Time Frequency Analysis of ECG Signal Using Ramanujan ...
15
IOSR Journal of Electronics and Communication Engineering (IOSR-JECE) e-ISSN: 2278-2834,p- ISSN: 2278-8735.Volume 16, Issue 6, Ser. I (Nov. – Dec. 2021), PP 07-21 www.iosrjournals.org DOI: 10.9790/2834-1606010721 www.iosrjournals.org 7 | Page Time Frequency Analysis of ECG Signal Using Ramanujan Fourier Transform Dr CR PRASANTH 1 (Mtech ,MBA ,PHD/Assistant Professor Kerala Neet Accademy,Tirunelveli) Mrs Neena Uthaman (MSC, B.Ed /Lecturer in Mathematics,Arab open University, Sultanate of Oman ) Abstract : Electrocardiogram (ECG)is a non-invasive technique used mainly as a primary diagnostic tool for cardiovascular diseases. A pure ECG signal provides valuable information about the electrophysiology of heart diseases and the occurrence of ischemic changes. It provides necessary information about the functional aspects of the heart and cardiovascular system. The objective of this report is to automatically detect the cardiac problems in ECG signal. Recently developed digital signal processing technique is used in this report for the detection of cardiac problems. Hence this report develops a method for analysis of heartbeats to detect cardiac abnormalities in ECG signals. ECG generated waveforms are used to find patterns of irregularities in cardiac cycles in patients. In many cases, irregularities evolve over an extended period of time that requires continuous monitoring. However, this requires compression of ECG signals. The practical importance of ECG data compression has become evident in many aspects of computerized electrocardiography. Various ECG compression methods are discussed. Keywords: Ambiguity domain, Ramanujan Fourier Transform, Ramanujan sums, Time-frequency, T wave alternanace --------------------------------------------------------------------------------------------------------------------------------------- Date of Submission: 28-10-2021 Date of Acceptance: 12-11-2021 --------------------------------------------------------------------------------------------------------------------------------------- I. Introduction 1.1 The heart anatomy The heart contains four chambers that is right atrium, left atrium, right ventricle, left ventricle and several atrioventricular and sinoatrial node as shown in the fig 1.1. The two upper chambers are called the left and right atria, while the lower two chambers are called the left and right ventricles. The atria are attached to the ventricles by fibrous, non-conductive tissue that keeps the ventricles electrically isolated from the atria. The right atrium and the right ventricle together form a pump to the circulate blood to the lungs. Oxygen-poor blood is received through large veins called the superior and inferior vena cava and flows into the right atrium. The right atrium contracts and forces blood into the right ventricle, stretching the ventricle and maximizing its pumping (contraction) efficiency. The right ventricle then pumps the blood to the lungs where the blood is oxygenated. Similarly, the left atrium and the left ventricle together form a pump to circulate oxygen-enriched blood received from the lungs (via the pulmonary veins) to the rest of the body. In heart Sino-atrial (S-A) node spontaneously generates regular electrical impulses, which then spread through the conduction system of the heart and initiate contraction of the myocardium. Propagation of an electrical impulse through excitable tissue is achieved through a process called depolarization. Depolarization of the heart muscles collectively generates a strong ionic current. This current flows through the resistive body tissue generating a voltage drop. The magnitude of the voltage drop is sufficiently large to be detected by electrodes attached to the skin. ECGs are thus recordings of voltage drops across the skin caused by ionic current flow generated from myocardial depolarisations. Atrial depolarisation results in the spreading of the electrical impulse through the atrial myocardium and appears as the P-wave. Similarly, ventricular depolarisation results in the spreading of the electrical impulse throughout the ventricular myocardium. The electrically activity that spread through the heart during cardiac cycle can be deducted using electrodes placed on the skin and an instrument called an electrocardiogram (ECG).
-
Upload
khangminh22 -
Category
Documents
-
view
0 -
download
0
Transcript of Time Frequency Analysis of ECG Signal Using Ramanujan ...
IOSR Journal of Electronics and Communication Engineering (IOSR-JECE)
e-ISSN: 2278-2834,p- ISSN: 2278-8735.Volume 16, Issue 6, Ser. I (Nov. – Dec. 2021), PP 07-21
www.iosrjournals.org
DOI: 10.9790/2834-1606010721 www.iosrjournals.org 7 | Page
Time Frequency Analysis of ECG
Signal Using Ramanujan Fourier Transform
Dr CR PRASANTH 1(Mtech ,MBA ,PHD/Assistant Professor Kerala Neet Accademy,Tirunelveli)
Mrs Neena Uthaman (MSC, B.Ed /Lecturer in Mathematics,Arab open University, Sultanate of Oman )
Abstract : Electrocardiogram (ECG)is a non-invasive technique used mainly as a primary diagnostic tool for cardiovascular diseases. A pure ECG signal provides valuable information about the electrophysiology of heart
diseases and the occurrence of ischemic changes. It provides necessary information about the functional aspects
of the heart and cardiovascular system. The objective of this report is to automatically detect the cardiac
problems in ECG signal. Recently developed digital signal processing technique is used in this report for the
detection of cardiac problems. Hence this report develops a method for analysis of heartbeats to detect cardiac
abnormalities in ECG signals. ECG generated waveforms are used to find patterns of irregularities in cardiac
cycles in patients. In many cases, irregularities evolve over an extended period of time that requires continuous
monitoring. However, this requires compression of ECG signals. The practical importance of ECG data
compression has become evident in many aspects of computerized electrocardiography. Various ECG
compression methods are discussed.
Keywords: Ambiguity domain, Ramanujan Fourier Transform, Ramanujan sums, Time-frequency, T wave alternanace
---------------------------------------------------------------------------------------------------------------------------------------
Date of Submission: 28-10-2021 Date of Acceptance: 12-11-2021
---------------------------------------------------------------------------------------------------------------------------------------
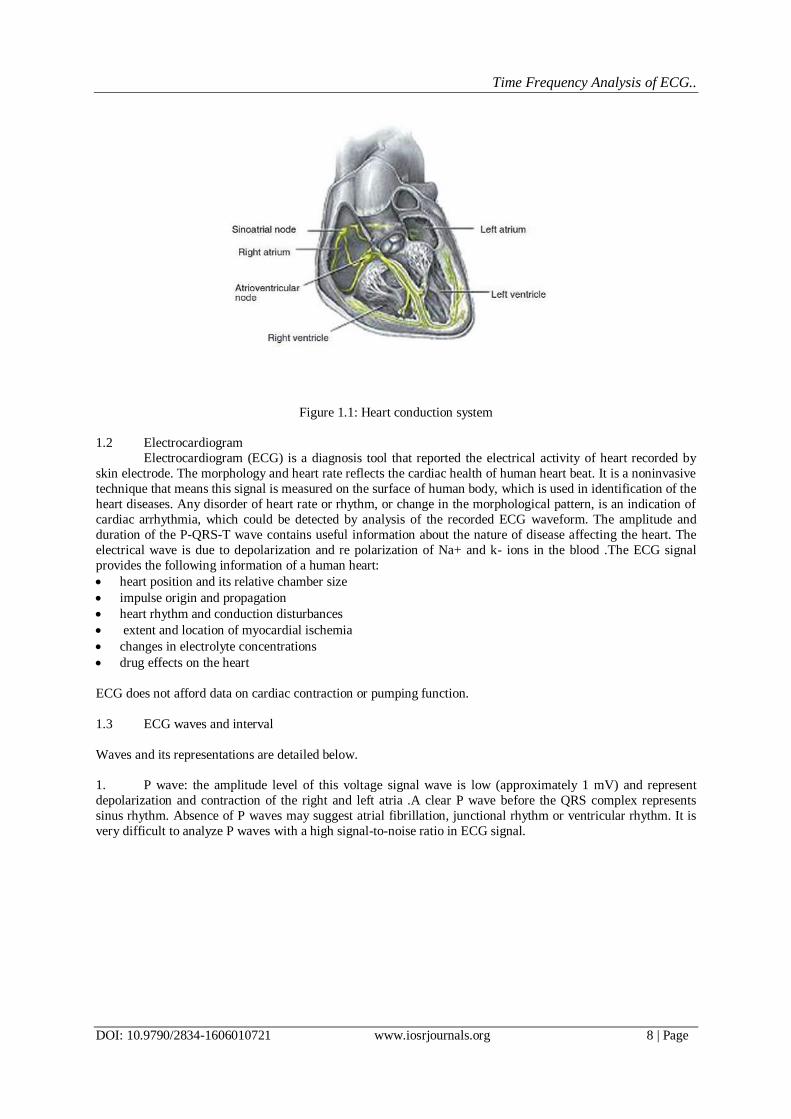
I. Introduction 1.1 The heart anatomy
The heart contains four chambers that is right atrium, left atrium, right ventricle, left ventricle and
several atrioventricular and sinoatrial node as shown in the fig 1.1. The two upper chambers are called the left
and right atria, while the lower two chambers are called the left and right ventricles. The atria are attached to the
ventricles by fibrous, non-conductive tissue that keeps the ventricles electrically isolated from the atria. The
right atrium and the right ventricle together form a pump to the circulate blood to the lungs. Oxygen-poor blood
is received through large veins called the superior and inferior vena cava and flows into the right atrium.
The right atrium contracts and forces blood into the right ventricle, stretching the ventricle and
maximizing its pumping (contraction) efficiency. The right ventricle then pumps the blood to the lungs where
the blood is oxygenated. Similarly, the left atrium and the left ventricle together form a pump to circulate oxygen-enriched blood received from the lungs (via the pulmonary veins) to the rest of the body.
In heart Sino-atrial (S-A) node spontaneously generates regular electrical impulses, which then spread
through the conduction system of the heart and initiate contraction of the myocardium. Propagation of an
electrical impulse through excitable tissue is achieved through a process called depolarization. Depolarization of
the heart muscles collectively generates a strong ionic current. This current flows through the resistive body
tissue generating a voltage drop.
The magnitude of the voltage drop is sufficiently large to be detected by electrodes attached to the skin.
ECGs are thus recordings of voltage drops across the skin caused by ionic current flow generated from
myocardial depolarisations. Atrial depolarisation results in the spreading of the electrical impulse through the
atrial myocardium and appears as the P-wave. Similarly, ventricular depolarisation results in the spreading of
the electrical impulse throughout the ventricular myocardium.
The electrically activity that spread through the heart during cardiac cycle can be deducted using electrodes placed on the skin and an instrument called an electrocardiogram (ECG).
Time Frequency Analysis of ECG..
DOI: 10.9790/2834-1606010721 www.iosrjournals.org 8 | Page
Figure 1.1: Heart conduction system
1.2 Electrocardiogram
Electrocardiogram (ECG) is a diagnosis tool that reported the electrical activity of heart recorded by
skin electrode. The morphology and heart rate reflects the cardiac health of human heart beat. It is a noninvasive
technique that means this signal is measured on the surface of human body, which is used in identification of the
heart diseases. Any disorder of heart rate or rhythm, or change in the morphological pattern, is an indication of
cardiac arrhythmia, which could be detected by analysis of the recorded ECG waveform. The amplitude and
duration of the P-QRS-T wave contains useful information about the nature of disease affecting the heart. The
electrical wave is due to depolarization and re polarization of Na+ and k- ions in the blood .The ECG signal
provides the following information of a human heart:
heart position and its relative chamber size
impulse origin and propagation
heart rhythm and conduction disturbances
extent and location of myocardial ischemia
changes in electrolyte concentrations
drug effects on the heart
ECG does not afford data on cardiac contraction or pumping function.
1.3 ECG waves and interval
Waves and its representations are detailed below.
1. P wave: the amplitude level of this voltage signal wave is low (approximately 1 mV) and represent
depolarization and contraction of the right and left atria .A clear P wave before the QRS complex represents
sinus rhythm. Absence of P waves may suggest atrial fibrillation, junctional rhythm or ventricular rhythm. It is
very difficult to analyze P waves with a high signal-to-noise ratio in ECG signal.

Time Frequency Analysis of ECG..
DOI: 10.9790/2834-1606010721 www.iosrjournals.org 9 | Page
Figure 1.2: Schematic diagram of normal ECG waveform
2. QRS complex: The QRS complex is the largest voltage deflection of approximately 10-20mV but may
vary in size depending on age, and gender. The voltage amplitude of QRS complex may also give information
about the cardiac disease .Duration of the QRS complex indicates the time for the ventricles to depolarize and
may give information about conduction problems in the ventricles such as bundle branch block
3. T wave: Represents ventricular repolarization. Large T waves may represent ischemia, and Hyperkalaemia.
Figure 1.3: Amplitudes and duration of waves, intervals and segments of ECG signals
The Table 1.2 shows features of P-wave, QRS complex and T wave in maximum amplitude and its duration.
According to medical definition the duration of each RR-interval is about 0.4-1.2s.
1.4 Regulation of Heart Rate
The basic rate of heartbeat is controlled by the activity of the ANS. Even when removed from the body
and placed into the artificial medium the heart will continue its beat rhythmically, although more slowly. In the body, however, the demands on the blood system are constantly changing and the heart rate has to be adjusted
accordingly. This is achieved by control systems, one nervous and the other chemicals. This is a homeostatic
response whose overall function is to maintain constant conditions within the bloodstream even though
conditions around it are constantly changing. The amount of blood flowing from the heart over the given period
of time is known as the cardiac output and depends upon the volume of blood pumped out of the heart at each
beat, the stroke volume, and the heart rate (number of beats per minute): Cardiac output = stroke volume heart
rate It is the cardiac output which is important variable in supplying blood to the body. One way of controlling
cardiac output is to control the heart rate.
II. Literature Survey Here a detailed literature survey and necessary theoretical background regarding the methods for ECG
signal analysis are given. First, these methods for are investigated as an introduction to the time-frequency
analysis methods. Then the linear and quadratic TFDs are introduced. There are no general methods for ECG
analysis. The method that should be applied in a particular case depends on the question being asked.
Traditionally time and frequency domain methods have been considered for analysis of ECG signals.

Time Frequency Analysis of ECG..
DOI: 10.9790/2834-1606010721 www.iosrjournals.org 10 | Page
In both time and frequency domain methods, the ECG signal is considered to be the realization of a
random process. Random processes are characterized by either probability distributions and their moments or
correlation function and their Fourier spectra. Such a description of ECG signals as the realization of a random
process assumes a mathematical but not a biophysical model. Even though the biophysical process underlying
the ECG signal itself may not be random, it may have a high degree of complexity and only a description in
statistical terms may be justified. In this way, an ECG signal can be characterized by a number of average
characteristics of the signal such as covariance or correlation (time domain analysis) and spectra (frequency domain analysis).
Since the early days of automatic analysis of ECG signals, representations based on correlation and
Fourier transform have been applied. The Fast Fourier Transformation (FFT) algorithm, invented in 1965,
deserves much of the credit for early progress in this field as it significantly simplified computation of spectral
coefficients. However, these methods are less suited for the frequency decomposition of the ECG signal due to
the non stationarity and presence of multi components in the ECG signal. Time-frequency methods were shown
to outperform conventional methods of frequency analysis. Indeed these methods have a long history of
application to ECG. The choice of time-frequency distribution is crucial for the efficiency of the proposed
approach for analysis. Indeed these methods have a long history of application to ECG. The choice of time
frequency distribution is crucial for the efficiency of the proposed approach for analysis.
The time-frequency methods combine time domain and frequency domain analyses to yield a potentially more revealing picture of the temporal localization of the signals spectral components.
Mathematically, they correspond to a joint function of time t and frequency f which is called a time-frequency
representation (TFR) of the signal. The dependence of the TFR on the signal may be linear, quadratic, or
otherwise nonlinear, with the first two cases being the most widely used.
2.1 Linear TFRs
The TFRs which satisfy the linearity or superposition principles are called linear TFRs. Linearity is a desirable
property in any application involving multi component signals. Two linear TFRs of basic importance in ECG
signal analysis are the Short Time Fourier Transform (STFT) and wavelet transform
(WT). Another important linear TFR is the wavelet transform which differs from the traditional Fourier
techniques by the way in which it localizes the information in the time-frequency plane; in particular, it is capable of trading one type of resolution for the other, which makes it especially suitable for the analysis of non
stationary signals.
2.2 Quadratic TFRs
Although linearity of a TFR is a desirable property, the quadratic structure of a TFR is an intuitively
reasonable assumption when we want to interpret a TFR as a time-frequency energy distribution. Some of the
prominent examples of quadratic TFRs are Spectrogram, Scalogram, and Wigner Ville Distribution (WVD) .A
more powerful approach to quadratic time-frequency analysis is given by the family of Wigner-Ville
distribution functions, based on the seminal work of Wigner in 1932 and Ville in 1948.
2.3 Ramanujan Fourier Transform Ramanujan sums, was applied to the signal processing of low frequency noise M. Planat et al. well
adapted to the analysis of arithmetical sequences with many resonances p/q . Cohen initially investigated the
number theoretic concepts to understand the usefulness of the so-called even functions. Saed Samadi et al.
introduced a special class of evensymmetric periodic signals. The most distinctive feature of these signals is that
their real valued Fourier coefficients can be calculated by forming a weighted average of the signal values using
integer valued coefficients. The signals arise from number-theoretic concepts concerning a class of functions
called even arithmetical functions. The integer-valued weighting coefficients, being sums of complex roots of
unity, are the Ramanujan sums and may be computed recursively or through closed-form arithmetical relations.
Lagha and Bensebti used RFT for the doppler spectrum estimation of weather radar. RFT based TF transform
functions and its 2-D extension was given by Lakshmi Sugavaneswaran et al.
III. Formulation Of The Problem Electrocardiogram (ECG) is a diagnosis tool that reported the electrical activity of heart recorded by
skin electrode. The morphology and heart rate reflects the cardiac health of human heart beat. It is a noninvasive
technique that means this signal is measured on the surface of human body, which is used in identification of the
heart diseases. Any disorder of heart rate or rhythm, or change in the morphological pattern, is an indication of
cardiac arrhythmia, which could be detected by analysis of the recorded ECG waveform.

Time Frequency Analysis of ECG..
DOI: 10.9790/2834-1606010721 www.iosrjournals.org 11 | Page
Since the early days of automatic analysis of ECG signals, representations based on Fourier transform
and parametric methods have been applied. These approaches are based on changes in certain frequencies bands.
Such methods have proved beneficial for various ECG characterizations, but the time information is lost in the
process. ECG being a chirp signal, it contains large amount time information. Since the nature of ECG signals is
non stationary and multi component, these methods are not suitable for the frequency decomposition of these
signals. The fast Fourier transform (FFT) also suffer from large noise sensitivity.
Parametric methods for power spectrum estimation such as autoregressive (AR), reduces the spectral loss problems and gives better frequency resolution. Since the ECG signals are non-stationary, the parametric
methods are not suitable for frequency decomposition of these signals. Hence it requires a representation which
can localize the components in both time and frequency.
For nearly 100 years, beat to beat alternation of T wave amplitude, termed T wave alternans (TWA),
has been closely linked to electrical instability in the heart. TWA is now established among the strongest
markers of susceptibility to sudden cardiac death. Since computer technology allows for detection of very
subtle yet clinically significant TWA during standard exercise testing, TWA has been used increasingly as a
noninvasive clinical tool for identifying and treating patients at risk for sudden cardiac death. The observation of
TWA hastening ventricular tachyarrhythmia’s in an extraordinary variety of clinical and experimental
conditions suggest potential universality of TWA in the pathophysiological mechanism of sudden death.
High resolution optical mapping studies have shown that TWA arises from alternans of repolarization at the level of the ventricular myocyte. Cellular alternans is likely due to the actions of one or more ionic
currents and is closely related to, if not directly dependent on, the kinetics of intracellular calcium cycling.
Impairment in calcium cycling at the cellular and sub-cellular levels has been implicated in the mechanism of
cellular alternans. Importantly, spatially discordant alternans between cells is most likely a consequence of
heterogeneities of electrophysiological properties between cells which span the ventricular wall, serving to
amplify spatial heterogeneities of repolarization, and forming a substrate for reentrant excitation. Through this
mechanism, TWA is linked directly and mechanistically to the pathogenesis of arrhythmias.
Investigation of TWA and its analysis has been a major research area in finding the heart diseases from
ECG. There has been several methods in the analysis of TWA. But the main target of all the research was to find
a better solution with maximum accuracy. The objective of this paper is to find a better solution for the analysis
and reliable information about heart diseases.
IV. Solution To The Problem In this study the use of Ramanujan transform (RT) for the assessment of T-Wave alternans (TWA) is
investigated. The RT projects a signal on particular basis functions constituted by Ramanujan sums (RS). The
resulting components highlight the presence of 1/q resonances, being q an integer number. Thus, the transform
is suitable for detecting the typical 1/2 pattern of TWA. The quantification of TWA is obtained through the RT
coefficients. Below the dataset and its partitions used are briefly discussed and the different stages of the method
are discussed.
4.1 Datasets
4.1.1 T wave Alternans (TWA) Dataset
It contains 100 multichannel ECG records sampled at 500 Hz with 16 bits resolution over a 32mV
range. The dataset includes patients with myocardial infarctions, transient ischemia, ventricular
tachyarrhythmia’s, and other risk factors for sudden cardiac death, as well as healthy controls. It also contains
32 synthetic records obtained with 6 different models.
4.1.2 Young and Elderly Subjects Data:
This dataset consists of long term ECG recordings, in which twenty young (21-34 years old) and
twenty elderly (68-85 years old) rigorously screened healthy subjects underwent 120min of continuous supine resting while continuous electrocardiographic signals were collected. Each subgroup of subjects includes equal
numbers of men and women. All subjects remained in a resting state in sinus rhythm while watching the movie
Fantasia (Disney, 1940) to help maintain wakefulness. The continuous ECG signals were digitized at 250 Hz.
Each heartbeat was annotated using an automated arrhythmia detection algorithm, and each beat annotation was
verified by visual inspection.

Time Frequency Analysis of ECG..
DOI: 10.9790/2834-1606010721 www.iosrjournals.org 12 | Page
4.2 Proposed Variation in Time - Frequency Transforms
Figure 4.1: Block Diagram of the RFT Scheme
Figure presents the overall architecture for the proposed class of transforms. The analytic
representation of the input x(t) is obtained by computing the Hilbert transform of the signal. The analytic signal
is then mapped on to the Ambiguity Domain (AD), by using the ambiguity function (AF). AF is the time-
varying autocorrelation function and is defined as follows:
Where x*(t) represents the complex conjugate form of x(t). AD is a correlative domain and a signal is mapped
on to this domain by computing the autocorrelation function as defined above. In addition to signal equivalents
there exists certain additional artifacts (cross-terms) generated by interactions between signal components.
However, the peculiarity of AD-plane is that, in this domain the signal terms appear localized
around the origin and the cross-terms are located away from the origin. In this work, a modified AF
representation is computed by using the RS (on the time-varying autocorrelation values) as
Such a computation results in an overall reduction in the number of AD coefficients. These AD-mapped
coefficients can then be transformed into a sparser time-frequency representation, using the RFT computed from
their characteristic RS.
4.3 Analysis Stages
4.3.1 Preprocessing
The ECG is processed in terms of baseline filtering and QRS detection. The ECG signals were first highpass filtered to remove major baseline wander (3th order Butterworth filter, cut off frequency 0.5 Hz).
Then, each lead was analyzed separately, for Q onsets detection. Fiducial points obtained in different leads were
merged if closer than 150 ms. To refine it further and exclude remaining ventricular beats, artifacts and labeling
errors, we marked as artifacts those beats which showed a maximal cross correlation value < 0.9 with an
average template. The cross-correlation was computed with a shift of up to 100ms, and the Q onsets positions
were relocated accordingly. The process was repeated iteratively until no change was detected or a maximum
number of iteration was reached. We finally averaged normal beats and used this final template to detect waves
boundaries (QRS and T offsets; T onsets were defined as QRS offsets + 40 ms). Finally, a template for the T
wave was built and used to refine through cross-correlation the position of the T onsets (100 ms). Also in this
case the process was repeated iteratively. The temporal alignment of the T waves is at the core of how we
employed the Ramanujan transform.
4.3.2 QRS Complex Detection
4.3.2.1 Introduction
The detection of QRS complex is the first step towards automated computer-based ECG signal
analysis. To detect the QRS complex more accurately it is necessary to identify the exact R-peak location from
the recorded data. Morphological differences in the ECG waveform increase the complexity of QRS detection,
due to the high degree of heterogeneity in the QRS waveform and the difficulty in differentiating the QRS
complex from tall peaked P or T waves. Several techniques are reported to improve the accuracy of QRS

Time Frequency Analysis of ECG..
DOI: 10.9790/2834-1606010721 www.iosrjournals.org 13 | Page
complex detection from ECG signal because the exact detection of QRS complex is difficult, as the ECG signal
is added with different types of noise like electrode motion, power-line interferences, baseline wander, muscles
noise etc.. Pan and Tompkins reported a technique where, the detection of QRS complex was achieved by linear
filtering, non-linear transformation and decision rule algorithm. In another method the QRS complex of ECG
signal was found out using multi rate signal processing and filter banks. As reported in the QRS complex can be
found after finding the R-peak by differential operation in ECG signal. The first differentiation of ECG signal
and its Hilbert transform is used to find the location of R-peak in the ECG signal.
4.3.2.2 RR Detection Algorithm(PanTompkins algorithm)
In the first step, the algorithm passes the signal through a low-pass and a high-pass filter in order to
reduce the inuence of the muscle noise, the power line interference, the baseline wander, and the T-wave interference. After filtering, the signal is differentiated to provide the QRS slope information and it is squared
making all data points positive and emphasizing the higher frequencies. After squaring, the algorithm performs
sliding window integration in order to obtain the waveform feature. A temporal location of the QRS is marked
from the rising edge of the integrated waveform. In the last step, two thresholds are adjusted. The higher of the
two thresholds identifies peaks of the signal. The lower threshold is used when no peak has been detected by the
higher threshold in a certain time interval. In this case, the algorithm has to search back in time for a lost peak.
When a new peak is identified (as a local maximum change of direction within a predefined time interval), then
this peak is classified as a signal peak if it exceeds the high threshold (or the low threshold if we search back in
time for a lost peak) or as a noise peak otherwise. In order to detect a QRS complex, the integration waveform
and the filtered signals are investigated and different values for the aforesaid thresholds are used. To be
identified as a QRS complex, a peak must be recognized as a QRS in both integration and filtered waveform.
4.3.3 Feature Extraction of ECG Signal
4.3.3.1 RR-Interval Features
RR-interval is defined as the interval between successive heartbeat fiducial points. Features are
extracted from the RR sequence. The pre RR-interval is defined as the RR-interval between a given heartbeat
and the previous heartbeat. The RR-interval between a given heartbeat and the following heartbeat is known as
post-RR-interval. The average RR-interval is the mean of the RR-intervals for a recording and is considered as the same value for all heartbeats in a recording. Finally, the local average RR- interval is determined by
averaging the RR-intervals of the ten RR-intervals surrounding a heartbeat.
4.3.4 Calculation of T-Wave Template
In order to calculate the T-wave template of an ECG signal, all QQ-cycles of the ECG are aligned .
Then, the mean waveform of aligned cycles is obtained by applying the mean value calculation of simultaneous
samples. By applying the T-wave detection algorithm proposed in , the onset and offset locations of the T-wave
in the cycle template are determined.
4.3.5 T-Wave alternans quantification
The first step was the selection of the T-waves to be included in the TWA computation. This was done through the joint analysis of RR intervals and Cik values. In details, we selected the longest sequence in which:
i) two successive RR intervals did not differ more than a 10% in respect to the mean global RR value; and ii) all
the Cik were greater than 0.9. These criteria guaranteed to generate a sequence of similar T waves, with no
Twave missed (or incorrectly added). To reduce the influence of noise in the estimation of TWA amplitude, we
designed the Amplitude Adjusted T- Average (AATA) method,
where w(n) is the additive noise term. For each T-wave, the values of coefficients ck and dk are estimated in the
least square sense. The successive analysis was performed on the sequence of AATik(n) instead of the original
Tik(n).
To measure the prevalence of 1/2 pattern in the series, the following score was computed using the RT
coefficients

Time Frequency Analysis of ECG..
DOI: 10.9790/2834-1606010721 www.iosrjournals.org 14 | Page
The score tends to 1 when the 1/2 pattern is dominant, i.e.
Conversely, it goes to 0 when the 1/2 pattern is negligible. The amplitude of TWA was computed in a
temporal window (16 ms) centered around the Tpeak. However, if the TWAi score was lower than 0.3 in
correspondence of this maximum, the measure was considered unreliable and TWA amplitude was set to 0. This
rule was included to avoid false TWA detections in noisy ECG.
V. ECG Compression In a medical environment, there are several signals which must be constantly or periodically
supervised. Some of the most common are the temperature, the concentration of oxygen in blood, the arterial pressure or the electrocardiogram waveform. It is under this scenario that this thesis is developed. In this case,
there is an implemented system of acquisition of electrocardiogram (ECG) signals, which must be wirelessly
and error-free sent to the required medical location. The volume of ECG data produced by monitoring systems
can be quite large over a long period of time and ECG data compression is often needed for efficient storage of
such data. Similarly, when ECG data need to be transmitted for telemedicine applications, data compression
needs to be utilized for efficient transmission
A growing area of use for ECG is the 24-hour holters that are leased by consumers. These portable
ECG devices record and store the data for subsequent interpretation by a doctor. The idea of represent is
signal/information in fewer bits and any signal that contains some redundancy can be compressed. The main
goal of any compression technique is to achieve maximum data volume reduction while preserving the
significant signal morphology features upon reconstruction. Conceptually, data compression is the process of detecting and eliminating redundancies in a given data set. Compression relies on the fact that the data is
redundant, that till some extent it was generated following some rules and that we can learn those rules, and thus
predict accurately the Data. A compressor can reduce the size of a file by Deciding which data is more frequent
and assigning it less bits than to less frequent data.
5.1 ECG Compression Algorithm
The necessity of compressing the ECG signal exists in many transmitting and storage applications.
Transmitting the ECG signal through telephone wires, for example, may save a crucial time. If efficient
compression methods are utilized, memory requirements may drastically fall to make the solid state high quality
monitoring (Holter) device commercially viable. In reality, efficient data compression may be obtained only
with lossy Compression techniques (which allow reconstruction error). In ECG signal compression algorithms
the aim is to achieve a minimum information rate, while retaining the relevant diagnostic information in the reconstructed signal. Significant works have been reported in to improve the compression of the ECG signal as
well as maintain a low distortion. These can be divided into three major categories:
1. Direct Data Compression Method
2. Transform Method
3. Parameter Extraction Compression Method
Direct data compression is a time domain compression algorithm which directly analyses samples
where inter-beat and, intra-beat correlation is exploited. Some of the DDC algorithms are Turning point (TP),
Amplitude zone time epoch coding (AZTEC), Coordinate reduction time encoding system (CORTES), Scan
along polynomial approximation (SAPA), and Non redundant template. These algorithms suffer from sensitiveness to sampling rate, quantization levels and high frequency interference. It fails to achieve high data
rate along with preservation of clinical information.
In Transform based technique compressions are accomplished by applying an invertible orthogonal
transform to the signal. Due to its decorrelation and energy compaction properties the transform based methods
achieve better compression ratios. The commonly used transforms for data compression are FFT, DST, DCT,
and DWT.

Time Frequency Analysis of ECG..
DOI: 10.9790/2834-1606010721 www.iosrjournals.org 15 | Page
Parameter extraction compression method, extract the features and parameters of the signal. The
extracted parameters are subsequently utilized for classification based on a prior knowledge of the signal
features. For example peak detection method, linear prediction method, syntactic method or the neural network
method. Direct and transformation methods are reversible, while parameter extraction method is irreversible.
5.1.1 Direct Data Compression Algorithms
5.1.1.1 Turning point(TP) Algorithm
1. Acquire the ECG signal
2. Take the first three samples and check for the condition as mentioned
below:
(x1 - x0) * (x2 - x1) < 0
(or)
(x1 - x0) * (x2 - x1) > 0
3. If the above condition-1 is correct then x1 is stored else x2 is stored.
4. Reconstructing the compressed signal
5. The compression ratio of Turning point algorithm is 2:1, if higher compression is required then the same algorithm can be implemented on the already compressed signal so that it is further compressed to a ratio of 4:1.
But after the 2nd compression, the required data in the signal may be lost since the signal is overlapped on one
another. Therefore, TP algorithm is limited to compression ratio of 2:1.
5.1.1.2 Fan Algorithm
1. Acquire the ECG signal and retain the first sample x0.
2. Consider the next sample x1 att1 .Draw a straight line passes through (x0; x0+ɛ") and designate it as line U1.
Draw a straight line passes through (x0; x0 -ɛ ") and designate it as line L1.
3. Check if x2 lies within the area bounded by the 2 sloping lines (U1; L1). If yes generate 2 new sloping lines
(U2; L2) as before.
4. Compare the 2 pair of slopes.
5. Retain the most converging slope lines. 6. Now let x2 to be treated as x1 and let next sample to as if it were x2. Repeat the process for all points.
5.1.2 Transform Method
5.1.2.1 FFT Compression
1. Separate the ECG components into three components x, y, z.
2. Find the frequency and time between two samples.
3. Find the FFT of ECG signal check for fft coefficients (before compression) =0, increment the counter
A if it is between +25 to-25 and assign to Index=0.
4. Check for FFT coefficients (after compression) =0, increment the Counter B 5. Calculate inverse FFT and plot decompression, error.
6. Calculate the compression ratio, PRD.
5.1.2.2 DCT Compression
1. Separate the ECG components into three components x, y, z.
2. Find the frequency and time between two samples.
3. Find the dct of ecg signal check for dct coefficients (before compression) =0, increment the counter A
if it is between +0.22 to -0.22 and assign to Index=0.
4. Check for DCT coefficients (after compression) =0, increment the Counter B.
5. Calculate inverse dct and plot decompression, error.
6. Calculate the compression ratio, PRD.

Time Frequency Analysis of ECG..
DOI: 10.9790/2834-1606010721 www.iosrjournals.org 16 | Page
5.2 Performance Evaluation
Depending on the nature of the application there are various criteria to measure the performance of a
compression algorithm. Following are some measurements used to evaluate the performances of algorithm.
5.2.1 Compression Ratio (CR)
Compression ratio is the ratio between the size of the compressed file and the size of the source file
CR = (size of the compressed signal/size of the original signal)*100
5.2.2 Compression Factor (CF)
It is the inverse of the compression ratio. That is the ratio between the size of the source file and the size of the
compressed file.
CF= (size of the original signal/ size of the compressed signal)*100
5.2.3 Percent root mean square difference (PRD)
The most prominently used distortion measure is the Percent Root mean square Difference (PRD) that is given
in equation where x(n) is the original signal, x(n) is the reconstructed signal and Lb is the length of the block or
sequence over which PRD is calculated. PRD provides a numerical measure of the residual root mean square
(rms) error.
5.2.4 Compression Time (CT)
It is defined as the total time elapsed during the compression of original ECG signal. If the compression and
decompression times of an algorithm are less or in an acceptable level it implies that the algorithm is acceptable
with respective to the time factor. With the development of high speed computer accessories this factor may
give very small values and those may depend on the performance of computers. All the above methods evaluate
the effectiveness of compression algorithms using file sizes. There are some other methods to evaluate the
performance of compression algorithms. Compression time, computational complexity and probability
distribution are also used to measure the effectiveness.
VI. Result 6.1 TWA Detection
6.1.1 Analysis using twa00 database taken from lead 1
Figure 6.1: Peak Detection

Time Frequency Analysis of ECG..
DOI: 10.9790/2834-1606010721 www.iosrjournals.org 17 | Page
Figure 6.2: t wave extraction
6.1.2 Analysis using twa00 database taken from lead 2
Figure 6.3: Peak detection

Time Frequency Analysis of ECG..
DOI: 10.9790/2834-1606010721 www.iosrjournals.org 18 | Page
Figure 6.4: t wave extraction
Figure 6.5: TF plot
6.2 ECG Compression
Compression is performed using TP algorithm, FAN algorithm, FFT and DCT.

Time Frequency Analysis of ECG..
DOI: 10.9790/2834-1606010721 www.iosrjournals.org 19 | Page
Figure 6.6: Turning point method
Figure 6.7: FAN algorithm

Time Frequency Analysis of ECG..
DOI: 10.9790/2834-1606010721 www.iosrjournals.org 20 | Page
Figure 6.8: DCT compression
Figure 6.9: FFT compression
VII. Conclusion 1. Simulated twa detection using RFT :TWA is detected in the infected samples with an alternans score of
0.538 at a faster rate.
2. Simulated ECG compression using different algorithms and concluded that DCT is the efficient method
for ECG compression(compression ratio of 90.43) among the methods used.

Time Frequency Analysis of ECG..
DOI: 10.9790/2834-1606010721 www.iosrjournals.org 21 | Page
References [1]. Task Force of the European Society of Cardiology and the North American Society of Pacing and Electrophysiology, "`Heart rate
variability: Standards of measurement, physiological interpretation, and clinical use,"' Eur. Heart J., vol. 17, pp. 354-381, 1996
[2]. M. Teich, S. Lowen, K. Vibe-Rheymer, and C. Heneghan, "`Heart rate variability: measures and models, in Nonlinear Biomedical
Signal Processing", vol. II, Dynamic Analysis and Modelling. New York: IEEE Press, 2001, pp. 159-213.
[3]. G. Berntson, J. Bigger, D. Eckberg, P. Grossman, P. Kaufmann,M.Malik,H. Nagaraja, S. Porges, J. Saul, P. Stone, and M. vander
Molen, "Heart rate variability: Origins, methods, and interpretive caveats, "Psychophysiology, vol. 34, no. 6, pp. 623{648, Nov.
1997.
[4]. F. Mormann, R. G. Andrzejak, C. E. Elger, and K. Lenhn-ertz, "Seizure prediction: the long and winding road," Brain, vol. 130, no.
2, pp. 313-333, 2006.
[5]. R. Silipo, G. Deco, R. Vergassola, and C. Gremigni, "A characterization of HRVs nonlinear hidden dynamics by means of
Markovmodels,"IEEE Trans. Biomed. Eng., vol. 46, no. 8, pp. 978-986, Aug. 1999.
[6]. Martnez JP,Olmos S,"Methodological principles of T wave alternans analysis: a unified framework", IEEE Trans Biomed Eng Apr
2005;52(4)pp.599613.
[7]. J. M. Smith, E. A. Clancy, C. R. Valeri, J. N. Ruskin, and R. J. Cohen, "Electrical alternans and cardiac electrical instability",
Circulation, vol.77, no. 1, pp.110121, 1988.
[8]. D. S. Rosenbaum, L. E. Jackson, J. M. Smith, H. Garan, J. N. Ruskin, and R. J. Cohen, "Electrical alternans and vulnerability to
ventricular arrhytimias," N. Engl. J. Med., vol. 330, no. 4, pp. 235241, 1994.
[9]. K. Adachi, Y. Ohnisch, T. Shima, K. Yamashiro, A. Takei, N. Tamura, and M. Yokoyama, "Determinant of microvolt-level T-wave
alternans in patients with dilated cardiomyopathy", J. Am. Coll. Cardiol., vol. 34, no. 2, pp. 374380, 1999
[10]. B. D. Nearing, A. H. Huang, and R. L. Verrier, "Dynamic tracking of cardiac vulnerability by complex demodulation of the T
wave", Science, no. 252, pp. 437440, 1991.
[11]. B. D. Nearing and R. L. Verrier, "Personal computer system for tracking cardiac vulnerability by complex demodulation of the T
wave," J. Appl.Physiol., vol. 74, no. 5, pp. 26062612, 1993.
[12]. L. Burattini, W. Zareba, J. P. Couderc, E. L. Titlebaum, and A. J. Moss, "Computer detection of nonstationary T-wave alternans
using a new correlative method," Comput. Cardiol., vol. 24, pp. 657660, 1997.
[13]. L. Burattini, "Electrocardiographic T Wave Alternans Detection and Significance," Ph.D. dissertation, University of Rochester,
Rochester, NY, 1998.
[14]. L. Burattini, W. Zareba, and A. J. Moss, "Correlation method for detection of transient T-wave alternans in digital Holter ECG
recordings, "Ann. Electrocardiol., vol. 4, no. 4, pp. 416426, 1999.
[15]. B. D. Nearing and R. L. Verrier, "Modified moving average analysis of T-wave alternans to predict ventricular _brillation with high
accuracy," J. Appl. Physiol., no. 92, pp. 541549, 2002.
[16]. J. P. Martnez and S. Olmos, "A robust T-wave alternans detector based on the GLRT for Laplacian noise distribution," in Proc.
Comput. Cardiol. 2002, Piscataway, NJ, 2002, pp. 677680.
[17]. "Detection of Twave alternans in nonstationary noise: a GLRT approach," in Proc. Computers in Cardiology 2003, Piscataway, NJ,
2003, pp. 161164.
[18]. S. M. Kay, "Fundamentals of Statistical Signal Processing", Upper Saddle River, NJ: Prentice-Hall, 1998, vol. II, Detection theory.
[19]. Moody G. "The physionet / Computers in Cardiology Challenge 2008:T-Wave Alternans", In Proc. Computers in Cardiology. 2008.
[20]. J. Pan andW. J. Tompkins, "A real-time QRS detection algorithm, "IEEE Trans. Biomed. Eng., vol. 32, no. 3, pp. 230-236, Mar.
1985.
[21]. Homaeinezhad, M. R., Sabzevari, S. A. H., Ghaffari, A. & Daevaeiha, M. "High-Accuracy Characterization of Ambulatory Holter
Electrocardiogram Events : A Comparative Study between Walsh-Hadamard Transform, First Derivative-Based and Intelligent
Techniques", International Journal of Systems Biology and Biomedical Technologies, 1, 4071 (2012).
[22]. Carmichael R."Expansions of arithmetical functions in infinite series", Proc London Math Soc 1932;34:2.
[23]. http://www.physionet.org/physiobank/database/Fantasia.
[24]. http://www.physionet.org/physiobank/database/nsr2db.
[25]. http://www.physionet.org/physiobank/database/ch2db.
[26]. N. Iyengar, C.-K. Peng, R. Morin, A. Goldberger, and L. Lipsitz, "Age related alterations in the fractal scaling of cardiac interbeat
interval dynamics," Amer.J.Physiol., vol. 271, pp.
[27]. J. D. Hamilton,"Time Series Analysis",Princeton, NJ: Princeton Univ. Press, 1994.
[28]. S. Samadi,M.O.Ahmad, & M. N. S. Swamy, "Ramanujan sums and discrete Fourier transforms," IEEE Signal Process. Lett.,vol.
12,no. 4, pp. 293296,april 2005.
[29]. E.Cohen,"A class of arithmetic functions," Proc. Nat.Acad. Sci. USA, vol. 41, pp. 939944, 1955.
[30]. S. Ramanujan, "On certain trigonometric sums and their applications in the theory of numbers," Trans. Cambridge Philos. Soc., vol.
22, pp. 259276, 1918, (pp. 179199 of his Collected Papers).
[31]. http://en.wikipedia.org/wiki/Electrocardiography.
[32]. S. Jalaleddine, C. Hutchens, R. Stratan, and W. A. Co-berly, " ECG data compression techniques-a unified approach", IEEE Trans.
Biomed. Eng., 37, 329-343.
[33]. J. R. Cox, F. M. Nolle, H. A. Fozzard, and G. C. Oliver, (1968) "AZTEC, a preprocessing program for real time ECG rhythm
analysis", IEEE Trans. Biomed. Eng., BME-15, 129-129.
[34]. B. R. S. Reddy and I. S. N. Murthy, (1986)" ECG data compression using fourier descriptors", IEEE Trans. Bio-med. Eng., BME-
33, 428-433.
[35]. A. S. Al-Fahoum, (2006) "Quality assessment of ECG compression techniques using a wavelet-based diagnostic measure", IEEE
Trans. In Biomedicine, 10, 182-191
[36]. A. Perkusich, G. S. Deep, M. L. B. Perkusich, and M. L. Varani, (1989) An expert ECG acquisition and analysis system", IMTC-
89, 184-189.
Dr CR PRASANTH, et. al. "Time Frequency Analysis of ECG Signal Using Ramanujan Fourier
Transform." IOSR Journal of Electronics and Communication Engineering (IOSR-JECE) 16(6),
(2021): pp 07-21.