Compression and Analysis of ECG Features Using Optimal Polynomial Approximations
Upload
khangminh22Category
view
1download
0
1SCiEntifiC REpoRts | 7: 459 | DOI:10.1038/s41598-017-00540-x
www.nature.com/scientificreports
Efficient ECG Compression and QRS Detection for E-Health ApplicationsMohamed Elgendi 1,2, Amr Mohamed3 & Rabab Ward1
Current medical screening and diagnostic procedures have shifted toward recording longer electrocardiogram (ECG) signals, which have traditionally been processed on personal computers (PCs) with high-speed multi-core processors and efficient memory processing. Battery-driven devices are now more commonly used for the same purpose and thus exploring highly efficient, low-power alternatives for local ECG signal collection and processing is essential for efficient and convenient clinical use. Several ECG compression methods have been reported in the current literature with limited discussion on the performance of the compressed and the reconstructed ECG signals in terms of the QRS complex detection accuracy. This paper proposes and evaluates different compression methods based not only on the compression ratio (CR) and percentage root-mean-square difference (PRD), but also based on the accuracy of QRS detection. In this paper, we have developed a lossy method (Methods III) and compared them to the most current lossless and lossy ECG compression methods (Method I and Method II, respectively). The proposed lossy compression method (Method III) achieves CR of 4.5×, PRD of 0.53, as well as an overall sensitivity of 99.78% and positive predictivity of 99.92% are achieved (when coupled with an existing QRS detection algorithm) on the MIT-BIH Arrhythmia database and an overall sensitivity of 99.90% and positive predictivity of 99.84% on the QT database.
Cardiovascular diseases (CVDs) are cited as the number one cause of death worldwide by the World Health Organization (WHO)1. Medical researchers have placed significant importance on cardiac health research, lead-ing to a strong focus on technological advances for cardiac function assessment. One such research pathway is the improvement of the conventional cardiovascular-diagnosis technologies used in hospitals/clinics.
Electrocardiogram (ECG) analysis is the most common clinical cardiac test and has proven to be a useful screening tool for a variety of cardiac abnormalities due to its simple, risk-free, and inexpensive application2. The ECG signal contains features that reflect the underlying operation of the heart, and these features represent electrophysiological events that coincide with the sequence of depolarization and repolarization of the atria and ventricles. The signals for each heartbeat contain three main events: the P wave, the QRS complex, and the T wave. Analyzing these events over a short period of time (<30 mins) has been achieved with high accuracy. However, early detection of CVDs requires long-term monitoring using ECG electrodes connected to mobile phones and/or point-of-care devices that rely on wireless communication to improve the development of technological diag-nostic devices.
Developing an ECG system that is reliable, scalable, and an effective patient monitoring and medical data management tool is essential for implementing a highly accurate and efficient e-health device for CVD screening and diagnosis. The ECG compression technique proposed in this study leverages current sensors and smartphone technologies for connecting patient networks with a medical infrastructure to facilitate remote patient treatment, as shown in Fig. 1. ECG data aggregators (ECGag) (e.g., mobile phones and point-of-care devices) can be used to acquire, minimally process, and wirelessly transmit ECG signals to an ECG analysis unit (ECGau) (e.g., a device with high computational resources such as a computer). ECGags are usually battery-driven and have limited storage and minimal computational capacity. Thus, a solution that reduces the size of the acquired ECG signals (which are saved, stored, and transmitted by the ECGag) while protecting the integrity of the signal quality (so no information is lost) is needed.
A proper compression method can reduce the size of the transmitted ECG signals. However, most of the high-performance ECG compression methods are not suitable for wireless biosensors because of their complexity3,4. Suitable compression methods usually mandate either a low-compression rate or high energy consumption5.
1Department of Electrical and Computer Engineering, University of British Columbia, Vancouver, British Columbia, Canada. 2Department of Obstetrics and Gynaecology, University of British Columbia, Vancouver, British Columbia, Canada. 3Department of Computer Science & Engineering, University of Qatar, Doha, Qatar. Correspondence and requests for materials should be addressed to M.E. (email: [email protected])
Received: 6 December 2016
Accepted: 28 February 2017
Published: xx xx xxxx
OPEN

www.nature.com/scientificreports/
2SCiEntifiC REpoRts | 7: 459 | DOI:10.1038/s41598-017-00540-x
Therefore, developing a simple, fast, and efficient compression method that is suitable for long-term (≥30 mins) ECG signals is needed. Moreover, most of the ECG compression methods are discussed separately from the ability to detect main events (e.g., QRS complexes).
Based on a review of current literature, the evaluation of the compression method performance is widely evaluated by PRD6. Since a highly distorted ECG signal can be useless from a clinical point of view, reporting the impact of compression on detecting QRS complexes is vital. In this paper, we evaluate the overall efficiency of ECG signal transmission in terms of CR, PRD, and QRS detection performance.
Another aspect that will be explored is the local analysis of the ECG signal on the ECGag unit. Developing an algorithm that enables the ECG analysis (such as QRS detection and beat-to-beat interval estimation) to be performed locally on the ECGag is also needed7,8. Because the wireless communication between the ECGag and the ECGau unit (cf. Fig. 1) is a major source of power consumption for the ECGag, developing an algorithm that allows for local analysis will reduce the power consumed by the device. Combined with the proposed ECG compression method discussed above, local analysis of the ECG signals will facilitate faster decision making and efficient signal processing with the use of limited resources.
ResultsThe performance of the proposed algorithm was evaluated using the MIT-BIH arrhythmia and QT databases. For a fair and consistent evaluation of the proposed method (Method III) with all results published in the literature, the performance of the QRS detection algorithms from each method was assessed using two statistical measures: sensitivity (SE) and positive predictivity (+P). The SE and +P were calculated as follows:
= +SE(%) TP/(TP FN), (1)
+ = +P(%) TP/(TP FP), (2)
In other words, SE reports the percentage of detected true beats out of all true beats, while the +P reports the percentage of detected true beats out of all detected beats. Note, TP stands for true positives (the number of QRS complexes detected as QRS complexes), FN stands for false negatives (the number of QRS complexes which have not been detected), and FP stands for the number of false positives (non-QRS complexes detected as QRS complexes).
Method I demonstrated the performance of the QRS detector with different parameter values. The optimal W and q values were determined by8 after testing various combinations of (W, q) with W ranging from 3 to 6 and q ranging from 9 to 17. It was found that optimal detection QRS accuracy was achieved with W = 3 and q = 15. Note that the optimization step of the QRS detector for Method II was not discussed in ref.9.
For Method III, a rigorous optimization over all parameters was conducted. This step is carried out once on either an ECGau or a PC. As soon as the optimal parameters are determined, the ECGag will be adjusted accord-ingly without any further tuning. As this step occurs one time, it does not add any complexity to the ECG signal analysis at ECGag or ECGau level. The value of B varied from bmin = 360 Hz to bmin = 500 Hz, while the value of K varied from kmin = 50 Hz to kmin = 360 Hz. As we have multiple objectives, plotting the Pareto frontier (the objective space of possible Pareto solutions) cannot be achieved. Therefore, all Pareto solutions were sorted in descending order according to the overall accuracy (objective function g), as shown in Table 1. The optimal Pareto value of B/K was found to be 4.875, where B = 390 Hz and K = 80 Hz, achieving a maximum value of g = 99.851%
Figure 1. A wireless ECG Monitoring System.

www.nature.com/scientificreports/
3SCiEntifiC REpoRts | 7: 459 | DOI:10.1038/s41598-017-00540-x
with an SE of 99.78% and a +P of 99.92%. It is clear that the highest accuracy of QRS detection was scored using Method III with B/K = 4.875. The results of Method III will be discussed in more detail.
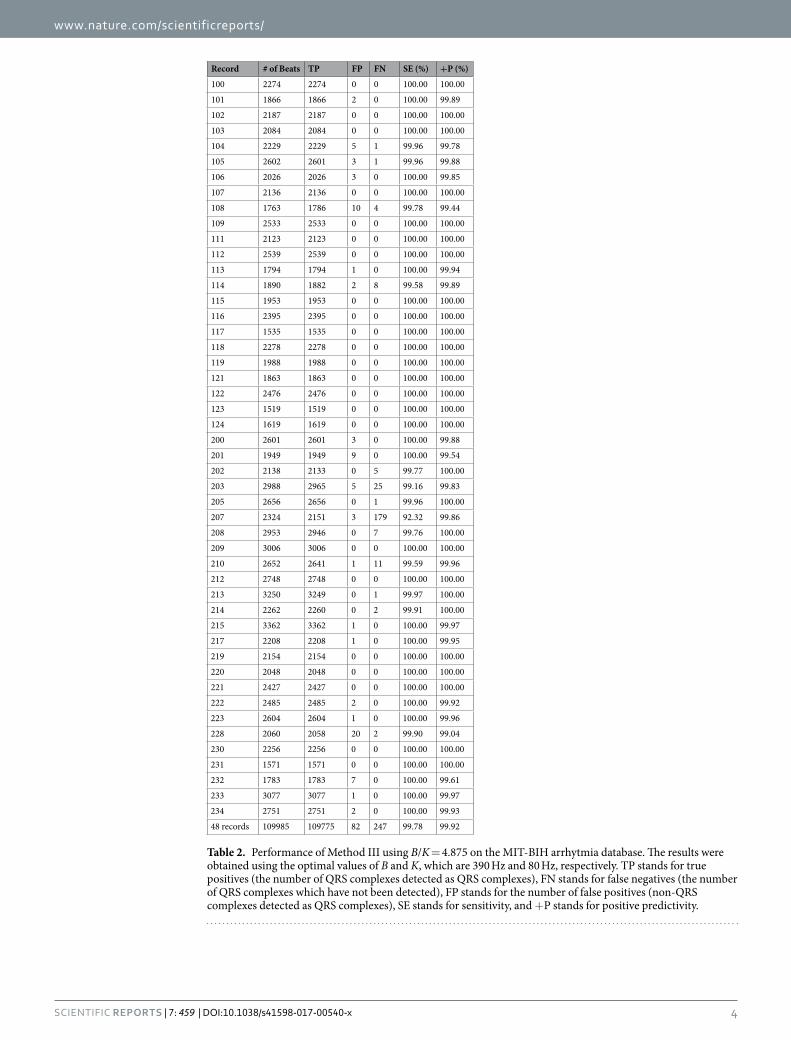
A summary of the QRS detection results for all recordings using Method III with B/K = 4.875 is shown in Table 2.
Figures 2, 3 and 4 show the performance of Method III under noisy conditions. The first plot (a) in each figure shows the original ECG signal. The second plot (b) shows the compressed ECG signal using Method III. The third plot (c) shows the QRS detection based on the compressed signal shown in plot (b). Figure 2 shows the perfor-mance of the QRS detector on a compressed ECG signal using Method III over T waves with large amplitudes, which are often misidentified as QRS peaks due to their amplitude.
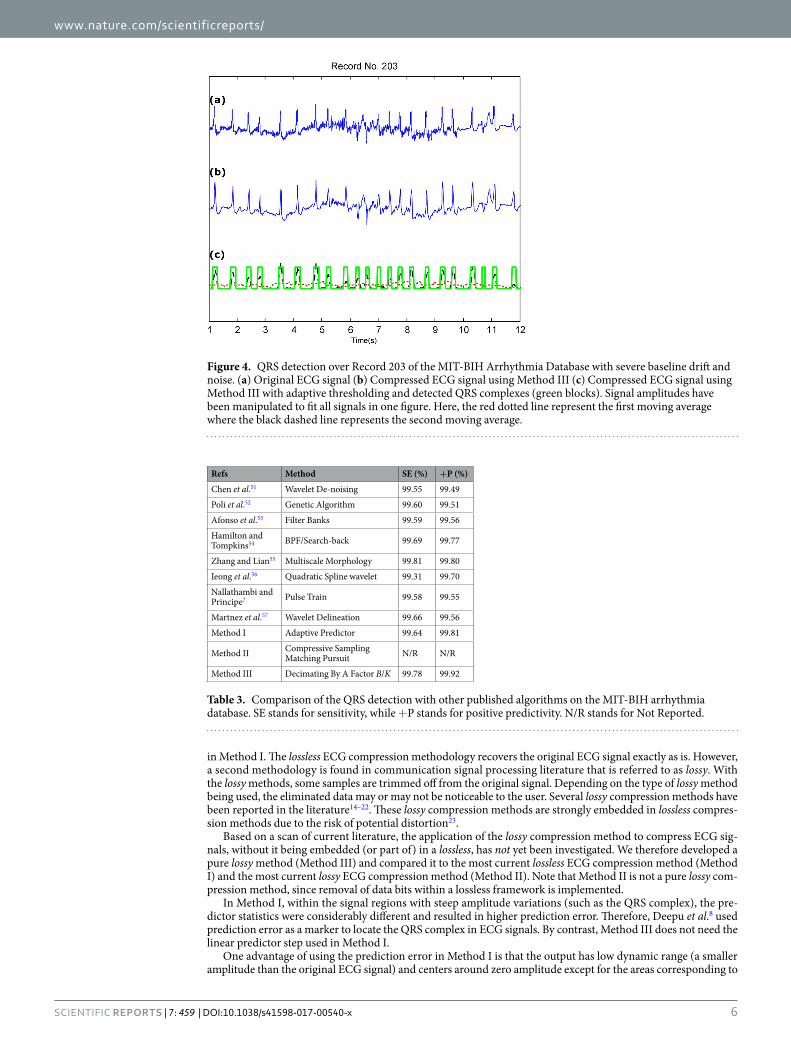
Figure 3 shows the QRS detection performance using an ECG signal with premature ventricular contractions, which introduce irregular heartbeats in terms of RR interval and morphology. Figure 4 shows that the QRS detec-tor performed well in the presence of noise and baseline wandering within the compressed ECG signal.
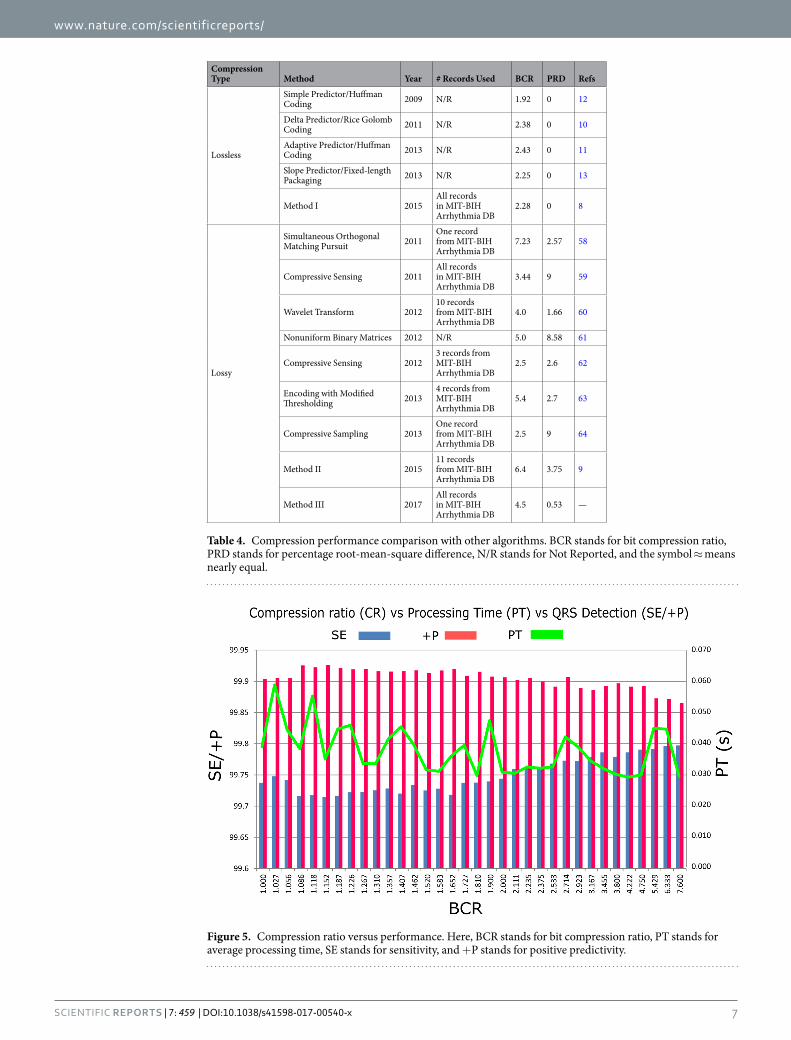
Table 3 compares the QRS detection performance of well-known compression algorithms with the proposed methods. As shown, Method III outperformed all competing lossless algorithms in terms of increasing BCR and decreasing PRD simultaneously. The multiscale morphology technique scored lower in detection accuracy given its high computational complexity. In comparison, Method III was fast and more efficient for analyzing ECG signals making it better suited for e-health applications.
Table 4 compares the compression performance of the four methods with other compression schemes imple-mented on hardware for wearable applications. Method III outperformed existing well-known lossy and loss-less compression methods by scoring the highest BCR at 4.5 while scoring the lowest PRD at 0.53. Note that Methods III and III have already outperformed the state-of-the-art lossless compression methods: delta predictor/Rice-Golomb coding10, adaptive predictor/Huffman coding11, simple predictor/Huffman coding12, and slope pre-dictor/fixed-length packaging methods13 in terms of increasing BCR and decreasing PRD simultaneously. The higher the BCR and the lower PRD values in an algorithm, the better the compression performance However, the detection of QRS has to be considered when choosing the optimal compression algorithm.
In this study, the proposed detector was implemented in MATLAB 2012a (MathWorks, Inc., Natick, MA, USA) on an Intel™ i5 CPU with 2.27 GHz. Figure 5 shows the BCR versus QRS detection performance and processing time. As expected, the processing time decreased as the BCR increased. Method III took an average
B K #Beat TP FP FN SE (%) +P (%) g (%)
390 80 109985 109775 82 247 99.78 99.92 99.85
390 70 109985 109781 89 249 99.78 99.91 99.85
390 60 109985 109774 88 254 99.78 99.91 99.84
390 110 109985 109748 83 264 99.77 99.92 99.84
380 80 109985 109789 109 238 99.79 99.89 99.84
390 50 109985 109796 110 237 99.79 99.89 99.84
410 80 109985 109705 59 303 99.74 99.94 99.84
380 140 109985 109754 92 257 99.77 99.91 99.84
400 70 109985 109750 81 275 99.76 99.92 99.84
400 60 109985 109750 79 276 99.76 99.92 99.84
. . . . . . . . .
. . . . . . . . .
. . . . . . . . .
. . . . . . . . .
. . . . . . . . .
. . . . . . . . .
500 260 109985 109233 28 803 99.37 99.97 99.67
500 250 109985 109232 28 801 99.37 99.97 99.67
500 300 109985 109223 27 809 99.37 99.97 99.67
500 290 109985 109231 29 808 99.37 99.97 99.67
500 270 109985 109220 31 807 99.37 99.97 99.67
500 310 109985 109209 30 819 99.36 99.97 99.66
500 340 109985 109207 29 822 99.36 99.97 99.66
500 320 109985 109214 29 825 99.35 99.97 99.66
500 330 109985 109201 27 829 99.35 99.97 99.66
500 350 109985 109207 29 827 99.35 99.97 99.66
Table 1. Optimal values for Method III based on the QRS detection accuracy. Results were sorted in descending order according to the overall accuracy (objective function g). TP stands for true positives (the number of QRS complexes detected as QRS complexes), FN stands for false negatives (the number of QRS complexes which have not been detected), FP stands for the number of false positives (non-QRS complexes detected as QRS complexes), SE stands for sensitivity, +P stands for positive predictivity, and g is the F-score (the harmonic mean of SE and +P).
www.nature.com/scientificreports/
4SCiEntifiC REpoRts | 7: 459 | DOI:10.1038/s41598-017-00540-x
Record # of Beats TP FP FN SE (%) +P (%)
100 2274 2274 0 0 100.00 100.00
101 1866 1866 2 0 100.00 99.89
102 2187 2187 0 0 100.00 100.00
103 2084 2084 0 0 100.00 100.00
104 2229 2229 5 1 99.96 99.78
105 2602 2601 3 1 99.96 99.88
106 2026 2026 3 0 100.00 99.85
107 2136 2136 0 0 100.00 100.00
108 1763 1786 10 4 99.78 99.44
109 2533 2533 0 0 100.00 100.00
111 2123 2123 0 0 100.00 100.00
112 2539 2539 0 0 100.00 100.00
113 1794 1794 1 0 100.00 99.94
114 1890 1882 2 8 99.58 99.89
115 1953 1953 0 0 100.00 100.00
116 2395 2395 0 0 100.00 100.00
117 1535 1535 0 0 100.00 100.00
118 2278 2278 0 0 100.00 100.00
119 1988 1988 0 0 100.00 100.00
121 1863 1863 0 0 100.00 100.00
122 2476 2476 0 0 100.00 100.00
123 1519 1519 0 0 100.00 100.00
124 1619 1619 0 0 100.00 100.00
200 2601 2601 3 0 100.00 99.88
201 1949 1949 9 0 100.00 99.54
202 2138 2133 0 5 99.77 100.00
203 2988 2965 5 25 99.16 99.83
205 2656 2656 0 1 99.96 100.00
207 2324 2151 3 179 92.32 99.86
208 2953 2946 0 7 99.76 100.00
209 3006 3006 0 0 100.00 100.00
210 2652 2641 1 11 99.59 99.96
212 2748 2748 0 0 100.00 100.00
213 3250 3249 0 1 99.97 100.00
214 2262 2260 0 2 99.91 100.00
215 3362 3362 1 0 100.00 99.97
217 2208 2208 1 0 100.00 99.95
219 2154 2154 0 0 100.00 100.00
220 2048 2048 0 0 100.00 100.00
221 2427 2427 0 0 100.00 100.00
222 2485 2485 2 0 100.00 99.92
223 2604 2604 1 0 100.00 99.96
228 2060 2058 20 2 99.90 99.04
230 2256 2256 0 0 100.00 100.00
231 1571 1571 0 0 100.00 100.00
232 1783 1783 7 0 100.00 99.61
233 3077 3077 1 0 100.00 99.97
234 2751 2751 2 0 100.00 99.93
48 records 109985 109775 82 247 99.78 99.92
Table 2. Performance of Method III using B/K = 4.875 on the MIT-BIH arrhytmia database. The results were obtained using the optimal values of B and K, which are 390 Hz and 80 Hz, respectively. TP stands for true positives (the number of QRS complexes detected as QRS complexes), FN stands for false negatives (the number of QRS complexes which have not been detected), FP stands for the number of false positives (non-QRS complexes detected as QRS complexes), SE stands for sensitivity, and +P stands for positive predictivity.

www.nature.com/scientificreports/
5SCiEntifiC REpoRts | 7: 459 | DOI:10.1038/s41598-017-00540-x
processing time of 0.029 seconds with a BCR of 4.5 to compress ECG signals and detect the QRS complexes. The time complexity of Method III is O(N) algorithm, which is similar to the lossy-based compression algorithms5, and the complexity is smaller than that of Method I [O(Nlog2N)] and Method II [O(Nlog2N))]. These results indicate that Method III has quick time response and less resource consumption.
DiscussionMethods Implementation. To the best of our knowledge, only one ECG compression method category is extensively discussed in current ECG compression literature; this method is referred to as lossless, and can be seen
Figure 2. QRS detection over Record 117 of the MIT-BIH Arrhythmia Database with large T waves. (a) Original ECG signal (b) Compressed ECG signal using Method III (c) Compressed ECG signal using Method III with adaptive thresholding and detected QRS complexes (green blocks). Signal amplitudes have been manipulated to fit all signals in one figure. Here, the red dotted line represent the first moving average where the black dashed line represents the second moving average.
Figure 3. QRS detection over Record 200 of the MIT-BIH Arrhythmia Database with irregular beats (premature ventricular contractions). (a) Original ECG signal (b) Compressed ECG signal using Method III (c) Compressed ECG signal using Method III with adaptive thresholding and detected QRS complexes (green blocks). Signal amplitudes have been manipulated to fit all signals in one figure. Here, the red dotted line represent the first moving average where the black dashed line represents the second moving average.
www.nature.com/scientificreports/
6SCiEntifiC REpoRts | 7: 459 | DOI:10.1038/s41598-017-00540-x
in Method I. The lossless ECG compression methodology recovers the original ECG signal exactly as is. However, a second methodology is found in communication signal processing literature that is referred to as lossy. With the lossy methods, some samples are trimmed off from the original signal. Depending on the type of lossy method being used, the eliminated data may or may not be noticeable to the user. Several lossy compression methods have been reported in the literature14–22. These lossy compression methods are strongly embedded in lossless compres-sion methods due to the risk of potential distortion23.
Based on a scan of current literature, the application of the lossy compression method to compress ECG sig-nals, without it being embedded (or part of) in a lossless, has not yet been investigated. We therefore developed a pure lossy method (Method III) and compared it to the most current lossless ECG compression method (Method I) and the most current lossy ECG compression method (Method II). Note that Method II is not a pure lossy com-pression method, since removal of data bits within a lossless framework is implemented.
In Method I, within the signal regions with steep amplitude variations (such as the QRS complex), the pre-dictor statistics were considerably different and resulted in higher prediction error. Therefore, Deepu et al.8 used prediction error as a marker to locate the QRS complex in ECG signals. By contrast, Method III does not need the linear predictor step used in Method I.
One advantage of using the prediction error in Method I is that the output has low dynamic range (a smaller amplitude than the original ECG signal) and centers around zero amplitude except for the areas corresponding to
Figure 4. QRS detection over Record 203 of the MIT-BIH Arrhythmia Database with severe baseline drift and noise. (a) Original ECG signal (b) Compressed ECG signal using Method III (c) Compressed ECG signal using Method III with adaptive thresholding and detected QRS complexes (green blocks). Signal amplitudes have been manipulated to fit all signals in one figure. Here, the red dotted line represent the first moving average where the black dashed line represents the second moving average.
Refs Method SE (%) +P (%)
Chen et al.51 Wavelet De-noising 99.55 99.49
Poli et al.52 Genetic Algorithm 99.60 99.51
Afonso et al.53 Filter Banks 99.59 99.56
Hamilton and Tompkins54 BPF/Search-back 99.69 99.77
Zhang and Lian55 Multiscale Morphology 99.81 99.80
Ieong et al.56 Quadratic Spline wavelet 99.31 99.70
Nallathambi and Principe7 Pulse Train 99.58 99.55
Martnez et al.57 Wavelet Delineation 99.66 99.56
Method I Adaptive Predictor 99.64 99.81
Method II Compressive Sampling Matching Pursuit N/R N/R
Method III Decimating By A Factor B/K 99.78 99.92
Table 3. Comparison of the QRS detection with other published algorithms on the MIT-BIH arrhythmia database. SE stands for sensitivity, while +P stands for positive predictivity. N/R stands for Not Reported.
www.nature.com/scientificreports/
7SCiEntifiC REpoRts | 7: 459 | DOI:10.1038/s41598-017-00540-x
Compression Type Method Year # Records Used BCR PRD Refs
Lossless
Simple Predictor/Huffman Coding 2009 N/R 1.92 0 12
Delta Predictor/Rice Golomb Coding 2011 N/R 2.38 0 10
Adaptive Predictor/Huffman Coding 2013 N/R 2.43 0 11
Slope Predictor/Fixed-length Packaging 2013 N/R 2.25 0 13
Method I 2015All records in MIT-BIH Arrhythmia DB
2.28 0 8
Lossy
Simultaneous Orthogonal Matching Pursuit 2011
One record from MIT-BIH Arrhythmia DB
7.23 2.57 58
Compressive Sensing 2011All records in MIT-BIH Arrhythmia DB
3.44 9 59
Wavelet Transform 201210 records from MIT-BIH Arrhythmia DB
4.0 1.66 60
Nonuniform Binary Matrices 2012 N/R 5.0 8.58 61
Compressive Sensing 20123 records from MIT-BIH Arrhythmia DB
2.5 2.6 62
Encoding with Modified Thresholding 2013
4 records from MIT-BIH Arrhythmia DB
5.4 2.7 63
Compressive Sampling 2013One record from MIT-BIH Arrhythmia DB
2.5 9 64
Method II 201511 records from MIT-BIH Arrhythmia DB
6.4 3.75 9
Method III 2017All records in MIT-BIH Arrhythmia DB
4.5 0.53 —
Table 4. Compression performance comparison with other algorithms. BCR stands for bit compression ratio, PRD stands for percentage root-mean-square difference, N/R stands for Not Reported, and the symbol ≈ means nearly equal.
Figure 5. Compression ratio versus performance. Here, BCR stands for bit compression ratio, PT stands for average processing time, SE stands for sensitivity, and +P stands for positive predictivity.
www.nature.com/scientificreports/
8SCiEntifiC REpoRts | 7: 459 | DOI:10.1038/s41598-017-00540-x
the QRS complexes. However, a lossless coding scheme is required to preserve the data. The output of the coding step is used to transmit the data instead of transmitting the whole signal to save power/memory resources. It is not required to apply a lossless coding scheme for Methods III, because the number of samples that represent the signal have already been reduced; using a lossless coding scheme would further reduce the quality of the signal and increase the consumption of power/memory resources unnecessarily.
Coding the output of the four methods can be carried out using variable-length coding schemes like Huffman and arithmetic coding24. All four methods are compatible with any of these existing coding schemes. The com-plexity of encoder/decoder implementation, however, is high for these techniques, although they produced opti-mal bit representations24.
Method I applied a coding-packaging scheme that gives a practical, fixed-length 16-bit output and has low hardware complexity8. The coding-packaging routine is based on the two’s complement, which is a mathemati-cal operation on binary numbers, representation of the prediction error signal. As most of the error prediction signal is around zero amplitude, it can be represented with only a few bits. Again, Method III does not need this step, as it will increase complexity and render these algorithms less suitable for wearable devices and e-health applications.
Compression Performance. It can be seen in Table 4 that lossless ECG techniques, such as the delta pre-dictor and Rice-Golomb coding scheme10, achieved a maximum BCR of 2.38. However, Rice-Golomb coding is highly complex and requires a dedicated memory8. The two-stage adaptive predictor and the Huffman coding schemes11 achieved a BCR of 2.43, but Huffman coding is highly complex, generates variable-length coded data, and would need further packaging to interface with a standard input/output8. Simple predictor and Huffman cod-ing12 achieved a BCR of 1.92. The slope predictor and a fixed-length packaging scheme12 achieved a BCR of 2.25. Method I (linear predictor and fixed-length packaging) achieved a BCR of 2.28. On the other hand, the proposed lossy compression technique, Method III, achieved a BCR of 4.5.
In general, there are many lossy compression techniques to achieve higher BCR but these require complicated signal processing techniques13. These approaches also require the usage of more complex hardware, which is not suitable for low-power wearable applications25,26, and are therefore not included in the comparison.
Method III achieved a BCR of 4.5 without the need for any packaging. The compression performance of Method III is substantially higher than that in refs8,10,11, and Method III validates the compression quality based on the QRS detection accuracy, which is essential for wearable applications. However, ECG compression tech-niques have typically been applied without being validated based on the QRS detection, making it difficult to assess the quality of the compression technique. Note that although Method III is a lossy compression method, the main features of the ECG signal morphology were preserved, as shown in Figs 2, 3 and 4. This indicates that a lossy compression method can be sufficient for ECG signal compression, in contrast to lossless methods that are more complex and require larger energy consumption.
In a lossy such as Method III, the minimum rate at which the ECG signal can be sampled—without losing the main events, such as the QRS complexes—has to be twice the highest frequency to achieve the Nyquist rate [Fs > 2Fmax]. In other words, the ECG sampling frequency has to be greater than or equal to 40 Hz.
Recent research into the implementation of lossy methods in an ambulatory environment faces many chal-lenges27. The current lossy algorithms, including the compressive sensing algorithms, do not compare favorably with other state-of-the-art lossless compression techniques when considering only CR vs. reconstruction quality27. Therefore, the choice of using a lossy algorithm depends on its ability to provide a low-power implementation. However, the implementation of lossy algorithms are included in lossless framework, which adds more complexity to the expected nature of lossy algorithms. The main advantage of the proposed Method III, which is a pure lossy algorithm, is that it accomplishes a higher compression rate, and higher PRD (higher reconstruction signal qual-ity) while achieving the highest QRS detection rate.
QRS Detection. The literature cites many QRS algorithms that have not been tested against a standard data-base, making the results difficult to compare and evaluate. Furthermore, many algorithms scored a high detection performance using the overall number of detected beats (i.e., QRS complexes), as shown in Table 2. Note that the QRS detector in ref.28 scored a high overall performance with a SE of 99.89% and a +P of 99.94%. However, the study’s authors excluded files 214 and 215 in the MIT-BIH arrhythmia database29, and therefore this algorithm may not be superior in terms of performance. In addition, their algorithm was based on wavelet feature extraction and singularity for classification without applying any compression techniques, which is considered unsuitable for e-health applications.
As noted, some investigators have excluded records from the MIT-BIH arrhythmia database29 for the sake of reducing noise in the processed ECG signals; consequently, their algorithms appeared to achieve improved per-formance. Other researchers excluded segments with ventricular flutter30 and signals from patients with paced beats31 from their investigations. In contrast, we tested the QRS detector over the compressed ECG signal without excluding any record or particular segment making the results more robust and the algorithm more efficient.
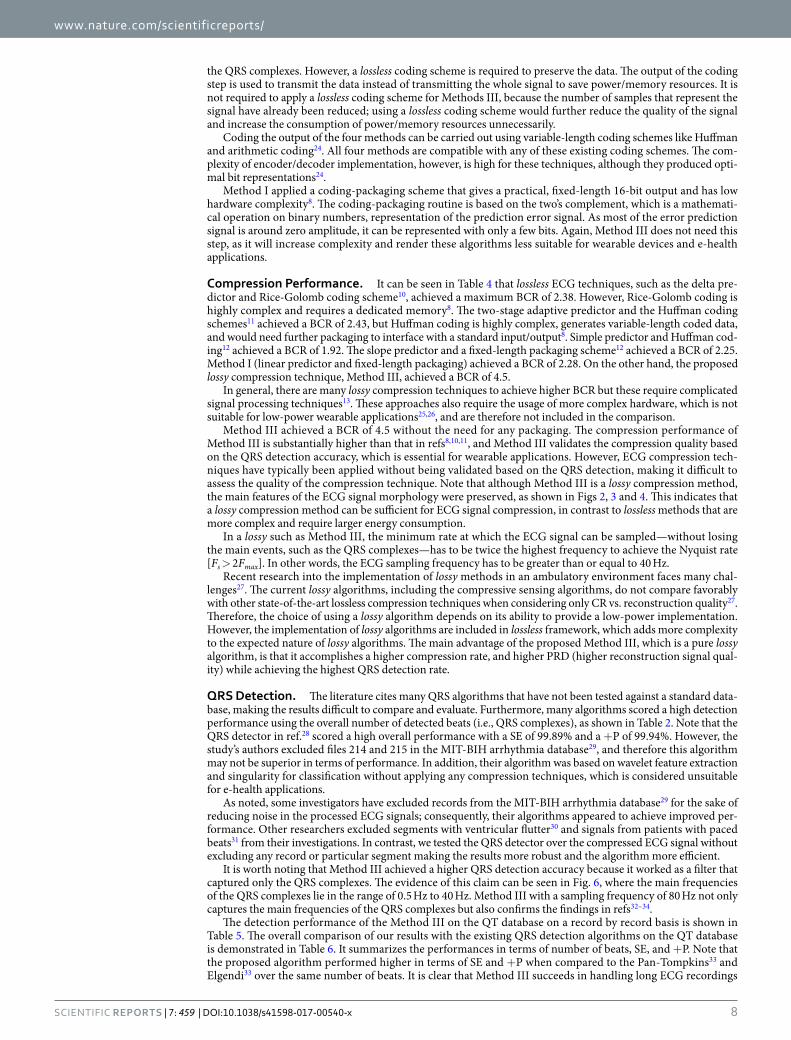
It is worth noting that Method III achieved a higher QRS detection accuracy because it worked as a filter that captured only the QRS complexes. The evidence of this claim can be seen in Fig. 6, where the main frequencies of the QRS complexes lie in the range of 0.5 Hz to 40 Hz. Method III with a sampling frequency of 80 Hz not only captures the main frequencies of the QRS complexes but also confirms the findings in refs32–34.
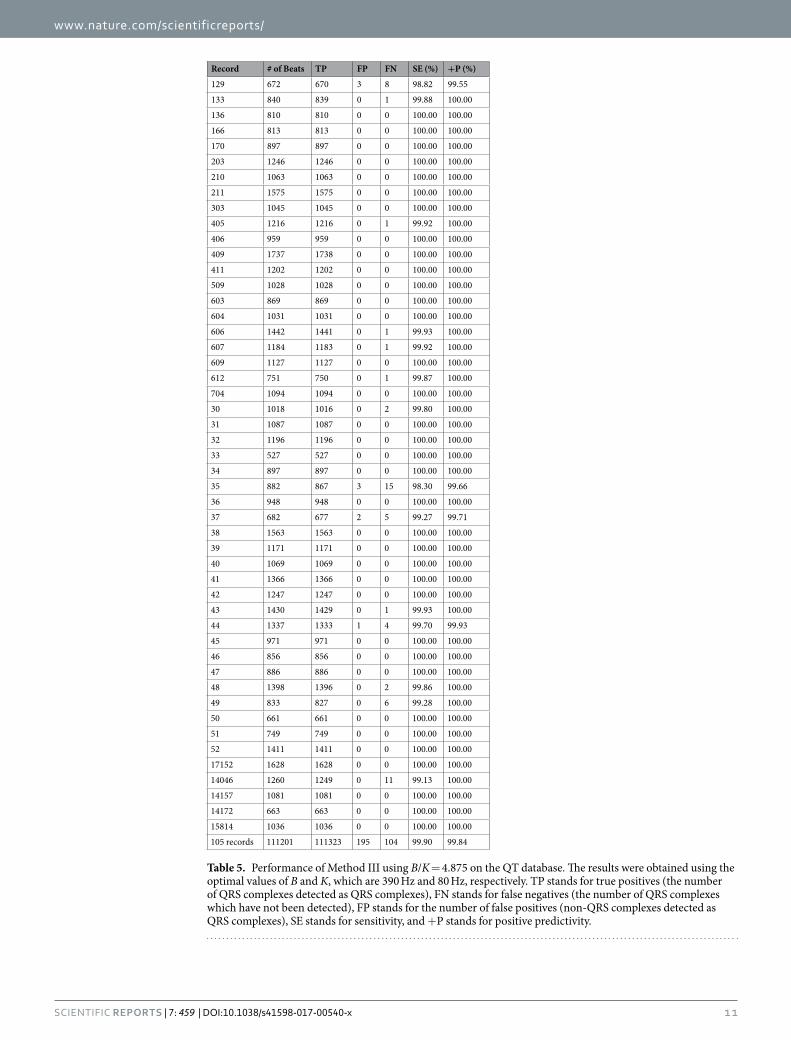
The detection performance of the Method III on the QT database on a record by record basis is shown in Table 5. The overall comparison of our results with the existing QRS detection algorithms on the QT database is demonstrated in Table 6. It summarizes the performances in terms of number of beats, SE, and +P. Note that the proposed algorithm performed higher in terms of SE and +P when compared to the Pan-Tompkins33 and Elgendi33 over the same number of beats. It is clear that Method III succeeds in handling long ECG recordings
www.nature.com/scientificreports/
9SCiEntifiC REpoRts | 7: 459 | DOI:10.1038/s41598-017-00540-x
with high performance over the 111,201 automatically annotated heart beats. Moreover, the proposed QRS detec-tor has not been re-tuned, in other words we applied Method III to the QT database without changing the value of any parameter and without re-training the algorithm. The results are promising, and Method III (with the parameters B = 390 Hz and K = 80 Hz) can be applied over different databases, sampling frequencies, types of arrhythmia, and noise.
Battery-driven ECG Devices. Based on the recommendation in ref.35, the better the computational effi-ciency, the faster the algorithm, and vice versa. Consequently, the faster the algorithm, the more suitable it is for real-time monitoring. In this study we used a computationally efficient QRS detector33 along with an optimal compression technique (Method III) to improve both the processing and transmission time.
With advances in computational power, the emphasis on algorithm complexity is slowly decreasing. However, the demand for computationally efficient algorithms still remains for instances where ECG signals are collected and analyzed locally in hospitals, in the home setting, or in remote/rural areas where patient access to hospitals access is limited. Developing a computationally efficient algorithm to accommodate the new trend toward the use of mobile ECG devices is required for these cases. Moreover, implementing a joint compression and QRS detec-tion algorithm to analyze long-term recorded signals in a time-efficient manner is also needed.
Typically, processing long recorded ECG signals is carried out on PCs with efficient memory and high-speed multi-core processors. This advantage is still not available for battery-operated devices: current wearable devices have limited memory and processing power36–38. In general, battery-driven ECG devices follow one of three strategies: 1) collect ECG signals for offline analysis; 2) collect ECG signals for real-time analysis within the device itself; or 3) collect ECG signals in real time and analyze the transmitted signals via a remote connection to a separate server. Each strategy has its own advantages and disadvantages in terms of processing time and power consumption. Our proposed Method III can be implemented in each strategy to improve both analysis time and QRS detection accuracy.
E-health Systems. E-health systems often use ECGags (e.g., mobile phones or personal digital assistants) merely to collect ECG data (either wirelessly or via a wired connection) that are then sent to an ECGau (e.g., a central monitoring station using 4 G mobile telecommunication or internet) for further analysis39,40. Applying the proposed compression Method III at the ECGag level is beneficial as it: reduces the transmission delay, saves bandwidth, saves energy on the battery-drived device, saves memory for storage, and speeds up real-time diagno-sis feedback. Although some analysis can be done locally on the ECGags before transmitting the compressed ECG signals, the analysis and the subsequent transmission of the ECG signals require a large a mount of energy that is taxes on the ECGag’s limited battery life. Thus, investigating efficient methods for local analysis and transmission of ECG signals is needed in terms of compression and QRS detection. Overall, there is a need for a computation-ally efficient compression technique and a computationally efficient QRS detector for real-time analysis that must be robust and improve QRS detection accuracy. Simple compression and QRS detection algorithms offer low-cost hardware implementation in both power and size for body sensor networks41. Method III can be implemented in the hardware of the ECGag device (or the ECG sensor circuit) and also can be embedded in the software (or an app) of the ECGag device. Because of the robustness, performance, efficiency, and simplicity in implementation, Method III is considered ideal for e-health applications, as it can be implemented on both ECGags and ECGaus.
Figure 6. Power spectra of ECG signal (first 60 seconds of record #100 from MIT-BIH Arrhythmia Database). The red curve curve represents the power spectra of Method III with a sampling frequency of 80 Hz. Note, the blue curves represent the power spectra of frequencies between 50 Hz and 360 Hz. The green curve represents the power spectra of QRS complexes (sampled at 360 Hz). It is clear that the optimal frequency band to detect QRS complexes is 0.5–40 Hz.

www.nature.com/scientificreports/
1 0SCiEntifiC REpoRts | 7: 459 | DOI:10.1038/s41598-017-00540-x
Record # of Beats TP FP FN SE (%) +P (%)
100 1134 1134 0 0 100.00 100.00
102 1088 1088 0 0 100.00 100.00
103 1048 1048 0 0 100.00 100.00
104 1109 1109 0 0 100.00 100.00
114 867 860 6 10 98.85 99.31
116 1186 1184 0 2 99.83 100.00
117 766 766 0 0 100.00 100.00
123 756 756 0 0 100.00 100.00
213 1641 1639 0 2 99.88 100.00
221 1247 1246 0 1 99.92 100.00
223 1309 1307 0 2 99.85 100.00
230 1077 1077 0 0 100.00 100.00
231 732 732 7 0 100.00 99.05
232 866 866 2 0 100.00 99.77
233 1532 1537 0 0 100.00 100.00
301 1352 1353 0 0 100.00 100.00
302 1501 1499 0 2 99.87 100.00
306 1040 1040 0 0 100.00 100.00
307 853 853 0 0 100.00 100.00
308 1294 1294 0 0 100.00 100.00
310 2012 2007 0 6 99.70 100.00
803 1026 1026 0 0 100.00 100.00
808 903 903 0 0 100.00 100.00
811 704 704 0 0 100.00 100.00
820 1159 1159 0 0 100.00 100.00
821 1557 1555 0 2 99.87 100.00
840 1180 1180 0 0 100.00 100.00
847 803 802 0 1 99.88 100.00
853 1113 1113 0 0 100.00 100.00
871 917 917 0 0 100.00 100.00
872 990 989 0 1 99.90 100.00
873 859 859 0 0 100.00 100.00
883 892 892 0 0 100.00 100.00
891 1267 1267 0 0 100.00 100.00
16265 1031 1031 0 0 100.00 100.00
16272 851 851 0 0 100.00 100.00
16273 1112 1112 0 0 100.00 100.00
16420 1063 1063 0 0 100.00 100.00
16483 1087 1087 0 0 100.00 100.00
16539 922 922 0 0 100.00 100.00
16773 1008 1008 0 0 100.00 100.00
16786 925 925 0 0 100.00 100.00
16795 761 761 0 0 100.00 100.00
17453 1047 1047 0 0 100.00 100.00
104 804 803 0 1 99.88 100.00
106 897 898 0 0 100.00 100.00
107 823 822 0 1 99.88 100.00
110 872 872 4 0 100.00 99.54
111 908 1094 162 10 99.09 87.10
112 684 695 5 0 100.00 99.29
114 698 698 0 0 100.00 100.00
116 560 559 0 1 99.82 100.00
121 1434 1431 0 3 99.79 100.00
122 1414 1414 0 0 100.00 100.00
124 1121 1121 0 0 100.00 100.00
126 945 945 0 0 100.00 100.00
Continued
www.nature.com/scientificreports/
1 1SCiEntifiC REpoRts | 7: 459 | DOI:10.1038/s41598-017-00540-x
Record # of Beats TP FP FN SE (%) +P (%)
129 672 670 3 8 98.82 99.55
133 840 839 0 1 99.88 100.00
136 810 810 0 0 100.00 100.00
166 813 813 0 0 100.00 100.00
170 897 897 0 0 100.00 100.00
203 1246 1246 0 0 100.00 100.00
210 1063 1063 0 0 100.00 100.00
211 1575 1575 0 0 100.00 100.00
303 1045 1045 0 0 100.00 100.00
405 1216 1216 0 1 99.92 100.00
406 959 959 0 0 100.00 100.00
409 1737 1738 0 0 100.00 100.00
411 1202 1202 0 0 100.00 100.00
509 1028 1028 0 0 100.00 100.00
603 869 869 0 0 100.00 100.00
604 1031 1031 0 0 100.00 100.00
606 1442 1441 0 1 99.93 100.00
607 1184 1183 0 1 99.92 100.00
609 1127 1127 0 0 100.00 100.00
612 751 750 0 1 99.87 100.00
704 1094 1094 0 0 100.00 100.00
30 1018 1016 0 2 99.80 100.00
31 1087 1087 0 0 100.00 100.00
32 1196 1196 0 0 100.00 100.00
33 527 527 0 0 100.00 100.00
34 897 897 0 0 100.00 100.00
35 882 867 3 15 98.30 99.66
36 948 948 0 0 100.00 100.00
37 682 677 2 5 99.27 99.71
38 1563 1563 0 0 100.00 100.00
39 1171 1171 0 0 100.00 100.00
40 1069 1069 0 0 100.00 100.00
41 1366 1366 0 0 100.00 100.00
42 1247 1247 0 0 100.00 100.00
43 1430 1429 0 1 99.93 100.00
44 1337 1333 1 4 99.70 99.93
45 971 971 0 0 100.00 100.00
46 856 856 0 0 100.00 100.00
47 886 886 0 0 100.00 100.00
48 1398 1396 0 2 99.86 100.00
49 833 827 0 6 99.28 100.00
50 661 661 0 0 100.00 100.00
51 749 749 0 0 100.00 100.00
52 1411 1411 0 0 100.00 100.00
17152 1628 1628 0 0 100.00 100.00
14046 1260 1249 0 11 99.13 100.00
14157 1081 1081 0 0 100.00 100.00
14172 663 663 0 0 100.00 100.00
15814 1036 1036 0 0 100.00 100.00
105 records 111201 111323 195 104 99.90 99.84
Table 5. Performance of Method III using B/K = 4.875 on the QT database. The results were obtained using the optimal values of B and K, which are 390 Hz and 80 Hz, respectively. TP stands for true positives (the number of QRS complexes detected as QRS complexes), FN stands for false negatives (the number of QRS complexes which have not been detected), FP stands for the number of false positives (non-QRS complexes detected as QRS complexes), SE stands for sensitivity, and +P stands for positive predictivity.

www.nature.com/scientificreports/
1 2SCiEntifiC REpoRts | 7: 459 | DOI:10.1038/s41598-017-00540-x
The proposed method could play a major role in the early detection of disease in low- and middle- income countries (LMICs) where there are major challenges with providing high-quality and universally accessible health care. This is because it follows the framework recommended in ref.42 for tackling noncommunicable diseases by achieving simplicity and reliability. Application of the method may increase the capability to develop e-health technologies that significantly impact morbidity and mortality rates, especially for those living in LMICs.
ConclusionsOur proposed lossy compression Method III is a simple yet efficient method that is validated with QRS detection and should be used for wearable, point-of-care, and e-health ECG devices. Method III outperformed existing compression algorithms by achieving a compression ratio of 4.5× with the highest QRS detection accuracy (an SE of 99.78% and a +P of 99.92% using the MIT-BIH arrhythmia database). Results show that Method III is suitable for wearable sensors and processing long-term recordings and large databases as well as for expanding telemed-icine capabilities in the near future. To the best of our knowledge, this is the first simple algorithm that improves QRS detection using data compression.
MethodsData Used. The MIT-BIH arrhythmia database, which contains 109,984 heart beats29, was used to evaluate the performance of the compression methods. This database is widely used to evaluate ECG compression and QRS detection algorithms as it includes different types of noise and various shapes of arrhythmic QRS com-plexes33. Moreover, the database contains annotation of R peaks for all ECG signals. The benchmark database contains 48 half-hour ambulatory ECG recordings. These recordings have 11-bit resolution over 10 mV and are sampled at 360 Hz. This database is used for training the proposed method and for comparison against the pub-lished ECG compression methods.
The QT database with 111,301 beats43 is used for evaluating the performance of our proposed compression algorithm. The QT database contains 105 records of 15-minute recording sampled at 250 Hz.
Compression Method I: Adaptive Linear Prediction. Method I is our benchmark lossless compres-sion method to compare and evaluate our proposed lossy method against. Several forward–prediction based approaches were used for QRS detection as reported in refs8,44,45. Linear forward prediction was used to estimate the current sample x[n] of the ECG signal in these approaches from its past m samples:
∑= −=
x̂ n h x n k[ ] [ ](3)k
mk
1
where x̂ n[ ] is the estimate of x[n], and hm is the predictor coefficients. Thus, the prediction error e[n] (the differ-ence between the actual sample and its estimate x̂ n[ ]) is:
= − .ˆe n x n x n[ ] [ ] [ ] (4)
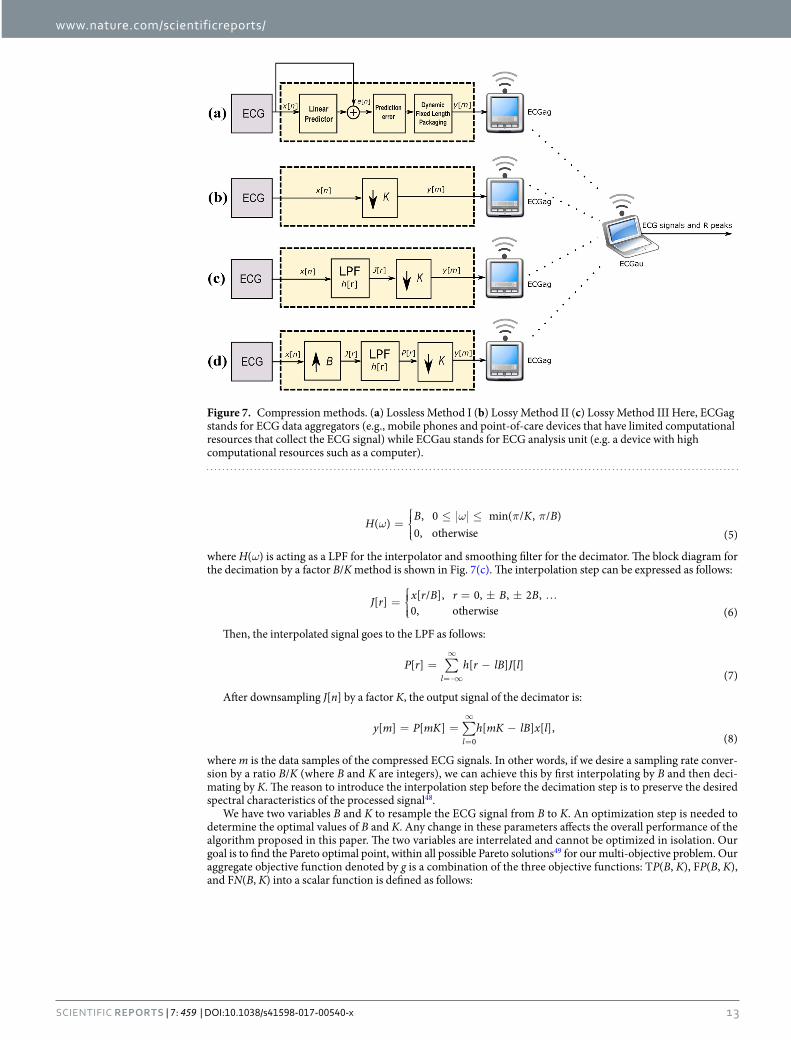
In this paper, we evaluated the recently published work by Deepu and Lian8 on ECG compression techniques using adaptive linear prediction. The block diagram representation of this method is shown in Fig. 7(a). The method applied a QRS detector on the prediction error e[n] signal, followed by fixed-length packaging.
Compression Method II: Compressive Sampling Matching Pursuit. Method II is our benchmark lossy compression method to compare and evaluate our proposed lossy method against. It is based on compressive sensing for potential implementation in e-health systems as described in ref.9. In Method II the ECG signal goes throw of four processing stages: sampling, redundancy removal module, quantization and Huffman encoding, as shown in Fig. 7(b). The output signal y[n] is then transmitted to a remote ECGau where the reconstruction of original ECG signal is performed. The novelty of this algorithm relies on the reconstruction algorithm that relies on prior knowledge of ECG wavelet coefficient structure to improve reconstruction quality.
Compression Method III: Decimating by a Factor B/K. Method III is our proposed lossy compression method. This method achieved a sampling rate conversion by first applying an interpolation step (upsampling followed by a lowpass Filter [LPF]), by factor B and then decimating (LPF followed by downsampling) the output by factor K as discussed in refs46,47. The two filters can be combined as a single LPF with a frequency response H(ω), which possess the following frequency response characteristic:
Ref # Beats SE (%) +P (%)
Aristotle57 86892 97.20 99.46
Martnez et al.57 86892 99.92 99.88
Pan and Tompkins33 111201 97.99 99.05
Elgendi33 111201 99.99 99.67
Method III 111201 99.90 99.84
Table 6. Comparison of the QRS detection with other published algorithms on the QT database. SE stands for sensitivity, while +P stands for positive predictivity.
www.nature.com/scientificreports/
13SCiEntifiC REpoRts | 7: 459 | DOI:10.1038/s41598-017-00540-x
ωω π π
=
≤ ≤H B K B( ) , 0 min( / , / )0, otherwise (5)
where H(ω) is acting as a LPF for the interpolator and smoothing filter for the decimator. The block diagram for the decimation by a factor B/K method is shown in Fig. 7(c). The interpolation step can be expressed as follows:
=
= ± ± …J r x r B r B B[ ] [ / ], 0, , 2 ,0, otherwise (6)
Then, the interpolated signal goes to the LPF as follows:
∑= −=−∞
∞P r h r lB J l[ ] [ ] [ ]
(7)l
After downsampling J[n] by a factor K, the output signal of the decimator is:
∑= = −=
∞y m P mK h mK lB x l[ ] [ ] [ ] [ ],
(8)l 0
where m is the data samples of the compressed ECG signals. In other words, if we desire a sampling rate conver-sion by a ratio B/K (where B and K are integers), we can achieve this by first interpolating by B and then deci-mating by K. The reason to introduce the interpolation step before the decimation step is to preserve the desired spectral characteristics of the processed signal48.
We have two variables B and K to resample the ECG signal from B to K. An optimization step is needed to determine the optimal values of B and K. Any change in these parameters affects the overall performance of the algorithm proposed in this paper. The two variables are interrelated and cannot be optimized in isolation. Our goal is to find the Pareto optimal point, within all possible Pareto solutions49 for our multi-objective problem. Our aggregate objective function denoted by g is a combination of the three objective functions: TP(B, K), FP(B, K), and FN(B, K) into a scalar function is defined as follows:
Figure 7. Compression methods. (a) Lossless Method I (b) Lossy Method II (c) Lossy Method III Here, ECGag stands for ECG data aggregators (e.g., mobile phones and point-of-care devices that have limited computational resources that collect the ECG signal) while ECGau stands for ECG analysis unit (e.g. a device with high computational resources such as a computer).

www.nature.com/scientificreports/
1 4SCiEntifiC REpoRts | 7: 459 | DOI:10.1038/s41598-017-00540-x
=×
× + +
≤ ≤≤ ≤
g B K B KB K B K B K
B Kb B bk K k
TPTP FP FN
argmax ( , ) 2 ( , )2 ( , ) ( , ) ( , )
,subject to ,
, (9)min max
min max
where g is the traditional F-measure or balanced F-score, which is the harmonic mean of sensitivity and positive predictivity. TP(B, K), FP(B, K), and FN(B, K) are the three objective functions to be maximized jointly. The Pareto frontier is formed with solutions (the values of two decision variables) that optimizes all parameters. Once the Pareto solutions are achieved, the optimal solution will be used for the implementation. In other words, we are systematically enumerating all possible combinations of B and K that maximizes the value of g. Note, the Pareto optimal solution assures simultaneous improvement of all objectives.
QRS Detection. The detection algorithm of the QRS complex published in refs33,35, a two event-related mov-ing averages (TERMA) algorithm50, was used during the data analysis to capture the QRS complexes. TERMA is a fast (computationally efficient) and suitable algorithm for implementation on battery-operated mobile devices, as recommended in refs33,35. Therefore, the use of TERMA in combination with the proposed compression algo-rithm is expected to improve the overall ECG signal analysis, storage capacity, processing time, and signal trans-mission. In other words, an immediate feedback to the user can be achieved at the ECGag level, long recorded ECG signals can be saved at the ECGags, the transmission between the ECGags and ECGaus will be optimized, and the decision making at the ECGau level will speed up.
The TERMA-based QRS detection algorithm50 consists of four stages (filtering, enhancing, generating poten-tial blocks, and thresholding) and uses five parameters (starting frequency [F1], end frequency [F2], first moving average [MAevent with a window size of W1], second moving average [MAcycle with a window size of W2], and rejec-tion threshold [β]). First, the ECG signal was passed through a third-order Butterworth filter with a bandpass filter F1 − F2. The resulting signal was then squared, and two moving averages (MAevent and MAcycle) were applied with a rejection threshold (β) to generate blocks of interest. After applying a rigorous optimization step discussed in ref.33, the optimal parameters for the QRS detector were F1 = 8 Hz, F2 = 20 Hz, W1 = 97 ms, W2 = 611 ms, and β = 8. Therefore, the QRS detector was within these optimal parameters.
The TERMA-based QRS detector will only be applied to proposed Methods III. Since the QRS detection per-formance was not reported for Method II, Method I is the benchmark to compare the proposed methods against as described in ref.8. Method I will use its already incorporated QRS detector, which removes the high-frequency impulse noise from the prediction error signal. The output will be run through the Savtizky-Golay filter to smooth the incoming signal by approximating the signal within a specified window of size W to a polynomial of order q that best matched the given signal in a least-squares sense.
Compression Ratio. The bit compression ratio (BCR) was calculated as follows:
=BCR size(BW )size(BW)
,(10)
u
c
where BWc and BWu refer to the bit widths of compressed and uncompressed samples, respectively. If we evaluate the performance of a compression algorithm based only on BCR, we can conclude that the higher the BCR, the better the compression algorithm.
Percentage Root Means Squared Difference. The percentage root means squared difference (PRD) is used to quantify the recovered signal quality by measuring the error between original and reconstructed signal, as follows:
= − ׈ ˆx x xPRD 100/ , (11)2 2
where x is raw ECG signal while x̂ is the reconstructed ECG signal. If we evaluate the performance of a compres-sion algorithm based only on PRD, we can conclude that the lower the PRD, the better the compression algorithm.
References 1. Alwan, A. Global status report on noncommunicable diseases 2010. World Health Organization (2011). 2. Dilaveris, P. E. et al. Simple electrocardiographic markers for the prediction of paroxysmal idiopathic atrial fibrillation. American
Heart Journal 135, 733–738 (1998). 3. Kannan, R. & Eswaran, C. Lossless compression schemes for ecg signals using neural network predictors. EURASIP Journal on
Applied Signal Processing 2007, 102–102 (2007). 4. Calhoun, B. H. et al. Body sensor networks: A holistic approach from silicon to users. Proceedings of the IEEE 100, 91–106 (2012). 5. Luo, K., Li, J. & Wu, J. A dynamic compression scheme for energy-efficient real-time wireless electrocardiogram biosensors. IEEE
Transactions on Instrumentation and Measurement 63, 2160–2169 (2014). 6. Manikandan, M. S. & Dandapat, S. Wavelet-based electrocardiogram signal compression methods and their performances: A
prospective review. Biomedical Signal Processing and Control 14, 73–107 (URL. http://www.sciencedirect.com/science/article/pii/S1746809414000998 (2014).
7. Nallathambi, G. & Principe, J. C. Integrate and fire pulse train automaton for qrs detection. IEEE Transactions on Biomedical Engineering 61, 317–326 (2014).

www.nature.com/scientificreports/
1 5SCiEntifiC REpoRts | 7: 459 | DOI:10.1038/s41598-017-00540-x
8. Deepu, C. J. & Lian, Y. A joint QRS detection and data compression scheme for wearable sensors. IEEE Transactions on Biomedical Engineering 62, 165–175 (2015).
9. Polania, L. F., Carrillo, R. E., Blanco-Velasco, M. & Barner, K. E. Exploiting prior knowledge in compressed sensing wireless ecg systems. IEEE journal of Biomedical and Health Informatics 19, 508–519 (2015).
10. Chua, E. & Fang, W.-C. Mixed bio-signal lossless data compressor for portable brain-heart monitoring systems. IEEE Transactions on Consumer Electronics 57, 267–273 (2011).
11. Chen, S.-L. & Wang, J.-G. VLSI implementation of low-power cost-efficient lossless ecg encoder design for wireless healthcare monitoring application. Electronics Letters 49, 91–93 (2013).
12. Chen, S.-L., Lee, H.-Y., Chen, C.-A., Huang, H.-Y. & Luo, C.-H. Wireless body sensor network with adaptive low-power design for biometrics and healthcare applications. IEEE Systems Journal 3, 398–409 (2009).
13. Deepu, C. J., Zhang, X., Liew, W.-S., Wong, D. & Lian, Y. An ECG-SoC with 535 nW/channel lossless data compression for wearable sensors. In IEEE Asian Solid-State Circuits Conference 145–148 (IEEE, 2013).
14. Ruttimann, U. E. & Pipberger, H. V. Compression of the ecg by prediction or interpolation and entropy encoding. IEEE Transactions on Biomedical Engineering BME-26, 613–623 (1979).
15. Abenstein, J. P. & Tompkins, W. J. A new data-reduction algorithm for real-time ecg analysis. IEEE Transactions on Biomedical Engineering BME-29, 43–48 (1982).
16. Furht, B. & Perez, A. An adaptive real-time ecg compression algorithm with variable threshold. IEEE Transactions on Biomedical Engineering 35, 489–494 (1988).
17. Jalaleddine, S. M. S., Hutchens, C. G., Strattan, R. D. & Coberly, W. A. Ecg data compression techniques-a unified approach. IEEE Transactions on Biomedical Engineering 37, 329–343 (1990).
18. Tai, S. C., Chang, C. W. & Chen, C. F. Designing better adaptive sampling algorithms for ecg holter systems. IEEE Transactions on Biomedical Engineering 44, 901–903 (1997).
19. Kim, H., Yazicioglu, R. F., Merken, P., Hoof, C. V. & Yoo, H. J. Ecg signal compression and classification algorithm with quad level vector for ecg holter system. IEEE Transactions on Information Technology in Biomedicine 14, 93–100 (2010).
20. Huang, B., Wang, Y. & Chen, J. {ECG} compression using the context modeling arithmetic coding with dynamic learning vectorâ–scalar quantization. Biomedical Signal Processing and Control 8, 59–65 (URL. http://www.sciencedirect.com/science/article/pii/S174680941200047X 2013).
21. Mukhopadhyay, S., Mitra, S. & Mitra, M. {ECG} signal compression using {ASCII} character encoding and transmission via {SMS}. Biomedical Signal Processing and Control 8, 354–363 (URL. http://www.sciencedirect.com/science/article/pii/S1746809413000360 2013).
22. Abo-Zahhad, M., Al-Ajlouni, A. F., Ahmed, S. M. & Schilling, R. A new algorithm for the compression of {ECG} signals based on mother wavelet parameterization and best-threshold levels selection. Digital Signal Processing 23, 1002–1011 (URL. http://www.sciencedirect.com/science/article/pii/S1051200412002746 2013).
23. Cho, G.-Y., Lee, S.-J. & Lee, T.-R. An optimized compression algorithm for real-time ecg data transmission in wireless network of medical information systems. Journal of medical systems 39, 161 (2015).
24. Chua, E. & Fang, W.-C. Mixed bio-signal lossless data compressor for portable brain-heart monitoring systems. IEEE Transactions on Consumer Electronics 57, 267–273 (2011).
25. Arnavut, Z. ECG signal compression based on burrows-wheeler transformation and inversion ranks of linear prediction. IEEE transactions on biomedical engineering 54, 410–418 (2007).
26. Miaou, S.-G. & Chao, S.-N. Wavelet-based lossy-to-lossless ECG compression in a unified vector quantization framework. IEEE Transactions on Biomedical Engineering 52, 539–543 (2005).
27. Craven, D., McGinley, B., Kilmartin, L., Glavin, M. & Jones, E. Compressed sensing for bioelectric signals: a review. IEEE journal of biomedical and health informatics 19, 529–540 (2015).
28. Li, C., Zheng, C. & Tai, C. Detection of ECG characteristic points using wavelet transforms. IEEE Transactions on Biomedical Engineering 42, 21–28 (1995).
29. Moody, G. B. & Mark, R. G. The impact of the MIT-BIH arrhythmia database. IEEE Engineering in Medicine and Biology Magazine 20, 45–50 (2001).
30. Martinez, J. P., Almeida, R., Olmos, S., Rocha, A. P. & Laguna, P. A wavelet-based ECG delineator: evaluation on standard databases. IEEE Transactions on Biomedical Engineering 51, 570–581 (2004).
31. Moraes, J. C. T. B., Freitas, M. M., Vilani, F. N. & Costa, E. V. A QRS complex detection algorithm using electrocardiogram leads. In Proc. IEEE Computers in Cardiology 205–208 (2002).
32. Elgendi, M., Jonkman, M. & De Boer, F. Frequency bands effects on QRS detection. In Proc. International Joint Conference on Biomedical Engineering Systems and Technologies, BIOSIGNALS 2010 Valencia, Spain, 428–431 (2010).
33. Elgendi, M. Fast QRS detection with an optimized knowledge-based method: Evaluation on 11 standard ECG databases. PLoS One 8, e73557 (URL. http://dx.doi.org/10.1371 2013).
34. Elgendi, M., Meo, M. & Abbott, D. A proof-of-concept study: Simple and effective detection of p and t waves in arrhythmic ecg signals. Bioengineering 3, 26 (URL. http://www.mdpi.com/2306-5354/3/4/26 2016).
35. Elgendi, M., Eskofier, B., Dokos, S. & Abbott, D. Revisiting QRS detection methodologies for portable, wearable, battery-operated, and wireless ECG systems. PLoS One 9, 1–18 (URL. http://dx.doi.org/10.1371 2014.
36. Gradl, S., Kugler, P., Lohmuller, C. & Eskofier, B. Real-time ECG monitoring and arrhythmia detection using Android-based mobile devices. In Proc. 2012 Ann Int. Conf. IEEE Engineering in Medicine and Biology Society (EMBC) 2452–2455 (San Diego, CA, USA, 2012).
37. Oresko, J. Portable heart attack warning system by monitoring the ST segment via smartphone electrocardiogram processing Ph.D. thesis, University of Pittsburgh (2010).
38. Hii, P.-C. & Chung, W.-Y. A comprehensive ubiquitous healthcare solution on an Android mobile device. Sensors 11, 6799–6815 (2011).
39. Jasemian, Y. & Arendt-Nielsen, L. Evaluation of a realtime, remote monitoring telemedicine system using the bluetooth protocol and a mobile phone network. Journal of Telemedicine and Telecare 11, 256–260 (2005).
40. Jurik, A. D. & Weaver, A. C. Remote medical monitoring. Computer 41, 96–99 (2008). 41. Zhang, C. F. & Tae-Wuk, B. VLSI friendly ECG QRS complex detector for body sensor networks. IEEE Journal on Emerging and
Selected Topics in Circuits and Systems 2, 52–59 (2012). 42. Elgendi, M. et al. A six-step framework on biomedical signal analysis for tackling noncommunicable diseases: Current and future
perspectives. JMIR Biomed Eng 1, e1 (URL. http://biomedeng.jmir.org/2016/1/e1/ 2016). 43. Laguna, P., Mark, R. G., Goldberg, A. & Moody, G. B. A database for evaluation of algorithms for measurement of qt and other
waveform intervals in the ecg. In IEEE Computers in Cardiology 673–676 (IEEE, 1997). 44. Kyrkos, A., Giakoumakis, E. & Carayannis, G. QRS detection through time recursive prediction techniques. Signal Processing 15,
429–436 (1988). 45. Lin, K.-P. & Chang, W. H. QRS feature extraction using linear prediction. IEEE Transactions on Biomedical Engineering 36,
1050–1055 (1989). 46. Kovacevic, J. & Vetterli, M. Perfect reconstruction filter banks with rational sampling factors. IEEE Transactions on Signal Processing
41, 2047–2066 (1993).
www.nature.com/scientificreports/
1 6SCiEntifiC REpoRts | 7: 459 | DOI:10.1038/s41598-017-00540-x
47. Tao, R., Deng, B., Zhang, W.-Q. & Wang, Y. Sampling and sampling rate conversion of band limited signals in the fractional fourier transform domain. IEEE Transactions on Signal Processin g 56, 158–171 (2008).
48. Crochiere, R. & Rabiner, L. Optimum FIR digital filter implementations for decimation, interpolation, and narrow-band filtering. IEEE Transactions on Acoustics, Speech, and Signal Processing 23, 444–456 (1975).
49. Mattson, C. A., Mullur, A. A. & Messac, A. Smart Pareto filter: Obtaining a minimal representation of multiobjective design space. Engineering Optimization 36, 721–740 (2004).
50. Elgendi, M. TERMA framework for biomedical signal analysis: An economic-inspired approach. Biosensors 6, 55 (URL. http://www.mdpi.com/2079-6374/6/4/55 2016).
51. Chen, S.-W., Chen, H.-C. & Chan, H.-L. A real-time qrs detection method based on moving-averaging incorporating with wavelet denoising. Computer Methods and Programs in Biomedicine 82, 187–195 (2006).
52. Poli, R., Cagnoni, S. & Valli, G. Genetic design of optimum linear and nonlinear qrs detectors. IEEE Transactions on Biomedical Engineering 42, 1137–1141 (1995).
53. Afonso, V., Tompkins, W., Nguyen, T. & Luo, S. Ecg beat detection using filter banks. IEEE Transactions on Biomedical Engineering 46, 192–202 (1999).
54. Hamilton, P. & Tompkins, W. Quantitative investigation of QRS detection rules using the MIT/BIH arrhythmiac database. IEEE Transactions in Biomedical Engineering 33, 1157–1165 (1986).
55. Zhang, F. & Lian, Y. QRS detection based on multiscale mathematical morphology for wearable ecg devices in body area networks. IEEE Transactions on Biomedical Circuits and Systems 3, 220–228 (2009).
56. Ieong, C.-I. et al. A 0.83-qrs detection processor using quadratic spline wavelet transform for wireless ecg acquisition in 0.35-cmos. IEEE transactions on biomedical circuits and systems 6, 586–595 (2012).
57. Martnez, J. P., Almeida, R., Olmos, S., Rocha, A. P. & Laguna, P. A wavelet-based ECG delineator: evaluation on standard databases. IEEE Transactions on Biomedical Engineering 51, 570–581 (2004).
58. Polania, L. F., Carrillo, R. E., Blanco-Velasco, M. & Barner, K. E. Compressed sensing based method for ecg compression. In 2011 IEEE International Conference on Acoustics, Speech and Signal Processing, Prague, Czech Republic 761–764 (IEEE, 2011).
59. Mamaghanian, H., Khaled, N., Atienza, D. & Vandergheynst, P. Compressed sensing for real-time energy-efficient ecg compression on wireless body sensor nodes. IEEE Transactions on Biomedical Engineering 58, 2456–2466 (2011).
60. Mishra, A., Thakkar, F., Modi, C. & Kher, R. Ecg signal compression using compressive sensing and wavelet transform. In the 2012 Annual International Conference of the IEEE Engineering in Medicine and Biology Society, 28 Aug–01 Sep 2012 San Diego, CA, USA, 3404–3407 (IEEE, 2012).
61. Ansari-Ram, F. & Hosseini-Khayat, S. Ecg signal compression using compressed sensing with nonuniform binary matrices. In the 2012 16th CSI International Symposium on Artificial Intelligence and Signal Processing, May 2–3 Shiraz, Iran, 305–309 (IEEE, 2012).
62. Casson, A. J. & Rodriguez-Villegas, E. Signal agnostic compressive sensing for body area networks: Comparison of signal reconstructions. In the 2012 Annual International Conference of the IEEE Engineering in Medicine and Biology Society, 28 Aug–01 Sep 2012, San Diego, CA, USA, 4497–4500 (IEEE, 2012).
63. Kumar, R., Kumar, A. & Pandey, R. K. Beta wavelet based ECG signal compression using lossless encoding with modified thresholding. Computers Electrical Engineering 39, 130–140 URL// www.sciencedirect.com/science/article/pii/S0045790612000808. Special issue on Recent Advanced Technologies and Theories for Grid and Cloud Computing and Bio-engineering (2013).
64. Chae, D. H., Alem, Y. F., Durrani, S. & Kennedy, R. A. Performance study of compressive sampling for ecg signal compression in noisy and varying sparsity acquisition. In the 2013 IEEE International Conference on Acoustics, Speech and Signal Processing, 26 May–31 May, Vancouver, Canada, 1306–1309 (IEEE, 2013).
AcknowledgementsThis work was made possible by NPRP grant #7-684-1-127 from the Qatar National Research Fund (a member of Qatar Foundation). The statements made herein are solely the responsibility of the authors.
Author ContributionsM.E., A.M. and R.W. designed the experiment. M.E. and R.W. performed the statistical analysis. M.E., A.M. and R.W. conceived of the study, and drafted the manuscript. The authors approved the final manuscript.
Additional InformationCompeting Interests: The authors declare that they have no competing interests.Change History: A correction to this article has been published and is linked from the HTML version of this paper. The error has not been fixed in the paper.Publisher’s note: Springer Nature remains neutral with regard to jurisdictional claims in published maps and institutional affiliations.
This work is licensed under a Creative Commons Attribution 4.0 International License. The images or other third party material in this article are included in the article’s Creative Commons license,
unless indicated otherwise in the credit line; if the material is not included under the Creative Commons license, users will need to obtain permission from the license holder to reproduce the material. To view a copy of this license, visit http://creativecommons.org/licenses/by/4.0/ © The Author(s) 2017
Copyright © 2022 FDOKUMEN