The ECG Made Easy E-Book - Pre-Med
269
-
Upload
khangminh22 -
Category
Documents
-
view
2 -
download
0
Transcript of The ECG Made Easy E-Book - Pre-Med
The ECG Made Easy
NINTH EDITION
John Hampton DM MA DPhil FRCPFFPM FESCEmeritus Professor of Cardiology, University of Nottingham, UK
Joanna Hampton MD MA BM BCh FRCPConsultant Physician, Addenbrooke's Hospital, Cambridge, UKEDINBURGH LONDON NEW YORK OXFORD PHILADELPHIA ST LOUIS SYDNEY 2019
Table of Contents
Cover image
Title Page
Copyright
How to use this book
Part 1: The ECG made very easy indeed: a beginner's guide
Part 2: The basics: the fundamentals of ECG recording, reportingand interpretation
Part 3: Making the most of the ECG: the clinical interpretation ofindividual ECGs
Part 4: Now test yourself
Quick reminders
Further reading
PrefacePart 1 The ECG made very easy indeed: a beginner'sguide
1 The ECG made very easy indeed
What is an ECG?
When do you need an ECG?
How to record an ECG?
How to interpret an ECG: the basics
Rhythms you must be able to recognize
Patterns you must be able to recognize
The normal ECG and its variants
ECG red flags
Part 2 The basics: the fundamentals of ECGrecording, reporting and interpretation
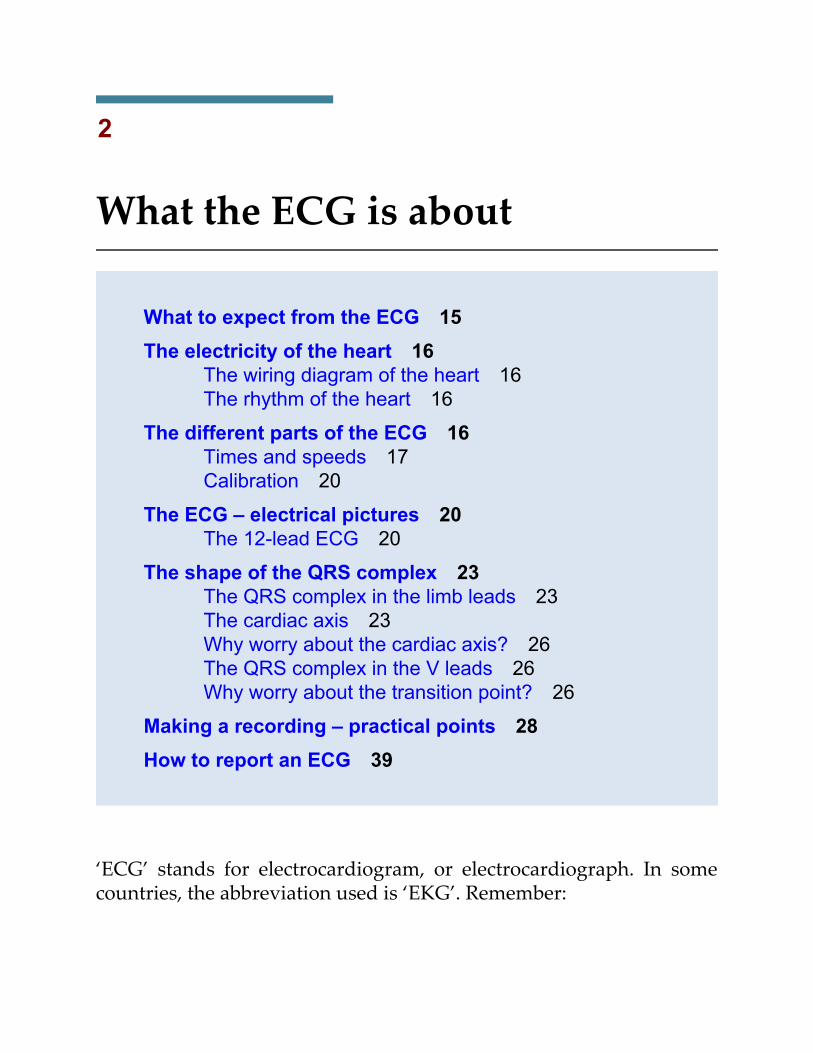
2 What the ECG is about
What to Expect from the ECG
The electricity of the heart
The different parts of the ECG
The ECG – electrical pictures
The shape of the QRS complex
Making a recording – practical points
How to report an ECG

3 Conduction and its problems
Conduction problems in the AV node and His bundle
Conduction problems in the right and left bundle branches –bundle branch block
Conduction problems in the distal parts of the left bundle branch
What to do
4 The rhythm of the heart
The intrinsic rhythmicity of the heart
Abnormal rhythms
The bradycardias – the slow rhythms
Extrasystoles
The tachycardias – the fast rhythms
Fibrillation
Wolff-Parkinson-White syndrome
The origins of tachycardias
What to do
The Identification of Rhythm Abnormalities
5 Abnormalities of P waves, QRS complexes and T waves
Abnormalities of the P wave
Abnormalities of the QRS complex
Abnormalities of the ST segment
Abnormalities of the T wave
Other abnormalities of the ST segment and the T wave
Part 3 Making the most of the ECG: the clinicalinterpretation of individual ECGs
6 The ECG in healthy subjects
The normal cardiac rhythm
The P wave
Conduction
The QRS complex
The ST segment
The T wave
U waves
The ECG in athletes
7 The ECG in patients with chest pain or breathlessness
The ECG in patients with constant chest pain
The ECG in patients with intermittent chest pain
The ECG in patients with breathlessness
8 The ECG in patients with palpitations or syncope
The ECG when the patient has no symptoms
The ECG when the patient has symptoms
Pacemakers
Cardiac arrest
Part 4 Now test yourself
9 ECGs you must be able to recognize
ECG descriptions and interpretations
Index
Quick Reminder Guide
When reporting an ECG, remember
What to Look for
Glossary
Copyright
© 2019 Elsevier Ltd. All rights reserved.
First edition 1973Second edition 1980Third edition 1986Fourth edition 1992Fifth edition 1997Sixth edition 2003Seventh edition 2008Eighth edition 2013Ninth edition 2019
The right of John Hampton and Joanna Hampton to be identified asauthor(s) of this work has been asserted by them in accordance withthe Copyright, Designs and Patents Act 1988.
No part of this publication may be reproduced or transmitted in anyform or by any means, electronic or mechanical, includingphotocopying, recording, or any information storage and retrievalsystem, without permission in writing from the Publisher. Details onhow to seek permission, further information about the Publisher'spermissions policies and our arrangements with organizations such asthe Copyright Clearance Center and the Copyright Licensing Agency,can be found at our website: www.elsevier.com/permissions.
This book and the individual contributions contained in it areprotected under copyright by the Publisher (other than as may be
noted herein).
NoticesPractitioners and researchers must always rely on their ownexperience and knowledge in evaluating and using any information,methods, compounds or experiments described herein. Because ofrapid advances in the medical sciences, in particular, independentverification of diagnoses and drug dosages should be made. To thefullest extent of the law, no responsibility is assumed by Elsevier,authors, editors or contributors for any injury and/or damage topersons or property as a matter of products liability, negligence orotherwise, or from any use or operation of any methods, products,instructions or ideas contained in the material herein.
ISBN 978-0-7020-7457-8978-0-7020-7466-0
Printed in ChinaLast digit is the print number: 9 8 7 6 5 4 3 2 1
Content Strategist: Laurence HunterContent Development Specialist: Fiona ConnProject Manager: Louisa TalbottDesign: Brian SalisburyIllustration Manager: Karen GiacomucciIllustrator: Helius and Gecko Ltd

How to use this book
Part 1: The ECG made very easyindeed: a beginner's guideThis guide has been written for those who are just starting to useECGs in their clinical practice. It aims to reduce the facts to the bareminimum. If you have no previous knowledge of the ECG, thischapter is for you. Once you have understood it, the rest of the bookwill amplify your knowledge, but this is the place to start when usingthe ECG for patient care.
Part 2: The basics: the fundamentals ofECG recording, reporting andinterpretationBefore you can use the ECG as an aid to diagnosis or treatment, youhave to understand the basics. Part 2 of this book explains why theelectrical activity of the heart can be recorded as an ECG, anddescribes the significance of the 12 ECG ‘leads’ that make ‘pictures’ ofthe electrical activity seen from different directions.
Part 2 also explains how the ECG can be used to measure the heartrate, to assess the speed of electrical conduction through differentparts of the heart, and to determine the rhythm of the heart. Thecauses of common ‘abnormal’ ECG patterns are described.

Part 3: Making the most of the ECG: theclinical interpretation of individualECGsIn this part of the book, we look beyond the basics and consider howthe ECG can help in the situations in which it is most used – in the‘screening’ of healthy subjects, and in patients with chest pain,breathlessness, palpitations or syncope. Recalling the classic ECGabnormalities covered in Chapters 2–5, we will look at some of thevariations that can make ECG interpretation seem more difficult,using examples of more ECGs from real patients with commonproblems.

Part 4: Now test yourselfYou should now be able to recognize the common ECG patterns, andthis final chapter contains twelve 12-lead ECGs from real patients foryou to interpret.
Quick remindersThis has been placed at the back of the book after the index so you canrefer to it quickly when you need to. It lists the common abnormalitiesyou must be able to recognize.
Further readingThe symbol indicates cross-references to useful information in TheECG Made Practical, 7th edition (Elsevier, 2019).
Preface
The ECG Made Easy was first published in 1973, and well over three-quarters of a million copies have been sold. The book has beentranslated into German, French, Spanish, Italian, Portuguese, Polish,Czech, Indonesian, Japanese, Russian and Turkish, and into twoChinese languages. The aims of this edition are the same as before: thebook is not intended to be a comprehensive textbook ofelectrophysiology, nor even of ECG interpretation – it is designed asan introduction to the ECG for medical students, technicians, nursesand paramedics. It may also provide useful revision for those whohave forgotten what they learned as students.
There really is no need for the ECG to be daunting: just as mostpeople drive a car without knowing much about engines, andgardeners do not need to be botanists, most people can make full useof the ECG without becoming submerged in its complexities. Thisbook encourages the reader to accept that the ECG is easy tounderstand and that its use is just a natural extension of taking thepatient's history and performing a physical examination.
The first edition of The ECG Made Easy (1973) was described by theBritish Medical Journal as a ‘medical classic’. The book has been afavourite of generations of medical students and nurses, and it haschanged a lot through progressive editions. This ninth edition differsfrom its predecessors in that it now includes a new chapter entitled‘The ECG made very easy indeed’. This basic guide has been writtenin response to feedback from both medical students and nurses, whowanted something even easier than previous editions of The ECGMade Easy! The guide aims to distil the bare essentials of using an ECGin clinical practice with minimal theory and maximum practicality.
The ECG Made Easy should help students to prepare for
examinations, but for the development of clinical competence – andconfidence – there is no substitute for reporting on large numbers ofclinical records. Two companion texts may help those who havemastered The ECG Made Easy and want to progress further. The ECGMade Practical (formerly The ECG in Practice) deals with therelationship between the patient's history and physical signs and theECG, and also with the many variations in the ECG seen in health anddisease. 150 ECG Cases (formerly 150 ECG Problems) describes 150clinical cases and gives their full ECGs, in a format that encouragesthe reader to interpret the records and decide on treatment beforelooking at the answers.
We are grateful to Laurence Hunter and Fiona Conn of Elsevier fortheir continuing support.
The title of The ECG Made Easy was suggested more than 45 yearsago by the late Tony Mitchell, Foundation Professor of Medicine at theUniversity of Nottingham, and many more books have beenpublished with a ‘Made Easy’ title since then. We are grateful to himand to the many people who have helped to refine the book over theyears, and particularly to many students for their constructivecriticisms and helpful comments, which have reinforced our beliefthat the ECG really is easy to understand.
JH, JH
PART 1The ECG made very easy indeed:a beginner's guide
OUTLINE
1 The ECG made very easy indeed
1
The ECG made very easy indeed
What is an ECG? 1When do you need an ECG? 1How to record an ECG 2How to interpret an ECG: the basics 2
The ECG waves and what they mean 2Interpretation starts here! 4
Rhythms you must be able to recognize 8Patterns you must be able to recognize 10The normal ECG and its variants 13ECG red flags 14
This guide has been written for those who are just starting to useECGs in their clinical practice. It aims to reduce the facts to the bareminimum. If you have no previous knowledge of the ECG, thischapter is for you. Once you have understood it, the rest of the bookwill amplify your knowledge, but this is the place to start when usingthe ECG for patient care.
What is an ECG?‘ECG’ stands for electrocardiogram, or electrocardiograph. In some
countries, the abbreviation used is ‘EKG’.The heart is a pump driven by intrinsic electrical impulses which
make the heart beat. An ECG is a paper recording of that electricalactivity. The ECG records where electrical impulses start and howthey flow through the heart. It does not measure how well the heart ispumping.
The electrical activity of the heart starts in the ‘internal pacemaker’,which is called the sinoatrial node. This is in the right atrium. Thenormal rhythm is called ‘sinus rhythm’ (properly it should be calledsinoatrial rhythm, but it isn't). The way electrical impulses flowthrough the heart is called conduction.
Abnormalities in the electrical activity of the heart can result inabnormal conduction or rhythms where the heart may go too quickly,too slowly, or beat irregularly.
Changes to the normal flow of electricity through the heart can beshown on an ECG and may indicate damaged heart muscle. Heartmuscle can be damaged by many disease processes such as infarction,hypertension and pulmonary embolism.
When do you need an ECG?An ECG should be recorded whenever a patient has chest pain,palpitations, breathlessness or dizziness, or if the patient has had anepisode of syncope (blackout) or an unexplained fall. In addition, apatient with a stroke or a transient ischaemic attack (TIA) must havean ECG as these may be due to an irregular heart rhythm.
Remember that the patient's symptoms and physical signs willguide interpretation of the ECG.
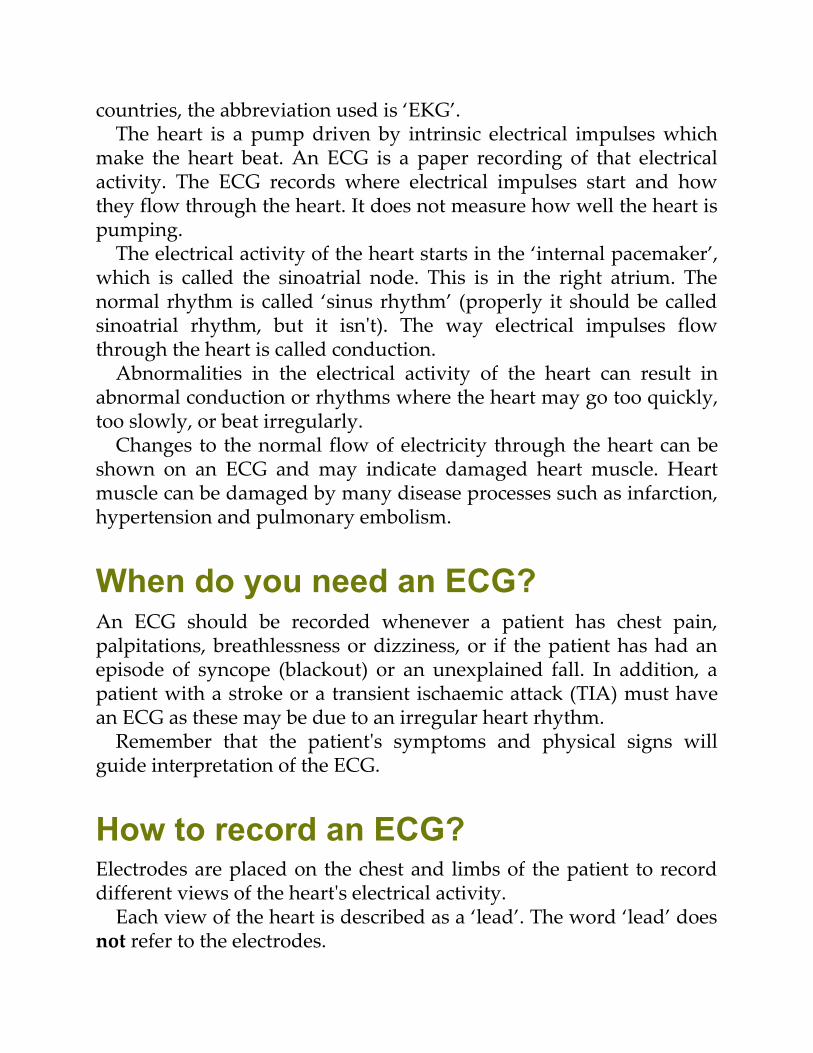
How to record an ECG?Electrodes are placed on the chest and limbs of the patient to recorddifferent views of the heart's electrical activity.
Each view of the heart is described as a ‘lead’. The word ‘lead’ doesnot refer to the electrodes.

The rhythm of the heart can be determined from only one view, i.e.one lead (this requires two electrodes).
For a full picture of the heart's electrical activity, a 12-lead view isconventional.
One electrode is attached to each limb. These four electrodesprovide six ‘limb leads’ or six different views of the heart in a verticalplane. These are called leads I, II, III, VL, VF and VR. VL, VF and VRused to be called AVL, AVF and AVR, respectively, but the A isessentially meaningless and is redundant.
Six electrodes are attached to the chest, recording leads V1 to V6.Accurate placement of these electrodes is essential for comparing laterECGs. These leads ‘look at’ the heart from the front in a horizontalplane (Fig. 1.1).
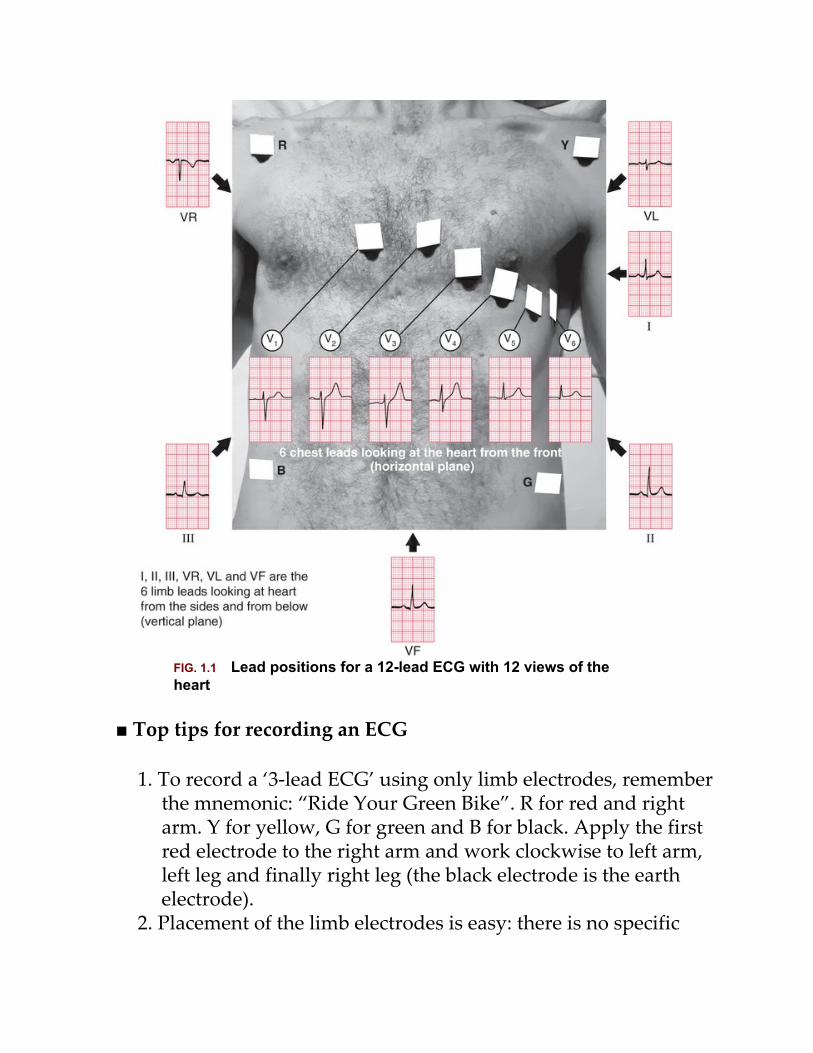
FIG. 1.1 Lead positions for a 12-lead ECG with 12 views of theheart
■ Top tips for recording an ECG
1. To record a ‘3-lead ECG’ using only limb electrodes, rememberthe mnemonic: “Ride Your Green Bike”. R for red and rightarm. Y for yellow, G for green and B for black. Apply the firstred electrode to the right arm and work clockwise to left arm,left leg and finally right leg (the black electrode is the earthelectrode).
2. Placement of the limb electrodes is easy: there is no specific

position to remember.Try to find the least hairy area: anywhere from the
shoulder or outer clavicle down to the wrist is finefor the upper limb; anywhere from the lowerabdomen to the foot on right and left side is fine forthe lower limb electrodes.
3. Placement of the chest electrodes MUST be accurate andstandardized for every recording (see Figs 1.1 and 2.24).
4. Make sure the patient is warm and relaxed.5. Check machine settings: standard is paper speed of
25 mm/second; the voltage calibration should be set so that1 mV causes 1 cm of upwards deflection (for more details, seeChapter 2).
6. Make sure the date and time are recorded and always ensurethe patient's name is on the ECG.
7. Write the patient's symptoms and BP on the ECG.
For more details, see Chapter 2, pages 28–38.
How to interpret an ECG: the basics■ Top tip: the more ECGs you read, the better you will become.
What follows is the bare minimum of ECG physiology for ECGinterpretation.
The ECG waves and what they mean
• Think of the heart as having internal wiring. Theinternal pacemaker is the sinoatrial node situatedin the right atrium (Fig. 1.2)
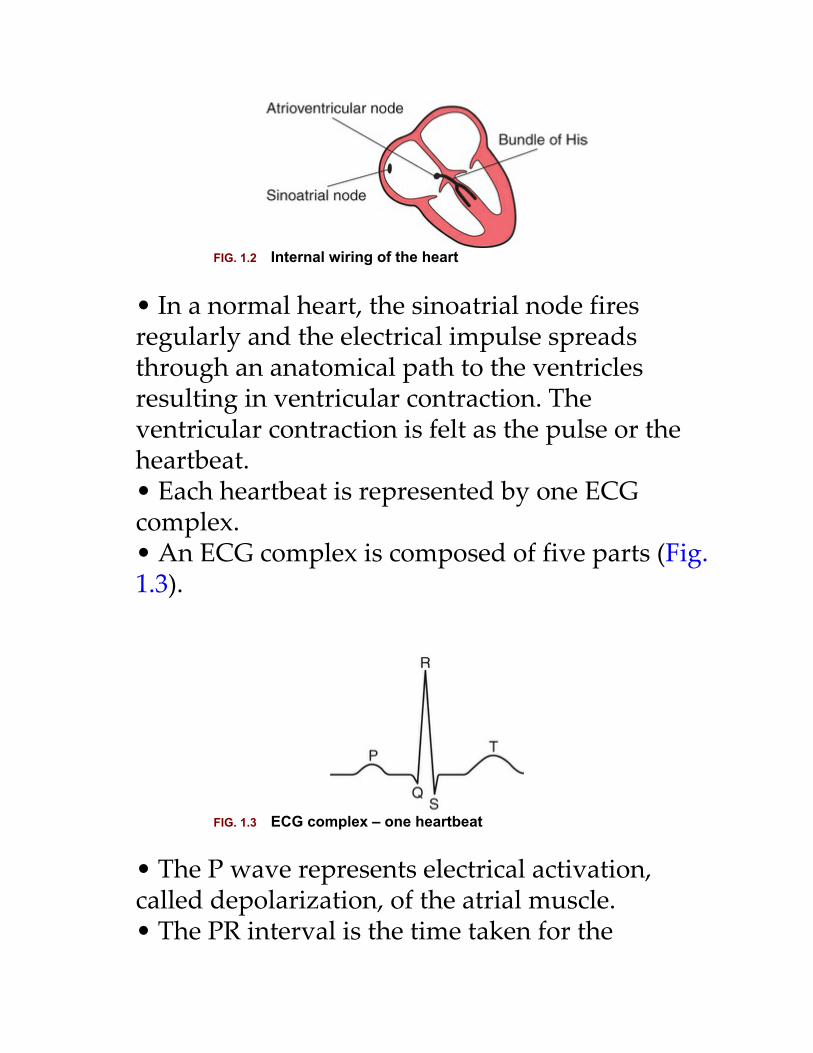
FIG. 1.2 Internal wiring of the heart
• In a normal heart, the sinoatrial node firesregularly and the electrical impulse spreadsthrough an anatomical path to the ventriclesresulting in ventricular contraction. Theventricular contraction is felt as the pulse or theheartbeat.• Each heartbeat is represented by one ECGcomplex.• An ECG complex is composed of five parts (Fig.1.3).
FIG. 1.3 ECG complex – one heartbeat
• The P wave represents electrical activation,called depolarization, of the atrial muscle.• The PR interval is the time taken for the
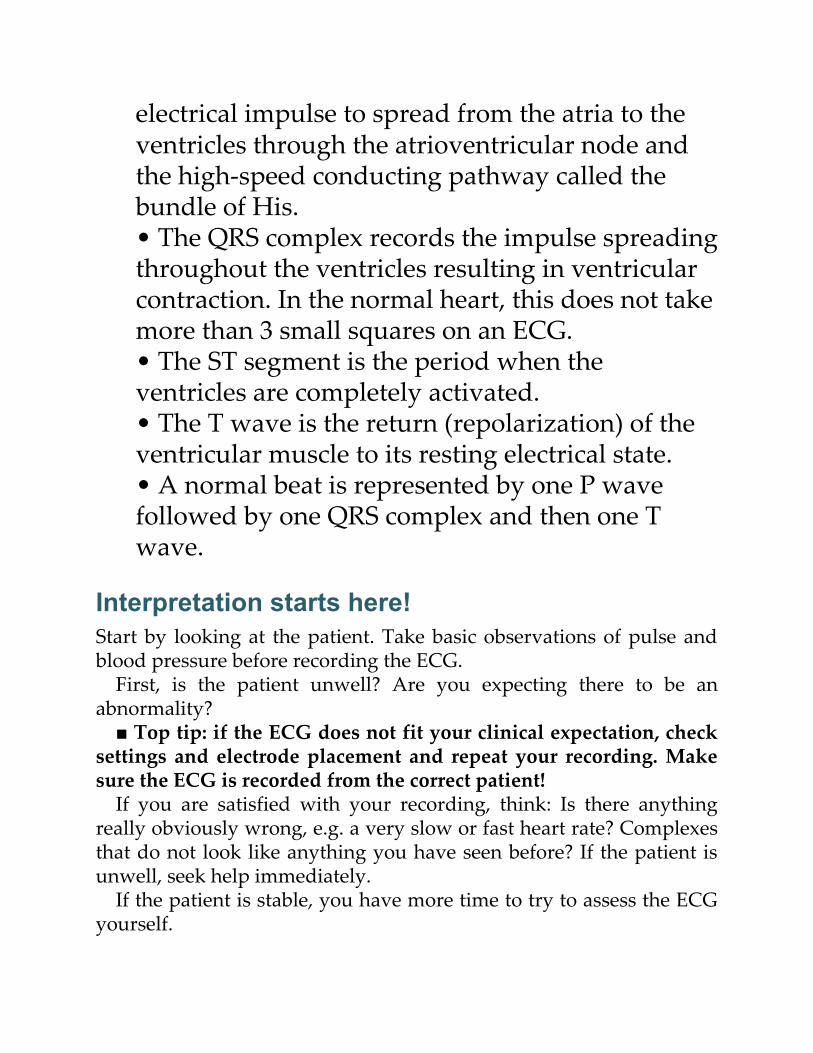
electrical impulse to spread from the atria to theventricles through the atrioventricular node andthe high-speed conducting pathway called thebundle of His.• The QRS complex records the impulse spreadingthroughout the ventricles resulting in ventricularcontraction. In the normal heart, this does not takemore than 3 small squares on an ECG.• The ST segment is the period when theventricles are completely activated.• The T wave is the return (repolarization) of theventricular muscle to its resting electrical state.• A normal beat is represented by one P wavefollowed by one QRS complex and then one Twave.
Interpretation starts here!Start by looking at the patient. Take basic observations of pulse andblood pressure before recording the ECG.
First, is the patient unwell? Are you expecting there to be anabnormality?■ Top tip: if the ECG does not fit your clinical expectation, check
settings and electrode placement and repeat your recording. Makesure the ECG is recorded from the correct patient!
If you are satisfied with your recording, think: Is there anythingreally obviously wrong, e.g. a very slow or fast heart rate? Complexesthat do not look like anything you have seen before? If the patient isunwell, seek help immediately.
If the patient is stable, you have more time to try to assess the ECGyourself.
■ Top tip: always approach the ECG the same way. Go throughthe following questions in the same order every time:
Say ‘R R P W Q S T’ – it rhymes, and might help you to rememberthe questions you need to answer!
R Rate What is the rate (measured in beats per minute [bpm])?
R Rhythm What is the rhythm?
P P wave Is there one P wave before every QRS complex?
W Width Is the width of the QRS complex normal (< 3 small squares)?
Q Q wave Are there any deep Q waves present?
S ST segment Is there ST segment depression or elevation?
T T wave Are there any abnormal inverted (upside down) T waves?
Let's now look at these questions in more detail. (Remember ‘R R PW Q S T’.)
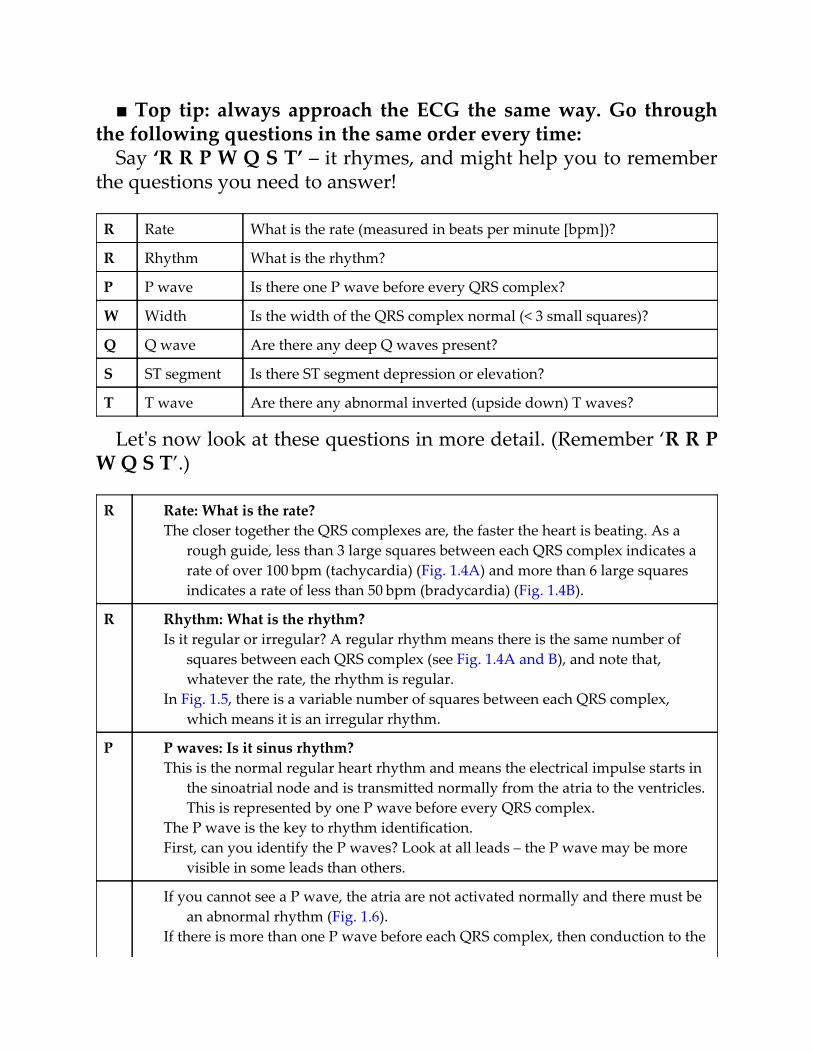
R Rate: What is the rate?The closer together the QRS complexes are, the faster the heart is beating. As a
rough guide, less than 3 large squares between each QRS complex indicates arate of over 100 bpm (tachycardia) (Fig. 1.4A) and more than 6 large squaresindicates a rate of less than 50 bpm (bradycardia) (Fig. 1.4B).
R Rhythm: What is the rhythm?Is it regular or irregular? A regular rhythm means there is the same number of
squares between each QRS complex (see Fig. 1.4A and B), and note that,whatever the rate, the rhythm is regular.
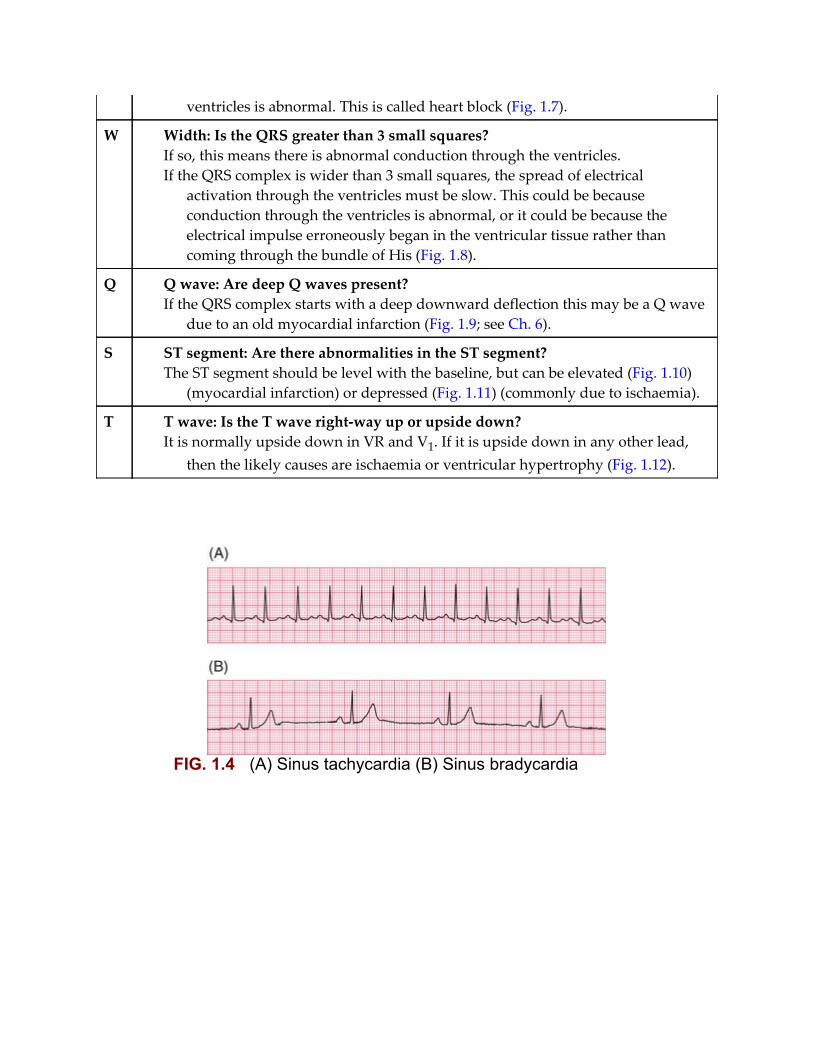
In Fig. 1.5, there is a variable number of squares between each QRS complex,which means it is an irregular rhythm.
P P waves: Is it sinus rhythm?This is the normal regular heart rhythm and means the electrical impulse starts in
the sinoatrial node and is transmitted normally from the atria to the ventricles.This is represented by one P wave before every QRS complex.
The P wave is the key to rhythm identification.First, can you identify the P waves? Look at all leads – the P wave may be more
visible in some leads than others.
If you cannot see a P wave, the atria are not activated normally and there must bean abnormal rhythm (Fig. 1.6).
If there is more than one P wave before each QRS complex, then conduction to the
ventricles is abnormal. This is called heart block (Fig. 1.7).
W Width: Is the QRS greater than 3 small squares?If so, this means there is abnormal conduction through the ventricles.If the QRS complex is wider than 3 small squares, the spread of electrical
activation through the ventricles must be slow. This could be becauseconduction through the ventricles is abnormal, or it could be because theelectrical impulse erroneously began in the ventricular tissue rather thancoming through the bundle of His (Fig. 1.8).
Q Q wave: Are deep Q waves present?If the QRS complex starts with a deep downward deflection this may be a Q wave
due to an old myocardial infarction (Fig. 1.9; see Ch. 6).
S ST segment: Are there abnormalities in the ST segment?The ST segment should be level with the baseline, but can be elevated (Fig. 1.10)
(myocardial infarction) or depressed (Fig. 1.11) (commonly due to ischaemia).
T T wave: Is the T wave right-way up or upside down?It is normally upside down in VR and V1. If it is upside down in any other lead,
then the likely causes are ischaemia or ventricular hypertrophy (Fig. 1.12).
FIG. 1.4 (A) Sinus tachycardia (B) Sinus bradycardia
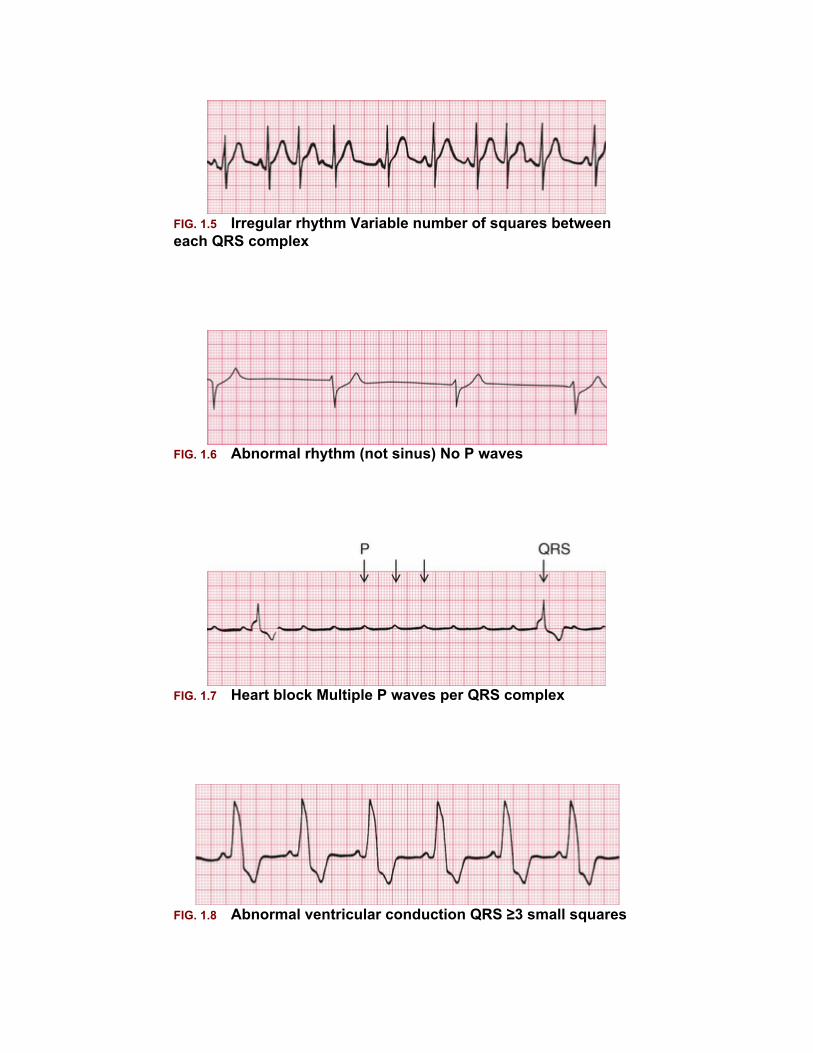
FIG. 1.5 Irregular rhythm Variable number of squares betweeneach QRS complex
FIG. 1.6 Abnormal rhythm (not sinus) No P waves
FIG. 1.7 Heart block Multiple P waves per QRS complex
FIG. 1.8 Abnormal ventricular conduction QRS ≥3 small squares
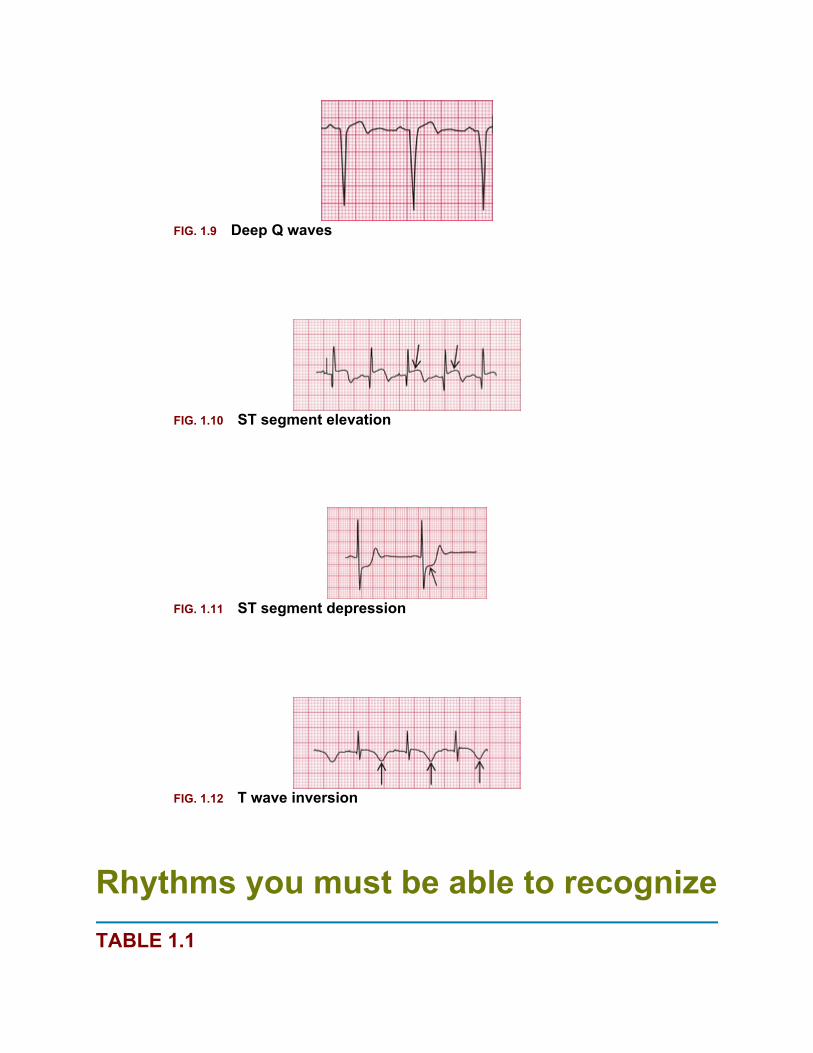
FIG. 1.9 Deep Q waves
FIG. 1.10 ST segment elevation
FIG. 1.11 ST segment depression
FIG. 1.12 T wave inversion
Rhythms you must be able to recognizeTABLE 1.1
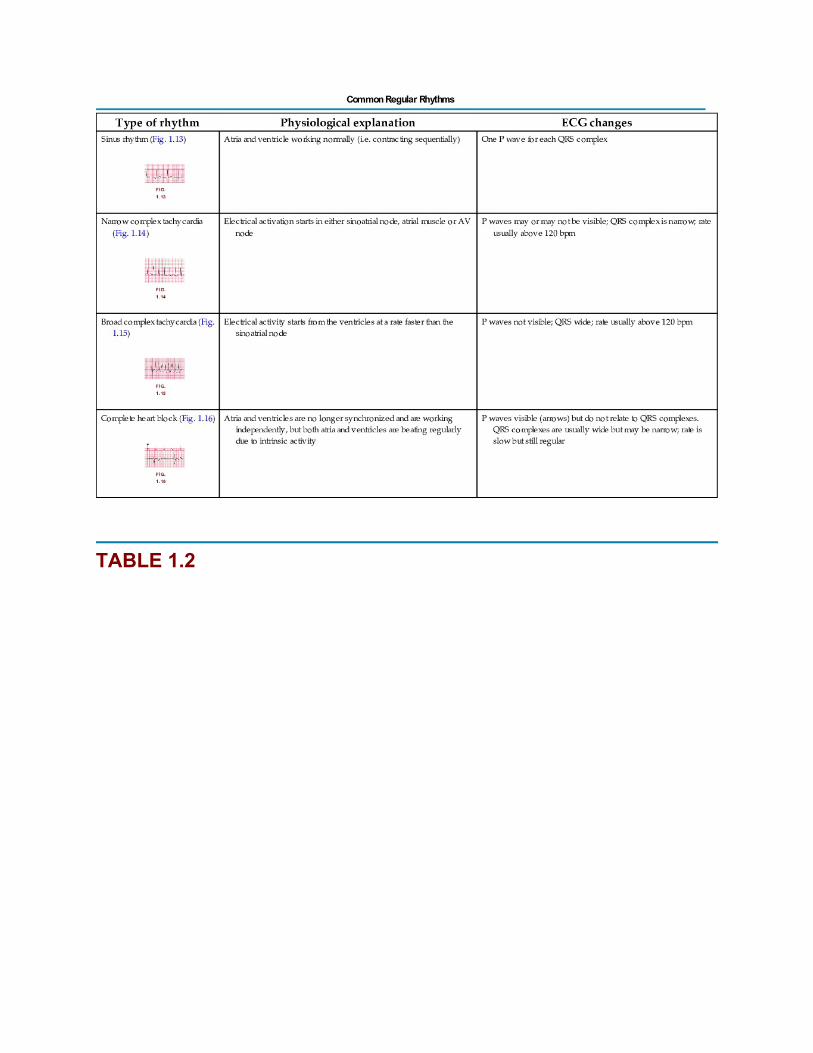
TABLE 1.2
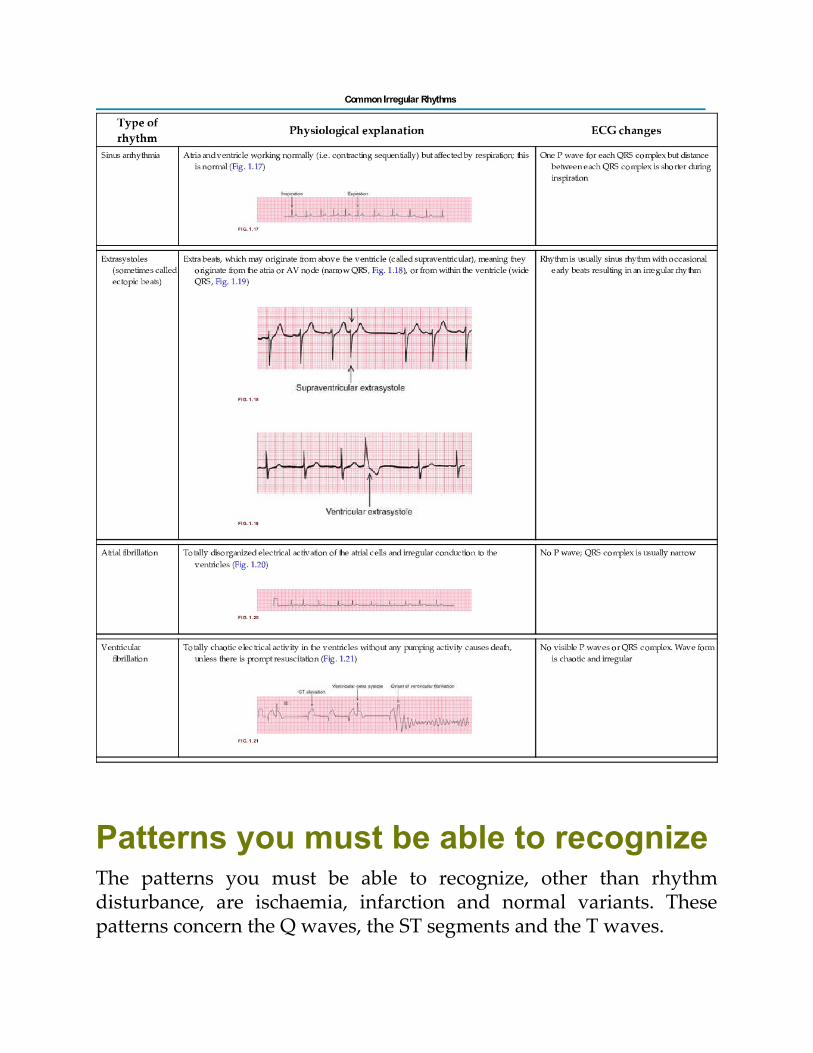
Patterns you must be able to recognizeThe patterns you must be able to recognize, other than rhythmdisturbance, are ischaemia, infarction and normal variants. Thesepatterns concern the Q waves, the ST segments and the T waves.

Fig. 1.22 shows sinus rhythm with ST depression in leads V2–V6.This change is characteristic of myocardial ischaemia and may be seenin someone having an anginal attack. Fig. 1.23 shows sinus rhythmwith T wave inversion across all the chest leads (V1–V6). This patternis also typical of acute myocardial ischaemia and may be seen inmyocardial infarction.
FIG. 1.22 Acute myocardial ischaemia with ST depression Sinusrhythm with ST depression in leads V2–V6
FIG. 1.23 Acute ischaemia with T wave inversion Sinus rhythmwith T wave inversion throughout all chest leads, V1–V6
Fig. 1.24 shows sinus rhythm with marked ST segment elevation inleads V2–V6. This is typical of acute myocardial infarction. Myocardial
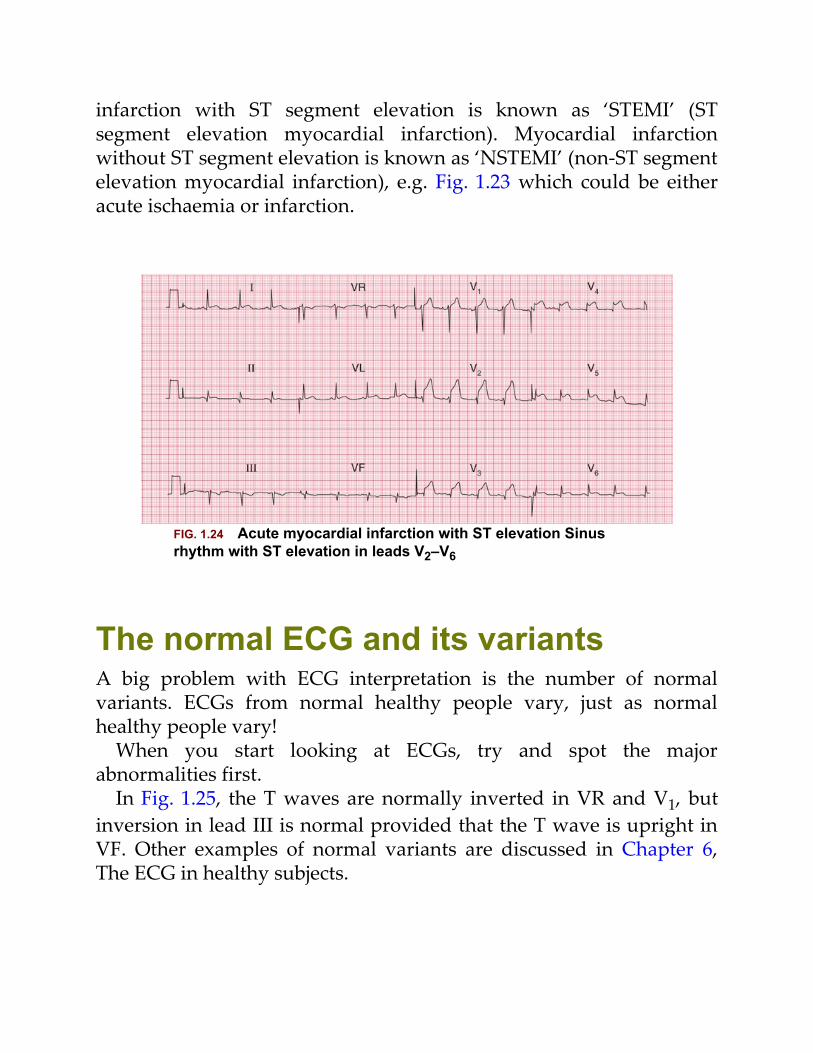
infarction with ST segment elevation is known as ‘STEMI’ (STsegment elevation myocardial infarction). Myocardial infarctionwithout ST segment elevation is known as ‘NSTEMI’ (non-ST segmentelevation myocardial infarction), e.g. Fig. 1.23 which could be eitheracute ischaemia or infarction.
FIG. 1.24 Acute myocardial infarction with ST elevation Sinusrhythm with ST elevation in leads V2–V6
The normal ECG and its variantsA big problem with ECG interpretation is the number of normalvariants. ECGs from normal healthy people vary, just as normalhealthy people vary!
When you start looking at ECGs, try and spot the majorabnormalities first.
In Fig. 1.25, the T waves are normally inverted in VR and V1, butinversion in lead III is normal provided that the T wave is upright inVF. Other examples of normal variants are discussed in Chapter 6,The ECG in healthy subjects.
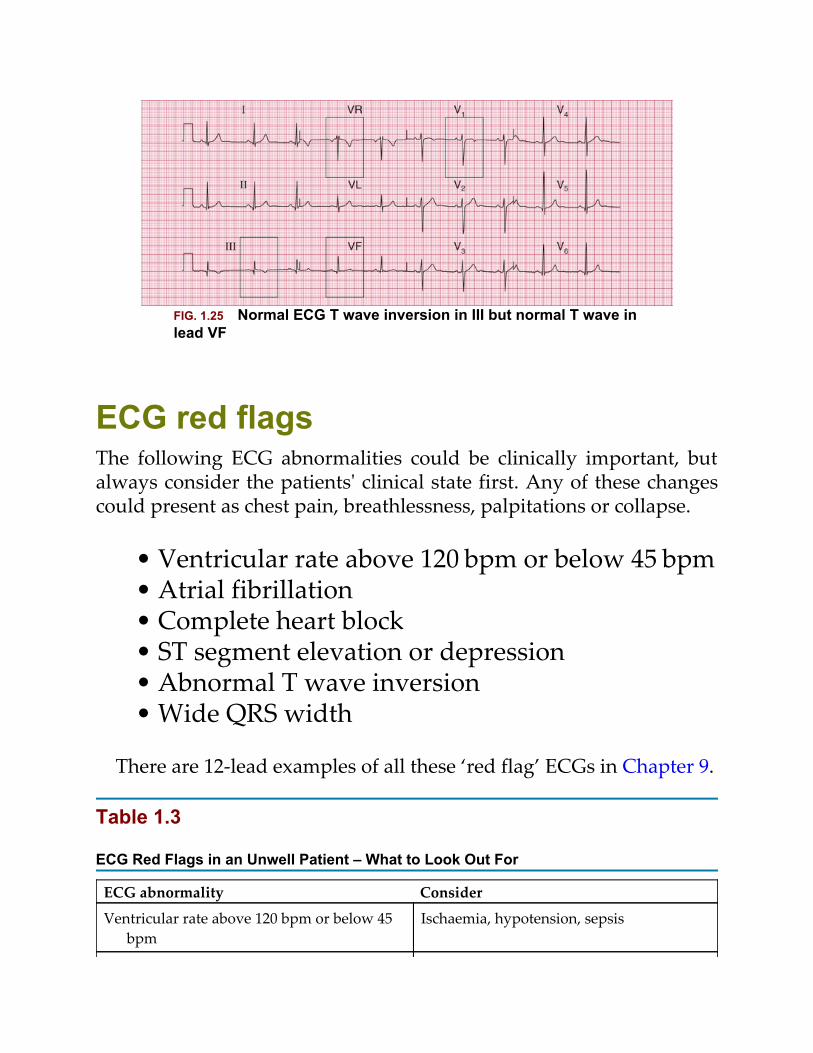
FIG. 1.25 Normal ECG T wave inversion in III but normal T wave inlead VF
ECG red flagsThe following ECG abnormalities could be clinically important, butalways consider the patients' clinical state first. Any of these changescould present as chest pain, breathlessness, palpitations or collapse.
• Ventricular rate above 120 bpm or below 45 bpm• Atrial fibrillation• Complete heart block• ST segment elevation or depression• Abnormal T wave inversion• Wide QRS width
There are 12-lead examples of all these ‘red flag’ ECGs in Chapter 9.
Table 1.3
ECG Red Flags in an Unwell Patient – What to Look Out For
ECG abnormality Consider
Ventricular rate above 120 bpm or below 45bpm
Ischaemia, hypotension, sepsis
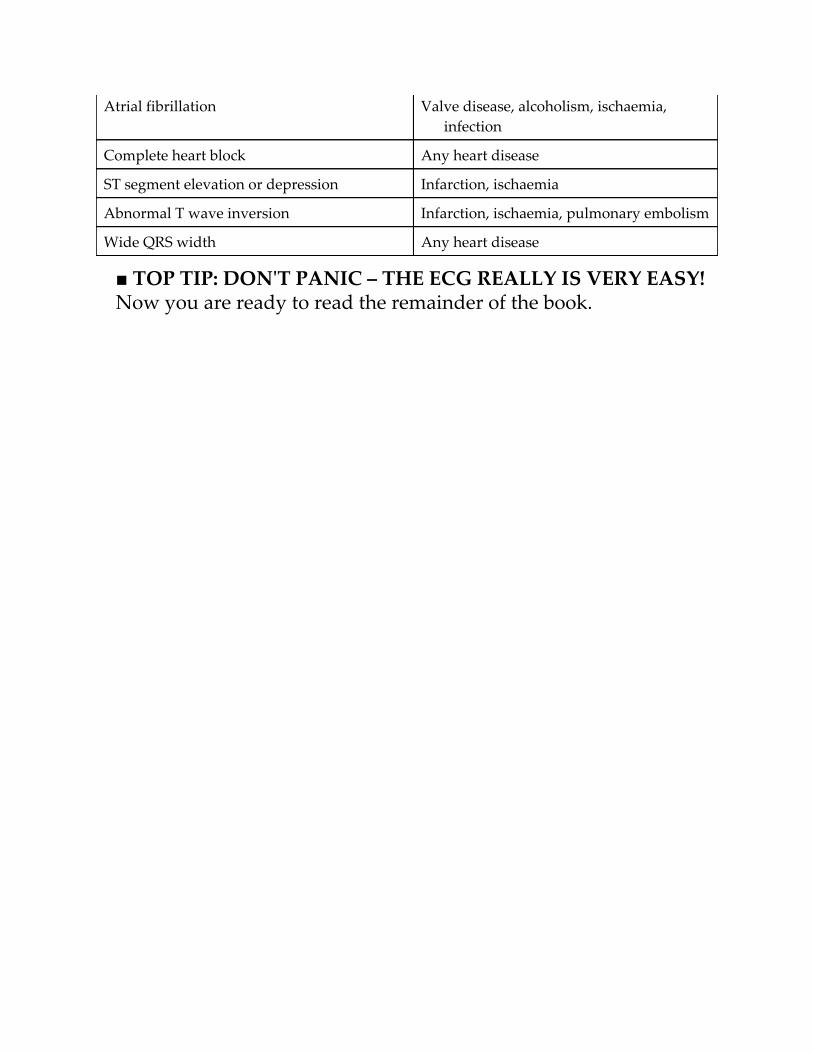
Atrial fibrillation Valve disease, alcoholism, ischaemia,infection
Complete heart block Any heart disease
ST segment elevation or depression Infarction, ischaemia
Abnormal T wave inversion Infarction, ischaemia, pulmonary embolism
Wide QRS width Any heart disease
■ TOP TIP: DON'T PANIC – THE ECG REALLY IS VERY EASY!Now you are ready to read the remainder of the book.
PART 2The basics: the fundamentals ofECG recording, reporting andinterpretation
OUTLINE
2 What the ECG is about3 Conduction and its problems4 The rhythm of the heart5 Abnormalities of P waves, QRS complexes and T waves
2
What the ECG is about
What to expect from the ECG 15The electricity of the heart 16
The wiring diagram of the heart 16The rhythm of the heart 16
The different parts of the ECG 16Times and speeds 17Calibration 20
The ECG – electrical pictures 20The 12-lead ECG 20
The shape of the QRS complex 23The QRS complex in the limb leads 23The cardiac axis 23Why worry about the cardiac axis? 26The QRS complex in the V leads 26Why worry about the transition point? 26
Making a recording – practical points 28How to report an ECG 39
‘ECG’ stands for electrocardiogram, or electrocardiograph. In somecountries, the abbreviation used is ‘EKG’. Remember:
• By the time you have finished this book, youshould be able to say and mean ‘The ECG is easyto understand’.• Most abnormalities of the ECG are amenable toreason.
What to Expect from the ECGClinical diagnosis depends mainly on a patient's history and, to alesser extent, on the physical examination. The ECG can provideevidence to support a diagnosis, and in some cases it is crucial forpatient management. It is, however, important to see the ECG as atool, and not as an end in itself.
The ECG is essential for the diagnosis, and therefore themanagement, of abnormal cardiac rhythms. It helps with thediagnosis of the cause of chest pain, and the proper use of earlyintervention in myocardial infarction depends upon it. It can helpwith the diagnosis of the cause of dizziness, syncope andbreathlessness.
With practice, interpreting the ECG is a matter of patternrecognition. However, the ECG can be analysed from first principles ifa few simple rules and basic facts are remembered. This chapter isabout these rules and facts.
The electricity of the heartThe contraction of any muscle is associated with electrical changescalled ‘depolarization’, and these changes can be detected byelectrodes attached to the surface of the body. Since all muscularcontraction will be detected, the electrical changes associated withcontraction of the heart muscle will only be clear if the patient is fullyrelaxed and no skeletal muscles are contracting.
Although the heart has four chambers, from the electrical point of
view it can be thought of as having only two, because the two atriacontract together, and then the two ventricles contract together.
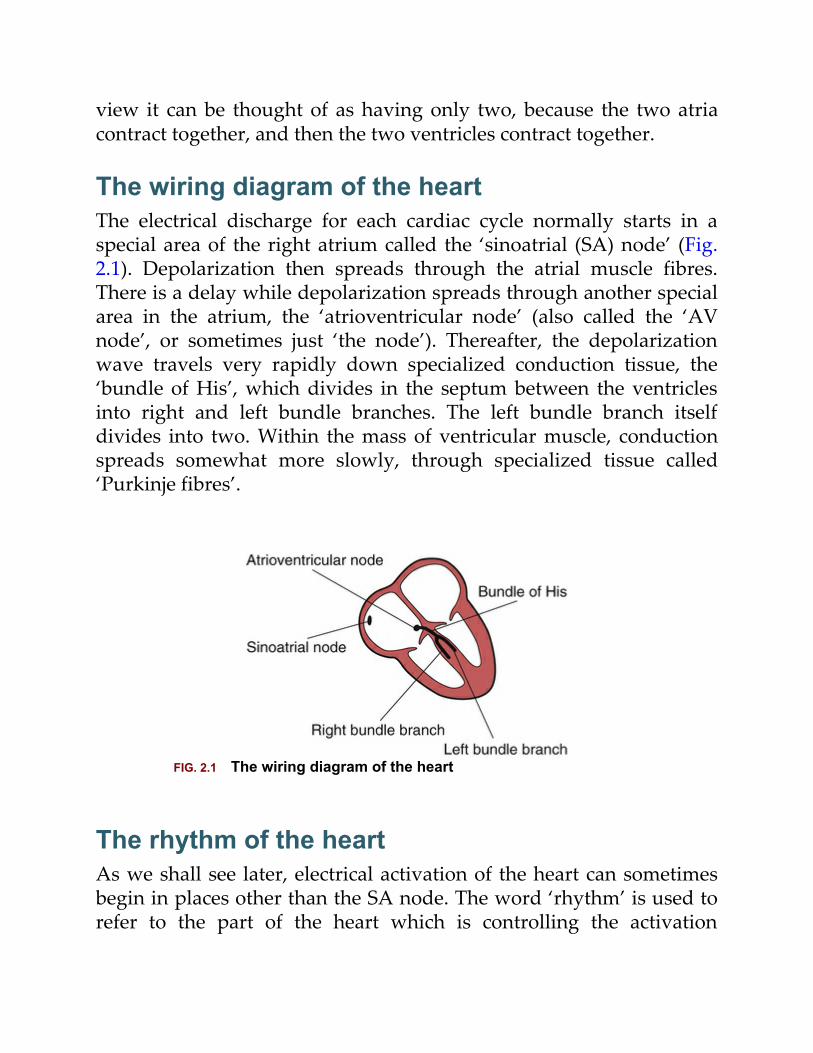
The wiring diagram of the heartThe electrical discharge for each cardiac cycle normally starts in aspecial area of the right atrium called the ‘sinoatrial (SA) node’ (Fig.2.1). Depolarization then spreads through the atrial muscle fibres.There is a delay while depolarization spreads through another specialarea in the atrium, the ‘atrioventricular node’ (also called the ‘AVnode’, or sometimes just ‘the node’). Thereafter, the depolarizationwave travels very rapidly down specialized conduction tissue, the‘bundle of His’, which divides in the septum between the ventriclesinto right and left bundle branches. The left bundle branch itselfdivides into two. Within the mass of ventricular muscle, conductionspreads somewhat more slowly, through specialized tissue called‘Purkinje fibres’.
FIG. 2.1 The wiring diagram of the heart
The rhythm of the heartAs we shall see later, electrical activation of the heart can sometimesbegin in places other than the SA node. The word ‘rhythm’ is used torefer to the part of the heart which is controlling the activation
sequence. The normal heart rhythm, with electrical activationbeginning in the SA node, is called ‘sinus rhythm’.
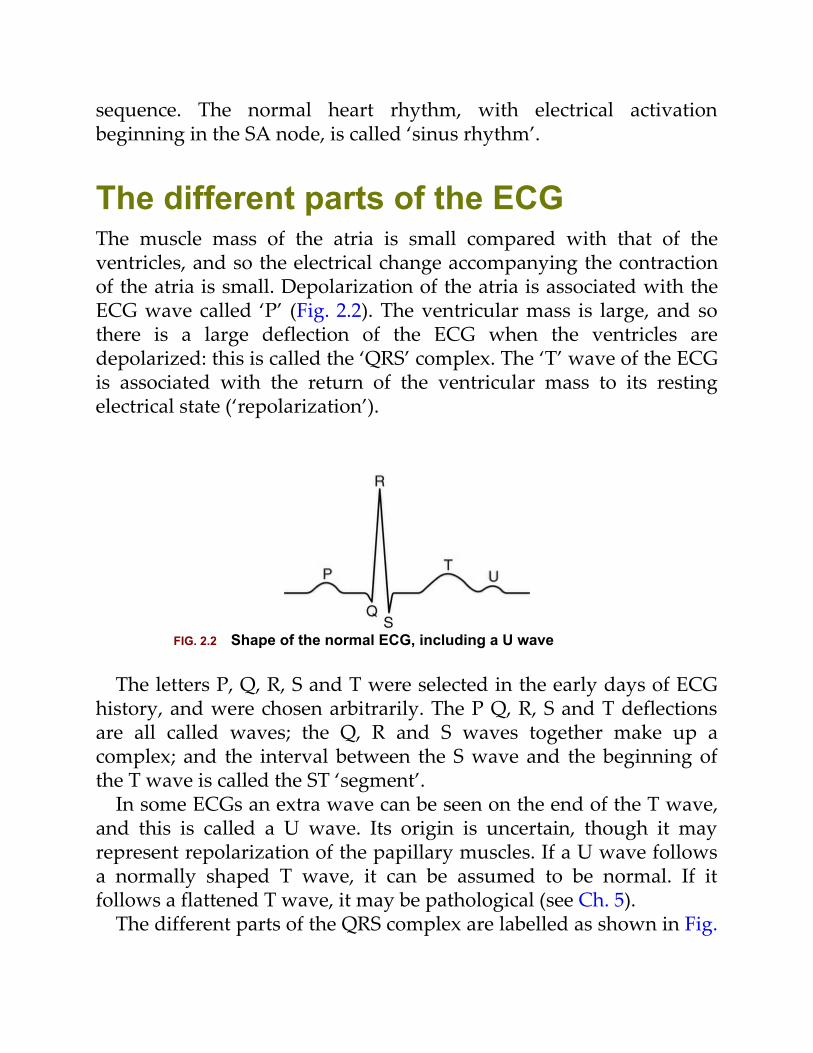
The different parts of the ECGThe muscle mass of the atria is small compared with that of theventricles, and so the electrical change accompanying the contractionof the atria is small. Depolarization of the atria is associated with theECG wave called ‘P’ (Fig. 2.2). The ventricular mass is large, and sothere is a large deflection of the ECG when the ventricles aredepolarized: this is called the ‘QRS’ complex. The ‘T’ wave of the ECGis associated with the return of the ventricular mass to its restingelectrical state (‘repolarization’).
FIG. 2.2 Shape of the normal ECG, including a U wave
The letters P, Q, R, S and T were selected in the early days of ECGhistory, and were chosen arbitrarily. The P Q, R, S and T deflectionsare all called waves; the Q, R and S waves together make up acomplex; and the interval between the S wave and the beginning ofthe T wave is called the ST ‘segment’.
In some ECGs an extra wave can be seen on the end of the T wave,and this is called a U wave. Its origin is uncertain, though it mayrepresent repolarization of the papillary muscles. If a U wave followsa normally shaped T wave, it can be assumed to be normal. If itfollows a flattened T wave, it may be pathological (see Ch. 5).
The different parts of the QRS complex are labelled as shown in Fig.
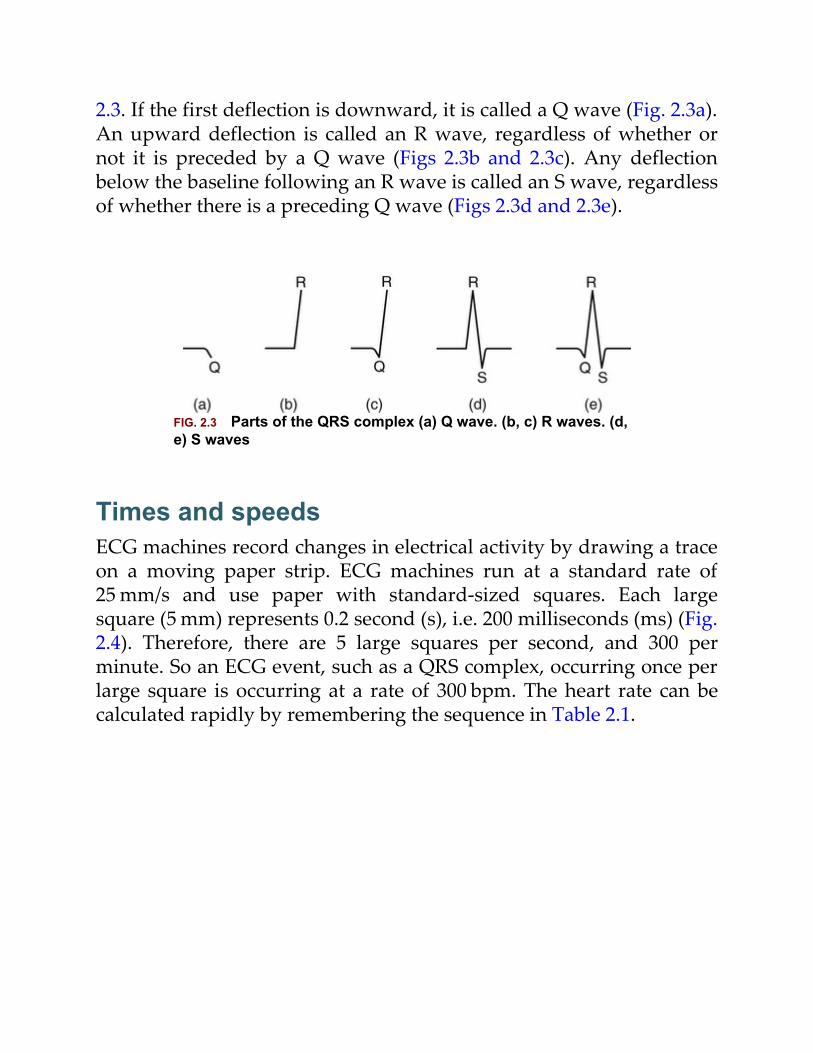
2.3. If the first deflection is downward, it is called a Q wave (Fig. 2.3a).An upward deflection is called an R wave, regardless of whether ornot it is preceded by a Q wave (Figs 2.3b and 2.3c). Any deflectionbelow the baseline following an R wave is called an S wave, regardlessof whether there is a preceding Q wave (Figs 2.3d and 2.3e).
FIG. 2.3 Parts of the QRS complex (a) Q wave. (b, c) R waves. (d,e) S waves
Times and speedsECG machines record changes in electrical activity by drawing a traceon a moving paper strip. ECG machines run at a standard rate of25 mm/s and use paper with standard-sized squares. Each largesquare (5 mm) represents 0.2 second (s), i.e. 200 milliseconds (ms) (Fig.2.4). Therefore, there are 5 large squares per second, and 300 perminute. So an ECG event, such as a QRS complex, occurring once perlarge square is occurring at a rate of 300 bpm. The heart rate can becalculated rapidly by remembering the sequence in Table 2.1.
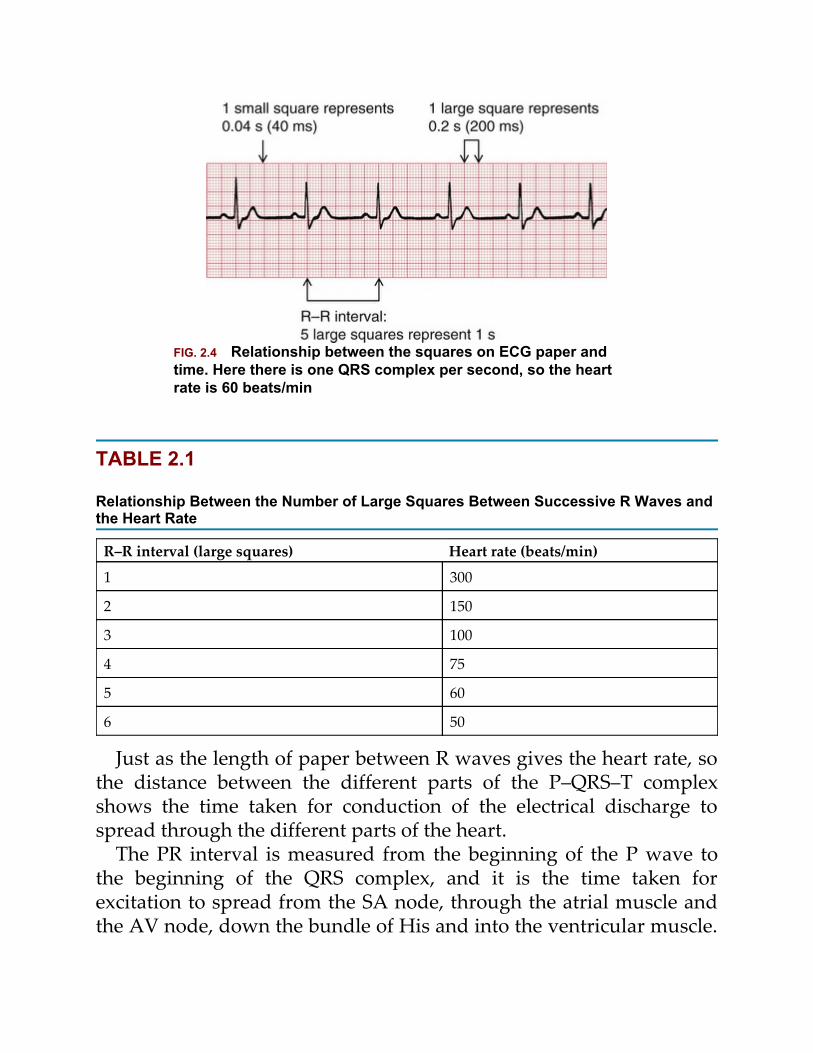
FIG. 2.4 Relationship between the squares on ECG paper andtime. Here there is one QRS complex per second, so the heartrate is 60 beats/min
TABLE 2.1
Relationship Between the Number of Large Squares Between Successive R Waves andthe Heart Rate
R–R interval (large squares) Heart rate (beats/min)
1 300
2 150
3 100
4 75
5 60
6 50
Just as the length of paper between R waves gives the heart rate, sothe distance between the different parts of the P–QRS–T complexshows the time taken for conduction of the electrical discharge tospread through the different parts of the heart.
The PR interval is measured from the beginning of the P wave tothe beginning of the QRS complex, and it is the time taken forexcitation to spread from the SA node, through the atrial muscle andthe AV node, down the bundle of His and into the ventricular muscle.
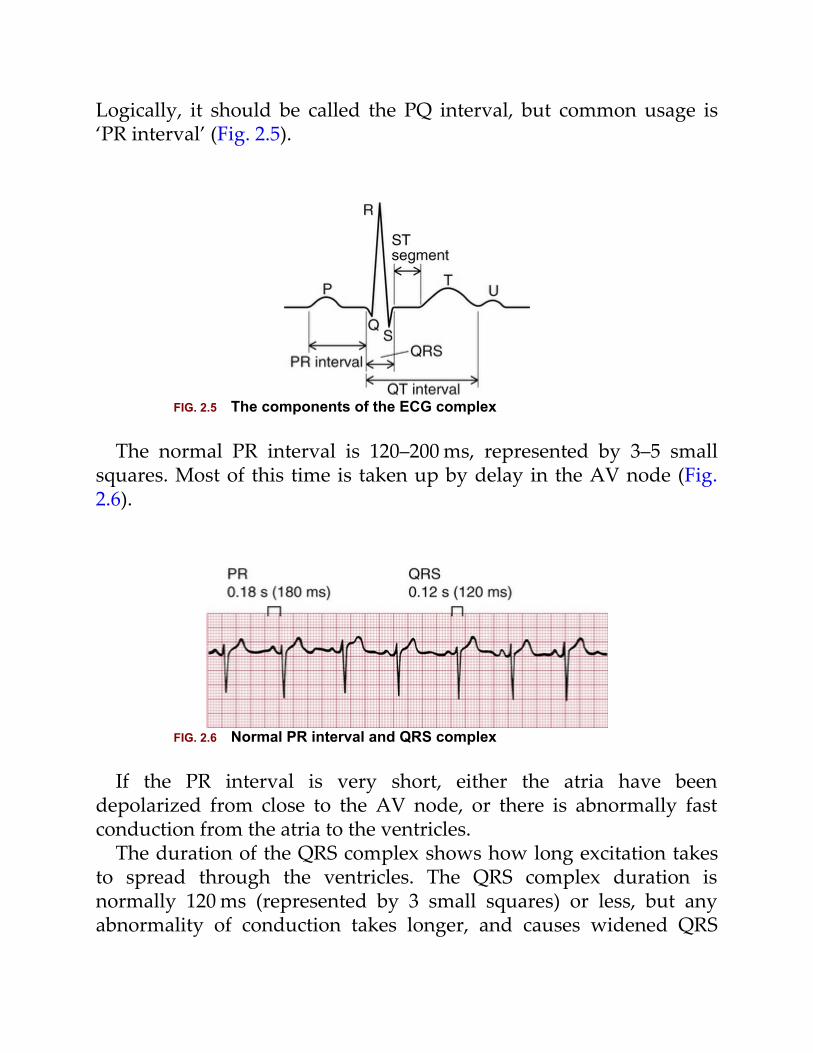
Logically, it should be called the PQ interval, but common usage is‘PR interval’ (Fig. 2.5).
FIG. 2.5 The components of the ECG complex
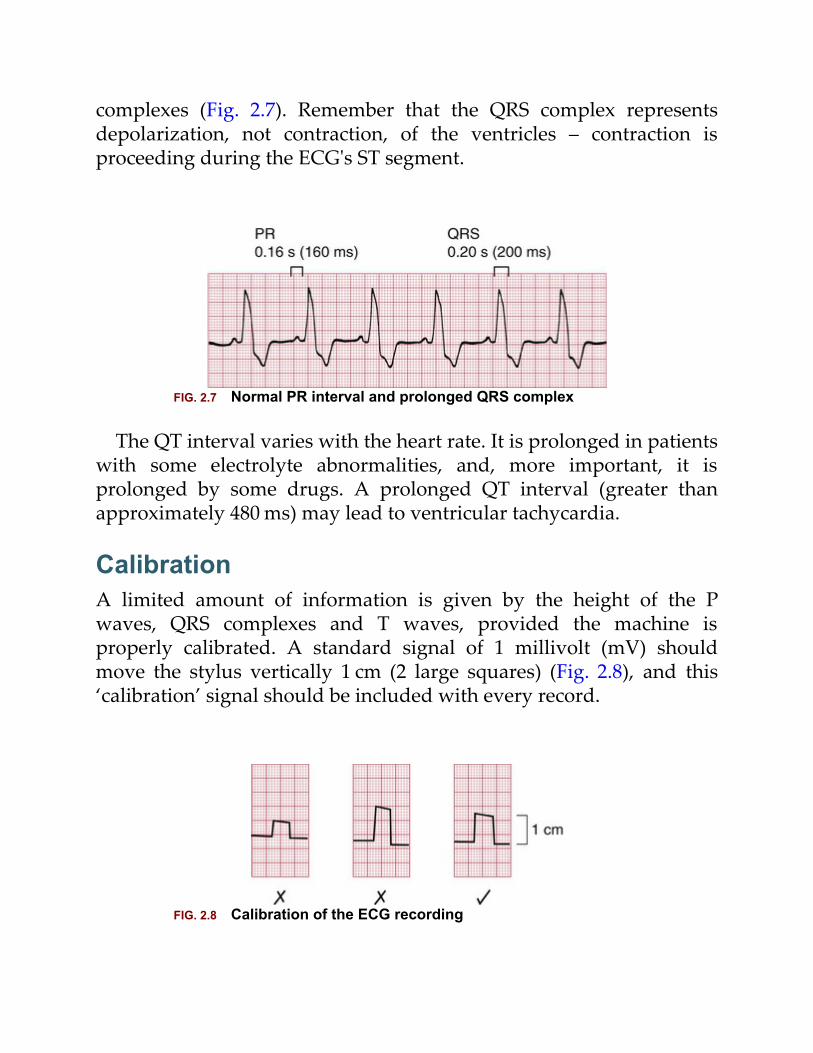
The normal PR interval is 120–200 ms, represented by 3–5 smallsquares. Most of this time is taken up by delay in the AV node (Fig.2.6).
FIG. 2.6 Normal PR interval and QRS complex
If the PR interval is very short, either the atria have beendepolarized from close to the AV node, or there is abnormally fastconduction from the atria to the ventricles.
The duration of the QRS complex shows how long excitation takesto spread through the ventricles. The QRS complex duration isnormally 120 ms (represented by 3 small squares) or less, but anyabnormality of conduction takes longer, and causes widened QRS
complexes (Fig. 2.7). Remember that the QRS complex representsdepolarization, not contraction, of the ventricles – contraction isproceeding during the ECG's ST segment.
FIG. 2.7 Normal PR interval and prolonged QRS complex
The QT interval varies with the heart rate. It is prolonged in patientswith some electrolyte abnormalities, and, more important, it isprolonged by some drugs. A prolonged QT interval (greater thanapproximately 480 ms) may lead to ventricular tachycardia.
CalibrationA limited amount of information is given by the height of the Pwaves, QRS complexes and T waves, provided the machine isproperly calibrated. A standard signal of 1 millivolt (mV) shouldmove the stylus vertically 1 cm (2 large squares) (Fig. 2.8), and this‘calibration’ signal should be included with every record.
FIG. 2.8 Calibration of the ECG recording
The ECG – electrical picturesThe word ‘lead’ sometimes causes confusion. Sometimes it is used tomean the pieces of wire that connect the patient to the ECG recorder.Properly, a lead is an electrical picture of the heart.
The electrical signal from the heart is detected at the surface of thebody through electrodes, which are joined to the ECG recorder bywires. One electrode is attached to each limb, and six to the front ofthe chest.
The ECG recorder compares the electrical activity detected in thedifferent electrodes, and the electrical picture so obtained is called a‘lead’. The different comparisons ‘look at’ the heart from differentdirections. For example, when the recorder is set to ‘lead I’, it iscomparing the electrical events detected by the electrodes attached tothe right and left arms. Each lead gives a different view of theelectrical activity of the heart, and so a different ECG pattern. Strictly,each ECG pattern should be called ‘lead…’, but often the word ‘lead’is omitted.
The ECG is made up of 12 characteristic views of the heart, sixobtained from the ‘limb’ leads (I, II, III, VR, VL, VF) and six from the‘chest’ leads (V1–V6). It is not necessary to remember how the leads (orviews of the heart) are derived by the recorder, but for those who liketo know how it works, see Table 2.2. The electrode attached to theright leg is used as an earth, and does not contribute to any lead.
TABLE 2.2
ECG Leads
Lead Comparison of electrical activity
I LA and RA
II LL and RA
III LL and LA
VR RA and average of (LA + LL)
VL LA and average of (RA + LL)
VF LL and average of (LA + RA)
V1 V1 and average of (LA + RA + LL)
V2 V2 and average of (LA + RA + LL)
V3 V3 and average of (LA + RA + LL)
V4 V4 and average of (LA + RA + LL)
V5 V5 and average of (LA + RA + LL)
V6 V6 and average of (LA + RA + LL)
Key: LA, left arm; RA, right arm; LL, left leg.
The 12-lead ECGECG interpretation is easy if you remember the directions from whichthe various leads look at the heart. The six ‘standard’ leads, which arerecorded from the electrodes attached to the limbs, can be thought ofas looking at the heart in a vertical plane (i.e. from the sides or thefeet) (Fig. 2.9).
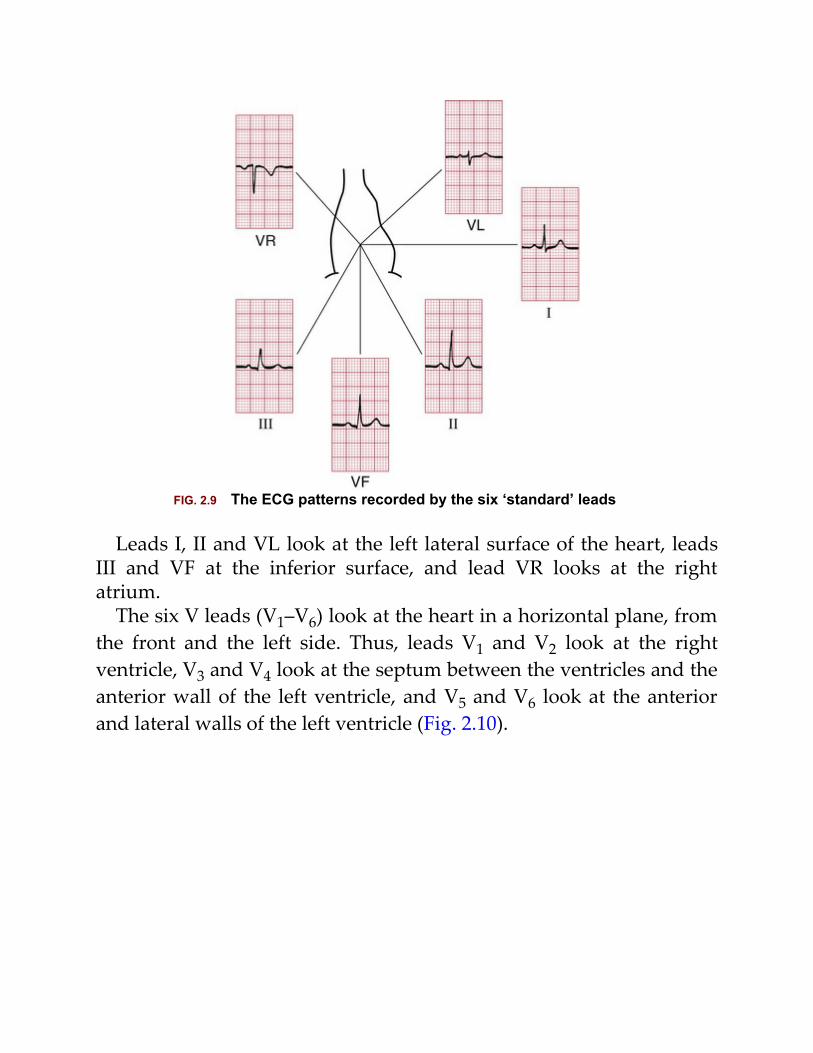
FIG. 2.9 The ECG patterns recorded by the six ‘standard’ leads
Leads I, II and VL look at the left lateral surface of the heart, leadsIII and VF at the inferior surface, and lead VR looks at the rightatrium.
The six V leads (V1–V6) look at the heart in a horizontal plane, fromthe front and the left side. Thus, leads V1 and V2 look at the rightventricle, V3 and V4 look at the septum between the ventricles and theanterior wall of the left ventricle, and V5 and V6 look at the anteriorand lateral walls of the left ventricle (Fig. 2.10).
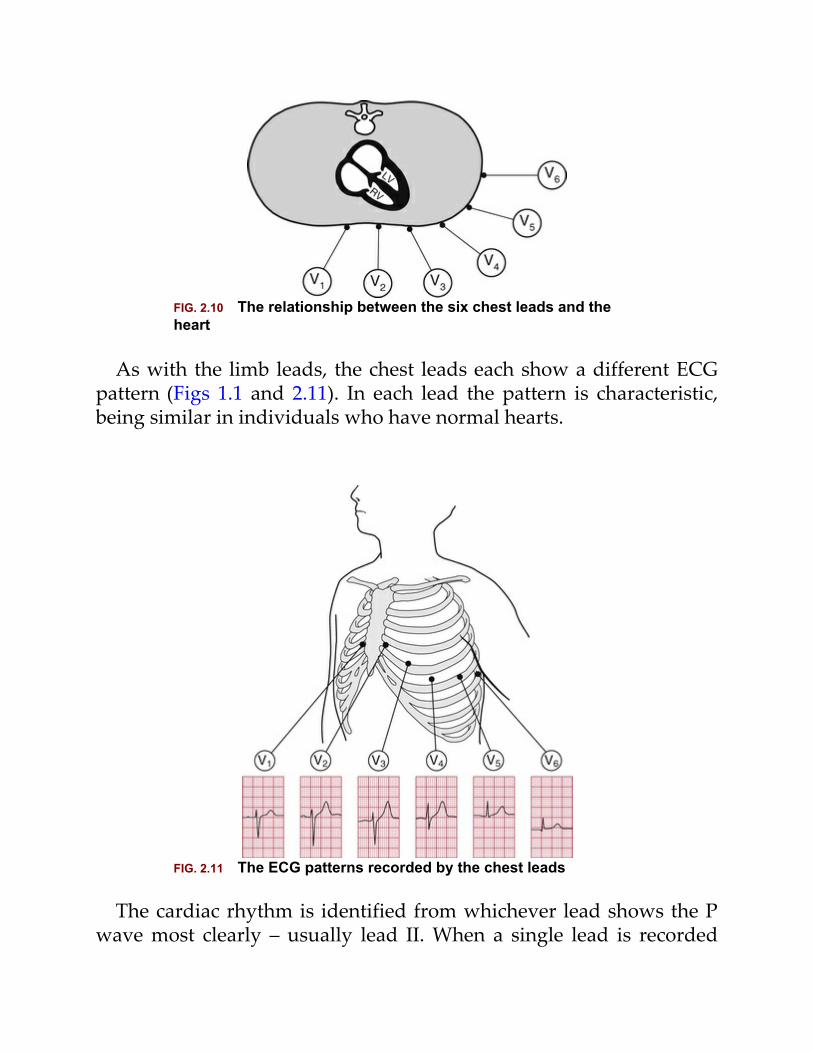
FIG. 2.10 The relationship between the six chest leads and theheart
As with the limb leads, the chest leads each show a different ECGpattern (Figs 1.1 and 2.11). In each lead the pattern is characteristic,being similar in individuals who have normal hearts.
FIG. 2.11 The ECG patterns recorded by the chest leads
The cardiac rhythm is identified from whichever lead shows the Pwave most clearly – usually lead II. When a single lead is recorded

simply to show the rhythm, it is called a ‘rhythm strip’, but it isimportant not to make any diagnosis from a single lead, other thanidentifying the cardiac rhythm.
The shape of the QRS complexWe now need to consider why the ECG has a characteristicappearance in each lead.
The QRS complex in the limb leadsThe ECG machine is arranged so that when a depolarization wavespreads towards a lead the stylus moves upwards, and when itspreads away from the lead the stylus moves downwards.
Depolarization spreads through the heart in many directions atonce, but the shape of the QRS complex shows the average directionin which the wave of depolarization is spreading through theventricles (Fig. 2.12).
FIG. 2.12 Depolarization and the shape of the QRS complexDepolarization (a) moving towards the lead, causing apredominantly upward QRS complex; (b) moving away from thelead, causing a predominantly downward QRS complex; and (c)at right angles to the lead, generating equal R and S waves
If the QRS complex is predominantly upward, or positive (i.e. the Rwave is greater than the S wave), the depolarization is movingtowards that lead (Fig. 2.12a). If predominantly downward, ornegative (the S wave is greater than the R wave), the depolarization is
moving away from that lead (Fig. 2.12b). When the depolarizationwave is moving at right angles to the lead, the R and S waves are ofequal size (Fig. 2.12c). Q waves, when present, have a specialsignificance, which we shall discuss later.
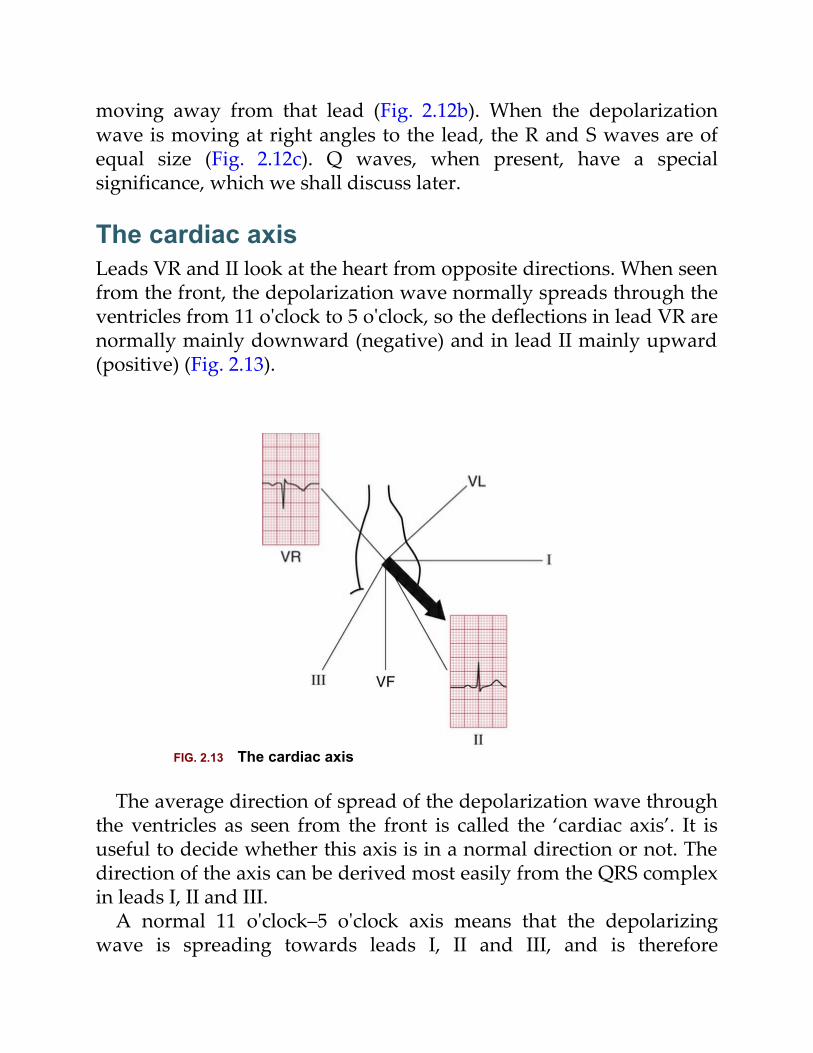
The cardiac axisLeads VR and II look at the heart from opposite directions. When seenfrom the front, the depolarization wave normally spreads through theventricles from 11 o'clock to 5 o'clock, so the deflections in lead VR arenormally mainly downward (negative) and in lead II mainly upward(positive) (Fig. 2.13).
FIG. 2.13 The cardiac axis
The average direction of spread of the depolarization wave throughthe ventricles as seen from the front is called the ‘cardiac axis’. It isuseful to decide whether this axis is in a normal direction or not. Thedirection of the axis can be derived most easily from the QRS complexin leads I, II and III.
A normal 11 o'clock–5 o'clock axis means that the depolarizingwave is spreading towards leads I, II and III, and is therefore
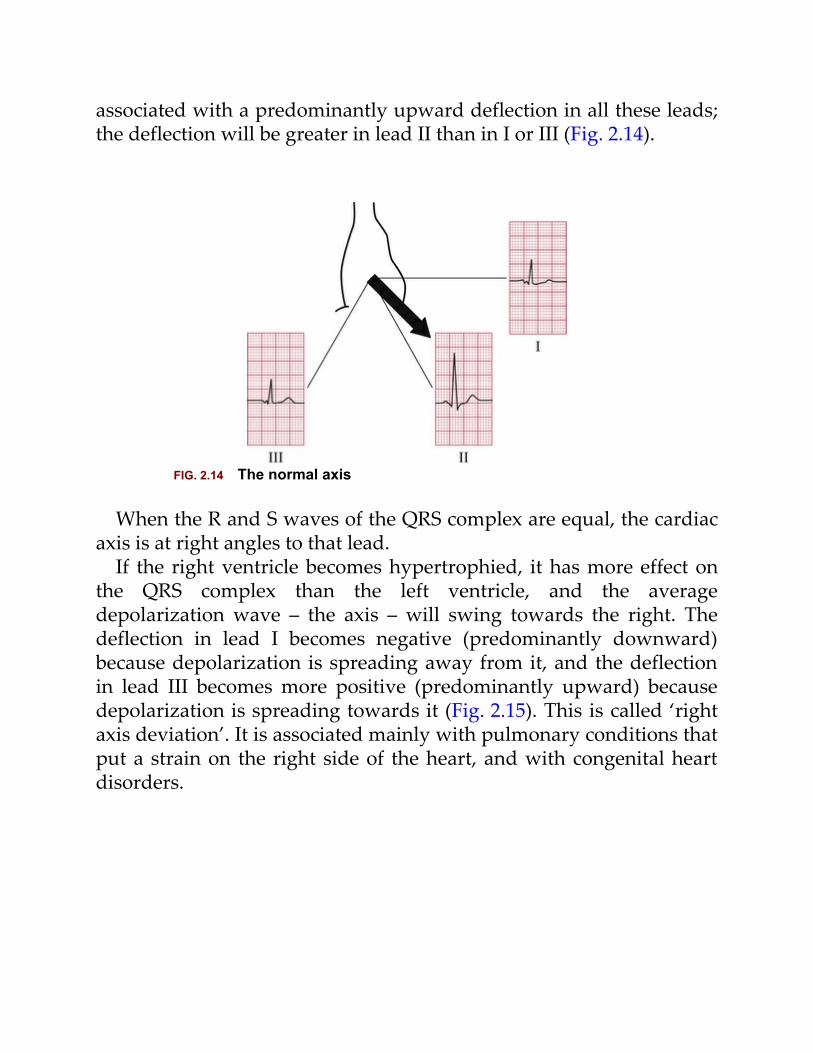
associated with a predominantly upward deflection in all these leads;the deflection will be greater in lead II than in I or III (Fig. 2.14).
FIG. 2.14 The normal axis
When the R and S waves of the QRS complex are equal, the cardiacaxis is at right angles to that lead.
If the right ventricle becomes hypertrophied, it has more effect onthe QRS complex than the left ventricle, and the averagedepolarization wave – the axis – will swing towards the right. Thedeflection in lead I becomes negative (predominantly downward)because depolarization is spreading away from it, and the deflectionin lead III becomes more positive (predominantly upward) becausedepolarization is spreading towards it (Fig. 2.15). This is called ‘rightaxis deviation’. It is associated mainly with pulmonary conditions thatput a strain on the right side of the heart, and with congenital heartdisorders.

FIG. 2.15 Right axis deviation
When the left ventricle becomes hypertrophied, it exerts moreinfluence on the QRS complex than the right ventricle. Hence, the axismay swing to the left, and the QRS complex becomes predominantlynegative in lead III (Fig. 2.16). ‘Left axis deviation’ is not significantuntil the QRS complex deflection is also predominantly negative inlead II. Although left axis deviation can be due to excess influence ofan enlarged left ventricle, in fact this axis change is usually due to aconduction defect rather than to increased bulk of the left ventricularmuscle (see Ch. 3).
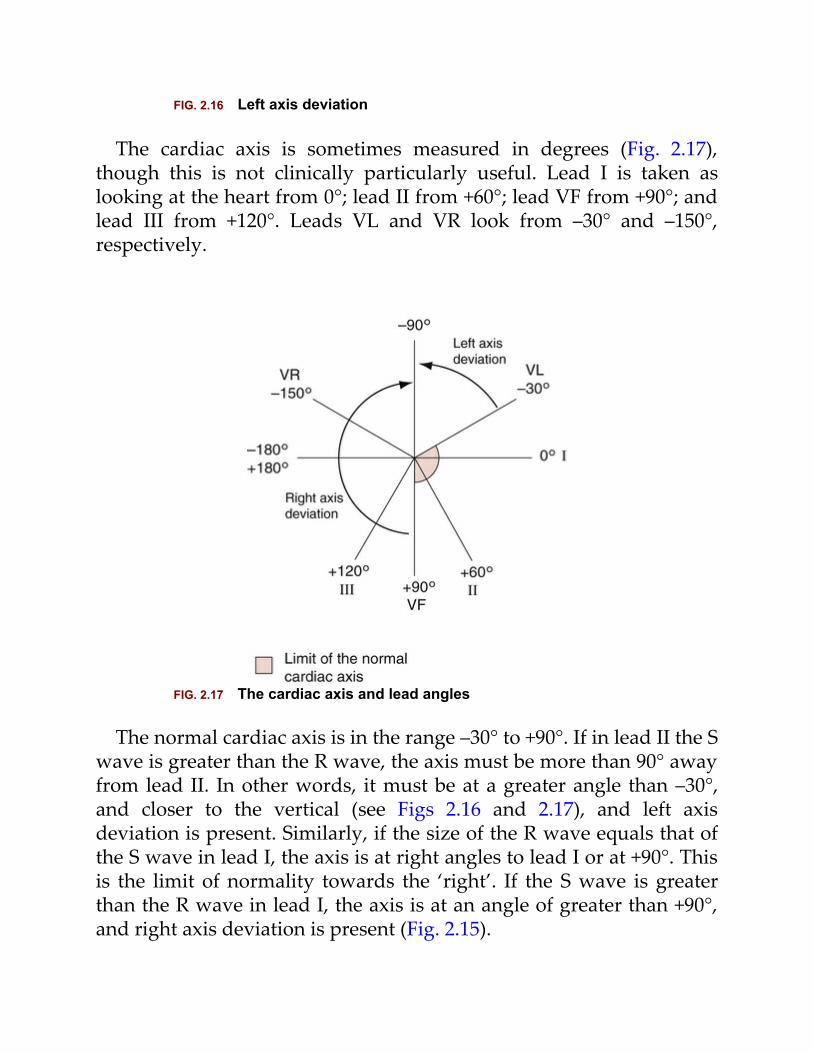
FIG. 2.16 Left axis deviation
The cardiac axis is sometimes measured in degrees (Fig. 2.17),though this is not clinically particularly useful. Lead I is taken aslooking at the heart from 0°; lead II from +60°; lead VF from +90°; andlead III from +120°. Leads VL and VR look from –30° and –150°,respectively.
FIG. 2.17 The cardiac axis and lead angles
The normal cardiac axis is in the range –30° to +90°. If in lead II the Swave is greater than the R wave, the axis must be more than 90° awayfrom lead II. In other words, it must be at a greater angle than –30°,and closer to the vertical (see Figs 2.16 and 2.17), and left axisdeviation is present. Similarly, if the size of the R wave equals that ofthe S wave in lead I, the axis is at right angles to lead I or at +90°. Thisis the limit of normality towards the ‘right’. If the S wave is greaterthan the R wave in lead I, the axis is at an angle of greater than +90°,and right axis deviation is present (Fig. 2.15).

Why worry about the cardiac axis?Right and left axis deviation in themselves are seldom significant –minor degrees occur in tall, thin individuals and in short, obeseindividuals, respectively. However, the presence of axis deviationshould alert you to look for other signs of right and left ventricularhypertrophy (see Ch. 5). A change in axis to the right may suggest apulmonary embolus, and a change to the left indicates a conductiondefect.
The QRS complex in the V leadsThe shape of the QRS complex in the chest (V) leads is determined bytwo things:
• The septum between the ventricles isdepolarized before the walls of the ventricles, andthe depolarization wave spreads across theseptum from left to right.• In the normal heart there is more muscle in thewall of the left ventricle than in that of the rightventricle, and so the left ventricle exerts moreinfluence on the ECG pattern than does the rightventricle.
Leads V1 and V2 look at the right ventricle; leads V3 and V4 look atthe septum; and leads V5 and V6 at the left ventricle (Fig. 2.10).
In a right ventricular lead the deflection is first upwards (R wave) asthe septum is depolarized. In a left ventricular lead the oppositepattern is seen: there is a small downward deflection (‘septal’ Q wave)(Fig. 2.18).
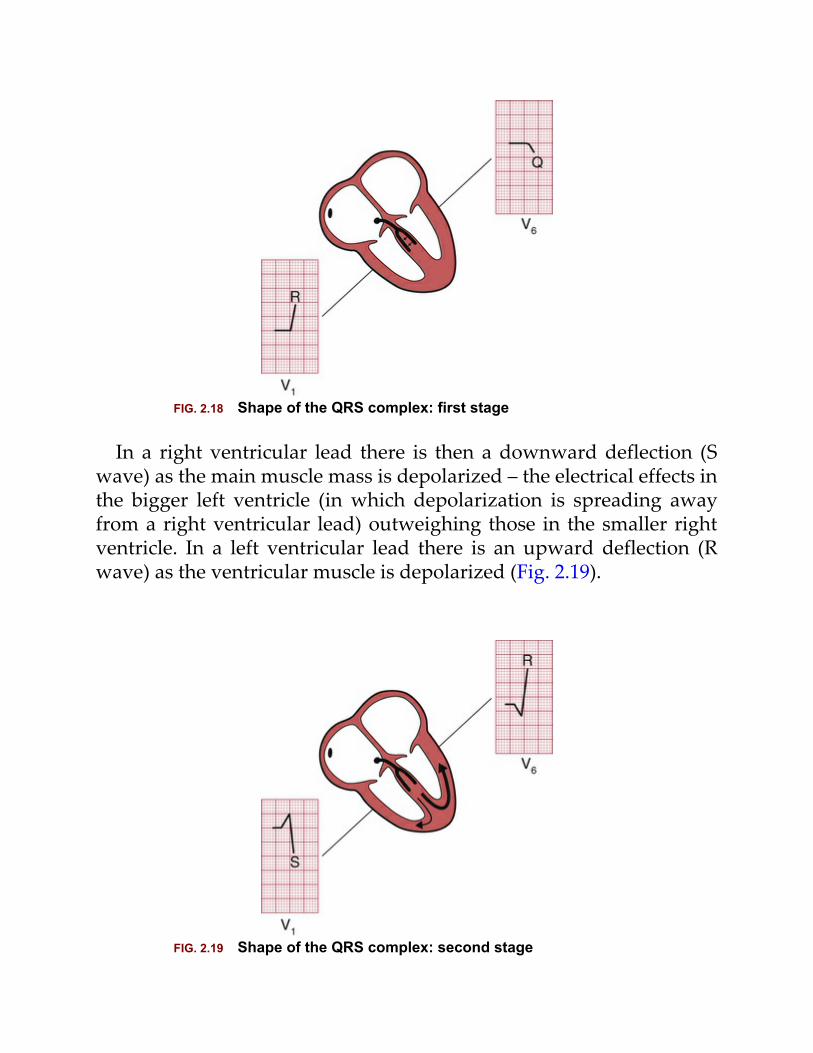
FIG. 2.18 Shape of the QRS complex: first stage
In a right ventricular lead there is then a downward deflection (Swave) as the main muscle mass is depolarized – the electrical effects inthe bigger left ventricle (in which depolarization is spreading awayfrom a right ventricular lead) outweighing those in the smaller rightventricle. In a left ventricular lead there is an upward deflection (Rwave) as the ventricular muscle is depolarized (Fig. 2.19).
FIG. 2.19 Shape of the QRS complex: second stage
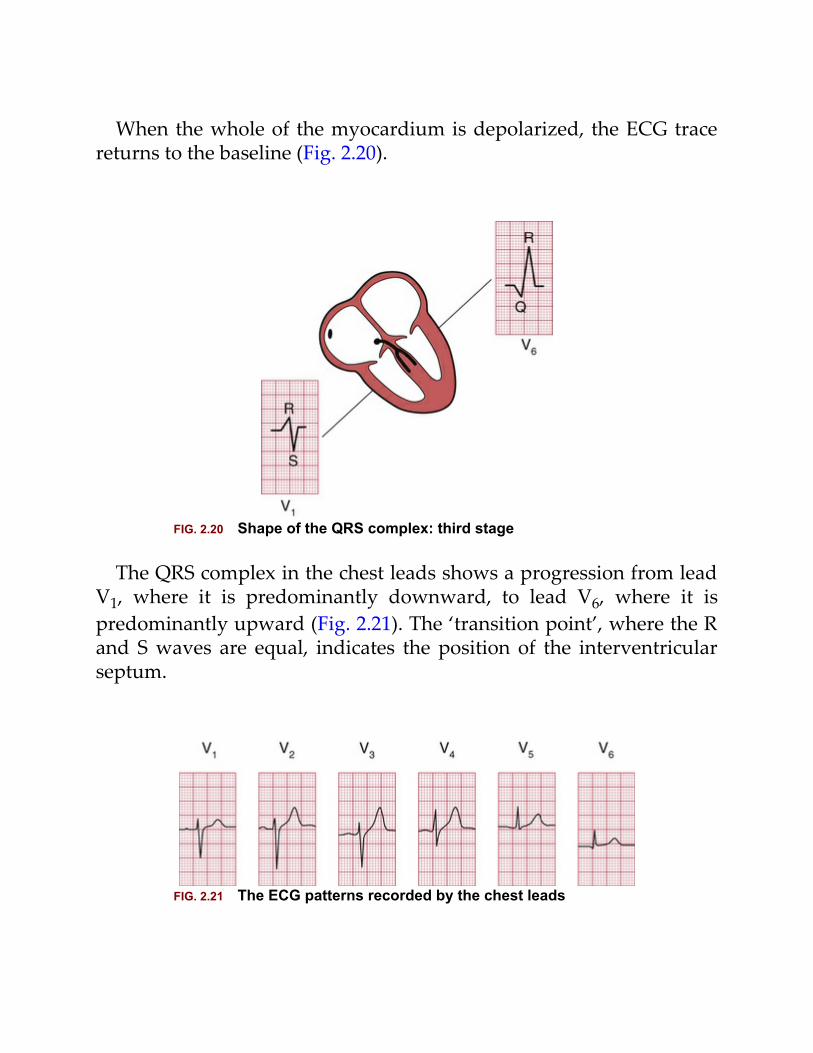
When the whole of the myocardium is depolarized, the ECG tracereturns to the baseline (Fig. 2.20).
FIG. 2.20 Shape of the QRS complex: third stage
The QRS complex in the chest leads shows a progression from leadV1, where it is predominantly downward, to lead V6, where it ispredominantly upward (Fig. 2.21). The ‘transition point’, where the Rand S waves are equal, indicates the position of the interventricularseptum.
FIG. 2.21 The ECG patterns recorded by the chest leads
Why worry about the transition point?If the right ventricle is enlarged, and occupies more of the precordiumthan is normal, the transition point will move from its normal positionof leads V3/V4 to leads V4/V5 or sometimes leads V5/V6. Seen frombelow, the heart can be thought of as having rotated in a clockwisedirection. ‘Clockwise rotation’ in the ECG is characteristic of chroniclung disease.
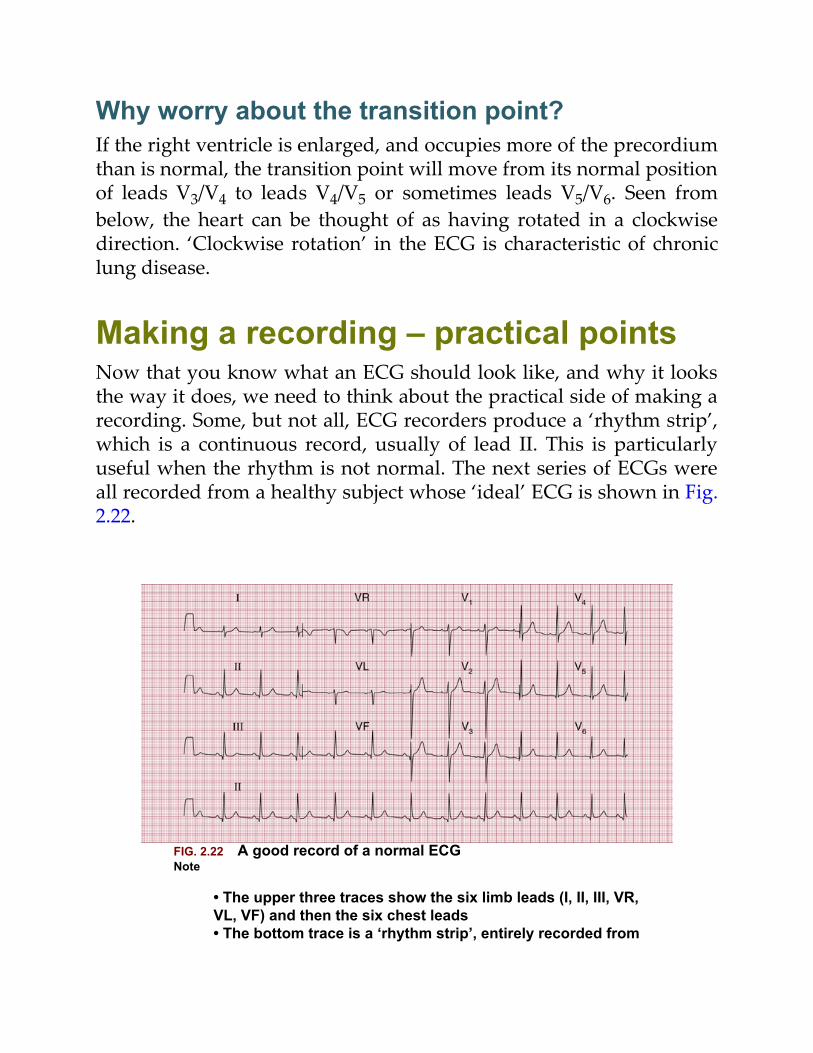
Making a recording – practical pointsNow that you know what an ECG should look like, and why it looksthe way it does, we need to think about the practical side of making arecording. Some, but not all, ECG recorders produce a ‘rhythm strip’,which is a continuous record, usually of lead II. This is particularlyuseful when the rhythm is not normal. The next series of ECGs wereall recorded from a healthy subject whose ‘ideal’ ECG is shown in Fig.2.22.
FIG. 2.22 A good record of a normal ECGNote
• The upper three traces show the six limb leads (I, II, III, VR,VL, VF) and then the six chest leads• The bottom trace is a ‘rhythm strip’, entirely recorded from
lead II (i.e. no lead changes)• The trace is clear, with P waves, QRS complexes and Twaves visible in all leads
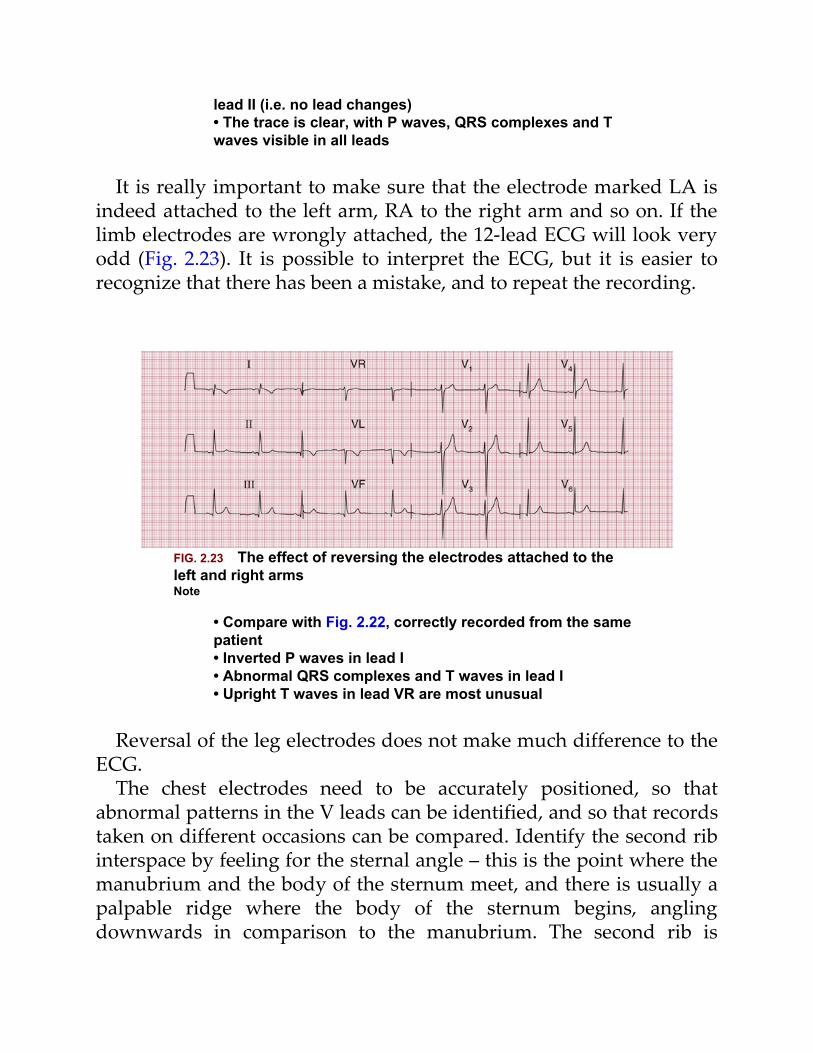
It is really important to make sure that the electrode marked LA isindeed attached to the left arm, RA to the right arm and so on. If thelimb electrodes are wrongly attached, the 12-lead ECG will look veryodd (Fig. 2.23). It is possible to interpret the ECG, but it is easier torecognize that there has been a mistake, and to repeat the recording.
FIG. 2.23 The effect of reversing the electrodes attached to theleft and right armsNote
• Compare with Fig. 2.22, correctly recorded from the samepatient• Inverted P waves in lead I• Abnormal QRS complexes and T waves in lead I• Upright T waves in lead VR are most unusual
Reversal of the leg electrodes does not make much difference to theECG.
The chest electrodes need to be accurately positioned, so thatabnormal patterns in the V leads can be identified, and so that recordstaken on different occasions can be compared. Identify the second ribinterspace by feeling for the sternal angle – this is the point where themanubrium and the body of the sternum meet, and there is usually apalpable ridge where the body of the sternum begins, anglingdownwards in comparison to the manubrium. The second rib is
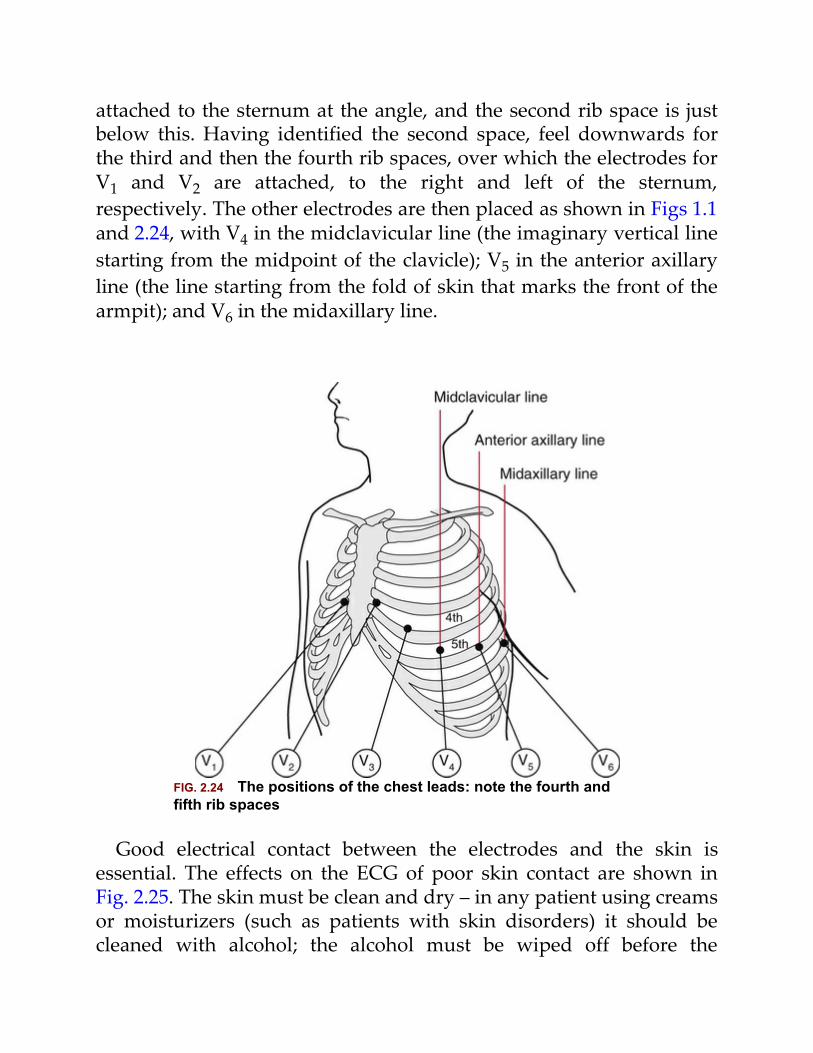
attached to the sternum at the angle, and the second rib space is justbelow this. Having identified the second space, feel downwards forthe third and then the fourth rib spaces, over which the electrodes forV1 and V2 are attached, to the right and left of the sternum,respectively. The other electrodes are then placed as shown in Figs 1.1and 2.24, with V4 in the midclavicular line (the imaginary vertical linestarting from the midpoint of the clavicle); V5 in the anterior axillaryline (the line starting from the fold of skin that marks the front of thearmpit); and V6 in the midaxillary line.
FIG. 2.24 The positions of the chest leads: note the fourth andfifth rib spaces
Good electrical contact between the electrodes and the skin isessential. The effects on the ECG of poor skin contact are shown inFig. 2.25. The skin must be clean and dry – in any patient using creamsor moisturizers (such as patients with skin disorders) it should becleaned with alcohol; the alcohol must be wiped off before the
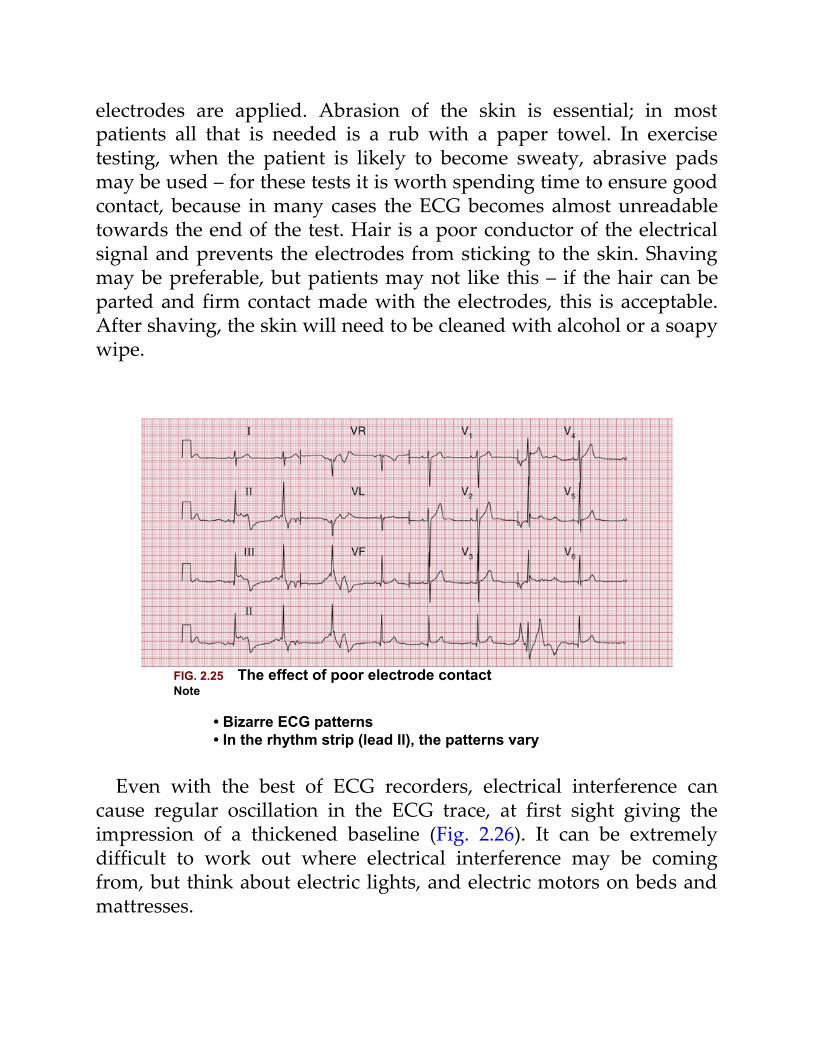
electrodes are applied. Abrasion of the skin is essential; in mostpatients all that is needed is a rub with a paper towel. In exercisetesting, when the patient is likely to become sweaty, abrasive padsmay be used – for these tests it is worth spending time to ensure goodcontact, because in many cases the ECG becomes almost unreadabletowards the end of the test. Hair is a poor conductor of the electricalsignal and prevents the electrodes from sticking to the skin. Shavingmay be preferable, but patients may not like this – if the hair can beparted and firm contact made with the electrodes, this is acceptable.After shaving, the skin will need to be cleaned with alcohol or a soapywipe.
FIG. 2.25 The effect of poor electrode contactNote
• Bizarre ECG patterns• In the rhythm strip (lead II), the patterns vary
Even with the best of ECG recorders, electrical interference cancause regular oscillation in the ECG trace, at first sight giving theimpression of a thickened baseline (Fig. 2.26). It can be extremelydifficult to work out where electrical interference may be comingfrom, but think about electric lights, and electric motors on beds andmattresses.
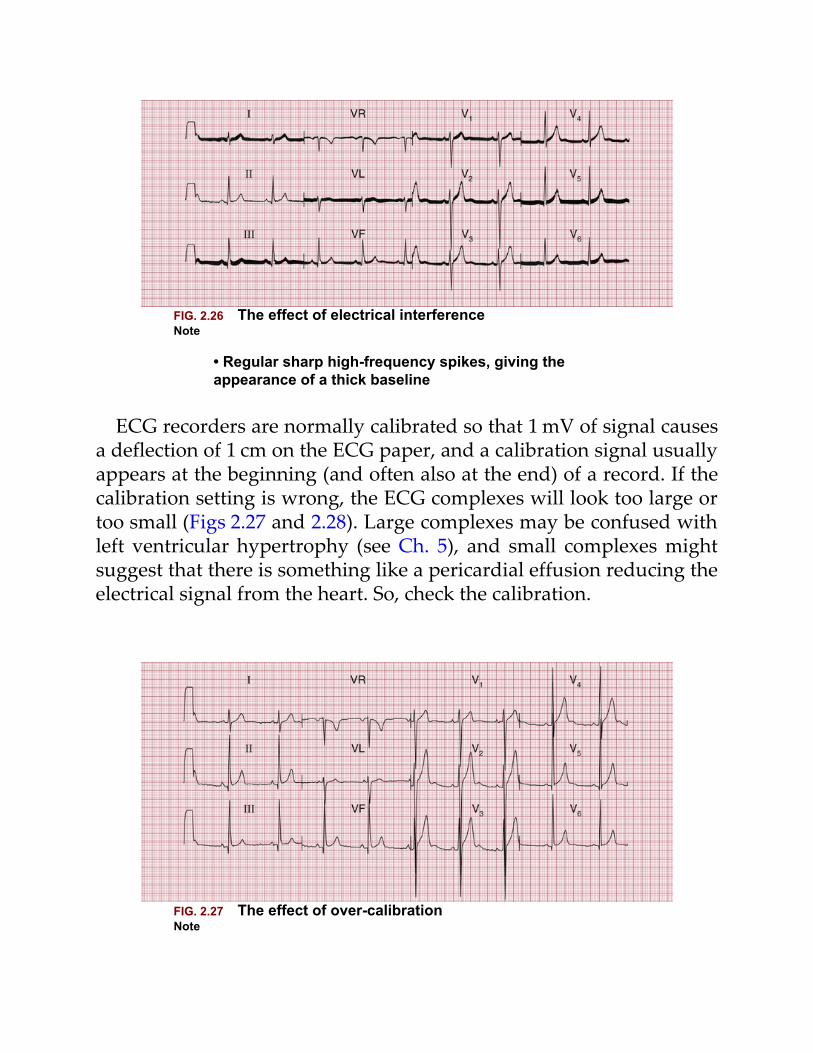
FIG. 2.26 The effect of electrical interferenceNote
• Regular sharp high-frequency spikes, giving theappearance of a thick baseline
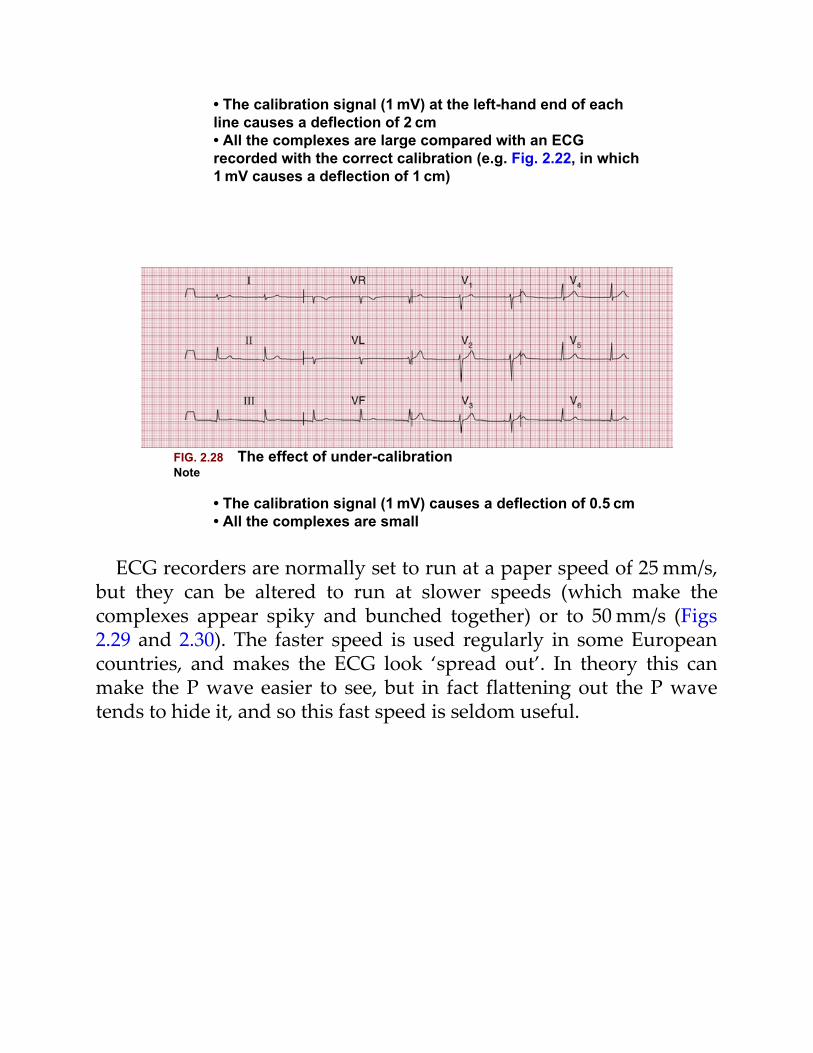
ECG recorders are normally calibrated so that 1 mV of signal causesa deflection of 1 cm on the ECG paper, and a calibration signal usuallyappears at the beginning (and often also at the end) of a record. If thecalibration setting is wrong, the ECG complexes will look too large ortoo small (Figs 2.27 and 2.28). Large complexes may be confused withleft ventricular hypertrophy (see Ch. 5), and small complexes mightsuggest that there is something like a pericardial effusion reducing theelectrical signal from the heart. So, check the calibration.
FIG. 2.27 The effect of over-calibrationNote
• The calibration signal (1 mV) at the left-hand end of eachline causes a deflection of 2 cm• All the complexes are large compared with an ECGrecorded with the correct calibration (e.g. Fig. 2.22, in which1 mV causes a deflection of 1 cm)
FIG. 2.28 The effect of under-calibrationNote
• The calibration signal (1 mV) causes a deflection of 0.5 cm• All the complexes are small
ECG recorders are normally set to run at a paper speed of 25 mm/s,but they can be altered to run at slower speeds (which make thecomplexes appear spiky and bunched together) or to 50 mm/s (Figs2.29 and 2.30). The faster speed is used regularly in some Europeancountries, and makes the ECG look ‘spread out’. In theory this canmake the P wave easier to see, but in fact flattening out the P wavetends to hide it, and so this fast speed is seldom useful.
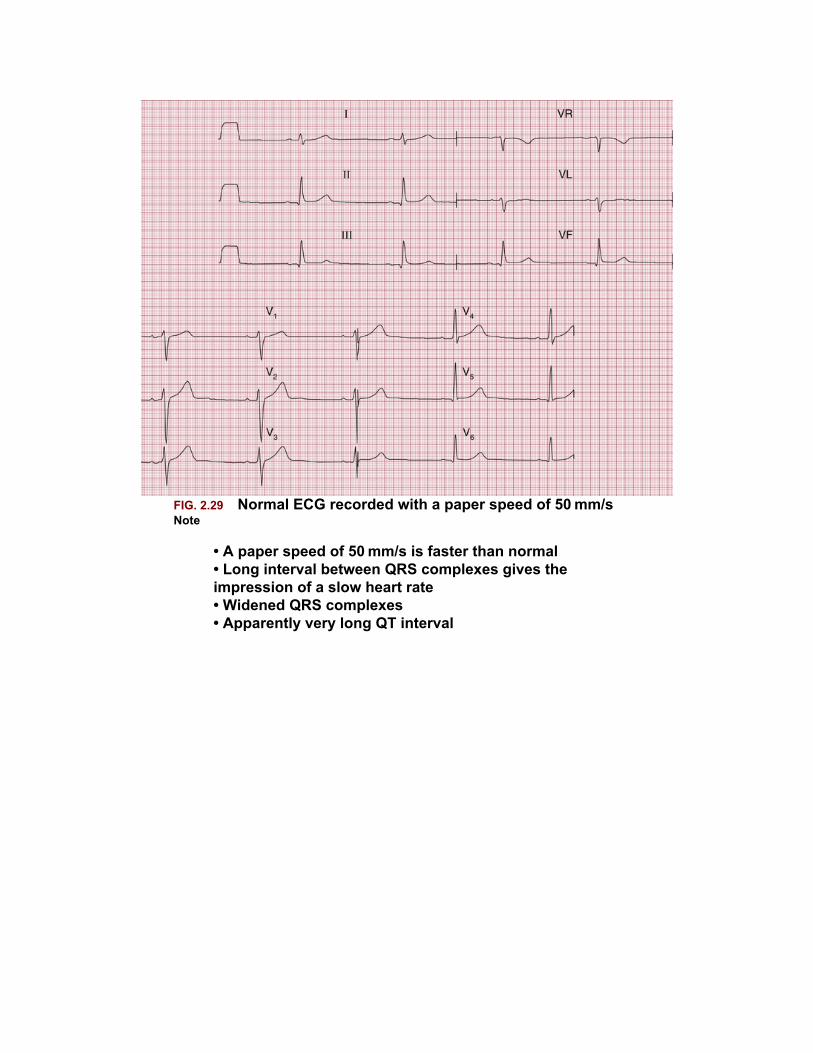
FIG. 2.29 Normal ECG recorded with a paper speed of 50 mm/sNote
• A paper speed of 50 mm/s is faster than normal• Long interval between QRS complexes gives theimpression of a slow heart rate• Widened QRS complexes• Apparently very long QT interval
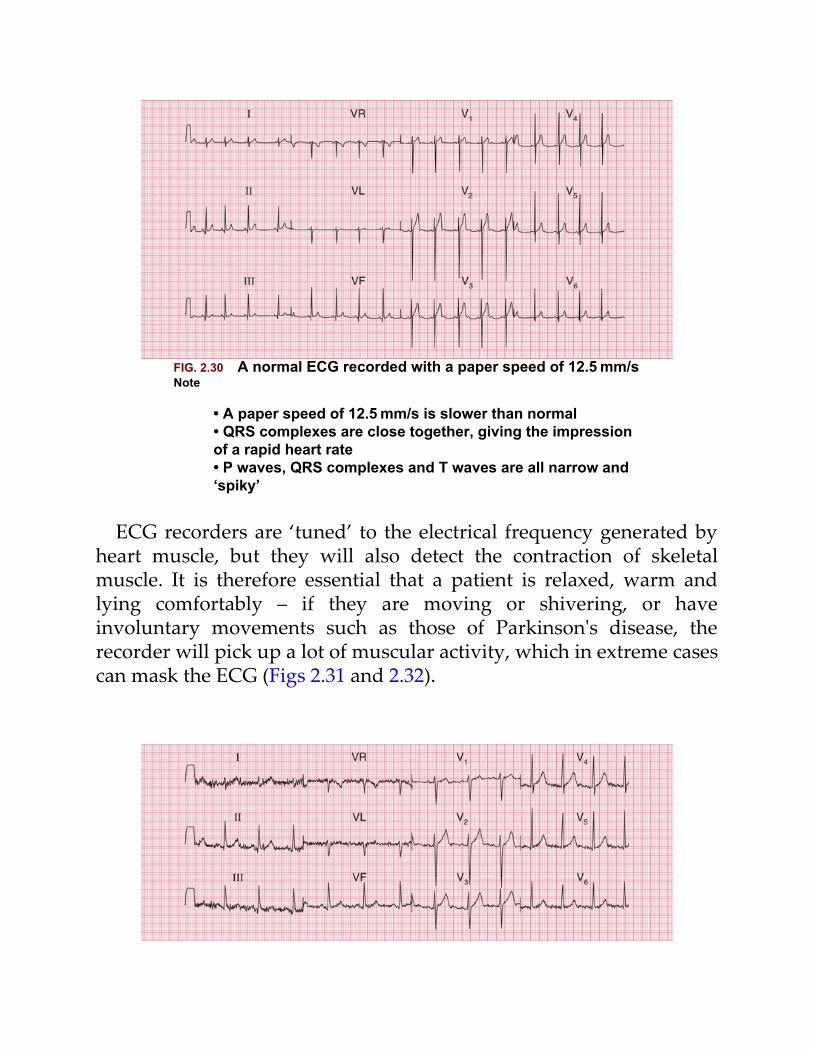
FIG. 2.30 A normal ECG recorded with a paper speed of 12.5 mm/sNote
• A paper speed of 12.5 mm/s is slower than normal• QRS complexes are close together, giving the impressionof a rapid heart rate• P waves, QRS complexes and T waves are all narrow and‘spiky’
ECG recorders are ‘tuned’ to the electrical frequency generated byheart muscle, but they will also detect the contraction of skeletalmuscle. It is therefore essential that a patient is relaxed, warm andlying comfortably – if they are moving or shivering, or haveinvoluntary movements such as those of Parkinson's disease, therecorder will pick up a lot of muscular activity, which in extreme casescan mask the ECG (Figs 2.31 and 2.32).
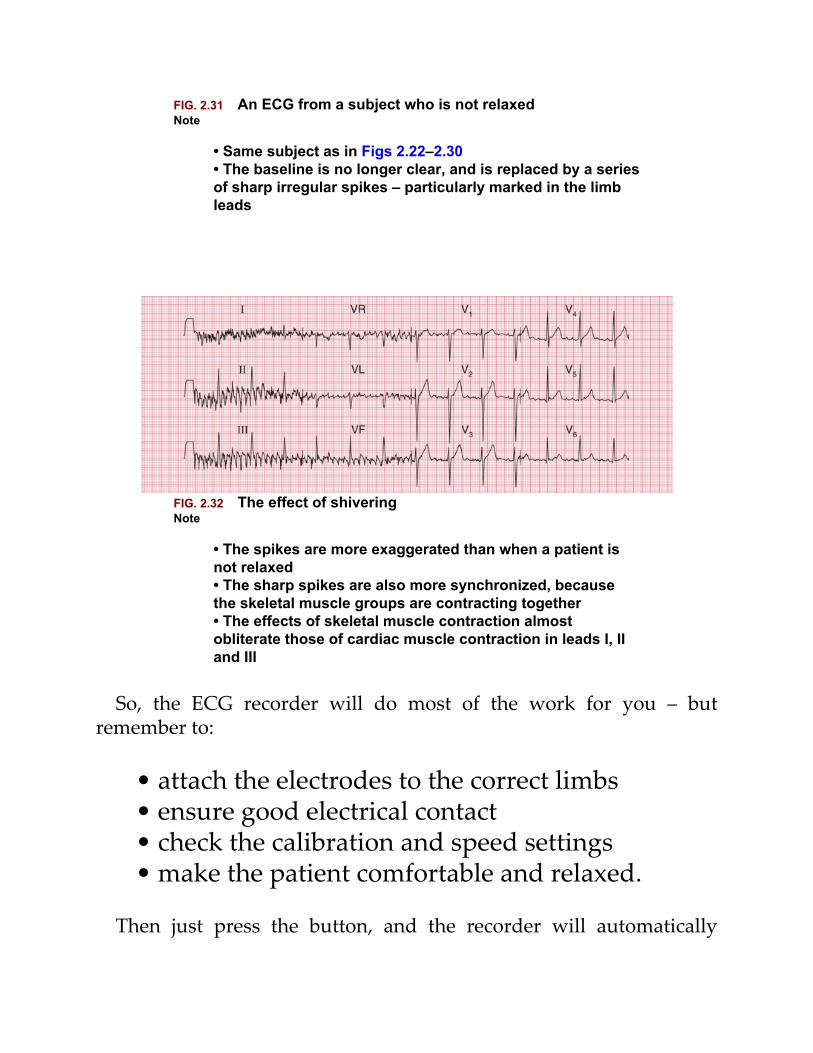
FIG. 2.31 An ECG from a subject who is not relaxedNote
• Same subject as in Figs 2.22–2.30• The baseline is no longer clear, and is replaced by a seriesof sharp irregular spikes – particularly marked in the limbleads
FIG. 2.32 The effect of shiveringNote
• The spikes are more exaggerated than when a patient isnot relaxed• The sharp spikes are also more synchronized, becausethe skeletal muscle groups are contracting together• The effects of skeletal muscle contraction almostobliterate those of cardiac muscle contraction in leads I, IIand III
So, the ECG recorder will do most of the work for you – butremember to:
• attach the electrodes to the correct limbs• ensure good electrical contact• check the calibration and speed settings• make the patient comfortable and relaxed.
Then just press the button, and the recorder will automatically
provide a beautiful 12-lead ECG.
How to report an ECGMany ECG recorders automatically provide a report, and in thesereports the heart rate and the conducting intervals are usuallyaccurately measured. However, the description of the rhythm and ofthe QRS and T patterns should be regarded with suspicion. Recorderstend to ‘over-report’, and to describe abnormalities where none exist:it is much better to be confident in your own reporting.
You now know enough about the ECG to understand the basis of areport. This should take the form of a description followed by aninterpretation.
The description should always be given in the same sequence:
1. rhythm2. conduction intervals3. cardiac axis4. a description of the QRS complexes5. a description of the ST segments and T waves.
Reporting a series of totally normal findings is possibly pedantic,and in real life this is frequently not done. However, you must thinkabout all the findings every time you interpret an ECG.
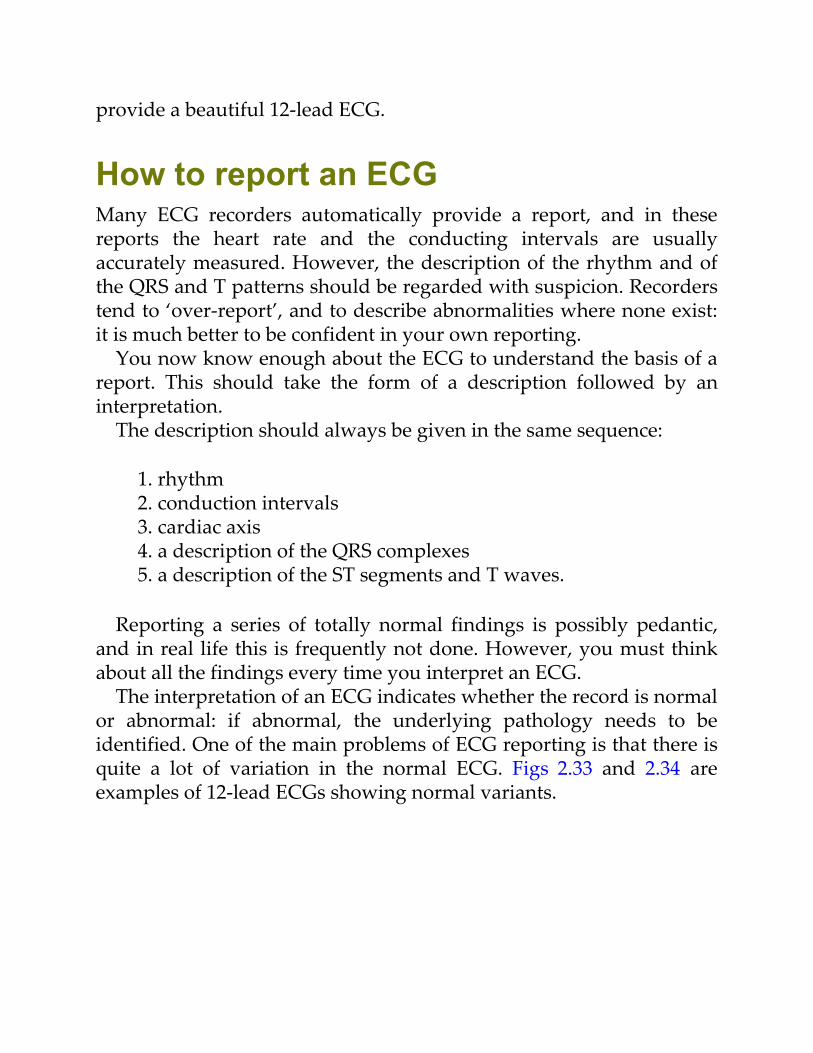
The interpretation of an ECG indicates whether the record is normalor abnormal: if abnormal, the underlying pathology needs to beidentified. One of the main problems of ECG reporting is that there isquite a lot of variation in the normal ECG. Figs 2.33 and 2.34 areexamples of 12-lead ECGs showing normal variants.
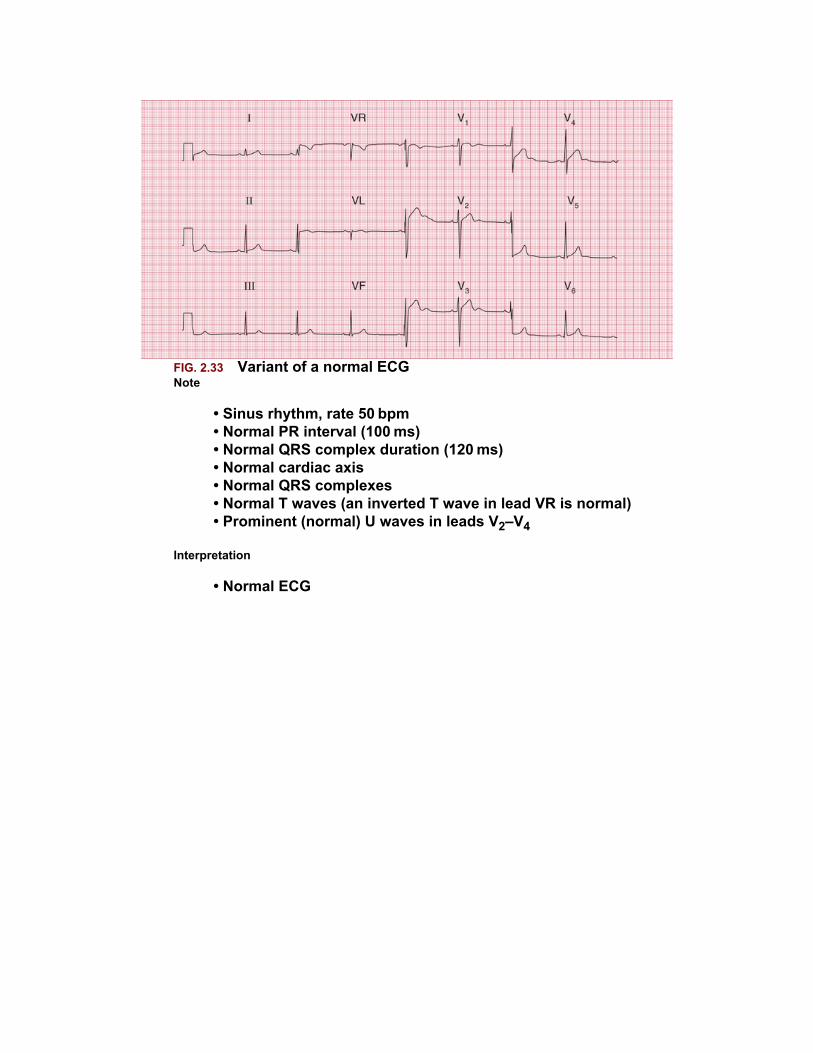
FIG. 2.33 Variant of a normal ECGNote
• Sinus rhythm, rate 50 bpm• Normal PR interval (100 ms)• Normal QRS complex duration (120 ms)• Normal cardiac axis• Normal QRS complexes• Normal T waves (an inverted T wave in lead VR is normal)• Prominent (normal) U waves in leads V2–V4
Interpretation
• Normal ECG
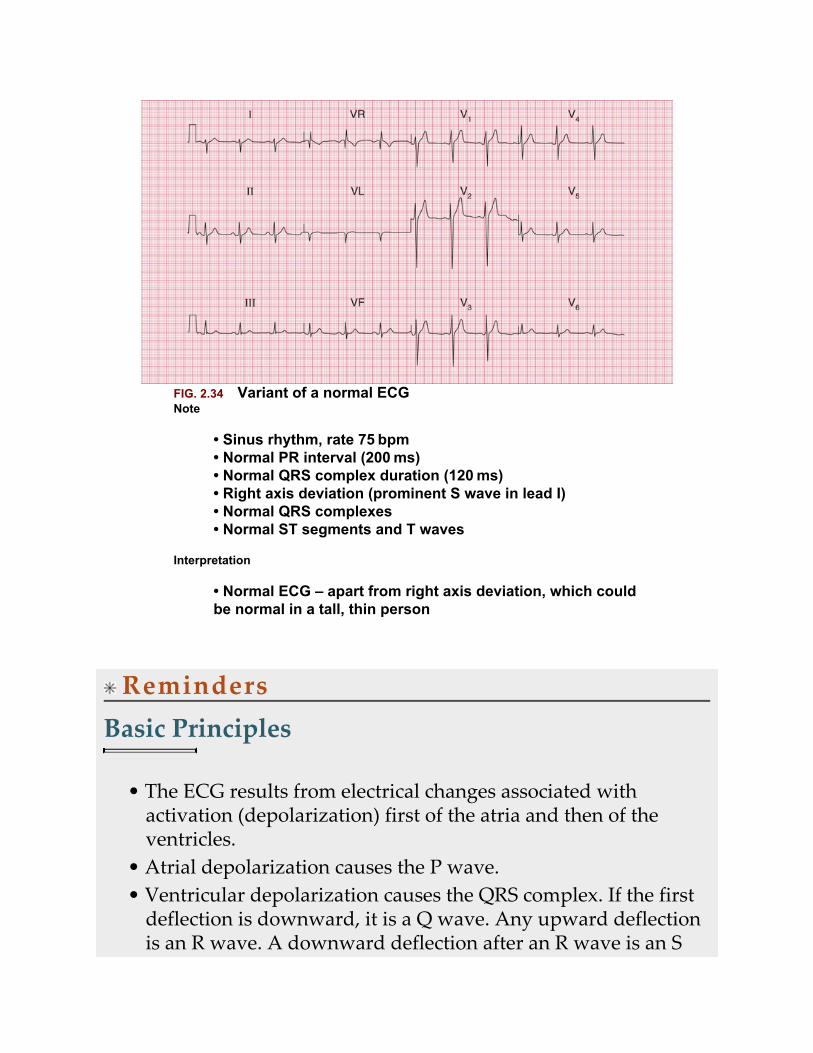
FIG. 2.34 Variant of a normal ECGNote
• Sinus rhythm, rate 75 bpm• Normal PR interval (200 ms)• Normal QRS complex duration (120 ms)• Right axis deviation (prominent S wave in lead I)• Normal QRS complexes• Normal ST segments and T waves
Interpretation
• Normal ECG – apart from right axis deviation, which couldbe normal in a tall, thin person
RemindersBasic Principles
• The ECG results from electrical changes associated withactivation (depolarization) first of the atria and then of theventricles.
• Atrial depolarization causes the P wave.• Ventricular depolarization causes the QRS complex. If the first
deflection is downward, it is a Q wave. Any upward deflectionis an R wave. A downward deflection after an R wave is an S
wave.
• When the depolarization wave spreads towards a lead, thedeflection is predominantly upward. When the wave spreadsaway from a lead, the deflection is predominantly downward.
• The six limb leads (I, II, III, VR, VL and VF) look at the heartfrom the sides and the feet in a vertical plane.
• The cardiac axis is the average direction of spread ofdepolarization as seen from the front, and is estimated fromleads I, II and III.
• The chest or V leads look at the heart from the front and the leftside in a horizontal plane. Lead V1 is positioned over the rightventricle, and lead V6 over the left ventricle.
• The septum is depolarized from the left side to the right.• In a normal heart the left ventricle exerts more influence on the
ECG than the right ventricle.• Unfortunately, there are a lot of minor variations in ECGs
which are consistent with perfectly normal hearts. Recognizingthe limits of normality is one of the main difficulties of ECGinterpretation.
For more on QT interval abnormalities, see ECG Made Practical, 7th
edition, Chapter 2For more on ECGs in healthy people, see ECG Made Practical, 7th
edition, Chapter 1
3
Conduction and its problems
Conduction problems in the AV node and Hisbundle 45
First degree heart block 46Second degree heart block 46Third degree heart block 48
Conduction problems in the right and left bundlebranches – bundle branch block 50
Right bundle branch block 50Left bundle branch block 53
Conduction problems in the distal parts of the leftbundle branch 55What to do 59
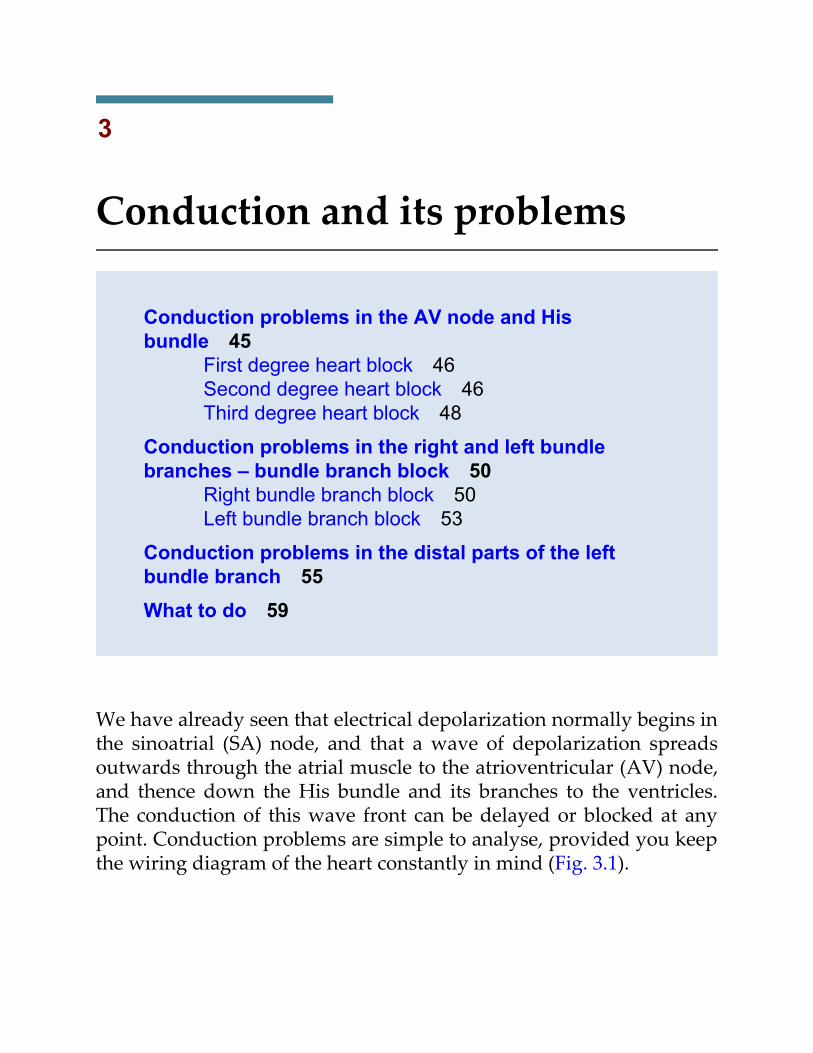
We have already seen that electrical depolarization normally begins inthe sinoatrial (SA) node, and that a wave of depolarization spreadsoutwards through the atrial muscle to the atrioventricular (AV) node,and thence down the His bundle and its branches to the ventricles.The conduction of this wave front can be delayed or blocked at anypoint. Conduction problems are simple to analyse, provided you keepthe wiring diagram of the heart constantly in mind (Fig. 3.1).
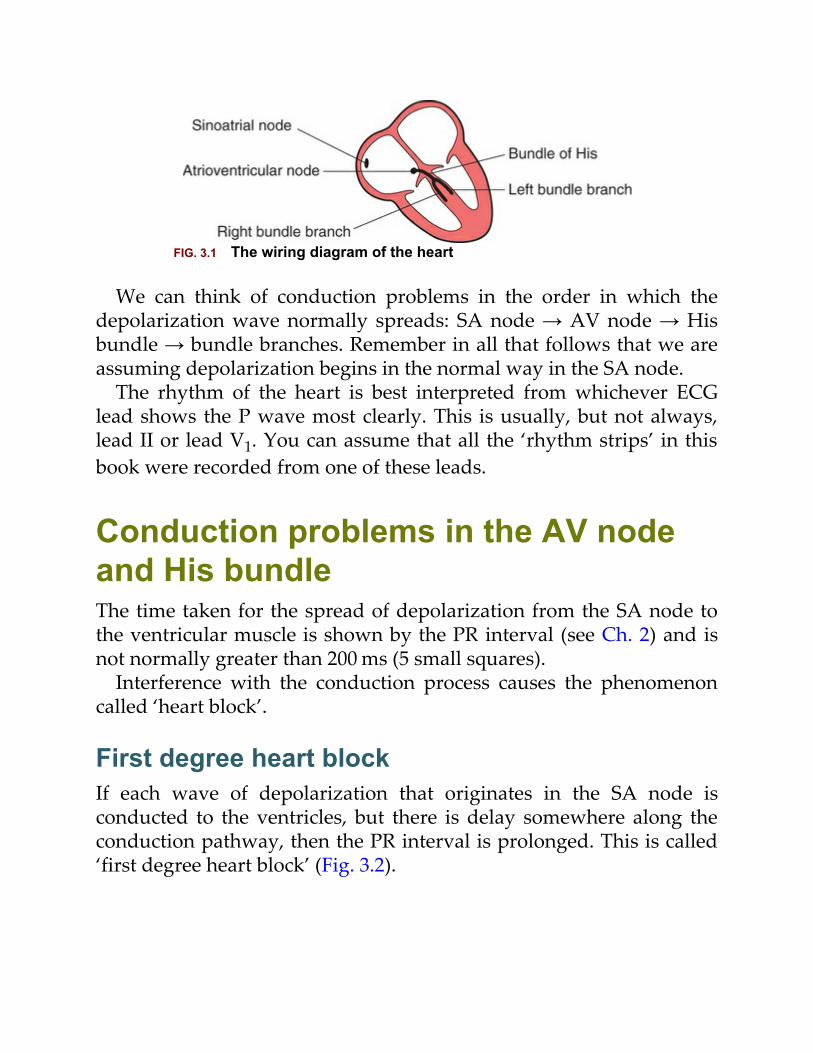
FIG. 3.1 The wiring diagram of the heart
We can think of conduction problems in the order in which thedepolarization wave normally spreads: SA node → AV node → Hisbundle → bundle branches. Remember in all that follows that we areassuming depolarization begins in the normal way in the SA node.
The rhythm of the heart is best interpreted from whichever ECGlead shows the P wave most clearly. This is usually, but not always,lead II or lead V1. You can assume that all the ‘rhythm strips’ in thisbook were recorded from one of these leads.
Conduction problems in the AV nodeand His bundleThe time taken for the spread of depolarization from the SA node tothe ventricular muscle is shown by the PR interval (see Ch. 2) and isnot normally greater than 200 ms (5 small squares).
Interference with the conduction process causes the phenomenoncalled ‘heart block’.
First degree heart blockIf each wave of depolarization that originates in the SA node isconducted to the ventricles, but there is delay somewhere along theconduction pathway, then the PR interval is prolonged. This is called‘first degree heart block’ (Fig. 3.2).
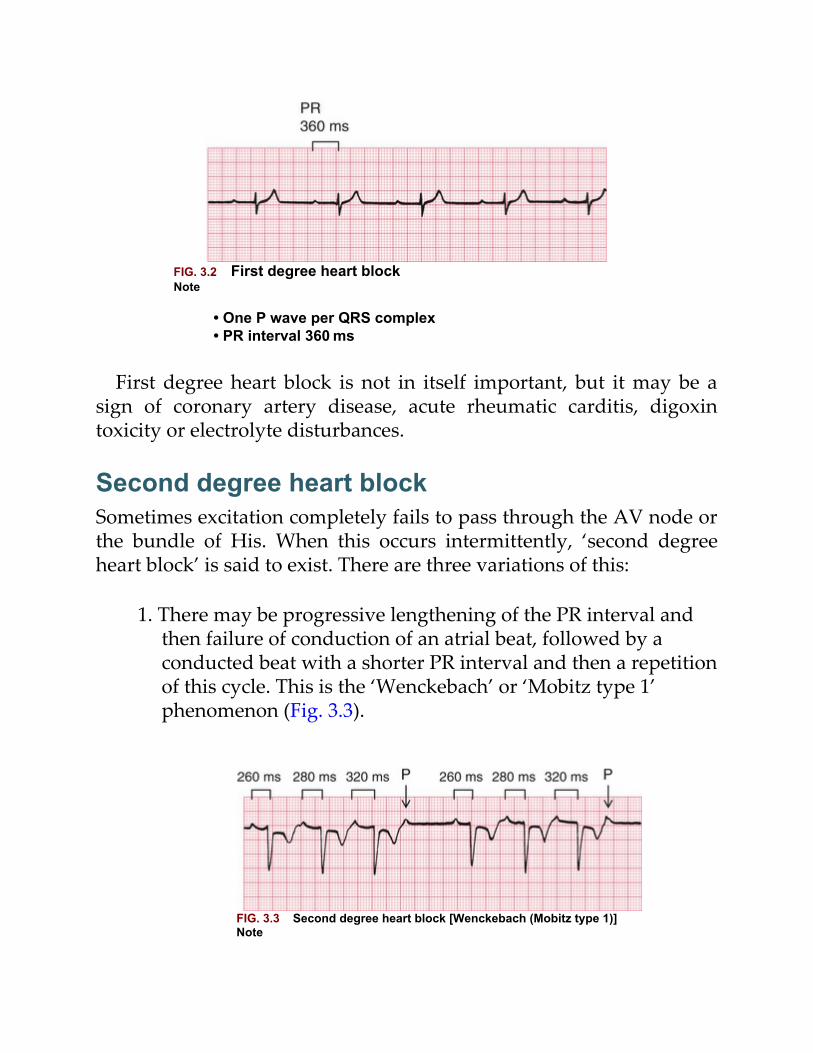
FIG. 3.2 First degree heart blockNote
• One P wave per QRS complex• PR interval 360 ms
First degree heart block is not in itself important, but it may be asign of coronary artery disease, acute rheumatic carditis, digoxintoxicity or electrolyte disturbances.
Second degree heart blockSometimes excitation completely fails to pass through the AV node orthe bundle of His. When this occurs intermittently, ‘second degreeheart block’ is said to exist. There are three variations of this:
1. There may be progressive lengthening of the PR interval andthen failure of conduction of an atrial beat, followed by aconducted beat with a shorter PR interval and then a repetitionof this cycle. This is the ‘Wenckebach’ or ‘Mobitz type 1’phenomenon (Fig. 3.3).
FIG. 3.3 Second degree heart block [Wenckebach (Mobitz type 1)]Note
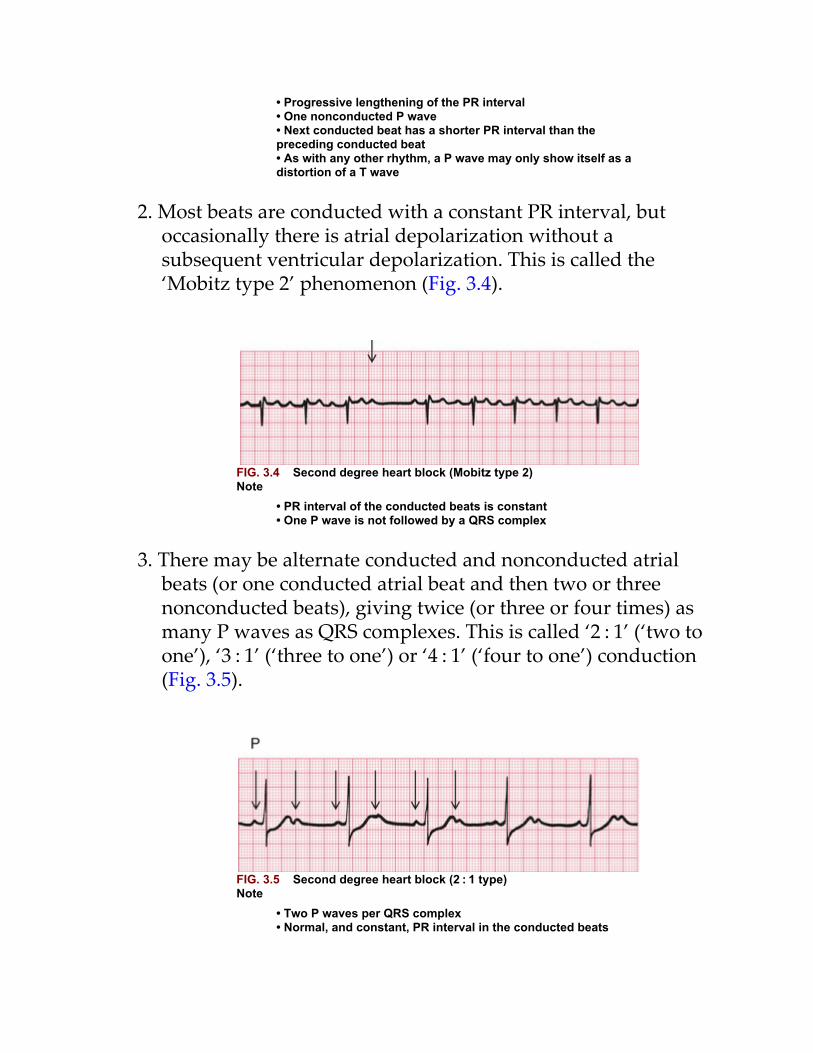
• Progressive lengthening of the PR interval• One nonconducted P wave• Next conducted beat has a shorter PR interval than thepreceding conducted beat• As with any other rhythm, a P wave may only show itself as adistortion of a T wave
2. Most beats are conducted with a constant PR interval, butoccasionally there is atrial depolarization without asubsequent ventricular depolarization. This is called the‘Mobitz type 2’ phenomenon (Fig. 3.4).
FIG. 3.4 Second degree heart block (Mobitz type 2)Note
• PR interval of the conducted beats is constant• One P wave is not followed by a QRS complex
3. There may be alternate conducted and nonconducted atrialbeats (or one conducted atrial beat and then two or threenonconducted beats), giving twice (or three or four times) asmany P waves as QRS complexes. This is called ‘2 : 1’ (‘two toone’), ‘3 : 1’ (‘three to one’) or ‘4 : 1’ (‘four to one’) conduction(Fig. 3.5).
FIG. 3.5 Second degree heart block (2 : 1 type)Note
• Two P waves per QRS complex• Normal, and constant, PR interval in the conducted beats

It is important to remember that, as with any other rhythm, a Pwave may only show itself as a distortion of a T wave (Fig. 3.6).
FIG. 3.6 Second degree heart block (2 : 1 type)Note
• P wave in the T wave can be identified because of itsregularity
The underlying causes of second degree heart block are the same asthose of first degree block. The Wenckebach phenomenon is usuallybenign, but Mobitz type 2 block and 2 : 1, 3 : 1 or 4 : 1 block may herald‘complete’, or ‘third degree’, heart block.
Third degree heart blockComplete heart block (third degree block) is said to occur when atrialcontraction is normal but no beats are conducted to the ventricles (Fig.3.7). When this occurs the ventricles are excited by a slow ‘escapemechanism’ (see Ch. 4), from a depolarizing focus within theventricular muscle.
FIG. 3.7 Third degree heart block
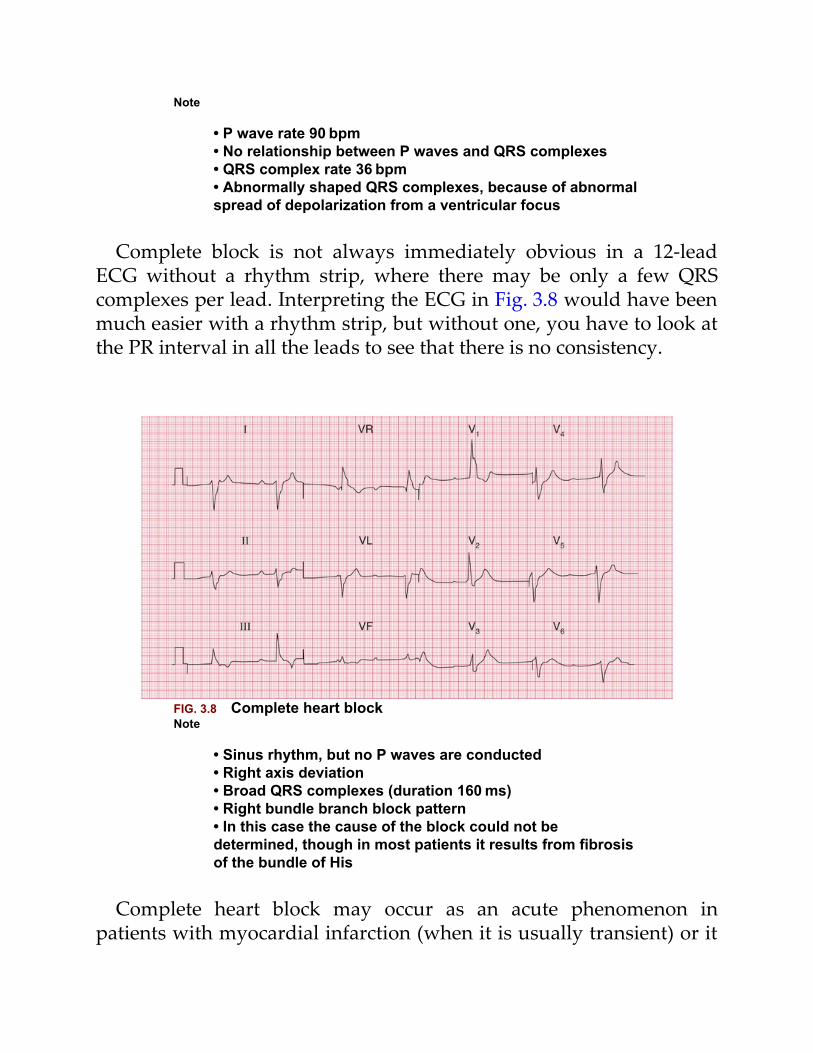
Note
• P wave rate 90 bpm• No relationship between P waves and QRS complexes• QRS complex rate 36 bpm• Abnormally shaped QRS complexes, because of abnormalspread of depolarization from a ventricular focus
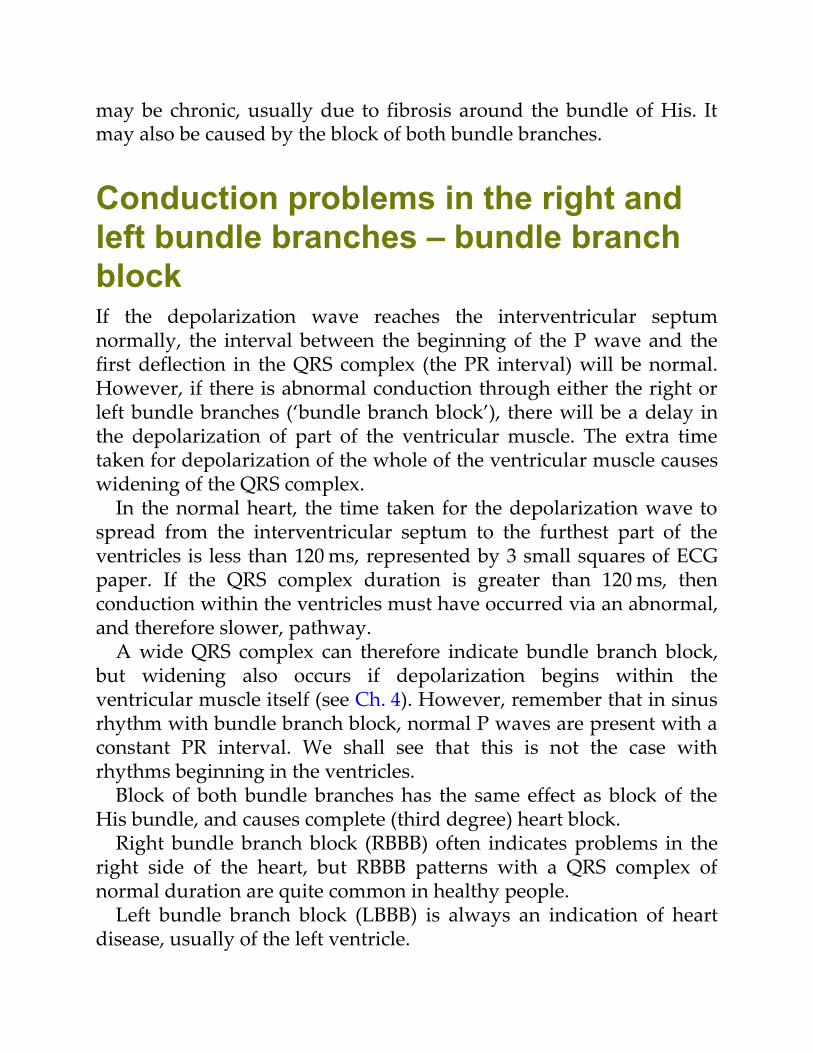
Complete block is not always immediately obvious in a 12-leadECG without a rhythm strip, where there may be only a few QRScomplexes per lead. Interpreting the ECG in Fig. 3.8 would have beenmuch easier with a rhythm strip, but without one, you have to look atthe PR interval in all the leads to see that there is no consistency.
FIG. 3.8 Complete heart blockNote
• Sinus rhythm, but no P waves are conducted• Right axis deviation• Broad QRS complexes (duration 160 ms)• Right bundle branch block pattern• In this case the cause of the block could not bedetermined, though in most patients it results from fibrosisof the bundle of His
Complete heart block may occur as an acute phenomenon inpatients with myocardial infarction (when it is usually transient) or it
may be chronic, usually due to fibrosis around the bundle of His. Itmay also be caused by the block of both bundle branches.
Conduction problems in the right andleft bundle branches – bundle branchblockIf the depolarization wave reaches the interventricular septumnormally, the interval between the beginning of the P wave and thefirst deflection in the QRS complex (the PR interval) will be normal.However, if there is abnormal conduction through either the right orleft bundle branches (‘bundle branch block’), there will be a delay inthe depolarization of part of the ventricular muscle. The extra timetaken for depolarization of the whole of the ventricular muscle causeswidening of the QRS complex.
In the normal heart, the time taken for the depolarization wave tospread from the interventricular septum to the furthest part of theventricles is less than 120 ms, represented by 3 small squares of ECGpaper. If the QRS complex duration is greater than 120 ms, thenconduction within the ventricles must have occurred via an abnormal,and therefore slower, pathway.
A wide QRS complex can therefore indicate bundle branch block,but widening also occurs if depolarization begins within theventricular muscle itself (see Ch. 4). However, remember that in sinusrhythm with bundle branch block, normal P waves are present with aconstant PR interval. We shall see that this is not the case withrhythms beginning in the ventricles.
Block of both bundle branches has the same effect as block of theHis bundle, and causes complete (third degree) heart block.
Right bundle branch block (RBBB) often indicates problems in theright side of the heart, but RBBB patterns with a QRS complex ofnormal duration are quite common in healthy people.
Left bundle branch block (LBBB) is always an indication of heartdisease, usually of the left ventricle.
It is important to recognize when bundle branch block is present,because LBBB prevents any further interpretation of the cardiogram,and RBBB can make interpretation difficult.
The mechanism underlying the ECG patterns of RBBB and LBBBcan be worked out from first principles. Remember (see Ch. 2):
• The septum is normally depolarized from left toright.• The left ventricle, having the greater musclemass, exerts more influence on the ECG than doesthe right ventricle.• Excitation spreading towards a lead causes anupward deflection within the ECG.
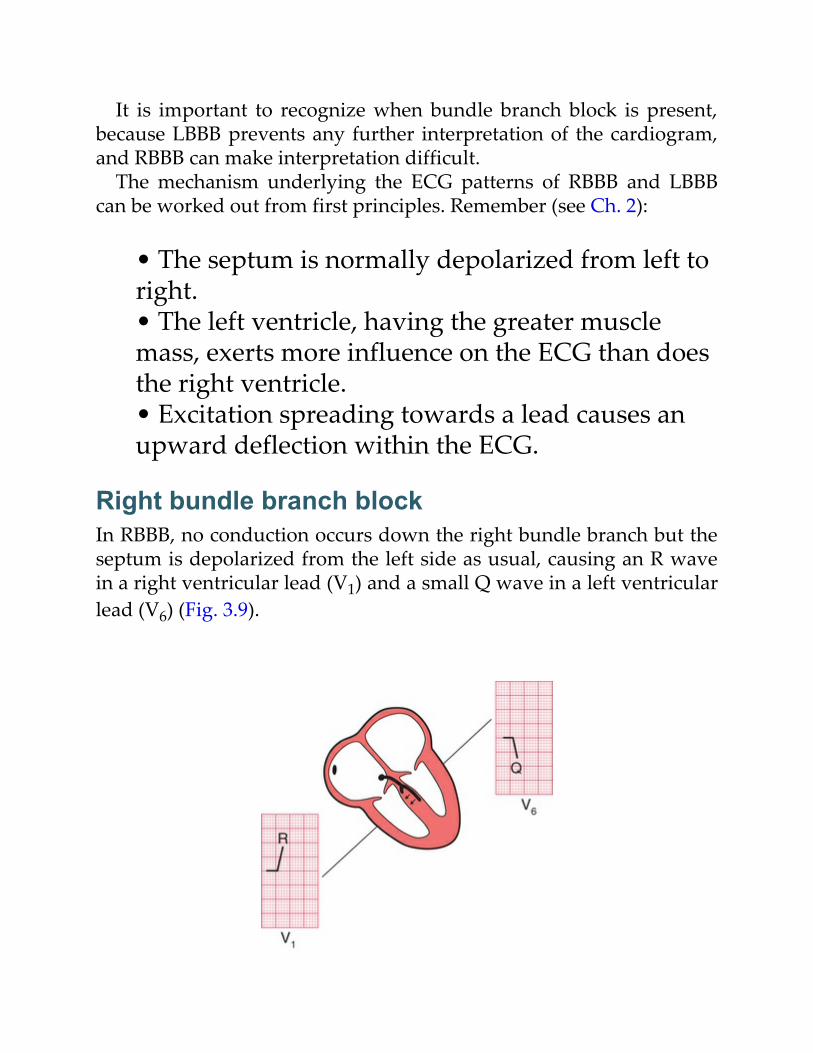
Right bundle branch blockIn RBBB, no conduction occurs down the right bundle branch but theseptum is depolarized from the left side as usual, causing an R wavein a right ventricular lead (V1) and a small Q wave in a left ventricularlead (V6) (Fig. 3.9).
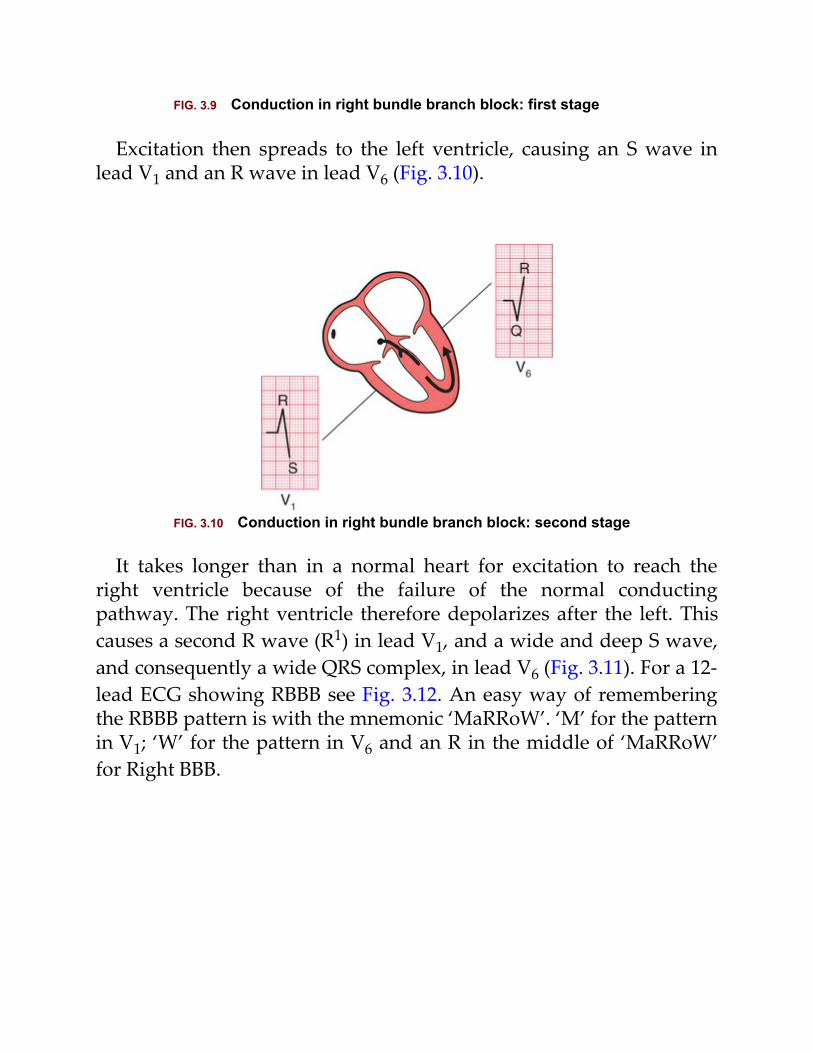
FIG. 3.9 Conduction in right bundle branch block: first stage
Excitation then spreads to the left ventricle, causing an S wave inlead V1 and an R wave in lead V6 (Fig. 3.10).
FIG. 3.10 Conduction in right bundle branch block: second stage
It takes longer than in a normal heart for excitation to reach theright ventricle because of the failure of the normal conductingpathway. The right ventricle therefore depolarizes after the left. Thiscauses a second R wave (R1) in lead V1, and a wide and deep S wave,and consequently a wide QRS complex, in lead V6 (Fig. 3.11). For a 12-lead ECG showing RBBB see Fig. 3.12. An easy way of rememberingthe RBBB pattern is with the mnemonic ‘MaRRoW’. ‘M’ for the patternin V1; ‘W’ for the pattern in V6 and an R in the middle of ‘MaRRoW’for Right BBB.
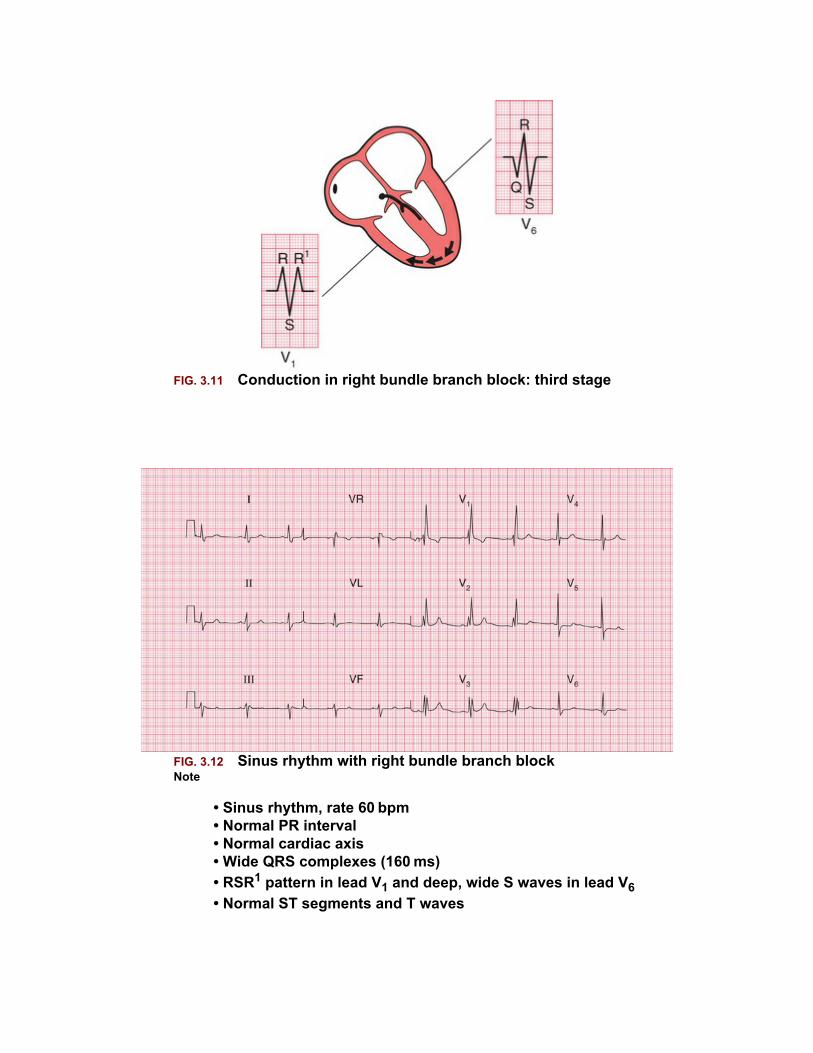
FIG. 3.11 Conduction in right bundle branch block: third stage
FIG. 3.12 Sinus rhythm with right bundle branch blockNote
• Sinus rhythm, rate 60 bpm• Normal PR interval• Normal cardiac axis• Wide QRS complexes (160 ms)• RSR1 pattern in lead V1 and deep, wide S waves in lead V6• Normal ST segments and T waves
An ‘RSR1’ pattern, with a QRS complex of normal width (less than120 ms), is sometimes called ‘partial right bundle branch block’. It isseldom of significance, and can be considered a normal variant.
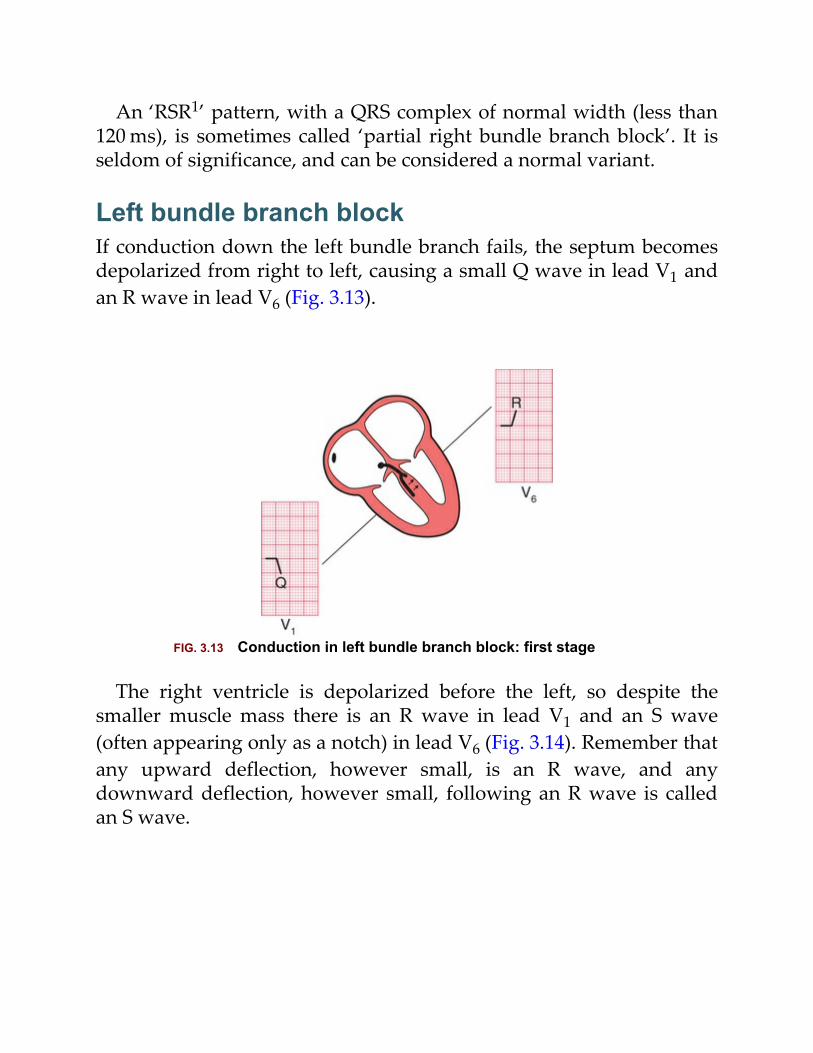
Left bundle branch blockIf conduction down the left bundle branch fails, the septum becomesdepolarized from right to left, causing a small Q wave in lead V1 andan R wave in lead V6 (Fig. 3.13).
FIG. 3.13 Conduction in left bundle branch block: first stage
The right ventricle is depolarized before the left, so despite thesmaller muscle mass there is an R wave in lead V1 and an S wave(often appearing only as a notch) in lead V6 (Fig. 3.14). Remember thatany upward deflection, however small, is an R wave, and anydownward deflection, however small, following an R wave is calledan S wave.
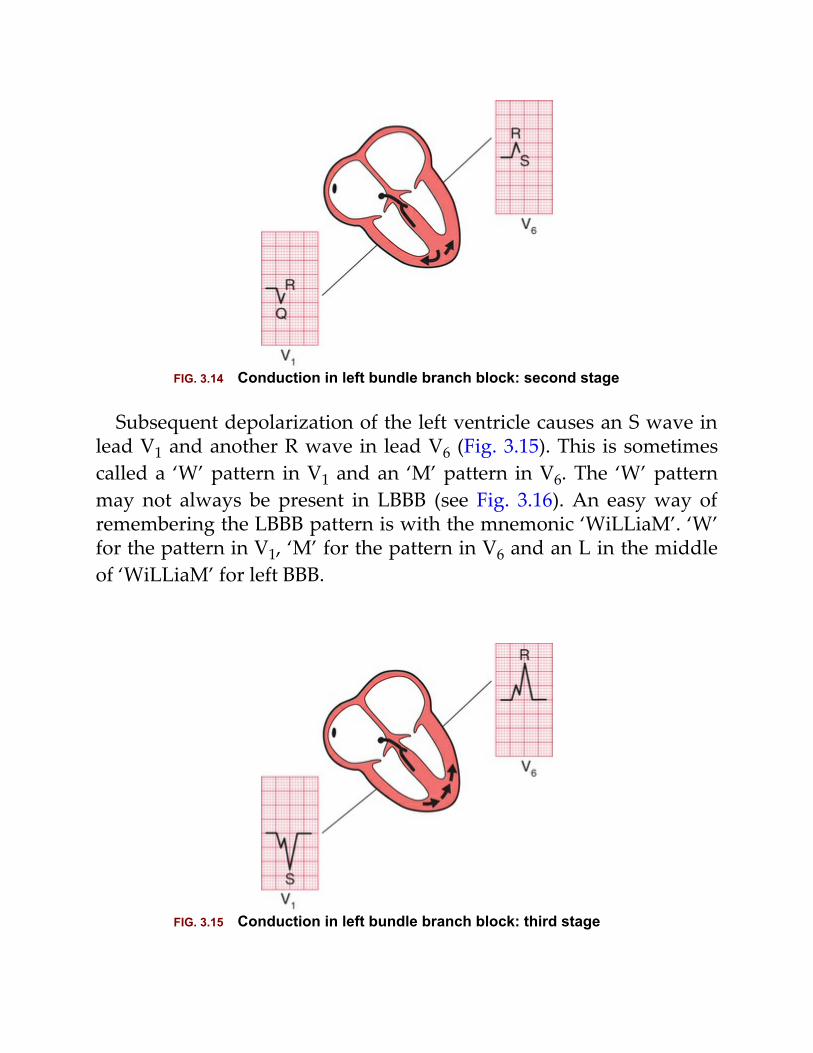
FIG. 3.14 Conduction in left bundle branch block: second stage
Subsequent depolarization of the left ventricle causes an S wave inlead V1 and another R wave in lead V6 (Fig. 3.15). This is sometimescalled a ‘W’ pattern in V1 and an ‘M’ pattern in V6. The ‘W’ patternmay not always be present in LBBB (see Fig. 3.16). An easy way ofremembering the LBBB pattern is with the mnemonic ‘WiLLiaM’. ‘W’for the pattern in V1, ‘M’ for the pattern in V6 and an L in the middleof ‘WiLLiaM’ for left BBB.
FIG. 3.15 Conduction in left bundle branch block: third stage
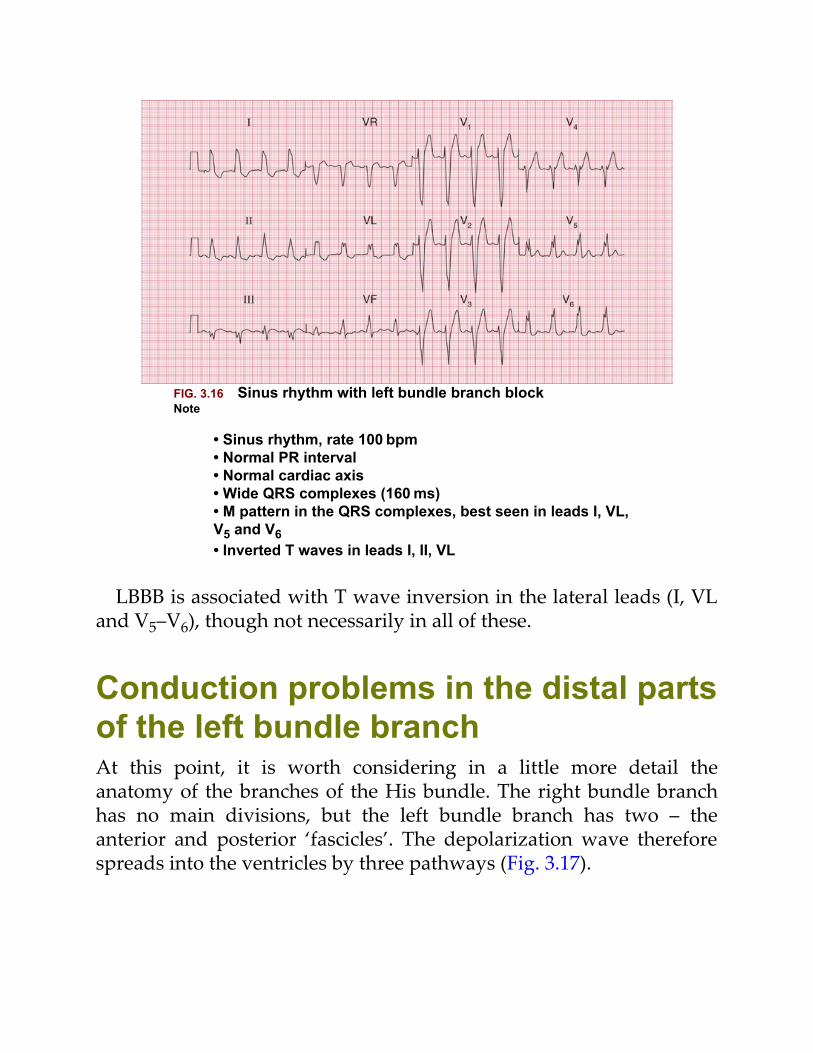
FIG. 3.16 Sinus rhythm with left bundle branch blockNote
• Sinus rhythm, rate 100 bpm• Normal PR interval• Normal cardiac axis• Wide QRS complexes (160 ms)• M pattern in the QRS complexes, best seen in leads I, VL,V5 and V6• Inverted T waves in leads I, II, VL
LBBB is associated with T wave inversion in the lateral leads (I, VLand V5–V6), though not necessarily in all of these.
Conduction problems in the distal partsof the left bundle branchAt this point, it is worth considering in a little more detail theanatomy of the branches of the His bundle. The right bundle branchhas no main divisions, but the left bundle branch has two – theanterior and posterior ‘fascicles’. The depolarization wave thereforespreads into the ventricles by three pathways (Fig. 3.17).
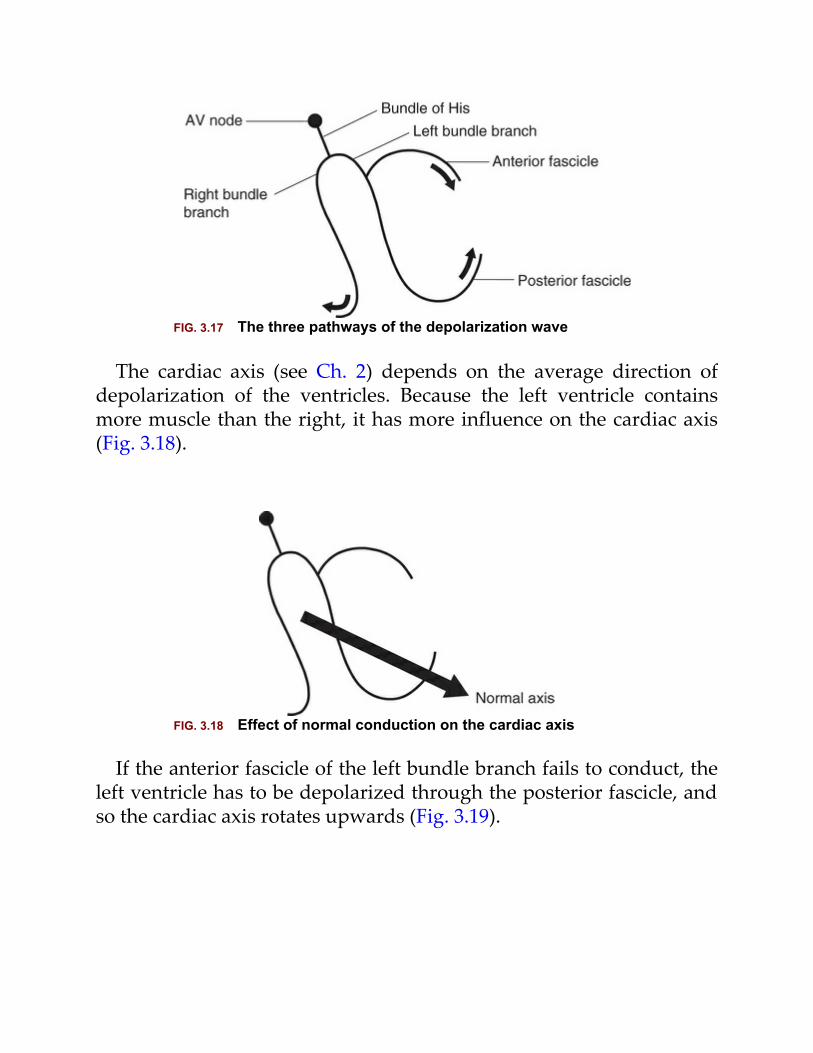
FIG. 3.17 The three pathways of the depolarization wave
The cardiac axis (see Ch. 2) depends on the average direction ofdepolarization of the ventricles. Because the left ventricle containsmore muscle than the right, it has more influence on the cardiac axis(Fig. 3.18).
FIG. 3.18 Effect of normal conduction on the cardiac axis
If the anterior fascicle of the left bundle branch fails to conduct, theleft ventricle has to be depolarized through the posterior fascicle, andso the cardiac axis rotates upwards (Fig. 3.19).
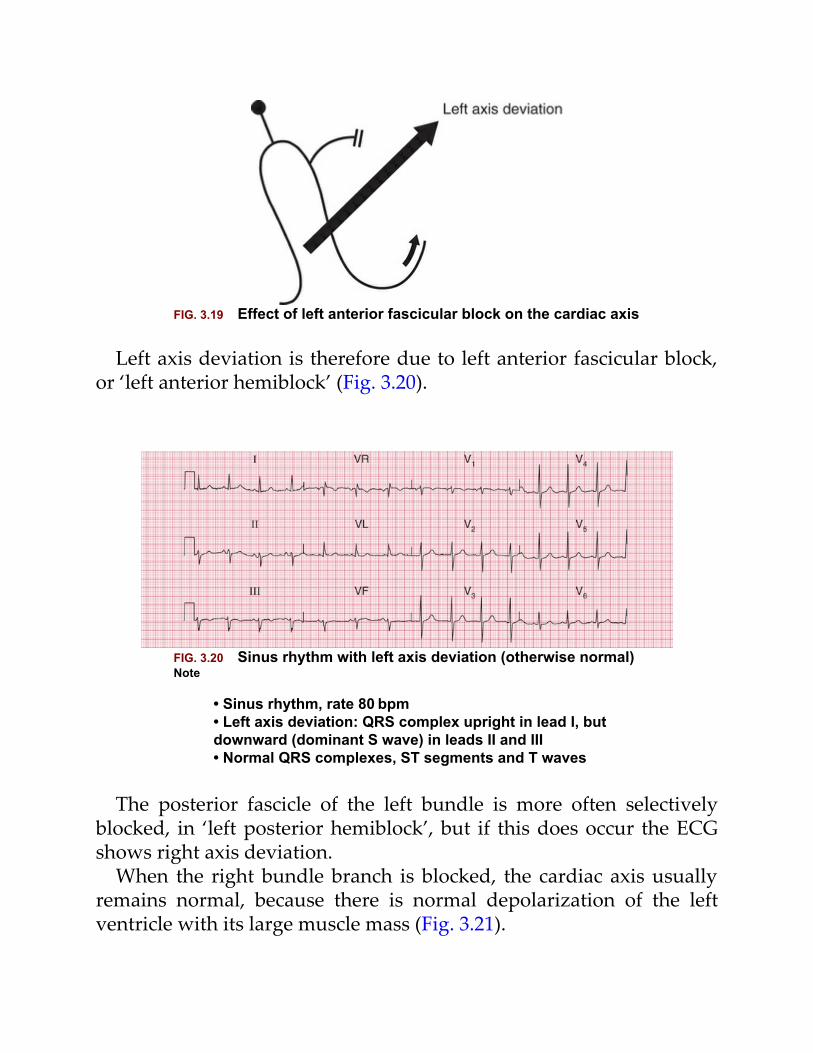
FIG. 3.19 Effect of left anterior fascicular block on the cardiac axis
Left axis deviation is therefore due to left anterior fascicular block,or ‘left anterior hemiblock’ (Fig. 3.20).
FIG. 3.20 Sinus rhythm with left axis deviation (otherwise normal)Note
• Sinus rhythm, rate 80 bpm• Left axis deviation: QRS complex upright in lead I, butdownward (dominant S wave) in leads II and III• Normal QRS complexes, ST segments and T waves
The posterior fascicle of the left bundle is more often selectivelyblocked, in ‘left posterior hemiblock’, but if this does occur the ECGshows right axis deviation.
When the right bundle branch is blocked, the cardiac axis usuallyremains normal, because there is normal depolarization of the leftventricle with its large muscle mass (Fig. 3.21).

FIG. 3.21 Lack of effect of right bundle branch block on thecardiac axis
However, if both the right bundle branch and the left anteriorfascicle are blocked, the ECG shows RBBB and left axis deviation (Fig.3.22). This is sometimes called ‘bifascicular block’, and this ECGpattern obviously indicates widespread damage to the conductingsystem (Fig. 3.23).
FIG. 3.22 Effect of right bundle branch block and left anteriorhemiblock on the cardiac axis
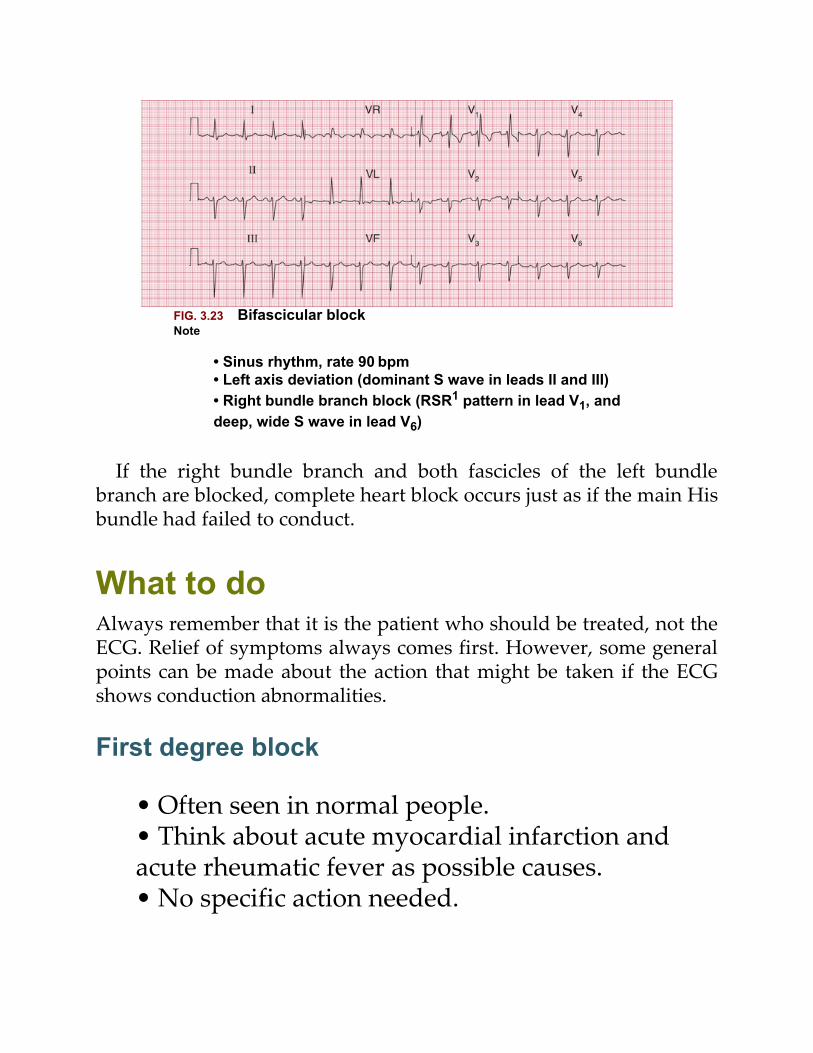
FIG. 3.23 Bifascicular blockNote
• Sinus rhythm, rate 90 bpm• Left axis deviation (dominant S wave in leads II and III)• Right bundle branch block (RSR1 pattern in lead V1, anddeep, wide S wave in lead V6)
If the right bundle branch and both fascicles of the left bundlebranch are blocked, complete heart block occurs just as if the main Hisbundle had failed to conduct.
What to doAlways remember that it is the patient who should be treated, not theECG. Relief of symptoms always comes first. However, some generalpoints can be made about the action that might be taken if the ECGshows conduction abnormalities.
First degree block
• Often seen in normal people.• Think about acute myocardial infarction andacute rheumatic fever as possible causes.• No specific action needed.
Second degree block
• Usually indicates heart disease; often seen inacute myocardial infarction.• Mobitz type 2 and Wenckebach block do notneed specific treatment.• 2 : 1, 3 : 1 or 4 : 1 block may indicate a need fortemporary or permanent pacing, especially if theventricular rate is slow.
Third degree block
• Always indicates conducting tissue disease –more often fibrosis than ischaemic.• Consider a temporary or permanent pacemaker.
Right bundle branch block
• Think about an atrial septal defect.• No specific treatment.
Left bundle branch block
• Think about aortic stenosis and ischaemicdisease.• If the patient is asymptomatic, no action isneeded.• If the patient has recently had severe chest pain,
LBBB may indicate an acute myocardial infarction,and intervention should be considered.
Left axis deviation
• Think about left ventricular hypertrophy and itscauses.• No action needed.
Left axis deviation and right bundle branch block
• Indicates severe conducting tissue disease.• No specific treatment needed.• Pacemaker required if the patient has symptomssuggestive of intermittent complete heart block.
RemindersConduction and Its Effects on the ECG
• Depolarization normally begins in the SA node, and spreads tothe ventricles via the AV node, the His bundle, the right andleft branches of the His bundle, and the anterior and posteriorfascicles of the left bundle branch.
• A conduction abnormality can develop at any of these points.• Conduction problems in the AV node and His bundle may be
partial (first and second degree block) or complete (third degreeblock).
• If conduction is normal through the AV node, the His bundleand one of its branches, but is abnormal in the other branch,bundle branch block exists and the QRS complex is wide.

• The ECG pattern of RBBB and LBBB can be worked out if youremember that:
– the septum is depolarized first from left to right– lead V1 looks at the right ventricle and lead V6 at the
left ventricle– when depolarization spreads towards an electrode, the
stylus moves upwards.• The easiest way to remember the patterns of RBBB and LBBB
are with the mnemonics ‘MaRRoW’ and ‘WiLLiaM’. In RBBB,use ‘MaRRoW’: an M pattern in V1 and a W pattern in V6, andthe letter R for RBBB in MaRRoW. In LBBB use ‘WiLLiaM’: a Wpattern in V1 and an M pattern in V6 and the letter L for LBBBin ‘WiLLiaM’.
• Block of the anterior division or fascicle of the left bundlebranch causes left axis deviation.
For more on conduction problems and pacemakers, see ECG MadePractical, 7th edition, Chapter 5
4
The rhythm of the heart
The intrinsic rhythmicity of the heart 62Abnormal rhythms 62The bradycardias – the slow rhythms 64
Atrial escape 64Nodal (junctional) escape 64Ventricular escape 64
Extrasystoles 67The tachycardias – the fast rhythms 70
Supraventricular tachycardias 70Ventricular tachycardias 74How to distinguish between ventriculartachycardia and supraventricular tachycardiawith bundle branch block 75
Fibrillation 77Atrial fibrillation 78Ventricular fibrillation 78
Wolff-Parkinson-White syndrome 80The origins of tachycardias 80What to do 82The identification of rhythm abnormalities 84
So far, we have only considered the spread of depolarization thatfollows the normal activation of the sinoatrial (SA) node. Whendepolarization begins in the SA node the heart is said to be in sinusrhythm. Depolarization can, however, begin in other places. Then therhythm is named after the part of the heart where the depolarizationsequence originates, and an ‘arrhythmia’ is said to be present.
When attempting to analyse a cardiac rhythm remember:
• Atrial contraction is associated with the P waveof the ECG.• Ventricular contraction is associated with theQRS complex.• Atrial contraction normally precedes ventricularcontraction, and there is normally one atrialcontraction per ventricular contraction (i.e. thereshould be as many P waves as there are QRScomplexes).
The keys to rhythm abnormalities are:
• The P waves – can you find them? Look for thelead in which they are most obvious.• The relationship between the P waves and theQRS complexes – there should be one P wave perQRS complex.• The width of the QRS complexes (should be120 ms or less, i.e. 3 small squares).• Because an arrhythmia should be identifiedfrom the lead in which the P waves can be seenmost easily, full 12-lead ECGs are better than
rhythm strips.
The intrinsic rhythmicity of the heartMost parts of the heart can depolarize spontaneously andrhythmically, and the rate of contraction of the ventricles will becontrolled by the part of the heart that is depolarizing mostfrequently.
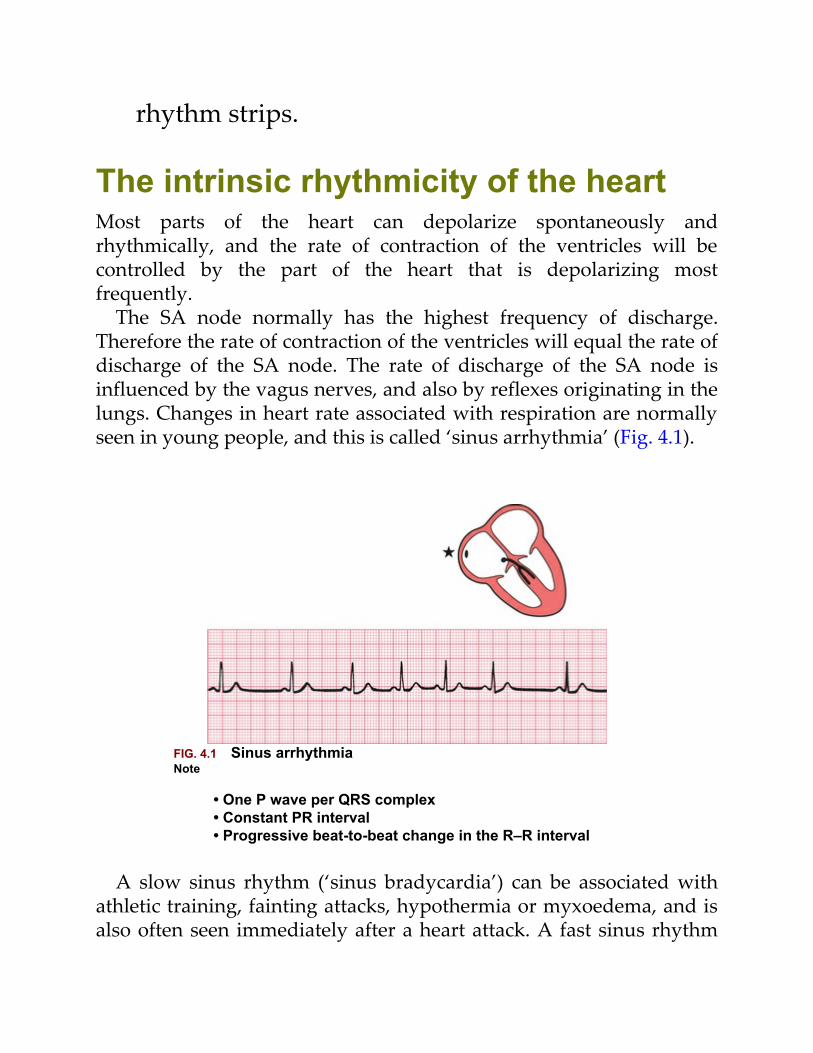
The SA node normally has the highest frequency of discharge.Therefore the rate of contraction of the ventricles will equal the rate ofdischarge of the SA node. The rate of discharge of the SA node isinfluenced by the vagus nerves, and also by reflexes originating in thelungs. Changes in heart rate associated with respiration are normallyseen in young people, and this is called ‘sinus arrhythmia’ (Fig. 4.1).
FIG. 4.1 Sinus arrhythmiaNote
• One P wave per QRS complex• Constant PR interval• Progressive beat-to-beat change in the R–R interval
A slow sinus rhythm (‘sinus bradycardia’) can be associated withathletic training, fainting attacks, hypothermia or myxoedema, and isalso often seen immediately after a heart attack. A fast sinus rhythm
(‘sinus tachycardia’) can be associated with exercise, fear, pain,haemorrhage or thyrotoxicosis. There is no particular rate that iscalled ‘bradycardia’ or ‘tachycardia’ – these are merely descriptiveterms. The stars in the figures in this chapter indicate the part of theheart where the activation sequence began.
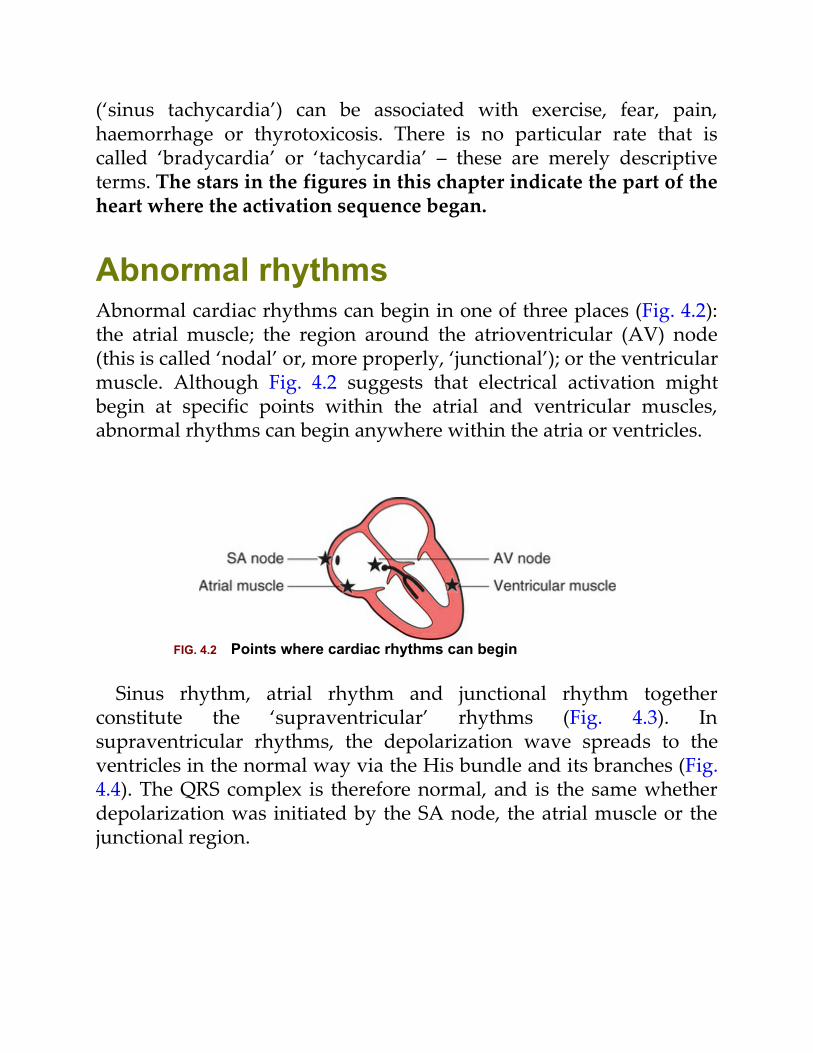
Abnormal rhythmsAbnormal cardiac rhythms can begin in one of three places (Fig. 4.2):the atrial muscle; the region around the atrioventricular (AV) node(this is called ‘nodal’ or, more properly, ‘junctional’); or the ventricularmuscle. Although Fig. 4.2 suggests that electrical activation mightbegin at specific points within the atrial and ventricular muscles,abnormal rhythms can begin anywhere within the atria or ventricles.
FIG. 4.2 Points where cardiac rhythms can begin
Sinus rhythm, atrial rhythm and junctional rhythm togetherconstitute the ‘supraventricular’ rhythms (Fig. 4.3). Insupraventricular rhythms, the depolarization wave spreads to theventricles in the normal way via the His bundle and its branches (Fig.4.4). The QRS complex is therefore normal, and is the same whetherdepolarization was initiated by the SA node, the atrial muscle or thejunctional region.
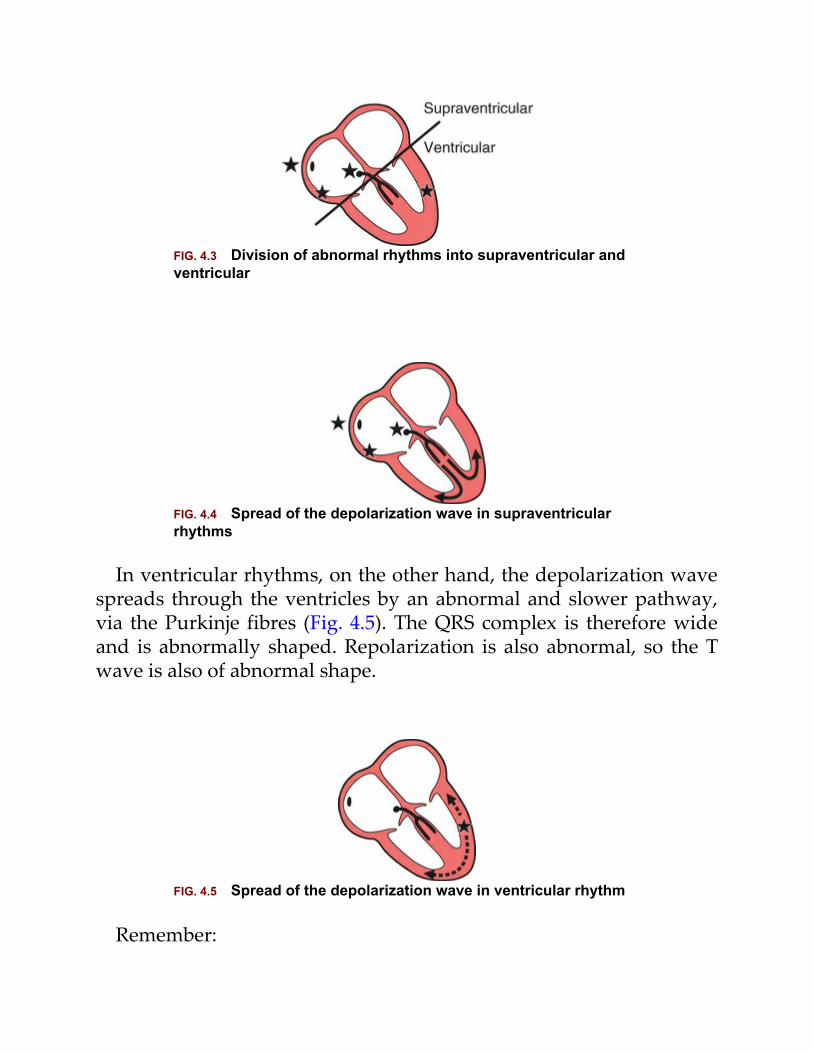
FIG. 4.3 Division of abnormal rhythms into supraventricular andventricular
FIG. 4.4 Spread of the depolarization wave in supraventricularrhythms
In ventricular rhythms, on the other hand, the depolarization wavespreads through the ventricles by an abnormal and slower pathway,via the Purkinje fibres (Fig. 4.5). The QRS complex is therefore wideand is abnormally shaped. Repolarization is also abnormal, so the Twave is also of abnormal shape.
FIG. 4.5 Spread of the depolarization wave in ventricular rhythm
Remember:
• Supraventricular rhythms have narrow QRScomplexes.• Ventricular rhythms have wide QRS complexes.• The only exception to this rule occurs whenthere is a supraventricular rhythm with right orleft bundle branch block, or the Wolff–Parkinson–White (WPW) syndrome, when the QRS complexwill be wide (see p. 80).
Abnormal rhythms arising in the atrial muscle, the junctional regionor the ventricular muscle can be categorized as:
• bradycardias – slow and sustained• extrasystoles – occur as early single beats• tachycardias – fast and sustained• fibrillation – activation of the atria or ventriclesis totally disorganized.
The bradycardias – the slow rhythmsIt is clearly advantageous if different parts of the heart are able toinitiate the depolarization sequence, because this gives the heart aseries of fail-safe mechanisms that will keep it going if the SA nodefails to depolarize, or if conduction of the depolarization wave isblocked. However, the protective mechanisms must normally beinactive if competition between normal and abnormal sites ofspontaneous depolarization is to be avoided. This is achieved by thesecondary sites having a lower intrinsic frequency of depolarizationthan the SA node.
The heart is controlled by whichever site is spontaneouslydepolarizing most frequently: normally this is the SA node, and it
gives a normal heart rate of about 70/min. If the SA node fails todepolarize, control will be assumed by a focus either in the atrialmuscle or in the region around the AV node (the junctional region),both of which have spontaneous depolarization frequencies of about50 bpm. If these fail, or if conduction through the His bundle isblocked, a ventricular focus will take over and give a ventricular rateof about 30 bpm.
These slow and protective rhythms are called ‘escape rhythms’,because they occur when secondary sites for initiating depolarizationescape from their normal inhibition by the more active SA node.
Escape rhythms are not primary disorders, but are the response toproblems higher in the conducting pathway. They are commonly seenin the acute phase of a heart attack, when they may be associated withsinus bradycardia. It is important not to try to suppress an escaperhythm, because without it the heart might stop altogether.
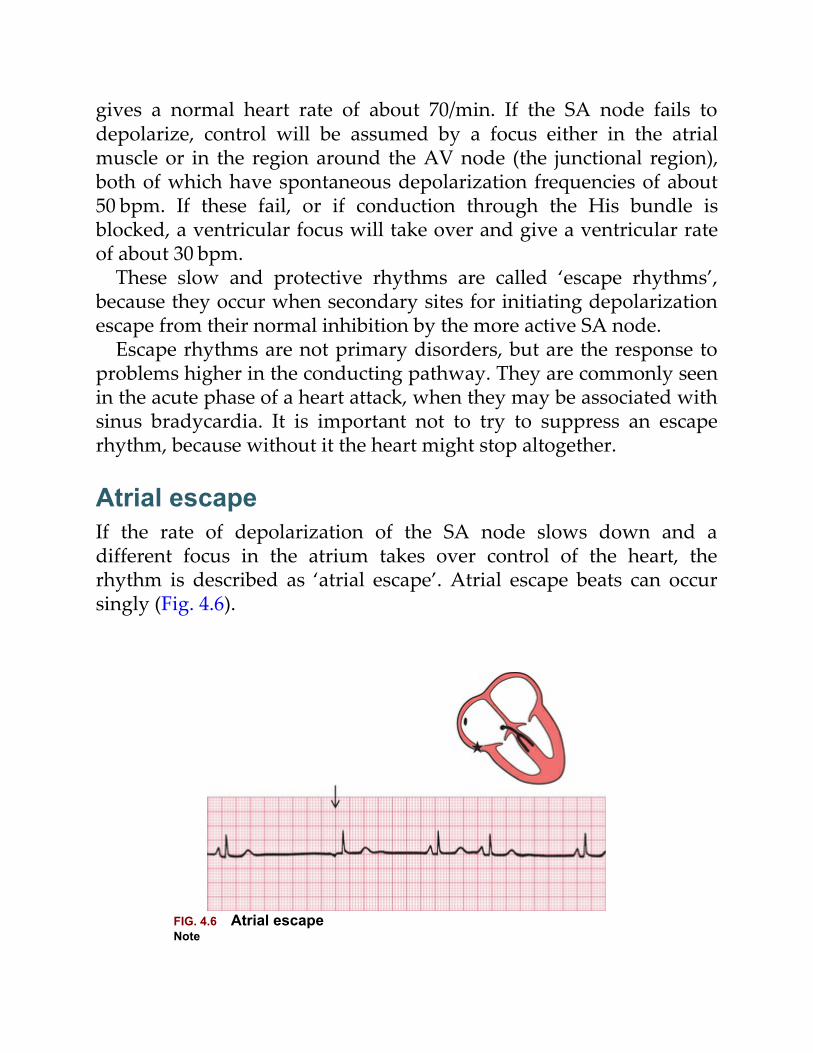
Atrial escapeIf the rate of depolarization of the SA node slows down and adifferent focus in the atrium takes over control of the heart, therhythm is described as ‘atrial escape’. Atrial escape beats can occursingly (Fig. 4.6).
FIG. 4.6 Atrial escapeNote
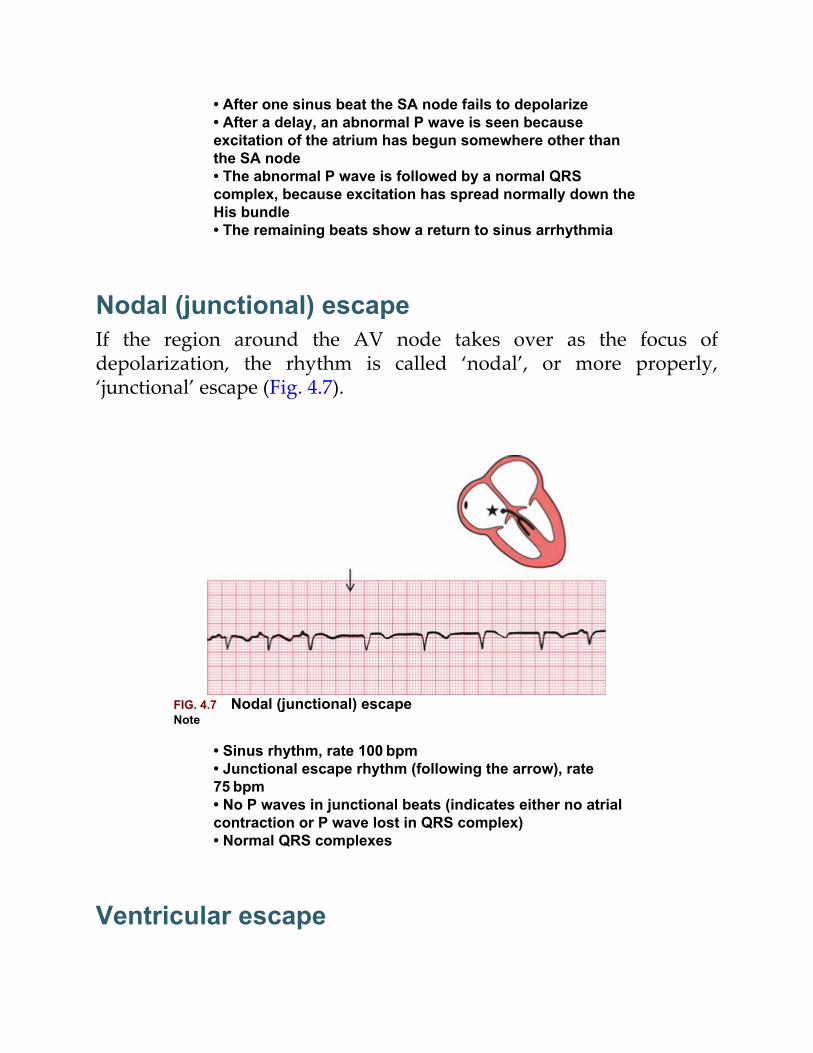
• After one sinus beat the SA node fails to depolarize• After a delay, an abnormal P wave is seen becauseexcitation of the atrium has begun somewhere other thanthe SA node• The abnormal P wave is followed by a normal QRScomplex, because excitation has spread normally down theHis bundle• The remaining beats show a return to sinus arrhythmia
Nodal (junctional) escapeIf the region around the AV node takes over as the focus ofdepolarization, the rhythm is called ‘nodal’, or more properly,‘junctional’ escape (Fig. 4.7).
FIG. 4.7 Nodal (junctional) escapeNote
• Sinus rhythm, rate 100 bpm• Junctional escape rhythm (following the arrow), rate75 bpm• No P waves in junctional beats (indicates either no atrialcontraction or P wave lost in QRS complex)• Normal QRS complexes
Ventricular escape
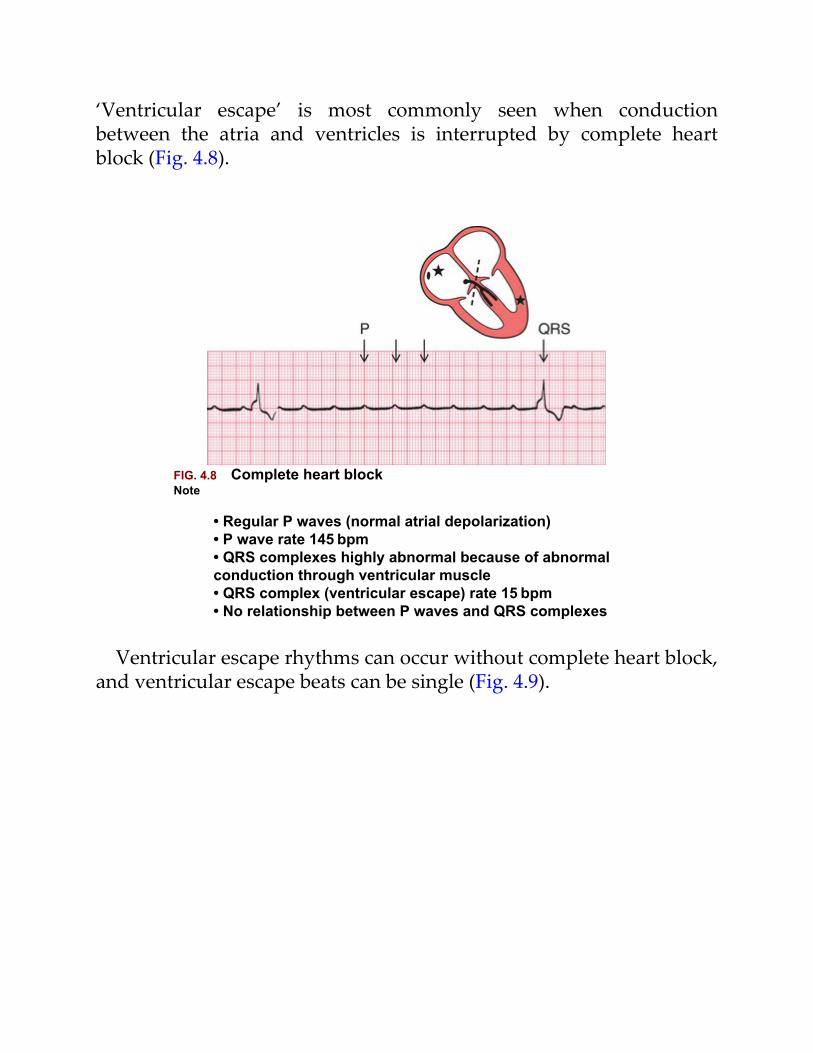
‘Ventricular escape’ is most commonly seen when conductionbetween the atria and ventricles is interrupted by complete heartblock (Fig. 4.8).
FIG. 4.8 Complete heart blockNote
• Regular P waves (normal atrial depolarization)• P wave rate 145 bpm• QRS complexes highly abnormal because of abnormalconduction through ventricular muscle• QRS complex (ventricular escape) rate 15 bpm• No relationship between P waves and QRS complexes
Ventricular escape rhythms can occur without complete heart block,and ventricular escape beats can be single (Fig. 4.9).
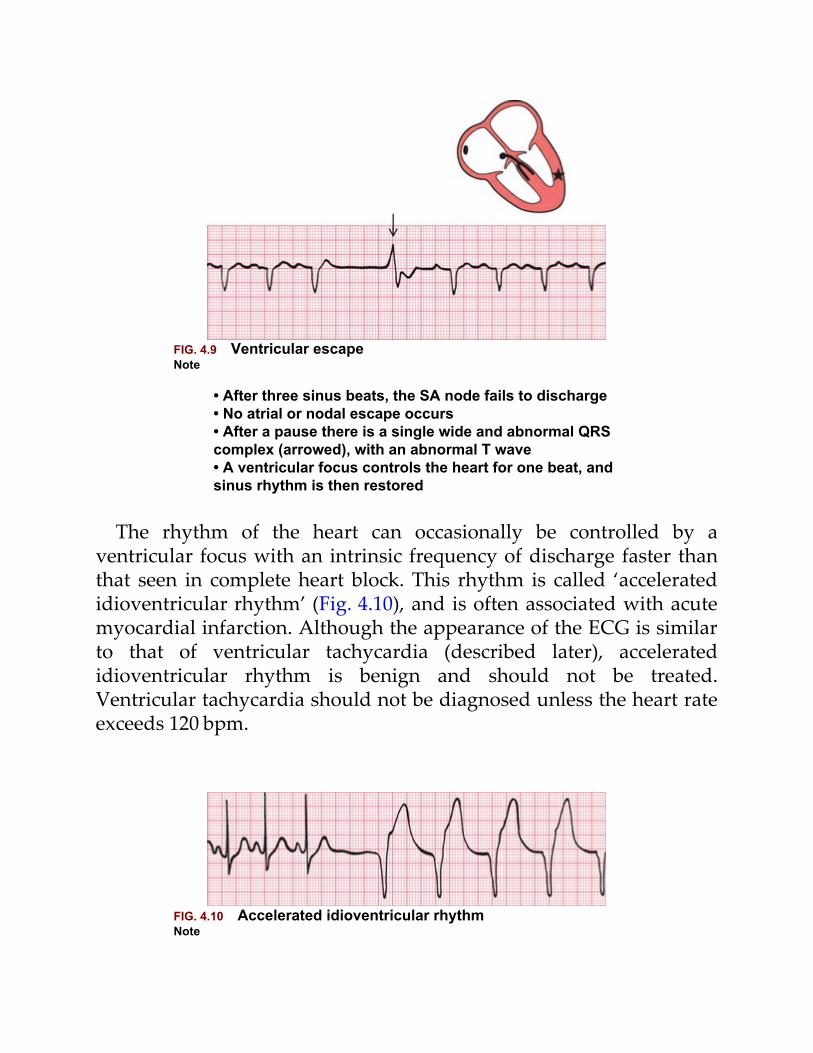
FIG. 4.9 Ventricular escapeNote
• After three sinus beats, the SA node fails to discharge• No atrial or nodal escape occurs• After a pause there is a single wide and abnormal QRScomplex (arrowed), with an abnormal T wave• A ventricular focus controls the heart for one beat, andsinus rhythm is then restored
The rhythm of the heart can occasionally be controlled by aventricular focus with an intrinsic frequency of discharge faster thanthat seen in complete heart block. This rhythm is called ‘acceleratedidioventricular rhythm’ (Fig. 4.10), and is often associated with acutemyocardial infarction. Although the appearance of the ECG is similarto that of ventricular tachycardia (described later), acceleratedidioventricular rhythm is benign and should not be treated.Ventricular tachycardia should not be diagnosed unless the heart rateexceeds 120 bpm.
FIG. 4.10 Accelerated idioventricular rhythmNote
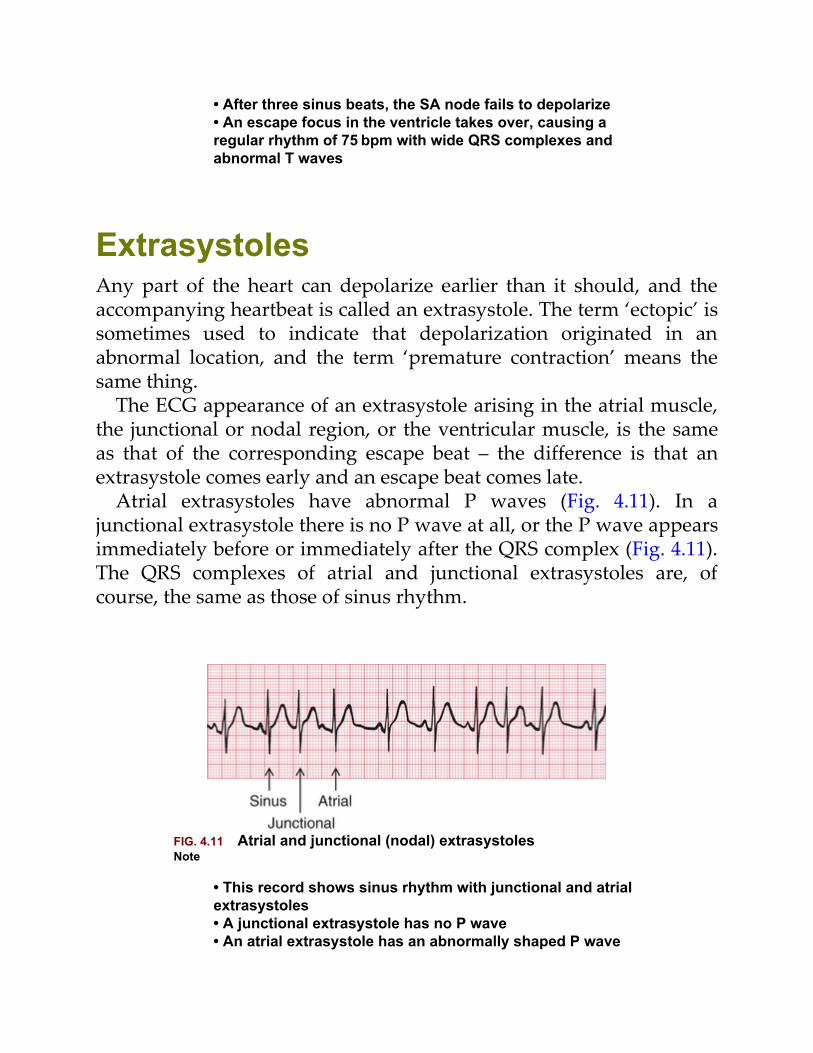
• After three sinus beats, the SA node fails to depolarize• An escape focus in the ventricle takes over, causing aregular rhythm of 75 bpm with wide QRS complexes andabnormal T waves
ExtrasystolesAny part of the heart can depolarize earlier than it should, and theaccompanying heartbeat is called an extrasystole. The term ‘ectopic’ issometimes used to indicate that depolarization originated in anabnormal location, and the term ‘premature contraction’ means thesame thing.
The ECG appearance of an extrasystole arising in the atrial muscle,the junctional or nodal region, or the ventricular muscle, is the sameas that of the corresponding escape beat – the difference is that anextrasystole comes early and an escape beat comes late.
Atrial extrasystoles have abnormal P waves (Fig. 4.11). In ajunctional extrasystole there is no P wave at all, or the P wave appearsimmediately before or immediately after the QRS complex (Fig. 4.11).The QRS complexes of atrial and junctional extrasystoles are, ofcourse, the same as those of sinus rhythm.
FIG. 4.11 Atrial and junctional (nodal) extrasystolesNote
• This record shows sinus rhythm with junctional and atrialextrasystoles• A junctional extrasystole has no P wave• An atrial extrasystole has an abnormally shaped P wave
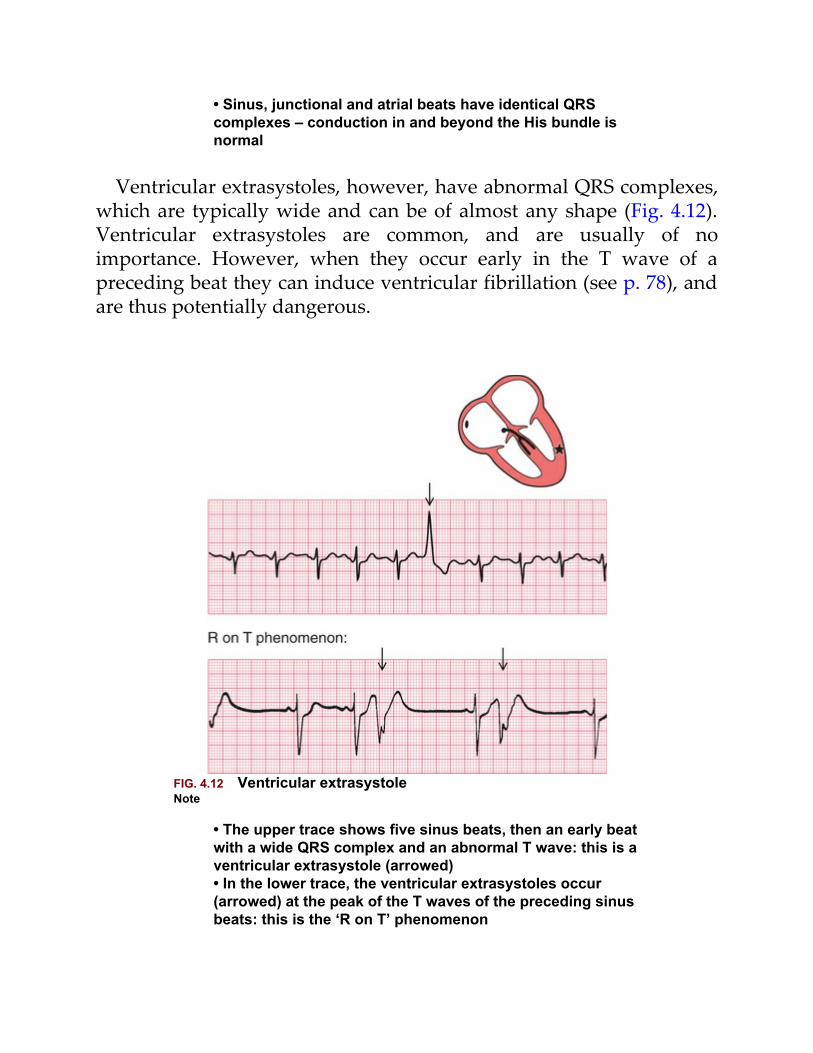
• Sinus, junctional and atrial beats have identical QRScomplexes – conduction in and beyond the His bundle isnormal
Ventricular extrasystoles, however, have abnormal QRS complexes,which are typically wide and can be of almost any shape (Fig. 4.12).Ventricular extrasystoles are common, and are usually of noimportance. However, when they occur early in the T wave of apreceding beat they can induce ventricular fibrillation (see p. 78), andare thus potentially dangerous.
FIG. 4.12 Ventricular extrasystoleNote
• The upper trace shows five sinus beats, then an early beatwith a wide QRS complex and an abnormal T wave: this is aventricular extrasystole (arrowed)• In the lower trace, the ventricular extrasystoles occur(arrowed) at the peak of the T waves of the preceding sinusbeats: this is the ‘R on T’ phenomenon
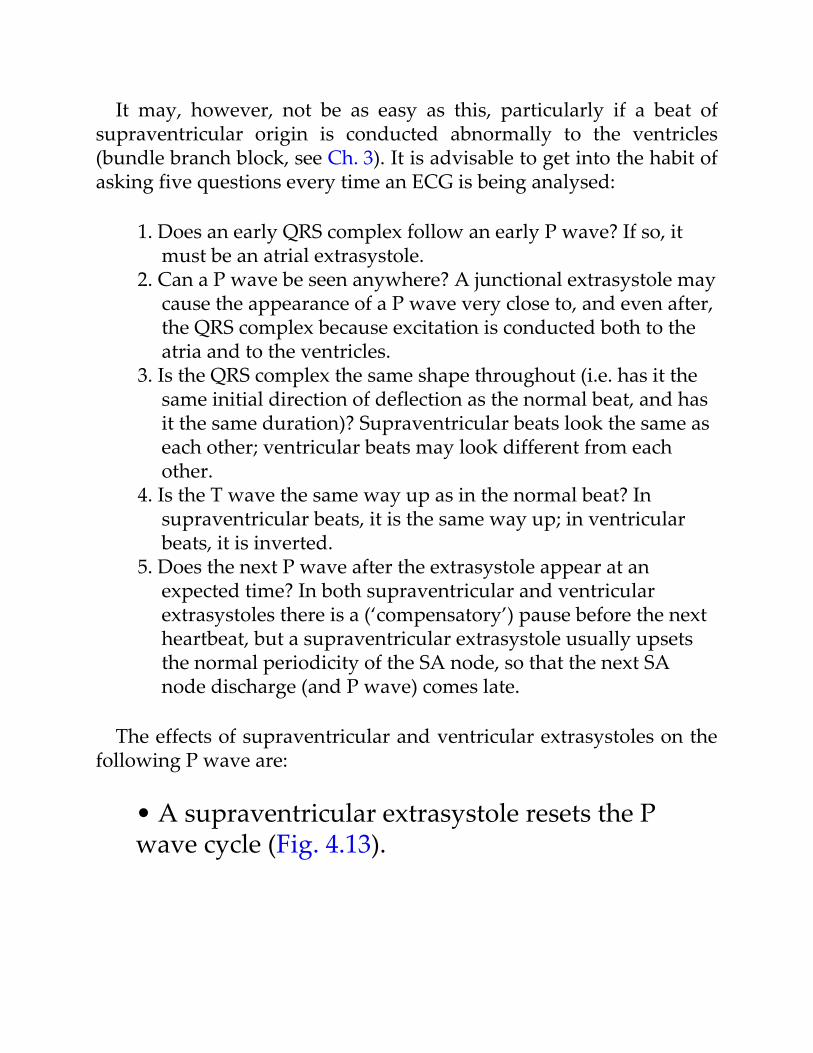
It may, however, not be as easy as this, particularly if a beat ofsupraventricular origin is conducted abnormally to the ventricles(bundle branch block, see Ch. 3). It is advisable to get into the habit ofasking five questions every time an ECG is being analysed:
1. Does an early QRS complex follow an early P wave? If so, itmust be an atrial extrasystole.
2. Can a P wave be seen anywhere? A junctional extrasystole maycause the appearance of a P wave very close to, and even after,the QRS complex because excitation is conducted both to theatria and to the ventricles.
3. Is the QRS complex the same shape throughout (i.e. has it thesame initial direction of deflection as the normal beat, and hasit the same duration)? Supraventricular beats look the same aseach other; ventricular beats may look different from eachother.
4. Is the T wave the same way up as in the normal beat? Insupraventricular beats, it is the same way up; in ventricularbeats, it is inverted.
5. Does the next P wave after the extrasystole appear at anexpected time? In both supraventricular and ventricularextrasystoles there is a (‘compensatory’) pause before the nextheartbeat, but a supraventricular extrasystole usually upsetsthe normal periodicity of the SA node, so that the next SAnode discharge (and P wave) comes late.
The effects of supraventricular and ventricular extrasystoles on thefollowing P wave are:
• A supraventricular extrasystole resets the Pwave cycle (Fig. 4.13).
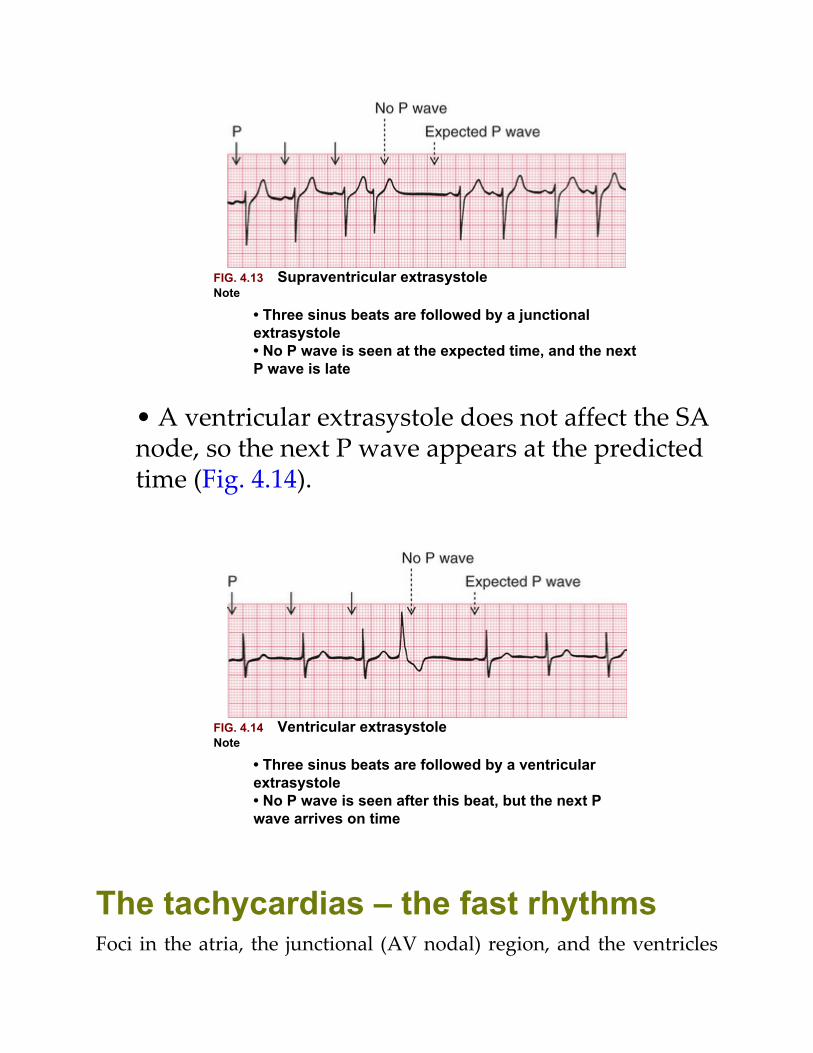
FIG. 4.13 Supraventricular extrasystoleNote
• Three sinus beats are followed by a junctionalextrasystole• No P wave is seen at the expected time, and the nextP wave is late
• A ventricular extrasystole does not affect the SAnode, so the next P wave appears at the predictedtime (Fig. 4.14).
FIG. 4.14 Ventricular extrasystoleNote
• Three sinus beats are followed by a ventricularextrasystole• No P wave is seen after this beat, but the next Pwave arrives on time
The tachycardias – the fast rhythmsFoci in the atria, the junctional (AV nodal) region, and the ventricles
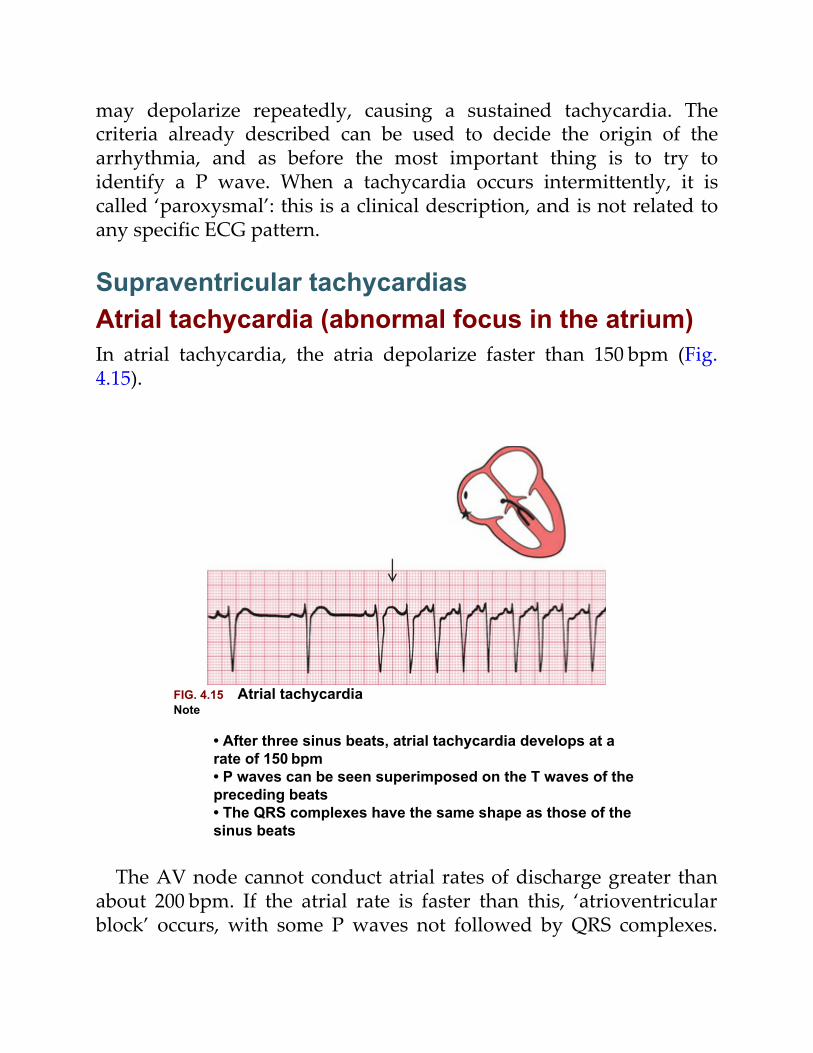
may depolarize repeatedly, causing a sustained tachycardia. Thecriteria already described can be used to decide the origin of thearrhythmia, and as before the most important thing is to try toidentify a P wave. When a tachycardia occurs intermittently, it iscalled ‘paroxysmal’: this is a clinical description, and is not related toany specific ECG pattern.
Supraventricular tachycardiasAtrial tachycardia (abnormal focus in the atrium)In atrial tachycardia, the atria depolarize faster than 150 bpm (Fig.4.15).
FIG. 4.15 Atrial tachycardiaNote
• After three sinus beats, atrial tachycardia develops at arate of 150 bpm• P waves can be seen superimposed on the T waves of thepreceding beats• The QRS complexes have the same shape as those of thesinus beats
The AV node cannot conduct atrial rates of discharge greater thanabout 200 bpm. If the atrial rate is faster than this, ‘atrioventricularblock’ occurs, with some P waves not followed by QRS complexes.
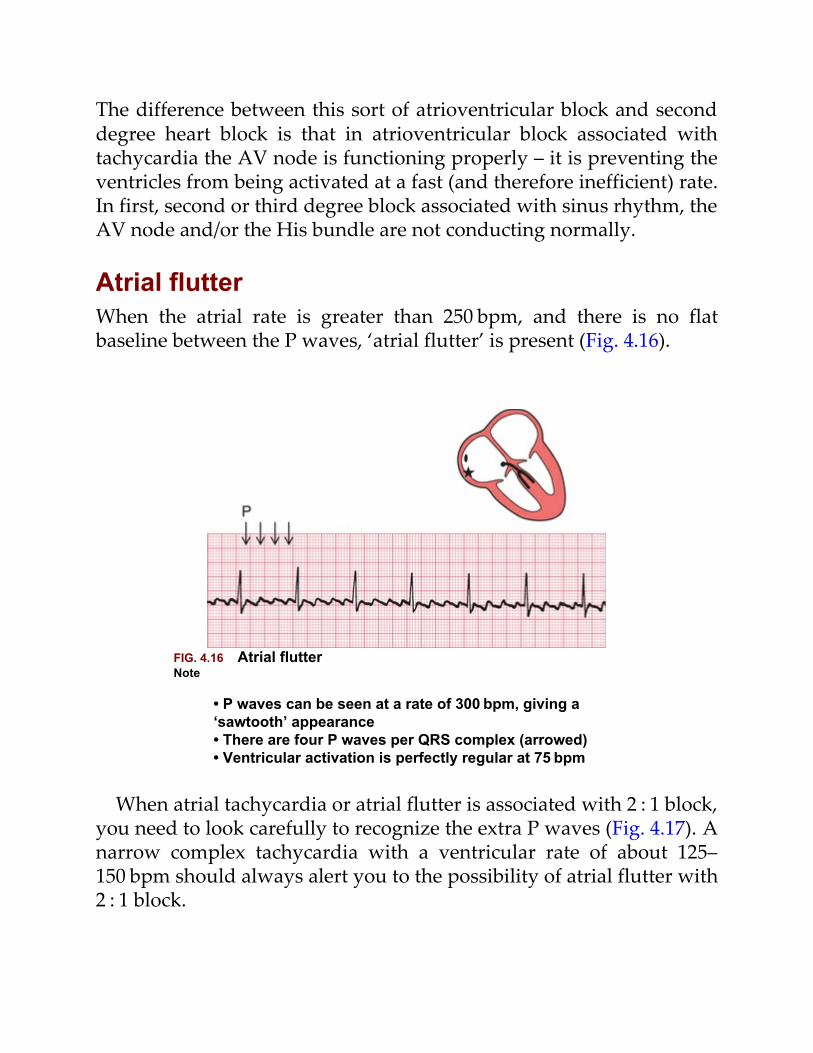
The difference between this sort of atrioventricular block and seconddegree heart block is that in atrioventricular block associated withtachycardia the AV node is functioning properly – it is preventing theventricles from being activated at a fast (and therefore inefficient) rate.In first, second or third degree block associated with sinus rhythm, theAV node and/or the His bundle are not conducting normally.
Atrial flutterWhen the atrial rate is greater than 250 bpm, and there is no flatbaseline between the P waves, ‘atrial flutter’ is present (Fig. 4.16).
FIG. 4.16 Atrial flutterNote
• P waves can be seen at a rate of 300 bpm, giving a‘sawtooth’ appearance• There are four P waves per QRS complex (arrowed)• Ventricular activation is perfectly regular at 75 bpm
When atrial tachycardia or atrial flutter is associated with 2 : 1 block,you need to look carefully to recognize the extra P waves (Fig. 4.17). Anarrow complex tachycardia with a ventricular rate of about 125–150 bpm should always alert you to the possibility of atrial flutter with2 : 1 block.
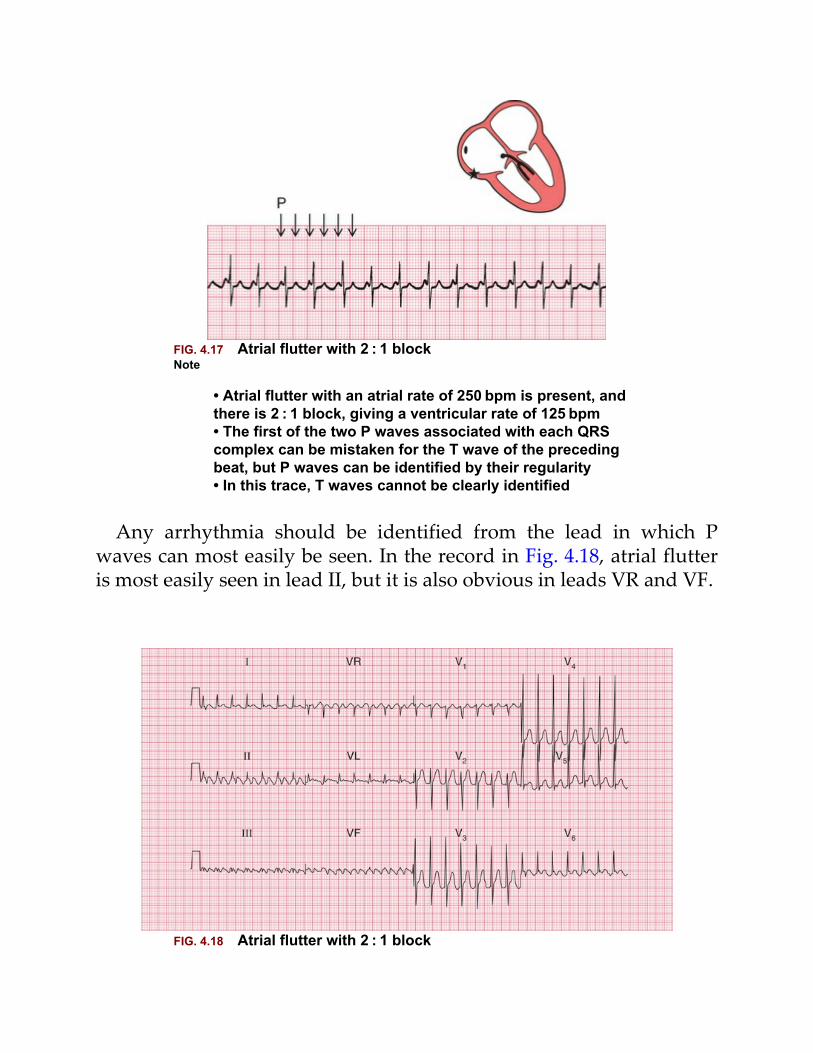
FIG. 4.17 Atrial flutter with 2 : 1 blockNote
• Atrial flutter with an atrial rate of 250 bpm is present, andthere is 2 : 1 block, giving a ventricular rate of 125 bpm• The first of the two P waves associated with each QRScomplex can be mistaken for the T wave of the precedingbeat, but P waves can be identified by their regularity• In this trace, T waves cannot be clearly identified
Any arrhythmia should be identified from the lead in which Pwaves can most easily be seen. In the record in Fig. 4.18, atrial flutteris most easily seen in lead II, but it is also obvious in leads VR and VF.
FIG. 4.18 Atrial flutter with 2 : 1 block
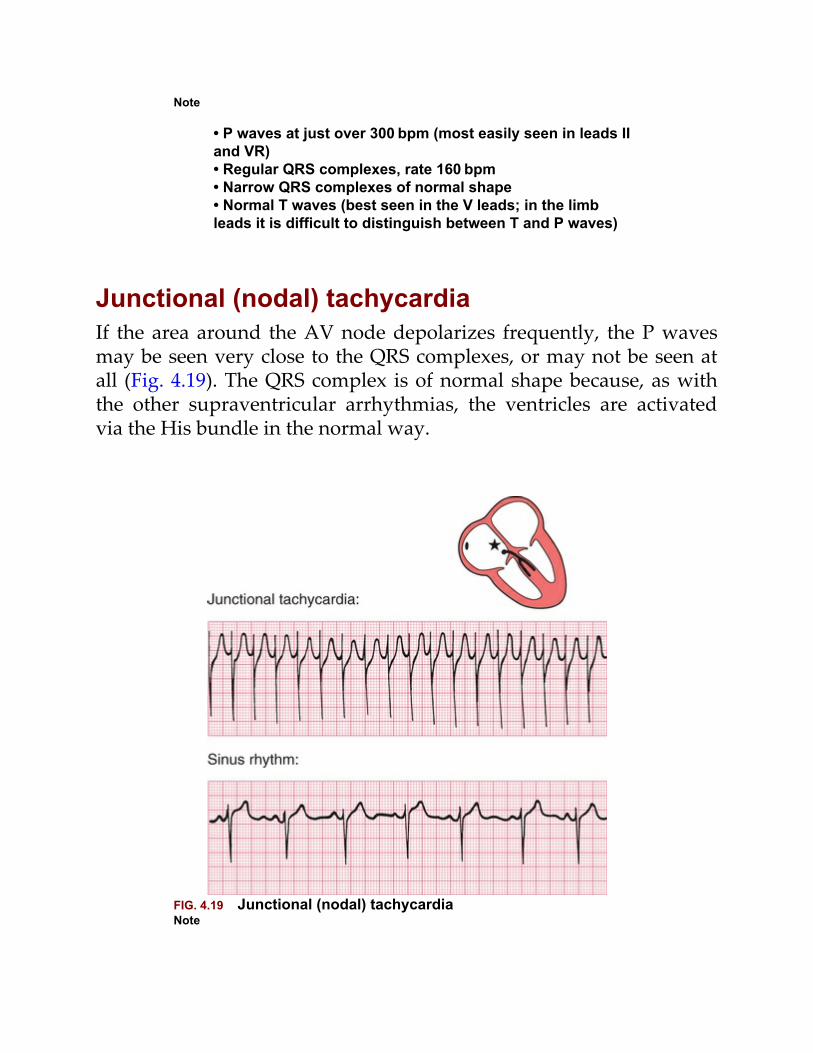
Note
• P waves at just over 300 bpm (most easily seen in leads IIand VR)• Regular QRS complexes, rate 160 bpm• Narrow QRS complexes of normal shape• Normal T waves (best seen in the V leads; in the limbleads it is difficult to distinguish between T and P waves)
Junctional (nodal) tachycardiaIf the area around the AV node depolarizes frequently, the P wavesmay be seen very close to the QRS complexes, or may not be seen atall (Fig. 4.19). The QRS complex is of normal shape because, as withthe other supraventricular arrhythmias, the ventricles are activatedvia the His bundle in the normal way.
FIG. 4.19 Junctional (nodal) tachycardiaNote
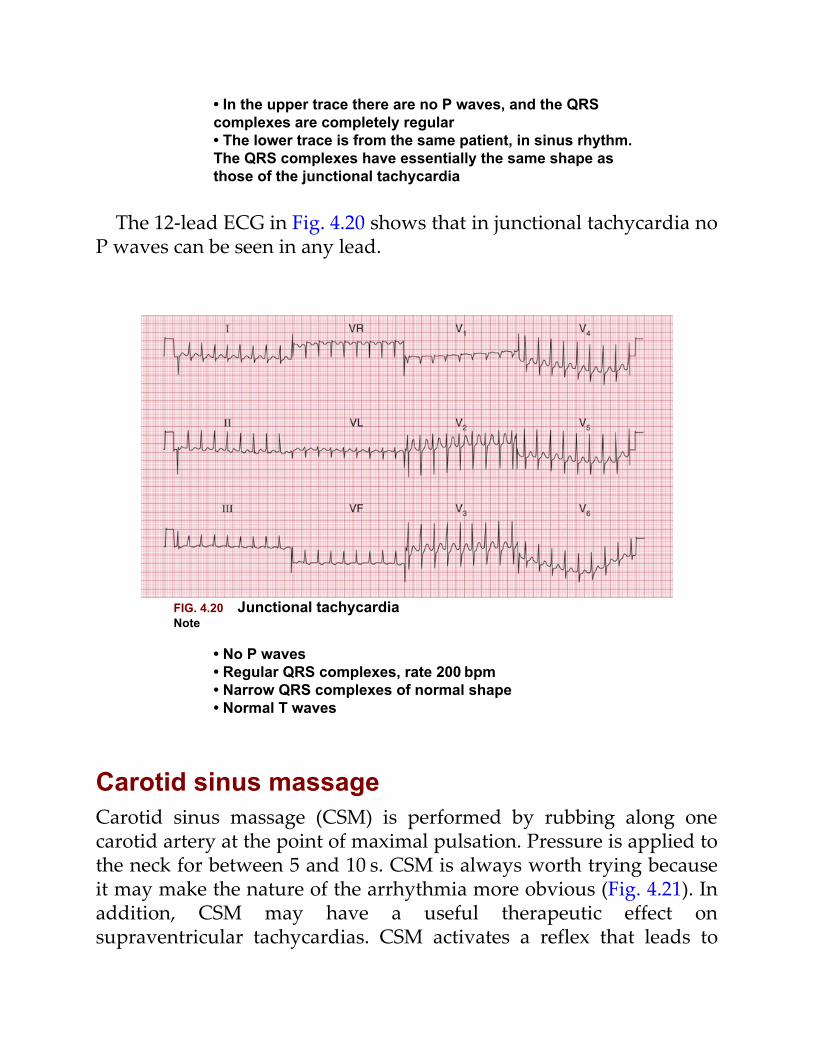
• In the upper trace there are no P waves, and the QRScomplexes are completely regular• The lower trace is from the same patient, in sinus rhythm.The QRS complexes have essentially the same shape asthose of the junctional tachycardia
The 12-lead ECG in Fig. 4.20 shows that in junctional tachycardia noP waves can be seen in any lead.
FIG. 4.20 Junctional tachycardiaNote
• No P waves• Regular QRS complexes, rate 200 bpm• Narrow QRS complexes of normal shape• Normal T waves
Carotid sinus massageCarotid sinus massage (CSM) is performed by rubbing along onecarotid artery at the point of maximal pulsation. Pressure is applied tothe neck for between 5 and 10 s. CSM is always worth trying becauseit may make the nature of the arrhythmia more obvious (Fig. 4.21). Inaddition, CSM may have a useful therapeutic effect onsupraventricular tachycardias. CSM activates a reflex that leads to
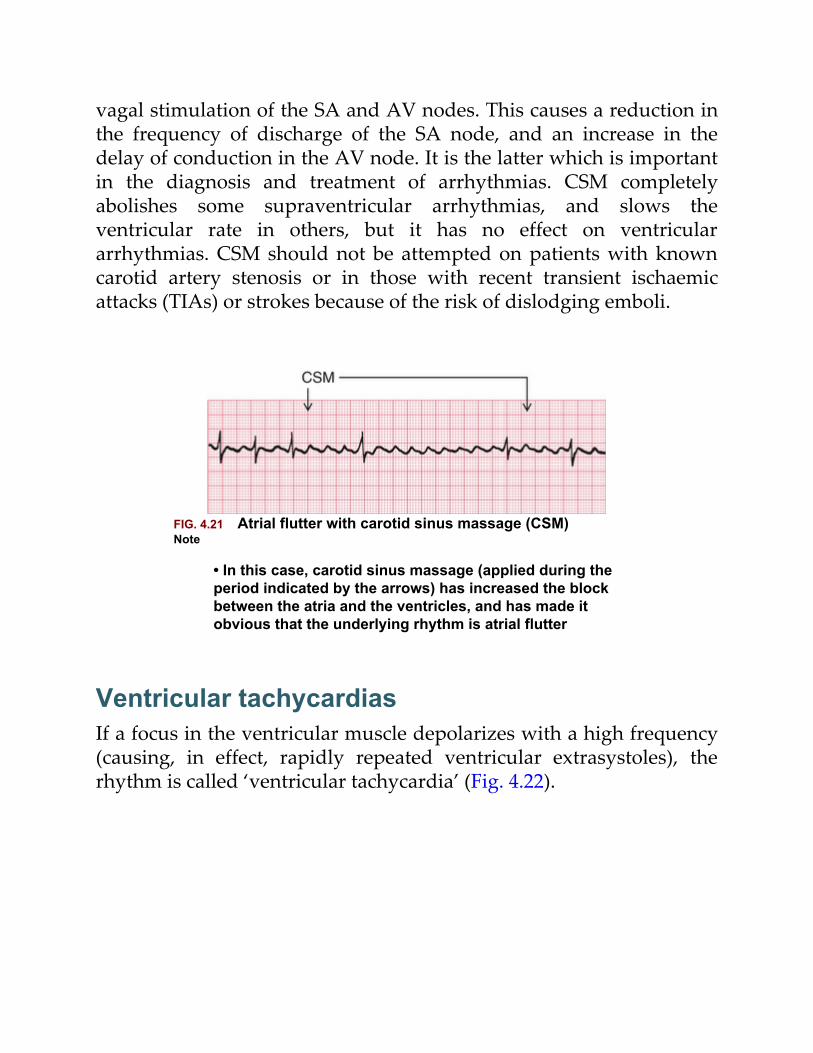
vagal stimulation of the SA and AV nodes. This causes a reduction inthe frequency of discharge of the SA node, and an increase in thedelay of conduction in the AV node. It is the latter which is importantin the diagnosis and treatment of arrhythmias. CSM completelyabolishes some supraventricular arrhythmias, and slows theventricular rate in others, but it has no effect on ventriculararrhythmias. CSM should not be attempted on patients with knowncarotid artery stenosis or in those with recent transient ischaemicattacks (TIAs) or strokes because of the risk of dislodging emboli.
FIG. 4.21 Atrial flutter with carotid sinus massage (CSM)Note
• In this case, carotid sinus massage (applied during theperiod indicated by the arrows) has increased the blockbetween the atria and the ventricles, and has made itobvious that the underlying rhythm is atrial flutter
Ventricular tachycardiasIf a focus in the ventricular muscle depolarizes with a high frequency(causing, in effect, rapidly repeated ventricular extrasystoles), therhythm is called ‘ventricular tachycardia’ (Fig. 4.22).
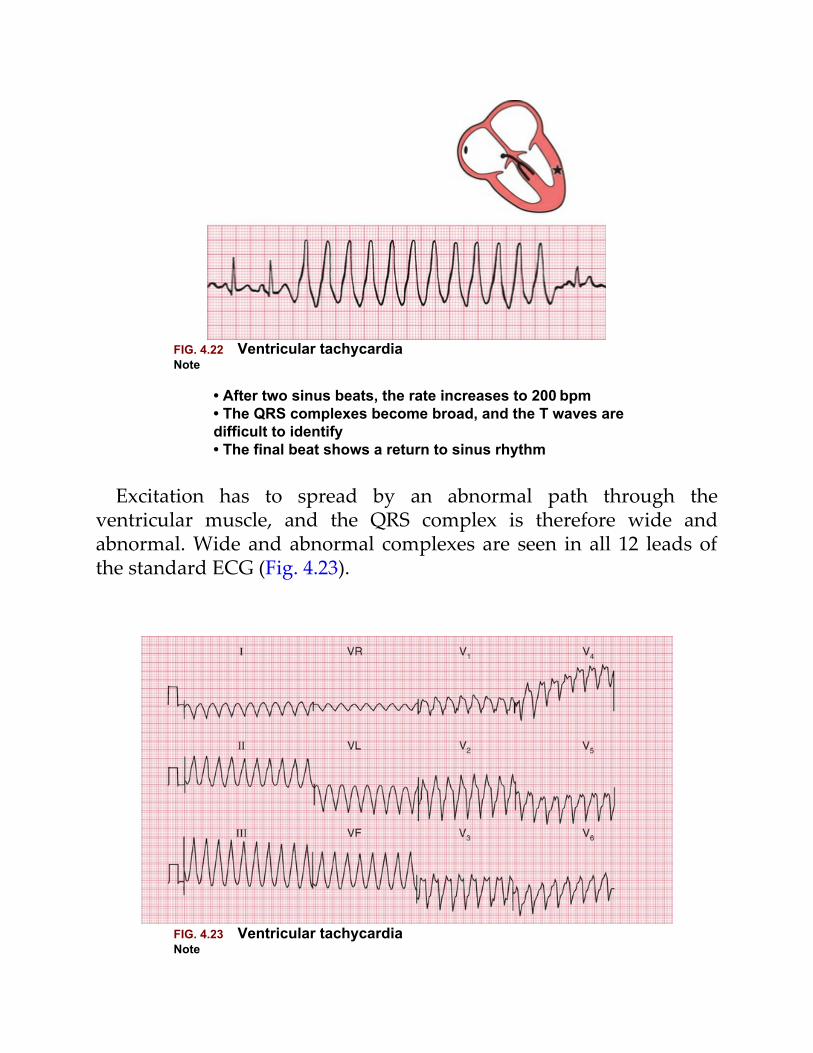
FIG. 4.22 Ventricular tachycardiaNote
• After two sinus beats, the rate increases to 200 bpm• The QRS complexes become broad, and the T waves aredifficult to identify• The final beat shows a return to sinus rhythm
Excitation has to spread by an abnormal path through theventricular muscle, and the QRS complex is therefore wide andabnormal. Wide and abnormal complexes are seen in all 12 leads ofthe standard ECG (Fig. 4.23).
FIG. 4.23 Ventricular tachycardiaNote
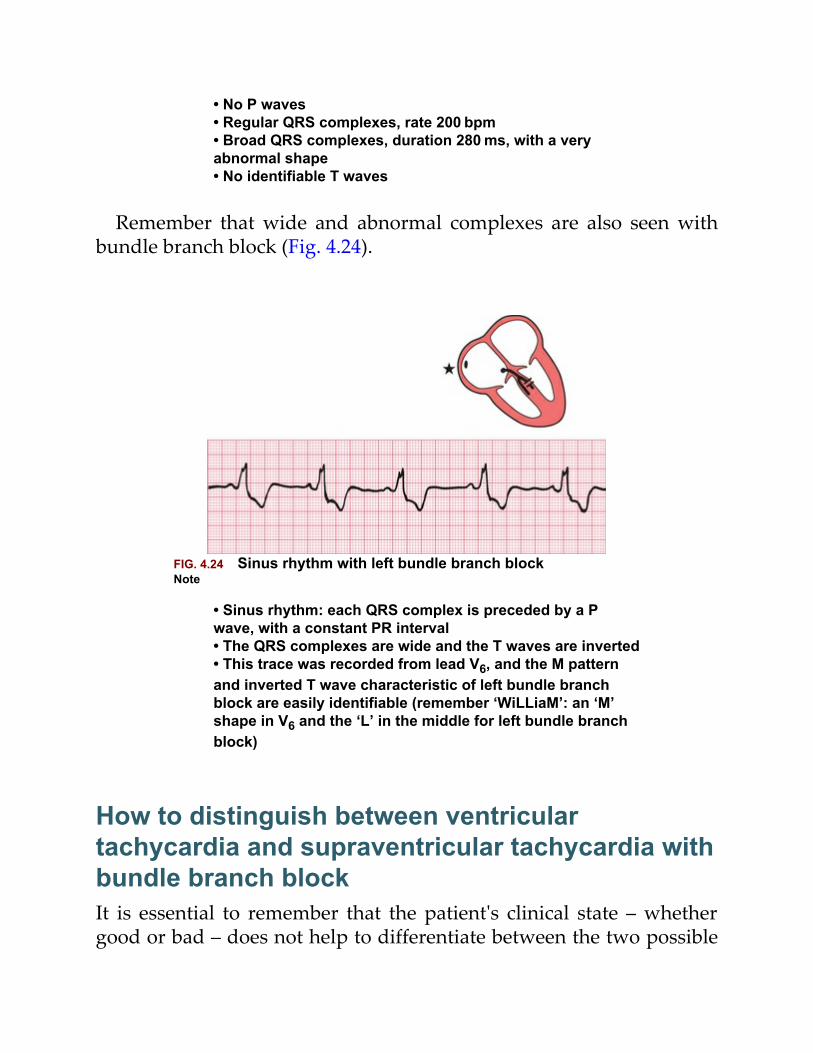
• No P waves• Regular QRS complexes, rate 200 bpm• Broad QRS complexes, duration 280 ms, with a veryabnormal shape• No identifiable T waves
Remember that wide and abnormal complexes are also seen withbundle branch block (Fig. 4.24).
FIG. 4.24 Sinus rhythm with left bundle branch blockNote
• Sinus rhythm: each QRS complex is preceded by a Pwave, with a constant PR interval• The QRS complexes are wide and the T waves are inverted• This trace was recorded from lead V6, and the M patternand inverted T wave characteristic of left bundle branchblock are easily identifiable (remember ‘WiLLiaM’: an ‘M’shape in V6 and the ‘L’ in the middle for left bundle branchblock)
How to distinguish between ventriculartachycardia and supraventricular tachycardia withbundle branch blockIt is essential to remember that the patient's clinical state – whethergood or bad – does not help to differentiate between the two possible
causes of a tachycardia with broad QRS complexes. If a patient withan acute myocardial infarction has broad complex tachycardia, it willalmost always be ventricular tachycardia. However, a patient withepisodes of broad complex tachycardia but without an infarctioncould have ventricular tachycardia, or supraventricular tachycardiawith bundle branch block or the WPW syndrome (see p. 80). Undersuch circumstances, the following points may be helpful:
1. Finding P waves and seeing how they relate to the QRScomplexes is always the key to identifying arrhythmias.Always look carefully at a full 12-lead ECG.
2. If possible, compare the QRS complex during the tachycardiawith that during sinus rhythm. If the patient has bundlebranch block when in sinus rhythm, the QRS complex duringthe tachycardia will have the same shape as during normalrhythm.
3. If the QRS complex is wider than 4 small squares (160 ms), therhythm will probably be ventricular in origin.
4. Left axis deviation during the tachycardia usually indicates aventricular origin, as does any change of axis compared with arecord taken during sinus rhythm.
5. If during the tachycardia the QRS complex is very irregular,the rhythm is probably atrial fibrillation with bundle branchblock or atrial fibrillation with WPW syndrome (see below).
FibrillationAll the arrhythmias discussed so far have involved the synchronouscontraction of all the muscle fibres of the atria or of the ventricles,albeit at abnormal speeds. When individual muscle fibres contractindependently, they are said to be ‘fibrillating’. Fibrillation can occurin the atrial or ventricular muscle.
Atrial fibrillation
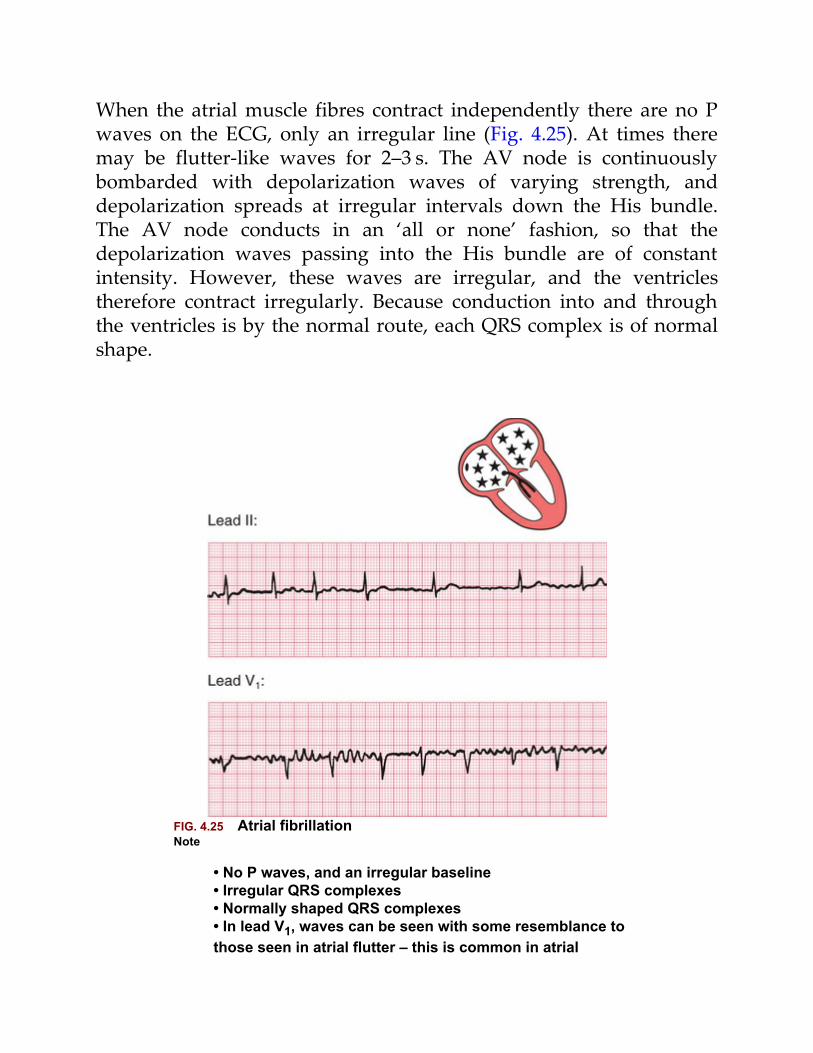
When the atrial muscle fibres contract independently there are no Pwaves on the ECG, only an irregular line (Fig. 4.25). At times theremay be flutter-like waves for 2–3 s. The AV node is continuouslybombarded with depolarization waves of varying strength, anddepolarization spreads at irregular intervals down the His bundle.The AV node conducts in an ‘all or none’ fashion, so that thedepolarization waves passing into the His bundle are of constantintensity. However, these waves are irregular, and the ventriclestherefore contract irregularly. Because conduction into and throughthe ventricles is by the normal route, each QRS complex is of normalshape.
FIG. 4.25 Atrial fibrillationNote
• No P waves, and an irregular baseline• Irregular QRS complexes• Normally shaped QRS complexes• In lead V1, waves can be seen with some resemblance tothose seen in atrial flutter – this is common in atrial
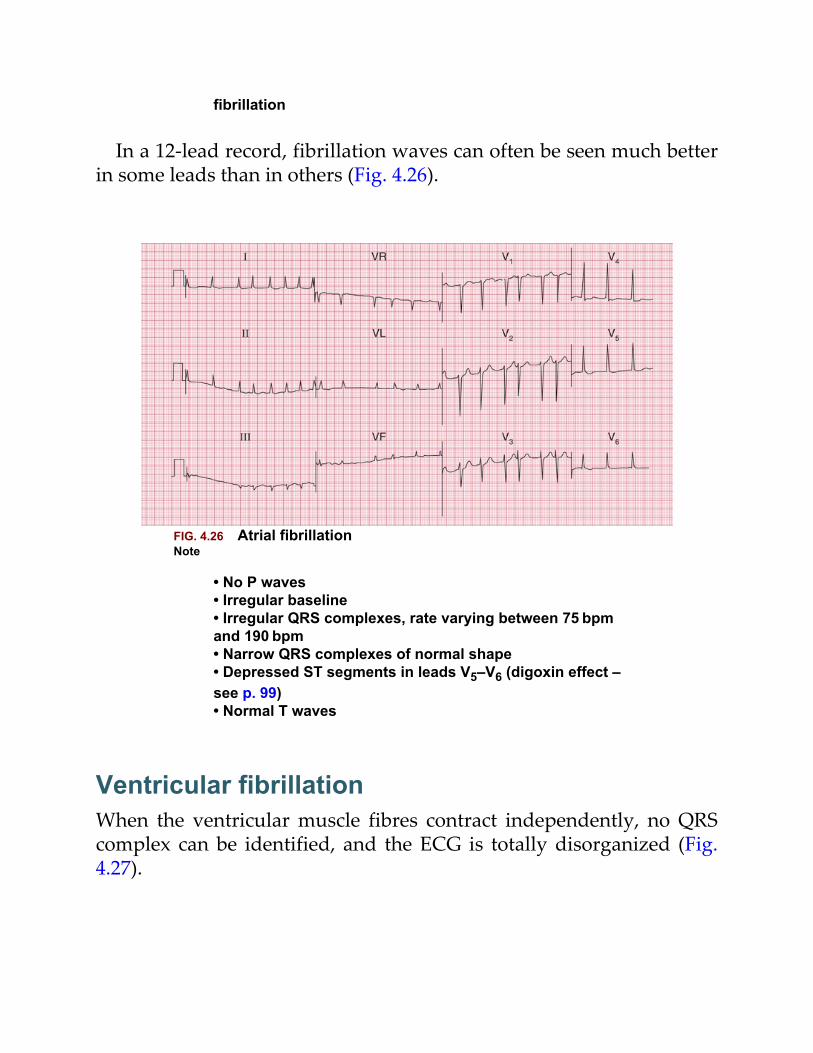
fibrillation
In a 12-lead record, fibrillation waves can often be seen much betterin some leads than in others (Fig. 4.26).
FIG. 4.26 Atrial fibrillationNote
• No P waves• Irregular baseline• Irregular QRS complexes, rate varying between 75 bpmand 190 bpm• Narrow QRS complexes of normal shape• Depressed ST segments in leads V5–V6 (digoxin effect –see p. 99)• Normal T waves
Ventricular fibrillationWhen the ventricular muscle fibres contract independently, no QRScomplex can be identified, and the ECG is totally disorganized (Fig.4.27).
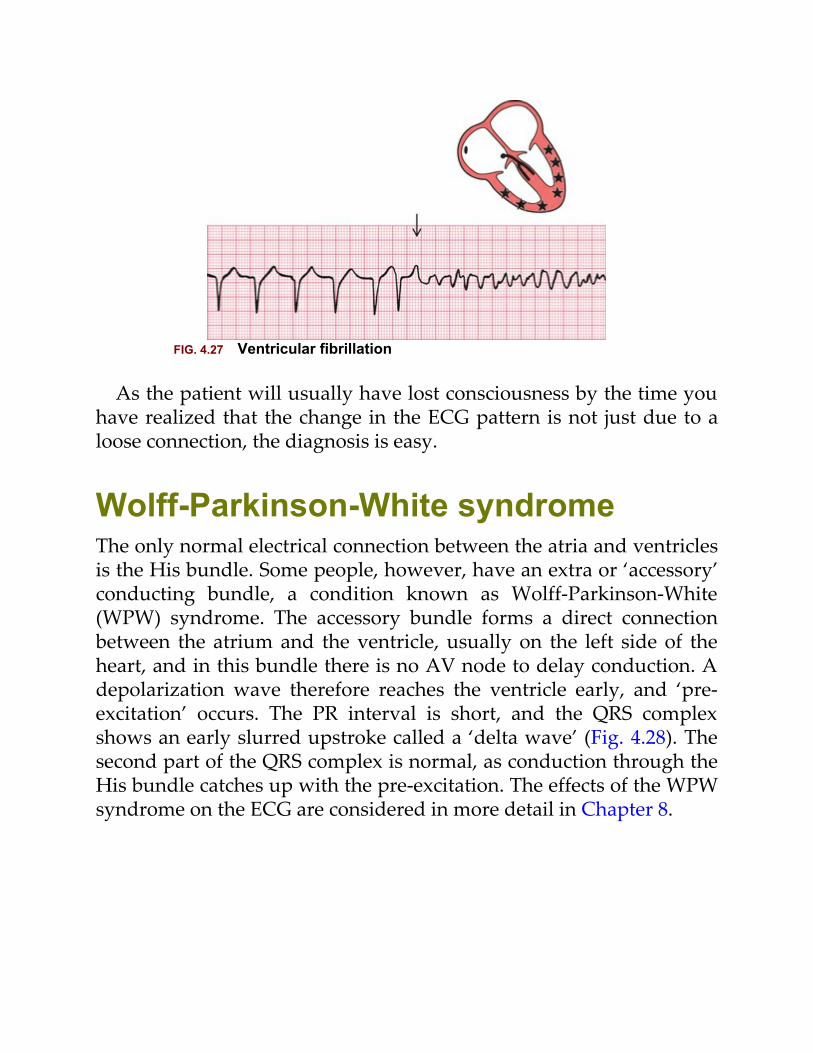
FIG. 4.27 Ventricular fibrillation
As the patient will usually have lost consciousness by the time youhave realized that the change in the ECG pattern is not just due to aloose connection, the diagnosis is easy.
Wolff-Parkinson-White syndromeThe only normal electrical connection between the atria and ventriclesis the His bundle. Some people, however, have an extra or ‘accessory’conducting bundle, a condition known as Wolff-Parkinson-White(WPW) syndrome. The accessory bundle forms a direct connectionbetween the atrium and the ventricle, usually on the left side of theheart, and in this bundle there is no AV node to delay conduction. Adepolarization wave therefore reaches the ventricle early, and ‘pre-excitation’ occurs. The PR interval is short, and the QRS complexshows an early slurred upstroke called a ‘delta wave’ (Fig. 4.28). Thesecond part of the QRS complex is normal, as conduction through theHis bundle catches up with the pre-excitation. The effects of the WPWsyndrome on the ECG are considered in more detail in Chapter 8.
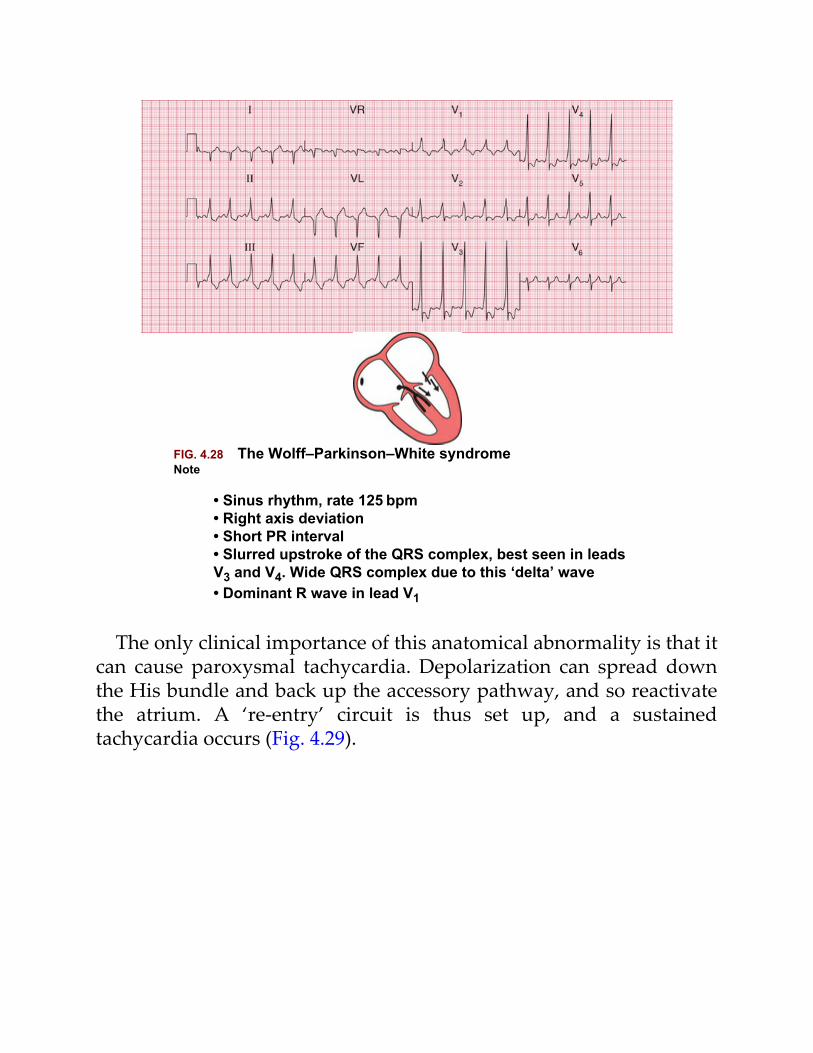
FIG. 4.28 The Wolff–Parkinson–White syndromeNote
• Sinus rhythm, rate 125 bpm• Right axis deviation• Short PR interval• Slurred upstroke of the QRS complex, best seen in leadsV3 and V4. Wide QRS complex due to this ‘delta’ wave• Dominant R wave in lead V1
The only clinical importance of this anatomical abnormality is that itcan cause paroxysmal tachycardia. Depolarization can spread downthe His bundle and back up the accessory pathway, and so reactivatethe atrium. A ‘re-entry’ circuit is thus set up, and a sustainedtachycardia occurs (Fig. 4.29).
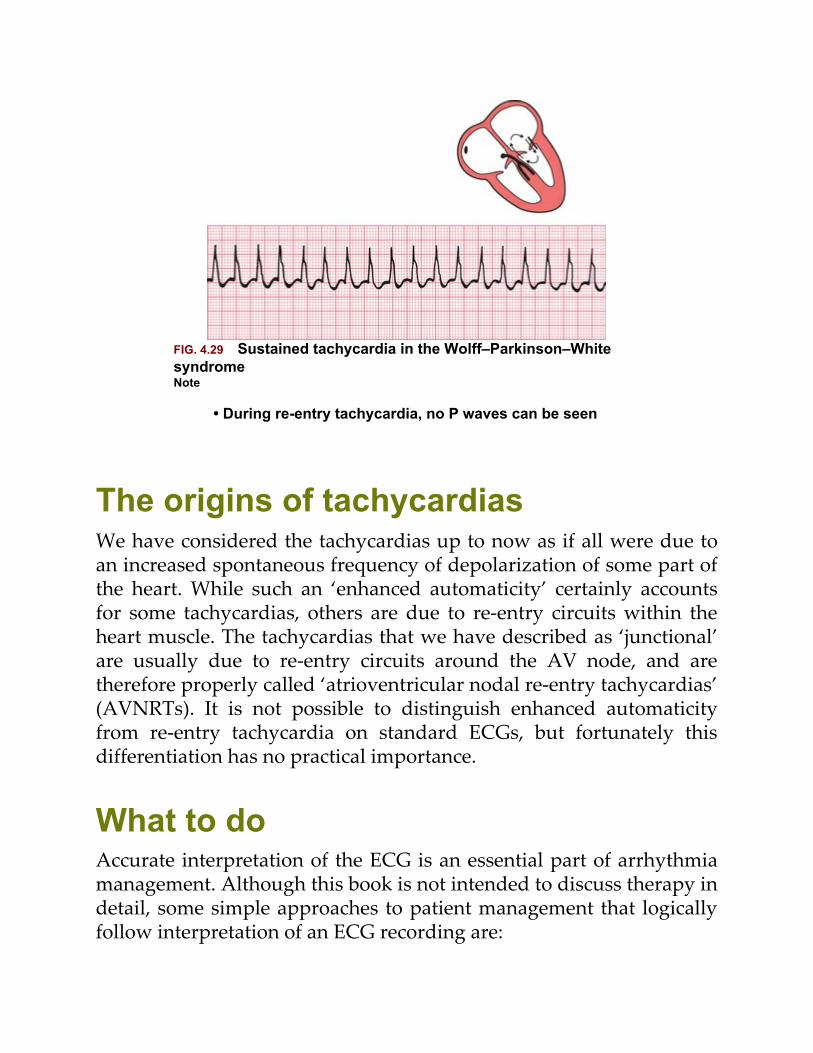
FIG. 4.29 Sustained tachycardia in the Wolff–Parkinson–WhitesyndromeNote
• During re-entry tachycardia, no P waves can be seen
The origins of tachycardiasWe have considered the tachycardias up to now as if all were due toan increased spontaneous frequency of depolarization of some part ofthe heart. While such an ‘enhanced automaticity’ certainly accountsfor some tachycardias, others are due to re-entry circuits within theheart muscle. The tachycardias that we have described as ‘junctional’are usually due to re-entry circuits around the AV node, and aretherefore properly called ‘atrioventricular nodal re-entry tachycardias’(AVNRTs). It is not possible to distinguish enhanced automaticityfrom re-entry tachycardia on standard ECGs, but fortunately thisdifferentiation has no practical importance.
What to doAccurate interpretation of the ECG is an essential part of arrhythmiamanagement. Although this book is not intended to discuss therapy indetail, some simple approaches to patient management that logicallyfollow interpretation of an ECG recording are:
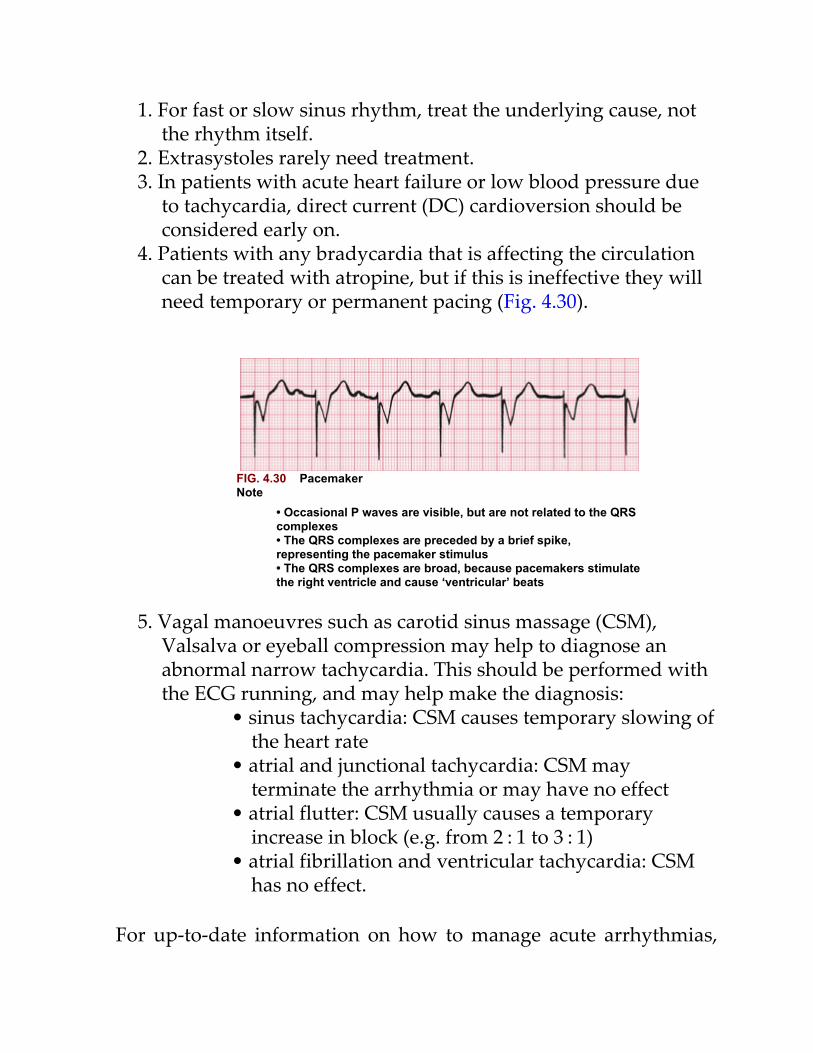
1. For fast or slow sinus rhythm, treat the underlying cause, notthe rhythm itself.
2. Extrasystoles rarely need treatment.3. In patients with acute heart failure or low blood pressure due
to tachycardia, direct current (DC) cardioversion should beconsidered early on.
4. Patients with any bradycardia that is affecting the circulationcan be treated with atropine, but if this is ineffective they willneed temporary or permanent pacing (Fig. 4.30).
FIG. 4.30 PacemakerNote
• Occasional P waves are visible, but are not related to the QRScomplexes• The QRS complexes are preceded by a brief spike,representing the pacemaker stimulus• The QRS complexes are broad, because pacemakers stimulatethe right ventricle and cause ‘ventricular’ beats
5. Vagal manoeuvres such as carotid sinus massage (CSM),Valsalva or eyeball compression may help to diagnose anabnormal narrow tachycardia. This should be performed withthe ECG running, and may help make the diagnosis:
• sinus tachycardia: CSM causes temporary slowing ofthe heart rate
• atrial and junctional tachycardia: CSM mayterminate the arrhythmia or may have no effect
• atrial flutter: CSM usually causes a temporaryincrease in block (e.g. from 2 : 1 to 3 : 1)
• atrial fibrillation and ventricular tachycardia: CSMhas no effect.
For up-to-date information on how to manage acute arrhythmias,
see current resuscitation council guidelines https://www.resus.org.uk.
RemindersAbnormal Cardiac Rhythms
• Most parts of the heart are capable of spontaneousdepolarization.
• Abnormal rhythms can arise in the atrial muscle, the regionaround the AV node (the junctional region) and in theventricular muscle.
• Escape rhythms are slow and are protective.• Occasional early depolarization of any part of the heart causes
an extrasystole.• Frequent depolarization of any part of the heart causes
tachycardia.• Asynchronous contraction of muscle fibres in the atria or
ventricles is called fibrillation.• Apart from the rate, the ECG patterns of an escape rhythm, an
extrasystole and a tachycardia arising in any one part of theheart are the same.
• All supraventricular rhythms have normal QRS complexes,provided there is no bundle branch block or pre-excitation(WPW) syndrome.
• Ventricular rhythms cause wide and abnormal QRS complexes,and abnormal T waves.
The Identification of RhythmAbnormalitiesRecognizing ECG abnormalities is, to a large extent, like recognizing
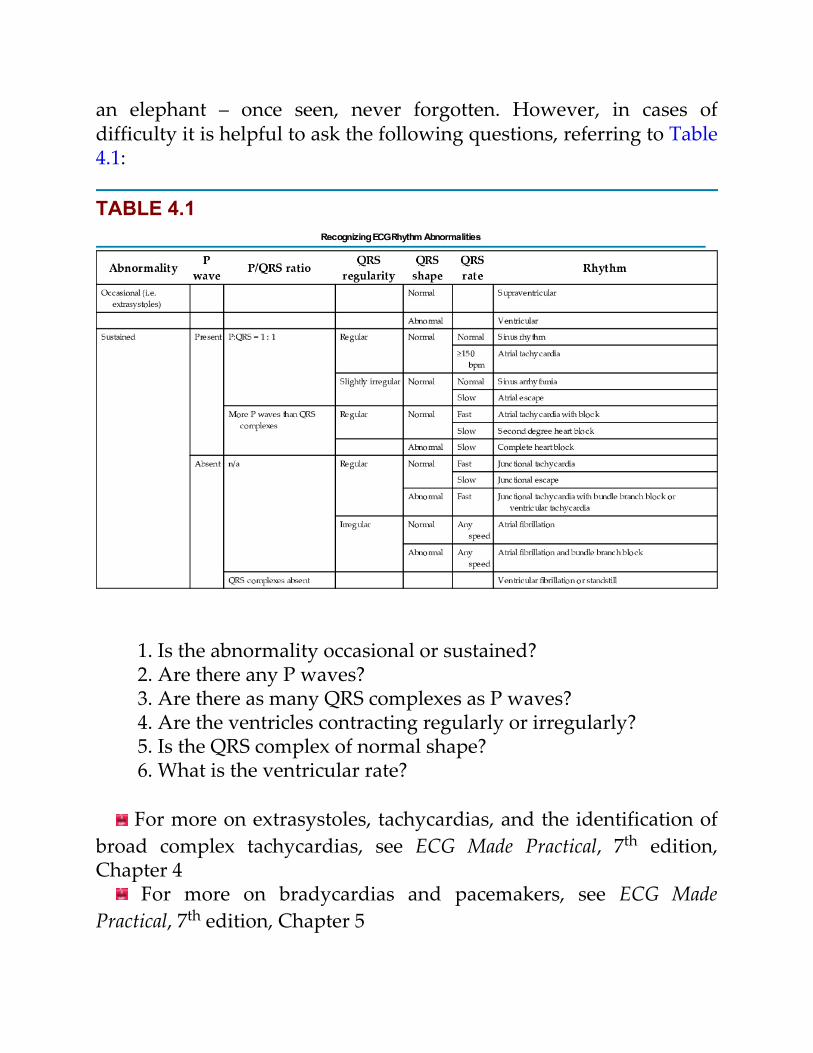
an elephant – once seen, never forgotten. However, in cases ofdifficulty it is helpful to ask the following questions, referring to Table4.1:
TABLE 4.1
1. Is the abnormality occasional or sustained?2. Are there any P waves?3. Are there as many QRS complexes as P waves?4. Are the ventricles contracting regularly or irregularly?5. Is the QRS complex of normal shape?6. What is the ventricular rate?
For more on extrasystoles, tachycardias, and the identification ofbroad complex tachycardias, see ECG Made Practical, 7th edition,Chapter 4
For more on bradycardias and pacemakers, see ECG MadePractical, 7th edition, Chapter 5
For more on WPW, see Chapter 8 in this book and ECG MadePractical, 7th edition, Chapter 3
5
Abnormalities of P waves, QRScomplexes and T waves
Abnormalities of the P wave 86Abnormalities of the QRS complex 86
Abnormalities of the width of the QRScomplex 87Increased height of the QRS complex 87The origin of Q waves 89
Abnormalities of the ST segment 95Abnormalities of the T wave 96
Inversion of the T wave 96Myocardial infarction 96Ventricular hypertrophy 99Bundle branch block 99Digoxin 99
Other abnormalities of the ST segment and the Twave 99
Electrolyte abnormalities 99Nonspecific changes 99
When interpreting an ECG, identify the rhythm first. Then ask thefollowing questions (remember ‘R R P W Q S T’ from Chapter 1) –always in the same sequence:
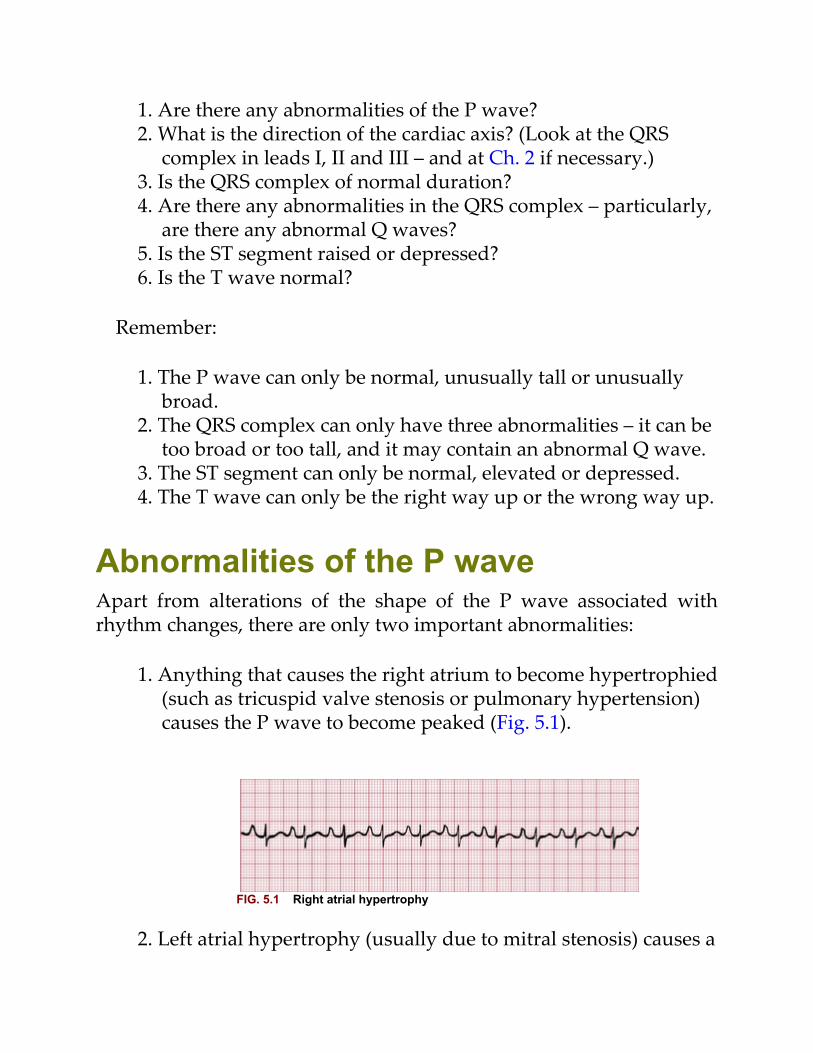
1. Are there any abnormalities of the P wave?2. What is the direction of the cardiac axis? (Look at the QRS
complex in leads I, II and III – and at Ch. 2 if necessary.)3. Is the QRS complex of normal duration?4. Are there any abnormalities in the QRS complex – particularly,
are there any abnormal Q waves?5. Is the ST segment raised or depressed?6. Is the T wave normal?
Remember:
1. The P wave can only be normal, unusually tall or unusuallybroad.
2. The QRS complex can only have three abnormalities – it can betoo broad or too tall, and it may contain an abnormal Q wave.
3. The ST segment can only be normal, elevated or depressed.4. The T wave can only be the right way up or the wrong way up.
Abnormalities of the P waveApart from alterations of the shape of the P wave associated withrhythm changes, there are only two important abnormalities:
1. Anything that causes the right atrium to become hypertrophied(such as tricuspid valve stenosis or pulmonary hypertension)causes the P wave to become peaked (Fig. 5.1).
FIG. 5.1 Right atrial hypertrophy
2. Left atrial hypertrophy (usually due to mitral stenosis) causes a
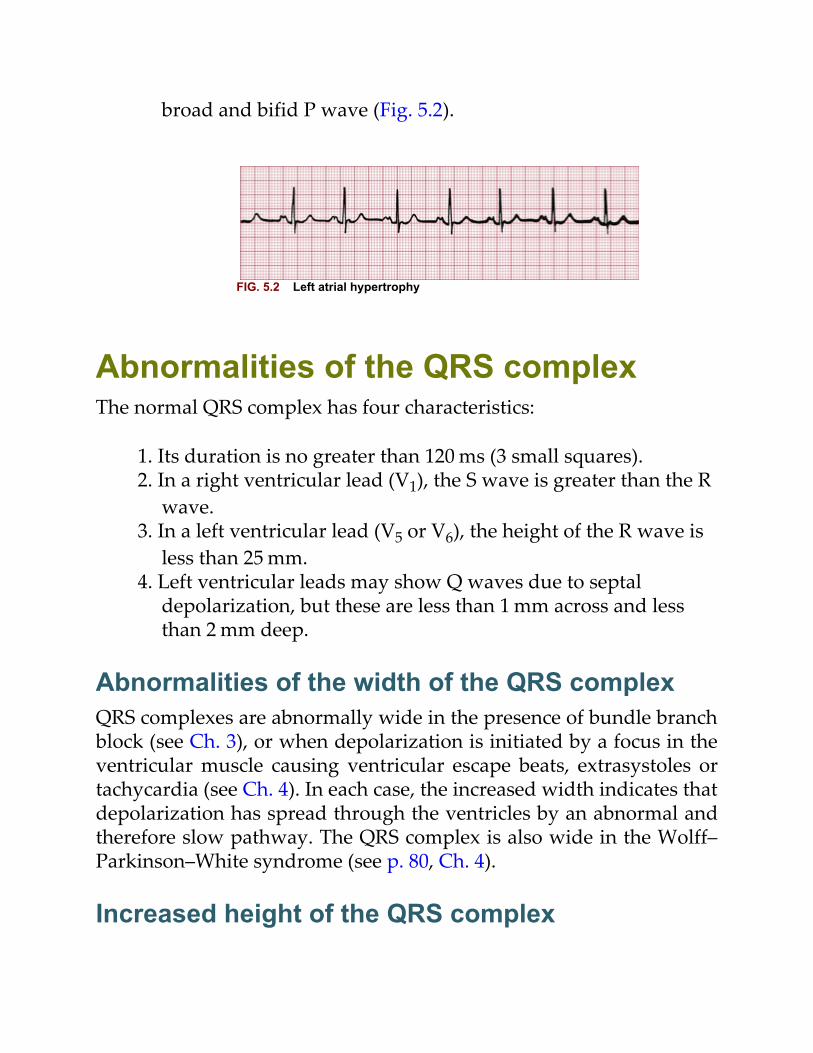
broad and bifid P wave (Fig. 5.2).
FIG. 5.2 Left atrial hypertrophy
Abnormalities of the QRS complexThe normal QRS complex has four characteristics:
1. Its duration is no greater than 120 ms (3 small squares).2. In a right ventricular lead (V1), the S wave is greater than the R
wave.3. In a left ventricular lead (V5 or V6), the height of the R wave is
less than 25 mm.4. Left ventricular leads may show Q waves due to septal
depolarization, but these are less than 1 mm across and lessthan 2 mm deep.
Abnormalities of the width of the QRS complexQRS complexes are abnormally wide in the presence of bundle branchblock (see Ch. 3), or when depolarization is initiated by a focus in theventricular muscle causing ventricular escape beats, extrasystoles ortachycardia (see Ch. 4). In each case, the increased width indicates thatdepolarization has spread through the ventricles by an abnormal andtherefore slow pathway. The QRS complex is also wide in the Wolff–Parkinson–White syndrome (see p. 80, Ch. 4).
Increased height of the QRS complex
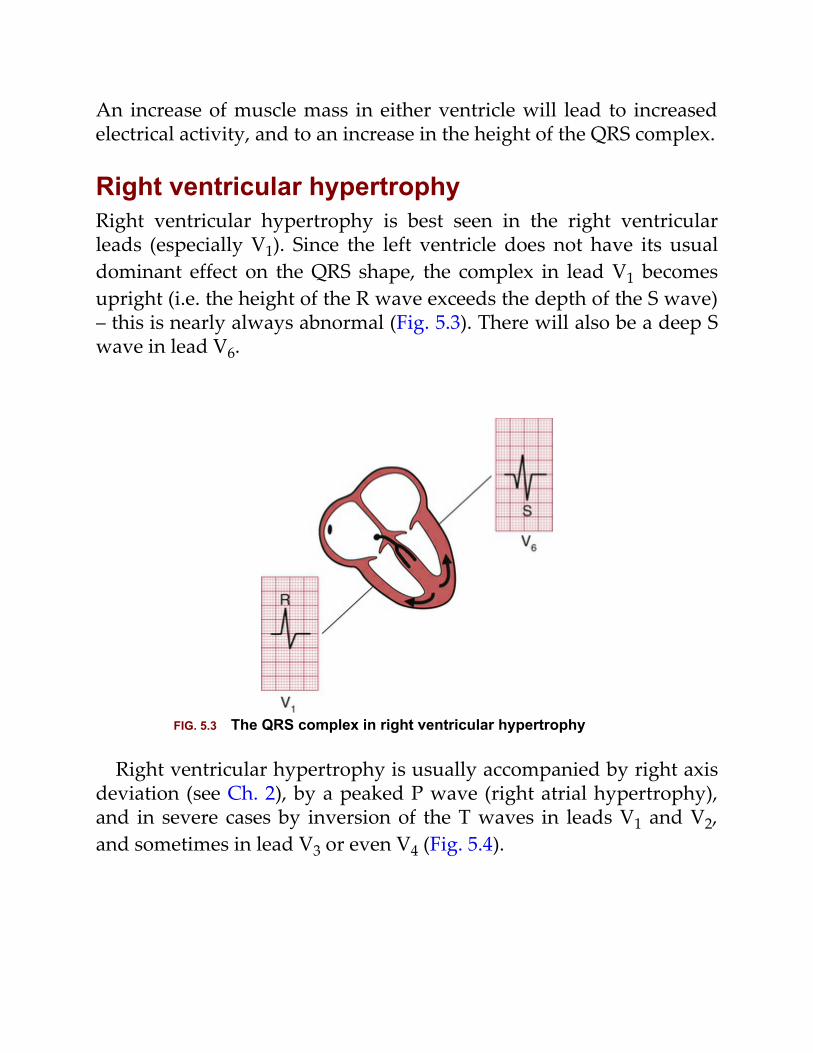
An increase of muscle mass in either ventricle will lead to increasedelectrical activity, and to an increase in the height of the QRS complex.
Right ventricular hypertrophyRight ventricular hypertrophy is best seen in the right ventricularleads (especially V1). Since the left ventricle does not have its usualdominant effect on the QRS shape, the complex in lead V1 becomesupright (i.e. the height of the R wave exceeds the depth of the S wave)– this is nearly always abnormal (Fig. 5.3). There will also be a deep Swave in lead V6.
FIG. 5.3 The QRS complex in right ventricular hypertrophy
Right ventricular hypertrophy is usually accompanied by right axisdeviation (see Ch. 2), by a peaked P wave (right atrial hypertrophy),and in severe cases by inversion of the T waves in leads V1 and V2,and sometimes in lead V3 or even V4 (Fig. 5.4).
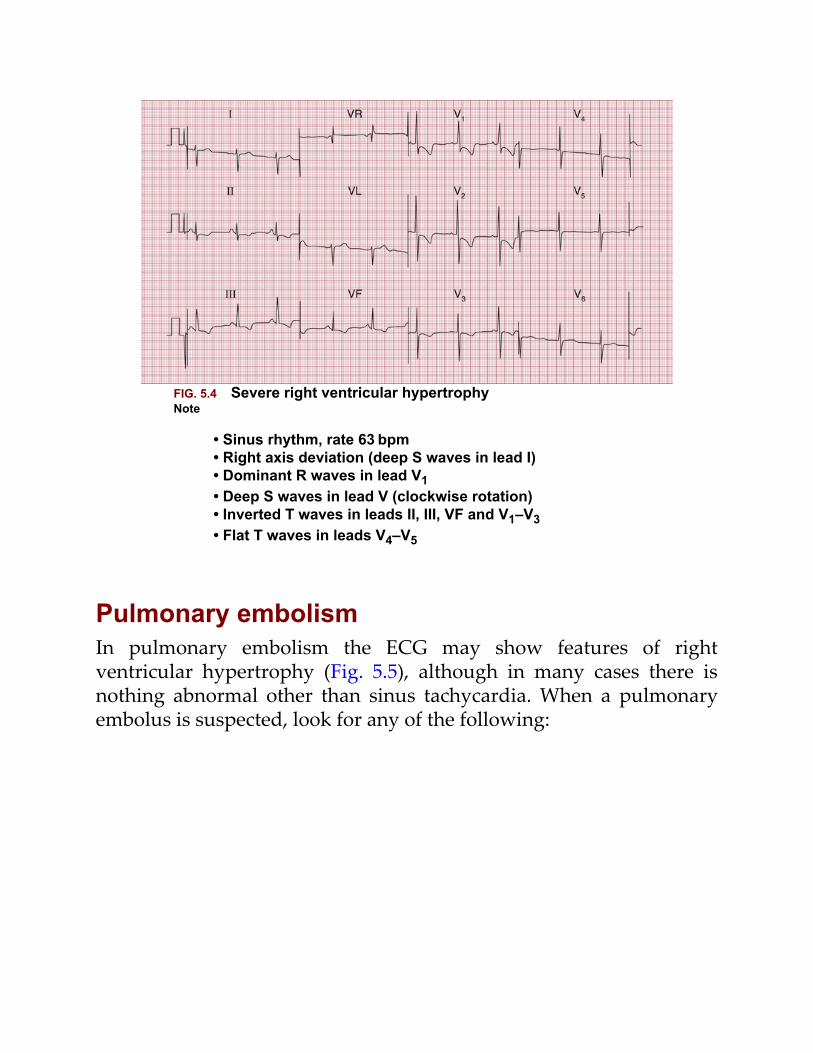
FIG. 5.4 Severe right ventricular hypertrophyNote
• Sinus rhythm, rate 63 bpm• Right axis deviation (deep S waves in lead I)• Dominant R waves in lead V1• Deep S waves in lead V (clockwise rotation)• Inverted T waves in leads II, III, VF and V1–V3• Flat T waves in leads V4–V5
Pulmonary embolismIn pulmonary embolism the ECG may show features of rightventricular hypertrophy (Fig. 5.5), although in many cases there isnothing abnormal other than sinus tachycardia. When a pulmonaryembolus is suspected, look for any of the following:
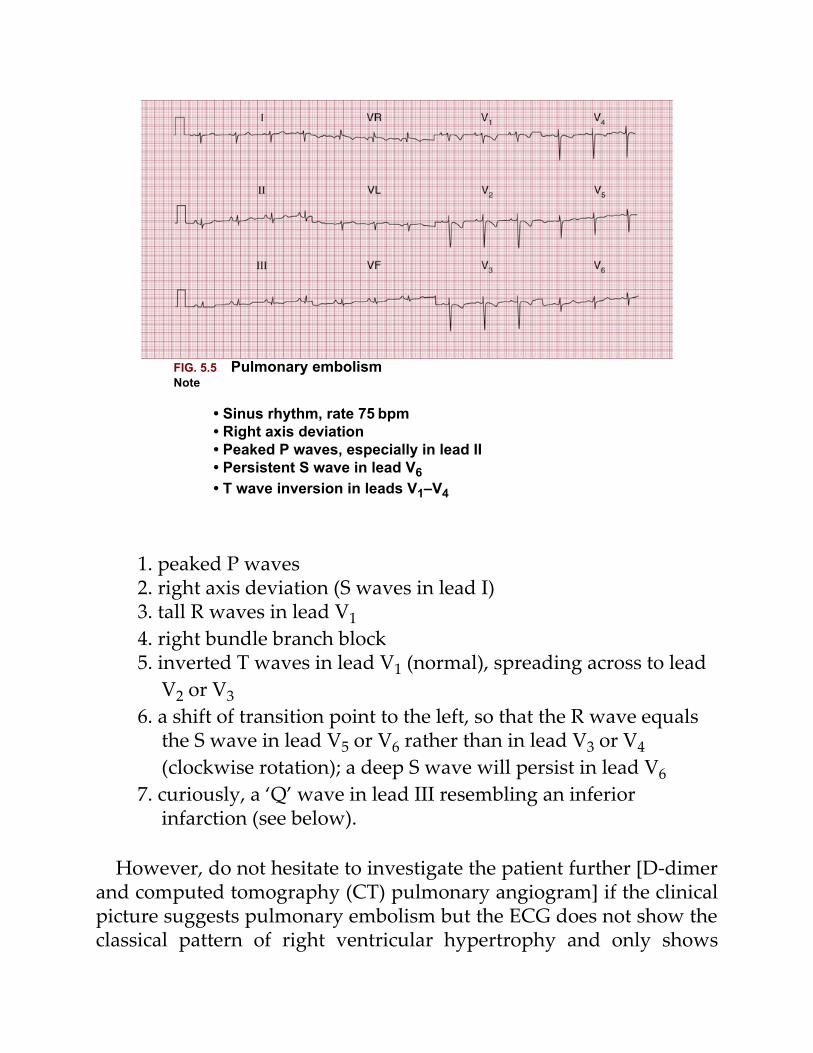
FIG. 5.5 Pulmonary embolismNote
• Sinus rhythm, rate 75 bpm• Right axis deviation• Peaked P waves, especially in lead II• Persistent S wave in lead V6• T wave inversion in leads V1–V4
1. peaked P waves2. right axis deviation (S waves in lead I)3. tall R waves in lead V14. right bundle branch block5. inverted T waves in lead V1 (normal), spreading across to lead
V2 or V36. a shift of transition point to the left, so that the R wave equals
the S wave in lead V5 or V6 rather than in lead V3 or V4(clockwise rotation); a deep S wave will persist in lead V6
7. curiously, a ‘Q’ wave in lead III resembling an inferiorinfarction (see below).
However, do not hesitate to investigate the patient further [D-dimerand computed tomography (CT) pulmonary angiogram] if the clinicalpicture suggests pulmonary embolism but the ECG does not show theclassical pattern of right ventricular hypertrophy and only shows
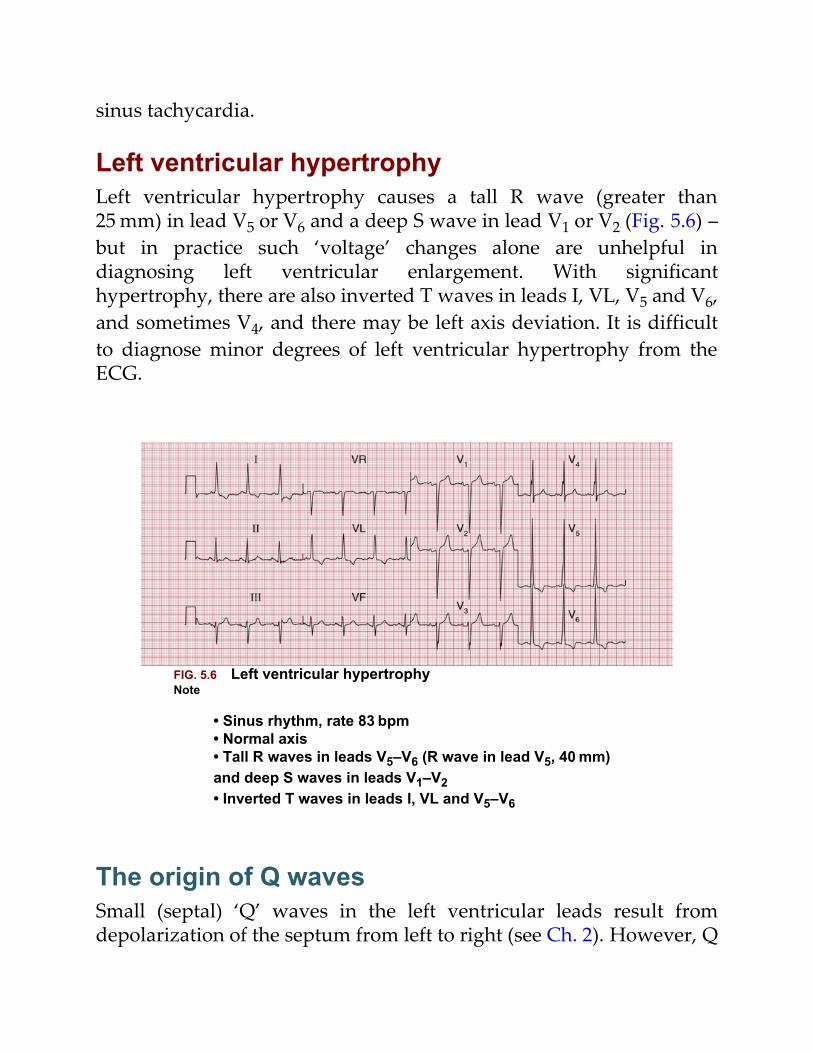
sinus tachycardia.
Left ventricular hypertrophyLeft ventricular hypertrophy causes a tall R wave (greater than25 mm) in lead V5 or V6 and a deep S wave in lead V1 or V2 (Fig. 5.6) –but in practice such ‘voltage’ changes alone are unhelpful indiagnosing left ventricular enlargement. With significanthypertrophy, there are also inverted T waves in leads I, VL, V5 and V6,and sometimes V4, and there may be left axis deviation. It is difficultto diagnose minor degrees of left ventricular hypertrophy from theECG.
FIG. 5.6 Left ventricular hypertrophyNote
• Sinus rhythm, rate 83 bpm• Normal axis• Tall R waves in leads V5–V6 (R wave in lead V5, 40 mm)and deep S waves in leads V1–V2• Inverted T waves in leads I, VL and V5–V6
The origin of Q wavesSmall (septal) ‘Q’ waves in the left ventricular leads result fromdepolarization of the septum from left to right (see Ch. 2). However, Q
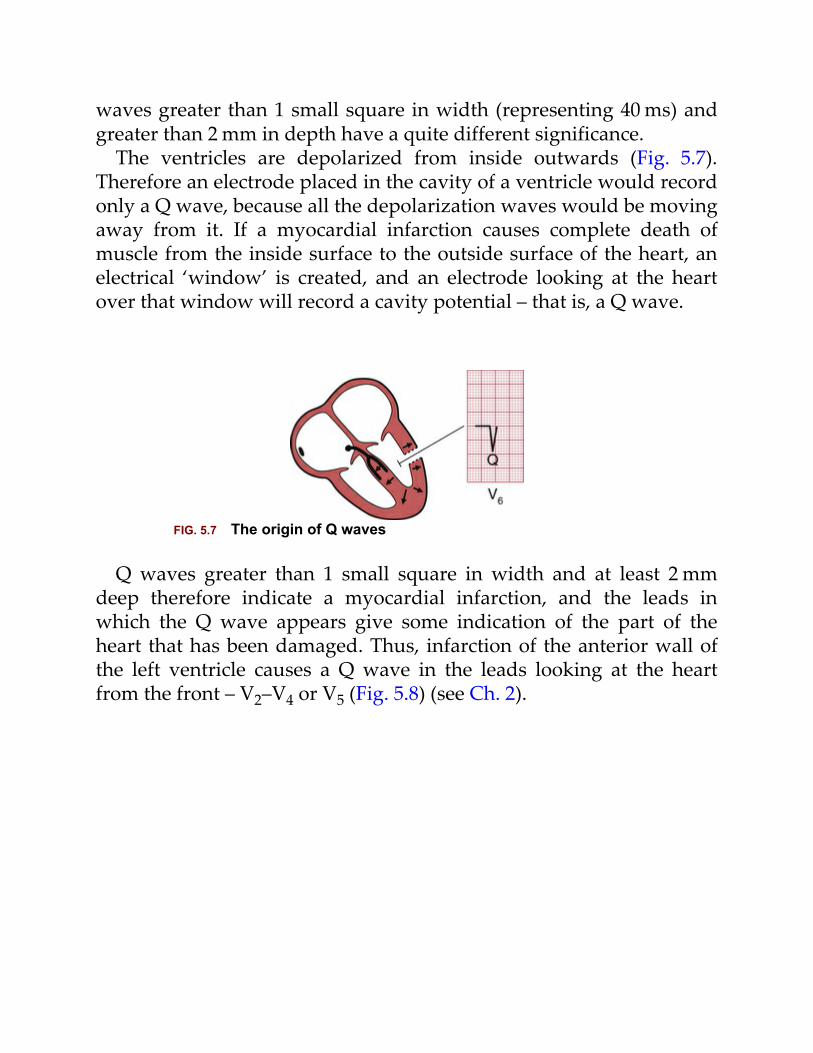
waves greater than 1 small square in width (representing 40 ms) andgreater than 2 mm in depth have a quite different significance.
The ventricles are depolarized from inside outwards (Fig. 5.7).Therefore an electrode placed in the cavity of a ventricle would recordonly a Q wave, because all the depolarization waves would be movingaway from it. If a myocardial infarction causes complete death ofmuscle from the inside surface to the outside surface of the heart, anelectrical ‘window’ is created, and an electrode looking at the heartover that window will record a cavity potential – that is, a Q wave.
FIG. 5.7 The origin of Q waves
Q waves greater than 1 small square in width and at least 2 mmdeep therefore indicate a myocardial infarction, and the leads inwhich the Q wave appears give some indication of the part of theheart that has been damaged. Thus, infarction of the anterior wall ofthe left ventricle causes a Q wave in the leads looking at the heartfrom the front – V2–V4 or V5 (Fig. 5.8) (see Ch. 2).
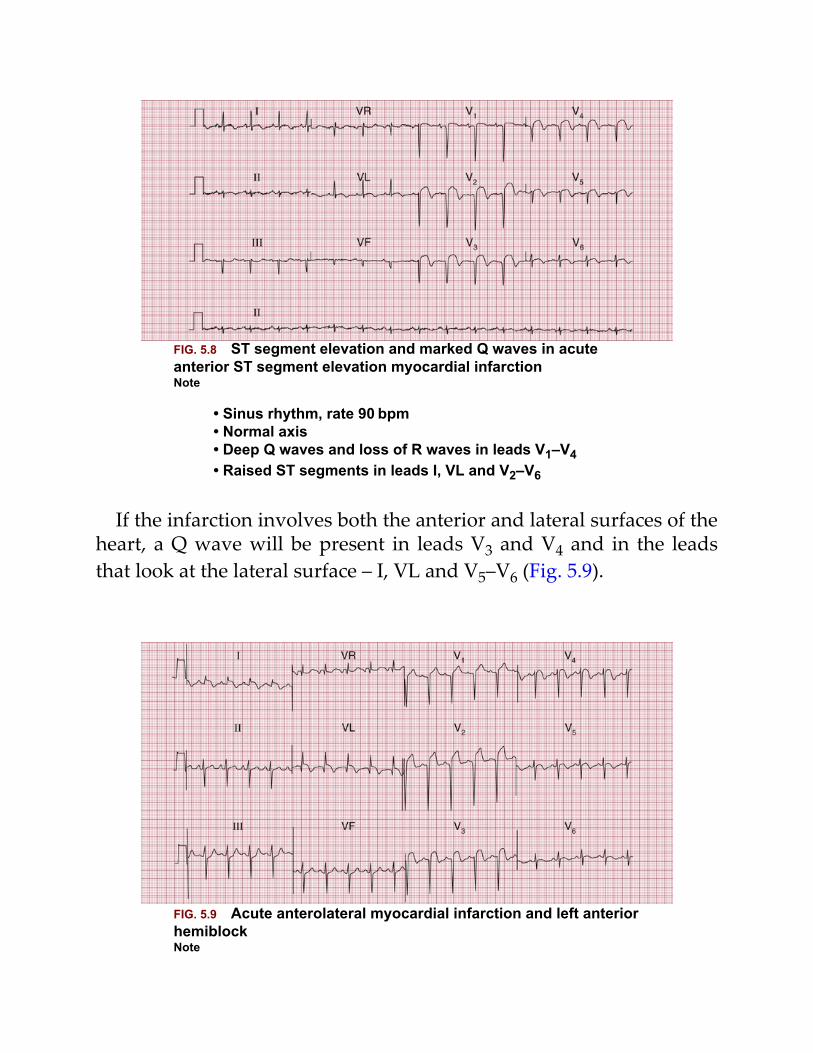
FIG. 5.8 ST segment elevation and marked Q waves in acuteanterior ST segment elevation myocardial infarctionNote
• Sinus rhythm, rate 90 bpm• Normal axis• Deep Q waves and loss of R waves in leads V1–V4• Raised ST segments in leads I, VL and V2–V6
If the infarction involves both the anterior and lateral surfaces of theheart, a Q wave will be present in leads V3 and V4 and in the leadsthat look at the lateral surface – I, VL and V5–V6 (Fig. 5.9).
FIG. 5.9 Acute anterolateral myocardial infarction and left anteriorhemiblockNote
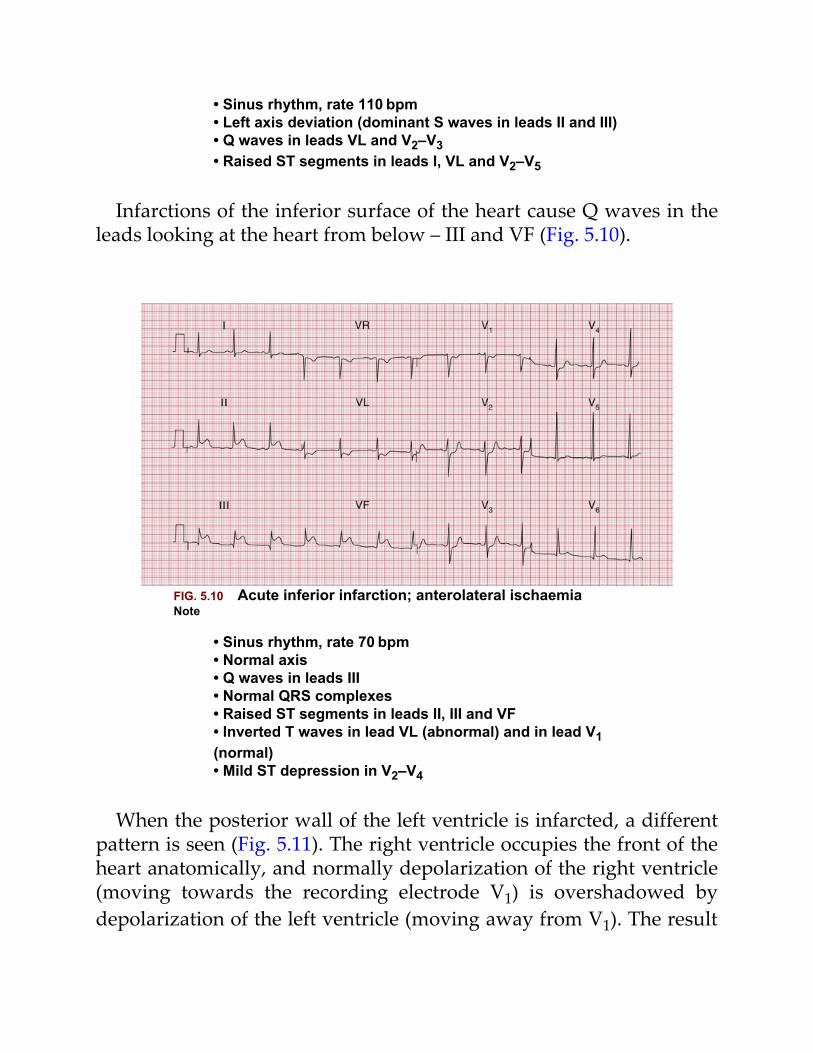
• Sinus rhythm, rate 110 bpm• Left axis deviation (dominant S waves in leads II and III)• Q waves in leads VL and V2–V3• Raised ST segments in leads I, VL and V2–V5
Infarctions of the inferior surface of the heart cause Q waves in theleads looking at the heart from below – III and VF (Fig. 5.10).
FIG. 5.10 Acute inferior infarction; anterolateral ischaemiaNote
• Sinus rhythm, rate 70 bpm• Normal axis• Q waves in leads III• Normal QRS complexes• Raised ST segments in leads II, III and VF• Inverted T waves in lead VL (abnormal) and in lead V1(normal)• Mild ST depression in V2–V4
When the posterior wall of the left ventricle is infarcted, a differentpattern is seen (Fig. 5.11). The right ventricle occupies the front of theheart anatomically, and normally depolarization of the right ventricle(moving towards the recording electrode V1) is overshadowed bydepolarization of the left ventricle (moving away from V1). The result
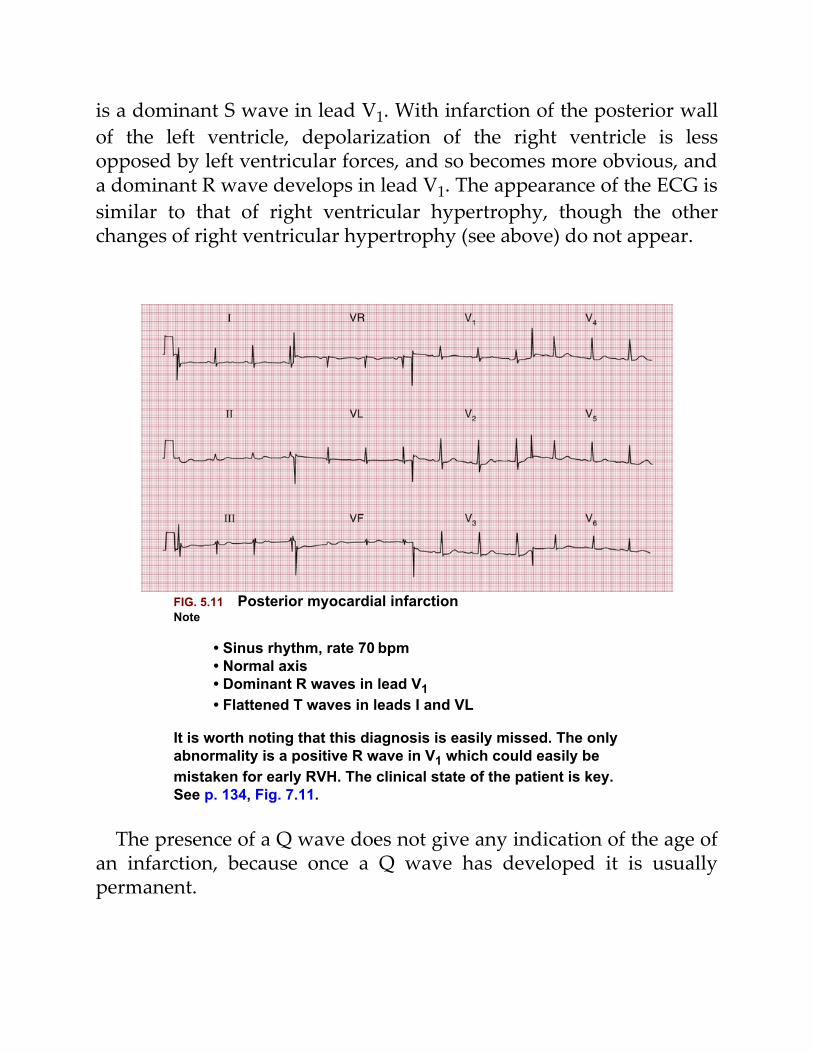
is a dominant S wave in lead V1. With infarction of the posterior wallof the left ventricle, depolarization of the right ventricle is lessopposed by left ventricular forces, and so becomes more obvious, anda dominant R wave develops in lead V1. The appearance of the ECG issimilar to that of right ventricular hypertrophy, though the otherchanges of right ventricular hypertrophy (see above) do not appear.
FIG. 5.11 Posterior myocardial infarctionNote
• Sinus rhythm, rate 70 bpm• Normal axis• Dominant R waves in lead V1• Flattened T waves in leads I and VL
It is worth noting that this diagnosis is easily missed. The onlyabnormality is a positive R wave in V1 which could easily bemistaken for early RVH. The clinical state of the patient is key.See p. 134, Fig. 7.11.
The presence of a Q wave does not give any indication of the age ofan infarction, because once a Q wave has developed it is usuallypermanent.
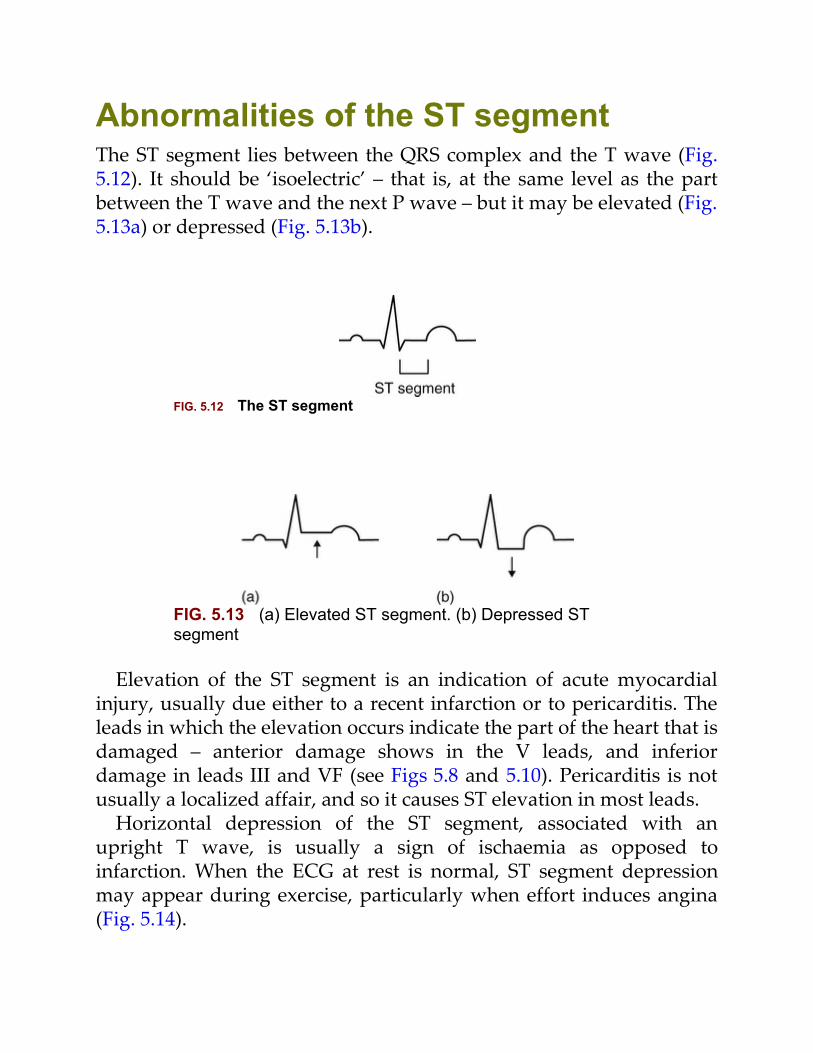
Abnormalities of the ST segmentThe ST segment lies between the QRS complex and the T wave (Fig.5.12). It should be ‘isoelectric’ – that is, at the same level as the partbetween the T wave and the next P wave – but it may be elevated (Fig.5.13a) or depressed (Fig. 5.13b).
FIG. 5.12 The ST segment
FIG. 5.13 (a) Elevated ST segment. (b) Depressed STsegment
Elevation of the ST segment is an indication of acute myocardialinjury, usually due either to a recent infarction or to pericarditis. Theleads in which the elevation occurs indicate the part of the heart that isdamaged – anterior damage shows in the V leads, and inferiordamage in leads III and VF (see Figs 5.8 and 5.10). Pericarditis is notusually a localized affair, and so it causes ST elevation in most leads.
Horizontal depression of the ST segment, associated with anupright T wave, is usually a sign of ischaemia as opposed toinfarction. When the ECG at rest is normal, ST segment depressionmay appear during exercise, particularly when effort induces angina(Fig. 5.14).
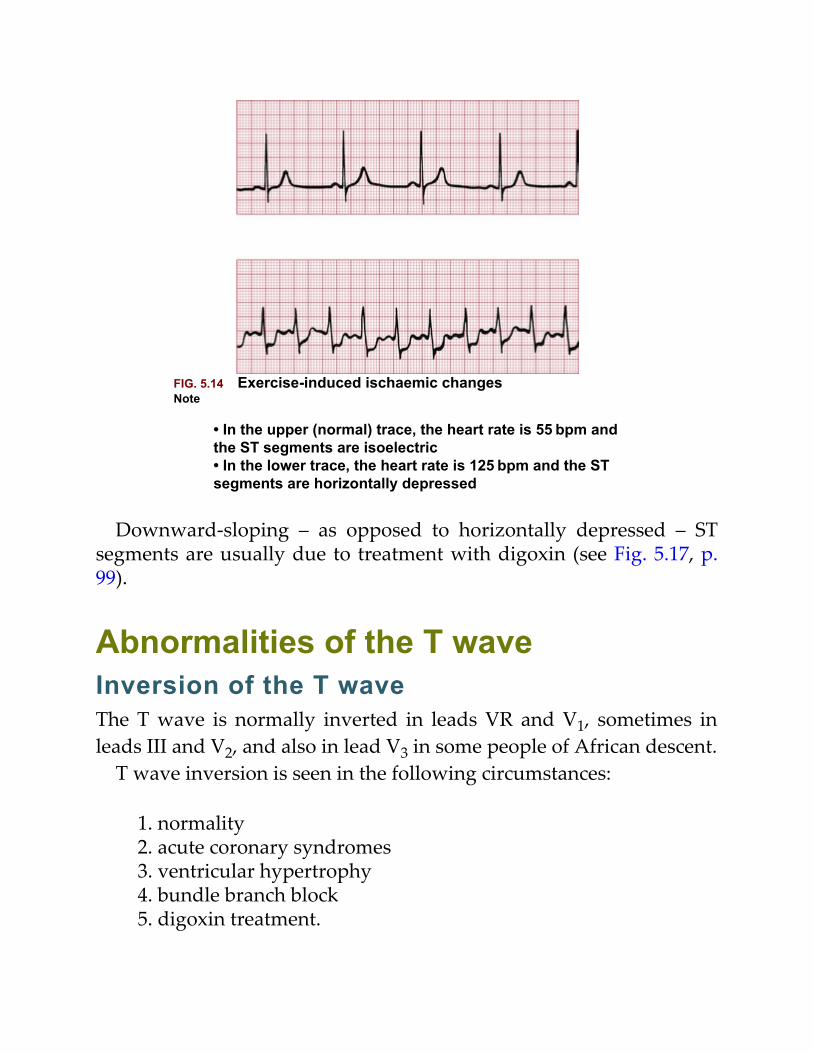
FIG. 5.14 Exercise-induced ischaemic changesNote
• In the upper (normal) trace, the heart rate is 55 bpm andthe ST segments are isoelectric• In the lower trace, the heart rate is 125 bpm and the STsegments are horizontally depressed
Downward-sloping – as opposed to horizontally depressed – STsegments are usually due to treatment with digoxin (see Fig. 5.17, p.99).
Abnormalities of the T waveInversion of the T waveThe T wave is normally inverted in leads VR and V1, sometimes inleads III and V2, and also in lead V3 in some people of African descent.
T wave inversion is seen in the following circumstances:
1. normality2. acute coronary syndromes3. ventricular hypertrophy4. bundle branch block5. digoxin treatment.
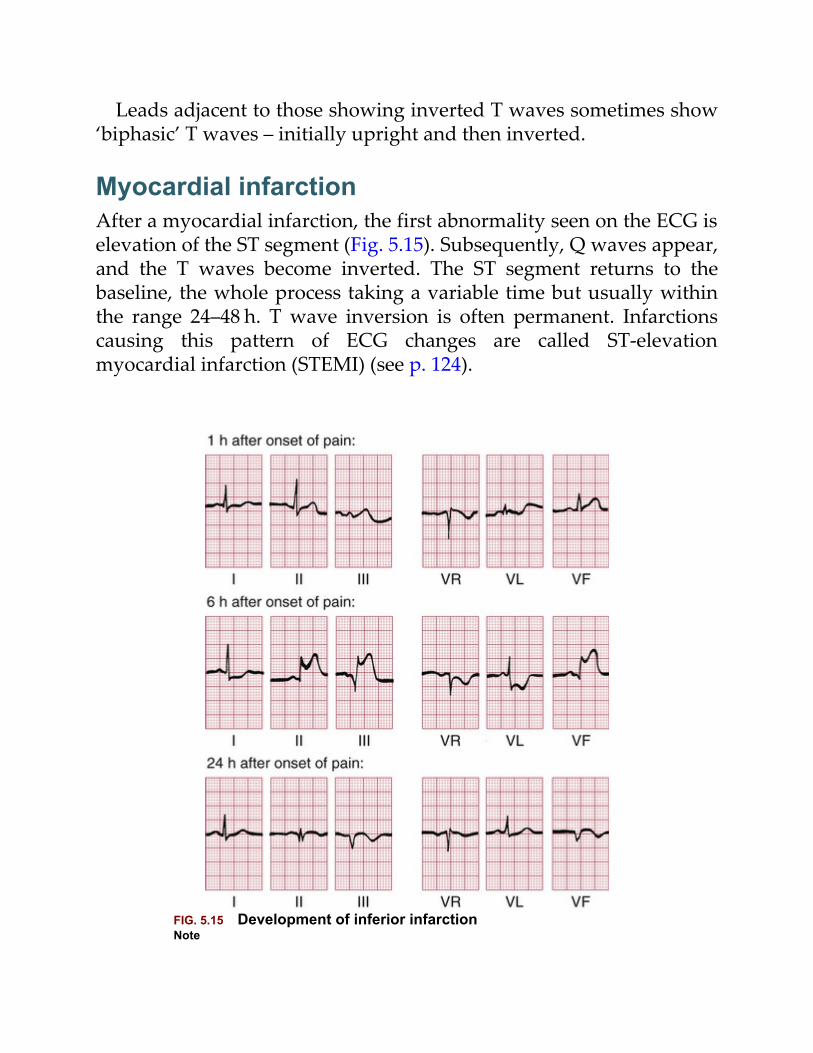
Leads adjacent to those showing inverted T waves sometimes show‘biphasic’ T waves – initially upright and then inverted.
Myocardial infarctionAfter a myocardial infarction, the first abnormality seen on the ECG iselevation of the ST segment (Fig. 5.15). Subsequently, Q waves appear,and the T waves become inverted. The ST segment returns to thebaseline, the whole process taking a variable time but usually withinthe range 24–48 h. T wave inversion is often permanent. Infarctionscausing this pattern of ECG changes are called ST-elevationmyocardial infarction (STEMI) (see p. 124).
FIG. 5.15 Development of inferior infarctionNote
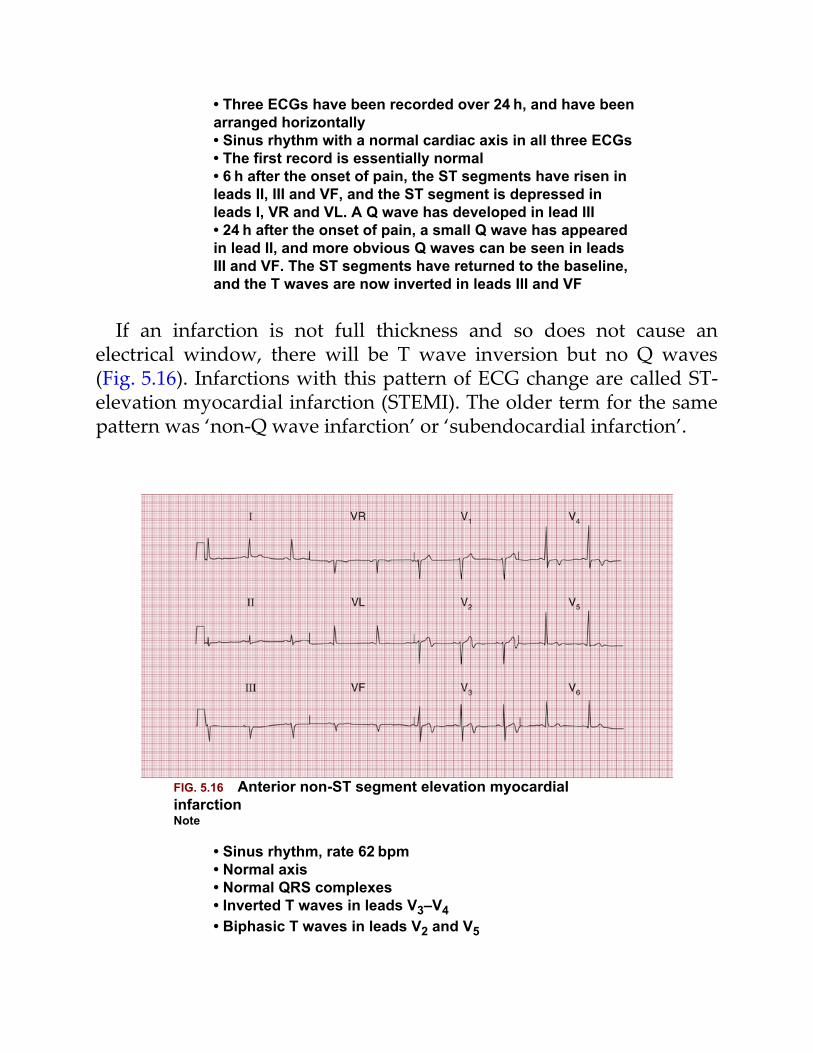
• Three ECGs have been recorded over 24 h, and have beenarranged horizontally• Sinus rhythm with a normal cardiac axis in all three ECGs• The first record is essentially normal• 6 h after the onset of pain, the ST segments have risen inleads II, III and VF, and the ST segment is depressed inleads I, VR and VL. A Q wave has developed in lead III• 24 h after the onset of pain, a small Q wave has appearedin lead II, and more obvious Q waves can be seen in leadsIII and VF. The ST segments have returned to the baseline,and the T waves are now inverted in leads III and VF
If an infarction is not full thickness and so does not cause anelectrical window, there will be T wave inversion but no Q waves(Fig. 5.16). Infarctions with this pattern of ECG change are called ST-elevation myocardial infarction (STEMI). The older term for the samepattern was ‘non-Q wave infarction’ or ‘subendocardial infarction’.
FIG. 5.16 Anterior non-ST segment elevation myocardialinfarctionNote
• Sinus rhythm, rate 62 bpm• Normal axis• Normal QRS complexes• Inverted T waves in leads V3–V4• Biphasic T waves in leads V2 and V5
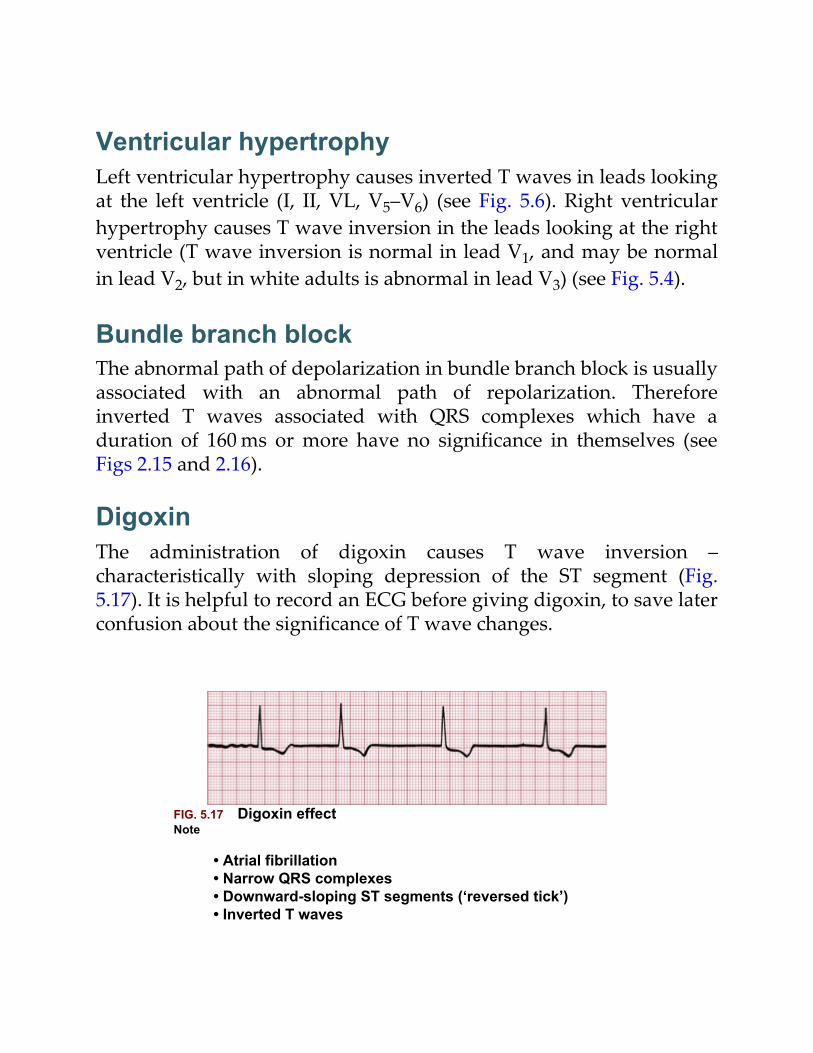
Ventricular hypertrophyLeft ventricular hypertrophy causes inverted T waves in leads lookingat the left ventricle (I, II, VL, V5–V6) (see Fig. 5.6). Right ventricularhypertrophy causes T wave inversion in the leads looking at the rightventricle (T wave inversion is normal in lead V1, and may be normalin lead V2, but in white adults is abnormal in lead V3) (see Fig. 5.4).
Bundle branch blockThe abnormal path of depolarization in bundle branch block is usuallyassociated with an abnormal path of repolarization. Thereforeinverted T waves associated with QRS complexes which have aduration of 160 ms or more have no significance in themselves (seeFigs 2.15 and 2.16).
DigoxinThe administration of digoxin causes T wave inversion –characteristically with sloping depression of the ST segment (Fig.5.17). It is helpful to record an ECG before giving digoxin, to save laterconfusion about the significance of T wave changes.
FIG. 5.17 Digoxin effectNote
• Atrial fibrillation• Narrow QRS complexes• Downward-sloping ST segments (‘reversed tick’)• Inverted T waves
Other abnormalities of the ST segmentand the T waveElectrolyte abnormalitiesAbnormalities of the plasma levels of potassium, calcium andmagnesium affect the ECG, though changes in the plasma sodiumlevel do not. The T wave and QT interval (measured from the onset ofthe QRS complex to the end of the T wave) are most commonlyaffected.
A low potassium level causes T wave flattening and the appearanceof a hump on the end of the T wave called a ‘U’ wave. A highpotassium level causes peaked T waves with the disappearance of theST segment. The QRS complex may be widened. The effects ofabnormal magnesium levels are similar.
A low plasma calcium level causes prolongation of the QT interval,and a high plasma calcium level shortens it.
Nonspecific changesMinor degrees of ST segment and T wave abnormalities (T waveflattening, etc.) are usually of no great significance, and are bestreported as ‘nonspecific ST–T changes’.
RemindersCauses of Abnormal P Waves, QRS Complexes andT Waves
• Tall P waves result from right atrial hypertrophy, and broad Pwaves from left atrial hypertrophy.
• Broadening of the QRS complex indicates abnormalintraventricular conduction: it is seen in bundle branch blockand in complexes originating in the ventricular muscle. It is alsoseen in the Wolff–Parkinson–White syndrome.
• Increased height of the QRS complex indicates ventricularhypertrophy. Right ventricular hypertrophy is seen in lead V1,and left ventricular hypertrophy is seen in leads V5–V6.
• Q waves greater than 1 mm across and 2 mm deep indicatemyocardial infarction.
• ST segment elevation indicates acute myocardial infarction orpericarditis.
• ST segment depression and T wave inversion may be due toischaemia, ventricular hypertrophy, abnormal intraventricularconduction or digoxin.
• T wave inversion is normal in leads III, VR and V1. T waveinversion is associated with bundle branch block, ischaemiaand ventricular hypertrophy.
• T wave flattening or peaking with an unusually long or shortQT interval may be due to electrolyte abnormalities, but manyminor ST–T changes are nonspecific.
And remember
• The ECG is easy to understand.• Most abnormalities of the ECG are amenable to reason.
For more on myocardial infarction, see ECG Made Practical, 7th
edition, Chapter 6 For more on the effect of electrolyte abnormalities, see ECG Made
Practical, 7th edition, Chapter 8
PART 3Making the most of the ECG: theclinical interpretation ofindividual ECGs
OUTLINE
6 The ECG in healthy subjects7 The ECG in patients with chest pain or breathlessness8 The ECG in patients with palpitations or syncope
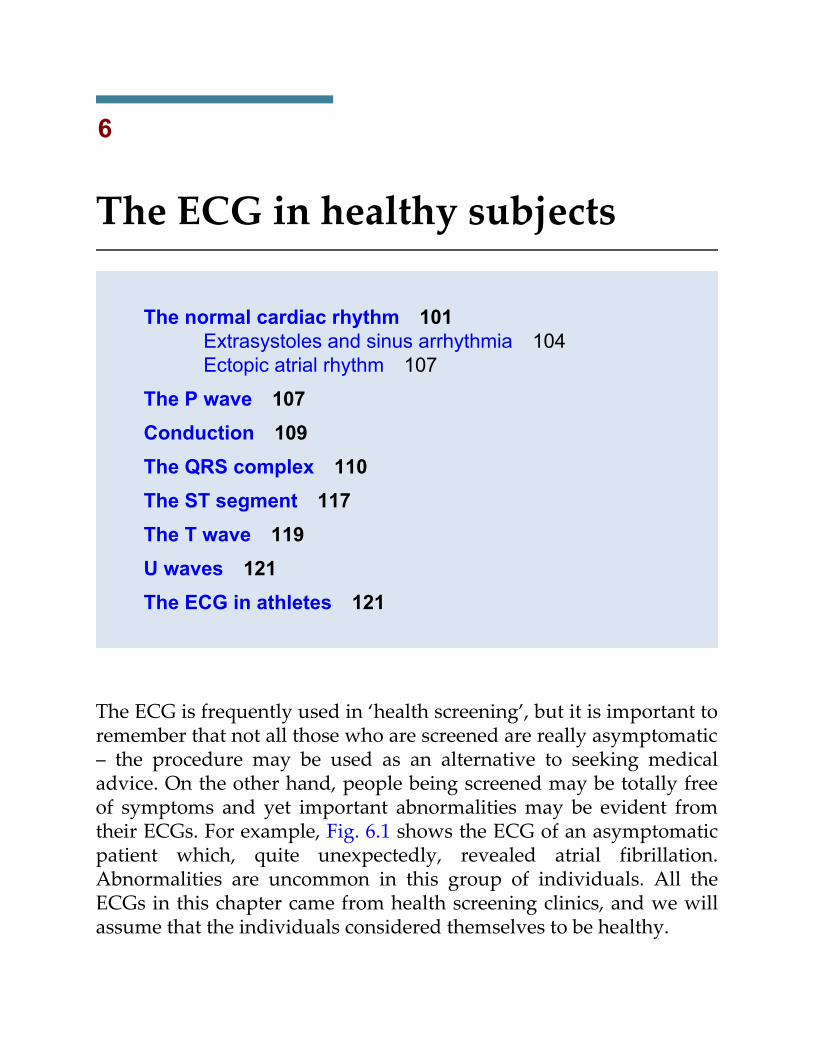
6
The ECG in healthy subjects
The normal cardiac rhythm 101Extrasystoles and sinus arrhythmia 104Ectopic atrial rhythm 107
The P wave 107Conduction 109The QRS complex 110The ST segment 117The T wave 119U waves 121The ECG in athletes 121
The ECG is frequently used in ‘health screening’, but it is important toremember that not all those who are screened are really asymptomatic– the procedure may be used as an alternative to seeking medicaladvice. On the other hand, people being screened may be totally freeof symptoms and yet important abnormalities may be evident fromtheir ECGs. For example, Fig. 6.1 shows the ECG of an asymptomaticpatient which, quite unexpectedly, revealed atrial fibrillation.Abnormalities are uncommon in this group of individuals. All theECGs in this chapter came from health screening clinics, and we willassume that the individuals considered themselves to be healthy.
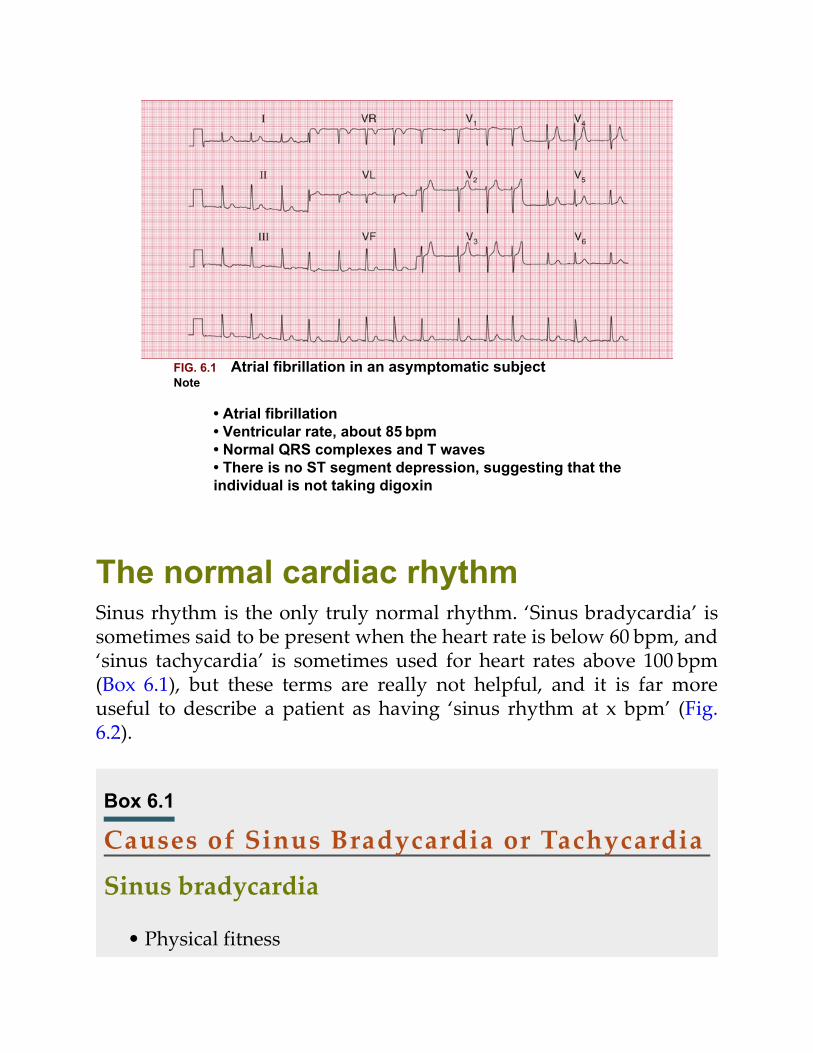
FIG. 6.1 Atrial fibrillation in an asymptomatic subjectNote
• Atrial fibrillation• Ventricular rate, about 85 bpm• Normal QRS complexes and T waves• There is no ST segment depression, suggesting that theindividual is not taking digoxin
The normal cardiac rhythmSinus rhythm is the only truly normal rhythm. ‘Sinus bradycardia’ issometimes said to be present when the heart rate is below 60 bpm, and‘sinus tachycardia’ is sometimes used for heart rates above 100 bpm(Box 6.1), but these terms are really not helpful, and it is far moreuseful to describe a patient as having ‘sinus rhythm at x bpm’ (Fig.6.2).
Box 6.1
Causes of Sinus Bradycardia or Tachycardia
Sinus bradycardia
• Physical fitness
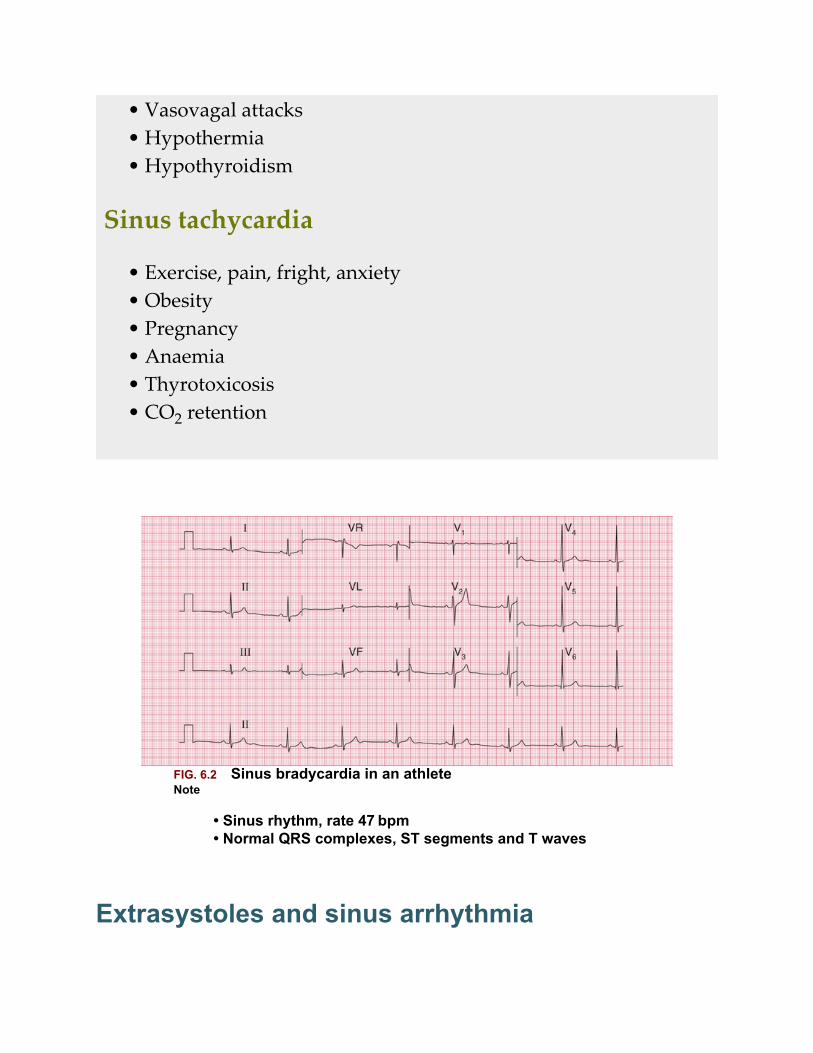
• Vasovagal attacks• Hypothermia• Hypothyroidism
Sinus tachycardia
• Exercise, pain, fright, anxiety• Obesity• Pregnancy• Anaemia• Thyrotoxicosis• CO2 retention
FIG. 6.2 Sinus bradycardia in an athleteNote
• Sinus rhythm, rate 47 bpm• Normal QRS complexes, ST segments and T waves
Extrasystoles and sinus arrhythmia
Supraventricular extrasystoles are of no clinical significance, althoughatrial extrasystoles need to be differentiated from the variations inbeat-to-beat interval which occur in sinus rhythm i.e. sinusarrhythmia. This is a normal variant of sinus rhythm where the ratevaries with inspiration and expiration (Figs 1.17, 6.3 and 6.4).Automated ECG reporting often fails to do this.
FIG. 6.3 Sinus arrhythmiaNote
• Sinus rhythm, rate about 65 bpm overall• The lead II rhythm strip shows that the rate is initiallyabout 80 bpm but slows progressively to 60 bpm• The QRS complexes, ST segments and T waves arenormal
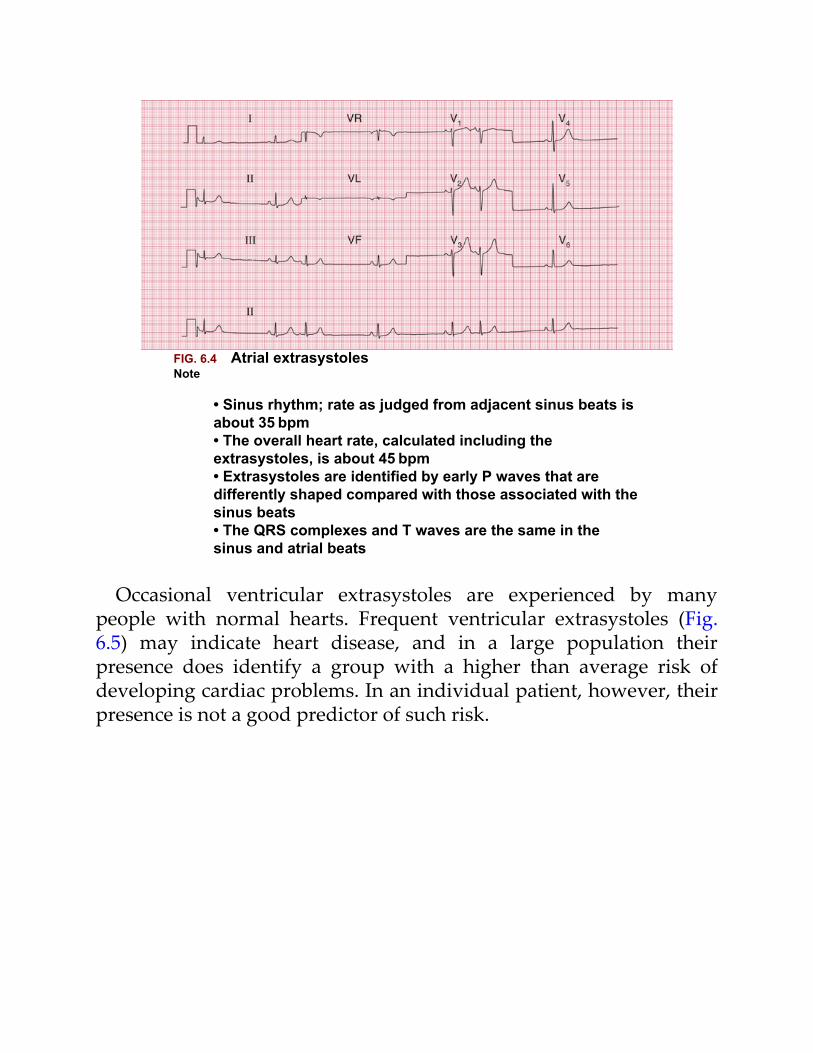
FIG. 6.4 Atrial extrasystolesNote
• Sinus rhythm; rate as judged from adjacent sinus beats isabout 35 bpm• The overall heart rate, calculated including theextrasystoles, is about 45 bpm• Extrasystoles are identified by early P waves that aredifferently shaped compared with those associated with thesinus beats• The QRS complexes and T waves are the same in thesinus and atrial beats
Occasional ventricular extrasystoles are experienced by manypeople with normal hearts. Frequent ventricular extrasystoles (Fig.6.5) may indicate heart disease, and in a large population theirpresence does identify a group with a higher than average risk ofdeveloping cardiac problems. In an individual patient, however, theirpresence is not a good predictor of such risk.
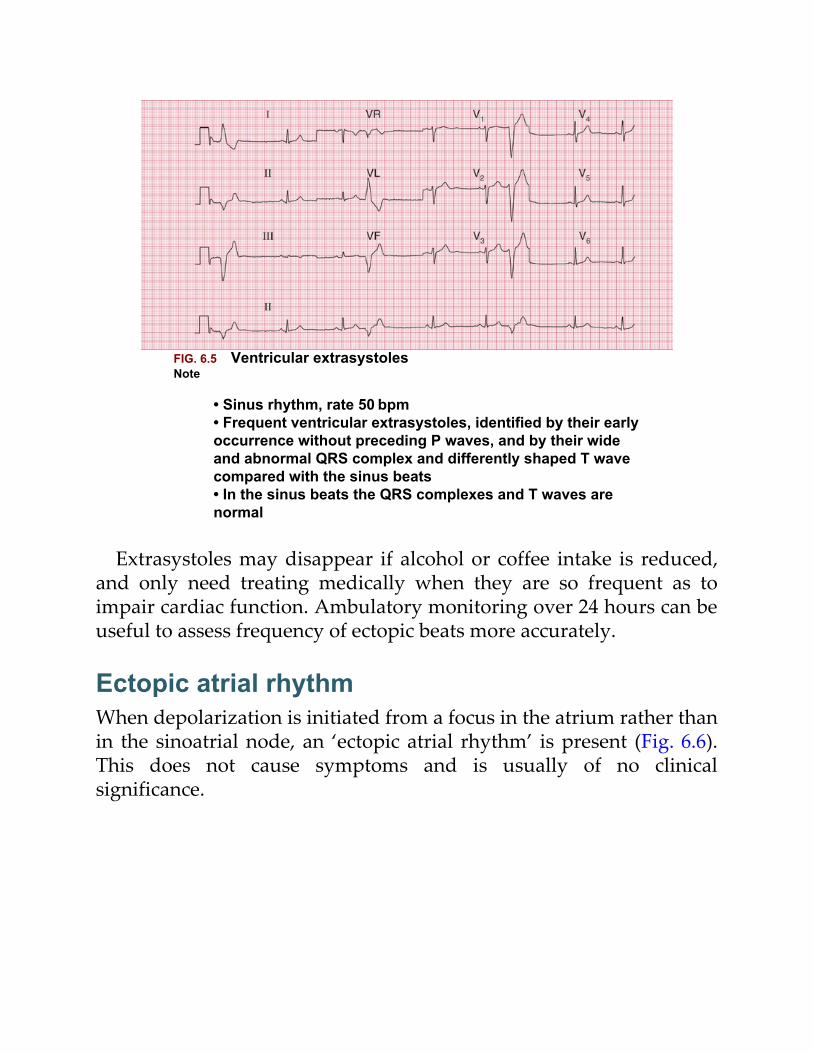
FIG. 6.5 Ventricular extrasystolesNote
• Sinus rhythm, rate 50 bpm• Frequent ventricular extrasystoles, identified by their earlyoccurrence without preceding P waves, and by their wideand abnormal QRS complex and differently shaped T wavecompared with the sinus beats• In the sinus beats the QRS complexes and T waves arenormal
Extrasystoles may disappear if alcohol or coffee intake is reduced,and only need treating medically when they are so frequent as toimpair cardiac function. Ambulatory monitoring over 24 hours can beuseful to assess frequency of ectopic beats more accurately.
Ectopic atrial rhythmWhen depolarization is initiated from a focus in the atrium rather thanin the sinoatrial node, an ‘ectopic atrial rhythm’ is present (Fig. 6.6).This does not cause symptoms and is usually of no clinicalsignificance.
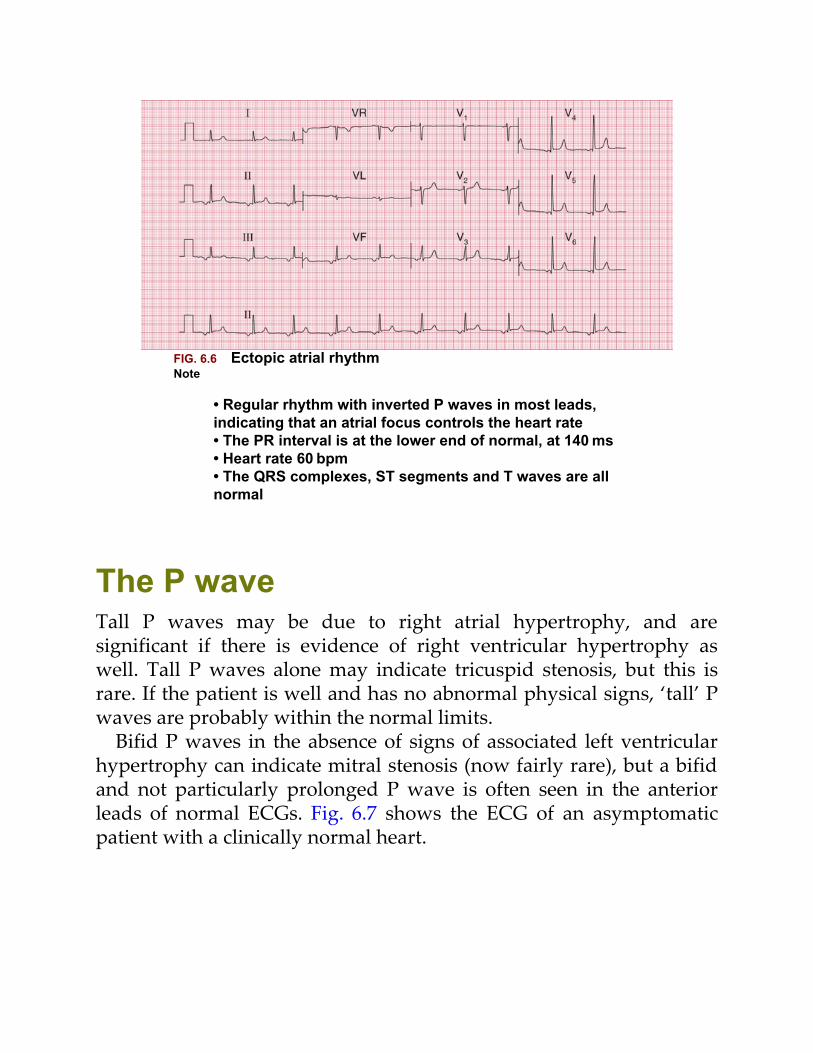
FIG. 6.6 Ectopic atrial rhythmNote
• Regular rhythm with inverted P waves in most leads,indicating that an atrial focus controls the heart rate• The PR interval is at the lower end of normal, at 140 ms• Heart rate 60 bpm• The QRS complexes, ST segments and T waves are allnormal
The P waveTall P waves may be due to right atrial hypertrophy, and aresignificant if there is evidence of right ventricular hypertrophy aswell. Tall P waves alone may indicate tricuspid stenosis, but this israre. If the patient is well and has no abnormal physical signs, ‘tall’ Pwaves are probably within the normal limits.
Bifid P waves in the absence of signs of associated left ventricularhypertrophy can indicate mitral stenosis (now fairly rare), but a bifidand not particularly prolonged P wave is often seen in the anteriorleads of normal ECGs. Fig. 6.7 shows the ECG of an asymptomaticpatient with a clinically normal heart.
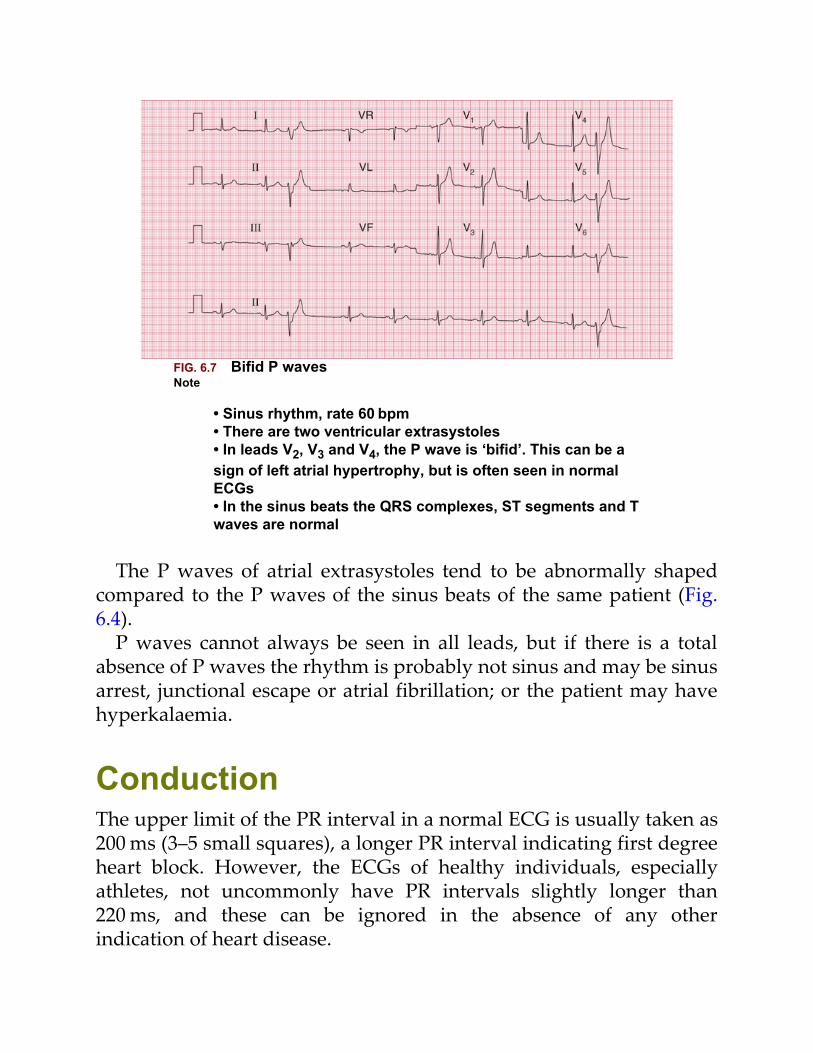
FIG. 6.7 Bifid P wavesNote
• Sinus rhythm, rate 60 bpm• There are two ventricular extrasystoles• In leads V2, V3 and V4, the P wave is ‘bifid’. This can be asign of left atrial hypertrophy, but is often seen in normalECGs• In the sinus beats the QRS complexes, ST segments and Twaves are normal
The P waves of atrial extrasystoles tend to be abnormally shapedcompared to the P waves of the sinus beats of the same patient (Fig.6.4).
P waves cannot always be seen in all leads, but if there is a totalabsence of P waves the rhythm is probably not sinus and may be sinusarrest, junctional escape or atrial fibrillation; or the patient may havehyperkalaemia.
ConductionThe upper limit of the PR interval in a normal ECG is usually taken as200 ms (3–5 small squares), a longer PR interval indicating first degreeheart block. However, the ECGs of healthy individuals, especiallyathletes, not uncommonly have PR intervals slightly longer than220 ms, and these can be ignored in the absence of any otherindication of heart disease.

The ECG in Fig. 6.8 was recorded from a healthy, asymptomaticindividual at a screening examination. Nevertheless, PR intervalprolongation to this extent is probably evidence of disease of theconducting tissue.
FIG. 6.8 First degree heart blockNote
• Sinus rhythm, rate 80 bpm• PR interval prolonged at 336 ms• Constant PR interval in all beats• Loss of the R wave in lead V3 could indicate an oldanterior infarction, otherwise QRS complexes, ST segmentsand T waves are normal
Second degree heart block of the Mobitz 1 (Wenckebach) type maybe seen in athletes, but otherwise second and third degree block areindications of heart disease.
A QRS complex that is predominantly downward (that is, the Swave is greater than the R wave) in leads II and III indicates left axisdeviation (Fig. 6.9).
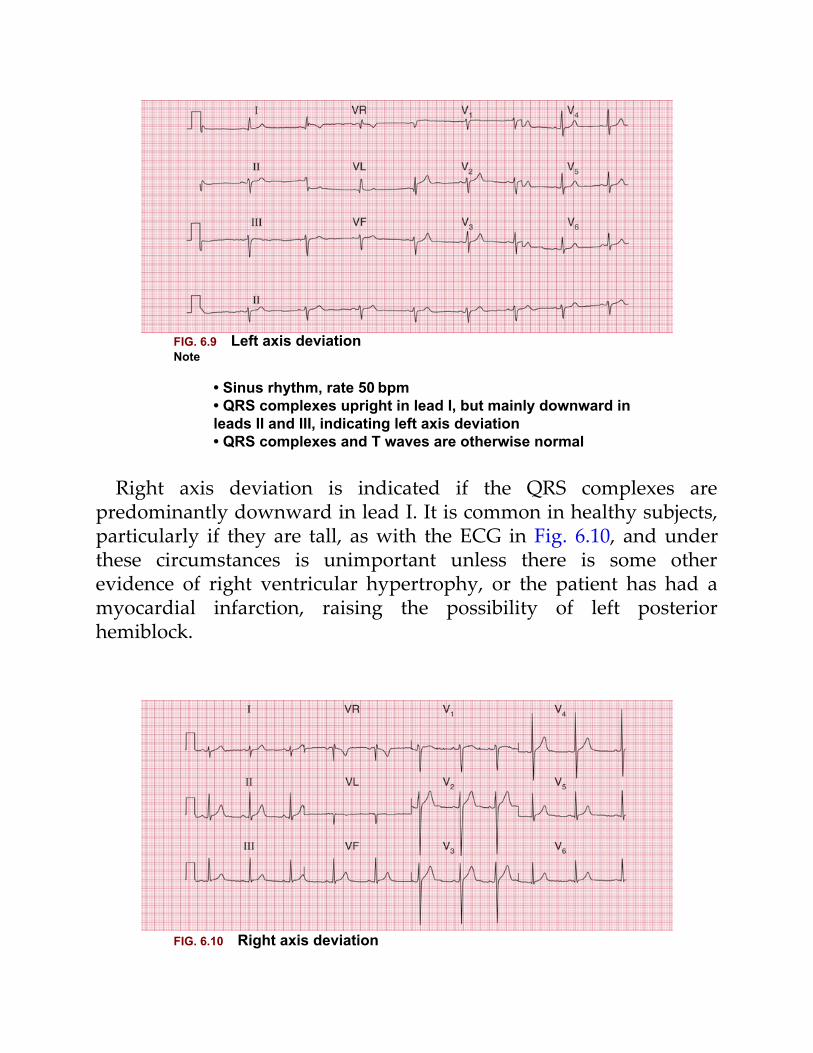
FIG. 6.9 Left axis deviationNote
• Sinus rhythm, rate 50 bpm• QRS complexes upright in lead I, but mainly downward inleads II and III, indicating left axis deviation• QRS complexes and T waves are otherwise normal
Right axis deviation is indicated if the QRS complexes arepredominantly downward in lead I. It is common in healthy subjects,particularly if they are tall, as with the ECG in Fig. 6.10, and underthese circumstances is unimportant unless there is some otherevidence of right ventricular hypertrophy, or the patient has had amyocardial infarction, raising the possibility of left posteriorhemiblock.
FIG. 6.10 Right axis deviation
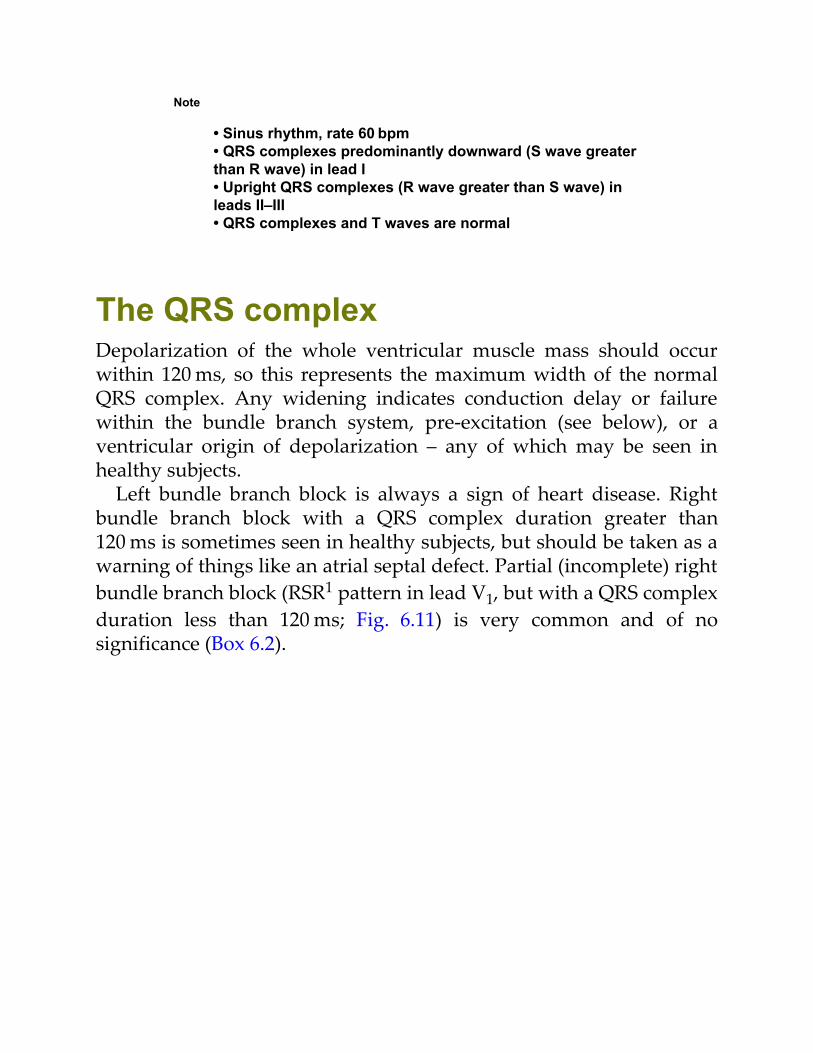
Note
• Sinus rhythm, rate 60 bpm• QRS complexes predominantly downward (S wave greaterthan R wave) in lead I• Upright QRS complexes (R wave greater than S wave) inleads II–III• QRS complexes and T waves are normal
The QRS complexDepolarization of the whole ventricular muscle mass should occurwithin 120 ms, so this represents the maximum width of the normalQRS complex. Any widening indicates conduction delay or failurewithin the bundle branch system, pre-excitation (see below), or aventricular origin of depolarization – any of which may be seen inhealthy subjects.
Left bundle branch block is always a sign of heart disease. Rightbundle branch block with a QRS complex duration greater than120 ms is sometimes seen in healthy subjects, but should be taken as awarning of things like an atrial septal defect. Partial (incomplete) rightbundle branch block (RSR1 pattern in lead V1, but with a QRS complexduration less than 120 ms; Fig. 6.11) is very common and of nosignificance (Box 6.2).
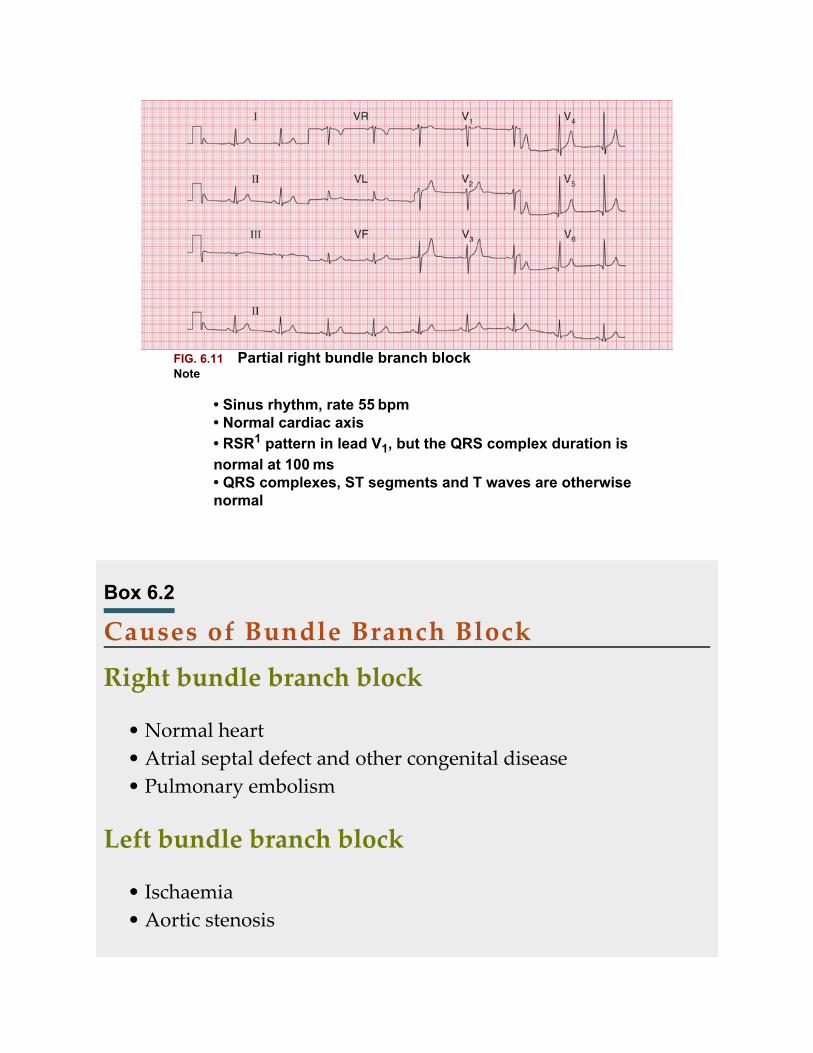
FIG. 6.11 Partial right bundle branch blockNote
• Sinus rhythm, rate 55 bpm• Normal cardiac axis• RSR1 pattern in lead V1, but the QRS complex duration isnormal at 100 ms• QRS complexes, ST segments and T waves are otherwisenormal
Box 6.2
Causes of Bundle Branch Block
Right bundle branch block
• Normal heart• Atrial septal defect and other congenital disease• Pulmonary embolism
Left bundle branch block
• Ischaemia• Aortic stenosis
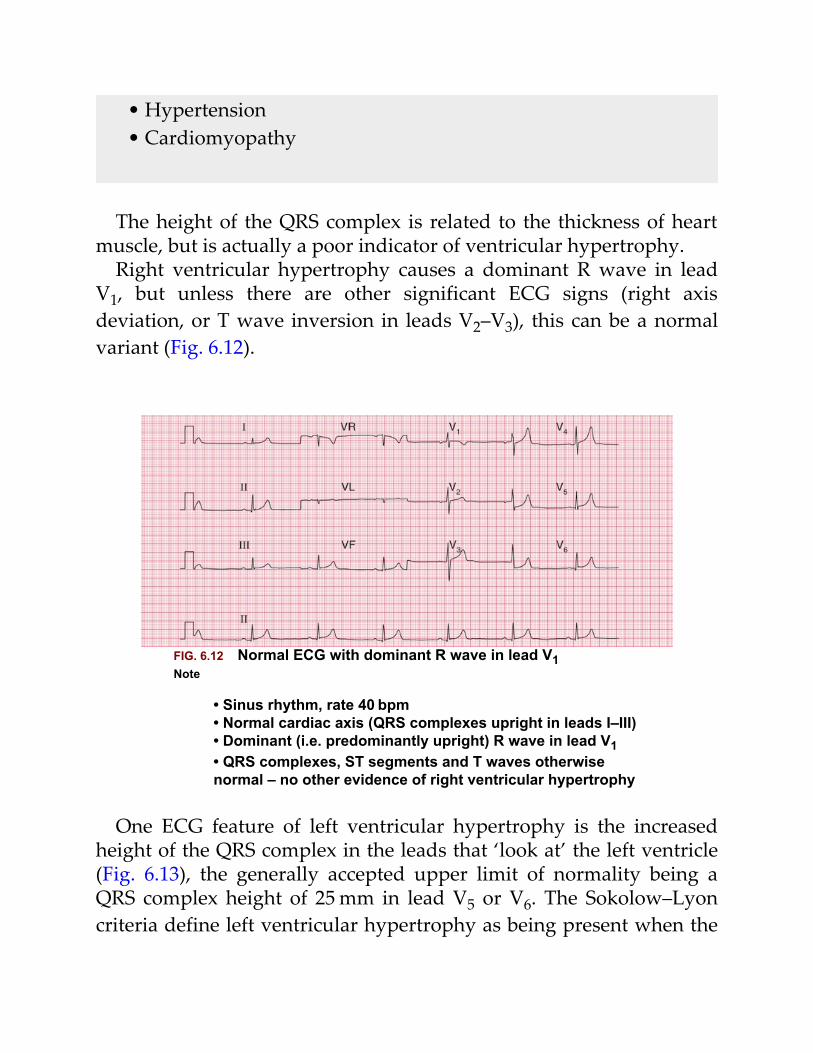
• Hypertension• Cardiomyopathy
The height of the QRS complex is related to the thickness of heartmuscle, but is actually a poor indicator of ventricular hypertrophy.
Right ventricular hypertrophy causes a dominant R wave in leadV1, but unless there are other significant ECG signs (right axisdeviation, or T wave inversion in leads V2–V3), this can be a normalvariant (Fig. 6.12).
FIG. 6.12 Normal ECG with dominant R wave in lead V1Note
• Sinus rhythm, rate 40 bpm• Normal cardiac axis (QRS complexes upright in leads I–III)• Dominant (i.e. predominantly upright) R wave in lead V1• QRS complexes, ST segments and T waves otherwisenormal – no other evidence of right ventricular hypertrophy
One ECG feature of left ventricular hypertrophy is the increasedheight of the QRS complex in the leads that ‘look at’ the left ventricle(Fig. 6.13), the generally accepted upper limit of normality being aQRS complex height of 25 mm in lead V5 or V6. The Sokolow–Lyoncriteria define left ventricular hypertrophy as being present when the
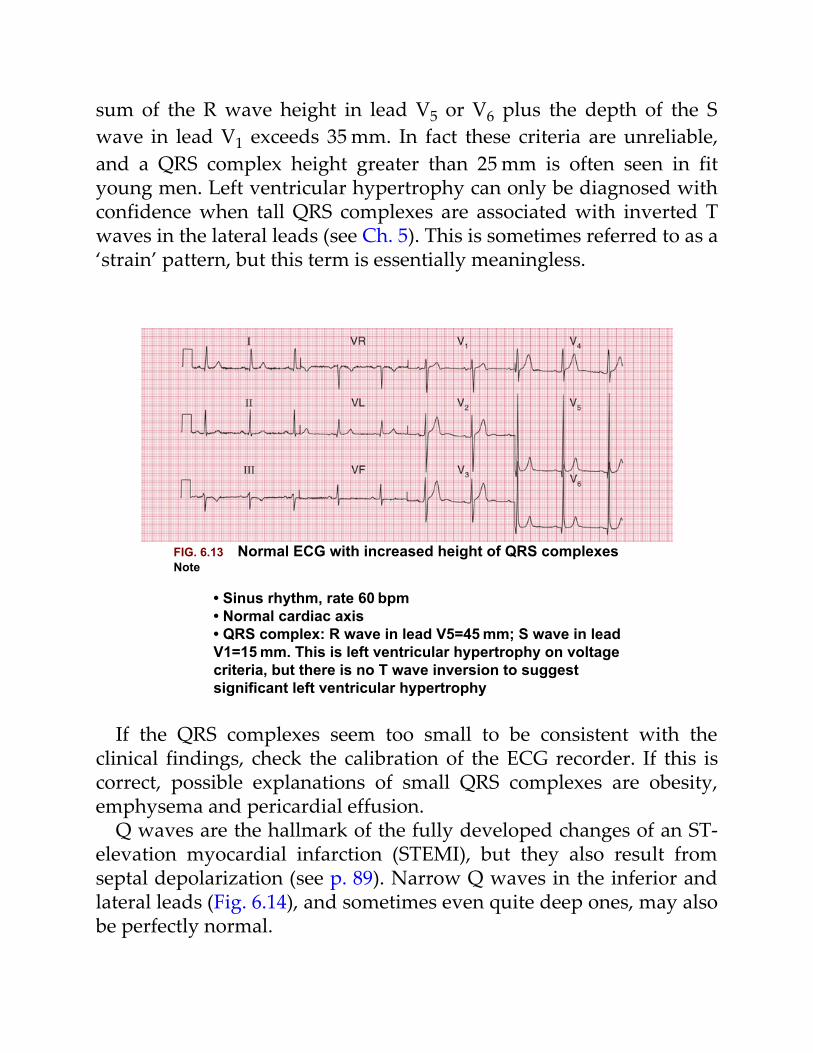
sum of the R wave height in lead V5 or V6 plus the depth of the Swave in lead V1 exceeds 35 mm. In fact these criteria are unreliable,and a QRS complex height greater than 25 mm is often seen in fityoung men. Left ventricular hypertrophy can only be diagnosed withconfidence when tall QRS complexes are associated with inverted Twaves in the lateral leads (see Ch. 5). This is sometimes referred to as a‘strain’ pattern, but this term is essentially meaningless.
FIG. 6.13 Normal ECG with increased height of QRS complexesNote
• Sinus rhythm, rate 60 bpm• Normal cardiac axis• QRS complex: R wave in lead V5=45 mm; S wave in leadV1=15 mm. This is left ventricular hypertrophy on voltagecriteria, but there is no T wave inversion to suggestsignificant left ventricular hypertrophy
If the QRS complexes seem too small to be consistent with theclinical findings, check the calibration of the ECG recorder. If this iscorrect, possible explanations of small QRS complexes are obesity,emphysema and pericardial effusion.
Q waves are the hallmark of the fully developed changes of an ST-elevation myocardial infarction (STEMI), but they also result fromseptal depolarization (see p. 89). Narrow Q waves in the inferior andlateral leads (Fig. 6.14), and sometimes even quite deep ones, may alsobe perfectly normal.
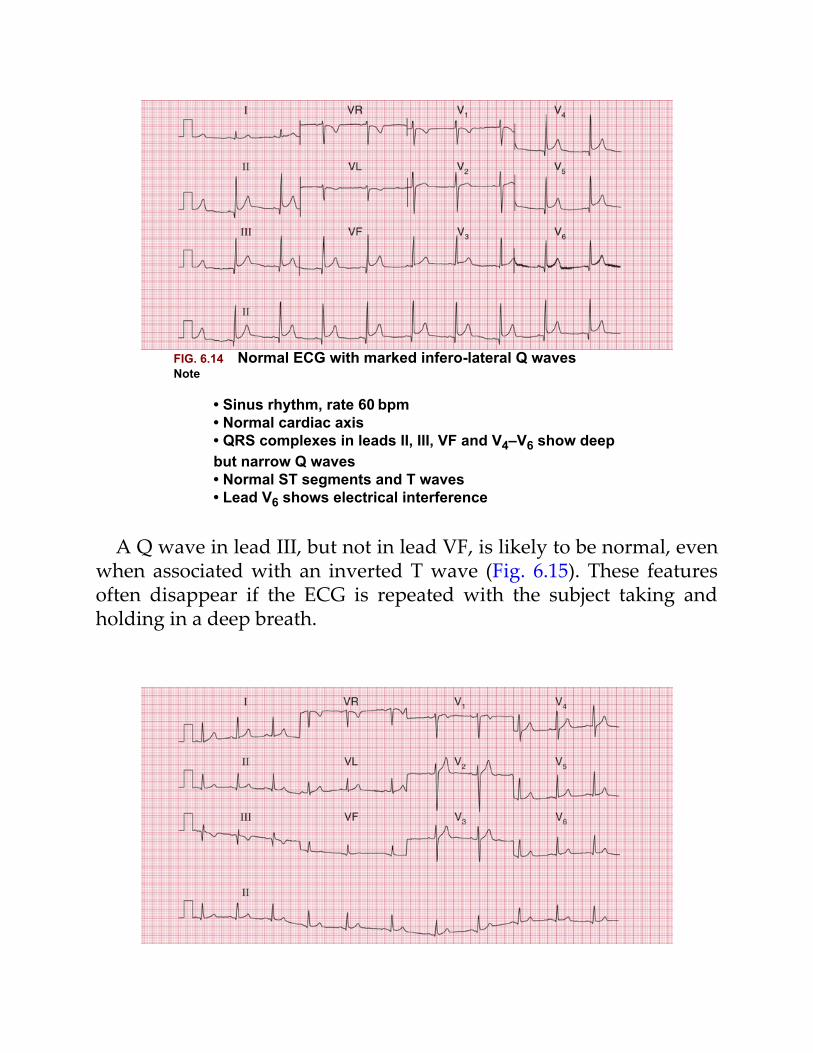
FIG. 6.14 Normal ECG with marked infero-lateral Q wavesNote
• Sinus rhythm, rate 60 bpm• Normal cardiac axis• QRS complexes in leads II, III, VF and V4–V6 show deepbut narrow Q waves• Normal ST segments and T waves• Lead V6 shows electrical interference
A Q wave in lead III, but not in lead VF, is likely to be normal, evenwhen associated with an inverted T wave (Fig. 6.15). These featuresoften disappear if the ECG is repeated with the subject taking andholding in a deep breath.
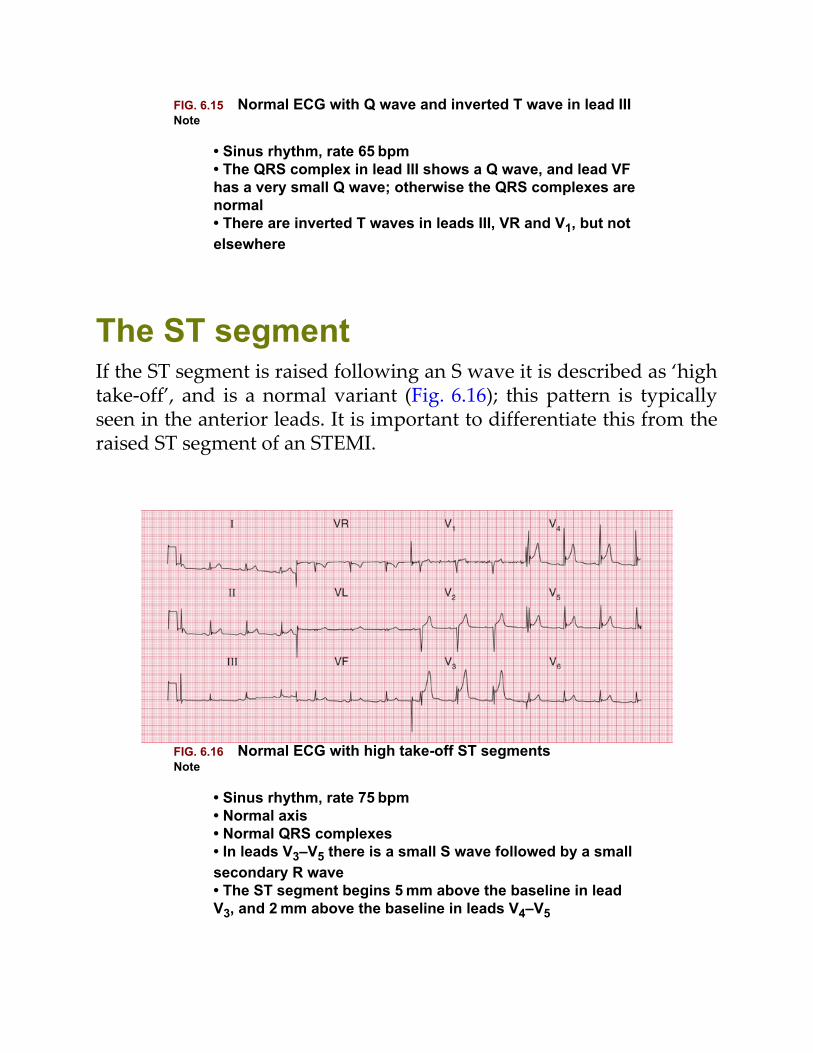
FIG. 6.15 Normal ECG with Q wave and inverted T wave in lead IIINote
• Sinus rhythm, rate 65 bpm• The QRS complex in lead III shows a Q wave, and lead VFhas a very small Q wave; otherwise the QRS complexes arenormal• There are inverted T waves in leads III, VR and V1, but notelsewhere
The ST segmentIf the ST segment is raised following an S wave it is described as ‘hightake-off’, and is a normal variant (Fig. 6.16); this pattern is typicallyseen in the anterior leads. It is important to differentiate this from theraised ST segment of an STEMI.
FIG. 6.16 Normal ECG with high take-off ST segmentsNote
• Sinus rhythm, rate 75 bpm• Normal axis• Normal QRS complexes• In leads V3–V5 there is a small S wave followed by a smallsecondary R wave• The ST segment begins 5 mm above the baseline in leadV3, and 2 mm above the baseline in leads V4–V5
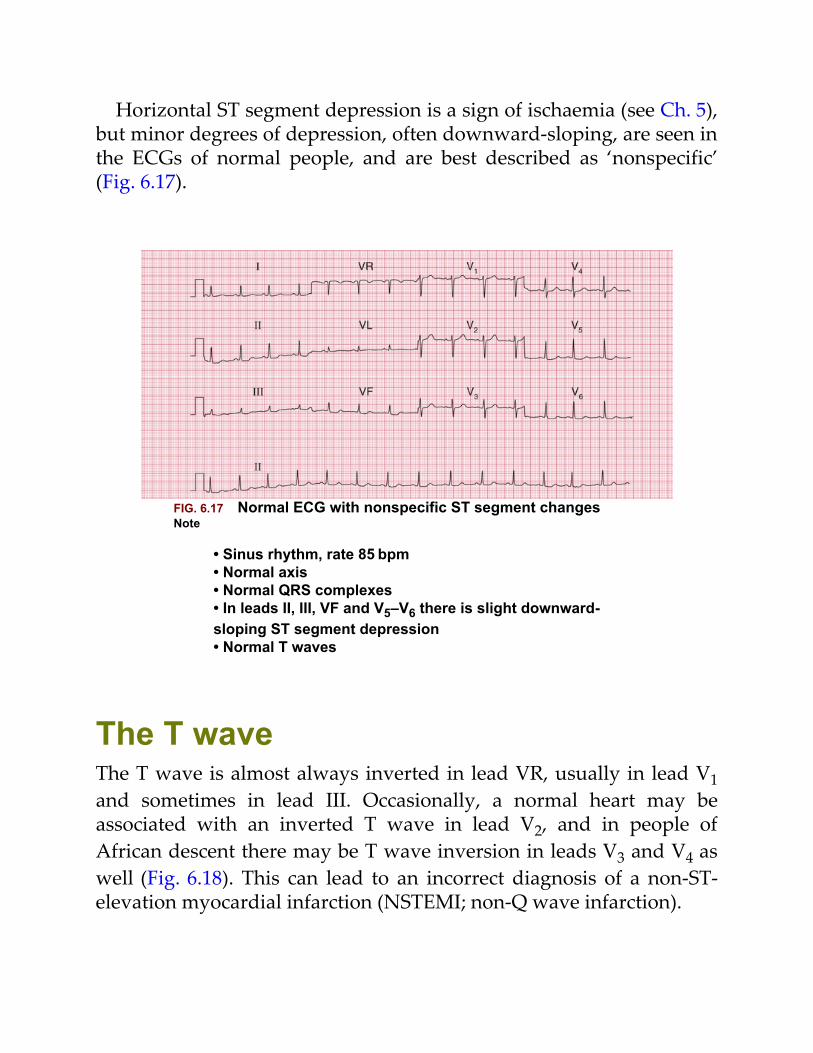
Horizontal ST segment depression is a sign of ischaemia (see Ch. 5),but minor degrees of depression, often downward-sloping, are seen inthe ECGs of normal people, and are best described as ‘nonspecific’(Fig. 6.17).
FIG. 6.17 Normal ECG with nonspecific ST segment changesNote
• Sinus rhythm, rate 85 bpm• Normal axis• Normal QRS complexes• In leads II, III, VF and V5–V6 there is slight downward-sloping ST segment depression• Normal T waves
The T waveThe T wave is almost always inverted in lead VR, usually in lead V1and sometimes in lead III. Occasionally, a normal heart may beassociated with an inverted T wave in lead V2, and in people ofAfrican descent there may be T wave inversion in leads V3 and V4 aswell (Fig. 6.18). This can lead to an incorrect diagnosis of a non-ST-elevation myocardial infarction (NSTEMI; non-Q wave infarction).
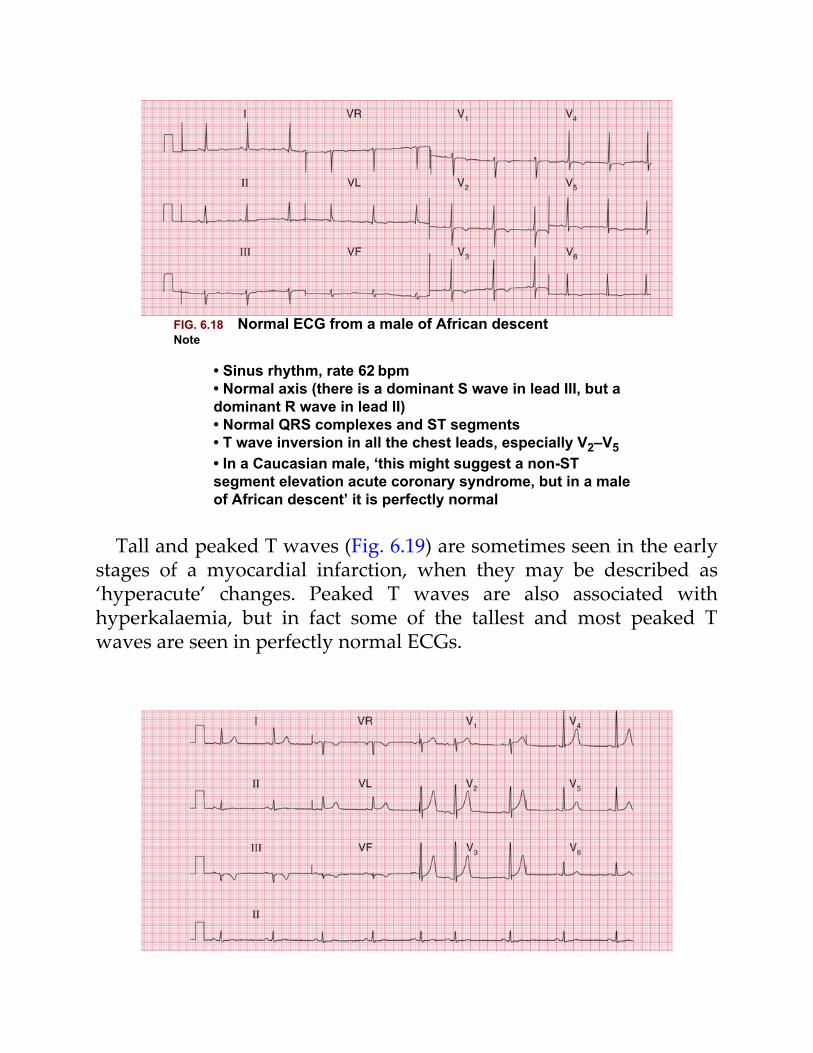
FIG. 6.18 Normal ECG from a male of African descentNote
• Sinus rhythm, rate 62 bpm• Normal axis (there is a dominant S wave in lead III, but adominant R wave in lead II)• Normal QRS complexes and ST segments• T wave inversion in all the chest leads, especially V2–V5• In a Caucasian male, ‘this might suggest a non-STsegment elevation acute coronary syndrome, but in a maleof African descent’ it is perfectly normal
Tall and peaked T waves (Fig. 6.19) are sometimes seen in the earlystages of a myocardial infarction, when they may be described as‘hyperacute’ changes. Peaked T waves are also associated withhyperkalaemia, but in fact some of the tallest and most peaked Twaves are seen in perfectly normal ECGs.
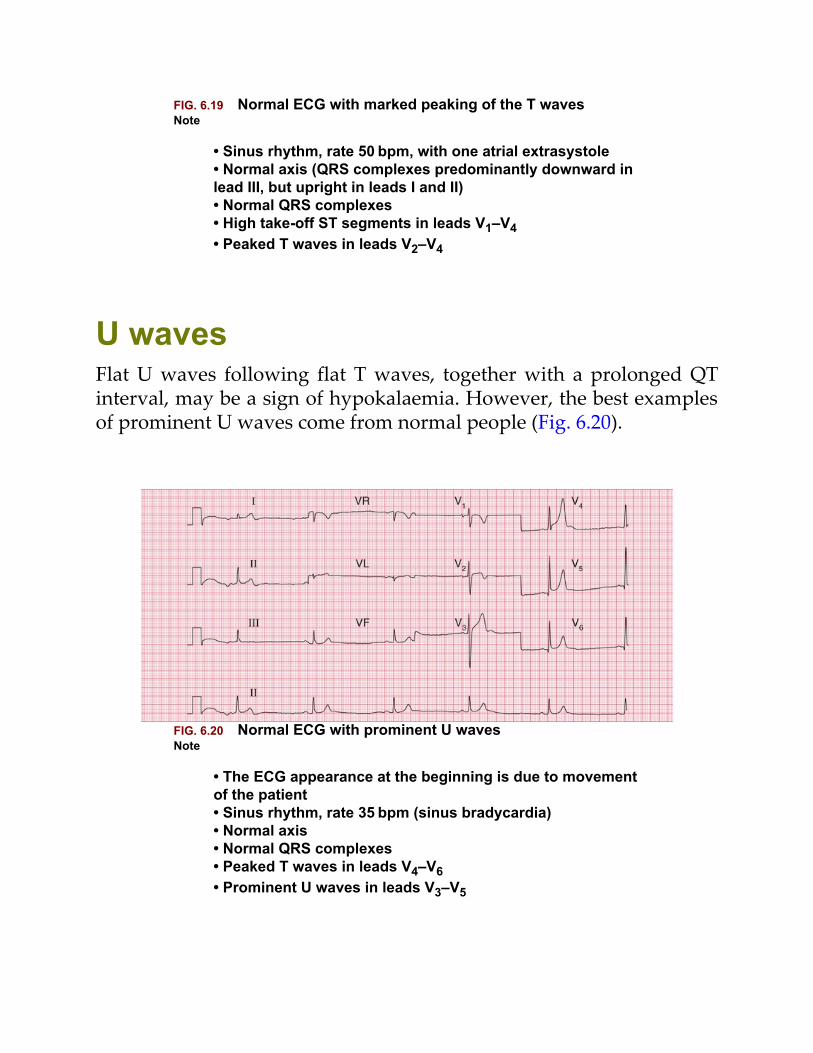
FIG. 6.19 Normal ECG with marked peaking of the T wavesNote
• Sinus rhythm, rate 50 bpm, with one atrial extrasystole• Normal axis (QRS complexes predominantly downward inlead III, but upright in leads I and II)• Normal QRS complexes• High take-off ST segments in leads V1–V4• Peaked T waves in leads V2–V4
U wavesFlat U waves following flat T waves, together with a prolonged QTinterval, may be a sign of hypokalaemia. However, the best examplesof prominent U waves come from normal people (Fig. 6.20).
FIG. 6.20 Normal ECG with prominent U wavesNote
• The ECG appearance at the beginning is due to movementof the patient• Sinus rhythm, rate 35 bpm (sinus bradycardia)• Normal axis• Normal QRS complexes• Peaked T waves in leads V4–V6• Prominent U waves in leads V3–V5
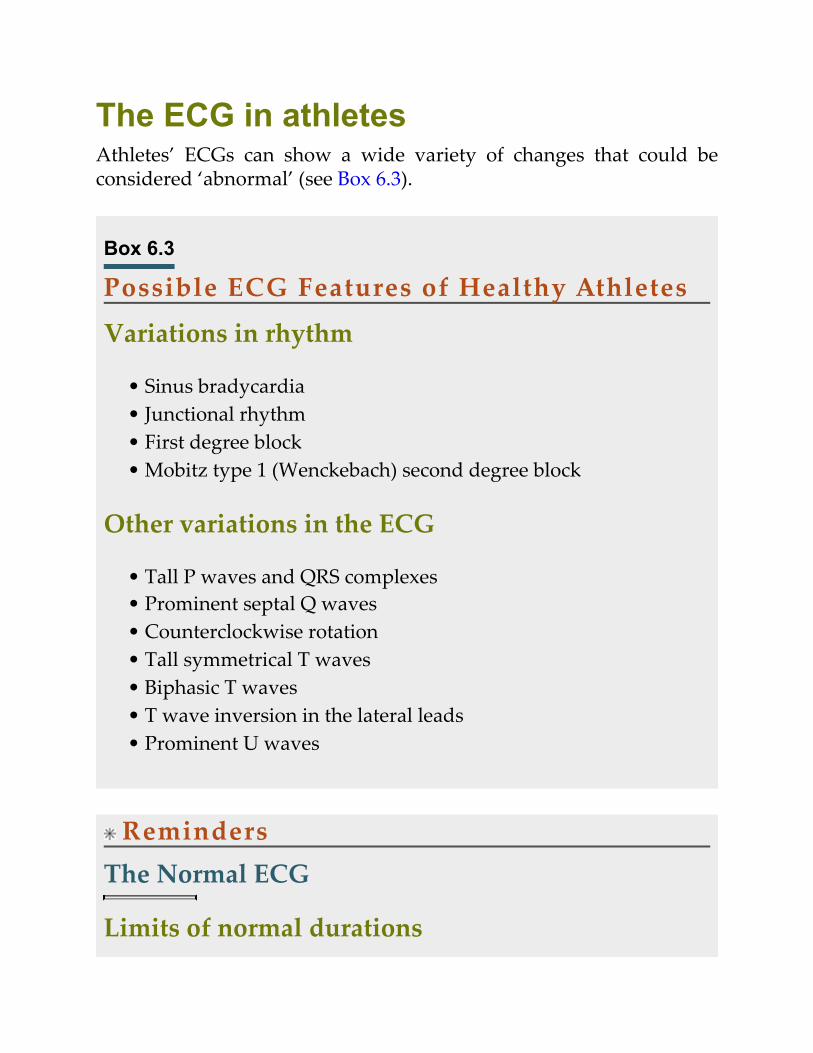
The ECG in athletesAthletes’ ECGs can show a wide variety of changes that could beconsidered ‘abnormal’ (see Box 6.3).
Box 6.3
Possible ECG Features of Healthy Athletes
Variations in rhythm
• Sinus bradycardia• Junctional rhythm• First degree block• Mobitz type 1 (Wenckebach) second degree block
Other variations in the ECG
• Tall P waves and QRS complexes• Prominent septal Q waves• Counterclockwise rotation• Tall symmetrical T waves• Biphasic T waves• T wave inversion in the lateral leads• Prominent U waves
RemindersThe Normal ECG
Limits of normal durations
• PR interval: 200 ms.• QRS complex duration: 120 ms.• QTc interval: 480 ms.
Rhythm
• Sinus arrhythmia.• Supraventricular extrasystoles are always normal.
The cardiac axis
• Normal axis: QRS complexes predominantly upward in leads I,II and III; still normal if the QRS complex is downward in leadIII.
• Minor degrees of right and left axis deviation are within thenormal range.
QRS complex
• Small Q waves are normal in leads I, VL and V6 (septal Qwaves).
• RSR1 pattern in lead V1 is normal if the duration is less than120 ms (partial right bundle branch block).
• R wave is smaller than S wave in lead V1.• R wave in lead V6 is less than 25 mm.• R wave in lead V6 plus S wave in lead V1 is less than 35 mm.
ST segment
• Should be isoelectric.
T wave
• May be inverted in:– lead III– lead VR– lead V1– leads V2 and V3, in people of African descent.
For more on the normal ECG, see ECG Made Practical, 7th edition,Chapter 1
For more on electrolyte abnormalities, see ECG Made Practical, 7th
edition, Chapter 8 For more on ventricular hypertrophy, see ECG Made Practical, 7th
edition, Chapter 7
7
The ECG in patients with chestpain or breathlessness
The ECG in patients with constant chest pain 123The ECG in acute coronary syndromes 123Unstable angina 124STEMI 124NSTEMI 135
The ECG in patients with intermittent chest pain 137The ECG in patients with breathlessness 137
Breathlessness due to heart disease 137Breathlessness due to lung disease 140
Chest pain is a very common complaint, and when reviewing the ECGof a patient with chest pain it is essential to remember that there arecauses other than myocardial ischaemia (Box 7.1).
Box 7.1
Causes of Chest Pain
Acute chest pain
• Myocardial infarction
• Pulmonary embolism• Pneumothorax and other pleuritic disease• Pericarditis• Aortic dissection
Intermittent chest pain
• Angina• Oesophageal pain• Musculoskeletal pain• Nonspecific pain
There are a few features of chest pain that make the diagnosisobvious. Chest pain that radiates to the teeth or jaw is probablycardiac in origin; pain that is worse on inspiration is either pleuritic ordue to pericarditis; and pain in the back may be due to eithermyocardial ischaemia or aortic dissection. The ECG will help todifferentiate these causes of pain but it is not infallible – for example,if an aortic dissection affects the coronary artery ostia, it can causemyocardial ischaemia.
The ECG in patients with constantchest painThe ECG in acute coronary syndromes‘Acute coronary syndrome’ is a term that covers a spectrum of clinicalconditions caused by the rupture of atheromatous plaque within acoronary artery. On the exposed core of the plaque a thrombus forms,and this can cause total or partial occlusion of the artery. The clinicalsyndrome ranges from angina at rest (unstable angina) to transmuralmyocardial infarction, and some definitions of acute coronary
syndrome also include sudden death due to coronary occlusion. Thediagnosis of acute coronary syndrome is based on the clinicalpresentation (including a previous history of coronary disease), ECGchanges and biochemical markers, principally troponin.
If a patient has chest pain and there is ECG evidence of myocardialischaemia but a normal plasma troponin level, then the diagnosis isacute coronary syndrome due to unstable angina. Myocardial necrosiscauses a rise in the level of plasma troponin (either troponin T ortroponin I), and a high-sensitivity assay can detect a very small rise.By some definitions, any such rise in a clinical situation suggestingmyocardial ischaemia justifies a diagnosis of myocardial infarction.However, the plasma troponin level may also rise in other conditions,which may also be associated with chest pain (Box 7.2). It is essentialto remember that the plasma troponin level may not rise for up to 12 hafter the onset of chest pain due to a myocardial infarction.
Box 7.2
Common Causes of Plasma Troponin LevelElevation in the Absence of AcuteMyocardial Infarction
• Acute pulmonary embolism• Acute pericarditis• Acute or severe heart failure• Sepsis and/or shock• Renal failure• False positive (laboratory problems, including the presence of
heterophilic antibodies and rheumatoid factor)
Thus the ECG is an essential tool in the diagnosis of an acutecoronary syndrome. Importantly, it also distinguishes between two
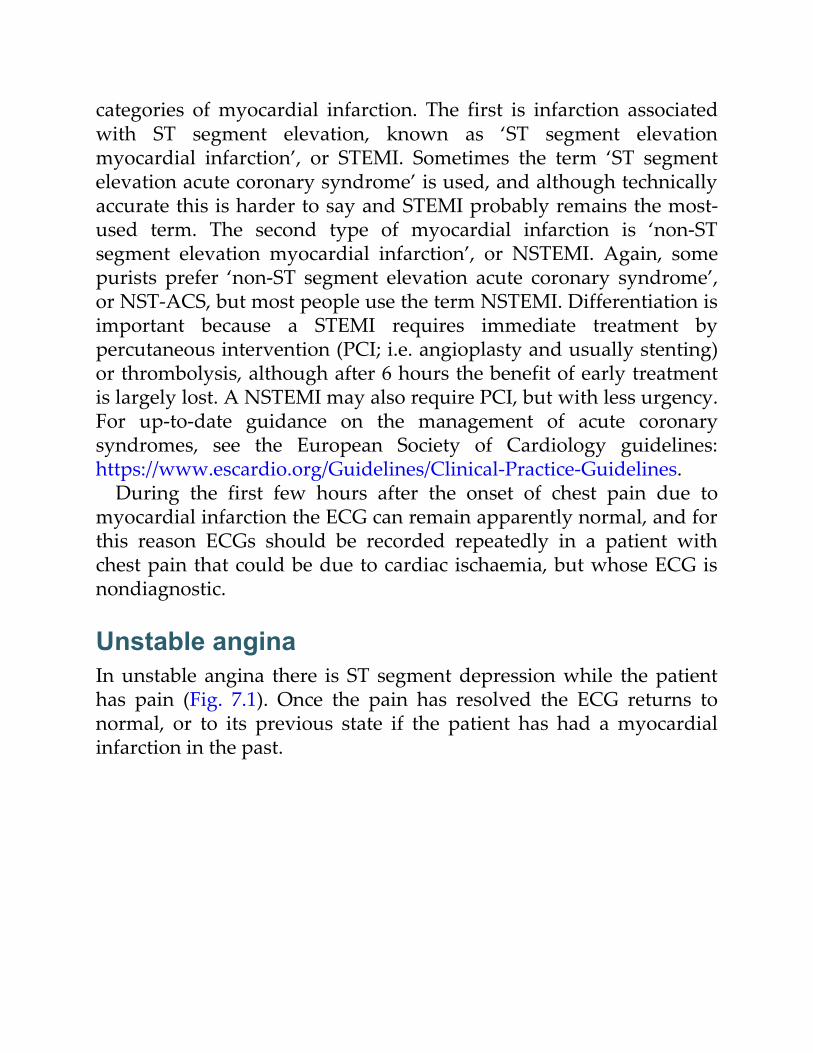
categories of myocardial infarction. The first is infarction associatedwith ST segment elevation, known as ‘ST segment elevationmyocardial infarction’, or STEMI. Sometimes the term ‘ST segmentelevation acute coronary syndrome’ is used, and although technicallyaccurate this is harder to say and STEMI probably remains the most-used term. The second type of myocardial infarction is ‘non-STsegment elevation myocardial infarction’, or NSTEMI. Again, somepurists prefer ‘non-ST segment elevation acute coronary syndrome’,or NST-ACS, but most people use the term NSTEMI. Differentiation isimportant because a STEMI requires immediate treatment bypercutaneous intervention (PCI; i.e. angioplasty and usually stenting)or thrombolysis, although after 6 hours the benefit of early treatmentis largely lost. A NSTEMI may also require PCI, but with less urgency.For up-to-date guidance on the management of acute coronarysyndromes, see the European Society of Cardiology guidelines:https://www.escardio.org/Guidelines/Clinical-Practice-Guidelines.
During the first few hours after the onset of chest pain due tomyocardial infarction the ECG can remain apparently normal, and forthis reason ECGs should be recorded repeatedly in a patient withchest pain that could be due to cardiac ischaemia, but whose ECG isnondiagnostic.
Unstable anginaIn unstable angina there is ST segment depression while the patienthas pain (Fig. 7.1). Once the pain has resolved the ECG returns tonormal, or to its previous state if the patient has had a myocardialinfarction in the past.
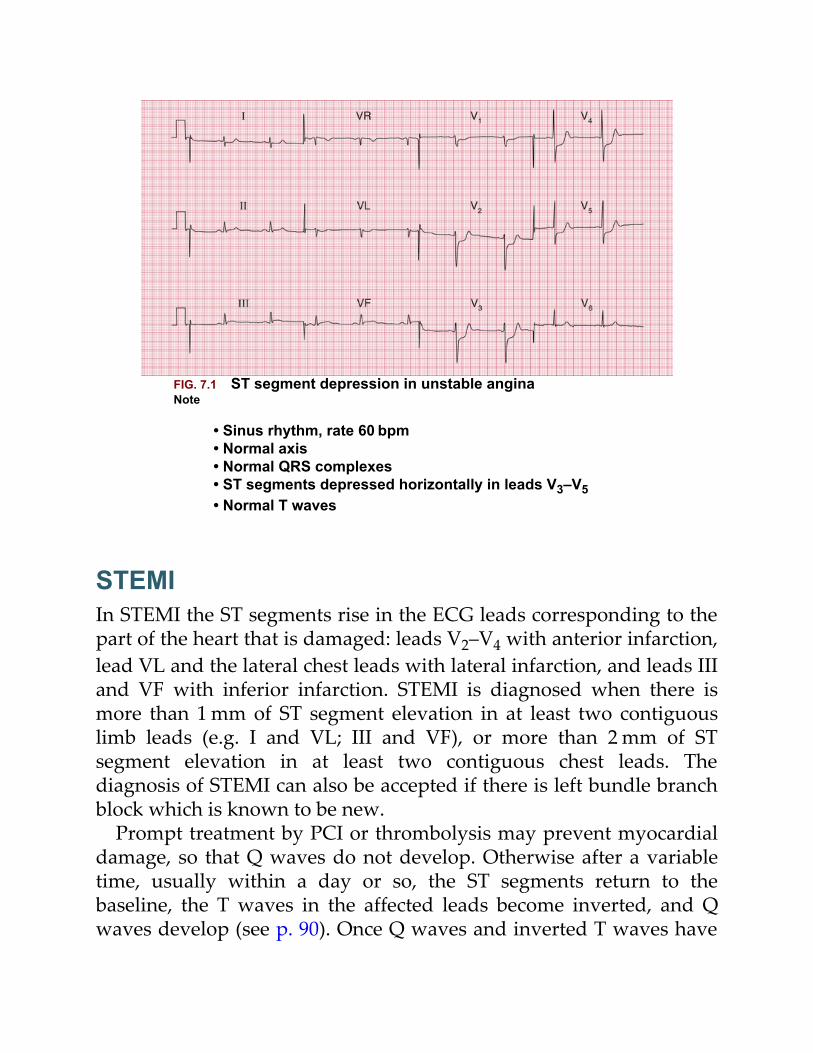
FIG. 7.1 ST segment depression in unstable anginaNote
• Sinus rhythm, rate 60 bpm• Normal axis• Normal QRS complexes• ST segments depressed horizontally in leads V3–V5• Normal T waves
STEMIIn STEMI the ST segments rise in the ECG leads corresponding to thepart of the heart that is damaged: leads V2–V4 with anterior infarction,lead VL and the lateral chest leads with lateral infarction, and leads IIIand VF with inferior infarction. STEMI is diagnosed when there ismore than 1 mm of ST segment elevation in at least two contiguouslimb leads (e.g. I and VL; III and VF), or more than 2 mm of STsegment elevation in at least two contiguous chest leads. Thediagnosis of STEMI can also be accepted if there is left bundle branchblock which is known to be new.
Prompt treatment by PCI or thrombolysis may prevent myocardialdamage, so that Q waves do not develop. Otherwise after a variabletime, usually within a day or so, the ST segments return to thebaseline, the T waves in the affected leads become inverted, and Qwaves develop (see p. 90). Once Q waves and inverted T waves have
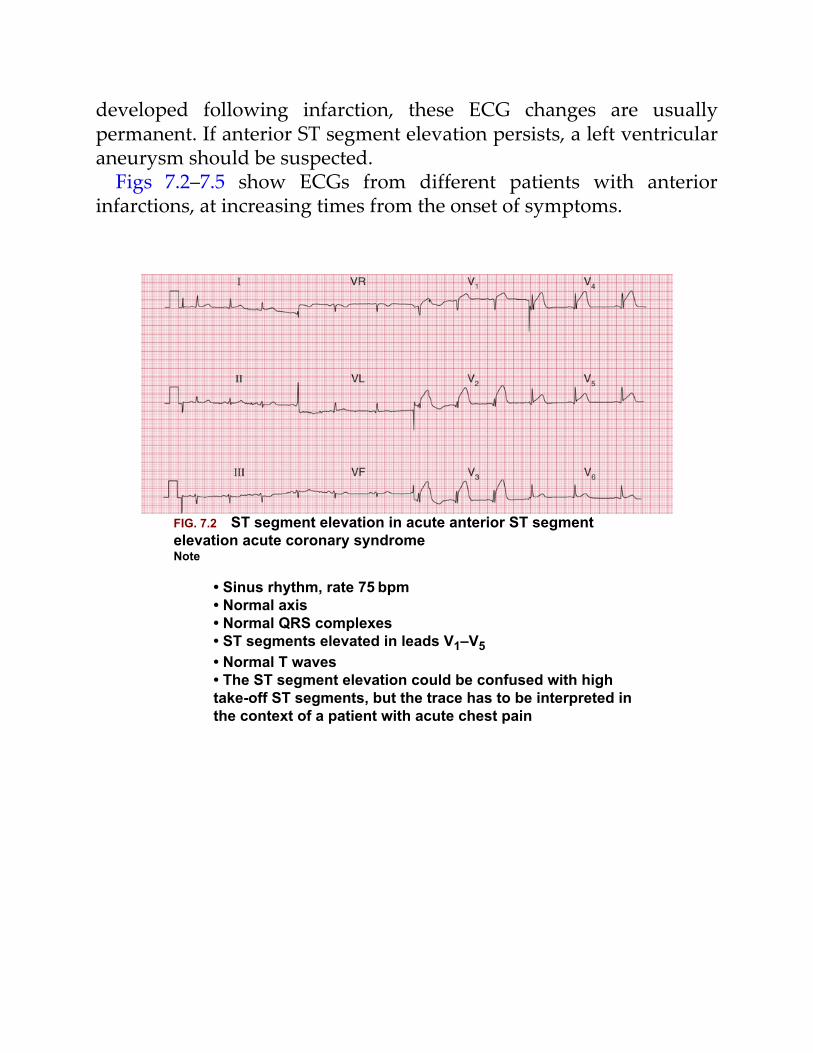
developed following infarction, these ECG changes are usuallypermanent. If anterior ST segment elevation persists, a left ventricularaneurysm should be suspected.
Figs 7.2–7.5 show ECGs from different patients with anteriorinfarctions, at increasing times from the onset of symptoms.
FIG. 7.2 ST segment elevation in acute anterior ST segmentelevation acute coronary syndromeNote
• Sinus rhythm, rate 75 bpm• Normal axis• Normal QRS complexes• ST segments elevated in leads V1–V5• Normal T waves• The ST segment elevation could be confused with hightake-off ST segments, but the trace has to be interpreted inthe context of a patient with acute chest pain
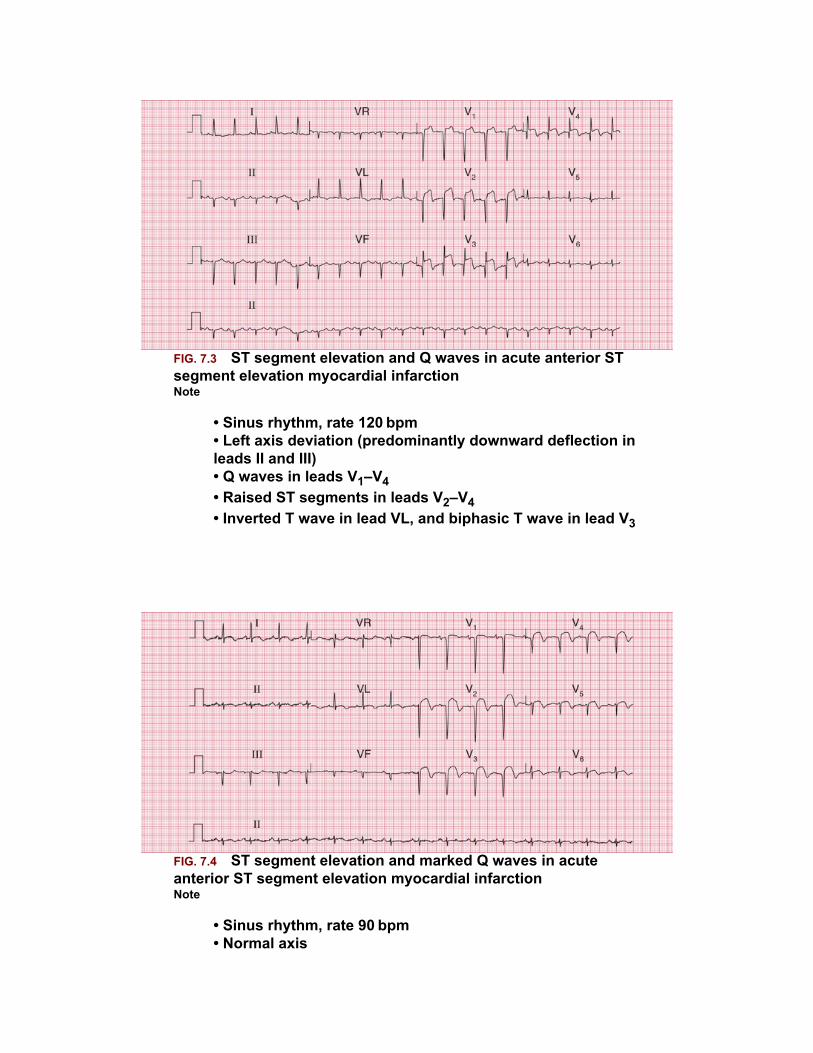
FIG. 7.3 ST segment elevation and Q waves in acute anterior STsegment elevation myocardial infarctionNote
• Sinus rhythm, rate 120 bpm• Left axis deviation (predominantly downward deflection inleads II and III)• Q waves in leads V1–V4• Raised ST segments in leads V2–V4• Inverted T wave in lead VL, and biphasic T wave in lead V3
FIG. 7.4 ST segment elevation and marked Q waves in acuteanterior ST segment elevation myocardial infarctionNote
• Sinus rhythm, rate 90 bpm• Normal axis
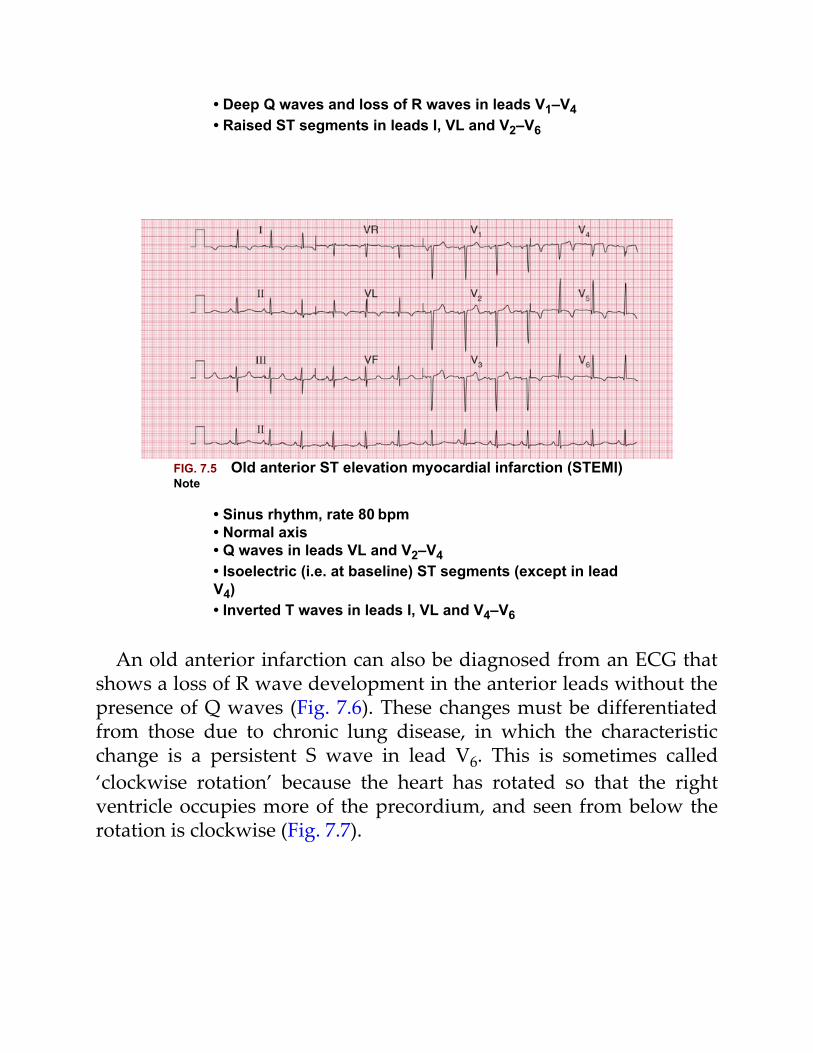
• Deep Q waves and loss of R waves in leads V1–V4• Raised ST segments in leads I, VL and V2–V6
FIG. 7.5 Old anterior ST elevation myocardial infarction (STEMI)Note
• Sinus rhythm, rate 80 bpm• Normal axis• Q waves in leads VL and V2–V4• Isoelectric (i.e. at baseline) ST segments (except in leadV4)• Inverted T waves in leads I, VL and V4–V6
An old anterior infarction can also be diagnosed from an ECG thatshows a loss of R wave development in the anterior leads without thepresence of Q waves (Fig. 7.6). These changes must be differentiatedfrom those due to chronic lung disease, in which the characteristicchange is a persistent S wave in lead V6. This is sometimes called‘clockwise rotation’ because the heart has rotated so that the rightventricle occupies more of the precordium, and seen from below therotation is clockwise (Fig. 7.7).

FIG. 7.6 Old anterior myocardial infarction with poor R waveprogression in the anterior leadsNote
• Sinus rhythm, rate 80 bpm• Normal axis (dominant S wave in lead III, butpredominantly upright complex in leads I and II)• Isoelectric ST segments• The normal steady progression of R wave development inthe anterior leads is missing, with no R wave in lead V3 buta normal R wave in lead V4• Small Q wave and inverted T wave in lead VL• This pattern might be due to inaccurate placement of theV3 electrode, though the abnormal pattern in lead VLsuggests cardiac disease. The ECG should be repeated
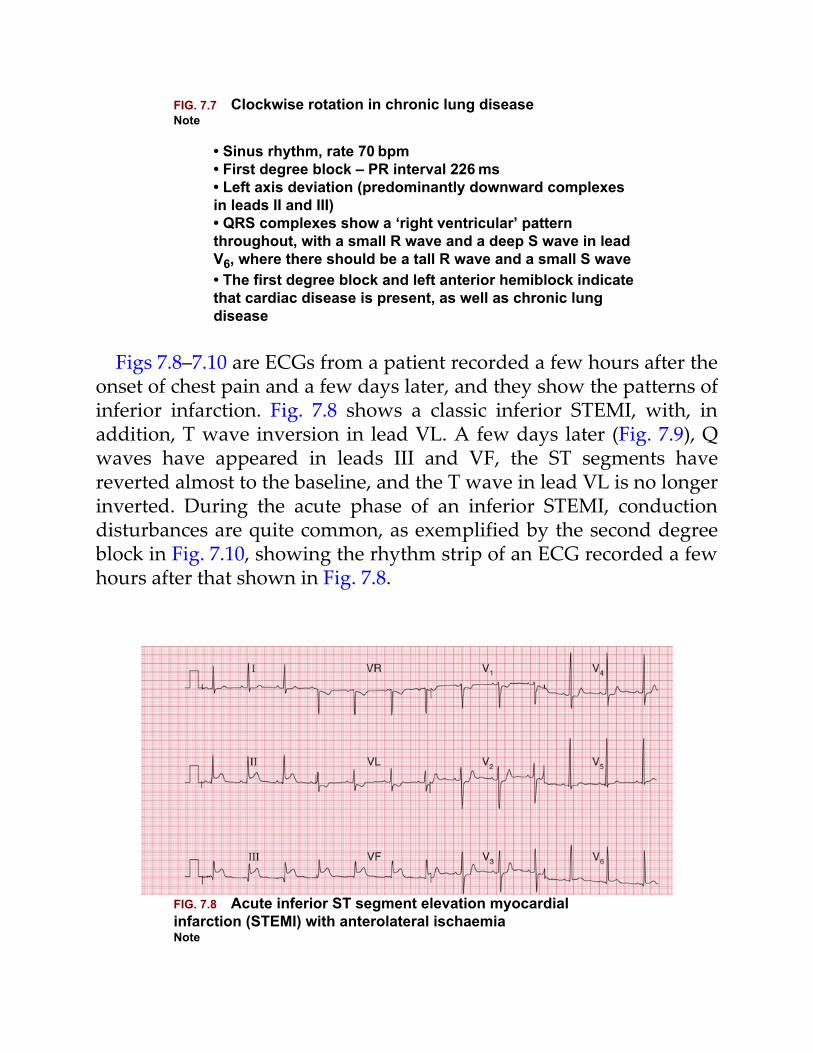
FIG. 7.7 Clockwise rotation in chronic lung diseaseNote
• Sinus rhythm, rate 70 bpm• First degree block – PR interval 226 ms• Left axis deviation (predominantly downward complexesin leads II and III)• QRS complexes show a ‘right ventricular’ patternthroughout, with a small R wave and a deep S wave in leadV6, where there should be a tall R wave and a small S wave• The first degree block and left anterior hemiblock indicatethat cardiac disease is present, as well as chronic lungdisease
Figs 7.8–7.10 are ECGs from a patient recorded a few hours after theonset of chest pain and a few days later, and they show the patterns ofinferior infarction. Fig. 7.8 shows a classic inferior STEMI, with, inaddition, T wave inversion in lead VL. A few days later (Fig. 7.9), Qwaves have appeared in leads III and VF, the ST segments havereverted almost to the baseline, and the T wave in lead VL is no longerinverted. During the acute phase of an inferior STEMI, conductiondisturbances are quite common, as exemplified by the second degreeblock in Fig. 7.10, showing the rhythm strip of an ECG recorded a fewhours after that shown in Fig. 7.8.
FIG. 7.8 Acute inferior ST segment elevation myocardialinfarction (STEMI) with anterolateral ischaemiaNote
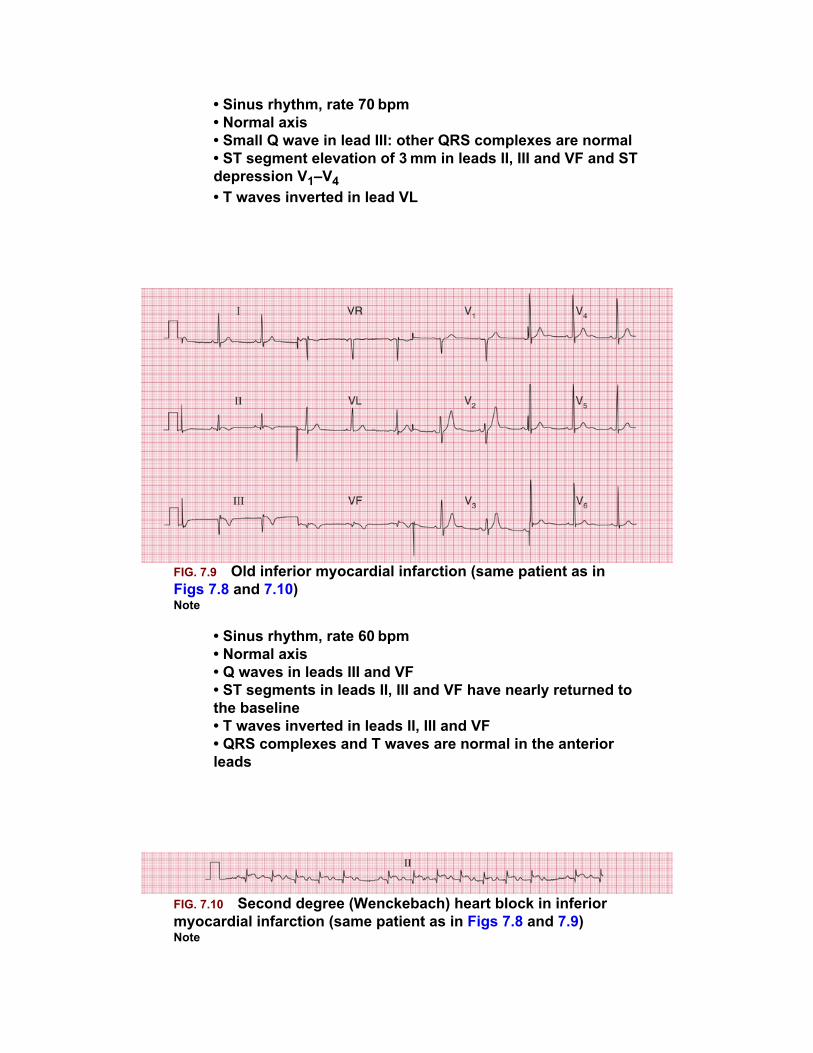
• Sinus rhythm, rate 70 bpm• Normal axis• Small Q wave in lead III: other QRS complexes are normal• ST segment elevation of 3 mm in leads II, III and VF and STdepression V1–V4• T waves inverted in lead VL
FIG. 7.9 Old inferior myocardial infarction (same patient as inFigs 7.8 and 7.10)Note
• Sinus rhythm, rate 60 bpm• Normal axis• Q waves in leads III and VF• ST segments in leads II, III and VF have nearly returned tothe baseline• T waves inverted in leads II, III and VF• QRS complexes and T waves are normal in the anteriorleads
FIG. 7.10 Second degree (Wenckebach) heart block in inferiormyocardial infarction (same patient as in Figs 7.8 and 7.9)Note

• Progressive lengthening of the PR interval in the first fewbeats, followed by a nonconducted P wave, and then asimilar sequence
When an infarction develops in the posterior wall of the leftventricle, Q waves can only be elicited by placing the chest lead on thepatient's back. In a routine ECG there will be a dominant R wave inlead V1, caused by unopposed anterior depolarization (Fig. 7.11). Thispattern must be differentiated from the dominant R wave in lead V1seen in pulmonary hypertension (see below), and from the dominantR wave that can be a normal variant. Differentiation is best made inthe light of the patient's history and the physical findings (see also Fig.5.11).
FIG. 7.11 Old posterior myocardial infarctionNote
• Sinus rhythm, rate 85 bpm• Dominant R wave in lead V1• ST segment depression in leads V1–V3• T wave inversion in leads II, III, VF and V5–V6• This pattern might be confused with a normal variant, orwith right ventricular hypertrophy, but the ST segment andT wave changes suggest ischaemia, and there is no rightaxis deviation as would be expected with right ventricularhypertrophy
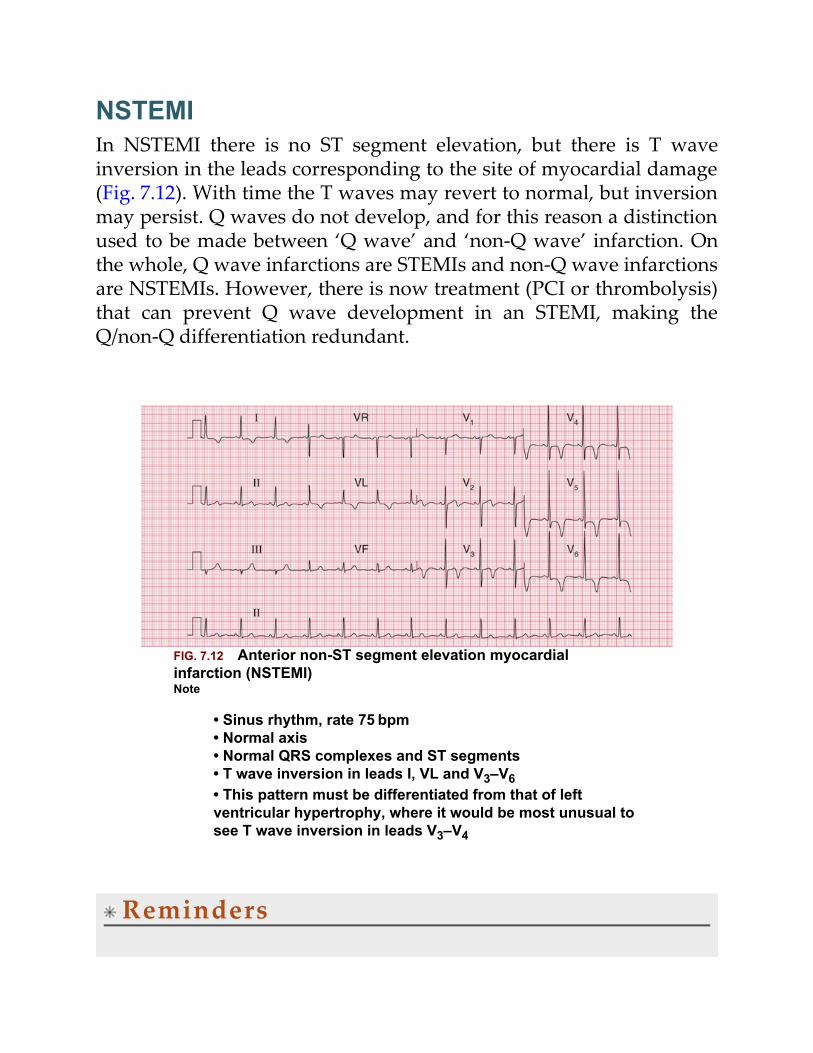
NSTEMIIn NSTEMI there is no ST segment elevation, but there is T waveinversion in the leads corresponding to the site of myocardial damage(Fig. 7.12). With time the T waves may revert to normal, but inversionmay persist. Q waves do not develop, and for this reason a distinctionused to be made between ‘Q wave’ and ‘non-Q wave’ infarction. Onthe whole, Q wave infarctions are STEMIs and non-Q wave infarctionsare NSTEMIs. However, there is now treatment (PCI or thrombolysis)that can prevent Q wave development in an STEMI, making theQ/non-Q differentiation redundant.
FIG. 7.12 Anterior non-ST segment elevation myocardialinfarction (NSTEMI)Note
• Sinus rhythm, rate 75 bpm• Normal axis• Normal QRS complexes and ST segments• T wave inversion in leads I, VL and V3–V6• This pattern must be differentiated from that of leftventricular hypertrophy, where it would be most unusual tosee T wave inversion in leads V3–V4
Reminders
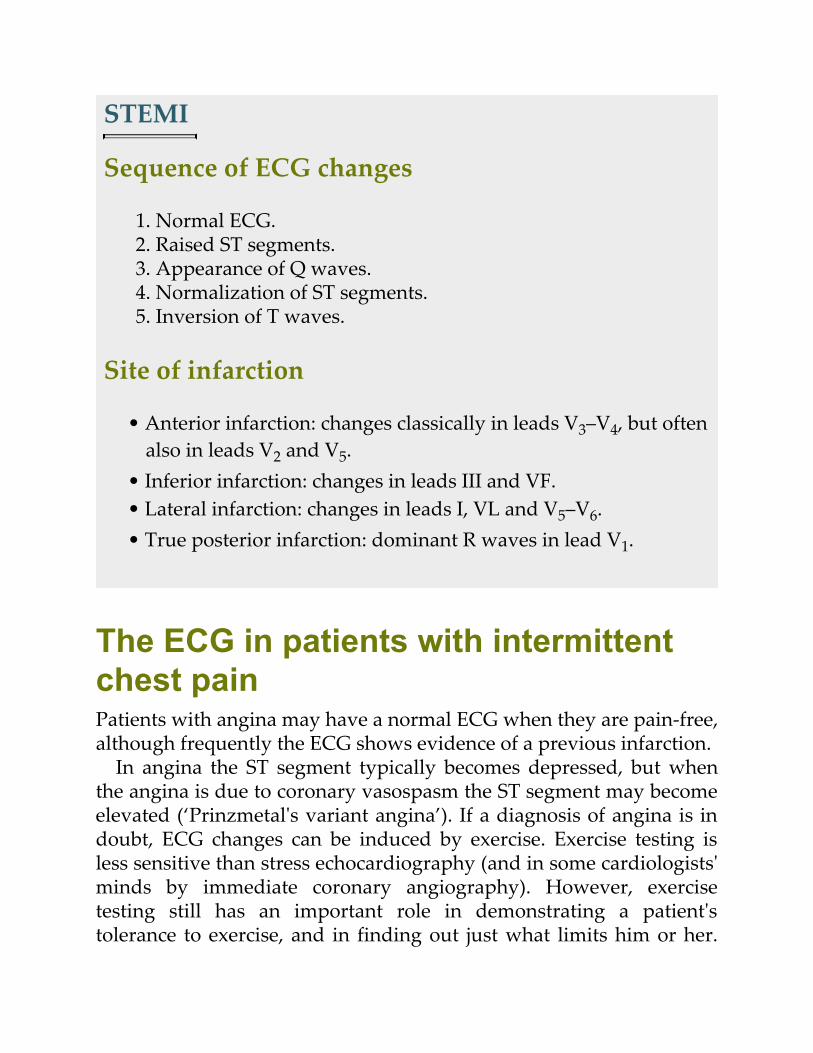
STEMI
Sequence of ECG changes
1. Normal ECG.2. Raised ST segments.3. Appearance of Q waves.4. Normalization of ST segments.5. Inversion of T waves.
Site of infarction
• Anterior infarction: changes classically in leads V3–V4, but oftenalso in leads V2 and V5.
• Inferior infarction: changes in leads III and VF.• Lateral infarction: changes in leads I, VL and V5–V6.• True posterior infarction: dominant R waves in lead V1.
The ECG in patients with intermittentchest painPatients with angina may have a normal ECG when they are pain-free,although frequently the ECG shows evidence of a previous infarction.
In angina the ST segment typically becomes depressed, but whenthe angina is due to coronary vasospasm the ST segment may becomeelevated (‘Prinzmetal's variant angina’). If a diagnosis of angina is indoubt, ECG changes can be induced by exercise. Exercise testing isless sensitive than stress echocardiography (and in some cardiologists'minds by immediate coronary angiography). However, exercisetesting still has an important role in demonstrating a patient'stolerance to exercise, and in finding out just what limits him or her.
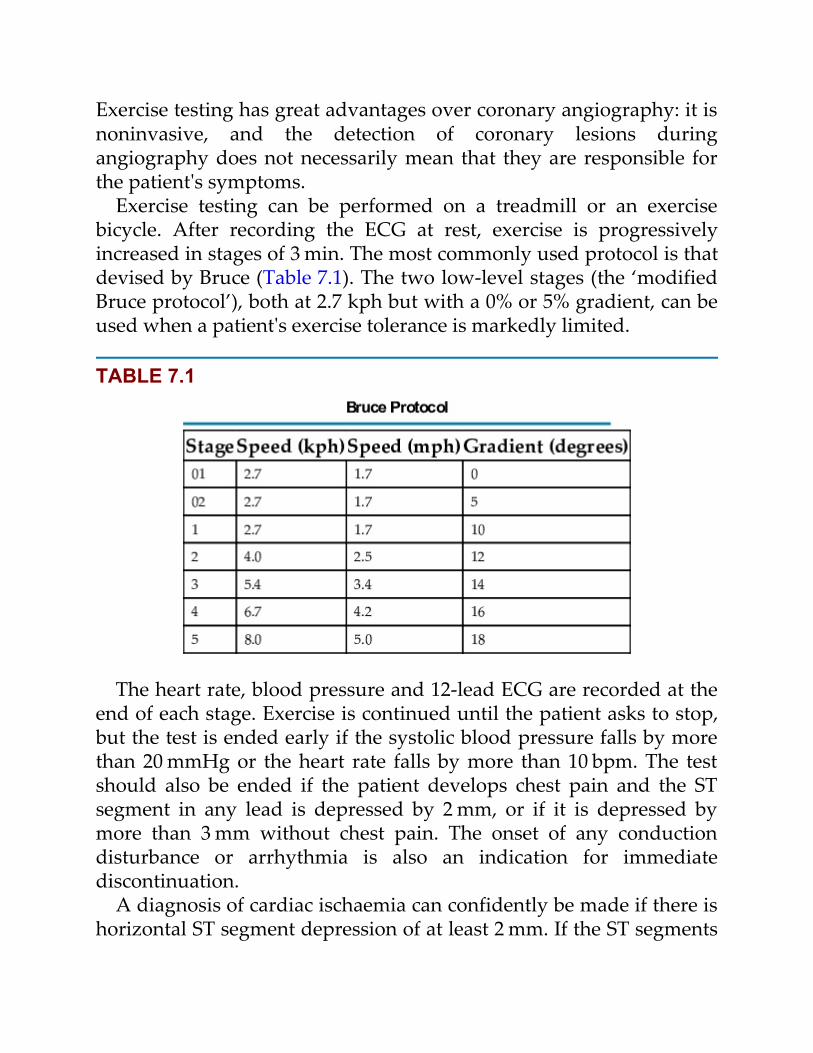
Exercise testing has great advantages over coronary angiography: it isnoninvasive, and the detection of coronary lesions duringangiography does not necessarily mean that they are responsible forthe patient's symptoms.
Exercise testing can be performed on a treadmill or an exercisebicycle. After recording the ECG at rest, exercise is progressivelyincreased in stages of 3 min. The most commonly used protocol is thatdevised by Bruce (Table 7.1). The two low-level stages (the ‘modifiedBruce protocol’), both at 2.7 kph but with a 0% or 5% gradient, can beused when a patient's exercise tolerance is markedly limited.
TABLE 7.1
The heart rate, blood pressure and 12-lead ECG are recorded at theend of each stage. Exercise is continued until the patient asks to stop,but the test is ended early if the systolic blood pressure falls by morethan 20 mmHg or the heart rate falls by more than 10 bpm. The testshould also be ended if the patient develops chest pain and the STsegment in any lead is depressed by 2 mm, or if it is depressed bymore than 3 mm without chest pain. The onset of any conductiondisturbance or arrhythmia is also an indication for immediatediscontinuation.
A diagnosis of cardiac ischaemia can confidently be made if there ishorizontal ST segment depression of at least 2 mm. If the ST segments
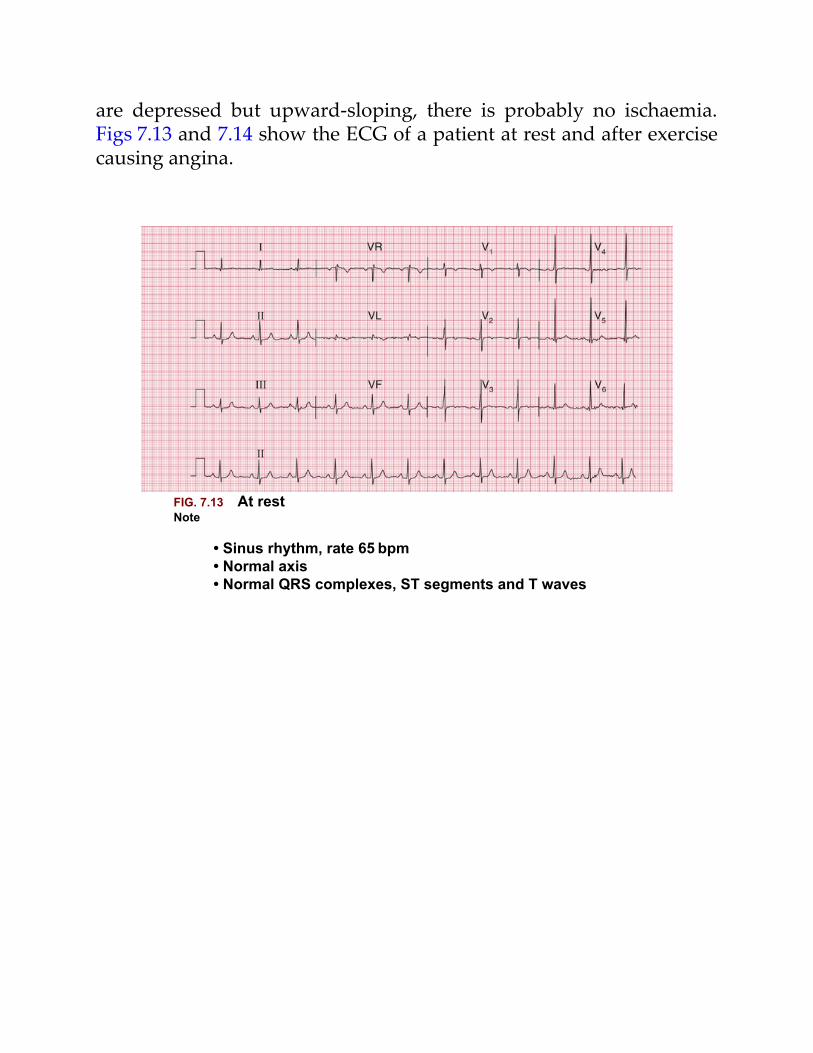
are depressed but upward-sloping, there is probably no ischaemia.Figs 7.13 and 7.14 show the ECG of a patient at rest and after exercisecausing angina.
FIG. 7.13 At restNote
• Sinus rhythm, rate 65 bpm• Normal axis• Normal QRS complexes, ST segments and T waves
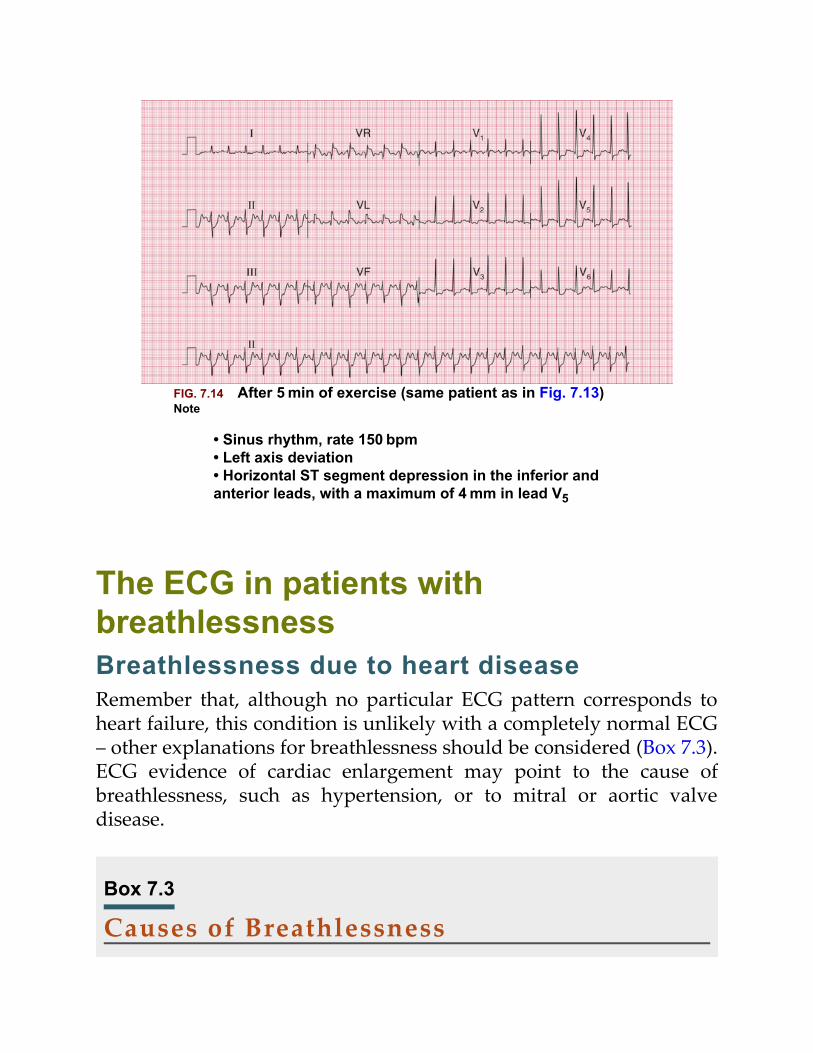
FIG. 7.14 After 5 min of exercise (same patient as in Fig. 7.13)Note
• Sinus rhythm, rate 150 bpm• Left axis deviation• Horizontal ST segment depression in the inferior andanterior leads, with a maximum of 4 mm in lead V5
The ECG in patients withbreathlessnessBreathlessness due to heart diseaseRemember that, although no particular ECG pattern corresponds toheart failure, this condition is unlikely with a completely normal ECG– other explanations for breathlessness should be considered (Box 7.3).ECG evidence of cardiac enlargement may point to the cause ofbreathlessness, such as hypertension, or to mitral or aortic valvedisease.
Box 7.3
Causes of Breathlessness
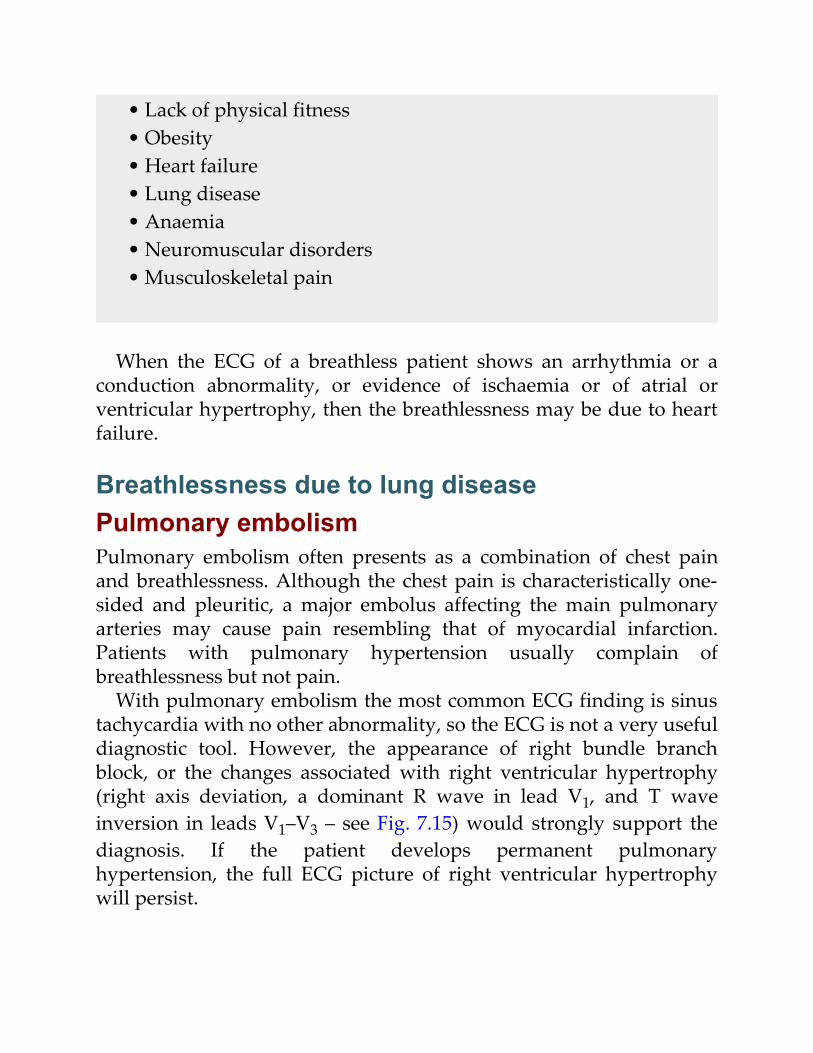
• Lack of physical fitness• Obesity• Heart failure• Lung disease• Anaemia• Neuromuscular disorders• Musculoskeletal pain
When the ECG of a breathless patient shows an arrhythmia or aconduction abnormality, or evidence of ischaemia or of atrial orventricular hypertrophy, then the breathlessness may be due to heartfailure.
Breathlessness due to lung diseasePulmonary embolismPulmonary embolism often presents as a combination of chest painand breathlessness. Although the chest pain is characteristically one-sided and pleuritic, a major embolus affecting the main pulmonaryarteries may cause pain resembling that of myocardial infarction.Patients with pulmonary hypertension usually complain ofbreathlessness but not pain.
With pulmonary embolism the most common ECG finding is sinustachycardia with no other abnormality, so the ECG is not a very usefuldiagnostic tool. However, the appearance of right bundle branchblock, or the changes associated with right ventricular hypertrophy(right axis deviation, a dominant R wave in lead V1, and T waveinversion in leads V1–V3 – see Fig. 7.15) would strongly support thediagnosis. If the patient develops permanent pulmonaryhypertension, the full ECG picture of right ventricular hypertrophywill persist.
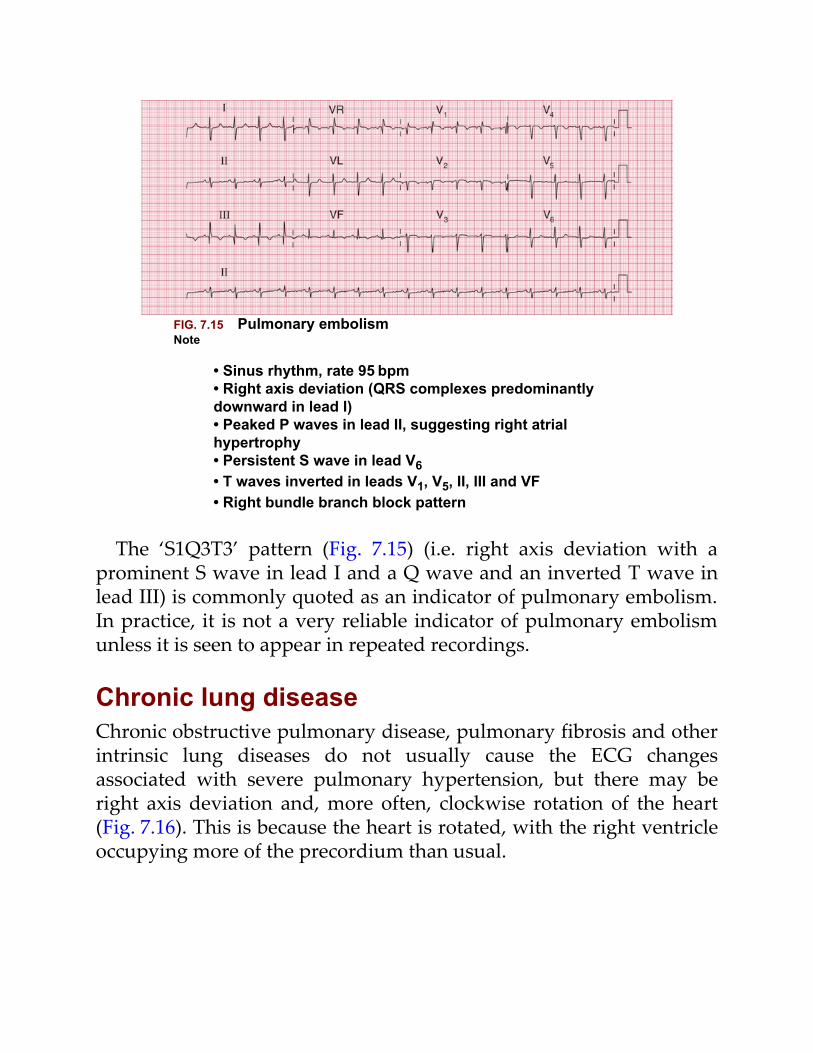
FIG. 7.15 Pulmonary embolismNote
• Sinus rhythm, rate 95 bpm• Right axis deviation (QRS complexes predominantlydownward in lead I)• Peaked P waves in lead II, suggesting right atrialhypertrophy• Persistent S wave in lead V6• T waves inverted in leads V1, V5, II, III and VF• Right bundle branch block pattern
The ‘S1Q3T3’ pattern (Fig. 7.15) (i.e. right axis deviation with aprominent S wave in lead I and a Q wave and an inverted T wave inlead III) is commonly quoted as an indicator of pulmonary embolism.In practice, it is not a very reliable indicator of pulmonary embolismunless it is seen to appear in repeated recordings.
Chronic lung diseaseChronic obstructive pulmonary disease, pulmonary fibrosis and otherintrinsic lung diseases do not usually cause the ECG changesassociated with severe pulmonary hypertension, but there may beright axis deviation and, more often, clockwise rotation of the heart(Fig. 7.16). This is because the heart is rotated, with the right ventricleoccupying more of the precordium than usual.
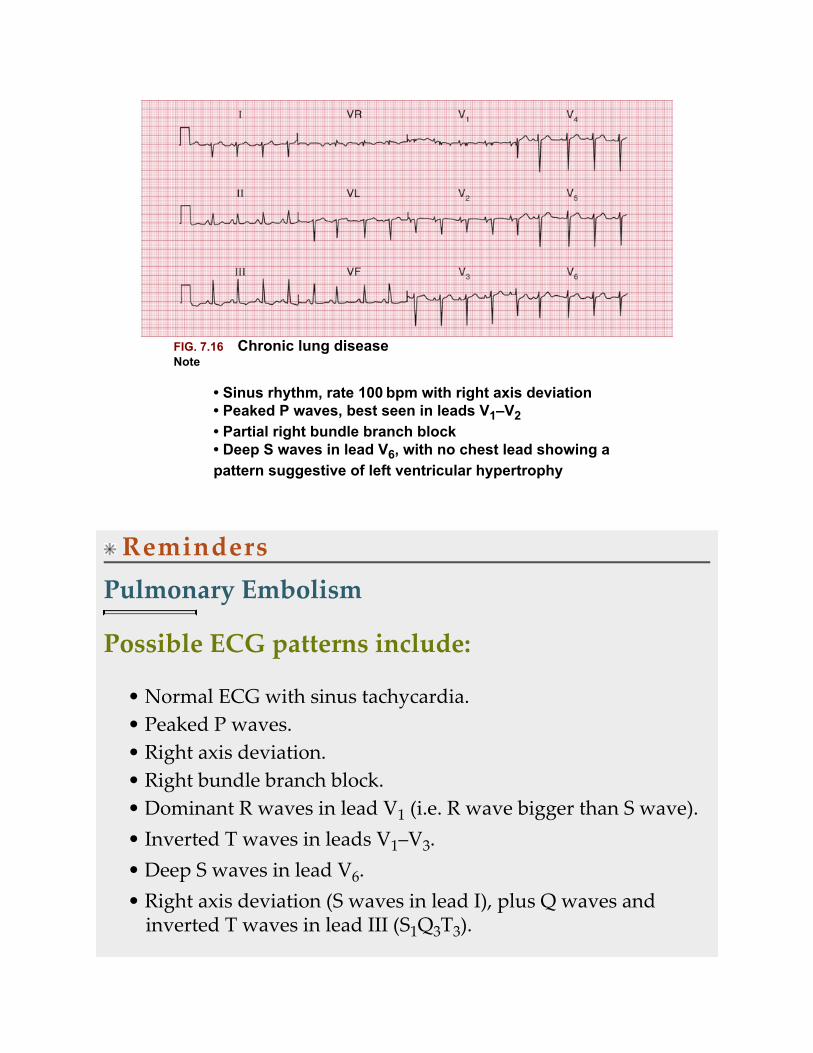
FIG. 7.16 Chronic lung diseaseNote
• Sinus rhythm, rate 100 bpm with right axis deviation• Peaked P waves, best seen in leads V1–V2• Partial right bundle branch block• Deep S waves in lead V6, with no chest lead showing apattern suggestive of left ventricular hypertrophy
RemindersPulmonary Embolism
Possible ECG patterns include:
• Normal ECG with sinus tachycardia.• Peaked P waves.• Right axis deviation.• Right bundle branch block.• Dominant R waves in lead V1 (i.e. R wave bigger than S wave).• Inverted T waves in leads V1–V3.• Deep S waves in lead V6.• Right axis deviation (S waves in lead I), plus Q waves and
inverted T waves in lead III (S1Q3T3).
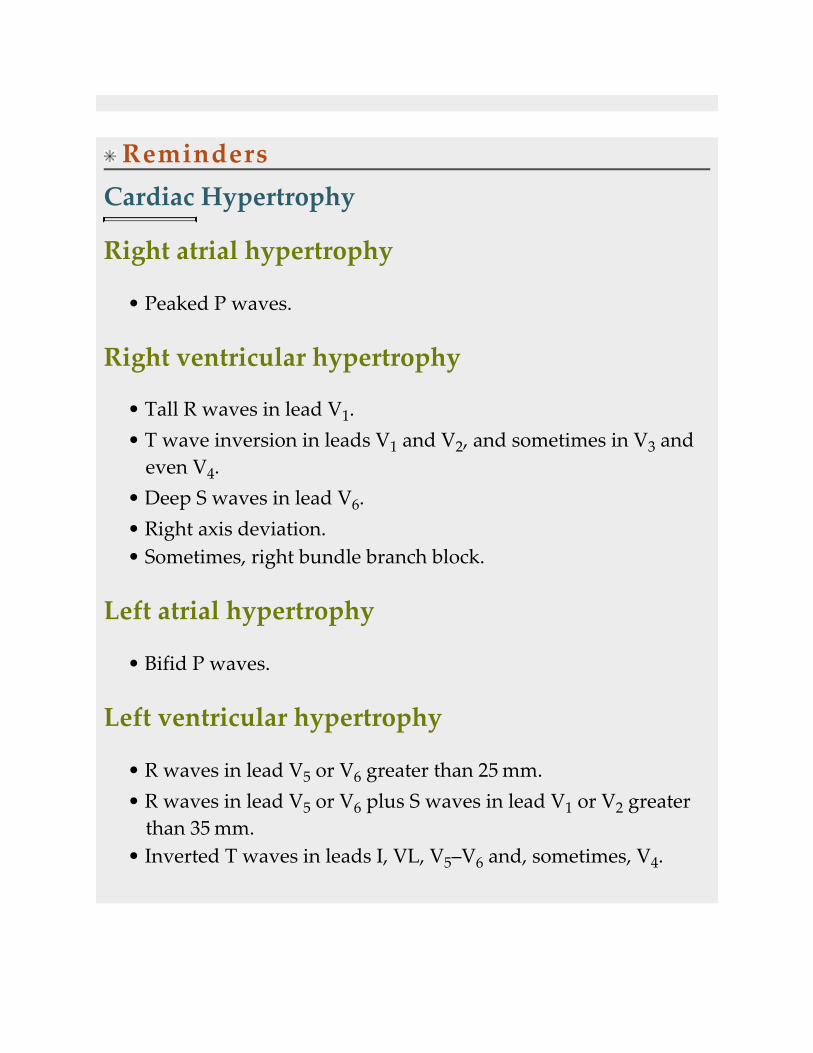
RemindersCardiac Hypertrophy
Right atrial hypertrophy
• Peaked P waves.
Right ventricular hypertrophy
• Tall R waves in lead V1.• T wave inversion in leads V1 and V2, and sometimes in V3 and
even V4.• Deep S waves in lead V6.• Right axis deviation.• Sometimes, right bundle branch block.
Left atrial hypertrophy
• Bifid P waves.
Left ventricular hypertrophy
• R waves in lead V5 or V6 greater than 25 mm.• R waves in lead V5 or V6 plus S waves in lead V1 or V2 greater
than 35 mm.• Inverted T waves in leads I, VL, V5–V6 and, sometimes, V4.
For more on pulmonary embolus, see ECG Made Practical, 7th
edition, Chapter 6
8
The ECG in patients withpalpitations or syncope
The ECG when the patient has no symptoms 143Normal ECGs 143Patterns suggesting cardiac disease 144Patterns suggesting paroxysmaltachycardia 144Patterns suggesting syncope due tobradycardia 149
The ECG when the patient has symptoms 155Paroxysmal tachycardia 155Intermittent bradycardia 155
Pacemakers 157Cardiac arrest 160
‘Palpitations’ means different things to different people, butessentially it means an awareness of the heartbeat. ‘Syncope’ meanssudden loss of consciousness. The only way of being certain that acardiac problem is the cause of either phenomenon is to record anECG when the patient is having a typical attack, but this is seldompossible. Nevertheless, the ECG can be helpful, even when the patientis well.
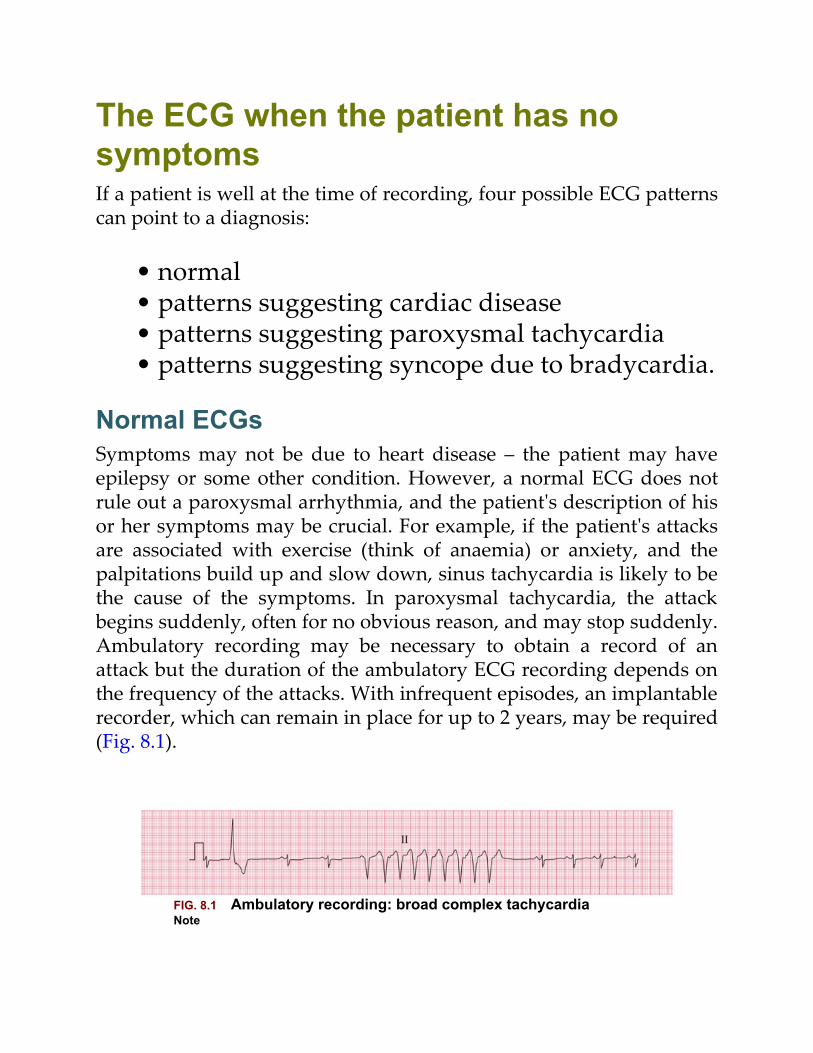
The ECG when the patient has nosymptomsIf a patient is well at the time of recording, four possible ECG patternscan point to a diagnosis:
• normal• patterns suggesting cardiac disease• patterns suggesting paroxysmal tachycardia• patterns suggesting syncope due to bradycardia.
Normal ECGsSymptoms may not be due to heart disease – the patient may haveepilepsy or some other condition. However, a normal ECG does notrule out a paroxysmal arrhythmia, and the patient's description of hisor her symptoms may be crucial. For example, if the patient's attacksare associated with exercise (think of anaemia) or anxiety, and thepalpitations build up and slow down, sinus tachycardia is likely to bethe cause of the symptoms. In paroxysmal tachycardia, the attackbegins suddenly, often for no obvious reason, and may stop suddenly.Ambulatory recording may be necessary to obtain a record of anattack but the duration of the ambulatory ECG recording depends onthe frequency of the attacks. With infrequent episodes, an implantablerecorder, which can remain in place for up to 2 years, may be required(Fig. 8.1).
FIG. 8.1 Ambulatory recording: broad complex tachycardiaNote
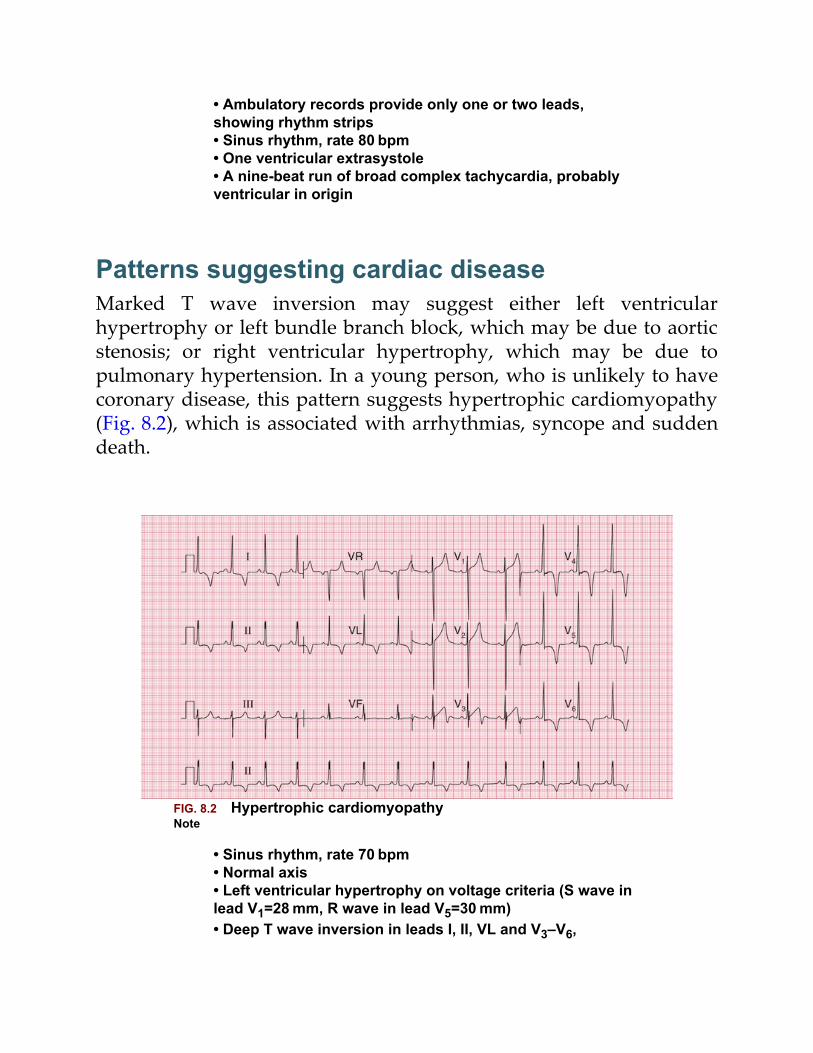
• Ambulatory records provide only one or two leads,showing rhythm strips• Sinus rhythm, rate 80 bpm• One ventricular extrasystole• A nine-beat run of broad complex tachycardia, probablyventricular in origin
Patterns suggesting cardiac diseaseMarked T wave inversion may suggest either left ventricularhypertrophy or left bundle branch block, which may be due to aorticstenosis; or right ventricular hypertrophy, which may be due topulmonary hypertension. In a young person, who is unlikely to havecoronary disease, this pattern suggests hypertrophic cardiomyopathy(Fig. 8.2), which is associated with arrhythmias, syncope and suddendeath.
FIG. 8.2 Hypertrophic cardiomyopathyNote
• Sinus rhythm, rate 70 bpm• Normal axis• Left ventricular hypertrophy on voltage criteria (S wave inlead V1=28 mm, R wave in lead V5=30 mm)• Deep T wave inversion in leads I, II, VL and V3–V6,
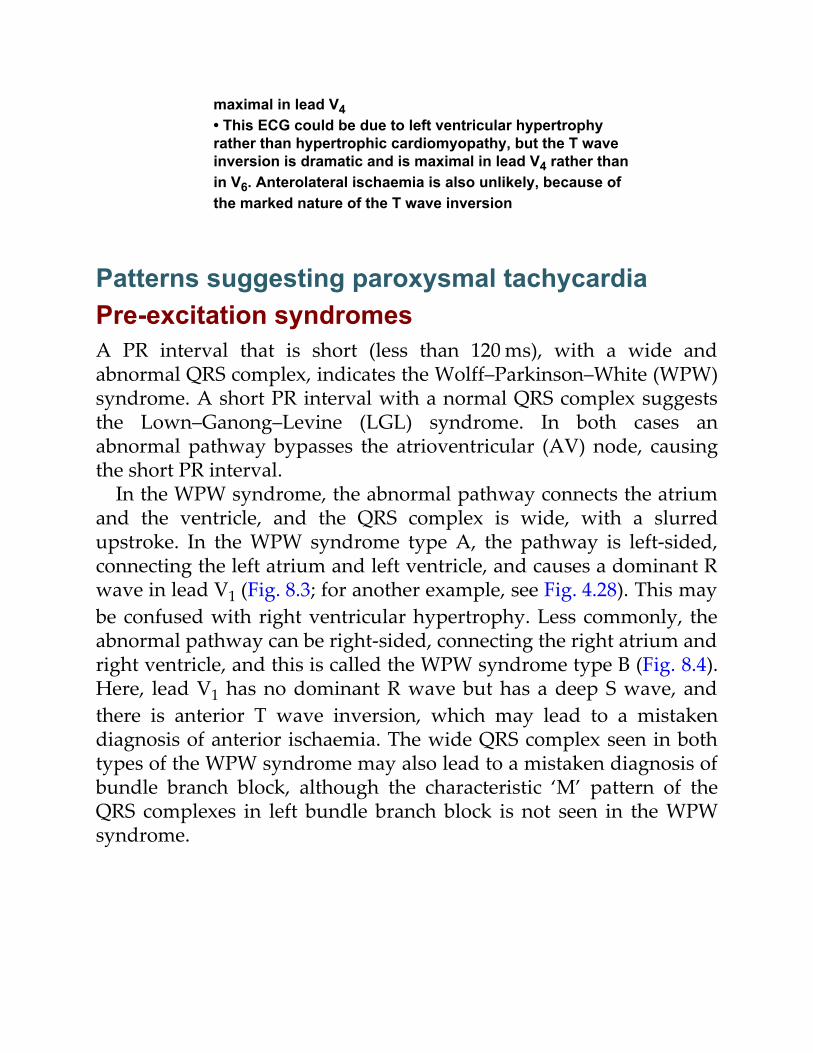
maximal in lead V4• This ECG could be due to left ventricular hypertrophyrather than hypertrophic cardiomyopathy, but the T waveinversion is dramatic and is maximal in lead V4 rather thanin V6. Anterolateral ischaemia is also unlikely, because ofthe marked nature of the T wave inversion
Patterns suggesting paroxysmal tachycardiaPre-excitation syndromesA PR interval that is short (less than 120 ms), with a wide andabnormal QRS complex, indicates the Wolff–Parkinson–White (WPW)syndrome. A short PR interval with a normal QRS complex suggeststhe Lown–Ganong–Levine (LGL) syndrome. In both cases anabnormal pathway bypasses the atrioventricular (AV) node, causingthe short PR interval.
In the WPW syndrome, the abnormal pathway connects the atriumand the ventricle, and the QRS complex is wide, with a slurredupstroke. In the WPW syndrome type A, the pathway is left-sided,connecting the left atrium and left ventricle, and causes a dominant Rwave in lead V1 (Fig. 8.3; for another example, see Fig. 4.28). This maybe confused with right ventricular hypertrophy. Less commonly, theabnormal pathway can be right-sided, connecting the right atrium andright ventricle, and this is called the WPW syndrome type B (Fig. 8.4).Here, lead V1 has no dominant R wave but has a deep S wave, andthere is anterior T wave inversion, which may lead to a mistakendiagnosis of anterior ischaemia. The wide QRS complex seen in bothtypes of the WPW syndrome may also lead to a mistaken diagnosis ofbundle branch block, although the characteristic ‘M’ pattern of theQRS complexes in left bundle branch block is not seen in the WPWsyndrome.
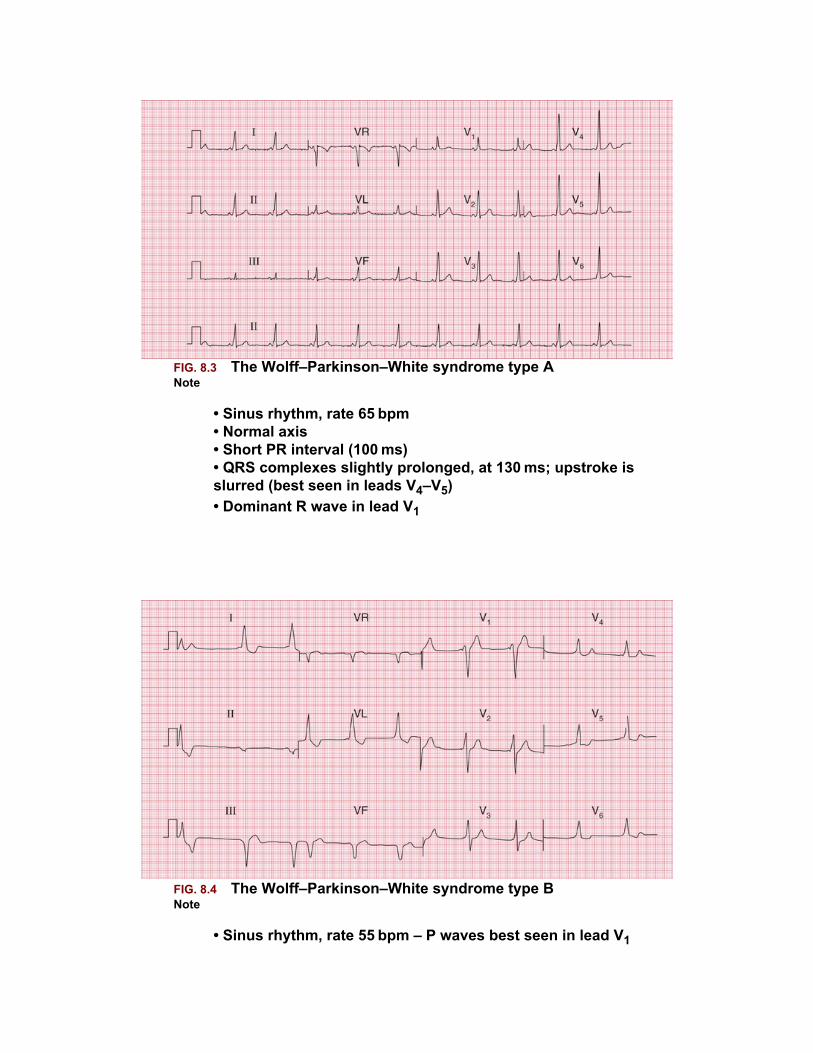
FIG. 8.3 The Wolff–Parkinson–White syndrome type ANote
• Sinus rhythm, rate 65 bpm• Normal axis• Short PR interval (100 ms)• QRS complexes slightly prolonged, at 130 ms; upstroke isslurred (best seen in leads V4–V5)• Dominant R wave in lead V1
FIG. 8.4 The Wolff–Parkinson–White syndrome type BNote
• Sinus rhythm, rate 55 bpm – P waves best seen in lead V1
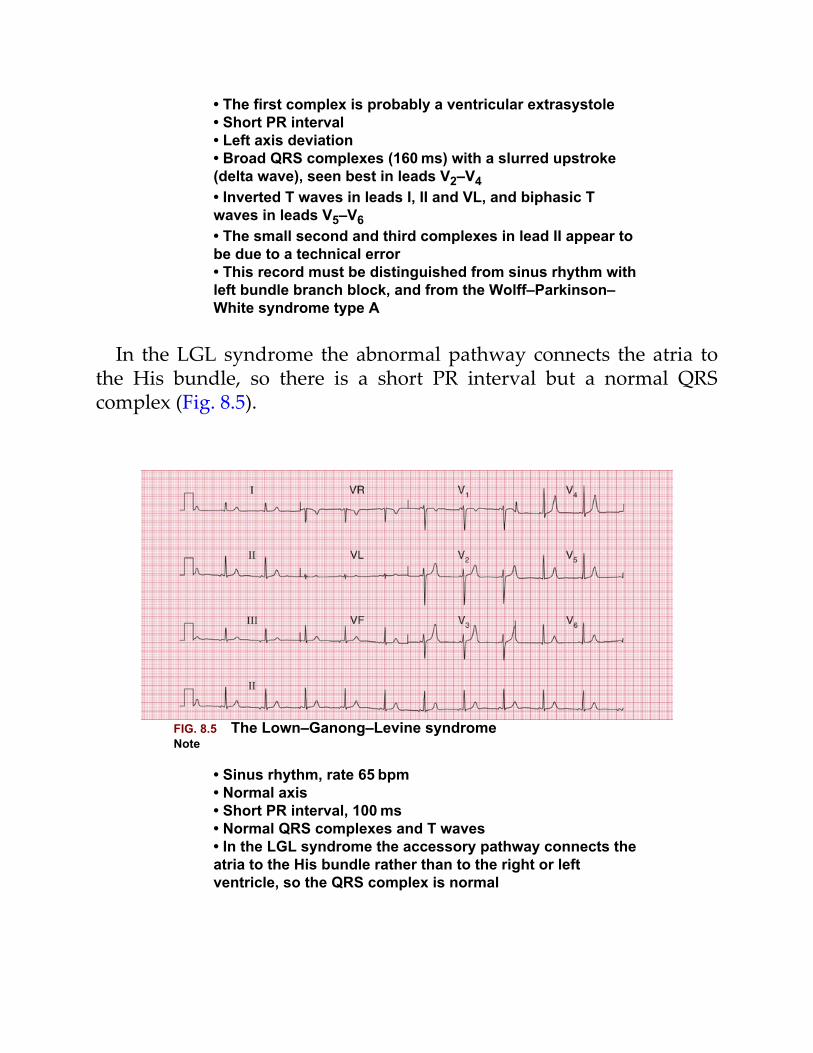
• The first complex is probably a ventricular extrasystole• Short PR interval• Left axis deviation• Broad QRS complexes (160 ms) with a slurred upstroke(delta wave), seen best in leads V2–V4• Inverted T waves in leads I, II and VL, and biphasic Twaves in leads V5–V6• The small second and third complexes in lead II appear tobe due to a technical error• This record must be distinguished from sinus rhythm withleft bundle branch block, and from the Wolff–Parkinson–White syndrome type A
In the LGL syndrome the abnormal pathway connects the atria tothe His bundle, so there is a short PR interval but a normal QRScomplex (Fig. 8.5).
FIG. 8.5 The Lown–Ganong–Levine syndromeNote
• Sinus rhythm, rate 65 bpm• Normal axis• Short PR interval, 100 ms• Normal QRS complexes and T waves• In the LGL syndrome the accessory pathway connects theatria to the His bundle rather than to the right or leftventricle, so the QRS complex is normal
Long QT intervalThe QT interval varies with the heart rate (and also with gender andthe time of day). The corrected interval (QTc) can be calculated usinga number of different formulae (e.g. Hodges, Fridericia andFramingham), but Bazett's formula is most commonly used:
A QTc interval longer than 480 ms is likely to be abnormal. QTinterval prolongation can be congenital, but is most often due todrugs, particularly to antiarrhythmic drugs (Box 8.1 and Fig. 8.6).
Box 8.1
Causes of Prolonged QT Interval
Congenital
• Jervell–Lange–Nielson syndrome• Romano–Ward syndrome• Several other genetic abnormalities also identified
Antiarrhythmic drugs
• Procainamide• Disopyramide• Amiodarone• Sotalol
Other drugs
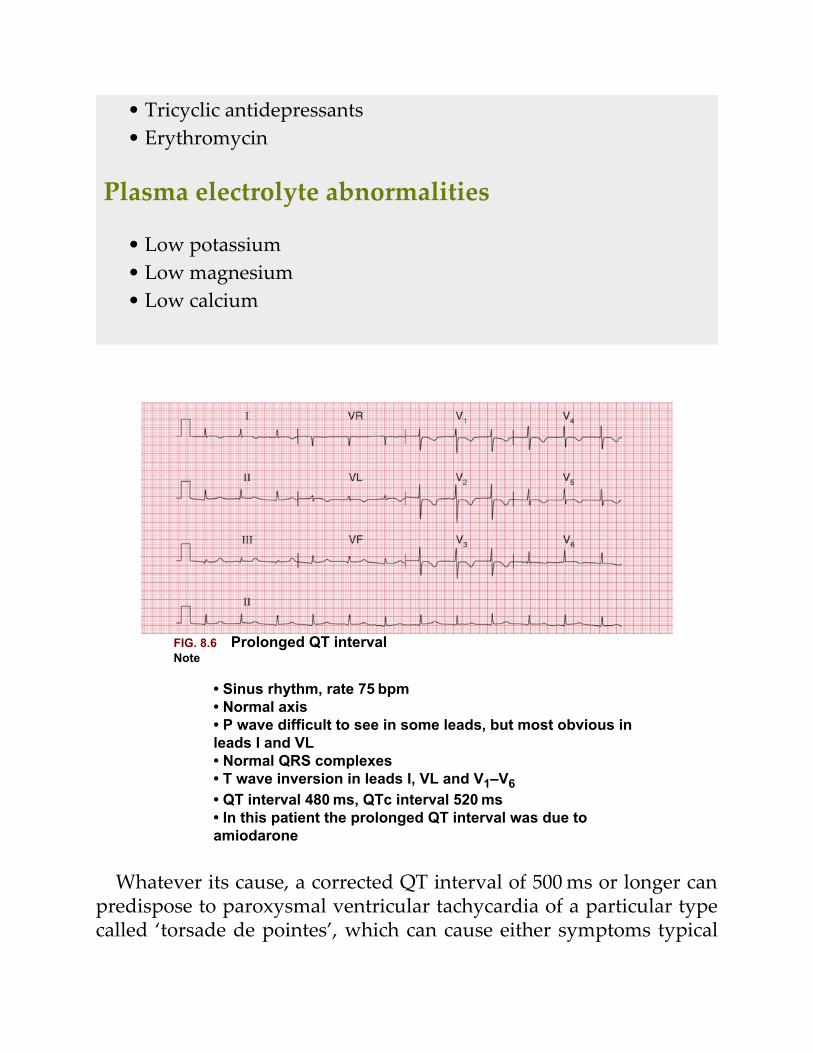
• Tricyclic antidepressants• Erythromycin
Plasma electrolyte abnormalities
• Low potassium• Low magnesium• Low calcium
FIG. 8.6 Prolonged QT intervalNote
• Sinus rhythm, rate 75 bpm• Normal axis• P wave difficult to see in some leads, but most obvious inleads I and VL• Normal QRS complexes• T wave inversion in leads I, VL and V1–V6• QT interval 480 ms, QTc interval 520 ms• In this patient the prolonged QT interval was due toamiodarone
Whatever its cause, a corrected QT interval of 500 ms or longer canpredispose to paroxysmal ventricular tachycardia of a particular typecalled ‘torsade de pointes’, which can cause either symptoms typical
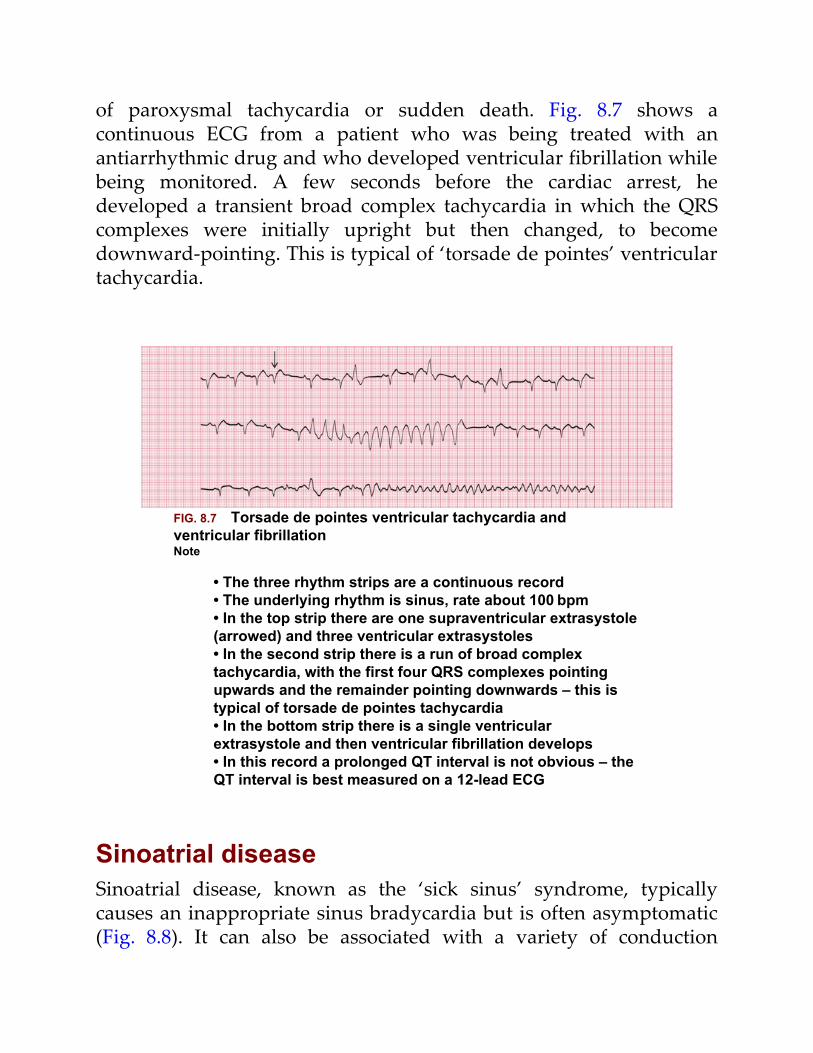
of paroxysmal tachycardia or sudden death. Fig. 8.7 shows acontinuous ECG from a patient who was being treated with anantiarrhythmic drug and who developed ventricular fibrillation whilebeing monitored. A few seconds before the cardiac arrest, hedeveloped a transient broad complex tachycardia in which the QRScomplexes were initially upright but then changed, to becomedownward-pointing. This is typical of ‘torsade de pointes’ ventriculartachycardia.
FIG. 8.7 Torsade de pointes ventricular tachycardia andventricular fibrillationNote
• The three rhythm strips are a continuous record• The underlying rhythm is sinus, rate about 100 bpm• In the top strip there are one supraventricular extrasystole(arrowed) and three ventricular extrasystoles• In the second strip there is a run of broad complextachycardia, with the first four QRS complexes pointingupwards and the remainder pointing downwards – this istypical of torsade de pointes tachycardia• In the bottom strip there is a single ventricularextrasystole and then ventricular fibrillation develops• In this record a prolonged QT interval is not obvious – theQT interval is best measured on a 12-lead ECG
Sinoatrial diseaseSinoatrial disease, known as the ‘sick sinus’ syndrome, typicallycauses an inappropriate sinus bradycardia but is often asymptomatic(Fig. 8.8). It can also be associated with a variety of conduction
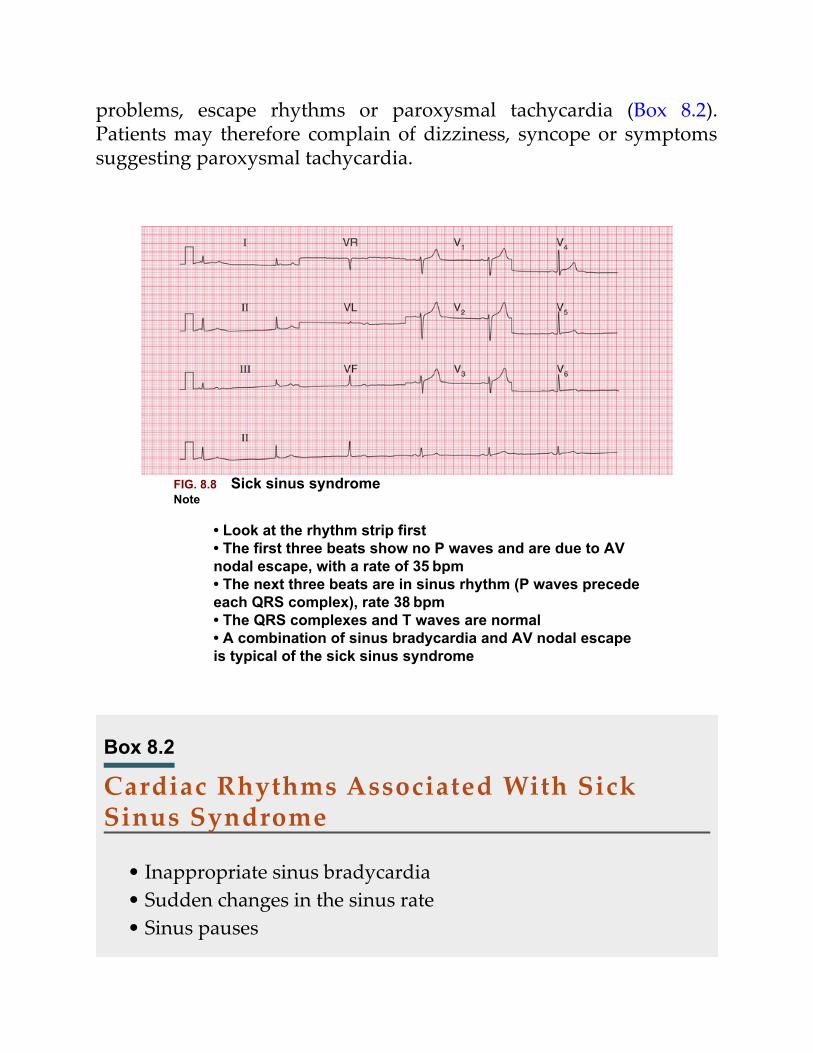
problems, escape rhythms or paroxysmal tachycardia (Box 8.2).Patients may therefore complain of dizziness, syncope or symptomssuggesting paroxysmal tachycardia.
FIG. 8.8 Sick sinus syndromeNote
• Look at the rhythm strip first• The first three beats show no P waves and are due to AVnodal escape, with a rate of 35 bpm• The next three beats are in sinus rhythm (P waves precedeeach QRS complex), rate 38 bpm• The QRS complexes and T waves are normal• A combination of sinus bradycardia and AV nodal escapeis typical of the sick sinus syndrome
Box 8.2
Cardiac Rhythms Associated With SickSinus Syndrome
• Inappropriate sinus bradycardia• Sudden changes in the sinus rate• Sinus pauses
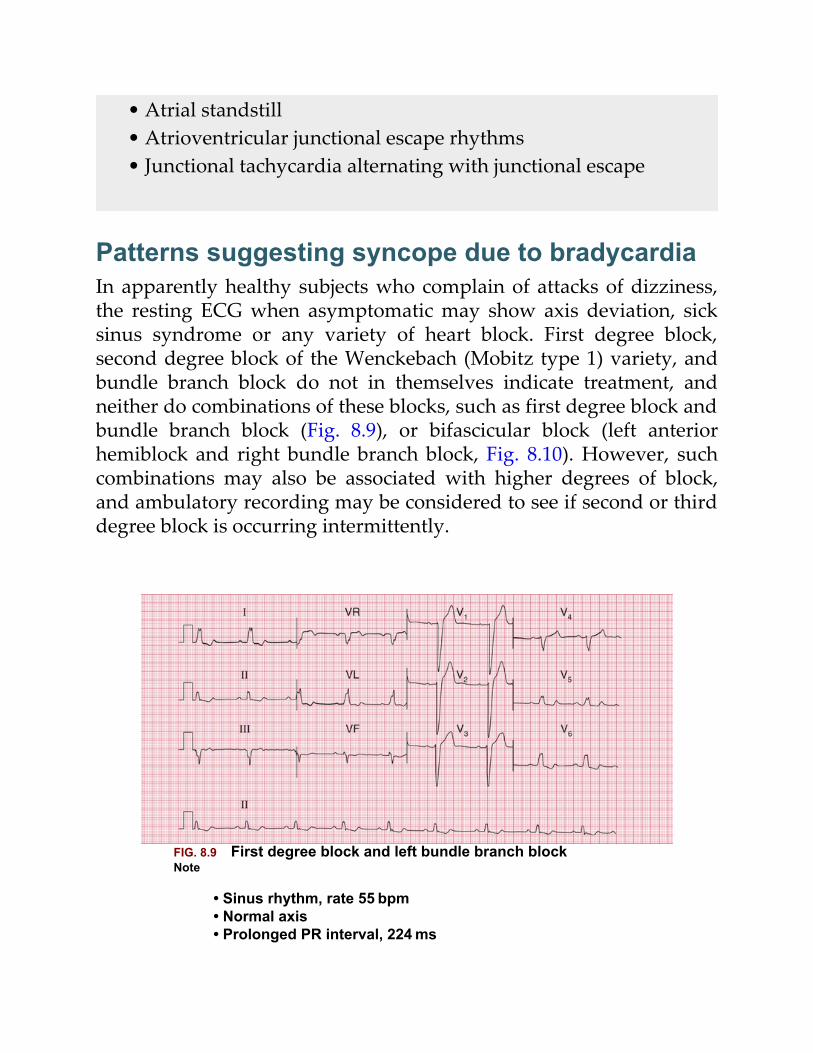
• Atrial standstill• Atrioventricular junctional escape rhythms• Junctional tachycardia alternating with junctional escape
Patterns suggesting syncope due to bradycardiaIn apparently healthy subjects who complain of attacks of dizziness,the resting ECG when asymptomatic may show axis deviation, sicksinus syndrome or any variety of heart block. First degree block,second degree block of the Wenckebach (Mobitz type 1) variety, andbundle branch block do not in themselves indicate treatment, andneither do combinations of these blocks, such as first degree block andbundle branch block (Fig. 8.9), or bifascicular block (left anteriorhemiblock and right bundle branch block, Fig. 8.10). However, suchcombinations may also be associated with higher degrees of block,and ambulatory recording may be considered to see if second or thirddegree block is occurring intermittently.
FIG. 8.9 First degree block and left bundle branch blockNote
• Sinus rhythm, rate 55 bpm• Normal axis• Prolonged PR interval, 224 ms
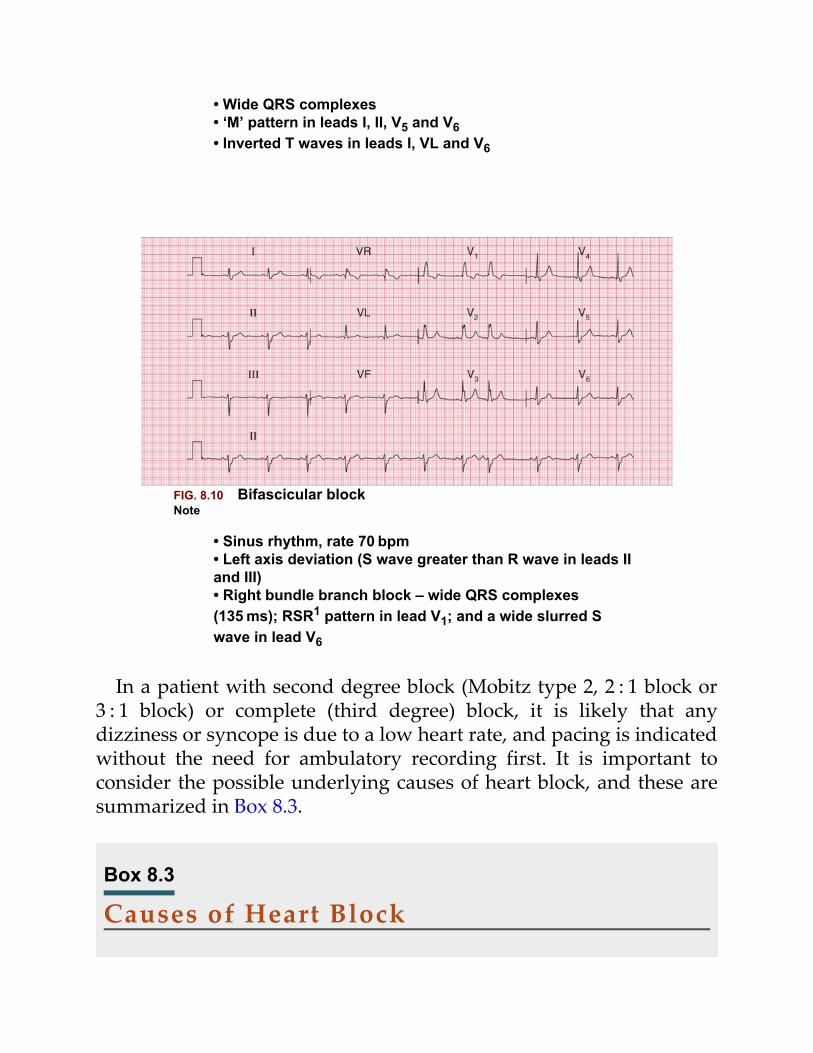
• Wide QRS complexes• ‘M’ pattern in leads I, II, V5 and V6• Inverted T waves in leads I, VL and V6
FIG. 8.10 Bifascicular blockNote
• Sinus rhythm, rate 70 bpm• Left axis deviation (S wave greater than R wave in leads IIand III)• Right bundle branch block – wide QRS complexes(135 ms); RSR1 pattern in lead V1; and a wide slurred Swave in lead V6
In a patient with second degree block (Mobitz type 2, 2 : 1 block or3 : 1 block) or complete (third degree) block, it is likely that anydizziness or syncope is due to a low heart rate, and pacing is indicatedwithout the need for ambulatory recording first. It is important toconsider the possible underlying causes of heart block, and these aresummarized in Box 8.3.
Box 8.3
Causes of Heart Block
First and second degree block
• Increased vagal tone• Athletes• Acute myocarditis• Ischaemic heart disease• Hypokalaemia• Digoxin• Beta-blockers
Complete block
• Idiopathic (fibrosis of conduction tissue)• Congenital• Ischaemic heart disease• Aortic stenosis• Surgery and trauma
The ECG when the patient hassymptomsParoxysmal tachycardiaIt is not possible to tell from a patient's symptoms whetherextrasystoles or a paroxysmal tachycardia are supraventricular orventricular in origin – although paroxysmal ventricular tachycardia isperhaps more likely to cause dizziness or syncope than paroxysmalsupraventricular tachycardia.
In a paroxysmal tachycardia, the heart rate is usually greater than160 bpm – compared with sinus tachycardia, in which it is seldomgreater than 140 bpm. The QRS complexes in paroxysmal tachycardia
can be narrow (i.e. less than 120 ms) or broad.Narrow complex tachycardias may indicate:
• sinus tachycardia• atrial tachycardia• junctional (AV nodal re-entry) tachycardia• atrial flutter• atrial fibrillation• Wolff-Parkinson-White (WPW) syndrome.
The ECG characteristics of the supraventricular rhythms aresummarized in the Reminders on page 162.
The simplest way to identify the cause of narrow complextachycardia is to use vagal manoeuvres such as carotid sinus massageor eyeball compression while recording an ECG. This will cause sinustachycardia to slow; atrial and junctional tachycardias andtachycardias due to pre-excitation may be abolished; in atrial flutterthe atrioventricular block will increase; and atrial fibrillation will notusually be affected.
Broad complex tachycardias indicate:
• ventricular tachycardia• supraventricular tachycardia of any type withbundle branch block• the WPW syndrome.
The ECG characteristics of the broad complex tachycardias aresummarized in the Reminders box on page 162.
It can be very difficult to differentiate between the broad complexesof a supraventricular tachycardia with bundle branch block andventricular tachycardia, but the Reminders boxes at the end of thischapter should help.
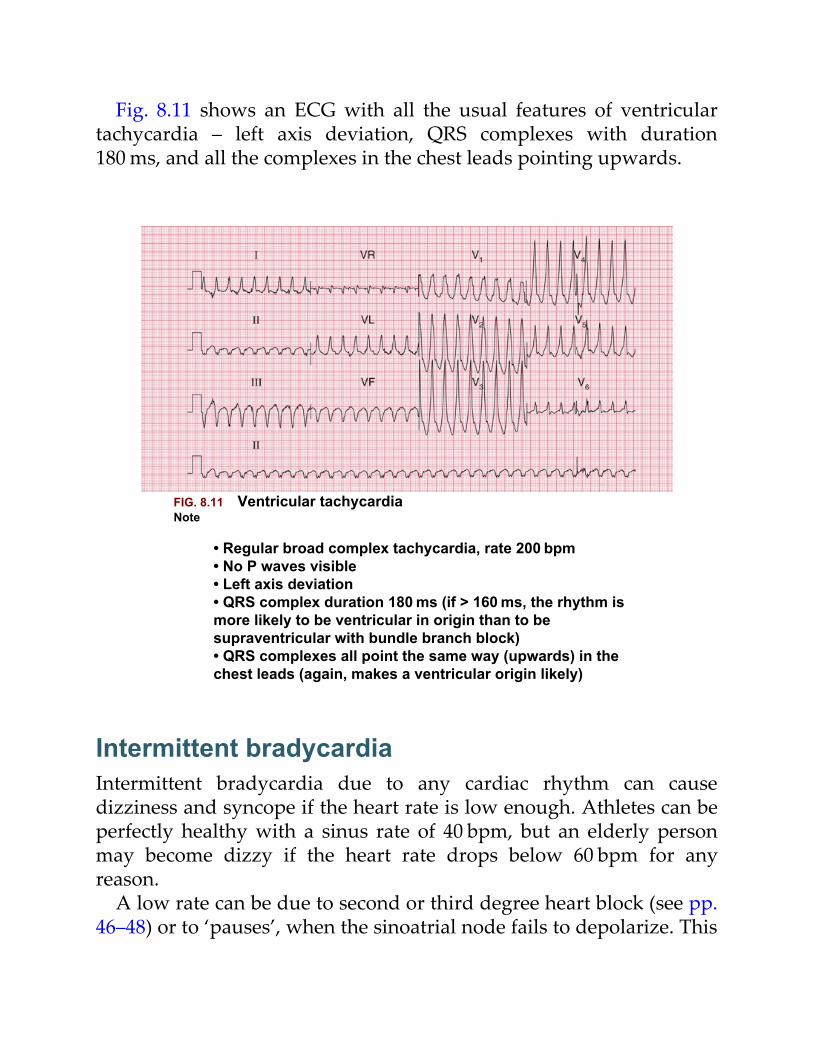
Fig. 8.11 shows an ECG with all the usual features of ventriculartachycardia – left axis deviation, QRS complexes with duration180 ms, and all the complexes in the chest leads pointing upwards.
FIG. 8.11 Ventricular tachycardiaNote
• Regular broad complex tachycardia, rate 200 bpm• No P waves visible• Left axis deviation• QRS complex duration 180 ms (if > 160 ms, the rhythm ismore likely to be ventricular in origin than to besupraventricular with bundle branch block)• QRS complexes all point the same way (upwards) in thechest leads (again, makes a ventricular origin likely)
Intermittent bradycardiaIntermittent bradycardia due to any cardiac rhythm can causedizziness and syncope if the heart rate is low enough. Athletes can beperfectly healthy with a sinus rate of 40 bpm, but an elderly personmay become dizzy if the heart rate drops below 60 bpm for anyreason.
A low rate can be due to second or third degree heart block (see pp.46–48) or to ‘pauses’, when the sinoatrial node fails to depolarize. This
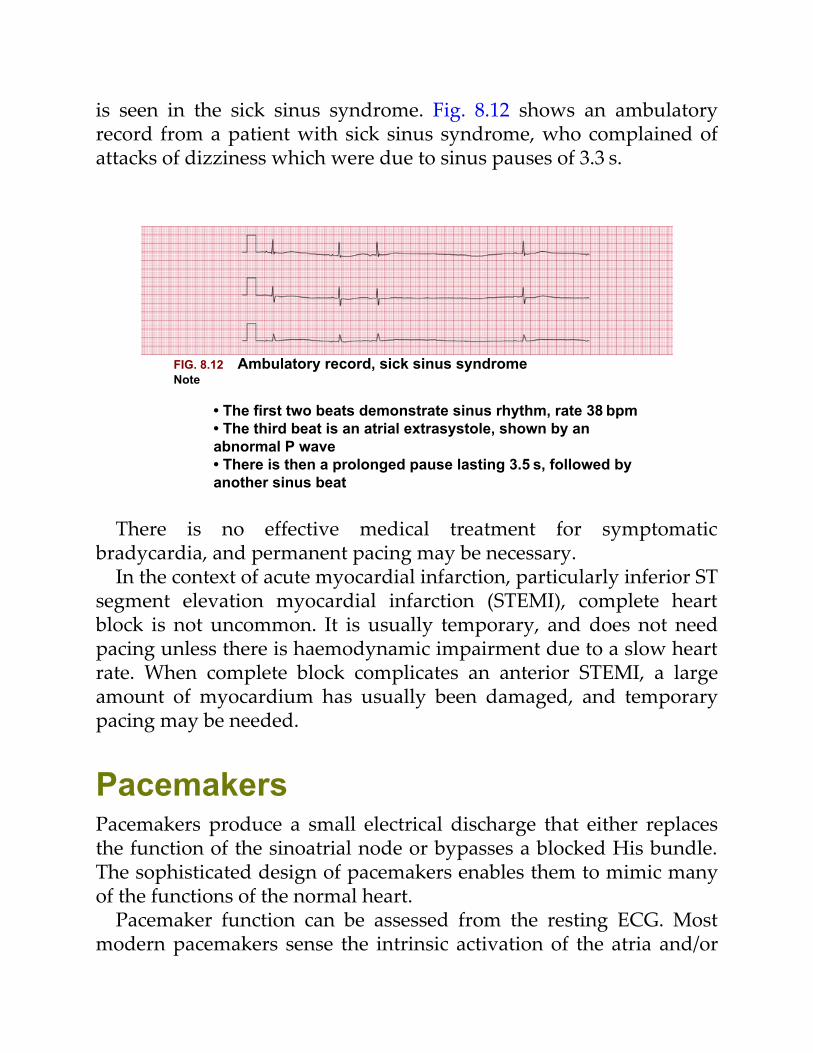
is seen in the sick sinus syndrome. Fig. 8.12 shows an ambulatoryrecord from a patient with sick sinus syndrome, who complained ofattacks of dizziness which were due to sinus pauses of 3.3 s.
FIG. 8.12 Ambulatory record, sick sinus syndromeNote
• The first two beats demonstrate sinus rhythm, rate 38 bpm• The third beat is an atrial extrasystole, shown by anabnormal P wave• There is then a prolonged pause lasting 3.5 s, followed byanother sinus beat
There is no effective medical treatment for symptomaticbradycardia, and permanent pacing may be necessary.
In the context of acute myocardial infarction, particularly inferior STsegment elevation myocardial infarction (STEMI), complete heartblock is not uncommon. It is usually temporary, and does not needpacing unless there is haemodynamic impairment due to a slow heartrate. When complete block complicates an anterior STEMI, a largeamount of myocardium has usually been damaged, and temporarypacing may be needed.
PacemakersPacemakers produce a small electrical discharge that either replacesthe function of the sinoatrial node or bypasses a blocked His bundle.The sophisticated design of pacemakers enables them to mimic manyof the functions of the normal heart.
Pacemaker function can be assessed from the resting ECG. Mostmodern pacemakers sense the intrinsic activation of the atria and/or
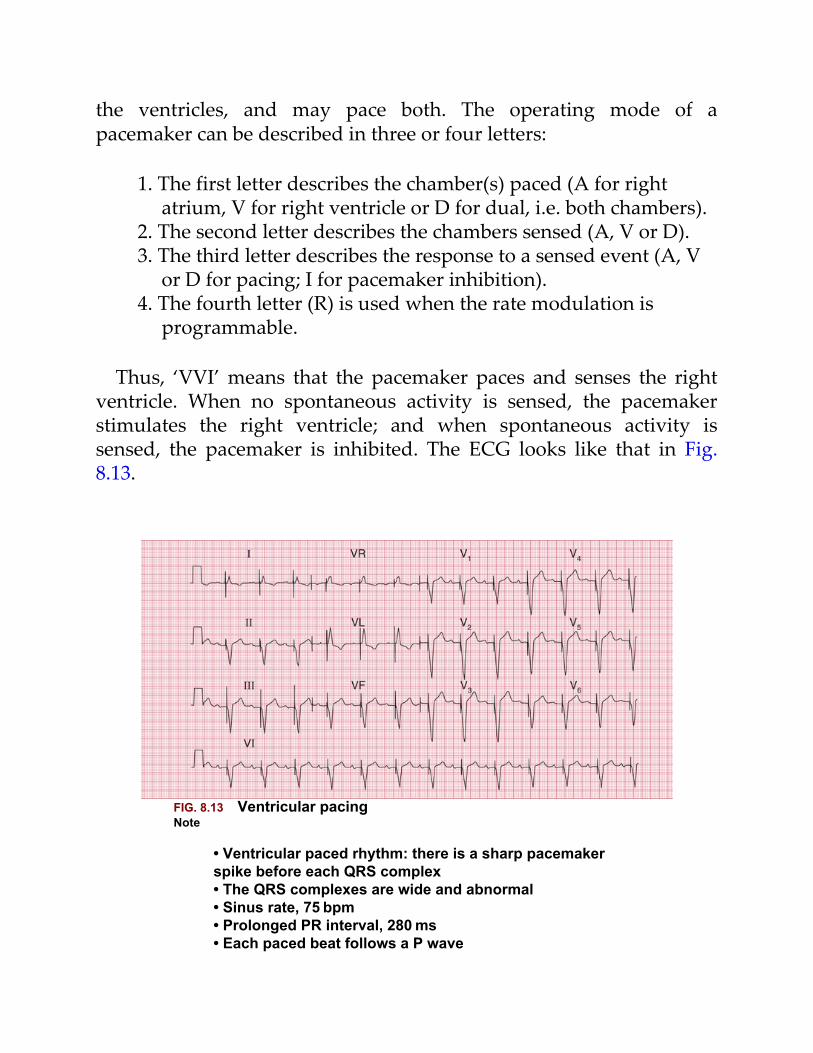
the ventricles, and may pace both. The operating mode of apacemaker can be described in three or four letters:
1. The first letter describes the chamber(s) paced (A for rightatrium, V for right ventricle or D for dual, i.e. both chambers).
2. The second letter describes the chambers sensed (A, V or D).3. The third letter describes the response to a sensed event (A, V
or D for pacing; I for pacemaker inhibition).4. The fourth letter (R) is used when the rate modulation is
programmable.
Thus, ‘VVI’ means that the pacemaker paces and senses the rightventricle. When no spontaneous activity is sensed, the pacemakerstimulates the right ventricle; and when spontaneous activity issensed, the pacemaker is inhibited. The ECG looks like that in Fig.8.13.
FIG. 8.13 Ventricular pacingNote
• Ventricular paced rhythm: there is a sharp pacemakerspike before each QRS complex• The QRS complexes are wide and abnormal• Sinus rate, 75 bpm• Prolonged PR interval, 280 ms• Each paced beat follows a P wave
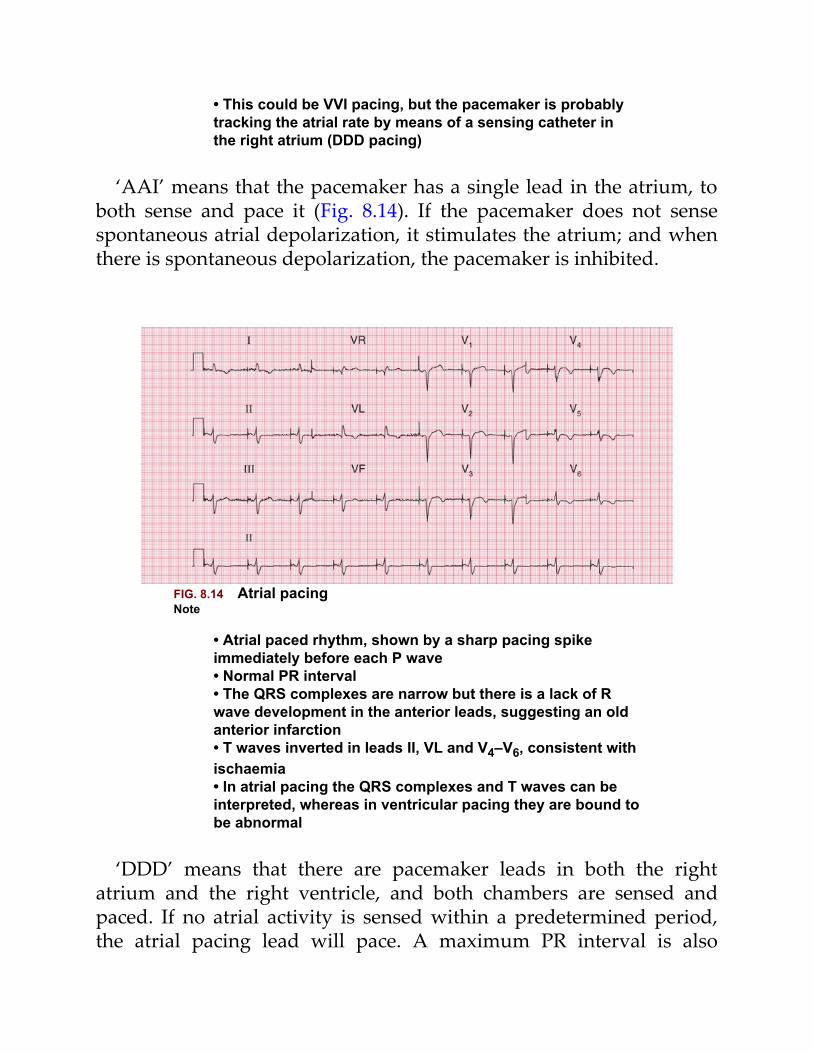
• This could be VVI pacing, but the pacemaker is probablytracking the atrial rate by means of a sensing catheter inthe right atrium (DDD pacing)
‘AAI’ means that the pacemaker has a single lead in the atrium, toboth sense and pace it (Fig. 8.14). If the pacemaker does not sensespontaneous atrial depolarization, it stimulates the atrium; and whenthere is spontaneous depolarization, the pacemaker is inhibited.
FIG. 8.14 Atrial pacingNote
• Atrial paced rhythm, shown by a sharp pacing spikeimmediately before each P wave• Normal PR interval• The QRS complexes are narrow but there is a lack of Rwave development in the anterior leads, suggesting an oldanterior infarction• T waves inverted in leads II, VL and V4–V6, consistent withischaemia• In atrial pacing the QRS complexes and T waves can beinterpreted, whereas in ventricular pacing they are bound tobe abnormal
‘DDD’ means that there are pacemaker leads in both the rightatrium and the right ventricle, and both chambers are sensed andpaced. If no atrial activity is sensed within a predetermined period,the atrial pacing lead will pace. A maximum PR interval is also

predetermined, and if no ventricular beat is sensed, the ventricle willbe paced. Fig. 8.13 could be the result of simple VVI pacing, or couldbe the result of atrial sensing and ventricular pacing, the ventricularrate ‘following’ the atrial rate. A chest X-ray would show whetherthere were one or two pacing leads. Fig. 8.15 shows both atrial andventricular pacing.
FIG. 8.15 Dual chamber pacingNote
• Two pacing spikes can be seen, most clearly in leads V1–V3• The first spike causes atrial activity, though no clear Pwave can be seen• The second spike causes ventricular activity, with a wideand abnormal QRS complex
Cardiac arrestCardiac arrest can be classified according to whether the rhythm is‘shockable’ (i.e. correctable by DC cardioversion) or non-shockable. Ineither case, Basic Life Support should be commenced. See ResusCouncil guidelines for up-to-date evidence: https://www.resus.org.uk.
Correct interpretation of the ECG during cardiac arrest is essentialto determine whether or not the rhythm is ‘shockable’.
The shockable rhythms are ventricular fibrillation (VF) andpulseless ventricular tachycardia (VT).
The non-shockable rhythms are asystole and pulseless electricalactivity (PEA). If it is not clear whether the rhythm is ‘fine’ VF orasystole, treat as VF.
Particularly in cases of PEA, consider possible reversible causes ofcardiac arrest, all of which begin with H or T and are listed in Box 8.4.
Box 8.4
Causes of Nonshockable Rhythms
• Hypoxia• Hypovolaemia• Hyperkalaemia, hypokalaemia, hypocalcaemia, acidosis,
hypoglycaemia• Hypothermia• Tamponade• Tension pneumothorax• Toxic substances, including drug overdoses• Thromboembolism, e.g. pulmonary embolism
RemindersThe Ventricular Rhythms
• In general, ventricular rhythms have wide (greater than 120 ms)QRS complexes; a change of axis compared to sinus rhythm;and abnormal T waves.
• Ventricular extrasystoles:– early QRS complex
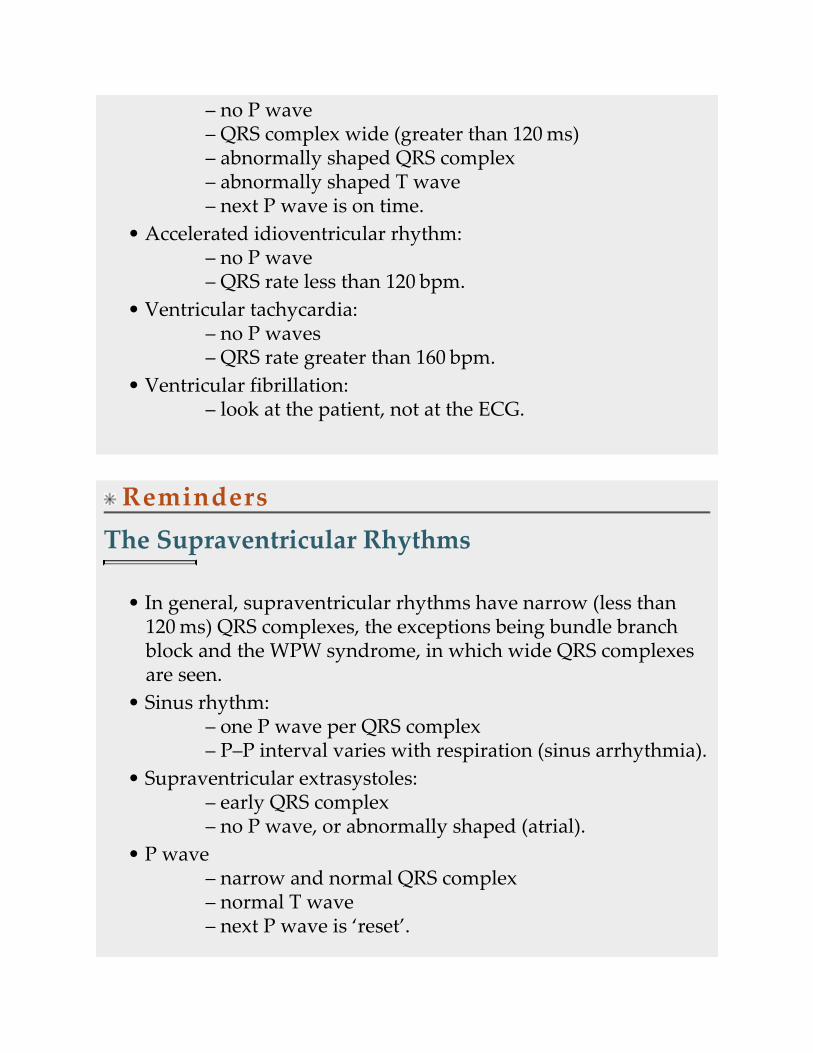
– no P wave– QRS complex wide (greater than 120 ms)– abnormally shaped QRS complex– abnormally shaped T wave– next P wave is on time.
• Accelerated idioventricular rhythm:– no P wave– QRS rate less than 120 bpm.
• Ventricular tachycardia:– no P waves– QRS rate greater than 160 bpm.
• Ventricular fibrillation:– look at the patient, not at the ECG.
RemindersThe Supraventricular Rhythms
• In general, supraventricular rhythms have narrow (less than120 ms) QRS complexes, the exceptions being bundle branchblock and the WPW syndrome, in which wide QRS complexesare seen.
• Sinus rhythm:– one P wave per QRS complex– P–P interval varies with respiration (sinus arrhythmia).
• Supraventricular extrasystoles:– early QRS complex– no P wave, or abnormally shaped (atrial).
• P wave– narrow and normal QRS complex– normal T wave– next P wave is ‘reset’.
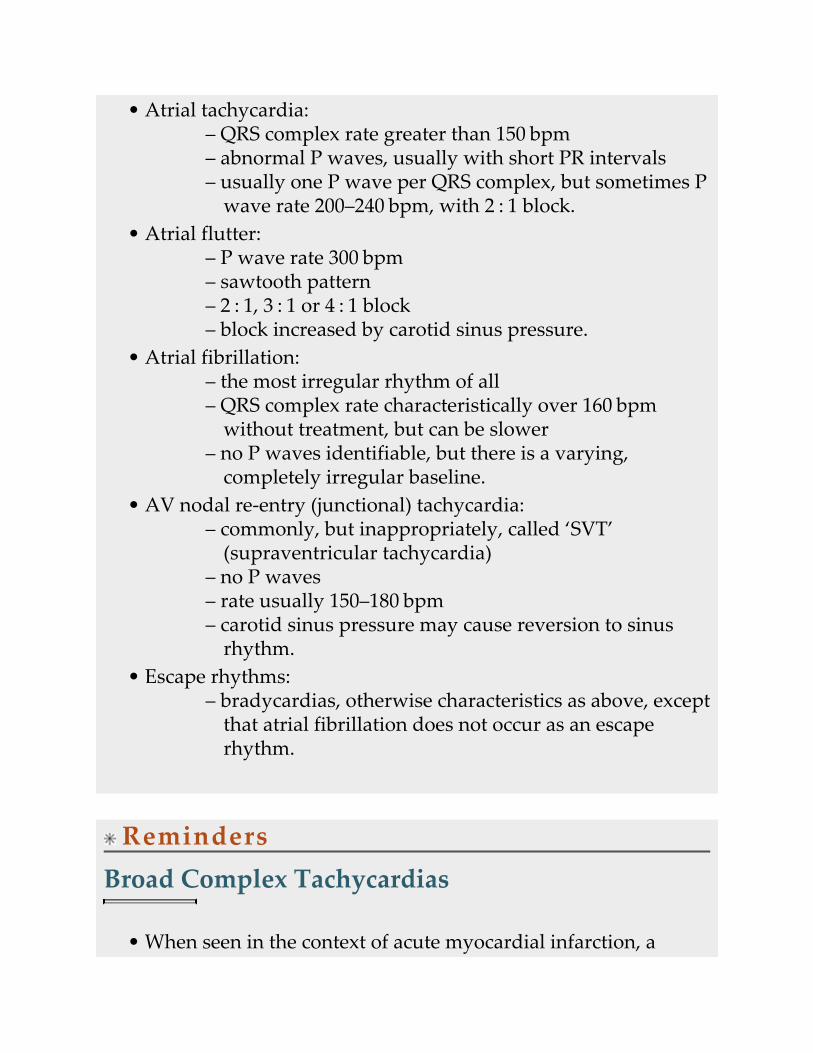
• Atrial tachycardia:– QRS complex rate greater than 150 bpm– abnormal P waves, usually with short PR intervals– usually one P wave per QRS complex, but sometimes P
wave rate 200–240 bpm, with 2 : 1 block.• Atrial flutter:
– P wave rate 300 bpm– sawtooth pattern– 2 : 1, 3 : 1 or 4 : 1 block– block increased by carotid sinus pressure.
• Atrial fibrillation:– the most irregular rhythm of all– QRS complex rate characteristically over 160 bpm
without treatment, but can be slower– no P waves identifiable, but there is a varying,
completely irregular baseline.• AV nodal re-entry (junctional) tachycardia:
– commonly, but inappropriately, called ‘SVT’(supraventricular tachycardia)
– no P waves– rate usually 150–180 bpm– carotid sinus pressure may cause reversion to sinus
rhythm.• Escape rhythms:
– bradycardias, otherwise characteristics as above, exceptthat atrial fibrillation does not occur as an escaperhythm.
RemindersBroad Complex Tachycardias
• When seen in the context of acute myocardial infarction, a
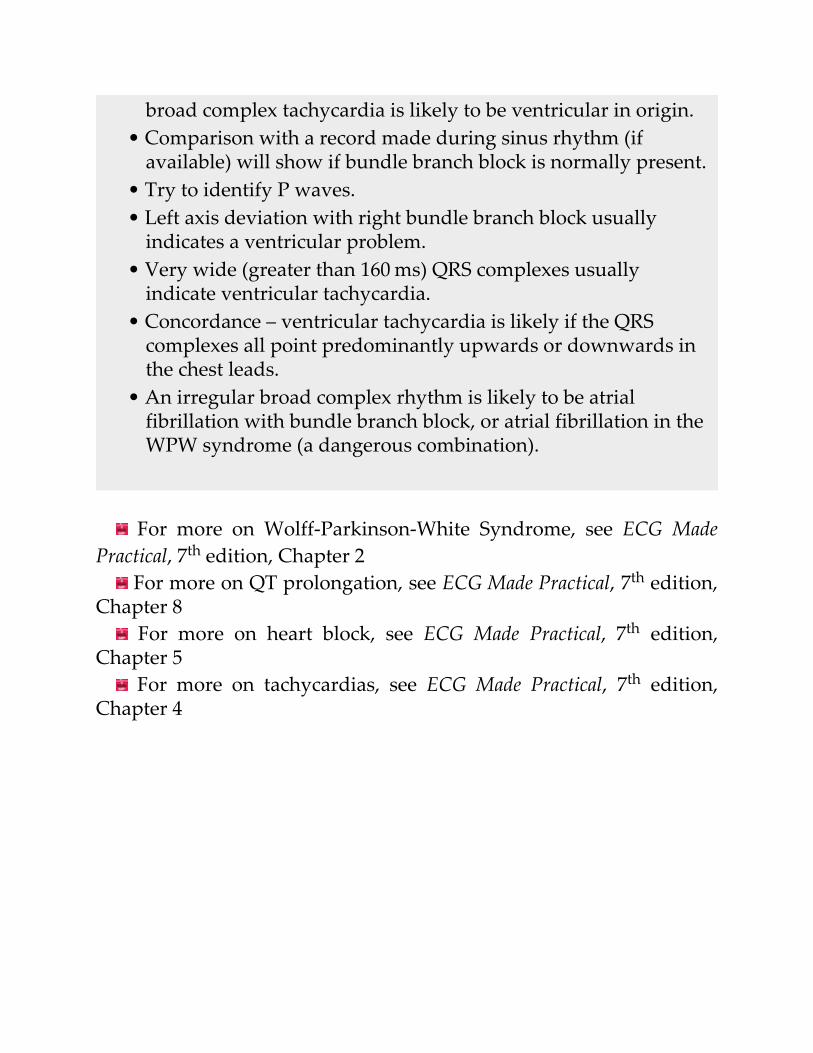
broad complex tachycardia is likely to be ventricular in origin.• Comparison with a record made during sinus rhythm (if
available) will show if bundle branch block is normally present.• Try to identify P waves.• Left axis deviation with right bundle branch block usually
indicates a ventricular problem.• Very wide (greater than 160 ms) QRS complexes usually
indicate ventricular tachycardia.• Concordance – ventricular tachycardia is likely if the QRS
complexes all point predominantly upwards or downwards inthe chest leads.
• An irregular broad complex rhythm is likely to be atrialfibrillation with bundle branch block, or atrial fibrillation in theWPW syndrome (a dangerous combination).
For more on Wolff-Parkinson-White Syndrome, see ECG MadePractical, 7th edition, Chapter 2
For more on QT prolongation, see ECG Made Practical, 7th edition,Chapter 8
For more on heart block, see ECG Made Practical, 7th edition,Chapter 5
For more on tachycardias, see ECG Made Practical, 7th edition,Chapter 4
PART 4Now test yourself
OUTLINE
9 ECGs you must be able to recognize
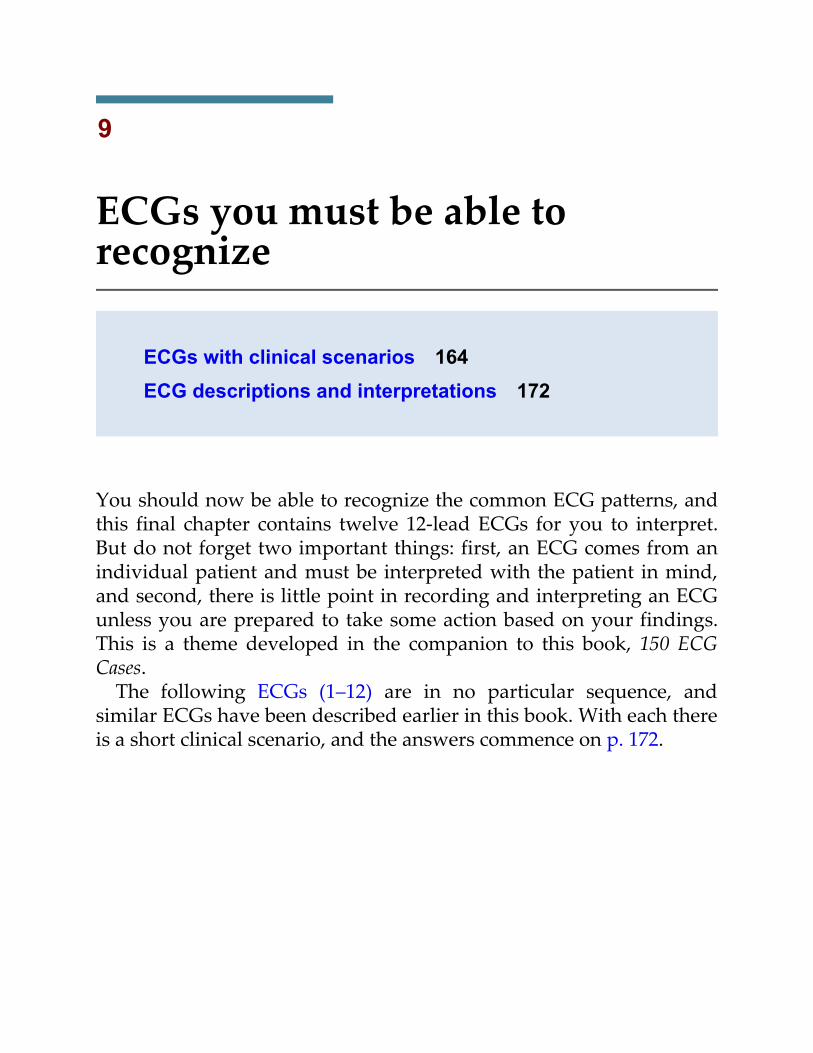
9
ECGs you must be able torecognize
ECGs with clinical scenarios 164ECG descriptions and interpretations 172
You should now be able to recognize the common ECG patterns, andthis final chapter contains twelve 12-lead ECGs for you to interpret.But do not forget two important things: first, an ECG comes from anindividual patient and must be interpreted with the patient in mind,and second, there is little point in recording and interpreting an ECGunless you are prepared to take some action based on your findings.This is a theme developed in the companion to this book, 150 ECGCases.
The following ECGs (1–12) are in no particular sequence, andsimilar ECGs have been described earlier in this book. With each thereis a short clinical scenario, and the answers commence on p. 172.
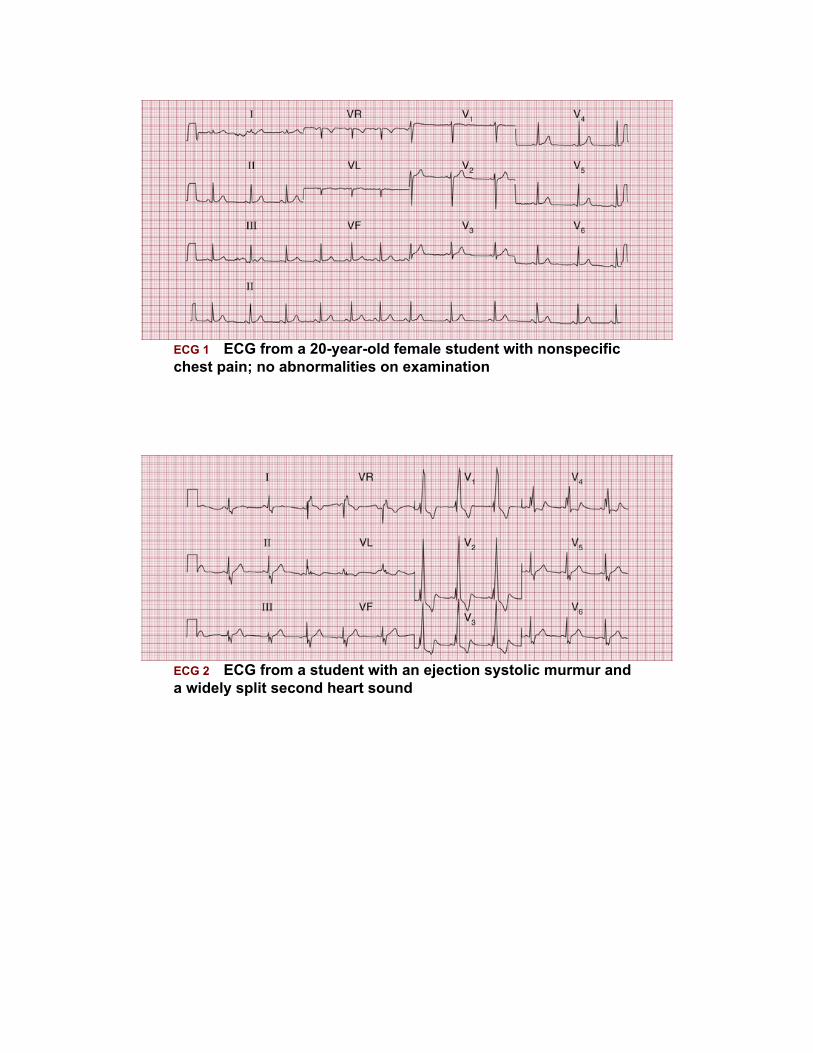
ECG 1 ECG from a 20-year-old female student with nonspecificchest pain; no abnormalities on examination
ECG 2 ECG from a student with an ejection systolic murmur anda widely split second heart sound
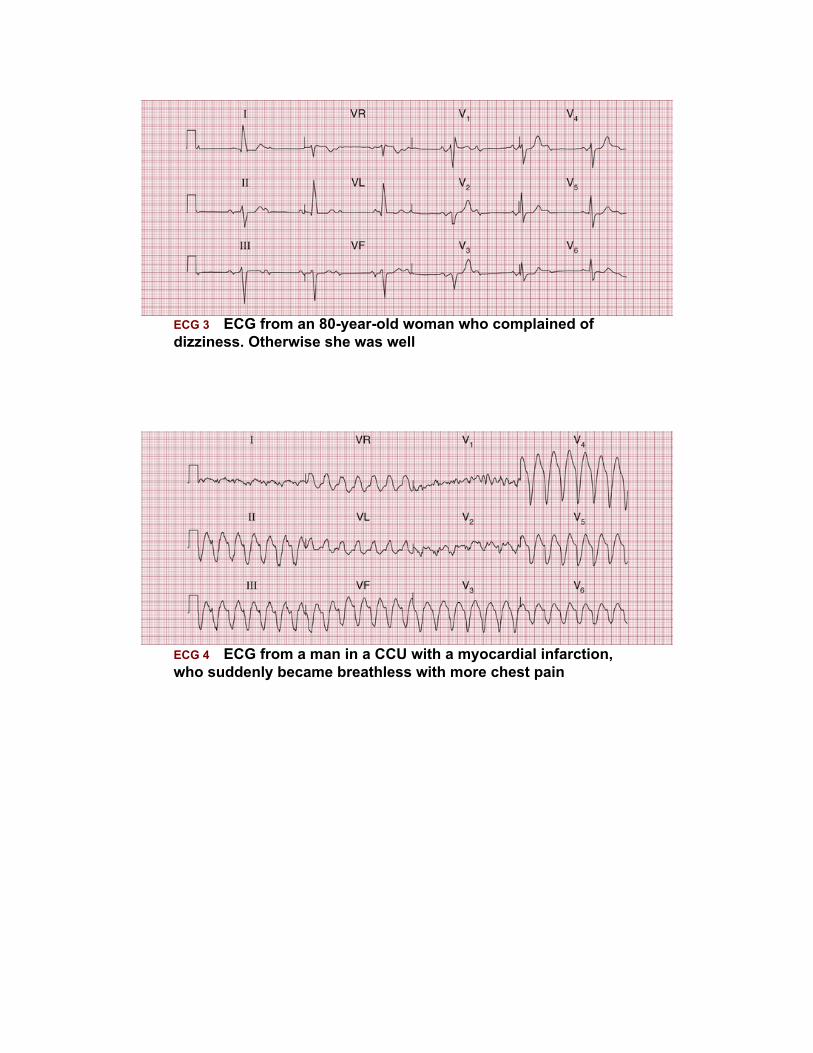
ECG 3 ECG from an 80-year-old woman who complained ofdizziness. Otherwise she was well
ECG 4 ECG from a man in a CCU with a myocardial infarction,who suddenly became breathless with more chest pain
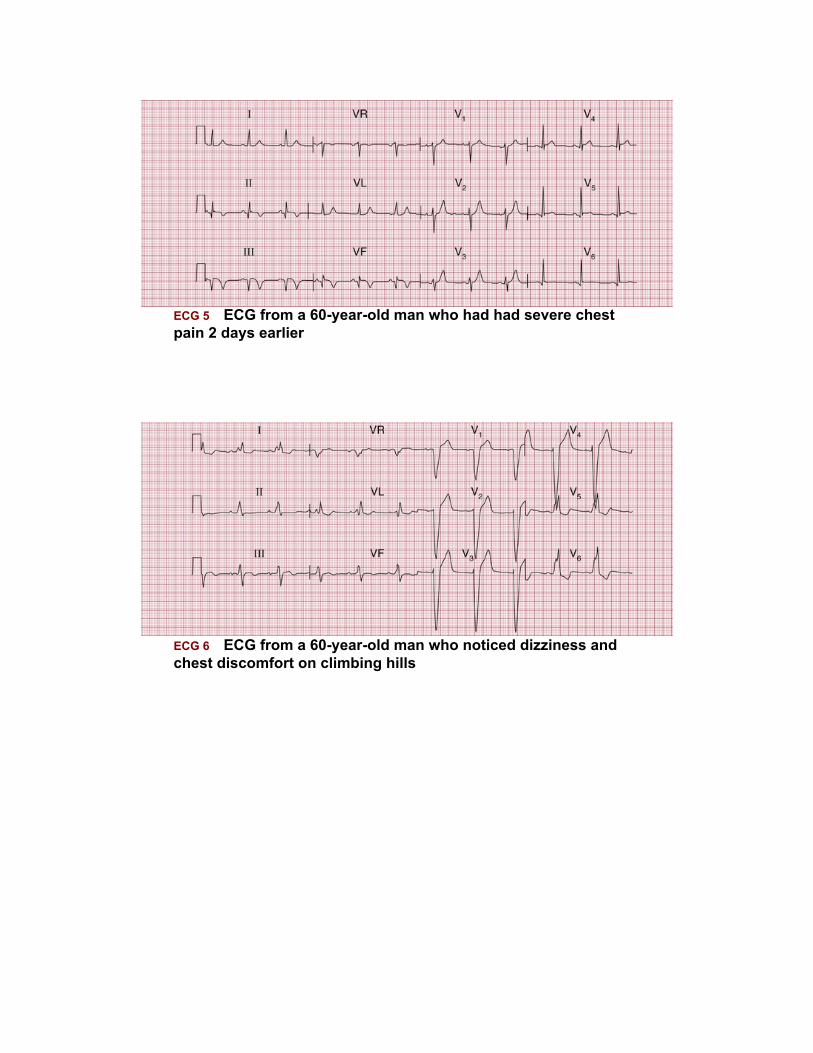
ECG 5 ECG from a 60-year-old man who had had severe chestpain 2 days earlier
ECG 6 ECG from a 60-year-old man who noticed dizziness andchest discomfort on climbing hills
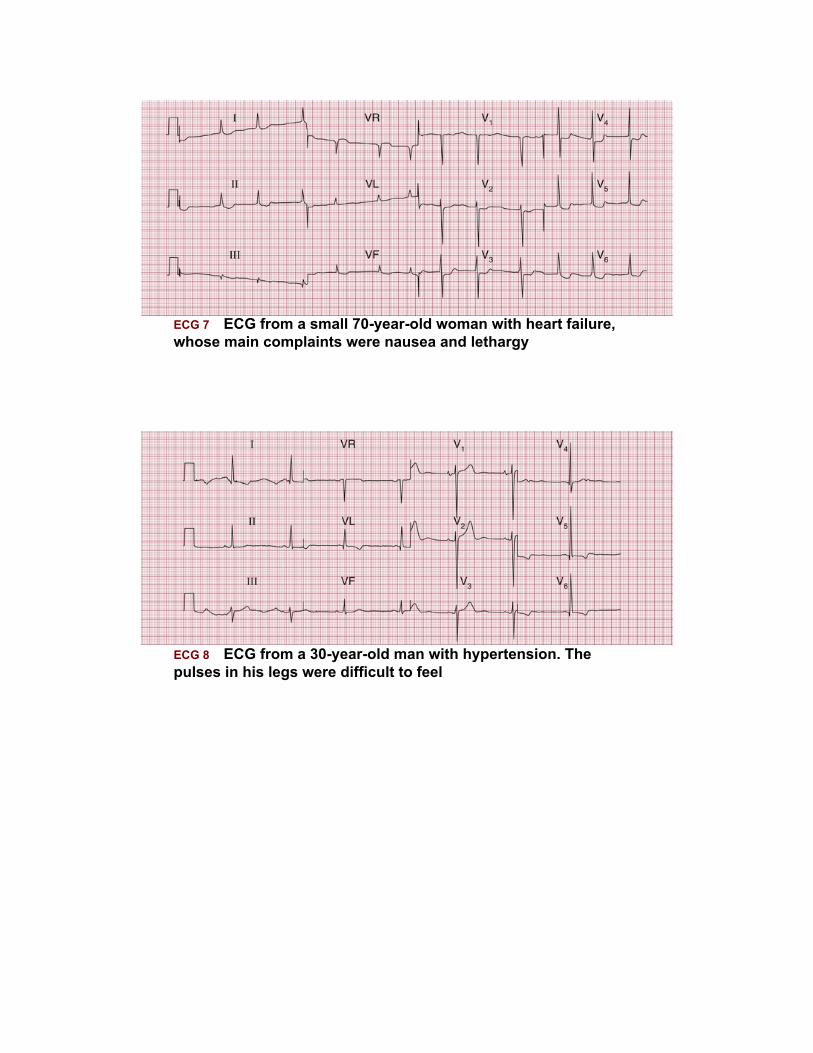
ECG 7 ECG from a small 70-year-old woman with heart failure,whose main complaints were nausea and lethargy
ECG 8 ECG from a 30-year-old man with hypertension. Thepulses in his legs were difficult to feel
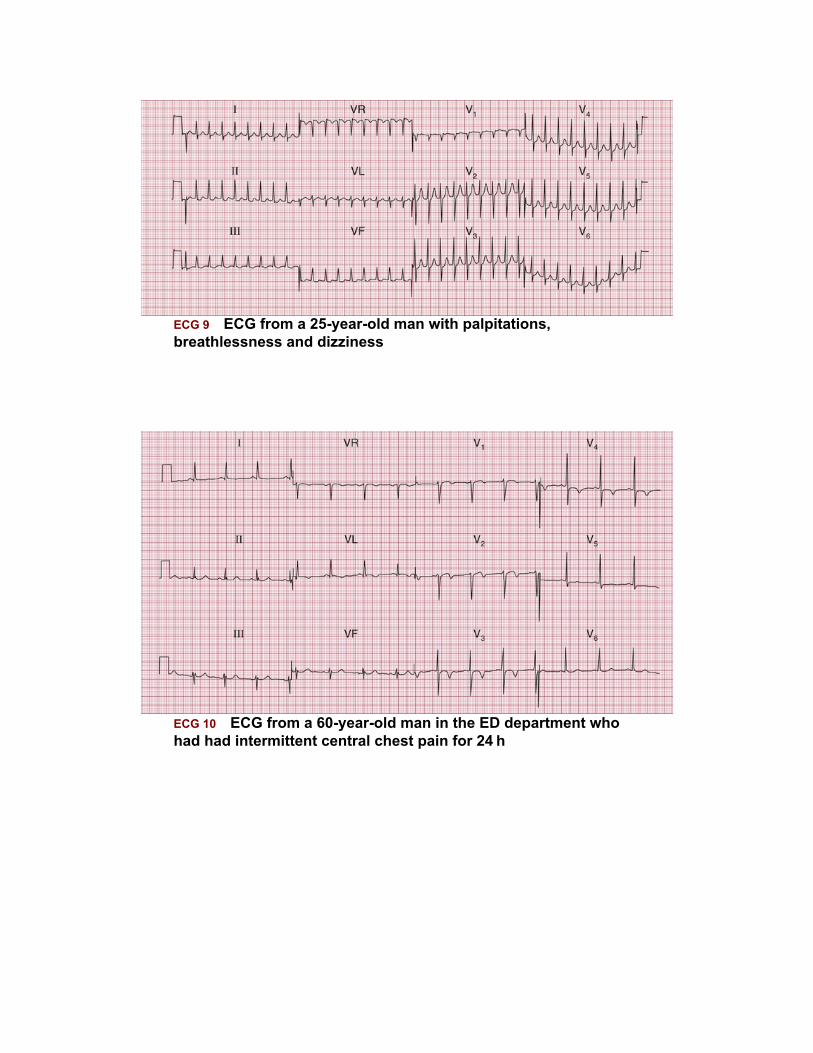
ECG 9 ECG from a 25-year-old man with palpitations,breathlessness and dizziness
ECG 10 ECG from a 60-year-old man in the ED department whohad had intermittent central chest pain for 24 h
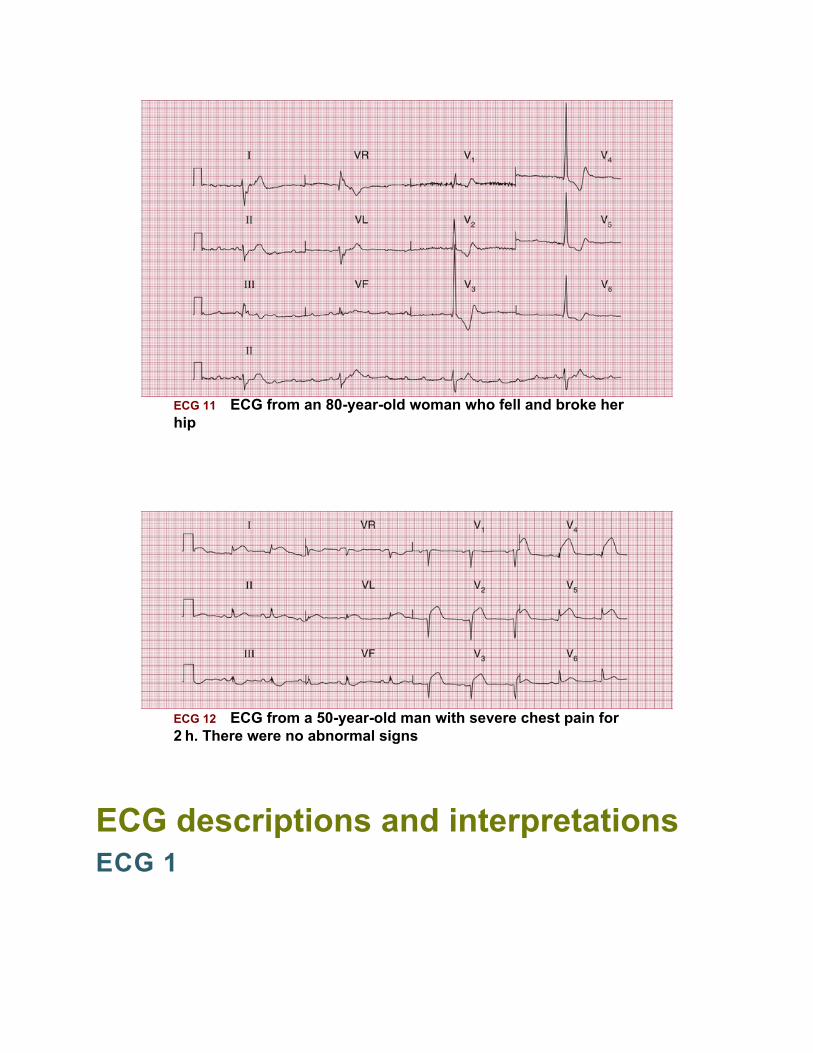
ECG 11 ECG from an 80-year-old woman who fell and broke herhip
ECG 12 ECG from a 50-year-old man with severe chest pain for2 h. There were no abnormal signs
ECG descriptions and interpretationsECG 1
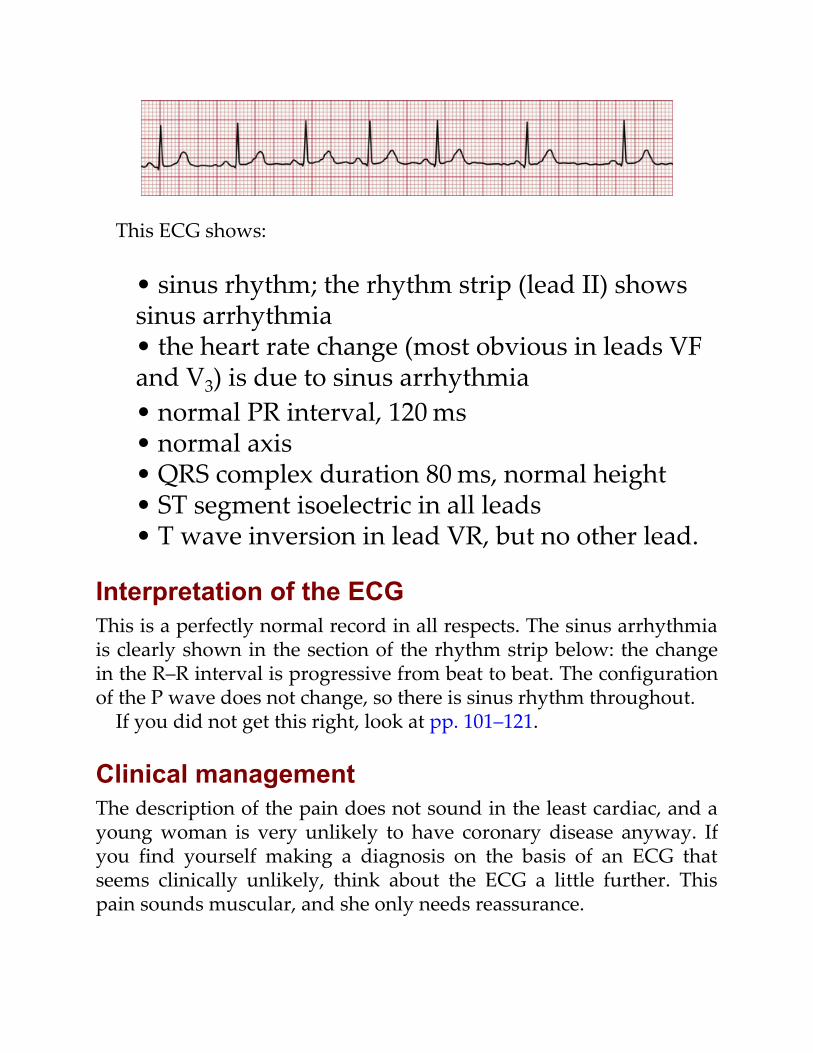
This ECG shows:
• sinus rhythm; the rhythm strip (lead II) showssinus arrhythmia• the heart rate change (most obvious in leads VFand V3) is due to sinus arrhythmia• normal PR interval, 120 ms• normal axis• QRS complex duration 80 ms, normal height• ST segment isoelectric in all leads• T wave inversion in lead VR, but no other lead.
Interpretation of the ECGThis is a perfectly normal record in all respects. The sinus arrhythmiais clearly shown in the section of the rhythm strip below: the changein the R–R interval is progressive from beat to beat. The configurationof the P wave does not change, so there is sinus rhythm throughout.
If you did not get this right, look at pp. 101–121.
Clinical managementThe description of the pain does not sound in the least cardiac, and ayoung woman is very unlikely to have coronary disease anyway. Ifyou find yourself making a diagnosis on the basis of an ECG thatseems clinically unlikely, think about the ECG a little further. Thispain sounds muscular, and she only needs reassurance.

ECG 2
This ECG shows:
• sinus rhythm• normal PR interval• normal axis• wide QRS complex duration, at 160 ms• RSR1 pattern in lead V1
• wide and notched S wave in lead V6
• ST segment isoelectric• T wave inversion in lead VR (normal), and inleads V1–V3.
Interpretation of the ECGThere is no problem with conduction between the atria and theventricles because the PR interval is normal and constant. Theprolonged QRS complex duration shows that there is conductiondelay within the ventricles. The RSR1 pattern in lead V1 and the deepand wide S wave in lead V6 (see the extracts from the traces, above)are characteristic of right bundle branch block (RBBB).
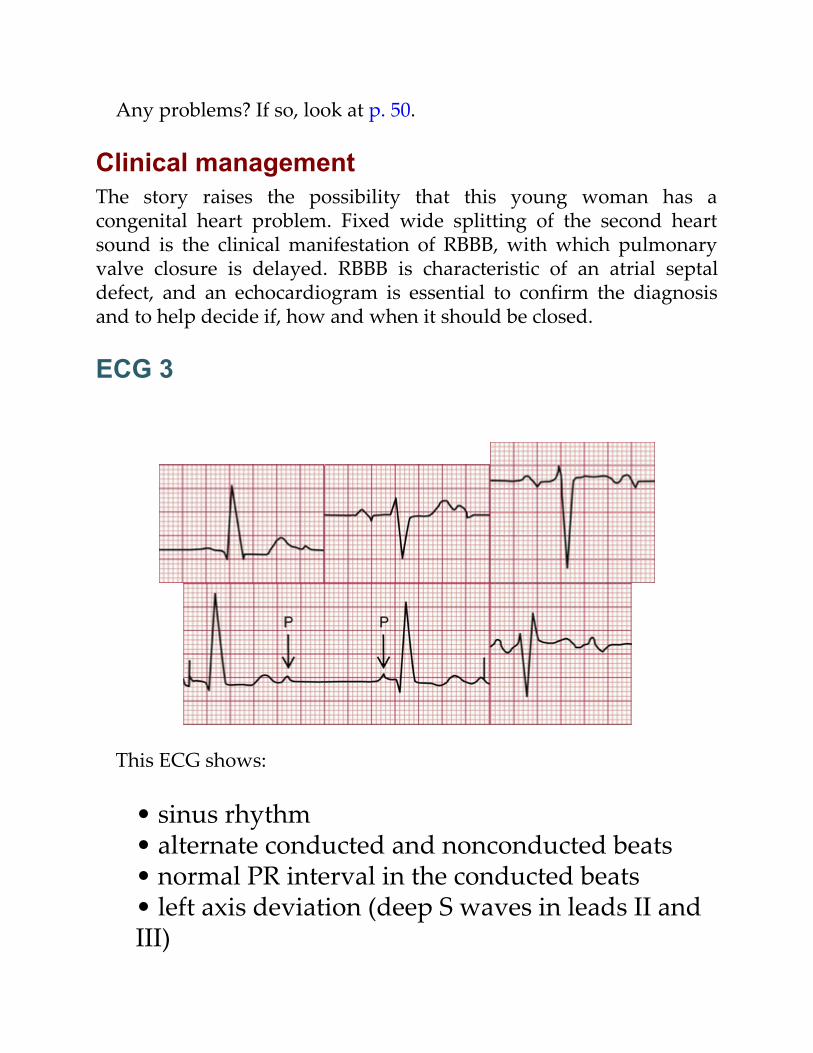
Any problems? If so, look at p. 50.
Clinical managementThe story raises the possibility that this young woman has acongenital heart problem. Fixed wide splitting of the second heartsound is the clinical manifestation of RBBB, with which pulmonaryvalve closure is delayed. RBBB is characteristic of an atrial septaldefect, and an echocardiogram is essential to confirm the diagnosisand to help decide if, how and when it should be closed.
ECG 3
This ECG shows:
• sinus rhythm• alternate conducted and nonconducted beats• normal PR interval in the conducted beats• left axis deviation (deep S waves in leads II andIII)
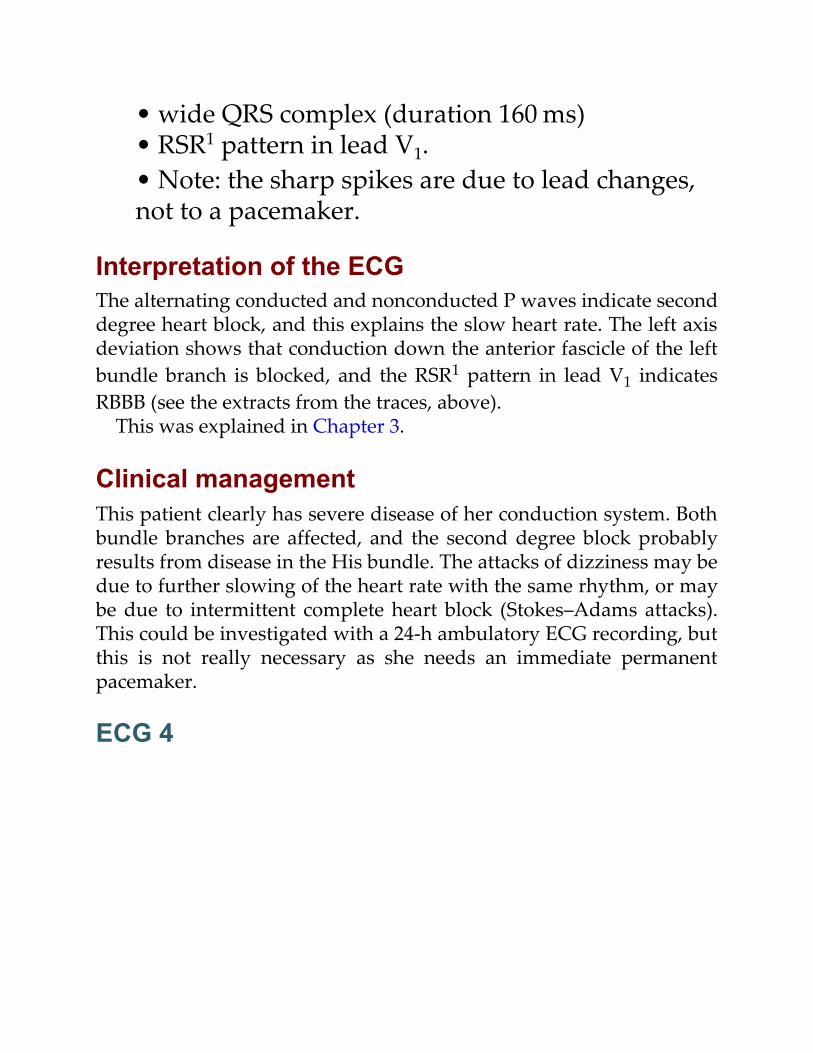
• wide QRS complex (duration 160 ms)• RSR1 pattern in lead V1.• Note: the sharp spikes are due to lead changes,not to a pacemaker.
Interpretation of the ECGThe alternating conducted and nonconducted P waves indicate seconddegree heart block, and this explains the slow heart rate. The left axisdeviation shows that conduction down the anterior fascicle of the leftbundle branch is blocked, and the RSR1 pattern in lead V1 indicatesRBBB (see the extracts from the traces, above).
This was explained in Chapter 3.
Clinical managementThis patient clearly has severe disease of her conduction system. Bothbundle branches are affected, and the second degree block probablyresults from disease in the His bundle. The attacks of dizziness may bedue to further slowing of the heart rate with the same rhythm, or maybe due to intermittent complete heart block (Stokes–Adams attacks).This could be investigated with a 24-h ambulatory ECG recording, butthis is not really necessary as she needs an immediate permanentpacemaker.
ECG 4
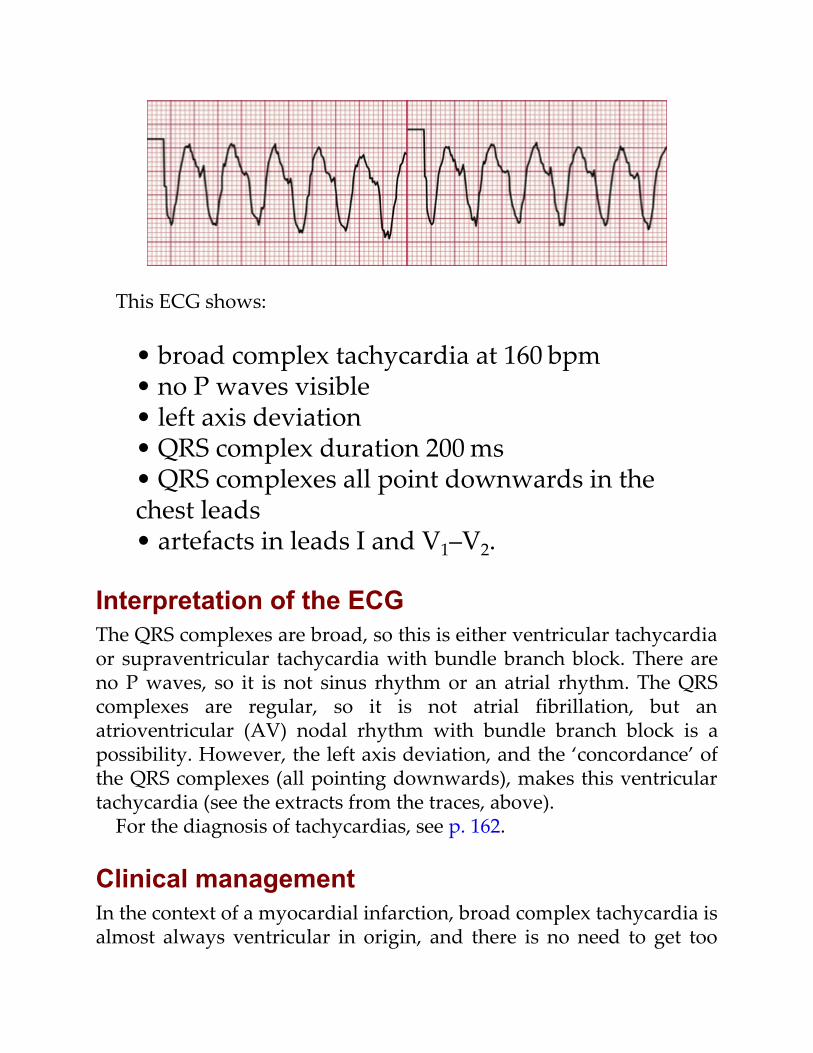
This ECG shows:
• broad complex tachycardia at 160 bpm• no P waves visible• left axis deviation• QRS complex duration 200 ms• QRS complexes all point downwards in thechest leads• artefacts in leads I and V1–V2.
Interpretation of the ECGThe QRS complexes are broad, so this is either ventricular tachycardiaor supraventricular tachycardia with bundle branch block. There areno P waves, so it is not sinus rhythm or an atrial rhythm. The QRScomplexes are regular, so it is not atrial fibrillation, but anatrioventricular (AV) nodal rhythm with bundle branch block is apossibility. However, the left axis deviation, and the ‘concordance’ ofthe QRS complexes (all pointing downwards), makes this ventriculartachycardia (see the extracts from the traces, above).
For the diagnosis of tachycardias, see p. 162.
Clinical managementIn the context of a myocardial infarction, broad complex tachycardia isalmost always ventricular in origin, and there is no need to get too

puzzled by the ECG. This patient has developed pulmonary oedema,so he needs urgent treatment. While preparations are made for directcurrent (DC) cardioversion, he could be given intravenous lidocaineand furosemide, but you should not rely on a satisfactory response todrug therapy.
ECG 5
This ECG shows:
• sinus rhythm• normal PR interval• normal axis• QRS complex has Q waves in leads II, III and VF• ST segment isoelectric• T waves inverted in leads II, III and VF.
Interpretation of the ECGThe Q waves in leads III and VF, together with the inverted T wavesin those leads (see the extract from the trace, above), indicate aninferior myocardial infarction. Since the ST segment is virtuallyisoelectric (i.e. at the baseline, and not elevated), the infarction is ‘old’.The ECG can show this pattern at any time after the 24 h following theinfarction, so timing the event is not possible from the ECG.
Get this one wrong? Read pp. 123–130.
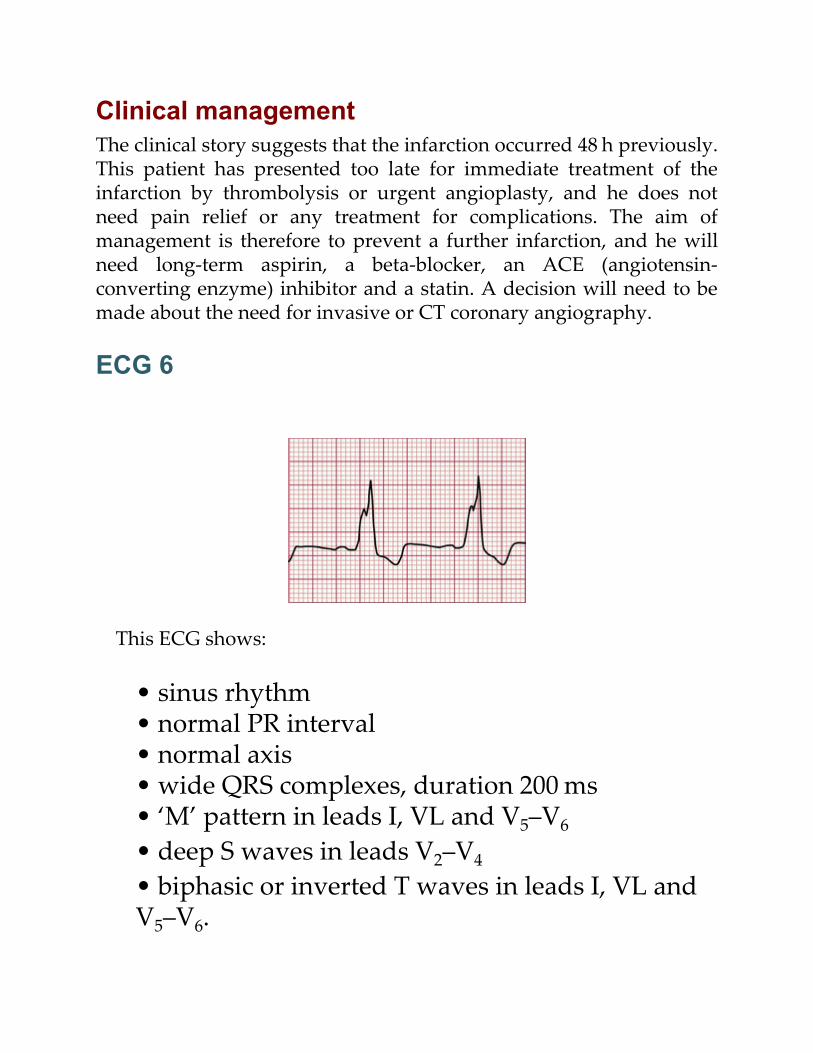
Clinical managementThe clinical story suggests that the infarction occurred 48 h previously.This patient has presented too late for immediate treatment of theinfarction by thrombolysis or urgent angioplasty, and he does notneed pain relief or any treatment for complications. The aim ofmanagement is therefore to prevent a further infarction, and he willneed long-term aspirin, a beta-blocker, an ACE (angiotensin-converting enzyme) inhibitor and a statin. A decision will need to bemade about the need for invasive or CT coronary angiography.
ECG 6
This ECG shows:
• sinus rhythm• normal PR interval• normal axis• wide QRS complexes, duration 200 ms• ‘M’ pattern in leads I, VL and V5–V6
• deep S waves in leads V2–V4
• biphasic or inverted T waves in leads I, VL andV5–V6.
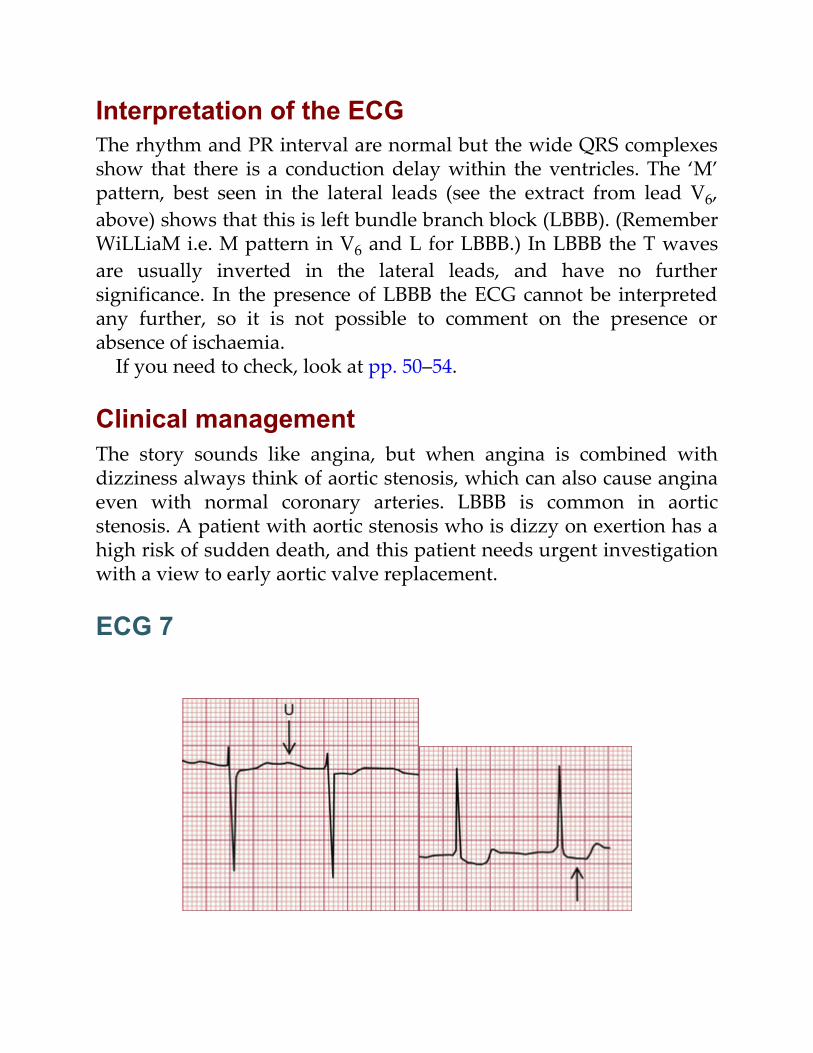
Interpretation of the ECGThe rhythm and PR interval are normal but the wide QRS complexesshow that there is a conduction delay within the ventricles. The ‘M’pattern, best seen in the lateral leads (see the extract from lead V6,above) shows that this is left bundle branch block (LBBB). (RememberWiLLiaM i.e. M pattern in V6 and L for LBBB.) In LBBB the T wavesare usually inverted in the lateral leads, and have no furthersignificance. In the presence of LBBB the ECG cannot be interpretedany further, so it is not possible to comment on the presence orabsence of ischaemia.
If you need to check, look at pp. 50–54.
Clinical managementThe story sounds like angina, but when angina is combined withdizziness always think of aortic stenosis, which can also cause anginaeven with normal coronary arteries. LBBB is common in aorticstenosis. A patient with aortic stenosis who is dizzy on exertion has ahigh risk of sudden death, and this patient needs urgent investigationwith a view to early aortic valve replacement.
ECG 7
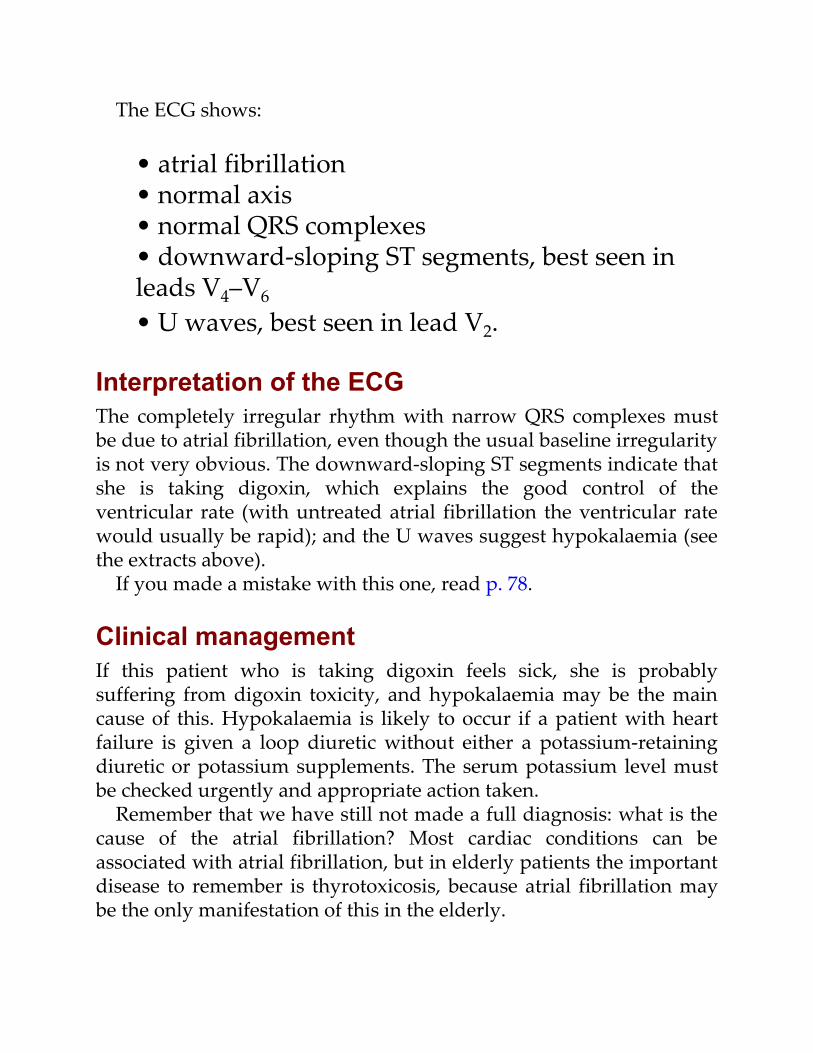
The ECG shows:
• atrial fibrillation• normal axis• normal QRS complexes• downward-sloping ST segments, best seen inleads V4–V6
• U waves, best seen in lead V2.
Interpretation of the ECGThe completely irregular rhythm with narrow QRS complexes mustbe due to atrial fibrillation, even though the usual baseline irregularityis not very obvious. The downward-sloping ST segments indicate thatshe is taking digoxin, which explains the good control of theventricular rate (with untreated atrial fibrillation the ventricular ratewould usually be rapid); and the U waves suggest hypokalaemia (seethe extracts above).
If you made a mistake with this one, read p. 78.
Clinical managementIf this patient who is taking digoxin feels sick, she is probablysuffering from digoxin toxicity, and hypokalaemia may be the maincause of this. Hypokalaemia is likely to occur if a patient with heartfailure is given a loop diuretic without either a potassium-retainingdiuretic or potassium supplements. The serum potassium level mustbe checked urgently and appropriate action taken.
Remember that we have still not made a full diagnosis: what is thecause of the atrial fibrillation? Most cardiac conditions can beassociated with atrial fibrillation, but in elderly patients the importantdisease to remember is thyrotoxicosis, because atrial fibrillation maybe the only manifestation of this in the elderly.
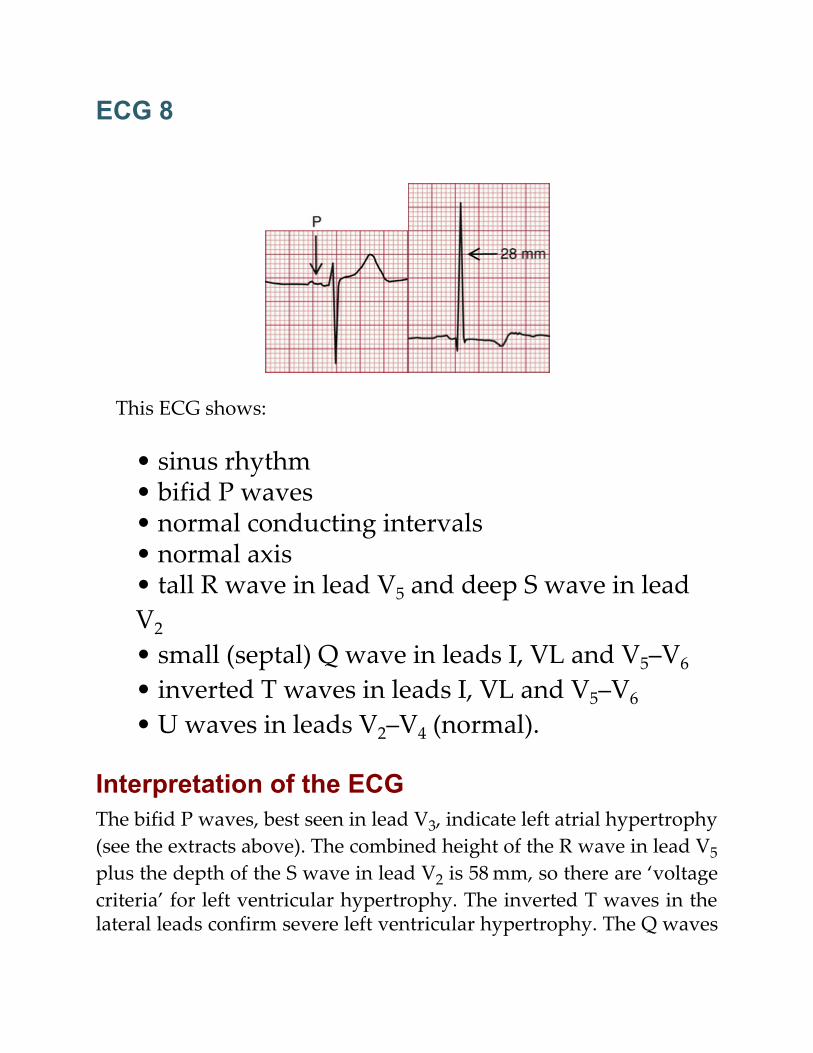
ECG 8
This ECG shows:
• sinus rhythm• bifid P waves• normal conducting intervals• normal axis• tall R wave in lead V5 and deep S wave in leadV2
• small (septal) Q wave in leads I, VL and V5–V6
• inverted T waves in leads I, VL and V5–V6
• U waves in leads V2–V4 (normal).
Interpretation of the ECGThe bifid P waves, best seen in lead V3, indicate left atrial hypertrophy(see the extracts above). The combined height of the R wave in lead V5plus the depth of the S wave in lead V2 is 58 mm, so there are ‘voltagecriteria’ for left ventricular hypertrophy. The inverted T waves in thelateral leads confirm severe left ventricular hypertrophy. The Q waves
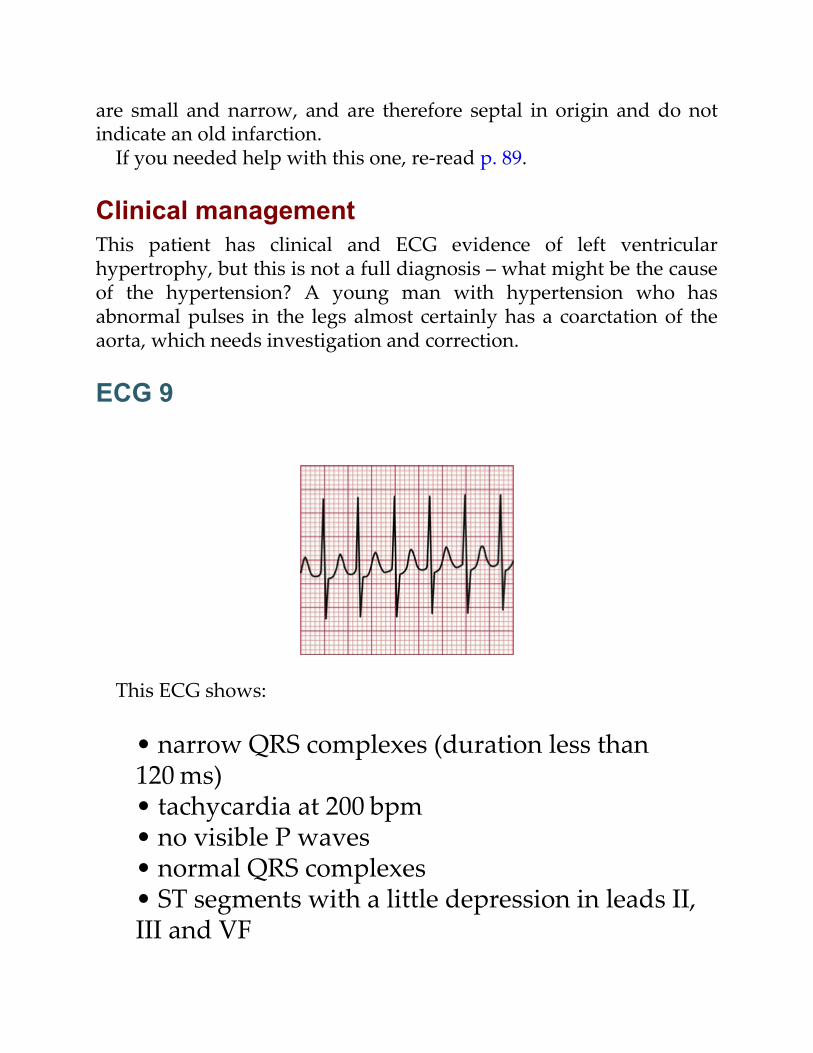
are small and narrow, and are therefore septal in origin and do notindicate an old infarction.
If you needed help with this one, re-read p. 89.
Clinical managementThis patient has clinical and ECG evidence of left ventricularhypertrophy, but this is not a full diagnosis – what might be the causeof the hypertension? A young man with hypertension who hasabnormal pulses in the legs almost certainly has a coarctation of theaorta, which needs investigation and correction.
ECG 9
This ECG shows:
• narrow QRS complexes (duration less than120 ms)• tachycardia at 200 bpm• no visible P waves• normal QRS complexes• ST segments with a little depression in leads II,III and VF
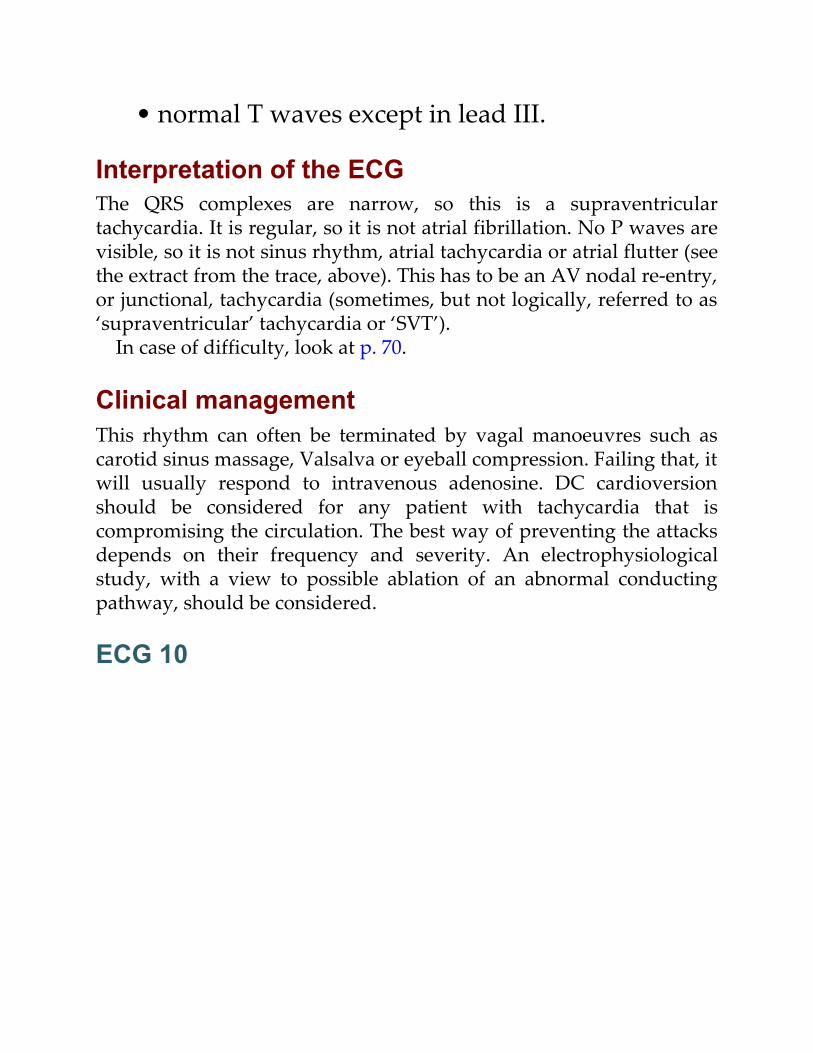
• normal T waves except in lead III.
Interpretation of the ECGThe QRS complexes are narrow, so this is a supraventriculartachycardia. It is regular, so it is not atrial fibrillation. No P waves arevisible, so it is not sinus rhythm, atrial tachycardia or atrial flutter (seethe extract from the trace, above). This has to be an AV nodal re-entry,or junctional, tachycardia (sometimes, but not logically, referred to as‘supraventricular’ tachycardia or ‘SVT’).
In case of difficulty, look at p. 70.
Clinical managementThis rhythm can often be terminated by vagal manoeuvres such ascarotid sinus massage, Valsalva or eyeball compression. Failing that, itwill usually respond to intravenous adenosine. DC cardioversionshould be considered for any patient with tachycardia that iscompromising the circulation. The best way of preventing the attacksdepends on their frequency and severity. An electrophysiologicalstudy, with a view to possible ablation of an abnormal conductingpathway, should be considered.
ECG 10
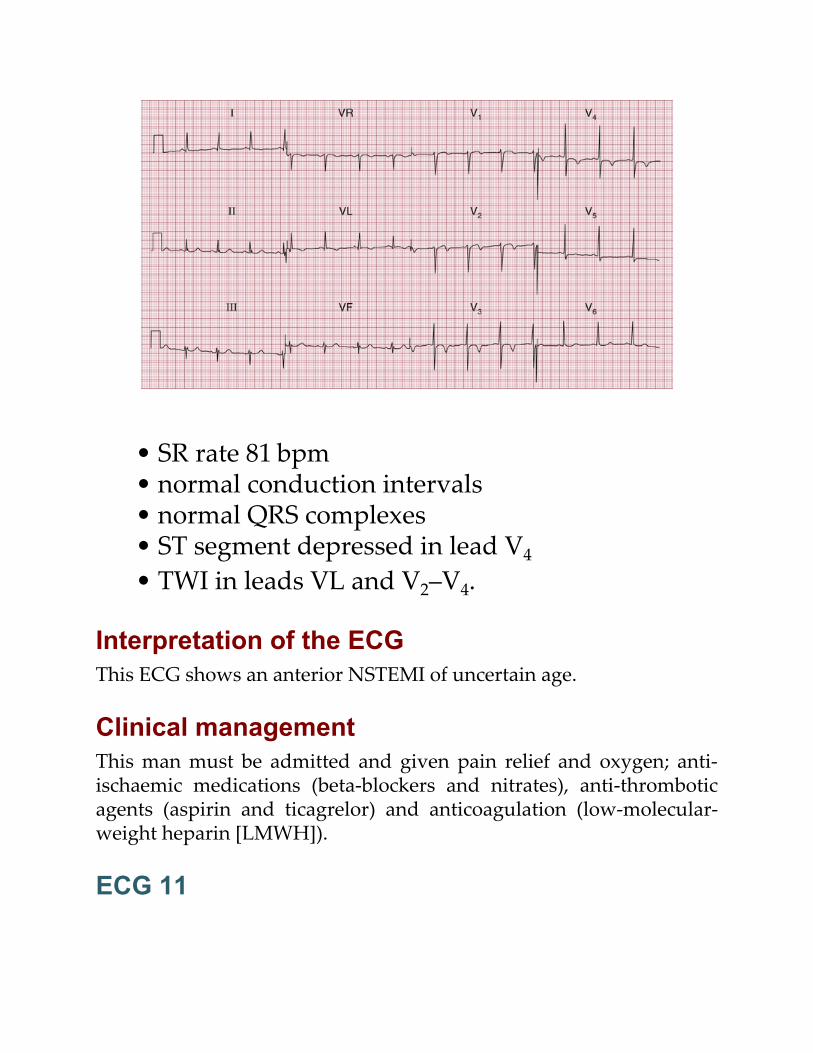
• SR rate 81 bpm• normal conduction intervals• normal QRS complexes• ST segment depressed in lead V4
• TWI in leads VL and V2–V4.
Interpretation of the ECGThis ECG shows an anterior NSTEMI of uncertain age.
Clinical managementThis man must be admitted and given pain relief and oxygen; anti-ischaemic medications (beta-blockers and nitrates), anti-thromboticagents (aspirin and ticagrelor) and anticoagulation (low-molecular-weight heparin [LMWH]).
ECG 11
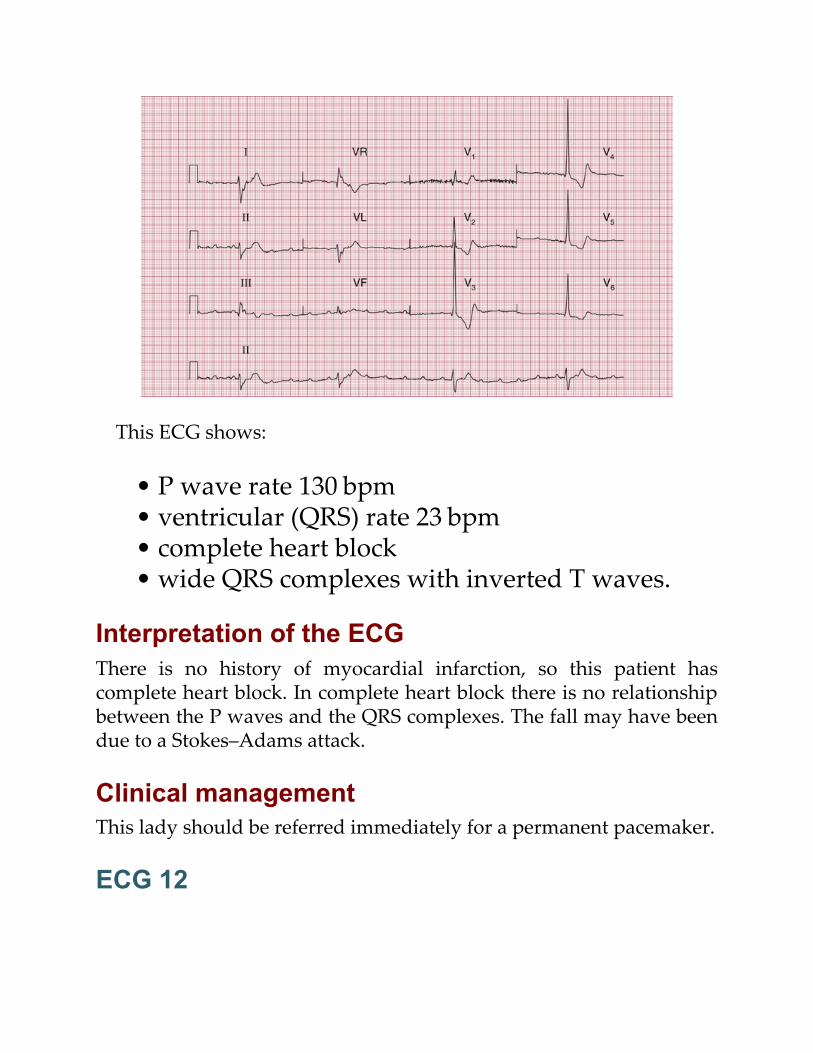
This ECG shows:
• P wave rate 130 bpm• ventricular (QRS) rate 23 bpm• complete heart block• wide QRS complexes with inverted T waves.
Interpretation of the ECGThere is no history of myocardial infarction, so this patient hascomplete heart block. In complete heart block there is no relationshipbetween the P waves and the QRS complexes. The fall may have beendue to a Stokes–Adams attack.
Clinical managementThis lady should be referred immediately for a permanent pacemaker.
ECG 12
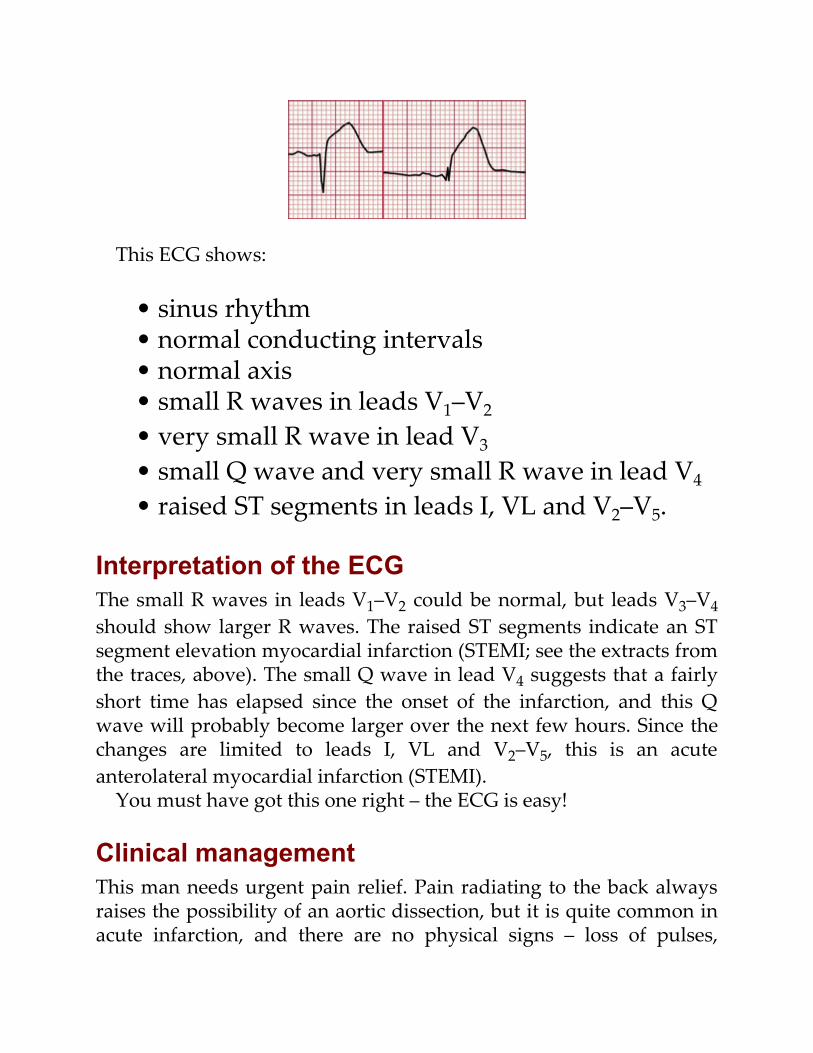
This ECG shows:
• sinus rhythm• normal conducting intervals• normal axis• small R waves in leads V1–V2
• very small R wave in lead V3
• small Q wave and very small R wave in lead V4
• raised ST segments in leads I, VL and V2–V5.
Interpretation of the ECGThe small R waves in leads V1–V2 could be normal, but leads V3–V4should show larger R waves. The raised ST segments indicate an STsegment elevation myocardial infarction (STEMI; see the extracts fromthe traces, above). The small Q wave in lead V4 suggests that a fairlyshort time has elapsed since the onset of the infarction, and this Qwave will probably become larger over the next few hours. Since thechanges are limited to leads I, VL and V2–V5, this is an acuteanterolateral myocardial infarction (STEMI).
You must have got this one right – the ECG is easy!
Clinical managementThis man needs urgent pain relief. Pain radiating to the back alwaysraises the possibility of an aortic dissection, but it is quite common inacute infarction, and there are no physical signs – loss of pulses,
asymmetric blood pressure in the arms, a murmur of aorticregurgitation or pericarditis – to support a diagnosis of aorticdissection. If in doubt an urgent CT aorta may help, but essentiallythis patient needs either immediate thrombolysis or angioplasty.■ TOP TIP: The moral of the stories in Chapter 9 is that an ECG is
an aid to diagnosis, not a substitute for further thought.■ TOP TIP: It is important to look at as many ECGs as possible
and to test yourself. For more real-world ECGs to test yourself on,see 150 ECG Cases, 5th edition.
Index
Page numbers followed by ‘f’ indicate figures, ‘t’ indicate tables, and‘b’ indicate boxes.
A
‘AAI’ pacing, 157
Accelerated idioventricular rhythm, 64–67, 67f, 161b
Accessory conducting bundle, 80
Acute coronary syndrome, 123–124non-ST segment elevation, 124
ST segment elevationacute anterior, 126fold anterior, 129f
, Myocardial infarction
Ambulatory (ECG) recordbroad complex tachycardia, 144f
paroxysmal tachycardia, 143–144sick sinus syndrome, 155, 157fsyncope due to bradycardia, 149
Angina, 123dizziness with, 177ECG at rest, 137, 138fexercise causing, 137
Prinzmetal's variant, 137
ST segment in, 137unstable, 124, 125f
Anterior axillary line, 31
Anterior fascicles, of left bundle branch, 55block, Left anterior hemiblock
Anterior leads, old anterior myocardial infarction with poor R waveprogression in, 130f
Antiarrhythmic drugs, prolonged QT interval due, 149
Aortic dissection, 183
Aortic stenosis, 144
Arrhythmia, 61junctional (nodal), 62–63management, 82
sinus, 9f, 9t–10t, 62–63, 62f, 104f, 164f, 172, 172fsupraventricular, Supraventricular rhythmsventricular, Ventricular rhythms, Bradycardia, Extrasystoles, Tachycardia
Asymptomatic patient, 101atrial fibrillation, 101, 102fpalpitations/syncope
bradycardia, 149cardiac disease, 144, 145f
normal ECGs, 143–144paroxysmal tachycardia, 144–149
Atheromatous plaque, 123
Athlete(s)ECG in, 121–122, 122bintermittent bradycardia, 155
sinus bradycardia, 103f, 155
Atrial contraction, 61, Pwave
Atrial escape, 64, 65f
Atrial extrasystoles, 67, 67f, 105f, 108
Atrial fibrillation, 9f, 9t–10t, 78, 78f, 79f, 155asymptomatic patient, 101, 102f
clinical scenario, 167f, 178, 178f
Atrial flutter, 70, 71fwith 2 : 1 block, 70, 71f, 72fwith carotid sinus massage, 75f, 82
Atrial hypertrophyleft, 86, 86f, 142bright, 86–87, 86f, 142b
Atrial muscle, abnormal cardiac rhythms in, 62–63
Atrial pacing, 157–160, 159f
Atrial rates, of discharge, tachycardia, 70
Atrial rhythm, ectopic, 107, 107f
Atrial septal defect, 112, 112f
Atrial tachycardia, 70, 70f
Atrioventricular (AV) blockatrial tachycardia associated with, 70, Second degree heart block
Atrioventricular nodal re-entry tachycardia (AVNRT), 72, 80–82clinical scenario, 168f, 180, 180f, Junctional (nodal) tachycardia
Atrioventricular (AV) node, 16, 62–63atrial fibrillation, 78atrial tachycardia, 70conduction problems in, 45–48
nodal (junctional) escape, 64, 65f
Axis, Cardiac axis
B
Bazett's formula, 149
Bifascicular block, 55, 58f, 149, 154f, 186b
Bifid P wave, 86, 86f, 108, 108fclinical scenario, 167f, 179, 179f
Block, heart, Heart block
Bradycardia, 62, 64–67intermittent, 155, 157fsinus, Sinus bradycardiasyncope due to, 149
Breathlessness, 123–140causes of, 140bdue to heart disease, 137due to lung disease, 140
Broad complex tachycardia, 8f, 8t, 162b
Bruce protocol, 137, 137t
Bundle branch block, 50–55, 87causes, 113b
inverted T waves, 97f, 98f, 99, 144mechanism, 50supraventricular tachycardia vs. ventricular tachycardia, 75–77, Left bundle
branch block (LBBB), Right bundle branch block (RBBB)
Bundle of His, His bundle
C
Calcium, low plasma level, 99
Calibration, ECG recorder, 20, 20f, 32–34over-calibration, 34f
under-calibration, 32–34, 35f
Cardiac arrest, 160–161causes of, 160
nonshockable rhythms, 161bpulseless electrical activity, 160shockable rhythms, 160
Cardiac axis, 23–26, 24f, 43b, 185deviation, causes, 187bleft anterior fascicular block, effect, 55, 56fleft anterior hemiblock, effect, 58f
left axis deviation, Left axis deviationmeasurement in degrees, 25, 26fnormal, 23, 24f, 25–26, 55, 56f
right axis deviation, Right axis deviationright bundle branch block, effect, 57f, 58f
Cardiac hypertrophy, 142b
Cardiac ischaemia, Ischaemia, cardiac
Cardiac rhythm, Rhythm, cardiac
Cardiomyopathy, hypertrophic, 144, 145f
Carotid sinus massage (CSM), 72–74, 75f, 82
Carotid sinus pressure (CSP), narrow complex tachycardia, 155
Chest leads (V1-V6), V1-V6 leads
Chest pain, 123–140cardiac ischaemia, 124causes of, 123, 124b
clinical scenario, 164f, 172, 172fconstant, 123–135intermittent, 137, 137t, 138f, 139f, Angina
Chronic lung disease, 140, 142f
Clockwise rotation, 130, 131f
‘Compensatory’ pause, 69
Complete heart block, Third degree (complete) heart block
Conducting bundle, accessory, 80
Conduction problems, 45–60, 60b, 149, 186bin AV node and His bundle, 45–48
in bundle branch block, 50–55clinical scenario, 165f, 174, 174fin distal parts of left bundle branch, 55
in healthy people, 109–110, Heart block
Constant chest pain, 123–135
Coronary vasospasm, 137
D
DC cardioversion, 160‘DDD’ pacing, 157–160
Delta wave, 80, 81f
Depolarization, 2, 16, 23, 24fbundle branch block, 50deflection of, 43b, 43ffirst degree heart block, 46
initiation, in SA node, 61, 64intrinsic frequency, 64–67left bundle branch, 55, 55f
supraventricular rhythms, 63, 63fventricular rhythms, 63, 64f
Digoxin, 99T wave inversion, 99f
toxicity, management, 178
Dizziness, 149, 155bundle of His disease, 165f, 174, 174f
Dual chamber pacing, 160f
E
ECG recorder, 20calibration, Calibration, ECG recorder
leads, Leadstimes and speeds in, 17–19, 18f, 18t, 36f, 38f
ECG recordingabnormal, recognition, 84, 84t
analysis, 68–69calibration of, 20, 20f, 32–34expectations, 15–16
health screening use, 101how to, 2ideal, 28, 29f
interpretation, 82non-relaxed subject, 34–39, 39fpractical points in, 28–39
reporting of, 39–43description in, sequence of, 40
Ectopic atrial rhythm, 107, 107f
Ectopic beats, 9f, 9t–10t, 67, Extrasystoles
Ejection systolic murmur, 164f, 173, 173f
Elderly patientsatrial fibrillation, 178
dizziness, heart rate, 155
Electrical interference, 32, 33f
Electrocardiogram (ECG), 1–433-lead, 212-lead, 2, 3f, 20–21
basic principles for, 43bclockwise rotation in, 130complex, 2, 4f, 18f
electrical pictures, 20–21interpretation of, 2–7, 15–16need for, 1–2
normal, 11f, 12f, 13, 13f, 143–144good record of, 29fpaper speeds in, variations of, 36f, 38fvariants of, 41f, 42f, 43b
parts of, 16–20poor skin contact and, 31–32, 32fred flags in, 14, 14t
variants in, 13
Electrodes, 2placement of, 2reversal of, 30f
skin, good contact between, 31–32, 32f
Electrolyte abnormalities, T wave abnormalities, 99
Enhanced automaticity, 80–82
Escape rhythm/mechanism, 64atrial, 64, 65fcomplete heart block, 48
nodal (junctional), 64, 65fventricular, 64–67, 66f
Exercise-induced ischaemic changes, 95, 95f
Exercise testing, 137abrasive pads, 31–32angina, 137Bruce protocol, 137, 137t
Extrasystoles, 9f, 9t–10t, 64, 67–69, 104atrial, 67, 67f, 105f, 108junctional (nodal), 67, 67fpalpitations due to, 155
supraventricular, 69, 69f, 104ventricular, 68, 68f, 69f, 104, 106f, 161b
F
Fibrillation, 64, 77–80atrial, Atrial fibrillation
ventricular, Ventricular fibrillation
First degree heart block, 46, 46f, 109f, 153f, 186bcauses of, 154bin healthy people, 109, 109f
H
Hair, poor electrode contact due to, 31–32
Health screening, ECG usage, 101
Healthy patients, ECG in, 101–122cardiac rhythm, 101–107, 103b, 103f
conduction, 109–110, 109f
QRS complex, 110–115, 113f, 114f, 115f, 116f, 118f, 119fST segment, 117, 117f, 118f
T wave, 119, 119f, 120fU wave, 121, 121f
Heart, 1electricity of, 16
internal wiring of, 2–4, 4frhythm of, 16, 61–84, Rhythm, cardiacwiring diagram of, 16, 16f, 46f
Heart block, 6f, 46causes of, 154bfirst degree, First degree heart blocksecond degree, Second degree heart block
third degree, Third degree (complete) heart block
Heart disease, breathlessness due to, 137
Heart ratecalculation, 17, 18tnormal, 64
paroxysmal tachycardia, 155slow/fast, causes, 103b
Heart sound, widely split, 164f, 173
Hemiblockleft anterior, 55, 58fleft posterior, 55
High take-off ST segments, 117, 117f
His bundle, 16, 16f, 80branches, anatomy, 55, 55fconduction problems in, 45–48disease in, dizziness and, 165f, 174, 174f
fibrosis, 48
Hyperkalaemia, 108, 119
Hypertrophic cardiomyopathy, 144, 145f
Hypokalaemia, 121, 178
I
Idioventricular rhythm, accelerated, 64–67, 67f, 161b
Infarction, Myocardial infarction
Intermittent bradycardia, 155
Intermittent chest pain, 137, 137t, 138f, 139f
Intermittent tachycardia, Paroxysmal tachycardia
Interventricular septum, 50
Inversionin left bundle branch block, 144in left ventricular hypertrophy, 144
Ischaemia, cardiacchest pain and, 124diagnosis of, 137exercise-induced changes, 95, 95f
lateral, 91, 93fST segment depression, 95, Angina, Myocardial infarction
J
Junctional escape, 64, 65f
Junctional (nodal) extrasystoles, 67, 67f
Junctional rhythm, 62–63
Junctional (nodal) tachycardia, 72, 73f, 74f, 80–82, Atrioventricular
nodal re-entry tachycardia (AVNRT)
L
Leads, 20, 20tcardiac axis and lead angles, 26f
chest leads, V1-V6 leads
limb leads, Limb leadsstandard, 20–21, 21f
V leads, V1-V6 leads, Cardiac axis
Left anterior hemiblock (left anterior fascicular block), 55, 92f, 110,110f, 186b
effect on cardiac axis, 58f
Left atrial hypertrophy, 86, 86f, 142b
Left axis deviation, 25, 25f, 187bdownward QRS complex and, 110
sinus rhythm with, 57fduring tachycardia, 77
Left bundle branch block (LBBB), 53–55, 112, 186bcauses, 113b
clinical scenario, 166f, 177, 177ffirst degree block and, 153fmechanism, 50
sinus rhythm with, 54f, 75–77, 77fstages, 53f
Left posterior hemiblock, 55
Left ventricle, influence on ECG pattern, 50
Left ventricular hypertrophy, 114, 114f, 142b, 167f, 179, 179finverted T waves, 89
QRS complex, 89, 90f, 114, 114fvoltage criteria, 89
Left ventricular lead, 86
Limb leads, 20, 43bQRS complex in, 23, 24freversed, 28, 30f
Long QT interval, 149, QT interval, prolonged
Lown-Ganong-Levine syndrome, 144, 148f
Lung diseasebreathlessness due to, 140
chronic, 131f, 140, 142f
M
M patternclinical scenario, 166f, 177, 177fin left bundle branch block, 54f, 144
Magnesium, abnormal levels, 99
Midaxillary line, 31, 31f
Midclavicular line, 31, 31f
Mitral stenosis, 108bifid P wave, 86, 86f
Mobitz type 1 (Wenckebach) block, 46–47, 47f, 109–110, 133f, 149
Mobitz type 2 block, 47, 47f, 149
Modified Bruce protocol, 137
Myocardial infarctionaccelerated idioventricular rhythm, 64–67acute, absence of, plasma troponin level elevation in, 124b
acute anterior, 91, 91fNSTEMI, 98f
acute anterolateral, 91, 92fclinical scenario, 171f, 183, 183fleft anterior hemiblock with, 92f
acute inferior, 91, 93fdevelopment, 96, 97f
age of, 94broad complex tachycardia, 75–77
chest pain due to, 123–124complete heart block, 48development, 96, 97f
diagnosis of, 123–124inferior, second degree (Wenckebach) heart block in, 133fnon-Q wave, 96
NSTEMIanterior, 135fsubendocardial, 96, 98f
old anterior, with poor R wave progression, in anterior leads, 130f
old inferior, 133fold posterior, 134fposterior, 91–94, 94f
ST segment elevation, ST segment elevation myocardial infarction (STEMI)T wave inversion, 95f, 96, 97f, 98f, Ischaemia, cardiac
Myocardial ischaemia, Ischaemia, cardiac
Myocardial necrosis, 123–124
N
Narrow complex tachycardia, 8f, 8t, 70, 155
Nodal (junctional) escape, 64, 65f
Nodal (junctional) extrasystoles, 67, 67f
Nodal (junctional) tachycardia, 72, 73f, 74f, 80–82, Atrioventricularnodal re-entry tachycardia (AVNRT)
Non-Q wave infarction, 96, 135, Myocardial infarction, NSTEMI
Non-ST segment elevation acute coronary syndrome (NST-ACS), 124
Non-ST segment elevation myocardial infarction (NSTEMI), 96, 98f,124, 135
anterior, 135f
clinical scenario, 169f, 181, 181f
Nonshockable rhythms, causes of, 161b
Normal ECG, 11f, 12f, 13, 13f, 143–144good record of, 29fpaper speeds in, variations of, 36f, 38f
variants of, 41f, 42f, 43b
O
Over-calibration, 34f
P
P wave, 4f, 16, 17f, 43b, 61abnormal, 85–100, 185
atrial extrasystole, 67causes, 100b
absentatrial fibrillation, 78, 78fjunctional escape, 108junctional extrasystole, 67, 67f
junctional tachycardia, 72ventricular tachycardia, 175
in atrial extrasystoles, 108in atrial tachycardia, 70
bifid, 86, 86f, 108, 108fbroad, 86, 86f
left atrial hypertrophy, 86, 86f
as distortion of T wave, 47, 48feffects of supraventricular and ventricular extrasystoles on, 69
healthy subjects, 107–108inverted, 107fpeaked, 86–87, 86f, 88f, 100
right atrial hypertrophy, 86, 86f
tall, 107–108
Pacemaker, 83f, 157–160AAI, 157atrial pacing, 157–160
DDD, 157–160dual chamber pacing, 160foperating mode of, 157
ventricular pacing, 158fVVI, 157
Pain, Chest pain
Palpitations, 143ECG in, 143–161
normal ECGs, 143–144with symptoms, 155
Paper speed, for ECG recorders, 3412.5 mm/s, 38f
50 mm/s, 36f
Parkinson's disease, 34–39
Paroxysmal supraventricular tachycardia, 155
Paroxysmal tachycardia, 70, 155
patterns suggesting, 144–149torsade de pointes, 149
Paroxysmal ventricular tachycardia, 149
Partial right bundle branch block, 50, 112, 112f
Percutaneous coronary intervention, 124
Pericarditis, elevated ST segment, 95, 95f
Plasma troponin level, elevation of, causes of, 124b
Posterior fascicles, of left bundle branch, 55
Potassium, low/high levels, 99, 121
PR interval, 4, 4f, 50measurement, 17normal, 19, 19f, 45–46, 109prolonged, 46, 109, Heart block
short, 144Wolff-Parkinson-White syndrome, 80, 81f
Pre-excitation syndromes, 80, 144
Premature contraction, 67
Prinzmetal's variant angina, 137
Pulmonary embolism, 87, 89f, 140, 141b, 141f
Pulmonary hypertension, 144
Pulmonary oedema, 175
Pulseless electrical activity, 160
Purkinje fibres, 16, 63
Q
Q wave, 7f, 17, 17f, 23, 86, 89–94, 186, 187b–188bin acute anterior ST segment elevation myocardial infarction, 127f, 128f
acute anterolateral infarction, 91deep, 7f
in healthy people, 115, 115f, 116finfarction, 135infero-lateral, normal ECG with, 115, 115f
in myocardial infarction, 90, 115timing, 96
narrow, 115
normal, 89origin, 89–94, 90fin pulmonary embolism, 87
septal, 89, 122bin STEMI, 126, ST segment elevation myocardial infarction (STEMI)width, 89
QRS complex, 4, 4f, 16, 17f, 61, 155, 185–186abnormal, 85–100
features and causes, 100bventricular extrasystole, 68
atrial fibrillation, 78
duration, 19, 50, 86, 112in healthy people, 110–115, 113f, 114f, 115f, 116f, 117f, 118f, 119fheight, 87–89, 100, 112, 114f
healthy subjects, 112, 114fleft ventricular hypertrophy, 114, 114f
junctional tachycardia, 72in left ventricular hypertrophy, 89, 90f, 114, 114f
in the limb leads, 23, 24fmore than 1 : 1, 187b–188bnormal
characteristics, 86duration, 86, 112supraventricular rhythms, 63
in paroxysmal tachycardia, 155parts of, 17, 17f
prolonged, 19fin pulmonary embolism, 87, 89fin right ventricular hypertrophy, 87, 87f, 88f
shape of, 23–28squares between, variable number of, 5ftimes and speeds of, 17, 18f
in V leads, 26, 27f, 28fwide/widening, 63, 87, 110–112, 187b–188b
bundle branch block, 50, 87, 100causes, 100b
electrolyte abnormalities, 99ventricular tachycardia, 75Wolff-Parkinson-White syndrome, 80, 87
width abnormalities, 7f, 87
Wolff-Parkinson-White syndrome, 144
QT intervalBazett's formula, 149prolonged, 150f
calcium abnormalities causing, 99causes of, 149b
QTc, 149
R
R on T phenomenon, 68f
R wave, 17, 17f, 23, 86dominant (V1), 113f, 114
in healthy people, 113f, 114tall, in right ventricular hypertrophy, 112
left ventricular hypertrophy, 114
old anterior myocardial infarction with, in anterior leads, 130f
second (R1), 50
Re-entry circuit, 80, Atrioventricular nodal re-entry tachycardia(AVNRT)
Record/recordings, ECG recorder
Repolarization, 4abnormal, 63, 99
Reporting, of ECG, 39–43description in, sequence of, 40
Rhythm, cardiac, 8, 8t, 21, 61–84, 101–107, 185–188abnormal, 6f, 62–64, 83b
identification, 84, 84t, Arrhythmia
escape, Escape rhythm/mechanism
fast, Tachycardiaof heart, 16intrinsic, 62
irregular, 5f, 9t–10tjunctional, 63normal, 101–107
points of initiation, 62–63, 63fsick sinus syndrome, 152b, 152fsinus, Sinus rhythm
slow, Bradycardiasupraventricular, Supraventricular rhythms
Rhythm strip, 21, 28, 29f
Right atrial hypertrophy, 86–87, 86f, 142btall P waves, 107–108
Right axis deviation, 25, 25f, 111f, 187bin healthy subjects, 110in right ventricular hypertrophy, 88
Right bundle branch block (RBBB), 50, 149, 186bcauses, 113b
clinical scenario, 165f, 173, 173feffect on cardiac axis, 57f, 58fin healthy people, 112
mechanism, 50partial, 50, 112, 112fsinus rhythm with, 52f
stages, 51f
Right ventricular hypertrophy, 112, 142binverted T waves, 99, 144QRS complex, 87, 87f
tall R wave, 112
Right ventricular lead, 86
R-R interval, chest pain scenario, 164f, 172
RSR pattern, 50
S
S wave, 17, 17f, 23, 53in right ventricular hypertrophy, 87, 87f, 88ftransition point, 87
‘S1Q3T3’ pattern, 140, 141f
Second degree heart block, 46–47, 186b2 : 1 type, 47, 48f, 149
3 : 1 type, 47, 1494 : 1 type, 47atrial tachycardia associated with, 70
causes of, 154b
clinical scenario, 165f, 174, 174fMobitz type 1 phenomenon, 46–47, 47f, 109–110
Mobitz type 2 phenomenon, 47, 47f, 149Wenckebach (Mobitz type 1) phenomenon, 46–47, 47f, 109–110, 133f, 149
Septal Q wave, 89, 122b
Septum, depolarized, 43b
Shivering, effect of, 40f
Shockable rhythms, cardiac arrest, 160
Sick sinus syndrome, 152b, 152fambulatory record, 157f
Sinoatrial disease, 149, 152f
Sinoatrial (SA) node, 1–4, 4f, 16, 16f, 45, 61–62depolarization initiation in, 61, 64discharge rate, 62failure to depolarize, 64
Sinus arrhythmia, 9f, 9t–10t, 62–63, 62f, 104fclinical scenario, 164f, 172, 172f
Sinus bradycardia, 5f, 62, 101athletes, 103fcauses, 103b
Sinus rhythm, 1, 4f, 8f, 8t, 61, 101with left axis deviation, 57f
with left bundle branch block, 54f, 75–77, 77fwith right bundle branch block, 52f
Sinus tachycardia, 5f, 62, 101causes, 103b
palpitations, 143–144
Sokolow-Lyon criteria, 114
Speeds, ECG recording, 17–19, 18f, 18t, 36f, 38f
ST segment, 4, 4f, 16, 17f, 95f, 186abnormalities, 95, 99–100
depressed, 7f, 95, 95f, 100, 187b–188bduring exercise, 95, 95fhorizontal, in ischaemia, 117ischaemia, 95
in unstable angina, 124, 125f
downward-sloping, 95, 99fnonspecific, 117, 118f
elevated, 7f, 95, 95f, 100in acute anterior ST segment elevation acute coronary syndrome, 126fin acute anterior ST segment elevation myocardial infarction, 127f, 128fin healthy people, 117, 117f, 118f
high take-off, 117, 117fnonspecific changes, 99–100, 117, 118fnormal, 95, 95f
ST segment elevation myocardial infarction (STEMI), 96, 124–132, 136bacute anterior, 126f, 127f, 128f
acute inferior, 132fclinical scenario, 166f, 171f, 176, 176f, 183, 183fcomplete heart block in, 155
ST elevation, high take-off vs, 117
Sternal angle, 31
‘Strain’ pattern, 114
Subendocardial infarction, 96, Non-ST segment elevation myocardialinfarction (NSTEMI)
Sudden death, 123, 144
Supraventricular extrasystoles, 9f, 69, 69f, 104
Supraventricular rhythms, 162bdepolarization, 63, 63f
division, 63f
Supraventricular tachycardia, 70–74clinical scenario, 165f, 175, 175f
paroxysmal, 155ventricular tachycardia vs., with bundle branch block, 75–77
Sustained tachycardia, in Wolff-Parkinson-White syndrome, 80, 82f
Symptomless patient, Asymptomatic patient
Syncope, 143bradycardia, 149
cardiac disease, 144, 145fnormal ECGs, 143–144paroxysmal tachycardia, 144–149
T
T wave, 4, 4f, 16, 17f, 186abnormalities, 63, 85–100
causes, 100belectrolyte abnormalities causing, 99
biphasic, 96
flattening, 99–100in healthy people, 115, 116f, 119, 119f, 120f‘hyperacute’ changes, 119
inversion, 7f, 96, 97f, 98f, 187b–188bbundle branch block, 99causes, 96, 100bdigoxin causing, 99, 99f
ethnic factors affecting, 119, 119fin healthy people, 115, 116fin left bundle branch block, 55in left ventricular hypertrophy, 89, 99
in myocardial infarction, 96, 97f, 98fin pulmonary embolism, 87, 89f
in STEMI, 126in ventricular hypertrophy, 88–89, 88f, 90f, 99
P wave as distortion of, 47, 48fpeaked, 100tall peaked, 119, 120f
Tachycardia, 62, 64, 70–77atrial, Atrial tachycardiaatrioventricular nodal re-entry, Atrioventricular nodal re-entry tachycardia
(AVNRT)broad complex, 8f, 8t, 162b
carotid sinus massage, 72–74, 75f, 82clinical scenario, 165f, 175, 175fjunctional (nodal), 72, 73f, 74f, 80–82
left axis deviation during, 77narrow complex, 8f, 8t, 70origins of, 80–82paroxysmal, 70, 144–149
sinus, Sinus tachycardiasupraventricular, Supraventricular tachycardiaventricular, Ventricular tachycardia
Third degree (complete) heart block, 8f, 8t, 48, 49f, 186bcauses of, 149clinical scenario, 170f, 182, 182fventricular escape and, 64, 66f
Thyrotoxicosis, 178
Times and speeds, in ECG recording, 17–19, 18f, 18t, 36f, 38f
Torsade de pointes, 149, 151f
Transition point, 26–28R and S waves equal, shift, pulmonary embolism, 87
Troponin, 123–124, 124b
U
U wave, 17, 17f, 99, 121, 121f, 186atrial fibrillation, 178, 178f
Under-calibration, 32–34, 35f
Unstable angina, 124ST segment depression in, 125f
V
V1-V6 leads, 20, 43bECG patterns recorded by, 22fheart and, 21, 22f
position of, 31, 31fQRS complex in, 26, 27f, 28f
Valsalva manoeuvre, 180
Ventricular contraction, 61, QRS complex
Ventricular escape, 64–67, 66f
Ventricular extrasystoles, 9f, 68, 68f, 69f, 104, 106feffects on P waves, 69
Ventricular fibrillation, 9t–10t, 10f, 78–80, 80f, 151fpulseless, shockable cardiac arrest, 160
ventricular extrasystole inducing, 68
Ventricular hypertrophy, Left ventricular hypertrophy, Rightventricular hypertrophy
Ventricular pacing, 158f
Ventricular rhythms, 161bdepolarization, 63, 64fdivision, 63f
Ventricular tachycardia, 74–75, 75f, 76f, 151f, 156fheart rate, diagnosis, 64–67
paroxysmal, 149pulseless, shockable cardiac arrest, 160supraventricular tachycardia vs., with bundle branch block, 75–77
torsade de pointes, 149, 151f
Voltage changes, effect, 89
Voltage criteria, left ventricular hypertrophy, 89
‘VVI’ pacing, 157
W
Wenckebach phenomenon, 46–47, 47f, 109–110, 133f, 149
Wiring diagram, of heart, 16, 16f, 46f
Wolff-Parkinson-White (WPW) syndrome, 80, 81fsustained tachycardia, 80, 82ftype A, 144, 146f
type B, 144, 147f
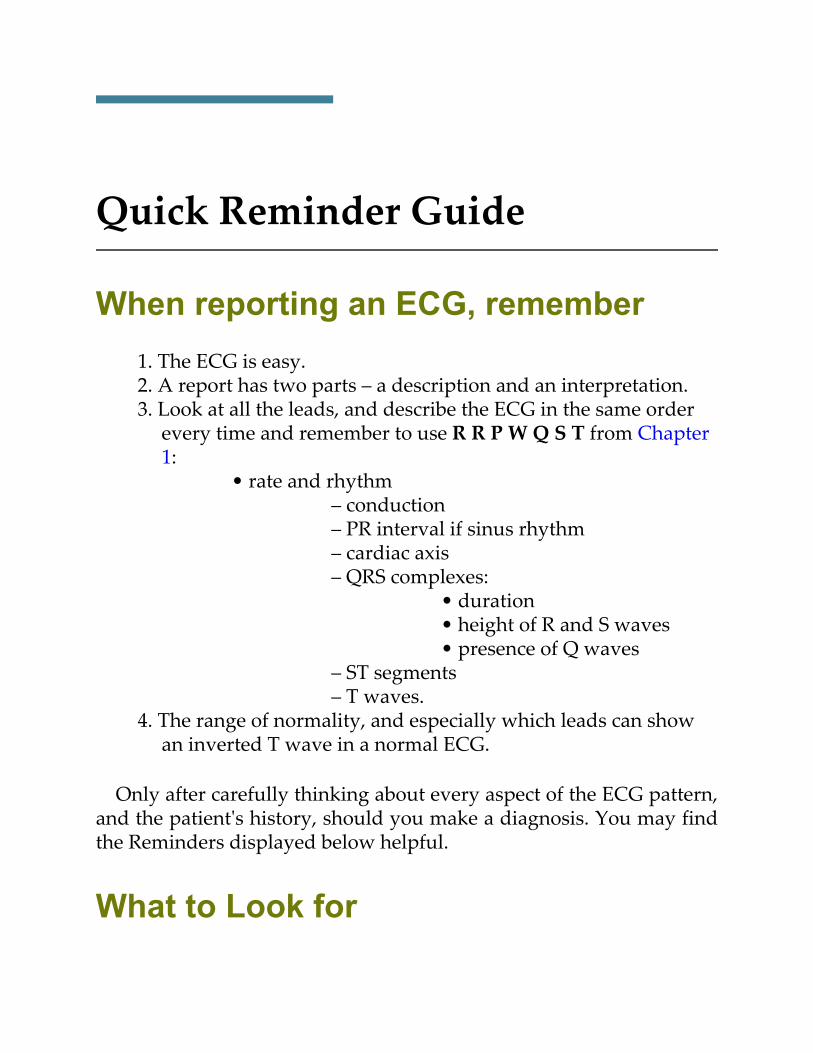
Quick Reminder Guide
When reporting an ECG, remember1. The ECG is easy.2. A report has two parts – a description and an interpretation.3. Look at all the leads, and describe the ECG in the same order
every time and remember to use R R P W Q S T from Chapter1:
• rate and rhythm– conduction– PR interval if sinus rhythm– cardiac axis– QRS complexes:
• duration• height of R and S waves• presence of Q waves
– ST segments– T waves.
4. The range of normality, and especially which leads can showan inverted T wave in a normal ECG.
Only after carefully thinking about every aspect of the ECG pattern,and the patient's history, should you make a diagnosis. You may findthe Reminders displayed below helpful.
What to Look for
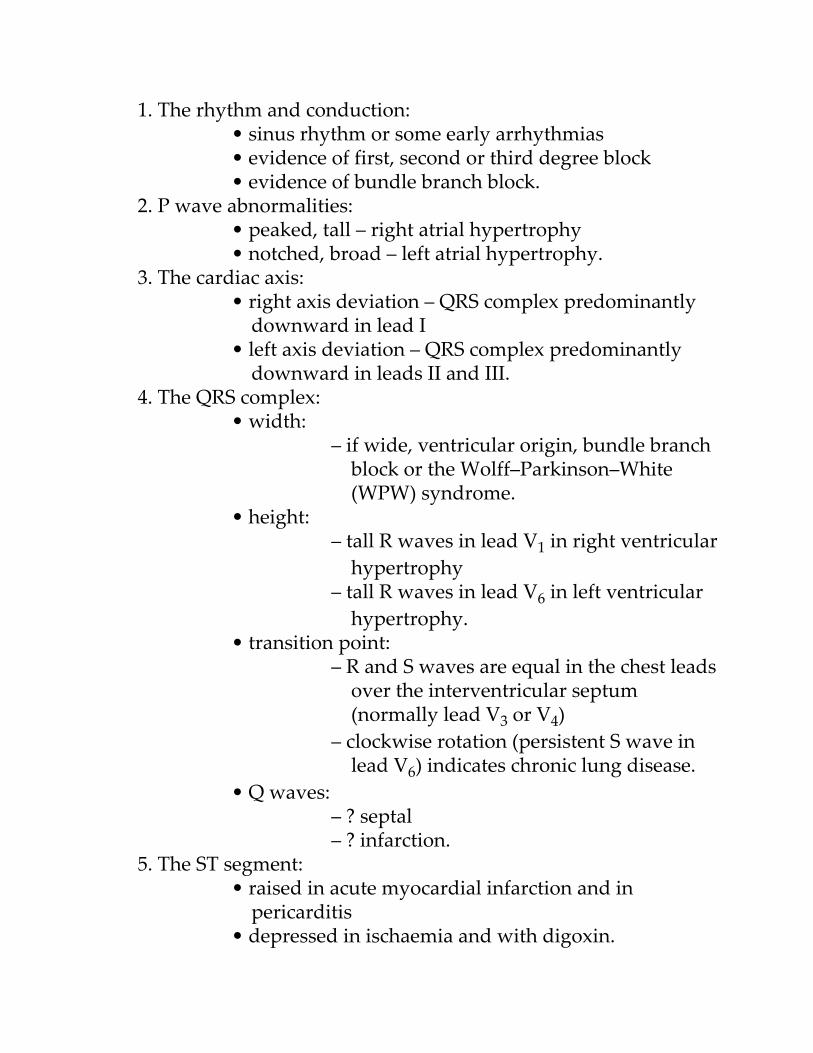
1. The rhythm and conduction:• sinus rhythm or some early arrhythmias• evidence of first, second or third degree block• evidence of bundle branch block.
2. P wave abnormalities:• peaked, tall – right atrial hypertrophy• notched, broad – left atrial hypertrophy.
3. The cardiac axis:• right axis deviation – QRS complex predominantly
downward in lead I• left axis deviation – QRS complex predominantly
downward in leads II and III.4. The QRS complex:
• width:– if wide, ventricular origin, bundle branch
block or the Wolff–Parkinson–White(WPW) syndrome.
• height:– tall R waves in lead V1 in right ventricular
hypertrophy– tall R waves in lead V6 in left ventricular
hypertrophy.• transition point:
– R and S waves are equal in the chest leadsover the interventricular septum(normally lead V3 or V4)
– clockwise rotation (persistent S wave inlead V6) indicates chronic lung disease.
• Q waves:– ? septal– ? infarction.
5. The ST segment:• raised in acute myocardial infarction and in
pericarditis• depressed in ischaemia and with digoxin.
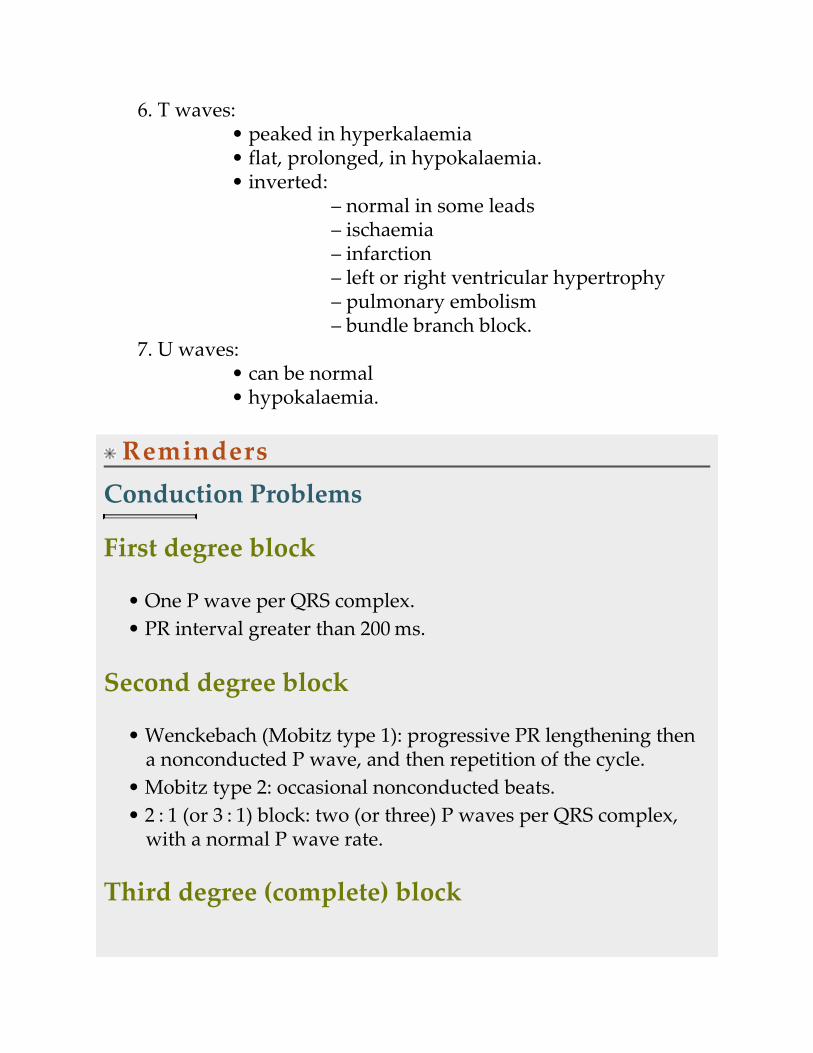
6. T waves:• peaked in hyperkalaemia• flat, prolonged, in hypokalaemia.• inverted:
– normal in some leads– ischaemia– infarction– left or right ventricular hypertrophy– pulmonary embolism– bundle branch block.
7. U waves:• can be normal• hypokalaemia.
RemindersConduction Problems
First degree block
• One P wave per QRS complex.• PR interval greater than 200 ms.
Second degree block
• Wenckebach (Mobitz type 1): progressive PR lengthening thena nonconducted P wave, and then repetition of the cycle.
• Mobitz type 2: occasional nonconducted beats.• 2 : 1 (or 3 : 1) block: two (or three) P waves per QRS complex,
with a normal P wave rate.
Third degree (complete) block
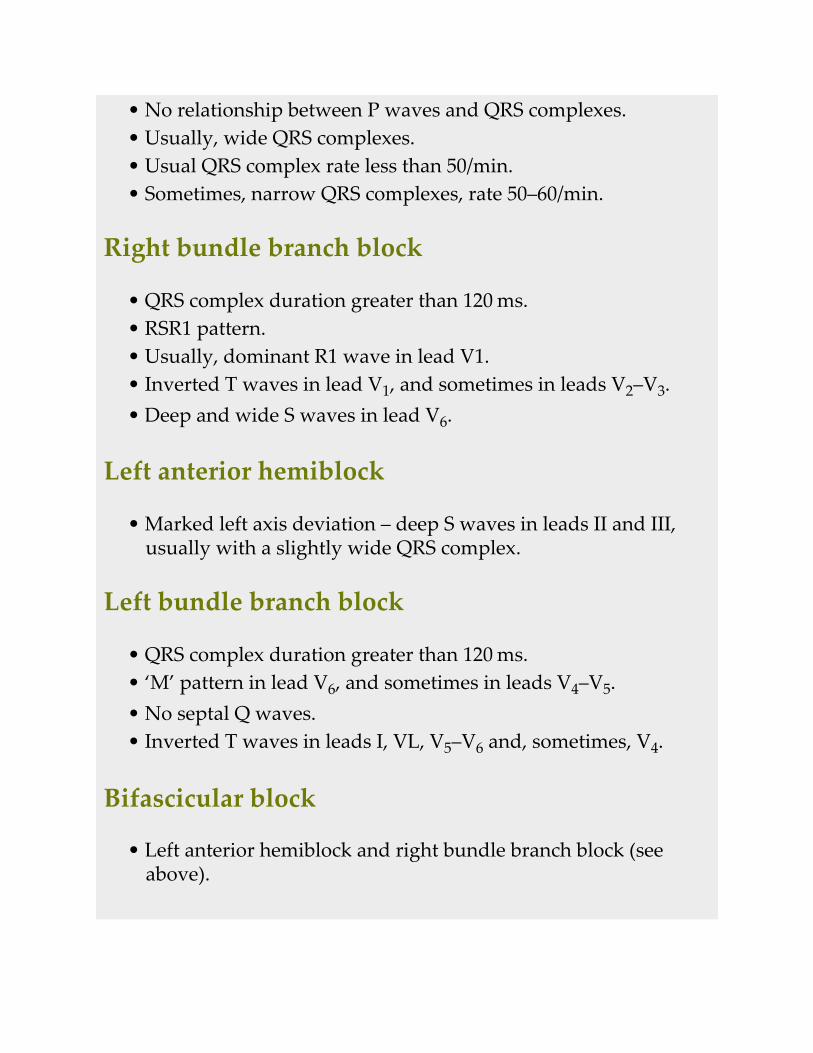
• No relationship between P waves and QRS complexes.• Usually, wide QRS complexes.• Usual QRS complex rate less than 50/min.• Sometimes, narrow QRS complexes, rate 50–60/min.
Right bundle branch block
• QRS complex duration greater than 120 ms.• RSR1 pattern.• Usually, dominant R1 wave in lead V1.• Inverted T waves in lead V1, and sometimes in leads V2–V3.• Deep and wide S waves in lead V6.
Left anterior hemiblock
• Marked left axis deviation – deep S waves in leads II and III,usually with a slightly wide QRS complex.
Left bundle branch block
• QRS complex duration greater than 120 ms.• ‘M’ pattern in lead V6, and sometimes in leads V4–V5.• No septal Q waves.• Inverted T waves in leads I, VL, V5–V6 and, sometimes, V4.
Bifascicular block
• Left anterior hemiblock and right bundle branch block (seeabove).
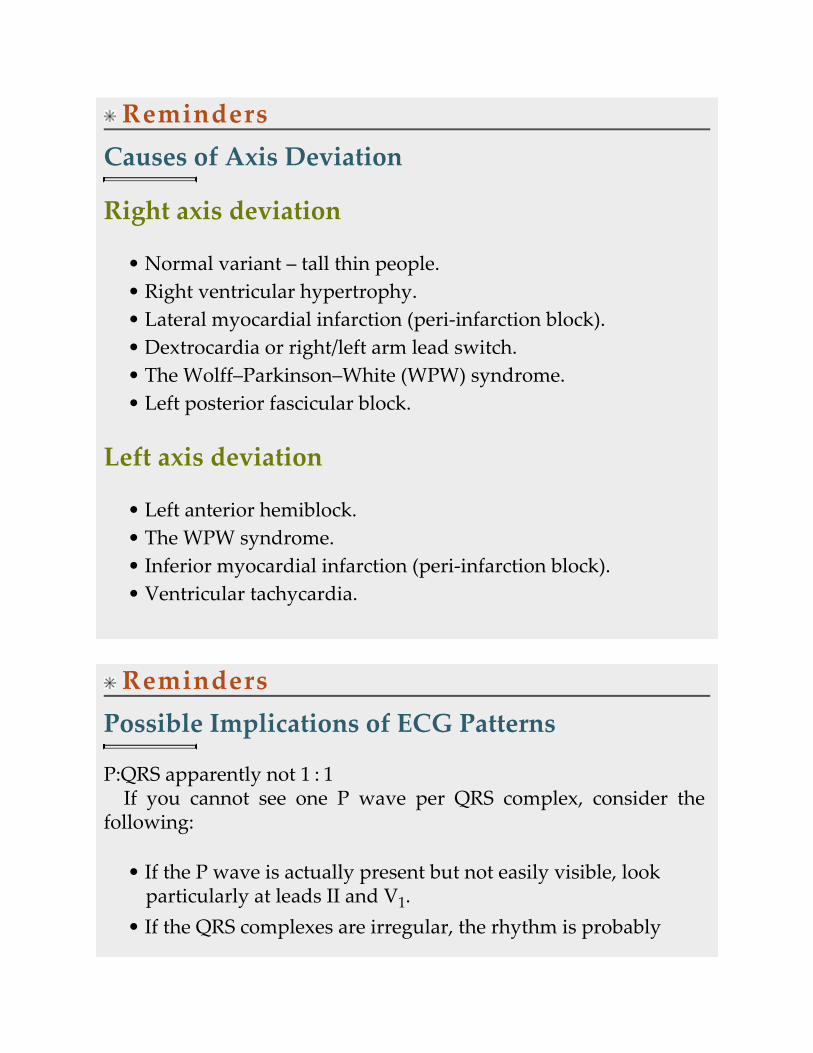
RemindersCauses of Axis Deviation
Right axis deviation
• Normal variant – tall thin people.• Right ventricular hypertrophy.• Lateral myocardial infarction (peri-infarction block).• Dextrocardia or right/left arm lead switch.• The Wolff–Parkinson–White (WPW) syndrome.• Left posterior fascicular block.
Left axis deviation
• Left anterior hemiblock.• The WPW syndrome.• Inferior myocardial infarction (peri-infarction block).• Ventricular tachycardia.
RemindersPossible Implications of ECG Patterns
P:QRS apparently not 1 : 1If you cannot see one P wave per QRS complex, consider the
following:
• If the P wave is actually present but not easily visible, lookparticularly at leads II and V1.
• If the QRS complexes are irregular, the rhythm is probably
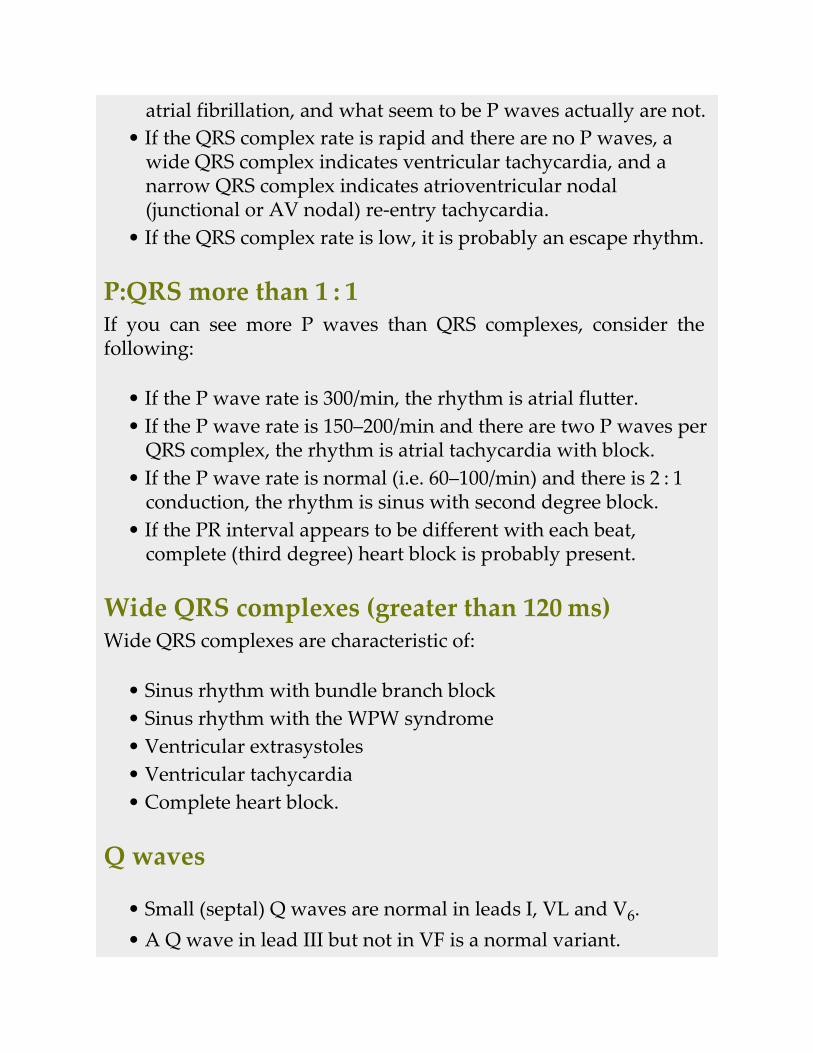
atrial fibrillation, and what seem to be P waves actually are not.• If the QRS complex rate is rapid and there are no P waves, a
wide QRS complex indicates ventricular tachycardia, and anarrow QRS complex indicates atrioventricular nodal(junctional or AV nodal) re-entry tachycardia.
• If the QRS complex rate is low, it is probably an escape rhythm.
P:QRS more than 1 : 1If you can see more P waves than QRS complexes, consider thefollowing:
• If the P wave rate is 300/min, the rhythm is atrial flutter.• If the P wave rate is 150–200/min and there are two P waves per
QRS complex, the rhythm is atrial tachycardia with block.• If the P wave rate is normal (i.e. 60–100/min) and there is 2 : 1
conduction, the rhythm is sinus with second degree block.• If the PR interval appears to be different with each beat,
complete (third degree) heart block is probably present.
Wide QRS complexes (greater than 120 ms)Wide QRS complexes are characteristic of:
• Sinus rhythm with bundle branch block• Sinus rhythm with the WPW syndrome• Ventricular extrasystoles• Ventricular tachycardia• Complete heart block.
Q waves
• Small (septal) Q waves are normal in leads I, VL and V6.• A Q wave in lead III but not in VF is a normal variant.
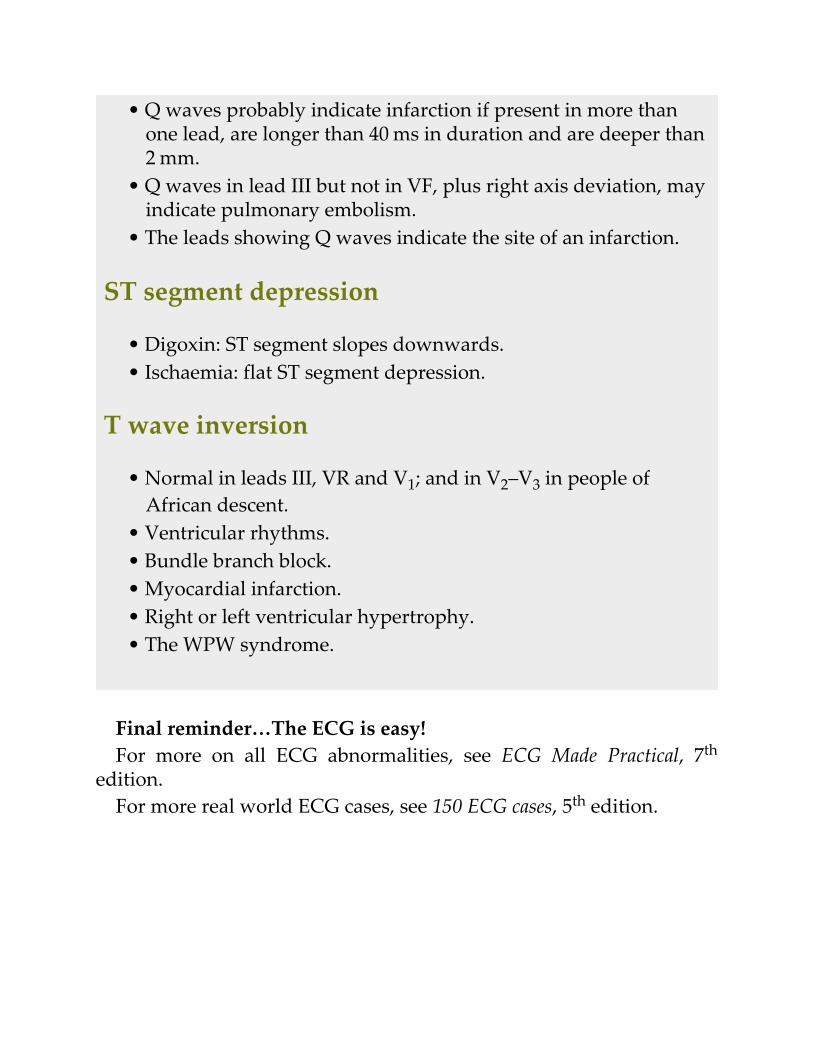
• Q waves probably indicate infarction if present in more thanone lead, are longer than 40 ms in duration and are deeper than2 mm.
• Q waves in lead III but not in VF, plus right axis deviation, mayindicate pulmonary embolism.
• The leads showing Q waves indicate the site of an infarction.
ST segment depression
• Digoxin: ST segment slopes downwards.• Ischaemia: flat ST segment depression.
T wave inversion
• Normal in leads III, VR and V1; and in V2–V3 in people ofAfrican descent.
• Ventricular rhythms.• Bundle branch block.• Myocardial infarction.• Right or left ventricular hypertrophy.• The WPW syndrome.
Final reminder…The ECG is easy!For more on all ECG abnormalities, see ECG Made Practical, 7th
edition.For more real world ECG cases, see 150 ECG cases, 5th edition.
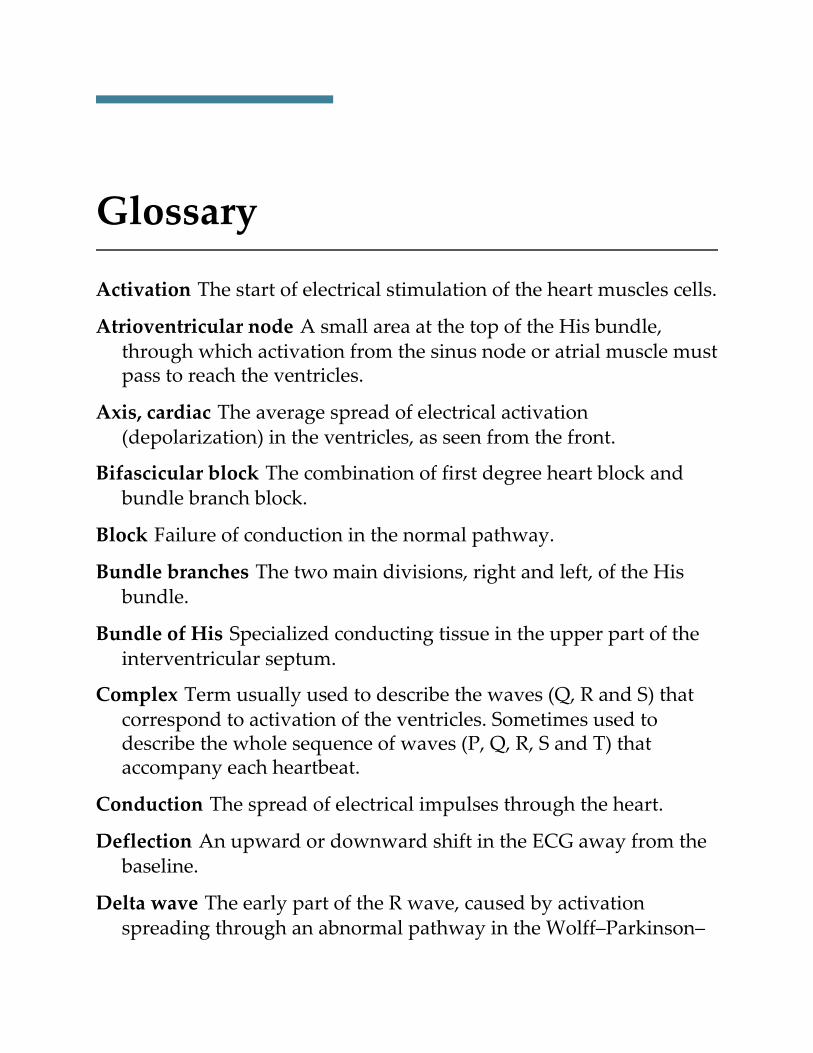
Glossary
Activation The start of electrical stimulation of the heart muscles cells.
Atrioventricular node A small area at the top of the His bundle,through which activation from the sinus node or atrial muscle mustpass to reach the ventricles.
Axis, cardiac The average spread of electrical activation(depolarization) in the ventricles, as seen from the front.
Bifascicular block The combination of first degree heart block andbundle branch block.
Block Failure of conduction in the normal pathway.
Bundle branches The two main divisions, right and left, of the Hisbundle.
Bundle of His Specialized conducting tissue in the upper part of theinterventricular septum.
Complex Term usually used to describe the waves (Q, R and S) thatcorrespond to activation of the ventricles. Sometimes used todescribe the whole sequence of waves (P, Q, R, S and T) thataccompany each heartbeat.
Conduction The spread of electrical impulses through the heart.
Deflection An upward or downward shift in the ECG away from thebaseline.
Delta wave The early part of the R wave, caused by activationspreading through an abnormal pathway in the Wolff–Parkinson–
White syndrome.
Depolarization Refers to the individual cellular activity but for thepurposes of this book, means the same as activation (see above).
ECG (or EKG) Electrocardiogram (EKG in some European centres).Electrocardiograph sometimes used to describe a printed ECG.
Ectopic beat A heartbeat in which activation has begun somewhereother than the sinus (sinoatrial) node. A term essentiallyinterchangeable with extrasystole or premature contraction.
Escape rhythm A rhythm that emerges when the normal pacemaker(sinoatrial node) fails – thus, for example, a site in the ventricle willtake over when the normal activation that starts in the sinus nodeis completely blocked by disease of the His Bundle. This would betermed complete heart block.
Extrasystole Used interchangeably with ectopic beat; can arise in theventricles or in the supraventricular area.
Fascicle The two main divisions of the left bundle branch, anteriorand posterior.
Heart block First degree: prolongation of the PR interval. Seconddegree: some P waves are conducted and others are not. Thirddegree (complete): no conduction through the His Bundle.
Lead The electrical ‘picture’ of the heart produced by comparison ofthe recording from two or more electrode positions.
Mobitz block A type of second degree heart block.
PR interval The time from the beginning of the P wave to thebeginning of the QRS complex.
Premature beat A term used (often in the USA) interchangeably withextrasystole or ectopic.
Purkinje fibres Terminal branches of the His bundle, i.e. specializedconduction tissue within the ventricular muscle.
QT interval The time from the end of the Q wave to the end of the Twave.
QTc interval The QT interval corrected for heart rate.
Repolarization The return of activated heart muscle to its electricalresting state.
Rhythm This could be clinical (whether the pulse is regular orirregular) or could be the ECG rhythm which describes the patternof ECG complexes and the part of the heart where activation began,e.g. sinus rhythm, atrial rhythms, ventricular rhythms.
Sinus node The normal cardiac pacemaker – a tiny area in the upperpart of the right atrium which normally has the highestspontaneous rate of depolarization, and therefore controls the heartrhythm.
ST segment The interval between the end of the QRS complex and theend of the T wave.
Supraventricular rhythm A rhythm originating anywhere ‘above’ theventricles in the normal activation sequence. Thus, for examplesinus rhythm, atrioventricular (or junctional) rhythm.
Trifascicular block The combination of first degree block, left axisdeviation and right bundle branch block.
Ventricular rhythm A rhythm originating in the ventricular muscle.
Wave (P, Q, R, S, T, U) A deflection of the ECG.
Wenckebach blocks A type of second degree heart block.

Instructions for online access
Thank you for your purchase. Please note that your purchase of thisElsevier eBook also includes access to an online version. Please clickhere (or go to http://ebooks.elsevier.com) to request an activation codeand registration instructions in order to gain access to the webversion.