support for the epa national contract for lead analysis - US ...
351
SUPPORT FOR THE EPA NATIONAL CONTRACT FOR LEAD ANALYSIS Contract No. EP-BPA-15-D-0004 2015 Quality Assurance Project Plan Category 1 Eastern Research Group, Inc. 601 Keystone Park Drive, Suite 700 Morrisville, NC 27560
-
Upload
khangminh22 -
Category
Documents
-
view
0 -
download
0
Transcript of support for the epa national contract for lead analysis - US ...
SUPPORT FOR THE EPA NATIONAL
CONTRACT FOR LEAD ANALYSIS
Contract No. EP-BPA-15-D-0004
2015
Quality Assurance Project Plan
Category 1
Eastern Research Group, Inc.
601 Keystone Park Drive, Suite 700
Morrisville, NC 27560

Project No. EP-BPA-15-D-0004
Element No. A2
Revision No. 0
Date October 2015
Page iii of xvi
TABLE OF CONTENTS
Section
PROJECT MANAGEMENT
1 Project/Task Organization ....................................................................................... 1 of 4
1.1 Assignment of Program Personnel .............................................................. 1 of 4
1.1.1 Program Manager ............................................................................ 1 of 4
1.1.2 Program QA Coordinator ................................................................ 2 of 4
1.1.3 Task Leaders ................................................................................... 2 of 4
2 Problem Definition/Background ............................................................................. 1 of 1
3 Project/Task Description ......................................................................................... 1 of 1
3.1 NAAQS for Lead Analysis ......................................................................... 1 of 1
4 Data Quality Objectives and Criteria for Measurement Data ................................. 1 of 2
5 Special Training Requirements/Certification .......................................................... 1 of 2
5.1 ERG Analytical Laboratory Personnel ........................................................ 1 of 2
5.2 DRI Analytical Laboratory Personnel ......................................................... 1 of 2
6 Documentation and Records ................................................................................... 1 of 5
6.1 Data Management ....................................................................................... 1 of 5
6.2 Data Reports ................................................................................................ 1 of 5
6.3 Records and Supporting Data ...................................................................... 2 of 5
6.3.1 Notebooks ........................................................................................ 3 of 5
6.3.2 Electronic Data Collection .............................................................. 3 of 5
6.4 Data Reporting Package Archiving and Retrieval ...................................... 4 of 5
6.5 Quality System Document Control ............................................................. 5 of 5
MEASUREMENT DATA ACQUISITION
7 Sampling Process Design ........................................................................................ 1 of 1
8 Sampling Method Requirements ............................................................................. 1 of 1
9 Sample Handling and Custody Requirements ......................................................... 1 of 4
9.1 Analysis Chain of Custody Forms .............................................................. 1 of 4
9.2 Invalid Samples ........................................................................................... 3 of 4
9.3 Analytical Data ............................................................................................ 3 of 4
9.4 Sample Monitoring Data ............................................................................. 4 of 4
10 Analytical Methods Requirements .......................................................................... 1 of 3
10.1 Lead Analysis Using an ICP-MS Analytical System .................................. 1 of 3
10.2 Lead Analysis Using an X-Ray Fluorescence Analytical System .............. 2 of 3

Project No. EP-BPA-15-D-0004
Element No. A2
Revision No. 0
Date October 2015
Page iv of xvi
TABLE OF CONTENTS (Continued)
Section
11 Quality Control Requirements ................................................................................ 1 of 8
11.1 Standard Traceability .................................................................................. 1 of 8
11.2 Accuracy and Acceptance ........................................................................... 1 of 8
11.2.1 Lead Analysis by ICP-MS ............................................................... 2 of 8
11.2.2 Lead Analysis by XRF .................................................................... 6 of 8
11.4 Precision ...................................................................................................... 7 of 8
11.5 Sensitivity (Method Detection Limits) ........................................................ 8 of 8
12 Instrument/Equipment Testing, Inspection, and Maintenance Requirements ......... 1 of 3
12.1 ICP-MS ........................................................................................................ 1 of 3
12.2 XRF ............................................................................................................. 3 of 3
13 Instrument Calibration and Frequency .................................................................... 1 of 3
13.1 ICP-MS Calibration ..................................................................................... 2 of 3
13.2 XRF Calibration .......................................................................................... 2 of 3
14 Inspection/Acceptance for Supplies and Consumables ........................................... 1 of 3
14.1 Purpose ........................................................................................................ 1 of 3
14.2 Critical Supplies and Consumables ............................................................. 1 of 3
14.3 Acceptance Criteria ..................................................................................... 1 of 3
14.4 Tracking and Quality Verification of Supplies and Consumables .............. 3 of 3
15 Data Management ................................................................................................... 1 of 6
15.1 Data Recording ............................................................................................ 1 of 6
15.2 Data Validation ........................................................................................... 2 of 6
15.3 Data Reduction and Transformation ........................................................... 3 of 6
15.4 Data Transmittal .......................................................................................... 4 of 6
15.5 Data Tracking .............................................................................................. 4 of 6
15.6 Data Storage and Retrieval .......................................................................... 5 of 6
ASSESSMENT/OVERSIGHT
16 Assessments and Response Actions ........................................................................ 1 of 8
16.1 Assessment Activities and Project Planning ............................................... 4 of 8
16.1.1 External Technical Systems and Data Quality Audits .................... 4 of 8
16.1.2 Internal Technical Systems Audits .................................................. 6 of 8
16.1.3 Proficiency Testing ......................................................................... 7 of 8
16.2 Documentation of Assessments .................................................................. 7 of 8
16.2.1 TSA, Data Quality Audit, and PT Documentation .......................... 7 of 8
16.2.2 Internal Data Review Documentation at ERG ................................ 8 of 8
16.2.3 Internal Data Review Documentation at DRI ................................. 8 of 8
Project No. EP-BPA-15-D-0004
Element No. A2
Revision No. 0
Date October 2015
Page v of xvi
TABLE OF CONTENTS (Continued)
Section
17 Reports to Management .......................................................................................... 1 of 2
17.1 Data Reports ................................................................................................ 1 of 2
17.2 Internal Technical System Audit Reports ................................................... 1 of 2
DATA VALIDATION AND USABILITY
18 Data Review and Verification ................................................................................. 1 of 9
18.1 Data Review Design .................................................................................... 1 of 9
18.2 Data Verification ......................................................................................... 2 of 9
18.3 Data Review ................................................................................................ 2 of 9
18.4 Data Reduction, Validation, and Reporting ................................................ 3 of 9
18.5 Air Quality System ...................................................................................... 4 of 9
18.5.1 AQS Flagging and Reporting .......................................................... 5 of 9
19 Data Validation, Verification and Analysis ............................................................ 1 of 2
19.1 Process for Validating and Verifying Data ................................................. 1 of 2
19.1.1 Verification of Data ......................................................................... 1 of 2
19.1.2 Validation ........................................................................................ 1 of 2
19.2 Data Analysis .............................................................................................. 2 of 2
19.2.1 Analytical Tests ............................................................................... 2 of 2
20 Reconciliation with Data Quality Objectives .......................................................... 1 of 1
20.1 Conduct Preliminary Data Review .............................................................. 1 of 1
20.2 Draw Conclusions from the Data ................................................................ 1 of 1
21 References ............................................................................................................... 1 of 1
APPENDICES
A ERG Standard Operating Procedures
ERG-MOR-017 Standard Operating Procedure for Developing, Documenting,
and Evaluating the Accuracy of Spreadsheet Data
ERG-MOR-022 Standard Operating Procedure for Preparation of Standards in
the ERG Laboratory
ERG-MOR-033 Standard Operating Procedure for Hazardous Waste
ERG-MOR-045 Standard Operating Procedure for Sample Receipt at ERG
Chemistry Laboratory
ERG-MOR-057 Standard Operating Procedures for Project Peer Review
ERG-MOR-079 Standard Operating Procedure for Sample Login to the
Laboratory Information Management System
Project No. EP-BPA-15-D-0004
Element No. A2
Revision No. 0
Date October 2015
Page vi of xvi
ERG-MOR-084 Standard Operating Procedure for the Preparation and Analysis
of High Volume Quartz Filters for Metals by ICP-MS using
Method IO 3.5 and FEM Method EQL-0512-201
ERG-MOR-085 Standard Operating Procedure for the Preparation and Analysis
of 47mm Filters for Metals by ICP-MS using Method IO 3.5
and FEM Method EQL-0512-202
ERG-MOR-098 Standard Operating Procedure for the Preparation of Monitoring
Data for AQS Upload
ERG-MOR-099 Standard Operating Procedures for the Laboratory Information
Management System
B DRI Standard Operating Procedures
DRI SOP #2-209.8 DRI Standard Operating Procedure for X-Ray Fluorescence
(XRF) Analysis of Aerosol Filter Samples (PANalytical Epsilon
5)
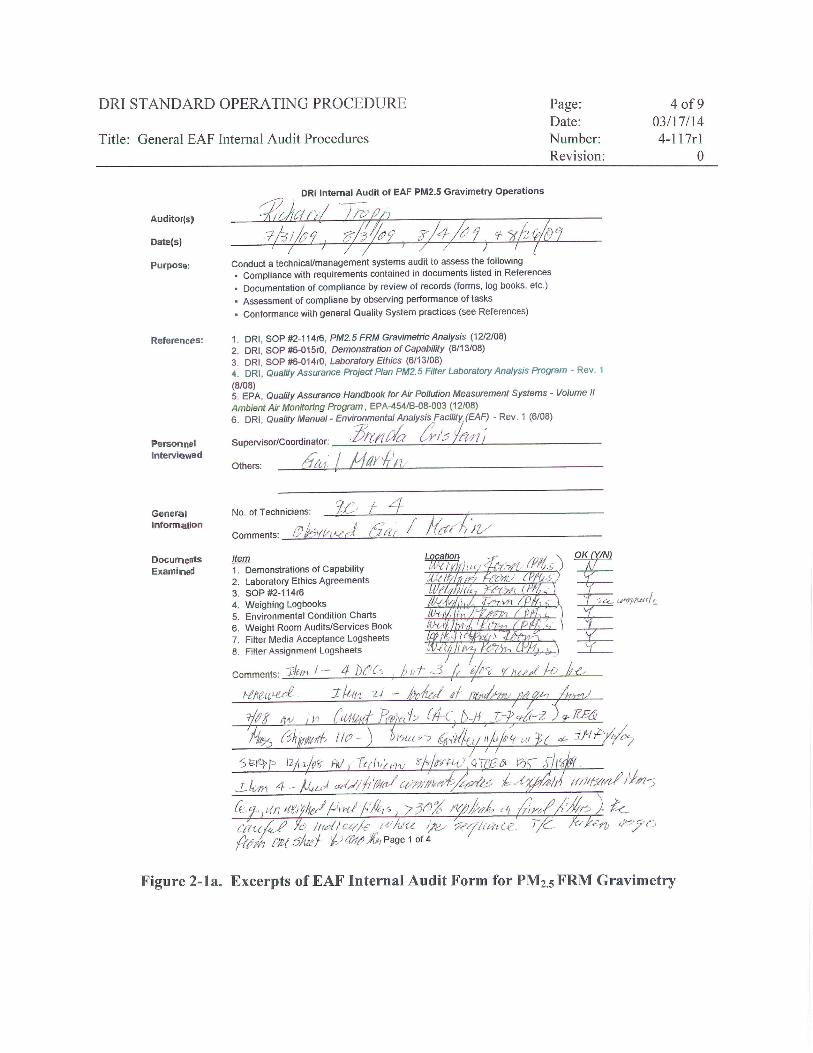
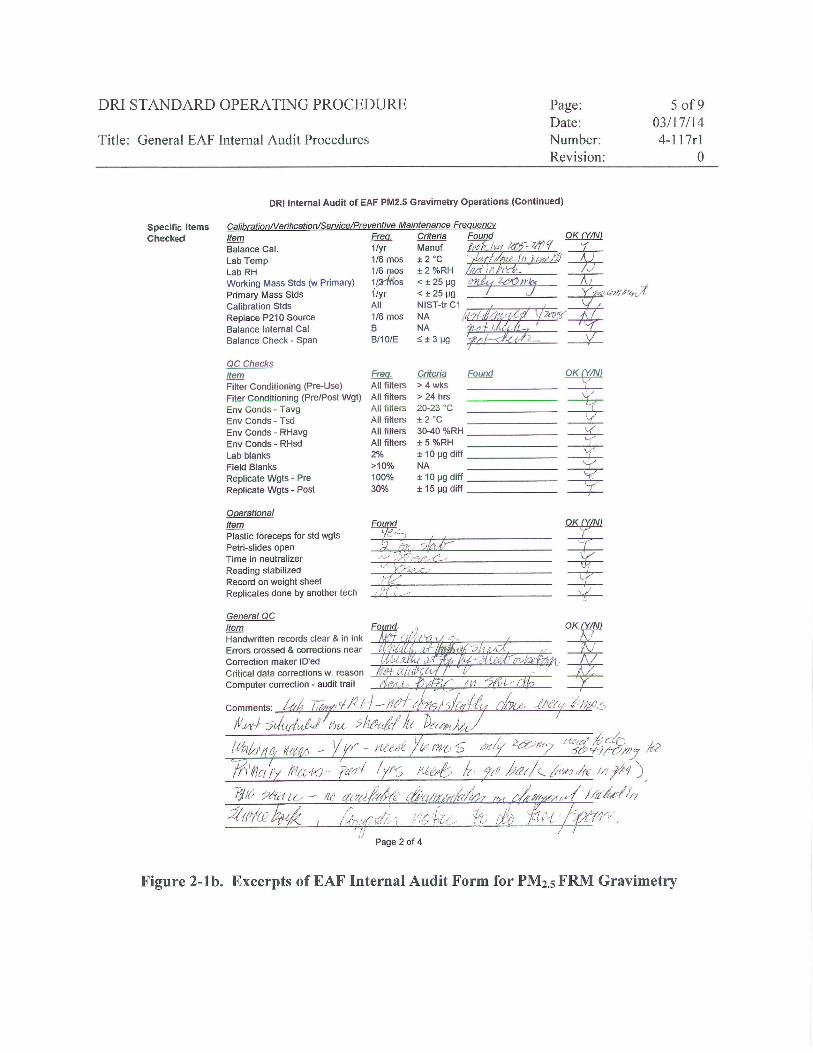
DRI SOP #4-1117r1 DRI Standard Operating Procedure for General EAF Internal
Audit Procedures
DRI SOP #6-0015r1 DRI Standard Operating Procedure for Demonstration of
Capability
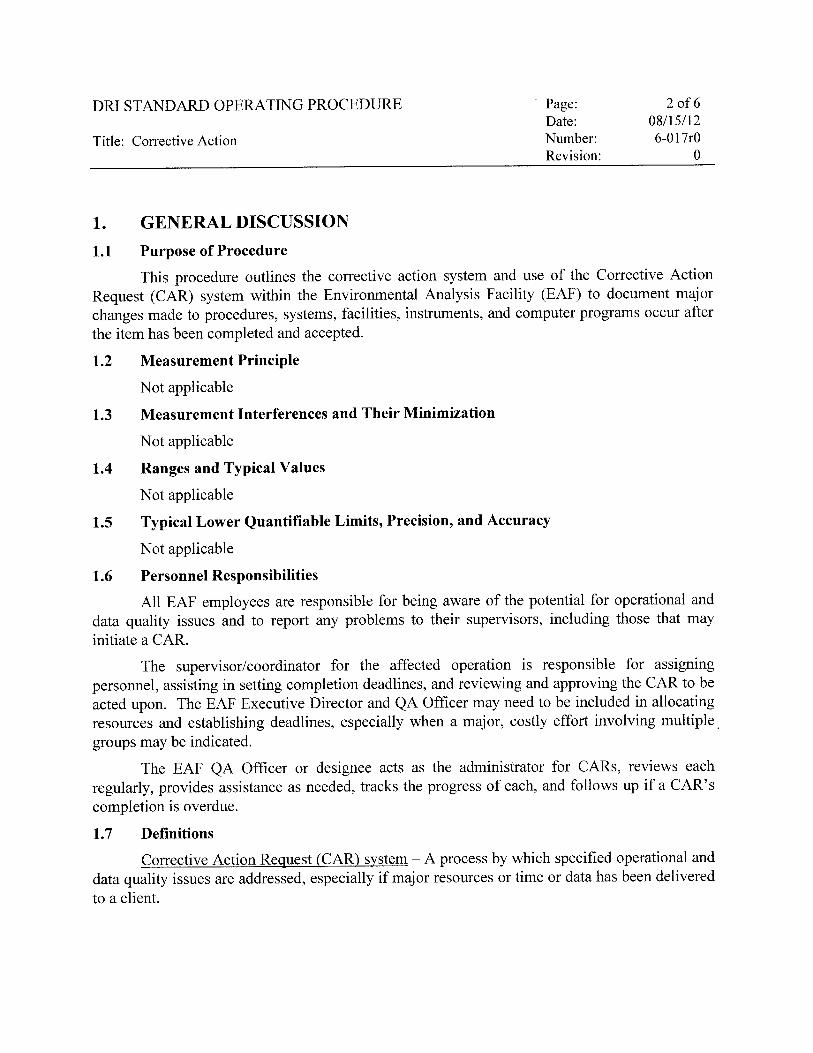
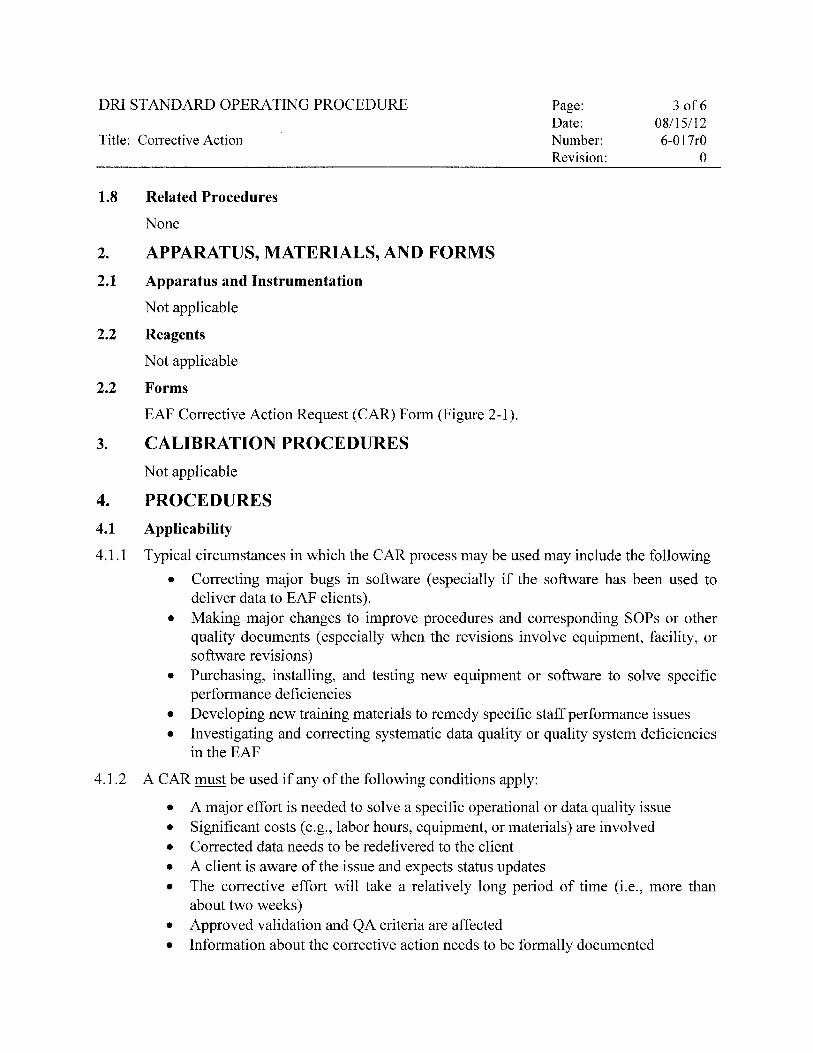
DRI SOP #6-017r0 DRI Standard Operating Procedure for Corrective Action

Project No. EP-BPA-15-D-0004
Element No. A2
Revision No. 0
Date October 2015
Page vii of xvi
LIST OF TABLES
Table
1-1 Program Organization ......................................................................................................... 3 of 4
3-1 List of Analytical Services .................................................................................................. 1 of 1
4-1 Measurement Quality Objectives for the Lead Analysis Program ...................................... 2 of 2
6-1 Data Documentation and Records ....................................................................................... 2 of 5
11-1 ICP-MS Instrument Performance Specifications .................................................................. 2 of 8
11-2 Summary of Quality Control Procedures for ICP-MS Analysis ........................................... 3 of 8
11-3 Summary of Quality Control Procedures for XRF Analysis ................................................ 7 of 8
11-4 2015 Method Detection Limit ............................................................................................... 8 of 8
12-1 Preventive Maintenance in ERG & DRI Laboratories ......................................................... 2 of 3
13-1 ICP-MS and XRF Analytical Calibration Requirements ...................................................... 2 of 3
14-1 Critical Field and Laboratory Supplies and Consumables .................................................... 2 of 3
15-1 Data Archive Policies ........................................................................................................... 6 of 6
18-1 Qualifier Codes ..................................................................................................................... 6 of 9
18-2 Null Codes ............................................................................................................................ 7 of 9
18-3 Summary of Quantitation and Detection Limit Flags and Applications .............................. 9 of 9
LIST OF FIGURES
Figure
1-1 Lead Analysis Organizational Chart ................................................................................... 4 of 4
9-1 Metals COC ......................................................................................................................... 2 of 4
9-2 Example ERG LIMS Login Page ........................................................................................ 3 of 4
15-1 Data Management and Sample Flow Diagram ................................................................... 2 of 6
16-1 ERG Corrective Action Report Form .................................................................................. 2 of 8
16-2 DRI Corrective Action Report Form ................................................................................... 3 of 8

Project No. EP-BPA-15-D-0004
Element No. A2
Revision No. 0
Date October 2015
Page viii of xvi
SYMBOLS AND ABBREVIATIONS
AMTIC Ambient Air Monitoring Technical Information Center
AQS Air Quality Subsystem
BPA Blank Purchase Agreement
BS/BSD Blank Spike/Bland Spike Duplicate
CAR Corrective Action Report
CCB Continuing calibration blank
CCV Continuing calibration verification
COC Chain of Custody
CSN Chemical Speciation Network
CV Coefficient of Variation, precision
DOC Demonstration of Capability
DPR Daily Performance Report
DQOs Data Quality Objective(s)
DRI Desert Research Institute
DUP Duplicate (used for Replicate Analysis)
EAF Environmental Analysis Facility
EPA U.S. Environmental Protection Agency
ERG Eastern Research Group, Inc.
EDXRF Energy Dispersive X-ray Fluorescence
FACA Federal Advisory Committee Act
FEM Federal Equivalency Method
FRM Federal Reference Method
HSV High standard verification
IC Initial Calibration Standards (ICP-MS)
ICB Initial Calibration Blank
ICP-MS Inductively Coupled Plasma/Mass Spectrometer
ICSA Interference Check Standard A
ICSAB Interference Check Standard B
ICV Initial calibration verification
ISTD Internal Standard
LCV Low Calibration Verification
LIMS Laboratory Information Management System
LOQ Limit of Quantitation
LQL Lower Quantifiable Limit

Project No. EP-BPA-15-D-0004
Element No. A2
Revision No. 0
Date October 2015
Page ix of xvi
LRB Laboratory Reagent Blank
MS/MSD Matrix Spike/Matrix Spike Duplicate
MB Method Blank
MDLs Method Detection Limit(s)
mm Millimeter
MQOs Measurement Quality Objective
μg/L Micrograms per liter
μg/m3 Microgram per cubic meter
NAAQS National Ambient Air Quality Standard
NAREL National Air and Radiation Environmental Laboratory
NELAC National Environmental Laboratory Accreditation Conference
NELAP National Environmental Laboratory Accreditation Program
ng/L Nanogram per liter
NIOSH National Institute for Occupational Safety and Health
NIST National Institute of Standards and Technology
OSHA Occupational Safety and Health Administration
Pb-TSP Lead for Total Suspended Particles
Pb-PM10 Lead for PM10
PDS Post digestion spike
PE Performance Evaluation
POC Parameter Occurrence Code
QA Quality Assurance
QAPP Quality Assurance Project Plan
QC Quality Control
RB Raw Blank
RD Raw Data
RPD Relative Percent Difference
RSD Relative Standard Deviation
SOPs Standard Operating Procedure(s)
SRD Serial dilution
SRM Standard Reference Material
TCEQ Texas Commission on Environmental Quality
TSAs Technical System Audits
TSP Total Suspended Particles
XRF X-ray Fluorescence

Project No. EP-BPA-15-D-0004
Element No. A2
Revision No. 0
Date October 2015
Page x of xvi
DISTRIBUTION LIST
Copies of this plan and all revisions will be provided to:
Jeff Yane, Work Assignment Manager, U.S. EPA, C404-02, RTP, NC
Laurie Trinca, Project Manager, U.S. EPA, C304-06, RTP, NC
Greg Noah, AT QA Coordinator, U.S. EPA, C304-06, RTP, NC
U.S. EPA Regional contacts may obtain a copy of the QAPP by contacting the ERG Program
Manager. It is the responsibility of each Regional contact to make copies of the plan for appropriate
State personnel or to refer them to ERG Program Manager.

Project No. EP-BPA-15-D-0004
Element No. Section 1 - A4
Revision No. 0
Date October 2015
Page 1 of 4
PROJECT MANAGEMENT
SECTION 1
PROJECT/TASK ORGANIZATION
1.1 Assignment of Program Personnel
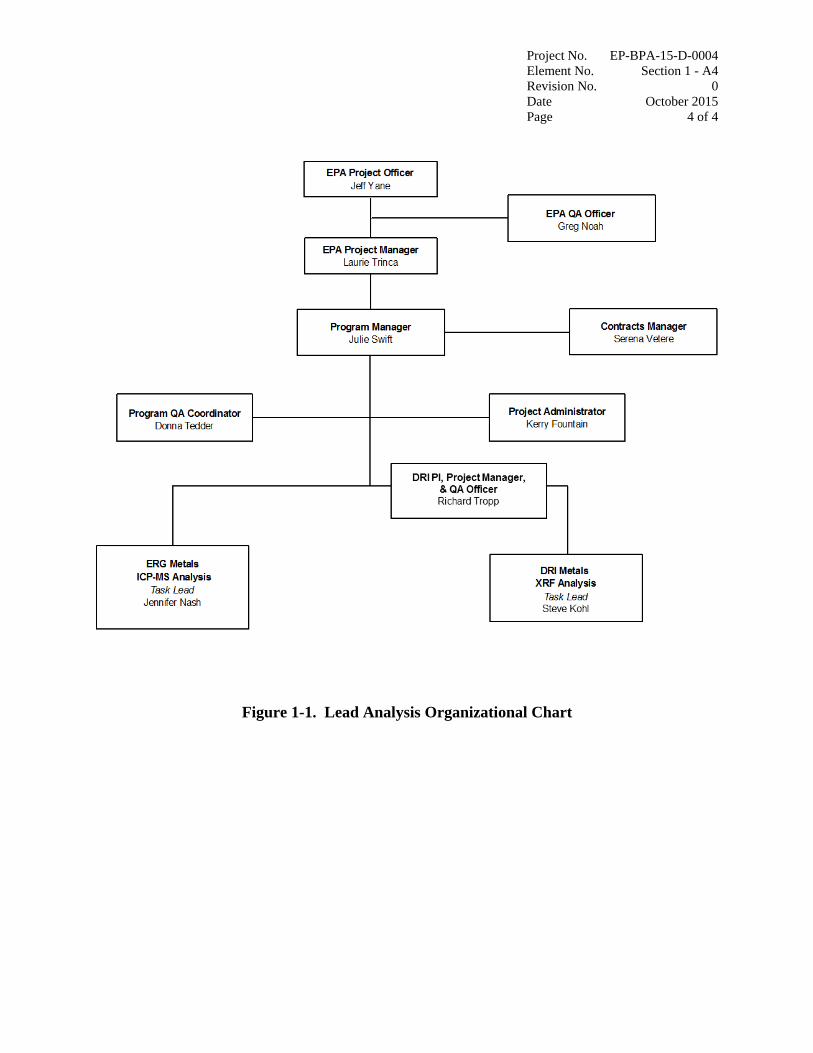
Table 1-1 presents the program organization for each aspect of the Environmental
Protection Agency (EPA) Analysis for Lead in TSP and PM10 Filters. The program
organizational chart is presented in Figure 1-1. All Eastern Research Group (ERG) and Desert
Research Institute (DRI) staff working on this contract are provided access to a current electronic
copy of this signed, EPA approved Quality Assurance Project Plan (QAPP).
ERG’s primary support on this contract includes analysis for lead for Total Suspended
Particles (Pb-TSP) or PM10 (Pb-PM10) by Inductively Coupled Plasma/Mass Spectrometer (ICP-
MS). DRI’s primary support includes analysis for Pb-PM10 filters by X-ray Fluorescence (XRF)
analysis.
ERG is responsible to the client for the work of the subcontractor, DRI. The
subcontractor will meet the Data Quality Objectives (DQOs) requirements for the appropriate
method. ERG shall maintain a record of subcontractor compliance, including documentation of
subcontractor’s Method Detection Limits (MDLs).
1.1.1 Program Manager
Ms. Julie Swift, an ERG Vice President, is the Program Manager for this contract and
will serve as the primary contact. In this role, she has the primary responsibility for
understanding EPA’s and their clients’ (i.e., State, local, and tribal agencies) needs at the
program level. Ms. Swift coordinates with the ERG Quality Assurance (QA) Officer and metal’s
Task Lead to provide EPA client perspective and communicate technical issues and needs. As
the Program Manager, Ms. Julie Swift is responsible for the technical operation and the quality

Project No. EP-BPA-15-D-0004
Element No. Section 1 - A4
Revision No. 0
Date October 2015
Page 2 of 4
of the program on a day-to-day basis. She leads the analytical tasks and provides technical
direction and support. She assists in the resolution of technical issues and serves as a resource
for the Task Lead regarding any project issues. Ms. Swift also performs an overall review of the
data that is reported.
1.1.2 Program QA Coordinator
Ms. Donna Tedder, the Program and Laboratory QA Coordinator, is responsible for
ensuring the overall integrity and quality of project results. Ms. Tedder, or her designee, will do
a 10 percent QA review for all sample analyses delivered for reporting to the Program Manager.
In the case of subcontracted work, 20 percent of data from subcontractor will be reviewed. The
lines of communication between management, the Program QA Coordinator, and the technical
staff are formally established and allow for discussion of real and potential problems, preventive
actions, and corrective procedures. On major quality issues, Ms. Tedder reports independently to
Ms. Mary Willett, ERG’s corporate QA Officer.
1.1.3 Task Leaders
Ms. Jennifer Nash, ERG’s Metals Task Lead, is responsible for meeting the project
objectives, meeting report schedules, and directing the technical staff in execution of the
technical effort for their respective task(s). She will review 100 percent of all sample analyses
and will deliver 10 percent of sample analyses that the QA Coordinator requests for review prior
to data reporting by the Program Manager. Ms. Nash will assess and report on the project’s
progress and results (e.g., recordkeeping, data validation procedures, sample turnaround time)
and ensure timely, high-quality services that meet the requirements in this QAPP.
ERG will subcontract the analysis for the XRF analysis of PM10 filters to DRI.
Dr. Richard Tropp will serve as DRI’s Principal Investigator and Project Manager while Steve
Kohl, from DRI, will be the DRI Task Leader responsible for leading the XRF analysis of PM10
filters. Dr. Tropp will serve as primary contact at DRI, with Mr. Kohl as secondary. Dr. Tropp

Project No. EP-BPA-15-D-0004
Element No. Section 1 - A4
Revision No. 0
Date October 2015
Page 3 of 4
will also be responsible for overseeing the project and Quality Assurance/Quality Control
(QA/QC) of the Energy Dispersive X-ray Fluorescence (EDXRF) data and its reporting to ERG.
Mr. Kohl will be responsible for overseeing the receipt, EDXRF analysis, data processing, data
validation and reporting for the Teflon PM10 samples.
Table 1-1
Program Organization
Program Assignment
Program Personnel
Assigned
Phone Number
Email Address
ERG Program Manager
Julie Swift
(919) 468-7924
Task Lead – ERG ICP-MS Analysis
Jennifer Nash
(919) 468-7881
DRI Project Manager Richard Tropp (775) 674-7094 [email protected]
Task Lead – DRI XRF Analysis Steve Kohl (775) 674-7056 [email protected]
Program QA Coordinator Donna Tedder
(919) 468-7921
Project Administrator Kerry Fountain
(919) 468-7962
Project No. EP-BPA-15-D-0004
Element No. Section 1 - A4
Revision No. 0
Date October 2015
Page 4 of 4
Figure 1-1. Lead Analysis Organizational Chart

Project No. EP-BPA-15-D-0004
Element No. Section 2 - A5
Revision No. 0
Date October 2015
Page 1 of 1
SECTION 2
PROBLEM DEFINITION/BACKGROUND
On November 12, 2008, the EPA issued a rule strengthening the primary and secondary
National Ambient Air Quality Standards (NAAQS) for lead and associated monitoring
requirements (Federal Register Volume 73, Number 219, (73 FR 66964) (1) to provide necessary
protection for public health and welfare. The EPA revised various elements of the primary
standard to provide increased protection for children and at-risk populations against adverse
health effects, most notably including neurological effects in children. EPA revised the primary
(health-based) standard from 1.5 micrograms per cubic meter (µg/m3) to 0.15 µg/m3, as total
suspended particles (TSP). EPA is revising the secondary (welfare-based) standard to be
identical in all respects to the revised primary standard.
The EPA also promulgated a new Federal Reference Method (FRM) for the sampling and
analysis of Pb-PM10 as Code of Federal Regulations Title 40 Part 50 (40 CFR Part 50), Appendix
Q(2). The averaging time was revised to a rolling 3-month period with a maximum (not-to-be-
exceeded), evaluated over a 3-year period.
EPA revised the data handling procedures, including allowance for the use of Pb-PM10
data in certain circumstances, and the treatment of exceptional events, and ambient air
monitoring and reporting requirements for Pb, including those related to sampling and analysis
methods, network design, sampling schedule, and data reporting. Depending on specific
circumstances outlined in the rule, States have the option of monitoring for Pb-TSP or Pb-PM10
following approved FRMs or Federal Equivalent Methods (FEMs) to meet the monitoring
requirements.

Project No. EP-BPA-15-D-0004
Element No. Section 3 - A6
Revision 0
Date October 2015
Page 1 of 1
SECTION 3
PROJECT/TASK DESCRIPTION
This section describes the activities performed under the national contract for the analysis
of Pb-TSP and Pb-PM10 for state, local, and tribal monitoring agencies. Sampling and analysis
schedules are prepared when a Blank Purchase Agreement (BPA) is provided by EPA.
3.1 NAAQS for Lead Analysis
The NAAQS national contract for the analysis of Pb-TSP and Pb-PM10 was created so
that the State, Local and Tribal monitoring agencies could access a laboratory to provide their
analysis following EPA approved FRM/FEM analysis specifications. The filters are supplied by
the state/local agencies for this program. The EPA provides the agencies, through their Regional
Coordinators, access to this contract to provide the analysis. A list of the analyses, EPA
FRM/FEM, and laboratory Standard Operating Procedures (SOP) are listed in Table 3-1. ERG
can prepare the data in the Air Quality Subsystem (AQS) database format for quarterly upload if
requested.
Table 3-1
List of Analytical Services
Analysis
Method SOP ICP-MS
Pb-TSP
EQL-0512-201(3)
ERG-MOR-084
Pb-PM10
EQL-0512-202(4) ERG-MOR-085
XRF
Pb-PM10
40 CFR Part 50, Appendix Q(2)
DRI SOP #2-209
Project No. EP-BPA-15-D-0004
Element No. Section 4 – A7
Revision No. 0
Date October 2015
Page 1 of 2
SECTION 4
DATA QUALITY OBJECTIVES AND CRITERIA FOR MEASUREMENT DATA
Because ERG performs analysis services only, DQOs for defining a network program are
not identified in this QAPP. This section will discuss the Measurements Quality Objectives
(MQOs) of ERG and DRI laboratory analyses, emphasizing the levels of uncertainty the decision
maker is willing to allow/accept from the analytical results.
Once a sampling DQO is established, the quality of the data must be evaluated and
controlled to ensure that data quality is maintained within the established acceptance criteria.
MQOs are designed to evaluate and control various phases (sampling, preparation, analysis) of
the measurement process to ensure that the total measurement uncertainty is within the range
prescribed by the DQOs. MQOs can be defined in terms of the following data quality indicators:
Precision - a measure of mutual agreement among individual measurements of the same
property usually under prescribed similar conditions. This is the random component of
error.
Bias - the systematic or persistent distortion of a measurement process that causes error in
one direction. Bias is determined by estimating the positive and negative deviation from
the true value as a percentage of the true value.
Detectability - the determination of the low range critical value of a characteristic that a
method-specific procedure can reliably discern.
Comparability - a measure of the level of confidence with which one data set can be
compared to another.
Bias has been the term frequently used to represent closeness to “truth” and includes a
combination of precision and bias error components. The MQOs listed will attempt to separate
measurement uncertainties into precision and bias components. Bias will be assessed in the
quarterly EPA audits which will be reported into AQS.

Project No. EP-BPA-15-D-0004
Element No. Section 4 – A7
Revision No. 0
Date October 2015
Page 2 of 2
Analytical Precision is calculated by comparing the differences between replicate
analyses (two analyses of the same sample) from the arithmetic mean of the two results as shown
below. Replicate analyses with low variability have a lower Relative Percent Difference (RPD)
(better precision), whereas high variability samples have a higher RPD (poorer precision).
𝑅𝑃𝐷 = |𝑋1 − 𝑋2|
𝑥 100
Where:
X1 = Ambient air concentration of a given compound measured in one sample;
X2 = Concentration of the same compound measured during replicate analysis;
X = Arithmetic mean of X1 and X2.
Table 4-1 lists the MQOs for Pb-TSP and Pb-PM10 using ICP-MS and XRF.
Table 4-1
Measurement Quality Objectives for the National Lead Analysis Program
Analyte/
Instrument
Reporting
Units
Precision
from
analysis of
Replicate
Samples
(RPD)*
Precision
from
collection
of
Collocate
Samples*
Comparability/
Based on
Method
Minimum
Detection
Limit Pb-TSP
ICP-MS
µg/filter ± 10% ± 20% EQL-0512-201 See Table
11-4
Pb-PM10
ICP-MS
µg/filter ± 10% ± 20% EQL-0512-202
See Table
11-4
Pb-PM10
XRF
µg/filter ± 10% ± 20% 40 CFR Part 50,
Appendix Q
See Table
11-4 * Sample value is ≥ 10 times the MDL

Project No. EP-BPA-15-D-0004
Element No. Section 5 - A8
Revision No. 0
Date October 2015
Page 1 of 2
SECTION 5
SPECIAL TRAINING REQUIREMENTS/CERTIFICATION
The activities of EPA’s National Contract for Lead Analysis is performed using accepted
EPA, National Institute for Occupational Safety and Health (NIOSH), and Occupational Safety
and Health Administration (OSHA) analytical protocols for the analytical laboratory staff.
5.1 ERG Analytical Laboratory Personnel
ERG analytical laboratory personnel involved in this project have been trained in their
tasks and have up to 28 years of experience in the duties they will be performing in the analytical
laboratory. Training of ERG laboratory personnel is recorded in ERG Training Records in an
Excel database and filed as a hardcopy. Technical training includes general techniques and
specific training based on the appropriate SOP, method, and program QAPP. After training, an
initial demonstration of each personnel’s ability to perform the analytical task involves repeated
measurements of a standard. These records are kept by the ERG QA staff. Currently, no special
certifications are needed for the analysis of the ambient samples received for this programs.
Health and Safety training is performed annually. The laboratory personnel will adhere to the
ERG Corporate Health and Safety manual.
ERG maintains appropriate SOPs for each analytical method. These SOPs are presented
in Appendix A. All SOPs document equipment and/or procedures required to perform each
specific laboratory activity. Laboratory staff will be subject to on-site surveillance by the
Quality Assurance staff and quarterly audit samples.
5.2 DRI Analytical Laboratory Personnel
DRI Environmental Analysis Facility (EAF) personnel involved in this project have an
education background and up to 35 years of experience in the duties they will be performing at
DRI EAF. The DRI Project Manager, Dr. Tropp, has been overseeing sampling and analysis
Project No. EP-BPA-15-D-0004
Element No. Section 5 - A8
Revision No. 0
Date October 2015
Page 2 of 2 projects for over 35 years, including the QA/QC of XRF analysis results. DRI’s EAF Analysis
Task Leader, Mr. Kohl, has been performing EDXRF analysis of PM samples for more than 20
years. All laboratory personnel performing tasks according to EAF SOPs have passed a
demonstration of capability (DOC) initially then annually according to DRI SOP for
Demonstration of Capability, DRI SOP #6-0015r1 in Appendix B. These records are kept by the
EAF QA Manager. DRI EAF personnel are subject to periodic internal QA audits by the EAF
QA Manager. In addition, DRI EAF personnel will perform periodic PE sample analyses as
required. All DRI EAF personnel are required to undergo DRI laboratory safety training
annually and adhere to the Institute’s health and safety plans.
Project No. EP-BPA-15-D-0004
Element No. Section 6 - A9
Revision No. 0
Date October 2015
Page 1 of 5
SECTION 6
DOCUMENTATION AND RECORDS
The EPA National Contract for Lead analysis generates a number of documents and
records that need to be retained/archived. The PM will provide all staff working on this contract
access to a current electronic copy of this signed, EPA approved QAPP. In this QAPP, ERG’s
reporting package (defined as the information required to support the data reported) includes all
data required to be collected as well as support data deemed important by ERG and/or DRI.
6.1 Data Management
ERG has a structured records management retrieval system that allows for the efficient
archive and retrieval of records. The analytical information that is collected by the laboratory
will be managed in this system. The laboratory paper copies of all analyses are stored on site in
a secured temperature-controlled laboratory area for up to five years after the close of the
contract. Data obtained from DRI will be imported into the LIMS data server so that the same
reports will be generated for all samples submitted for analysis. ERG also archives the data in
the Laboratory Information Management System (LIMS) data server which is backed up weekly,
monthly, and biannually. The backed-up data is stored at an off-site ERG facility. Data Storage
and Retrieval is discussed in more detail in Section 15.6. The Program Manager has final
authority for the storage, access to, and final disposal of all records kept for this program.
6.2 Data Reports
Data reports, sent in Adobe and Excel formats to EPA and appropriate state/local/tribal
agencies, will include the sample name, filter ID number, collection date, received date, analysis
date, analytical method, analytical data reported in µg/filter, MDL, and qualifiers. This report
will be submitted within 30 days from the receipt of the samples. The data reports will include
analytical results for individual samples as well as associated QC samples, associated MDLs, and
qualifiers.

Project No. EP-BPA-15-D-0004
Element No. Section 6 - A9
Revision No. 0
Date October 2015
Page 2 of 5 6.3 Records and Supporting Data
Data used for the measurement of lead and the associated QA/QC data are collected
electronically or on data forms. Table 6-1 presents the location of the data records for laboratory
operations stored at the ERG and DRI laboratories.
Table 6-1
Data Documentation and Records
Item Record
Short Term
Location
Storage
Long Term
Location Storage
Field Operations
Chain of Custody (COC) ERG COCs In Laboratory
with Samples
Copy scanned and
stored on ERG
LIMS
Laboratory Records - ERG
Sample Prep Data Bench sheets Hardcopy filed,
LIMS
Hardcopy
archived, LIMS
Sample Management Records (sample
receipt, handling, storage, etc.) COCs
LIMS, with
bench sheets
LIMS, with bench
sheets
Test Methods SOPs
Hardcopy filed,
shared network
drive
Shared network
drive
QA/QC Reports (General QC records,
MDL information, calibration, etc.)
Individual records for
each analysis
Hardcopy filed,
shared network
drive
Hardcopy
archived, shared
network drive
Corrective Action Reports Individual records for
each analysis
Original copy
filed, copy in
data package
All copies
archived
Laboratory Records - DRI
Sample Management Records (sample
receipt, handling, storage, etc.) COCs
Shipping &
Receiving
Hard Copy
Archiver
Test Methods SOPs Analytical; Lab LAN & QA Files
QA/QC Reports (General QC records,
MDL information, calibration, etc.)
Individual records for
each analysis Analytical Lab LAN
Corrective Action Reports (CAR) Individual records for
each analysis Analytical Lab
LAN and EAF QA
Manager *
Data Reduction, Verification, and Validation
Electronic Data (used for AQS data
entry if requested) Excel® and Access®
Shared network
drive
Shared network
drive
* Archive for formal CARs

Project No. EP-BPA-15-D-0004
Element No. Section 6 - A9
Revision No. 0
Date October 2015
Page 3 of 5 6.3.1 Notebooks
ERG issues laboratory notebooks to each laboratory division upon request. This
notebook is uniquely numbered and associated with the laboratory personnel. Although LIMS
data entry forms are associated with all routine environmental data operations, the notebooks can
be used to record additional information about these operations. All notebook entries are filled
out in indelible ink. Corrections are made by inserting one line through the incorrect entry,
initialing the correction (ERG and DRI maintain a signature log), and placing the correct entry
alongside the incorrect entry, if this can be accomplished legibly, or by providing the information
on a new line.
Field Notebooks - Field notebooks are the responsibility of the EPA, States, local or
tribal agencies as ERG is not responsible for the collection of samples.
Laboratory Notebooks - Notebooks are associated with general procedures such as
temperature records for the refrigerators, calibration of analytical balances, sample preparation
logs, calibration of analytical instruments, preventive maintenance and repairs, receipt of
standards and other supplies, etc., used in this program.
Sample Shipping and Receipt - ERG’s LIMS system is used to record samples
received. Hard copies of COC records are also stored for one year; however, electronic copies
are scanned and stored in LIMS and on a shared network drive.
6.3.2 Electronic Data Collection
In order to reduce the potential for data entry errors, automated systems are utilized
(where appropriate) and record the same information that is found on data entry forms.
Whenever possible, DRI utilizes barcode-based hardcopy forms, data processing routines to
process data from sampling and analytical instruments directly, and standardized data processing
routines. Information available from multiple sources (e.g., hardcopy forms, sampler files, and

Project No. EP-BPA-15-D-0004
Element No. Section 6 - A9
Revision No. 0
Date October 2015
Page 4 of 5 analytical instruments) are cross-checked for consistency and revised or flagged when questions
arise. Instrument and laboratory environmental data are stored on instruments and computers in
the laboratories and transferred to a database on the EAF LAN.
6.4 Data Reporting Package Archiving and Retrieval
In general, all the information listed above will be retained for at least 5 years from the
date of the end of the closed contract with EPA. If any litigation, claim, negotiation, audit or
other action involving the records has been started before the expiration of the 5-year period,
however, the records will be retained until completion of the action and resolution of all issues
which arise from it. The long-term storage at ERG is located in the laboratory in a locked
climate-controlled file room with limited access. The project secretary keeps a record of
documents entering and leaving long-term storage. Access to the facility storage area is limited
to authorized personnel only.
DRI EAF uses a phased approach for long-term storage of hard-copy records. Recently
archived records are located in a hardcopy storage area at DRI with limited access and checkout
logs. Older records, generally more than five years old after project completion, may be moved
to a climate-controlled offsite storage facility. It also has limited access and checkout logs. For
electronic records, DRI EAF laboratory computers house raw data stored on a RAID 1 (Mirror)
system. Raw data is automatically backed up to a virtual file and database server, which is run
on a physical clustered RAID 1 (Mirror) server, once a day. Once data is on the server it is
stored in an instantly accessible, un-modifiable directory for 35 days and an instantly accessible,
modifiable directory for 10 days. All data in these locations begin as exact copies of data that
was on each individual laboratory computer. After data is safely in those locations, the raw data
is extracted from the files and imported to the database server for possible modification. After
data has been on the server for 35 days, it is automatically written to tape and stored indefinitely.
Daily e-mails are automatically generated to confirm backups and notify computer personnel of
data processing and data management issues. All hard drives and tape, once filled, are stored in
a special media storage room. The room is secure, accessible only by assigned personnel, with

Project No. EP-BPA-15-D-0004
Element No. Section 6 - A9
Revision No. 0
Date October 2015
Page 5 of 5 entry through a security system. The room has no windows, no drop ceilings, and is buried in
the side of a hill in the lower section of the DRI building. It also contains UV filters on the lights
to prevent damage to media. In addition, there are separate keyed lockers for each DRI
laboratory. As part of an Institute-wide disaster recovery plan, data stored on networks at DRI’s
Reno campus are backed up to DRI’s Las Vegas campus and vice versa.
6.5 Quality System Document Control
To ensure the use of the most current version of quality system documents, all quality
documents (QAPP, SOPs, etc.) generated at the ERG Laboratory must be uniquely identified.
Original documents shall include the date of issue, revision number, page number, total number
of pages, and appropriate signatures. Copies of quality documents shall be controlled and include
the date of issue, revision number, page number, total number of pages, and copy control
number. When an original quality document is updated, the QA Coordinator or designee will
ensure that the copy documents are also updated and old versions are disposed. During the
course of the project, revised QAPPs will be circulated to the EPA and to ERG’s laboratory staff.
For copies of documents out of the laboratory’s control, a stamp or watermark stating
“Uncontrolled” or “Draft”, if applicable, will be applied. Each approved QAPP will be posted on
EPA’s Ambient Air Monitoring Technical Information Centers (AMTIC) Website.

Project No. EP-BPA-15-D-0004
Element No. Section 7 - B1
Revision No. 0
Date October 2015
Page 1 of 1
MEASUREMENT DATA ACQUISITION
SECTION 7
SAMPLING PROCESS DESIGN
ERG is not responsible for the collection of samples nor the design of the samplers used
in the NAAQS program. Pb-TSP sampling that meets the requirements of Appendix B to Part
50, Reference Method for the Determination of Suspended Particulate Matter in the Atmosphere
(High-Volume Method)(5) is acceptable as a FRM sampler. Low-volume PM10 samplers that
meet the requirements (as described in Appendix O of Part 50(6)) can be used for Pb-PM10
monitoring intended to meet NAAQS comparison objectives. ERG is responsible only for the
analysis of the samples it receives from the sites.

Project No. EP-BPA-15-D-0004
Element No. Section 8 - B2
Revision No. 0
Date October 2015
Page 1 of 1
SECTION 8
SAMPLING METHOD REQUIREMENTS
Because ERG is not responsible for actual execution of the field sampling in this
program, the method support for the site’s samplers are not discussed in this QAPP.

Project No. EP-BPA-15-D-0004
Element No. Section 9 - B3
Revision No. 0
Date October 2015
Page 1 of 4
SECTION 9
SAMPLE HANDLING AND CUSTODY REQUIREMENTS
ERG’s Shipping and Receiving Task Leader will ensure that sample media that is
received in the laboratory follow all of the procedures listed in this QAPP and the individual
SOPs. The Task Leader will also advise the Project Manager of any issues or obstacles
regarding sample receipt, login and storage. The sample custodian working under the Shipping
and Receiving Task Leader will receive custody of samples, complete COC receipt information,
document sample receipt, and enter COC information into LIMS to create a work order.
Samples for XRF analysis will be received and logged in at ERG’s laboratory before they are
sent to DRI for analysis.
9.1 Analysis Chain of Custody Forms
Field testing personnel will record data on the COC forms (Figure 9-1). The COC form
documents time, date, location, and other field parameters. Because the sites supply the filters
used for metal analysis, COC forms are generated by the State, local or tribal agency for these
samples. If needed, however, the COC forms provided on the AMTIC website at:
http://www3.epa.gov/ttn/amtic/pb-monitoring.html. Samples are received at ERG’s laboratory as
presented in the SOP for Sample Receipt at ERG Chemistry Laboratory, ERG-MOR-045, in
Appendix A.
The sample specific information from the COC is then entered into the LIMS (example
login page is shown in Figure 9-2). The sample is logged into the LIMS database following the
SOP for Sample Login to the Laboratory Information Management System, ERG-MOR-079
found in Appendix A. The sample is given a unique LIMS identification number.
The LIMS ID number is recorded on all ERG copies of the COC. The COC is scanned
(the PDF is stored in the LIMS system) and is kept with the samples until analysis is complete.

Project No. EP-BPA-15-D-0004
Element No. Section 9 - B3
Revision No. 0
Date October 2015
Page 2 of 4
Figure 9-1. Metals COC
27560 Keystone Park Drive, Suite 700, Morrisville, NC 601 Page __________ of __________
SITE
ode AQS C Date/Time:
ter: Submit
Date/Time:
# Date Filter ID
1
2
3
4
5
6
7
8
9
10
11
12
13
14
15
16
17
18
19
20
21
22
23
24
25
Chain of Custody TSP/PM10 Lead Analysis (EP-BPA-15-D-0004)
Sample Volume (m
3 Comments ) ERG LIMS ID ( ) Lab use only
Relinquished by:
ANALYSES Received by:
TSP (ICP
PM10 (ICPM
PM10 (XRF)

Project No. EP-BPA-15-D-0004
Element No. Section 9 - B3
Revision No. 0
Date October 2015
Page 3 of 4
Figure 9-2. Example ERG LIMS Login Page
9.2 Invalid Samples
The sample can be determined invalid at the site or in the laboratory. SOP ERG-MOR-
045 describes the sample receiving procedure and sample acceptance. Individual sites will be
contacted if there are any questions about the samples upon receipt. When a sample is designated
as invalid, the assigned LIMS ID number is notated as a void and the sample is invalidated on
the individual respective COC form. The sites will also be notified of any invalid samples in the
analytical data reports.
9.3 Analytical Data
All laboratory electronic records will be stored for archive on shared network drive which
is backed-up daily, weekly, and monthly. The back-ups are stored off-site for added safety. Raw
data will be included in the project archive files stored in an ERG long-term storage location.
Project No. EP-BPA-15-D-0004
Element No. Section 9 - B3
Revision No. 0
Date October 2015
Page 4 of 4
DRI EAF laboratory computers house raw data stored on a RAID 1 (Mirror) system.
Raw data is automatically backed up to a virtual file and database server, which is run on a
physical clustered RAID 1 (Mirror) server once a day. Once data is on the server it is stored in
an instantly accessible, un-modifiable directory for 35 days and an instantly accessible,
modifiable directory for 10 days. All data in these locations begin as exact copies of data that
was on each individual laboratory computer. After data is safely stored in those locations, the
raw data is extracted from the files and imported to the database server for possible modification.
After data has been on the server for 35 days, it is automatically written to tape and stored
indefinitely. Daily e-mails are automatically generated to confirm backups and notify computer
personnel of data processing and data management issues. All hard drives and tape, once filled,
are stored in a special media storage room.
All records generated are signed or initialed by the person performing the work and
reviewed by an appropriate Task Leader. Measurement results become part of a project report,
of which 10 percent is chosen and reviewed by the QA Coordinator or a reviewer designated by
the QA Coordinator.
9.4 Sampling Monitoring Data
All COC forms from the monitoring sites will be stored with the extraction bench sheet.
The COC forms will be reviewed by the Analysts, Task Leaders and Program Manager. The
original field data for all the samples, TSP by ICP-MS, PM10 by ICP-MS and PM10 by XRF will
remain in ERG custody and eventually will be stored on file until 5 years after the end of the
contract. DRI will receive a copy of the COC forms from the sites with the ERG LIMS ID
number added. ERG will contact the individual site if necessary information is not completed on
the COC forms.

Project No. EP-BPA-15-D-0004
Element No. Section 10 - B4
Revision No. 0
Date October 2015
Page 1 of 3
SECTION 10
ANALYTICAL METHODS REQUIREMENTS
Analytical procedures are laboratory-specific because of the different methods being used
at ERG and DRI. The ERG analytical methods for of Pb-TSP and Pb-PM10 uses ICP-MS. The
analytical method used at DRI utilizes the XRF for the analysis of Pb-PM10. All analytical
method SOPs are provided in Appendix A for ERG and Appendix B for DRI. Corrective action
for analytical system failures realized at time of analysis is initiated by the Analyst, supported by
the Task Leader for that method.
The SOPs for these analytical methods are reviewed annually and updated as necessary.
The QA Coordinator, Program Manager and Writer/Editor will review, sign and date it before
distributing to the particular laboratories satellite file areas. The previous copies will be replaced
with the revised edition. The original, and all previously revised edits, are stored in a historical
file maintained by ERG’s Document Administrator.
10.1 Lead Analysis Using an ICP-MS Analytical System
Sample preparation and analysis procedures are based on NAAQS FEM for the analysis
of Lead (EQL-0512-201(3) for TSP and EQL-0512-202(4) for PM10) using ICP-MS analysis
techniques. Upon receipt from the field, the samples are checked against the COC forms and
then logged into the LIMS system. Each sample component is examined to determine if damage
occurred during travel. Color, appearance, and other particulars of the samples are noted. A
complete description of the preparation and analytical procedures for glass fiber (8x10") filters
(ERG-MOR-084) and for Teflon® 47mm filters (ERG-MOR-085) are presented in Appendix A.
Analysis hold time for metals filters is 180 days.
The ICP-MS consists of an inductively coupled plasma source, ion optics, a quadrupole
mass spectrometer, a recirculator and an autosampler. The mass spectrometer will be mass
calibrated and resolution checked. Resolution at low mass is indicated by magnesium isotopes

Project No. EP-BPA-15-D-0004
Element No. Section 10 - B4
Revision No. 0
Date October 2015
Page 2 of 3 24, 25, and 26. Resolution at high mass is indicated by lead isotopes 206, 207, and 208.
Instrument stability must be demonstrated by running a tuning (daily performance check)
solution (1 nanograms per liter (ng/L) of barium, bismuth, cerium, cobalt, indium, lead, lithium,
and uranium; and 10 ng/L of magnesium) five times with the resulting Relative Standard
Deviation (RSD) of absolute signals for all analytes of less than 3 percent. Sample and waste
disposal procedures are outlined in ERG-MOR- 033, the SOP for Hazardous Waste.
10.2 Lead Analysis Using an X-Ray Fluorescence Analytical System
DRI will analyze the PM10 filters for Pb by XRF. Upon receipt from ERG, the samples
are checked against the COC forms. EDXRF analysis will be performed on Teflon-membrane
filters for Pb PM10, although the system may be used for up to 51 elements including the 33
elements currently reported to AQS for EPA’s Chemical Speciation Network (CSN). XRF
analyses are performed on a PANalytical Epsilon 5 EDXRF analyzer. Seven XRF conditions are
normally used by the PANalytical instrument on each sample to optimize the detection limits for
the specified elements. However, since Pb has no significant interferences from other elements
that are accounted for in the deconvolution software for the condition used, if EPA and ERG
agree, DRI will modify its normal multi-element procedure to use only the one condition for Pb
and increase the condition’s analysis time by a factor of four to improve the Pb detection limit by
a factor of two.
Two types of EDXRF standards are used for calibration, performance testing, and
auditing: (1) vacuum-deposited thin-film elements and compounds from Micromatter Co.
(Vancouver, BC), and (2) polymer films. The vacuum deposit standards cover most elements
and are used as calibration standards. The polymer film and NIST standards are used as QC
standards. During EDXRF analysis, filters are removed from their Petri slides and loaded into
holders for entry into the x-ray analysis chamber. The vacuum in the x-ray chamber and the heat
induced by the absorption of x-rays may evaporate some materials, such as ammonium nitrate.
A QC standard and a replicate from a previous analysis will be analyzed with each set of 10
filters. When a QC value differs from specifications by ± 10% or more, or when a replicate

Project No. EP-BPA-15-D-0004
Element No. Section 10 - B4
Revision No. 0
Date October 2015
Page 3 of 3 value differs from the original value (where values exceed 10 times the detection limits) by
±10% or more, the problem is identified and filters may be reanalyzed. If further tests of
standards show that the system calibration has changed by more than ±5%, the instrument is
recalibrated. In addition, DRI will maintain a set of laboratory blanks that will be analyzed
periodically (~1 blank for every 20 filters analyzed) to test for baseline shifts in blank values.
After EDXRF analysis, the Teflon-membrane filters are returned to their Petri slides and
stored until the XRF data validation is completed and indicates that the runs are acceptable.
Detailed information on the EDXRF analysis of Teflon-membrane filters is given in DRI
SOP for for X-Ray Fluorescence (XRF) Analysis of Aerosol Filter Samples (PANalytical Epsilon
5), DRI SOP #2-209.8, in Appendix B.

Project No. EP-BPA-15-D-0004
Element No. Section 11 – B5
Revision No. 0
Date March 2015
Page 1 of 8
SECTION 11
QUALITY CONTROL REQUIREMENTS
This section describes the quality control requirements for each of the analytical methods.
The MDLs presented in this section were performed in 2015.
11.1 Standard Traceability
The standards used for all analytes are vendor-supplied National Institute of Standards
and Technology (NIST) standards or vendor-supplied referenced to a NIST standard. All
analytical methods are also certified by comparison to a second source NIST-traceable standard.
The ERG-MOR-022, SOP for the Preparation of Standards in the ERG Laboratory, provides
direction for preparing standards (Appendix A).
11.2 Accuracy and Acceptance
Because ambient air measurements encompass a range of compounds and elements
whose individual concentrations are unknown, defining absolute accuracy is not possible.
Instead, accuracy is determined by comparing the analysis of standards of known concentration.
The criteria for the analysis of collocate samples and their replicate analyses are found in
Section 4. Each instrument calibration is discussed by method in Section 13 of this QAPP.
Accuracy of analysis is based on the accuracy of the calibration, including the accuracy of the
calibration standards. Accuracy is monitored throughout the program using QC and quarterly
audit (or proficiency) samples. Routine analysis of proficiency lead test strips/filters for TSP by
ICP-MS, PM10 by ICP-MS and PM10 by XRF is discussed in Section 16.1.3. Required QC
samples and their criteria and corrective actions are discussed by the methods listed below.
Project No. EP-BPA-15-D-0004
Element No. Section 11 – B5
Revision No. 0
Date March 2015
Page 2 of 8
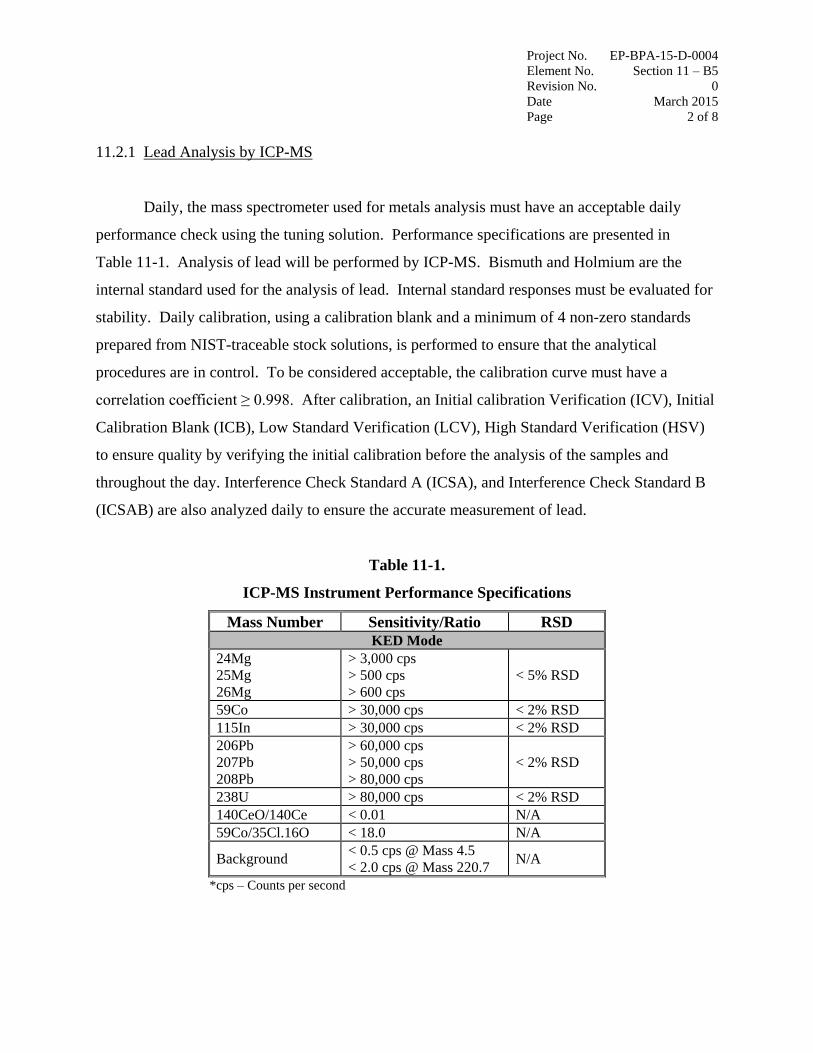
11.2.1 Lead Analysis by ICP-MS
Daily, the mass spectrometer used for metals analysis must have an acceptable daily
performance check using the tuning solution. Performance specifications are presented in
Table 11-1. Analysis of lead will be performed by ICP-MS. Bismuth and Holmium are the
internal standard used for the analysis of lead. Internal standard responses must be evaluated for
stability. Daily calibration, using a calibration blank and a minimum of 4 non-zero standards
prepared from NIST-traceable stock solutions, is performed to ensure that the analytical
procedures are in control. To be considered acceptable, the calibration curve must have a
correlation coefficient ≥ 0.998. After calibration, an Initial calibration Verification (ICV), Initial
Calibration Blank (ICB), Low Standard Verification (LCV), High Standard Verification (HSV)
to ensure quality by verifying the initial calibration before the analysis of the samples and
throughout the day. Interference Check Standard A (ICSA), and Interference Check Standard B
(ICSAB) are also analyzed daily to ensure the accurate measurement of lead.
Table 11-1.
ICP-MS Instrument Performance Specifications
Mass Number Sensitivity/Ratio RSD
KED Mode
24Mg
25Mg
26Mg
> 3,000 cps
> 500 cps
> 600 cps
< 5% RSD
59Co > 30,000 cps < 2% RSD
115In > 30,000 cps < 2% RSD
206Pb
207Pb
208Pb
> 60,000 cps
> 50,000 cps
> 80,000 cps
< 2% RSD
238U > 80,000 cps < 2% RSD
140CeO/140Ce < 0.01 N/A
59Co/35Cl.16O < 18.0 N/A
Background < 0.5 cps @ Mass 4.5
< 2.0 cps @ Mass 220.7 N/A
*cps – Counts per second

Project No. EP-BPA-15-D-0004
Element No. Section 11 – B5
Revision No. 0
Date March 2015
Page 3 of 8
If the initial calibration checks do not meet criteria, a second calibration check analysis is
performed. If the second set does not pass, or if one or more of the daily QC checks do not meet
criteria, a new calibration curve is prepared and analyzed. All samples analyzed with the
unacceptable QC check will be reanalyzed or flagged appropriately when necessary. During the
analysis of the samples, the Continuing Calibration Verification (CCV) and Continuing
Calibration Blank (CCB) are analyzed immediately before the analysis of samples, every ten
samples, and at the end of every analysis batch. The ICSA and ICSAB are analyzed every eight
hours and at the end of every analysis. The LCV is analyzed at the end of every analysis. Quality
procedures for metals analysis by ICP-MS are shown in Table 11-2.
Table 11-2
Summary of Quality Control Procedures for ICP-MS Analysis
Quality Control
Check
Frequency Acceptance Criteria Corrective Action
Daily
Performance
Check (DPR)
Daily, prior to samples See Table 11-1 for acceptance
criteria.
1)Repeat analysis of DPR
2)Re-optimize instrument
tuning parameters
3) Reprepare DPR standard
4) Perform instrument
maintenance
Initial Calibration
Standards (IC)
Daily, at least 5 calibration
points (blank included as
one calibration point)
Correlation coefficient ≥ 0.998
& %RSD ≤ 10. RSDs > 10 are
acceptable for the CAL2
standard.
1) Repeat analysis of
calibration standards
2) Reprepare calibration
standards and reanalyze
ICV Immediately after
calibration
Recovery 90-110% 1) Repeat analysis of ICV
2) Recalibrate ICV standard
3) Recalibrate and reanalyze
ICB Immediately after ICV Absolute value must be < MDL 1) Locate and resolve
contamination problems before
continuing
2) Reanalyze or recalibrate or
flag failing elements for the
entire analysis when
appropriate
HSV After ICB and before ICS Recovery from 95-105% 1) Repeat analysis of HSV
2) Reprepare HSV
ICSA/IFA Following the HSV, every 8
hours and at the end of each
run
Within ±3 times Limit of
Quantitation (LOQ) from zero or
from the standard background
contamination when present
1) Repeat analysis of ICSA
2) Reprepare ICSA and analyze
3) Adjust correction equation(s)
and reprocess entire analysis

Project No. EP-BPA-15-D-0004
Element No. Section 11 – B5
Revision No. 0
Date March 2015
Page 4 of 8
Table 11-2, Continued
Summary of Quality Control Procedures for ICP-MS Analysis
Quality Control
Check
Frequency Acceptance Criteria Corrective Action
ICSAB/IFB Following each ICSA Recovery 80-120% of true value
plus standard background
contamination when present
1) Repeat analysis of ICSAB
2) Reprepare ICSAB and
analyze
3) Adjust correction equation(s)
and reprocess entire analysis
CCV Analyze before samples,
after every 10 samples, and
at the end of each run
Recovery 90-110% 1) Reanalyze CCV
2) Reprepare CCV
3) Recalibrate and reanalyze
samples since last acceptable
CCV
LCV At the beginning and end of
each analysis, between the
CCV and the CCB
Recovery 70-130% 1) Reanalyze LCV
2) Reprepare LCV
3) Recalibrate and reanalyze
samples since last acceptable
LCV
CCB Analyzed after each CCV Absolute value must be < MDL 1) Reanalyze CCB
2) Reanalyze samples since last
acceptable CCB
LRB/BLK1 1 per 20 samples, a
minimum of 1 per batch
Absolute value must be < MDL 1) Reanalyze
2) If > MDL, but < 5x MDL,
sample results for that element
must be flagged for the entire
analysis
3) If > 5x the MDL then sample
results for that element must be
blank subtracted
MB/BLK2 1 per 20 samples, a
minimum of 1 per batch
Absolute value must be < MDL.
Note: The MB is used only for
the purpose of MDL generation
This standard is not required by
the method and there is no
corrective action
Standard
Reference
Material (SRM)
1 per 20 samples, a
minimum of 1 per batch
Recovery 80-120% 1) Reanalyze
2) Flag sample data
3) Re-extract batch
LCS/BS (and
BSD for 47mm
Teflon® filters
only)
1 per 20 samples, a
minimum of 1 per batch
Recovery 80-120% 1) Reanalyze
2) Flag data if recovery for
only one or two elements fail
criteria
3) Reprepare sample batch if
recovery for most elements fail
criteria, if possible

Project No. EP-BPA-15-D-0004
Element No. Section 11 – B5
Revision No. 0
Date March 2015
Page 5 of 8
Table 11-2, Continued
Summary of Quality Control Procedures for ICP-MS Analysis
Quality Control
Check
Frequency Acceptance Criteria Corrective Action
Replicates (DUP)
(Replicate
Analysis)
1 per 20 samples, a
minimum of 1 per batch
≤ ±10% RPD for 47 mm Teflon
filters and 20% RPD for 8x10”
Quartz filters values ≥ 10 times
the MDL
1) Check for matrix
interference in the case of
DUP1
2) Repeat replicate analysis
3) Flag data
Collocated
Samples (C1/C2)
10% of samples annually, if
applicable
≤ ±20% RPD for sample and
collocate values ≥ 10 times the
MDL
1) Flag C2 data if associated
replicate analysis are within
criteria 2) Repeat analysis if replicate
analysis fail
Matrix Spike
(MS) and Matrix
Spike Duplicate
(MSD) for 8x10”
Quart filters only
1 per 20 samples per sample
batch
Recovery 75-125% 1) Flag data if recovery for only
one or two elements fail
criteria, or when a matrix
interference is confirmed by
SRD and/or PDS results
2) Reanalyze
3) Reprepare sample batch if
recovery for most elements fail
criteria or contamination is
evident
Post Digestion
Spike (PDS)
1 per 20 samples, minimum
of 1 per batch
Recovery 75%-125% 1) Flag failed elements for
parent sample and PDS
2) Reprepare PDS if
preparation issue is suspected
reason for failure
Serial Dilution
(SRD)
1 per batch Recovery 90-110% of undiluted
sample if the element
concentration is minimally a
factor of 50 above the MDL in
the original sample
1) Reprepare dilution if
preparation issue is suspected
reason for failure 2) Flag failed analytes
Internal Standards
(ISTD)
Every Calibration, QC and
Field Sample
Recovery 60-125% of the
measured intensity of the
calibration blank
1) If drift suspected, stop
analysis and determine
cause, recalibrate if
necessary
2) Reprepare sample
3) If recovery > 125% due to
inherent ISTD, dilute sample
and reanalyze

Project No. EP-BPA-15-D-0004
Element No. Section 11 – B5
Revision No. 0
Date March 2015
Page 6 of 8
11.2.2 Lead Analysis by XRF
Table 14-1 summarizes the QC measures for elemental analysis by EDXRF.
Two types of EDXRF standards are used for calibration, performance testing, and
auditing: (1) vacuum-deposited thin-film elements and compounds from Micromatter Co. (Deer
Harbor, WA), and (2) polymer films. The vacuum deposit standards cover all elements except
for Ir, Ta, Zr, and Hf (which may be determined by interpolation) and are used as calibration
standards. The polymer film and NIST standards are used as QC standards. During EDXRF
analysis, filters are removed from their Petri slides and loaded into the carousel for entry into the
x-ray analysis chamber.
The vacuum in the x-ray chamber and the heat induced by the absorption of x-rays may
evaporate some materials, such as ammonium nitrate. Two QC standards are run once per day.
Ten percent replicates are also analyzed. When a QC value differs from specifications by ± 10%
or more, or when a replicate value differs from the original value (where values exceed 10 times
the detection limits) by ±10% or more, the previous filters are reanalyzed. If further tests of
standards show that the system calibration has changed by more than ±5%, the instrument is
recalibrated. In addition, DRI will maintain a set of laboratory blanks that will be analyzed
periodically (~1 blank for every 20 filters analyzed) to test for baseline shifts in blank values.
More detailed information on the QC measures for elemental analysis by EDXRF may be
found in DRI SOP #2-209.8, in Appendix B.

Project No. EP-BPA-15-D-0004
Element No. Section 11 – B5
Revision No. 0
Date March 2015
Page 7 of 8
Table 11-3
Summary of Quality Control Procedures for XRF Analysis
Requirement
Frequency
Calibration
Standard
Performed By
Acceptance
Criteria
Corrective Action
Multipoint Calibrations Annually QC standards XRF lab supervisor ± 5% Recalibrate
Minimum Detection Limit
(MDL)
Initially, then
quarterly or after
major instrument
change
Lab blanks XRF lab supervisor,
Project Manager
Within ± 10% of
previous limits
Troubleshoot
instrument and check
filter lots
Lower Quantifiable Limit
(LQL)
Quarterly Field blanks XRF lab supervisor,
Project Manager
Within ± 10% of
previous limits
Troubleshoot
instrument and check
filters
QC Samples
Lab blanks 1/20 samples N/A Analyst Within 3 σ of
MDLs
Check instrument
and filter lots
QC standards Daily Micromatter
thin films
Analyst ± 10% Samples before QC
standard and
previous standards
reanalyzed
NIST-traceable standards Annually Micromatter
thin films
Analyst ± 10% Samples before QC
standard and
previous standards
reanalyzed
Replicates 10% of samples N/A Analyst ± 10% when value
>10*MDL
Reanalysis of
previous samples
Level 1 Review Every sample N/A XRF lab supervisor Per SOP Reanalysis of
problem samples or
flagging per SOP
11.3 Precision
Analytical precision is estimated by repeated analysis of approximately 10 percent of the
samples. The second analysis is performed in the same analytical batch as the first analysis.
Precision estimates are calculated in terms of absolute percent difference. Because the true
concentration of the ambient air sample is unknown, these calculations are relative to the average
sample concentration. The precision criteria for all parameters were listed previously in
Table 4-1.

Project No. EP-BPA-15-D-0004
Element No. Section 11 – B5
Revision No. 0
Date March 2015
Page 8 of 8
Precision is determined as the RPD using the following calculation:
RPD X
1 X
2
X 100
Where:
X1 is the ambient air concentration of a given compound measured in one sample;
X2 is the concentration of the same compound measured during
duplicate/collocate/replicate analysis; and
X is the arithmetic mean of X1 and X2.
11.4 Sensitivity (Method Detection Limits)
MDLs are determined different ways for each analytical system. For the ICP-MS, one
MDL is determined for glass fiber filters, and another for Teflon® filters. The detection limits
for metals by ICP-MS is determined by the FACA(7) method using compiled method blank data.
The XRF MDLs are determined by DRI as three times the standard deviation of laboratory
blanks. They are updated periodically, usually quarterly. The MDLs are shown in Table 11-3
and are based on an average sampling volume of 2000 m3 for the glass fiber filters and 24.04 m3
for the Teflon® filters.
Table 11-4. 2015 Method Detection Limit
Element
47 mm Teflon
8x10" Glass
Fiber Filter
MDL
(ng/m3)
MDL
(ng/m3)
Lead – ICP-MS 0.029 0.089
Lead – XRF 2.0* If only the one condition for Pb is used and the analysis time in increased
by a factor of four, the MDL could become 1.0 ng/m3.
NOTE: For total metals: Assumes total volume of 24.04 m3 for Teflon® filters and 2000 m3 for Glass
Fiber filters.

Project No. EP-BPA-15-D-0004
Element No. Section 12 - B6
Revision No. 0
Date October 2015
Page 1 of 3 SECTION 12
INSTRUMENT/EQUIPMENT TESTING, INSPECTION, AND MAINTENANCE
REQUIREMENTS
To ensure the quality of the analytical equipment, ERG and DRI conduct performance
checks for all equipment used. The laboratories monitor the performance of the analytical
instrumentation to ensure proper operation while maintaining a spare parts inventory to shorten
equipment downtime. Table 12-1 details the maintenance items, how frequently they will be
performed, and who is responsible for performing the maintenance. All checks, testing,
inspections, and maintenance done on each instrument are recorded in the appropriate
Maintenance Logbook or LIMS Instrument Maintenance Logs for each instrument. Following
instrument maintenance, a calibration must be passed to ensure the instrument is performing
properly prior to analyzing samples. Because ERG’s instrument is under full service contracts,
service is rendered swiftly and instrument down time is kept to a minimum. DRI does not have a
full service contract for its XRF instrument but keeps a wide variety of spare parts on hand for
most common maintenance issues and make our own repairs. Historical maintenance on worst
case instrument failure (multiple components), it has taken less than 2 weeks to get parts and
repair and recalibrate the instrument. There is also a mutual aid agreement with UC Davis for
analyzing XRF samples in case of XRF instrument failure.
12.1 ICP-MS
For ICP-MS analysis, preventive maintenance is performed by competent technical
service representatives as needed. ERG personnel perform minor maintenance, such as detector
maintenance, on an as-needed basis. Spare pump tubing, autosampler probes, nebulizers, spray
chambers, torches, and cones should all be kept in reserve in the lab for the ICP-MS. More
procedures, checks, and scheduled maintenance checks are provided in ERG’s SOP ERG-MOR-
084 and -085 for metals analysis by ICP-MS, in Appendix A.

Project No. EP-BPA-15-D-0004
Element No. Section 12 - B6
Revision No. 0
Date October 2015
Page 2 of 3
Table 12-1
Preventive Maintenance in ERG & DRI Laboratories
Item
Maintenance Frequency
Responsible Party
ICP-MS Instrument
Computer Backup
Daily
Manufacturer Service
Contractor/Analyst
Change Roughing Pump Oil Annually
Manufacturer Service
Contractor/Analyst
Chiller Fluid Top-off and
Cleaning As Needed
Manufacturer Service
Contractor/Analyst
Replace Peripump Tubing Daily Analyst
Clean/Replace Sample
Introduction Components As Needed Analyst
Replace Autosampler Housing &
Instrument Air Filters Annually
Manufacturer Service
Contractor/Analyst
XRF Instrument
Run QC standards Daily Analyst
Fill LN2 container Weekly Analyst
Perform detector energy
calibration Weekly after LN2 fill Analyst
Check/fill x-ray tube cooling
water vessel As needed XRF Lab Supervisor
Check/change pump oil As needed XRF Lab Supervisor
Multipoint calibrations
Annually or after certain
equipment replacement or
repair
XRF Lab Supervisor

Project No. EP-BPA-15-D-0004
Element No. Section 12 - B6
Revision No. 0
Date October 2015
Page 3 of 3 12.2 XRF
For XRF analysis, most preventive maintenance is performed by competent analysts
while the multipoint calibration is performed by the XRF Laboratory Supervisor. The instrument
tends to run with minimal maintenance and major components tend to operate for years before
needing replacement. Additional procedures and checks are described in DRI’s SOP #2-209 for
lead analysis by XRF in Appendix B.
Project No. EP-BPA-15-D-0004
Element No. Section 13 - B7
Revision No. 0
Date October 2015
Page 1 of 3
SECTION 13
INSTRUMENT CALIBRATION AND FREQUENCY
Because the requirements for analytical system calibrations differ, the laboratories are
discussed separately in this section. Analytical instruments and equipment are calibrated when
the analysis is set up, when the laboratory takes corrective action, following major instrument
maintenance, or if the continuing calibration acceptance criteria have not been met. Appropriate
standards are prepared by serial dilutions of pure substances, accurately prepared concentrated
solutions. In preparing stock solutions of calibration standards, great care is exercised in
measuring weights and volumes, since analyses following the calibration are based on the
accuracy of the calibration.
DRI’s three types of standards used with the DRI XRF are: (1) elemental thin film
standards from μMatter; (2) multiple element thin film standards from μMatter; and (3) NIST
certified standards. None of these standards require preparation; they are used as received from
the supplier. The μMatter standards are stored in PetriSlides and kept in a cool dark cabinet
when not in use to retard oxidation and loss of volatile elements. NIST standards are stored in
the XRF room in the standards cabinet at ambient conditions. Certificates of elemental
concentrations are provided by the manufacturer and are filed in the XRF lab. The DRI XRF
system is recalibrated approximately every 12 months using the μMatter thin film standards.
Recalibration is also performed whenever the QA standard indicate a drift of >±5% in
calibration. Standards including elements from Na to U are analyzed in standard 47 mm filter
holders under the filter analysis application (Filterxxxyy, where yyy = month and xx = year).
Calibration factors in μg/cm2 per counts per second per milliamp are calculated for each element
using linear regression analysis by the Epsilon 5 software package. The μMatter standards are
accurate to ±5% relative, as stated by the manufacturer. The NIST standards are used to verify
the multipoint calibration that is performed annually or after major component repairs or
replacement.

Project No. EP-BPA-15-D-0004
Element No. Section 13 - B7
Revision No. 0
Date October 2015
Page 2 of 3
Each calibration analysis is stored, electronically and hardcopy, with the samples
analyzed using that calibration. All programs store the calibration information separately with
all pertinent information (raw data, control charts, and/or any summary statistics) together with
the analyzed samples.
13.1 ICP-MS Calibration
Calibration requirements for ICP-MS is shown in Table 13-1.
13.2 XRF Calibration
Calibration requirements for the XRF are also shown in Table 13-1.
Table 13-1
ICP-MS and XRF Analytical Calibration Requirements
Analytical
Parameter
Quality
Parameter
Method of
Determination Frequency
Acceptance
Criteria
ICP-MS Calibration –
Quantitative
Initial analysis of a
calibration blank plus
4 levels of standards
Prior to sample
analysis
Correlation
coefficient ≥ 0.998
& RSD ≤ 10. RSDs
> 10 are acceptable
for the CAL2
standard.
ICV Analysis of a second
source standard
Immediately following
calibration
Recovery 90-110%
ICB Analysis of an ASTM
Type I water acidified
with the same acid
matrix as is present in
the calibration
standards.
Immediately following
the ICV
Absolute value
must be ≤ MDL
HSV Analysis of high
concentration standard
Immediately following
the ICB
Recovery 95-105%
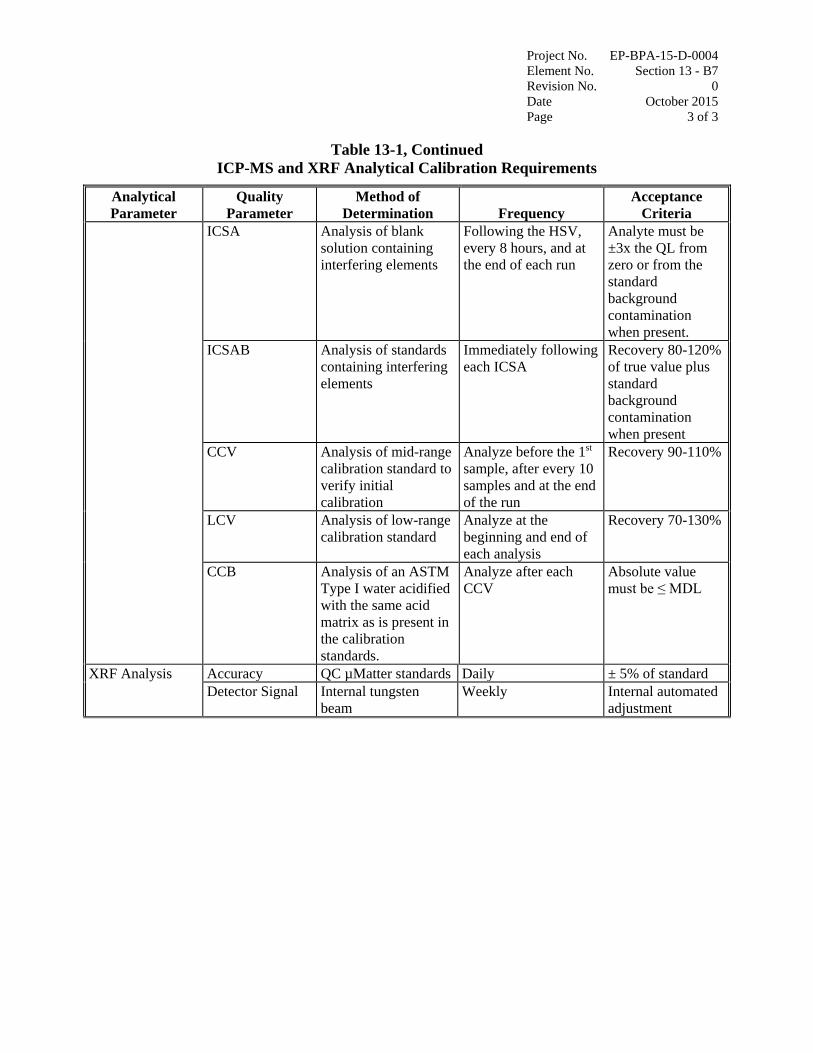
Project No. EP-BPA-15-D-0004
Element No. Section 13 - B7
Revision No. 0
Date October 2015
Page 3 of 3
Table 13-1, Continued
ICP-MS and XRF Analytical Calibration Requirements
Analytical
Parameter
Quality
Parameter
Method of
Determination Frequency
Acceptance
Criteria
ICSA Analysis of blank
solution containing
interfering elements
Following the HSV,
every 8 hours, and at
the end of each run
Analyte must be
±3x the QL from
zero or from the
standard
background
contamination
when present.
ICSAB Analysis of standards
containing interfering
elements
Immediately following
each ICSA
Recovery 80-120%
of true value plus
standard
background
contamination
when present
CCV Analysis of mid-range
calibration standard to
verify initial
calibration
Analyze before the 1st
sample, after every 10
samples and at the end
of the run
Recovery 90-110%
LCV Analysis of low-range
calibration standard
Analyze at the
beginning and end of
each analysis
Recovery 70-130%
CCB Analysis of an ASTM
Type I water acidified
with the same acid
matrix as is present in
the calibration
standards.
Analyze after each
CCV
Absolute value
must be ≤ MDL
XRF Analysis Accuracy QC µMatter standards Daily ± 5% of standard
Detector Signal Internal tungsten
beam
Weekly Internal automated
adjustment
Project No. EP-BPA-15-D-0004
Element No. Section 14 - B8
Revision No. 0
Date October 2015
Page 1 of 3
SECTION 14
INSPECTION/ACCEPTANCE FOR SUPPLIES AND CONSUMABLES
14.1 Purpose
The purpose of this element is to establish and document a system for inspecting and
accepting all supplies and consumables that may directly or indirectly affect the quality of the
data. By having documented inspection and acceptance criteria, consistency of the supplies can
be assured. This section details the supplies/consumables, their acceptance criteria, and the
required documentation for tracing this process.
14.2 Critical Supplies and Consumables
Table 14-1 details the various components for the laboratory operations.
14.3 Acceptance Criteria
Acceptance criteria must be consistent with overall project technical and quality criteria.
It is the laboratory analyst’s responsibility to update the criteria for acceptance of consumables.
As requirements change, so do the acceptance criteria. Observation of damage due to shipping
can only be performed once the equipment has arrived on site.
All supplies and consumables are inspected and either accepted or rejected upon receipt
in the laboratory. The employees who ordered the supply are responsible for verifying that the
order is acceptably delivered, stored and dispersed upon receipt in the laboratory. Some supplies
or consumables listed in Table 14-1 have to be deemed acceptable, through testing or blanking,
such as with the filters used for blank analysis. Any changes in standards and sample media must
meet the acceptance criteria outlined in Section 11 for that particular method. Such testing and
blanking data is kept with the sample data. Staff should not use supplies or consumables of
different model numbers or from different vendors without first discussing it with the Program
Manager and testing the supply or consumable.

Project No. EP-BPA-15-D-0004
Element No. Section 14 - B8
Revision No. 0
Date October 2015
Page 2 of 3
Table 14-1
Critical Field and Laboratory Supplies and Consumables
Area
Item
Description
Vendor
Model
Number
Laboratory Supplies and Consumables (Laboratories listed below)
ICP-MS Argon Coolant Gas Air Gas LARS-65
ICP-MS Helium Collision Gas Air Gas HE R80A
ICP-MS Acid High Purity HNO3
High Purity HCl
High Purity HF
Fisher A497-2
A466-500
A463-250
ICP-MS Inorganic
standards
Individual Metals
Standards
High Purity
Spex
Inorganic
Ventures
Various
ICP-MS Nalgene 60oz.
bottles
Sample containers Fisher 16058-043
ICP-MS Extraction
consumables
Sample Vials
FilterMate Filters
Reflux Caps
Autosampler Vials
SCP Science
Environmental
Express
CPI
010-500-264
SC0408
SC506
P/N 4092-316
ICP-MS Glass Fiber/
Teflon Filters
Filters Whatman
MTL
1822-866
PT47AN
XRF Liquid Nitrogen Detector coolant Air Gas NA
XRF Mylar sheets 2”x 2” 3.6 µm thick Somar
Spectrofilm
3615-33
XRF Tweezers For handling filters Millipore 62-000067
XRF Kimwipes Large & small VWR 34255 &
34155
XRF Methanol (in
squeeze bottle)
Cleaning solvent for
sample holders &
filter loading area
Fisher Scientific
(VWR)
A454-4
(16649-945)
XRF Epsilon 5 XRF
Analysis Logsheet
Analysis Logsheet DRI NA
Project No. EP-BPA-15-D-0004
Element No. Section 14 - B8
Revision No. 0
Date October 2015
Page 3 of 3
Consumables and supplies with special handling and storage needs must be handled and
stored as suggested by the manufacturer. Consumables with expiration dates, such as standards,
must be labeled with a receipt date, date opened, and the initials of the person that opened the
consumable and standard expiration dates must be entered into the standards section of LIMS.
To decrease waste, the oldest supplies or consumables should be used first.
14.4 Tracking and Quality Verification of Supplies and Consumables
Tracking and quality verification of supplies and consumables have two main
components. The first is the need of the end user of the supply or consumable to have an item of
the required quality. The second need is for the purchasing department to accurately track goods
received so that payment or credit of invoices can be approved. In order to address these two
issues, at ERG the following procedures outline the proper tracking and documentation
procedures to follow:
Receiving personnel will perform a rudimentary inspection of the packages as they
are received from the courier or shipping company. Note any obvious problems with
a receiving shipment such as crushed box or wet cardboard.
The package will be opened, inspected, and contents compared against the packing
slip.
If there is a problem with the equipment/supply, note it on the packing list and notify
the Purchasing Agent who will immediately call the vendor.
If the equipment/supplies appear to be complete and in good condition, sign and date
the packing list and give it to the Purchasing Agent so that payment can be made in a
timely manner.
Notify appropriate personnel that equipment/supplies are available. For items such as
filters, it is critical to notify the laboratory manager of the weight room so sufficient
time for processing of the filters can be allowed.
Stock equipment/supplies in appropriate pre-determined area.
Standards and reference materials are purchased from vendors who certify the purity and
traceability of these standards. Certificates of analysis and/or purity are maintained in project
files or in the LIMS standards log.
Project No. EP-BPA-15-D-0004
Element No. Section 15 - B9
Revision No. 0
Date October 2015
Page 1 of 6
SECTION 15
DATA MANAGEMENT
15.1 Data Recording
Data management for sample data is presented in Figure 15-1. The sample data path is
shown from sample origination to data reporting and storage. The LIMS allows the laboratory to
manage and track samples, instrument workflow, and reporting. The LIMS stores the raw
instrument data and performs the conversion calculations to put the data into final reporting
units. These calculations are reviewed and documented annually by ERG’s QA coordinator and
kept in the QA files in Room 102. The main procedures are described in the SOP for the
Laboratory Information Management System (ERG-MOR-099). The main functions of the
LIMS system include, but are not limited to:
Sample login;
Sample scheduling, and tracking;
Sample processing and quality control; and
Sample reporting and data storage.
All LIMS users must be authorized by the LIMS Administrator and permitted specified
privileges. The following privilege levels are defined:
Data Entry Privilege – The individual may see and modify only data within the LIMS
that he or she has personally entered.
Reporting Privilege – Without additional privileges.
Data Administration Privilege – Data Administrators for the database are allowed to
change data as a result of QA screening and related reasons. The Data Administrator
is responsible for performing the following tasks on a regular basis:
– Merging/correcting the duplicate data entry files;
– Running verification/validation routines, correcting data as necessary; and
– Generating summary data reports for management.

Project No. EP-BPA-15-D-0004
Element No. Section 15 - B9
Revision No. 0
Date October 2015
Page 2 of 6
Figure 15-1. Data Management and Sample Flow Diagram
15.2 Data Validation
Data validation is a combination of checking that data processing operations have been
carried out correctly and of monitoring the quality of the field operations. Operations checked
include collection information on COCs, sample receipt entry into LIMS, sample volume entry

Project No. EP-BPA-15-D-0004
Element No. Section 15 - B9
Revision No. 0
Date October 2015
Page 3 of 6
into bench sheets, and upload of data into LIMS. Data validation can identify problems in these
areas. Once problems are identified, the data can be corrected or invalidated, and corrective
actions can be taken for laboratory operations.
15.3 Data Reduction and Transformation
Calculations for transforming raw data from measured units to final concentrations use
standardized procedures listed in the individual ERG or DRI SOPs. The equations for
transforming raw data are set up to automatically calculate to final concentrations in the LIMS
system. The initial units for ICP-MS Pb results are ng/L with final reporting units of µg/filter.
The initial units for XRF Pb results are µg/cm2with the final results in µg/m3. For XRF Pb, the
associated MDLS and uncertainties are reported along with the final concentrations. For ICP-
MS, the associated MDLs are reported along with the final concentrations, and the MDLs are
adjusted for dilution (for ICP-MS) and actual prep volumes before reporting.
The electronic data file is uploaded onto a network server (which is backed-up daily) and
into the LIMS. DRI data files are imported onto the network server. Once the data is in LIMS,
the ERG Task Leader reviews it following the checklists presented in Section 16 using
instrument software and method specific controls set up in LIMS. Ten percent of the total data is
reviewed by the QA Coordinator or designee following the checklist and method specific
acceptance criteria in the summary quality control procedure tables outlined in Section 11. After
the data has successfully completed both reviews and the checklists have been signed, it is
available for reporting by the Program Manager.
The SOP for Project Peer Review uses manual calculations and visual verification to
review all data reported to EPA and State/ local/tribal agencies following guidelines outlined in
SOP ERG-MOR-057 (see Appendix A). SOP for Developing, Documenting, and Evaluating the
Accuracy of Spreadsheet Data, presented in SOP ERG-MOR-017 (see Appendix A), is consulted
in special cases where the calculations are performed via spreadsheets instead of the LIMS
system.

Project No. EP-BPA-15-D-0004
Element No. Section 15 - B9
Revision No. 0
Date October 2015
Page 4 of 6
Reporting formats are designed to fulfill the program requirements and to provide
comprehensive, conventional tables of data. The LIMS data reporting format includes any
required data qualifiers, footnotes, detection limits for each analyte, and appropriate units for all
measurements. The LIMS can produce Adobe and Excel data reports, which is standard for this
program. The report is reviewed by the Program Manager or designee before it is sent to the
client. As mentioned in Section 15.5, a comprehensive annual data report is prepared including
data statistics and characterization.
15.4 Data Transmittal
Data transmittal occurs when data are transferred from one person or location to another
or when data are copied from one form to another. Some examples of data transmittal are
copying raw data from a notebook onto a data entry form for keying into a computer file and
electronic transfer of data over a computer network. Each individual SOP listed in Appendix A
& B discusses the procedures for determining the calculations of concentrations as well as data
entry.
If requested, ERG will report all ambient air quality data and information specified by the
AQS User’s Guide and other documents located at the website
http://www.epa.gov/ttn/airs/airsaqs/manuals/ coded in the AQS format. Such air quality data
and information will be fully screened and validated and will be submitted directly to the AQS
via electronic transmission, in the format of the AQS, and in accordance with the annual
schedule. The SOP for the Preparation of Monitoring Data for AQS Upload is presented in
Appendix A (SOP ERG-MOR-098).
15.5 Data Tracking
The ERG LIMS database contains input functions and reports necessary to track and
account for the status of specific samples and their data during processing operations. The
following input locations are used to track sample and sample data status:

Project No. EP-BPA-15-D-0004
Element No. Section 15 - B9
Revision No. 0
Date October 2015
Page 5 of 6
Sample Control
– Sample collection information (by Work Order);
– Sample receipt/custody information;
– Unique sample number (LIMS ID);
– Storage location;
– Required analyses;
– Project due dates/hold times.
Laboratory
– Batch/bench assignment;
– Sequence assignment;
– Data entry/review;
– Query/update analysis status;
– Standards/calibration information.
15.6 Data Storage and Retrieval
Data archival policies are shown in Table 15-1.
All data are stored on the ERG LIMS server. This system has the following
specifications:
Operating System: Windows 2008 Server
Memory: 6G RAM
Hard Drives: Three drives of 450G each configured as RAID 5;
Network card: Gigabit card (10/100/1000)
Tape Drives for Backup: Two tape drives are daisy chained (Compaq SDLT 600
& HP SureStore DLT 818).
Security: Network login password protection on all workstations; Additional
password protection applied by application software.

Project No. EP-BPA-15-D-0004
Element No. Section 15 - B9
Revision No. 0
Date October 2015
Page 6 of 6
Security of the data in the database is ensured by the following controls:
Password protection on the data base that defines three levels of access to the data;
Regular password changes (quarterly);
Logging of all incoming communication sessions, including the originating
telephone number, the user’s ID, and connect times; and
Storage of media, including backup tapes, in an alternate location that is at a
locked, restricted access area.
Table 15-1. Data Archive Policies
Data Type Medium Location Retention Time Final Disposition
Laboratory
notebooks
Hardcopy Laboratory 5 years after close
of contract
N/A
LIMS Database Electronic (on-
line)
Laboratory Backup media
after 5 years
Backup tapes
retained
indefinitely

Project No. EP-BPA-15-D-0004
Element No. Section 16 – C1
Revision No. 0
Date October 2015
Page 1 of 8 ASSESSMENT/OVERSIGHT
SECTION 16
ASSESSMENTS AND RESPONSE ACTIONS
An assessment is defined as an evaluation process used to measure the performance or
effectiveness of the quality system or the establishment of the monitoring network and sites and
various measurement phases of the data operation.
The results of QA assessments indicate whether the control efforts are adequate or need
to be improved. Documentation of all QA and QC efforts implemented during the data
collection, analysis, and reporting phases are important to data users, who can then consider the
impact of these control efforts on the data quality. Both qualitative and quantitative assessments
of the effectiveness of these control efforts will identify those areas most likely to impact the
data quality. ERG will perform the following assessments in order to ensure the adequate
performance of the quality system.
The Response/CAR will be filed whenever a problem is found such as an operational
problem, or a failure to comply with procedures that affects the quality of the data. A CAR is an
important ongoing report to management because it documents primary QA activities and
provides valuable records of QA activities. A CAR can be originated by anyone on the project,
but must be sent to the Program QA Coordinator and Program Manager. Any problem that
affects the quality of the overall program will be discussed with the EPA.
On the numbered CAR, the description of the problem, the cause of the problem, the
corrective action, and the follow-up are documented. The follow-up assists the QA coordinator
in determining if the corrective action was successful and if it was handled in a timely manner.
ERG’s CAR is recorded on a three-part form, the white copy goes into the project file, the
yellow copy goes into the QA file (Room 102), and the pink copy goes to the facilitator. A copy
of the ERG CAR Form is shown in Figure 16-1.

Project No. EP-BPA-15-D-0004
Element No. Section 16 – C1
Revision No. 0
Date October 2015
Page 2 of 8
Figure 16-1. ERG Corrective Action Report Form

Project No. EP-BPA-15-D-0004
Element No. Section 16 – C1
Revision No. 0
Date October 2015
Page 3 of 8
DRI’s process for dealing with corrective actions is governed by DRI SOP for Corrective
actions, DRI SOP #6-017, and its CAR is shown in Figure 16-2.
Figure 16-2. DRI Corrective Action Report Form
EAF CORRECTIVE ACTION REQUEST
CAR No. Date
To
From
How Identified
Reported (Nonconformance) Conditions
Answer Due Date Signature
Root Cause
Corrective Action (Give Steps & Expected Completion Dates)
Preventive Action
Completed by Date
Accepted by Date
Follow-up Results
Performed by Date
Closed Out (Y/N) If not closed out on follow-up, issue a new CAR
New CAR No. Date

Project No. EP-BPA-15-D-0004
Element No. Section 16 - C1
Revision No. 0
Date October 2015
Page 4 of 8
Each recommendation addresses a specific problem or deficiency and requires a written
response from the responsible party. Each also requires the Program QA Coordinator to verify
that the corrective action has been implemented. A summary of the past years’ CARs are
discussed during the annual QA Management Systems Review.
The following actions are taken by the laboratory QA Coordinator and Program Manager
when any aspect of the testing work, or the results of this work, does not conform to the
requirements of the quality system or testing methods:
Identify nonconforming work and take actions such as the halting of work, the
withholding of test reports;
Evaluate of the impact of nonconforming work on quality and operations;
Take remedial action and make decision about the acceptability of the nonconforming
work (resample, use as is with qualification, unable to use);
Notify the client, and if necessary, recall the work; and authorize the resumption of
work.
ERG and DRI are responsible for implementing the analytical phase of this program and
are not responsible for the overall DQOs. Therefore, this QAPP tries to ensure that analytical
results are of adequate quality to ensure the achievement of the various program DQOs.
16.1 Assessment Activities and Project Planning
16.1.1 External Technical Systems and Data Quality Audits
A Technical Systems Audit (TSA) is a thorough and systematic on-site qualitative audit,
where facilities, equipment, personnel, training, procedures, subcontractor systems, and record
keeping are examined for conformance to the QAPP. The TSAs will be performed by EPA or its
designee at the ERG Laboratory. The TSAs of the contract are conducted approximately every
five years. The EPA QA Office will implement the TSA either as a team or as an individual
Project No. EP-BPA-15-D-0004
Element No. Section 16 - C1
Revision No. 0
Date October 2015
Page 5 of 8
auditor. ERG will participate in any data quality audits by EPA or designee at the discretion of
the EPA QA Coordinator.
The EPA audit team will prepare a brief written summary of findings for the Program
Manager and Program QA Coordinator. Problems with specific areas will be discussed and an
attempt made to rank them in order of their potential impact on data quality. ERG will work
with EPA to solve required corrective actions. As part of corrective action and follow-up, an
audit finding response letter will be generated by the Program Manager and Program QA
Coordinator. The audit finding response letter will address what actions are being implemented
to correct the finding(s) of the TSA. This summary from EPA and the following response from
ERG are filed in the QA/QC file in Room 102. The findings and the follow-up corrective actions
are discussed in the annual QA Management Systems Review.
As part of ongoing National Environmental Laboratory Accreditation Conference
(NELAC) certification, TSAs are performed at ERG by Florida Department of Health or
designee every two years. A summary of findings is sent to ERG, specifically the QA
Coordinator. The QA Coordinator sends its response of corrective actions which is either
accepted or denied by Florida Department of Health. This documentation is stored in the
QA/QC file in Room 102. The findings and the follow-up corrective actions are discussed in the
annual QA Management Systems Review.
As a contractor laboratory performing analyses for EPA’s PM2.5 CSN, DRI has external
TSAs performed roughly every three years by an audit team from EPA’s National Air and
Radiation Environmental Laboratory (NAREL). In addition, as part of its NELAP accreditation
program through the Texas Commission on Environmental Quality (TCEQ), the EAF is audited
roughly every three years by a TCEQ contractor.

Project No. EP-BPA-15-D-0004
Element No. Section 16 - C1
Revision No. 0
Date October 2015
Page 6 of 8
16.1.2 Internal Technical Systems Audits
At ERG, an internal TSA is performed examining facilities, equipment, personnel,
training, procedures, and record keeping for conformance to the individual SOPs and this QAPP.
The TSAs will be performed by the Program QA Coordinator and will be conducted at least once
per year. The checklists for the internal TSAs are based on the NATTS TSA or National
Environmental Laboratory Accreditation Program (NELAP) checklists with additional areas
addressing the individual SOPs and this QAPP. The content of the checklists vary episode to
episode to ensure comprehensive in-depth coverage of procedures over time. Such elements will
be included in the checklists:
Criteria listed in Section 11 of this QAPP
SOP specifications
Method specifications
Supporting equipment specifications
Other laboratory wide QA systems in place (ex. Satellite SOP notebooks)
The Program QA Coordinator will report internal audit findings to the Program Manager
within 30 days of completion of the internal audit in the form of a report. The EPA Delivery
Order Manager will be informed if issues from the internal audit impact the quality of this
program. The report is filed in the QA/QC file in Room 102. All corrective actions are
addressed and implemented as soon as they are determined. The findings and the follow-up
corrective actions are discussed in the annual QA Management Systems Review to assess
effectiveness of the corrective actions.
At DRI, internal audits are conducted by the EAF QA Manager using the procedures
contained in DRI SOP for General EAF Internal Audit Procedures, DRI SOP #4-117.1. The
checklists for the internal TSAs are based on the EPA CSN TSA and NELAP checklists with
additional areas addressing the individual SOPs, this QAPP, and the QAPPs for other projects.

Project No. EP-BPA-15-D-0004
Element No. Section 16 - C1
Revision No. 0
Date October 2015
Page 7 of 8
16.1.3 Proficiency Testing
The PT is an assessment tool for the laboratory operations. Routine ‘blind’ samples (Pb
Test strips/filters) are sent to the laboratory, where they follow the normal handling routines that
any other sample follows. The results are sent to the Program Manager and Program QA
Coordinator for final review and reporting to the auditing agency. The auditing agency prepares
a PT report and sends a copy of the results to the Program Manager, Program QA Coordinator,
and the EPA QA Office(s). Any results outside the acceptance criteria are noted in the PT
report. Repeated analyte failures are investigated to determine the root cause and documented on
a CAR. The PT reports are filed in the QA/QC file in Room 102. The performance on these
audits is discussed in the annual QA Management Systems Review.
As a CSN contractor laboratory, DRI receives annual XRF PE samples from
NAREL. However, these are ambient PM2.5 samples (of different sampling durations) and the
XRF analysis is not exclusively for Pb. Pb one of several elements typically used for the annual
inter-comparison. The results of these intercomparisons may be found at:
http://www3.epa.gov/ttn/amtic/pmspec.html.
16.2 Documentation of Assessments
16.2.1 TSA, Data Quality Audit, and PT Documentation
All reports from EPA or designated contractors regarding ERG’s performance on TSAs,
Data Quality Audits, and PTs are filed in the QA/QC file in Room 102. PT reports are dispersed
and discussed with contributing staff.
Reports from internal TSAs are prepared and discussed with the Program Manager, and
filed in the QA/QC file in Room 102. A similar procedure is used by DRI for internal TSAs,
external TSAs, and PE results and intercomparisons.
Project No. EP-BPA-15-D-0004
Element No. Section 16 - C1
Revision No. 0
Date October 2015
Page 8 of 8
16.2.2 Internal Data Review Documentation at ERG
Internal data review is performed on 100 percent of the data by the Task Leader and 10
percent of the data by the Program QA Coordinator or designee against the criteria in the
individual SOPs and this QAPP prior to being reported each month. The assessment is
documented on the data review checklist, which is returned to the Task Leader for minor
correction action and inclusion in the data package. The checklists used for analyses are shown
in their respective SOPs (Appendix A) as follows:
Lead by ICP-MS – ERG-MOR-084, SOP for the Preparation and Analysis of High
Volume Quartz Filters for Metals by ICP-MS using Method IO 3.5 and FEM Method
EQL-0512-201 and ERG-MOR-085, SOP for the Preparation and Analysis of 47mm
Filters for Metals by ICP-MS using Method IO 3.5 and FEM Method EQL-0512-202.
During the internal data review, major QC problems identified are brought to the attention of the
Program Manager and are documented on a CAR. The final project report also addresses QA
considerations for the whole project.
16.2.3 Internal Data Review Documentation at DRI
The procedures used at DRI are similar to those used by ERG. The SOP used for these
analysis are presented in Appendix B.
Lead by XRF – DRI SOP #2-209.8, X-Ray Fluoresence (XRF) Analysis of Aerosol
Filter Samples (PANalytical Epsilon 5), IO 3.3, and 40 CFR Part 50, Appendix Q.

Project No. EP-BPA-15-D-0004
Element No. Section 17 - C2
Revision No. 0
Date October 2015
Page 1 of 2
SECTION 17
REPORTS TO MANAGEMENT
This section describes the quality-related reports and communications to management
necessary to support monitoring network operations and the associated data acquisition,
validation, assessment, and reporting. Important benefits of regular monthly reports to EPA
provide the opportunity to alert EPA to data quality problems, to propose viable solutions to
problems, and to procure necessary additional resources.
Effective communication among all personnel is an integral part of a quality system.
Regular, planned quality reporting provides a means for tracking the following:
Adherence to scheduled delivery of data and reports;
Documentation of deviations from approved QA and test plans, and the impact of
these deviations on data quality; and
Analysis of the potential uncertainties in decisions based on the data.
Frequency, content and distribution of reports for monitoring are shown below.
17.1 Data Reports
Analytical data reports prepared by the Program Manager are sent to EPA, State, Local
and Tribal agencies within 30 days after the samples are received at ERG’s laboratory. These
reports include the monthly analytical data for each sample collected includes sample results,
sample information (sample information, sample volume, etc.) and a QA data.
17.2 Internal Technical System Audit Reports
The Program QA Coordinator or designee performs an internal technical system audit at
least once a year. The findings are listed in reports which are presented to the Program Manager

Project No. EP-BPA-15-D-0004
Element No. Section 17 - C2
Revision No. 0
Date October 2015
Page 2 of 2
and filed in the QA/QC storage file cabinet located in Room 102. These reports are available to
EPA personnel during their TSA. More detail on internal TSAs is provided in Section 16.

Project No. EP-BPA-15-D-0004
Element No. Section 18 - D1
Revision No. 0
Date October 2015
Page 1 of 9
DATA VALIDATION AND USABILITY
SECTION 18
DATA REVIEW AND VERIFICATION
Data verification is a two-stage process to determine if the sampling and analytical data
collection process is complete, consistent with the DQOs discussed in this QAPP and associated
SOPs, and meets the program requirements. First the data is reviewed for completeness,
accuracy, and acceptability. Then the data is verified to meet the quality requirements of the
program.
18.1 Data Review Design
Information used to verify air toxics data, includes:
Sample COCs, holding times, preservation methods.
Multi-point calibrations – the multipoint calibrations are used to establish proper
initial calibration and can be used to show changes in instrument response.
Standards – certifications, identification, expiration dates.
Instrument logs – all activities and samples analyzed are entered into the LIMS logs
(batches, sequences, etc.) to track the samples throughout the measurements
procedures.
Supporting equipment – identification, certifications, calibration, if needed.
Blank, CCVs, replicate and spike results – these QC indicators can be used to
ascertain whether sample handling or analysis is causing bias in the data set.
Review Checklists – these record monthly data quality review performed on all data
by Task Leader and on 10 percent of the data by the QA Coordinator or designee.
Data is reviewed using the checklists derived from the SOPs and this QAPP.
Summary Reports – data reports present the data to the EPA and respective
State/local/tribal representatives including data qualifiers.

Project No. EP-BPA-15-D-0004
Element No. Section 18 - D1
Revision No. 0
Date October 2015
Page 2 of 9
The reliability and acceptability of environmental analytical information depends on the
rigorous completion of all the requirements outlined in the QA/QC protocol. During data
analysis and validation, data are filtered and accepted or rejected based on the set of QC criteria
listed in the individual SOPs included in Appendix A (ERG) and B (DRI).
The data are critically reviewed to locate and isolate spurious values. A spurious value,
when located, is not immediately rejected. All questionable data, whether rejected or not, are
maintained along with rejection criteria and any possible explanation. Such a detailed approach
can be time-consuming but can also be helpful in identifying sources of error and, in the long
run, save time by reducing the number of outliers.
18.2 Data Verification
Data verification confirms by examination that specified requirements have been
fulfilled. The specific requirements are QC checks, acceptable data entry limits, etc. as presented
in Section 4 and Section 11. The analytical procedures performed during the monitoring program
will be checked against those described in the QAPP and the SOPs included in Appendix A
(ERG) and B (DRI). Deviations from the QAPP will be classified as acceptable or unacceptable,
and critical or noncritical. During review and assessment, qualifiers will be applied to the data as
needed; data found to have critical flaws (such as low spike or surrogate recoveries,
contaminated blanks, etc.) will be invalidated and a CAR filled out and implemented, if needed.
All of the data management guidelines followed for this contract are presented in Section 15.
18.3 Data Review
The chain of custody forms are checked to ensure accurate transcription. The results are
double-checked by the Task Lead and a 10% check is performed by the QA Coordinator. The
collected data are reviewed by the Analyst and the Task Leader. The data are scrutinized daily to
eliminate the collection of invalid data. Invalid samples are discussed in more detail in Section
9.2. The analyst records any unusual circumstances during analysis (e.g., power loss or
Project No. EP-BPA-15-D-0004
Element No. Section 18 - D1
Revision No. 0
Date October 2015
Page 3 of 9
fluctuations, temporary leaks or adjustments, operator error) on the LIMS bench sheet and
notifies the analytical Task Leader.
QC samples and procedures performed during the monitoring program will be checked
against those described in Section 4 of the QAPP. If QC is found unacceptable by these criteria,
corrective actions described in the same section are implemented. Prior to reporting, 100 percent
of the data is reviewed by the Task Leader. To verify accuracy, at least 10 percent of the
database is checked by the QA Coordinator or designated reviewer. Items checked include
original data sheets, checks of all calculations (from calibration to sample analysis), and data
transfers. As the data are checked, corrections are made to the database as errors or omissions
are encountered. If major errors are found, all of the data is checked to verify data quality. The
Program Manager reviews all of the data before it is reported to EPA or the State/local/tribal
agencies.
18.4 Data Reduction, Validation, and Reporting
Data validation is confirmed by examination of objective evidence that the particular
requirements for a specific intended use are fulfilled. Intended use deals with data of
acceptable quality to permit making decisions at the correct level of confidence. This section
outlines data validation and usability requirements.
All samples received are given a LIMS ID number that corresponds to that sample’s
information. An analysis logbook is maintained to detail pertinent sample information at the
time of analysis. Entries include site code, sample date, analysis date, LIMS ID, and electronic
file names. Electronic copies of the data are stored on the ERG LIMS server.
Data summaries are distributed to the participating EPA technical staff, administrators,
and to the administrators of the State/local/tribal agencies involved in the study. Each report is
prepared within 30 days from receipt of the samples at ERG’s laboratory. Cumulative listings are
periodically generated upon request. Any changes made in the data as a result of subsequent
Project No. EP-BPA-15-D-0004
Element No. Section 18 - D1
Revision No. 0
Date October 2015
Page 4 of 9
data validation processes performed by EPA and/or State/local/tribal agencies are noted in the
cumulative project data summaries for each specific sampling site. The data summaries include:
Site code;
Sample identifications;
Sample dates;
Target compound list;
Final concentrations; and
Method detection limits.
Data summaries are emailed to the program participants. The Program Manager reviews
all data before they are reported to EPA and/or the State/local/tribal agencies.
18.5 Air Quality System
ERG can submit the data collected for the Lead Analysis to the AQS database if
requested by the sites. This data can be either submitted by ERG or by the State, Local or Tribal
Agency.
Prior to ERG's submittal of data to AQS, the State/local/tribal agency would have to
submit, at a minimum, Basic Site Information transactions (Type AA) for each sampling site,
and Site Street Information (Type AB) and Site Open Path Information (Type AC), if necessary.
ERG then submits monitor transactions to prepare the AQS database for data upload. Data that
are uploaded into AQS include Raw Data (RD) transactions, QA transactions and Raw Blank
(RB) transactions.
The submittal process involves the following steps:
The raw data are formatted into pipe-delimited ( | ) coding that is accepted by the
AQS. Raw data, data generated by single sample episodes, by the primary sample

Project No. EP-BPA-15-D-0004
Element No. Section 18 - D1
Revision No. 0
Date October 2015
Page 5 of 9
(D1) of a duplicate episode, or by collocates (C1 and C2) are submitted using RD
transactions. Precision data, data generated by duplicate and replicate samples (R1,
D2, and/or R2) are submitted using QA transactions, specifically duplicate and
replicate transactions. Accuracy data, generated for lead-FEM audit results, are
submitted using Pb Analysis Audit transactions.
The RD, QA (specifically duplicate, replicate and Pb Analysis Audit), and RB coding
is generated and reviewed following guidelines listed in the SOP for the Preparation
of Monitoring Data for AQS Upload (ERG-MOR-098) to ensure that the proper
monitor ID (including state, county, site, parameter, and Parameter Occurrence Code
[POC] codes), sampling interval, units, method, sample date, start hour, and sample
values are correct. The transactions are stored as text files for upload into the AQS
database.
The transaction files are loaded under the appropriate screening group.
The transactions are edited to remove any errors found by AQS and then are
resubmitted. This step is repeated until the transactions are free of errors.
AQS performs a statistical check on the data submitted to validate the data and
determine if there are any outliers based on past data.
The data transactions are then posted into the AQS database.
18.5.1 AQS Flagging and Reporting
Air toxics data submittals may be submitted with flags to indicate additional information
related to the sample. There are two qualifier flag types that may be applied: Null codes and
Qualifier codes.
Null Code — assigned when a scheduled sample is not usable (e.g., damaged filter,
improper sampling time, etc.).
Qualifier Code — used to note a procedural or quality assurance issue that could
possibly affect the uncertainty or concentration of the value.
Qualifier Codes can be used in combination, with up to 10 possible codes applied. If a
Null code is used, no other flag should be used since no results are reported. Table 18-1 presents
the Qualifier codes and Table 18-2 presents the Null codes available to AQS users. These flags

Project No. EP-BPA-15-D-0004
Element No. Section 18 - D1
Revision No. 0
Date October 2015
Page 6 of 9
are applicable to the various steps of sample collection and analysis such as field operations,
chain of custody, and laboratory operations.
Blank issue flags are qualifier flags used if reported blank values are above the limits set
by the method SOPs or QAPP. If high blank values are associated with samples, the sample
values are reported but appropriately flagged. Samples will not be invalidated due to high blank
values. Blank issue flags are included in Table 18-1.
Table 18-1
Qualifier Codes
Qualifier Code Qualifier Description
1 Deviation from a CFR/Critical Criteria Requirement
2 Operational Deviation
3 Field Issue
4 Lab Issue
5 Outlier
6 QAPP Issue
7 Below Lowest Calibration Level
9 Negative value detected - zero reported
CB Values have been Blank Corrected
CC Clean Canister Residue
CL Surrogate Recoveries Outside Control Limits
DI Sample was diluted for analysis
EH Estimated; Exceeds Upper Range
FB Field Blank Value Above Acceptable Limit
HT Sample pick-up hold time exceeded; data questionable
IA African Dust
IB Asian Dust
IC Chemical Spills & Industrial Accidents
ID Cleanup After a Major Disaster
IE Demolition
IF Fire - Canadian
IG Fire - Mexico/Central America
IH Fireworks
II High Pollen Count
IJ High Winds
IK Infrequent Large Gatherings
IL Other
IM Prescribed Fire
IN Seismic Activity
IO Stratospheric Ozone Intrusion
IP Structural Fire

Project No. EP-BPA-15-D-0004
Element No. Section 18 - D1
Revision No. 0
Date October 2015
Page 7 of 9
Table 18-1, Continued
Qualifier Codes
Qualifier Code Qualifier Description
IQ Terrorist Act
IR Unique Traffic Disruption
IS Volcanic Eruptions
IT Wildfire-U. S.
J Construction
LB Lab blank value above acceptable limit
LJ Identification Of Analyte Is Acceptable; Reported Value Is An Estimate
LK Analyte Identified; Reported Value May Be Biased High
LL Analyte Identified; Reported Value May Be Biased Low
MD Value less than MDL
MS Value reported is ½ MDL substituted
MX Matrix Effect
ND No Value Detected
NS Influenced by nearby source
QX Analyte does not meet QC criteria
SQ Values Between SQL and MDL
SS Value substituted from secondary monitor
SX Does Not Meet Siting Criteria
TB Trip Blank Value Above Acceptable Limit
TT Transport Temperature is Out of Specs
V Validated Value
VB Value below normal; no reason to invalidate
W Flow Rate Average out of Spec.
X Filter Temperature Difference out of Spec.
Y Elapsed Sample Time out of Spec.
Table 18-2
Null Codes
Null Code Qualifier Description
AA Sample Pressure out of Limits
AB Technician Unavailable
AC Construction/Repairs in Area
AD Shelter Storm Damage
AE Shelter Temperature Outside Limits
AF Scheduled but not Collected
AG Sample Time out of Limits
AH Sample Flow Rate out of Limits
AI Insufficient Data (cannot calculate)
AJ Filter Damage
AK Filter Leak
AL Voided by Operator
AM Miscellaneous Void

Project No. EP-BPA-15-D-0004
Element No. Section 18 - D1
Revision No. 0
Date October 2015
Page 8 of 9
Table 18-2, Continued
Null Codes
Null Code Qualifier Description
AN Machine Malfunction
AO Bad Weather
AP Vandalism
AQ Collection Error
AR Lab Error
AS Poor Quality Assurance Results
AT Calibration
AU Monitoring Waived
AV Power Failure
AW Wildlife Damage
AX Precision Check
AY Q C Control Points (zero/span)
AZ Q C Audit
BA Maintenance/Routine Repairs
BB Unable to Reach Site
BC Multi-point Calibration
BD Auto Calibration
BE Building/Site Repair
BF Precision/Zero/Span
BG Missing ozone data not likely to exceed level of standard
BH Interference/co-elution/misidentification
BI Lost or damaged in transit
BJ Operator Error
BK Site computer/data logger down
BL QA Audit
BM Accuracy check
BN Sample Value Exceeds Media Limit
BR Sample Value Below Acceptable Range
CS Laboratory Calibration Standard
DA Aberrant Data (Corrupt Files, Aberrant Chromatography, Spikes, Shifts)
DL Detection Limit Analyses
FI Filter Inspection Flag
MB Method Blank (Analytical)
MC Module End Cap Missing
SA Storm Approaching
SC Sampler Contamination
ST Calibration Verification Standard
TC Component Check & Retention Time Standard
TS Holding Time Or Transport Temperature Is Out Of Specs.
XX Experimental Data

Project No. EP-BPA-15-D-0004
Element No. Section 18 - D1
Revision No. 0
Date October 2015
Page 9 of 9
ERG submits data to AQS using qualifier flags to show where the data are with respect to
the detection level. A variety of terms and acronyms are used for defining the lowest level that
can be detected for each analytical method. These terms and applications are presented below:
Quantitation Limits (QL) — the lowest level at which the entire analytical system
must provide a recognizable signal and acceptable calibration point for the analyte.
Detection Limits (DL) — the minimum concentration of an analyte that can be
measured above instrument background.
MDL — the minimum concentration of a substance that can be measured and
reported with 99 percent confidence that the analyte concentration is greater than zero
and is determined from analysis of a sample in a given matrix containing the analyte
(Part 136, App. B).
SQL — the lowest concentration of an analyte reliably measured within specified
limits of precision and accuracy during routine laboratory operating conditions.
Normally, the SQL is determined as a multiplier of the method detection limit
(e.g., 3.18 times) and is considered the lowest concentration that can be accurately
measured, as opposed to just detected.
The qualifier flags associated with quantitation and detection limits are also included in
Table 18-1, while Table 18-3 summarizes how they are applied to the data. ERG and DRI
MDLs will be uploaded into AQS to provide an accurate representation of the data.
Table 18-3
Summary of Quantitation and Detection Limit Flags and Applications
If Concentration is:
Value to
Report Flag Applied
> SQL Value None
> MDL ≤ SQL Value SQ
≤ MDL Value MD
Not Detected 0 ND
Project No. EP-BPA-15-D-0004
Element No. Section 19 - D2
Revision No. 0
Date October 2015
Page 1 of 2
SECTION 19
DATA VALIDATION, VERIFICATION AND ANALYSIS
Many of the processes for verifying and validating the measurement phases of the data
collection operation have previously been discussed in Section 18. If these processes as written
in the QAPP are followed, and the sites are representative of the boundary conditions for which
they were selected, one would expect to achieve the DQOs. However, exceptional field events
may occur, and field and laboratory activities may negatively affect the integrity of samples. In
addition, it is expected that some of the QC checks will fail to meet the acceptance criteria. This
section will outline how ERG will take the data to a higher level of quality analysis by
performing software tests, plotting, and other methods of analysis.
19.1 Process for Validating and Verifying Data
19.1.1 Verification of Data
For the analytical data, the entries are reviewed to reduce the possibility of entry and
transcription errors. Once the data are transferred to the ERG LIMS database, the data will be
reviewed for routine data outliers and data outside acceptance criteria. These data will be
flagged appropriately. All flagged data will be “re-verified” to ensure that the values are entered
correctly.
19.1.2 Validation
Records of all samples will be retained on file for 5 years, valid or invalid. Information
will include a brief summary of why the sample was invalidated along with the associated flags.
This record will be available on a network server. When the laboratory analyst reviews the COC
forms, he/she will look for possible problems. Filters that have flags related to obvious
contamination, filter damage, or field accidents will be examined immediately. Upon
concurrence of the associated laboratory analyst and the Program Manager, these samples will be
invalidated.

Project No. EP-BPA-15-D-0004
Element No. Section 19 - D2
Revision No. 0
Date October 2015
Page 2 of 2
19.2 Data Analysis
Data analysis refers to the process of interpreting the data that are collected. This section
will describe how the laboratories will begin to analyze the data to ascertain what the data
illustrate and how the data should be applied. The analyst should note any data that needs flags
(dilutions, collocate/replicate precision agreement). This is verified by the Task Leader, QA
Coordinator, and the Program Manager. The Program Manager has the ultimate authority to
invalidate any sample, given acceptable reasons.
19.2.1 Analytical Tests
ERG will employ software programs, described below, to help analyze the data.
Spreadsheet – Select ERG employees perform analysis on the data sets using Excel®
spreadsheets (analysts, Task Leaders, and QA reviewers) and Access® databases (AQS data
entry). Spreadsheets and databases allow the user to input data and statistically analyze, graph
linear data. This type of analysis will allow the user to see if there are any variations in the data
sets. In addition, various statistical tests such as tests for linearity, slope, intercept or correlation
coefficient can be generated between two strings of data. Time series plots and control charts
can help identify the following trends:
Large jumps or dips in concentrations;
Periodicity of peaks within a month or quarter; and
Expected or unexpected relationships among species.
Project No. EP-BPA-15-D-0004
Element No. Section 20 - D3
Revision No. 0
Date October 2015
Page 1 of 1
SECTION 20
RECONCILIATION WITH DATA QUALITY OBJECTIVES
The project management team, QA Coordinator, and sampling and analytical team
members are responsible for ensuring that all measurement procedures are followed as specified
and that measurements data meet the prescribed acceptance criteria. Prompt action is taken to
correct any problem that may arise.
20.1 Conduct Preliminary Data Review
A preliminary data review will be performed as discussed in Section 16 to uncover
potential limitations to using the data, to reveal outliers, and generally to explore the basic
structure of the data. The first step is to review the quality assurance reports. The second step is
to calculate basic summary statistics, generate graphical presentations of the data, and review
these summary statistics and graphs.
ERG will review all relevant quality assurance reports, internal and external, that describe
the data collection and reporting process. Particular attention will be directed to looking for
anomalies in recorded data, missing values, and any deviations from standard operating
procedures in a qualitative review.
20.2 Draw Conclusions from the Data
If the sampling design and statistical tests conducted during the final reporting process
show results that meet acceptance criteria, it can be assumed that the network design and the
uncertainty of the data are acceptable.

Project No. EP-BPA-15-D-0004
Revision No. 0
Date October 2015
Page 1 of 1
SECTION 21
REFERENCES
1. U.S. Environmental Protection Agency. Federal Register Volume 73, Number 219, (73
FR 66964). National Ambient Air Quality Standards for Lead; Final Rule. Rules and
Regulations, November 12, 2008.
Can be found at: http://www.gpo.gov/fdsys/pkg/FR-2008-11-12/html/E8-25654.htm
2. U.S. Environmental Protection Agency. Code of Federal Regulations. Title 40 CFR Part
50, Appendix Q. Reference Method for the Determination of Lead in Particulate Matter
as PM10 Collected from Ambient Air. Office of the Federal Register, November 12,
2008.
Can be found at: http://www.ecfr.gov/cgi-bin/text-
idx?SID=2c090408f6dc7f96eeb9e53b4acc8481&mc=true&node=ap40.2.50_118.q&rgn=
div9
3. U.S. Environmental Protection Agency. Standard Operating Procedure for Determination
of Lead in TSP by Inductively Coupled Plasma Mass Spectrometry (ICP-MS) with Hot
Block Dilute Acid and Hydrogen Peroxide, Method EQL-0512-201.
Can be found at: http://www3.epa.gov/ttn/amtic/files/ambient/pb/EQL-0512-201.pdf
4. U.S. Environmental Protection Agency. Standard Operating Procedure for the
Determination of Lead in PM10 by Inductively Coupled Plasma Mass Spectrometry
(ICP-MS) with Hot Block Dilute Acid and Hydrogen Peroxide Filter Extraction, Method
EQL-0512-202.
Can be found at: http://www3.epa.gov/ttn/amtic/files/ambient/pb/EQL-0512-202.pdf
5. U.S. Environmental Protection Agency. Code of Federal Regulations. Title 40 CFR Part
50, Appendix B. Reference Method for the Determination of Suspended Particulate
Matter in the Atmosphere (High-Volume Method). Office of the Federal Register, April
22, 1983.
Can be found at: http://www.ecfr.gov/cgi-bin/text-
idx?SID=2c090408f6dc7f96eeb9e53b4acc8481&mc=true&node=ap40.2.50_118.b&rgn=
div9
6. U.S. Environmental Protection Agency. Code of Federal Regulations. Title 40 CFR Part
50, Appendix O. Reference Method for the Determination of Coarse Particulate Matter as
PM10-2.5 in the Atmosphere. Office of the Federal Register, October 17, 2006.
Can be found at: http://www.ecfr.gov/cgi-bin/text-
idx?SID=2c090408f6dc7f96eeb9e53b4acc8481&mc=true&node=ap40.2.50_118.o&rgn=
div9
7. U.S. Environmental Protection Agency. Federal Advisory Committee Act (FACA).
Can be found at: http://www.epa.gov/waterscience/methods/det/

Appendix A
ERG Standard Operating Procedures
UNCONTROLLED ELECTRONIC COPY EFFECTIVE 5-2015

CONFIDENTIAL Standard Operating Procedure Procedure Number: ERG-MOR-017 Revision Number: 2 Revision Date: May 12, 2015 Page: 2 of 9 5.0 METHOD SUMMARY
To ensure the quality of data delivered to client in the form of a spreadsheet, the developer must consider multiple components of the spreadsheet, including the data, calculations, and presentation of the spreadsheet. The data, subsequent calculations and assumptions must be reviewed by another project team member before the spreadsheet can be finalized and sent to the client.
6.0 DEFINITIONS
Spreadsheet – An electronic table that is used to process or present data. A spreadsheet can be used to store and manipulate data, as well as present data in report-quality, tabular format. Spreadsheet Developer (Developer) – The person responsible for the overall accuracy and quality of a spreadsheet. The Developer ensures that data are entered correctly and that mathematical functions are accurately executed. Reviewer – The person not associated with the development of the spreadsheet that verifies the accuracy, completeness, and reasonableness of the data in the spreadsheet.
7.0 INTERFERENCES
NA 8.0 SAFETY
NA 9.0 EQUIPMENT AND SUPPLIES
NA 10.0 MATERIALS
NA 11.0 CHEMICALS, REAGENTS, AND STANDARDS
NA
UNCONTROLLED ELECTRONIC COPY EFFECTIVE 5-2015

CONFIDENTIAL Standard Operating Procedure Procedure Number: ERG-MOR-017 Revision Number: 2 Revision Date: May 12, 2015 Page: 3 of 9 12.0 COLLECTION, PRESERVATION, SHIPMENT, AND STORAGE
NA 13.0 CALIBRATION AND STANDARDIZATION
NA 14.0 PROCEDURE 14.1 Summary of Responsibilities
14.1.1 The Spreadsheet Developer:
Ensures that all original data are transcribed (entered) to the spreadsheet correctly.
Ensures that all equations used to generate results are entered correctly; ensures that all equations are used appropriately.
Ensures that all conversion factors and constants used in equations are described.
Ensures that all sources of original data are referenced in the spreadsheet.
Ensures that all variables within equations are defined.
Ensures that all spreadsheet tables are developed (content and format) according to the directions provided by the Project Manager or Task Leader, QAPP or SOP.
If possible, keeps a log of spreadsheet revisions. If different versions of a spreadsheet are created, the Developer should maintain a log that describes the changes made to the different versions. With two or more people editing one spreadsheet, control can be hard to maintain. One approach is to allot a tab in the spreadsheet where it can be logged who edits the spreadsheet and what was done (short description), including the date of the edits.
UNCONTROLLED ELECTRONIC COPY EFFECTIVE 5-2015
CONFIDENTIAL Standard Operating Procedure Procedure Number: ERG-MOR-017 Revision Number: 2 Revision Date: May 12, 2015 Page: 4 of 9
14.1.2 The Project Manager or Task Leader:
Determines when the use of spreadsheets (rather than database technology) are appropriate.
Determines if a specific format must be used and specifies what information should be included in each spreadsheet.
Ensures that methods and technical approaches used to produce a desired result are technically sound.
Ensures that spreadsheet documentation is included in the project file or within the spreadsheet.
Provides guidance on how to present data in the spreadsheet (based on client’s needs, project goals and objectives and QAPP QC acceptance criteria if applicable).
14.1.3 The Reviewer:
Verifies that the Developer’s technical approach is reasonable and
logical.
Verifies that calculations and results are accurate.
Verifies that documentation is complete and clear.
Ensures that assumptions and procedures used are reasonable.
Provides timely, constructive, and direct comments to the Developer.
Assigns a document version control number (SOP ERG-MOR-009).
14.2 To maintain acceptable data quality, it is important to practice adequate QC measures during the development and review of spreadsheets. The information presented in a spreadsheet should be evaluated to determine if input data are transcribed correctly, calculated results are technically sound, and the final results are reported in a manner that will allow the data to be evaluated.
UNCONTROLLED ELECTRONIC COPY EFFECTIVE 5-2015
CONFIDENTIAL Standard Operating Procedure Procedure Number: ERG-MOR-017 Revision Number: 2 Revision Date: May 12, 2015 Page: 5 of 9
14.2.1 Spreadsheet Identification:
Save the spreadsheet using a descriptive label and include the Work Assignment number or unique project number, if applicable, for example, “WA 1-09 Method Detection Limits”.
Include a title in the spreadsheet, at the beginning. Make the title descriptive enough to clearly identify the data presented and the project.
All spreadsheets should contain a tab to log the person(s) making edits to the spreadsheet and a short description of the edits, including date of edits, labeled Version Control, or similar.
Identify the reviewer and the date (month/day/year) the spreadsheet was reviewed in the log tab.
As needed, include headers or footers that identify the name of the electronic spreadsheet file, the page number, and total number of pages (e.g., Page 1 of 2), and the date the spreadsheet was last revised. The name of the disk or drive on which the file is stored may also be included with the file name.
Assign a unique name and number to the revised version of the spreadsheet.
Include a footer or header in the spreadsheet (or a note at the top or bottom of the spreadsheet) that indicates the date the spreadsheet was generated and the revision number, not the date that printing occurred.
14.2.2 Spreadsheet Development:
Describe all equations, using footnotes or a comments field, where appropriate. (e.g., if gram/kilogram are being converted to pound/ton, the equation performing the calculation should be explained as: “Convert g/kg to lb/ton: 1 g/kg x 1 lb/453.59 g x 1 kg/1,000 g x 453.59g/lb x 2,000 lb/ton, which is equivalent to multiplying by 2”). If detailed descriptions exist in project notebooks, then a reference to that notebook (e.g., notebook and page number) should be made in the comments field.
Identify any constants or conversion factors used.
UNCONTROLLED ELECTRONIC COPY EFFECTIVE 5-2015

CONFIDENTIAL Standard Operating Procedure Procedure Number: ERG-MOR-017 Revision Number: 2 Revision Date: May 12, 2015 Page: 6 of 9
Avoid using specific values in equations, except for easily recognizable conversion factors or constants. Enter values within a cell. Equations that use the value should reference the cell.
Hand (manually) verify equation cells.
Protect verified equation cell regions of spreadsheet to avoid accidentally over writing.
14.2.3 Supporting Data Requirements
The original raw data used in the spreadsheet should be retained in the project file and in the project archive.
14.2.4 Project Data File Requirements
Maintain an electronic backup copy at an identified location on the network and in hard copy in the project file.
15.0 CALCULATIONS
NA 16.0 QUALITY CONTROL Spreadsheet Quality Control Responsibilities
16.1 The Spreadsheet Developer:
Checks the accuracy of data transcriptions.
If the spreadsheet is being given to someone who will make revisions or enter data, data cells that should not be changed should be locked. Locking data cells in this manner will help prevent inadvertent changes to the spreadsheet.
16.2 The Project Manager or Task Leader:
Determines the level of QC necessary. For example, the Project Manager or Task Leader must decide if all data points and all calculations should be checked, or if only a percentage should be checked. It may be appropriate to initially check a percentage and, based on the number of discrepancies identified, decide if additional QC is required.
UNCONTROLLED ELECTRONIC COPY EFFECTIVE 5-2015

CONFIDENTIAL Standard Operating Procedure Procedure Number: ERG-MOR-017 Revision Number: 2 Revision Date: May 12, 2015 Page: 7 of 9 16.3 The Reviewer:
Verifies at least one calculation for each equation or combination of equations
used.
Verifies the accuracy of total values, means, and statistical evaluations of the data.
With the Project Manager or Task Leader, determines the amount of data to check; the number of errors found will dictate the amount of data evaluated for accuracy. The higher the error rate, the more data points to be checked. If numerous errors are found, the spreadsheet should be returned to the data generator with a note that includes a description of the review procedure and percentage of errors found. The error rate is a good indicator of the accuracy of all of the information in the spreadsheet. If needed, the site QA Coordinator should be consulted for guidance in determining the most effective way to determine which and how many values to recalculate.
Verifies that original data were input correctly.
Evaluates the technical soundness of methods and approaches used.
Ensures that equations in the spreadsheet produce the correct result and that equations were entered into the spreadsheet accurately.
Ensures that adequate documentation is included in the spreadsheet and that the documentation supports the data in the spreadsheet.
Discusses all discrepancies with the Developer and Project Manager or Task Leader, as appropriate. Actual spreadsheet errors identified by the Reviewer should be corrected by the Developer.
Summarizes the review, inputs their findings in the Version Control tab and comments on how to make changes to calculations in the Description tab indicating the errors or problems found, and the recommendations for revisions. The summary should also include the reviewer’s name, data of QC review (month/day/year), name of file, type of data reviewed, and the percentage of each type reviewed in the Version Control tab.
Assigns a document version control number (SOP ERG-MOR-009).
UNCONTROLLED ELECTRONIC COPY EFFECTIVE 5-2015
CONFIDENTIAL Standard Operating Procedure Procedure Number: ERG-MOR-017 Revision Number: 2 Revision Date: May 12, 2015 Page: 8 of 9 17.0 PREVENTION
NA 18.0 CORRECTIVE ACTION
NA 19.0 WASTE MANAGEMENT
NA 20.0 MAINTENANCE
NA 21.0 SHORTHAND PROCEDURE
1. Label a tab as Version Control and enter name, date and description of what was done
2. Label a tab as Description and include information about the project, the source of the raw data and what calculation are to be included in the spreadsheet. Define constants and equations here
3. In the working tab add a title on top of the page that includes a description of the table content
4. Ensure all raw data was entered correctly
5. Hand calculate some data points to review the spreadsheet results
6. Pass the spreadsheet to Technical Reviewer
7. The Technical reviewer will enter any comments or changes to the Control Version tab and provide a revised version to the Developer and Manager
22.0 DOCUMENTATION AND DOCUMENT CONTROL
All relevant information concerning Version Control, Description of calculations, should be included in separate tabs within the spreadsheet. However, accompanying documentation can be used such as hand calculations, more in detailed project descriptions and raw data collection comments. A separate tab within the spreadsheet will contain information about the edits to the spreadsheet contents, indicating editor’s name, date, short description of edits including reviews. Once reviewed the spreadsheet is assigned a document version control number (SOP ERG-MOR-009).
UNCONTROLLED ELECTRONIC COPY EFFECTIVE 5-2015

CONFIDENTIAL Standard Operating Procedure Procedure Number: ERG-MOR-017 Revision Number: 2 Revision Date: May 12, 2015 Page: 9 of 9 23.0 REFERENCES
Food and Drug Administration (FDA) Good Laboratory Practice (GLP) standards, 40 CFR Part 58.81(a), Subpart E – Testing Facility Operation, Standard Operating Procedures Federal Insecticide, Fungicide, and Rodenticide Act (FIFRA) GLP standards, 40 CFT Part 160.81(a), Subpart E – Testing Facility Operation, Standard Operating Procedures Toxic Substance Control Act (SCA) GLP standards, 40 CFR Part 792.81(a), Subpart E – Testing Facility Operation, Standard Operating Procedures
24.0 TABLES, DIAGRAMS, FLOWCHARTS, VALIDATION DATA
NA
UNCONTROLLED ELECTRONIC COPY EFFECTIVE 5-2015

UNCONTROLLED ELECTRONIC COPY EFFECTIVE 5-2012

CONFIDENTIAL Standard Operating Procedure Procedure Number: ERG-MOR-022 Revision Number: 1 Revision Date: May 8, 2012 Page: 2 of 8 4.0 SCOPE AND APPLICATION
This SOP is a general guidance to standard preparation. Some procedures may not be applicable to all analyses preformed at this location. The SOP was originally intended for use in the Organic Sample Preparation Laboratory however, the general procedures outlined in this SOP can be applied to preparing standards for any method. The calibration standards are used to establish or verify the instrument calibration which is used to calculate the concentrations of the analytes. The internal standard solution is used to measure the relative responses of analytes (and surrogates). When used, internal standards are added to all samples, standards, and quality control (QC) samples at the same concentration. The matrix spiking solution is added to a matrix prior to processing and is used to assess the efficiency of the preparative technique and analysis methodology. The surrogate spiking solution containing one or more compounds, different from the method analytes but similar in physical and chemical behavior, that can be used to measure extraction and analysis efficiency without interfering with the analysis.
5.0 METHOD SUMMARY
NA 6.0 DEFINITIONS
COA certificate of analysis g gram ID identification LIMS laboratory information management system μg microgram μL microliter mg milligram mL milliliter ng nanogram QA quality assurance QC quality control
7.0 INTERFERENCES To ensure the standards are free from interfering contaminants, all glassware should be
cleaned according to the glassware cleaning SOP (ERG-MOR-031). Syringes should be
UNCONTROLLED ELECTRONIC COPY EFFECTIVE 5-2012

CONFIDENTIAL Standard Operating Procedure Procedure Number: ERG-MOR-022 Revision Number: 1 Revision Date: May 8, 2012 Page: 3 of 8
cleaned by rinsing the plunger and the cylinder at least 10 times with the solvent to be used.
8.0 SAFETY
Follow normal laboratory safety procedures as outlined in the ERG Health and Safety Manual. The appropriate personal protection should be used during the preparation of standards/stocks.
9.0 EQUIPMENT NA 10.0 MATERIALS
The following equipment should be obtained: volumetric glassware, including volumetric flasks and pipettes, and syringes in the appropriate size(s). All volumetric glassware should be class A. A balance should be used that is appropriate to the degree of precision desired. In most cases, either a four- or a five-place balance should be used. Document the calibration check in the balance notebook prior to using the balance.
11.0 CHEMICALS, REAGENTS, AND STANDARDS
All reagents used to prepare standards should be reagent grade or better and be identified by their manufacturer and lot number. Solvents should be “high purity” or “pesticide residue grade.” If chemicals used in standards are less than 96% pure, then the percentage of purity must be factored into the calculations. All chemicals should be logged into the laboratory following the chemical inventory SOP (ERG-MOR-037). As chemicals are depleted, the chemical inventory should be updated so that chemicals can be replaced as needed. If a chemical has an expiration date, it should not be used past that date.
12.0 COLLECTION, PRESERVATION, SHIPMENT, AND STORAGE Store the standard/stocks as recommended by the vendor, or by the method. 13.0 CALIBRATION AND STANDARDIZATION NA
UNCONTROLLED ELECTRONIC COPY EFFECTIVE 5-2012
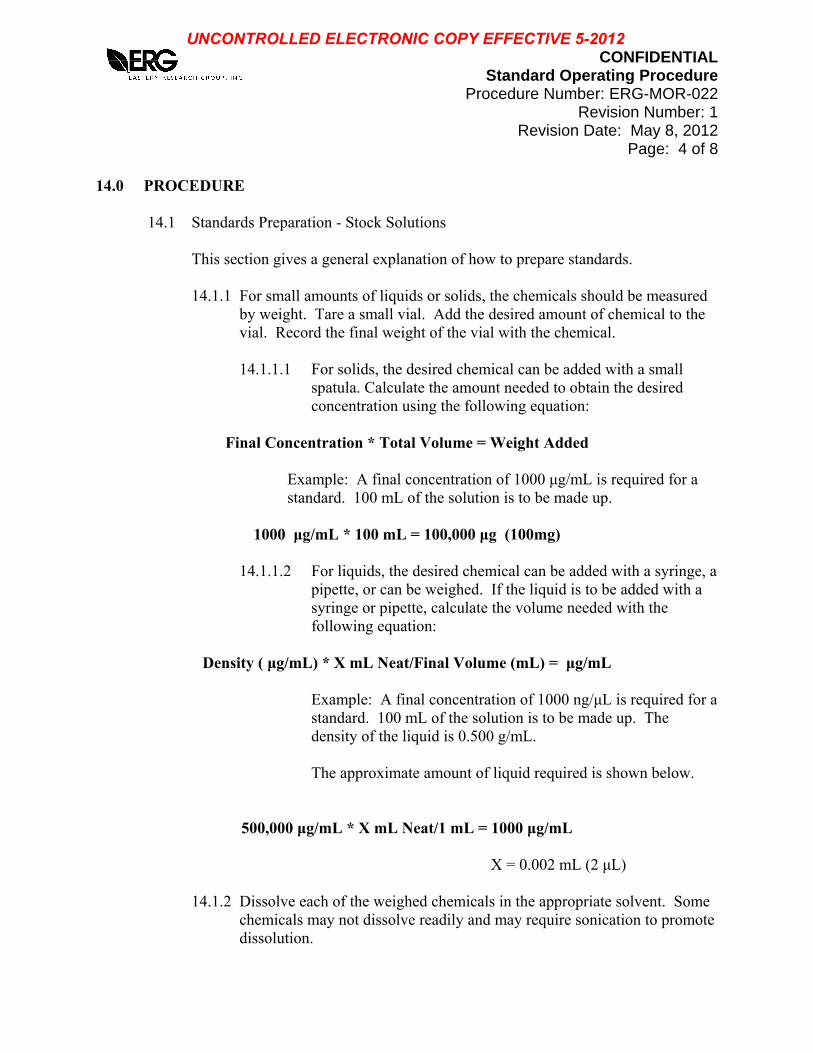
CONFIDENTIAL Standard Operating Procedure Procedure Number: ERG-MOR-022 Revision Number: 1 Revision Date: May 8, 2012 Page: 4 of 8 14.0 PROCEDURE
14.1 Standards Preparation - Stock Solutions
This section gives a general explanation of how to prepare standards.
14.1.1 For small amounts of liquids or solids, the chemicals should be measured by weight. Tare a small vial. Add the desired amount of chemical to the vial. Record the final weight of the vial with the chemical.
14.1.1.1 For solids, the desired chemical can be added with a small
spatula. Calculate the amount needed to obtain the desired concentration using the following equation:
Final Concentration * Total Volume = Weight Added
Example: A final concentration of 1000 μg/mL is required for a standard. 100 mL of the solution is to be made up.
1000 μg/mL * 100 mL = 100,000 μg (100mg)
14.1.1.2 For liquids, the desired chemical can be added with a syringe, a
pipette, or can be weighed. If the liquid is to be added with a syringe or pipette, calculate the volume needed with the following equation:
Density ( μg/mL) * X mL Neat/Final Volume (mL) = μg/mL
Example: A final concentration of 1000 ng/μL is required for a standard. 100 mL of the solution is to be made up. The density of the liquid is 0.500 g/mL.
The approximate amount of liquid required is shown below.
500,000 μg/mL * X mL Neat/1 mL = 1000 μg/mL X = 0.002 mL (2 μL)
14.1.2 Dissolve each of the weighed chemicals in the appropriate solvent. Some chemicals may not dissolve readily and may require sonication to promote dissolution.
UNCONTROLLED ELECTRONIC COPY EFFECTIVE 5-2012

CONFIDENTIAL Standard Operating Procedure Procedure Number: ERG-MOR-022 Revision Number: 1 Revision Date: May 8, 2012 Page: 5 of 8
14.1.3 Fill a clean, solvent-rinsed volumetric flask approximately ½ to ⅔ full of the solvent to be used for the standard. Add the dissolved chemicals from Step 14.1.2 to the volumetric flask. Rinse each vial three times with the solvent to make sure that all of the dissolved chemical is transferred to the volumetric flask.
14.1.4 Carefully fill the volumetric flask up to the final desired volume with the
solvent. The bottom of the meniscus should be at the volume line on the volumetric flask. Stopper the volumetric flask with a ground glass stopper and invert the flask 10 to 15 times to make sure that the solution is well mixed.
14.1.5 Transfer the stock standard to a vial with a Teflon®-lined screw cap lid for
storage in the standards refrigerator.
14.2 Working Standards Preparation - Dilutions of Stock Solutions
This section gives a general explanation of how to prepare dilutions of standard solutions.
14.2.1 When the concentration of a chemical is lower than can be obtained using
the methods described above, dilutions of the stock solutions can be made. Initially, a calculation must be done to determine what dilution is needed using the equation below:
14.2.2 Fill a solvent-rinsed volumetric flask approximately ½ to ⅔ full with the
solvent to be used for the standard. Measure the amount of the stock solution needed with a volumetric pipette or with a syringe. Add the stock solution to the solvent in the volumetric flask, and dilute to the volume needed with the solvent required.
14.2.3 Transfer the working standard to a vial with a Teflon®-lined screw cap lid
for storage in the standards refrigerator. 15.0 CALCULATIONS
Many of the necessary calculations are presented in Section 14.0.
Final Concentration = Weight Added/Total Volume
UNCONTROLLED ELECTRONIC COPY EFFECTIVE 5-2012
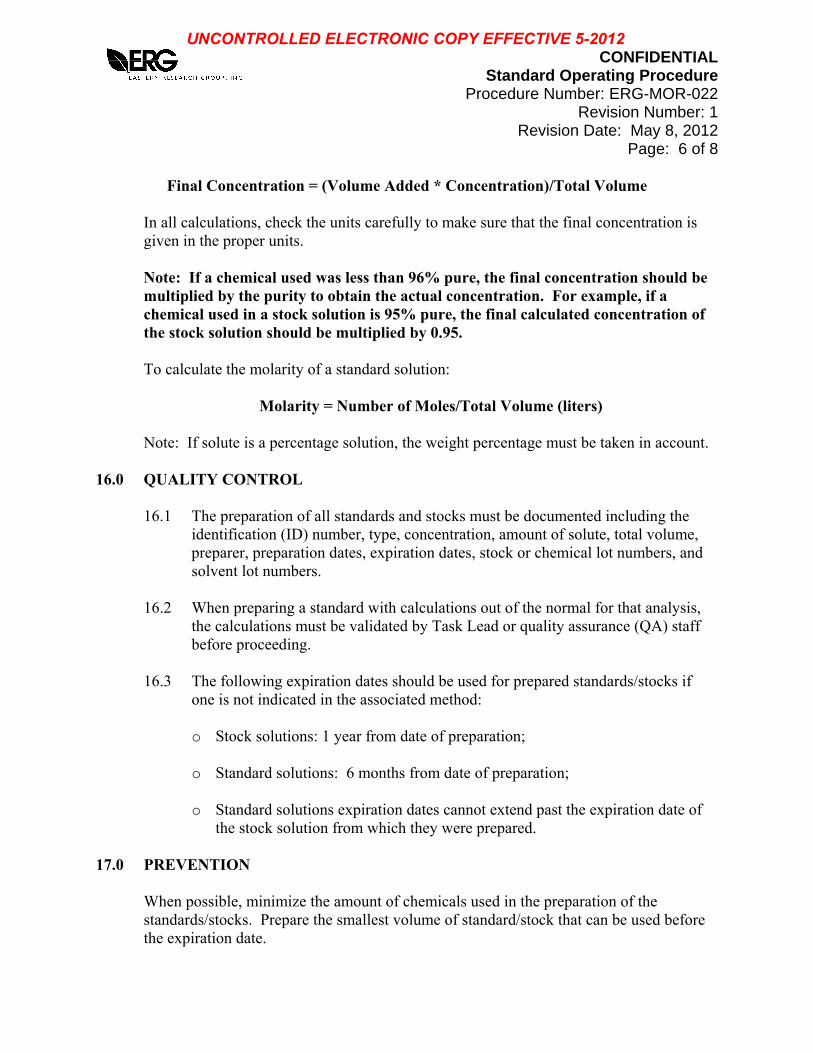
CONFIDENTIAL Standard Operating Procedure Procedure Number: ERG-MOR-022 Revision Number: 1 Revision Date: May 8, 2012 Page: 6 of 8
Final Concentration = (Volume Added * Concentration)/Total Volume
In all calculations, check the units carefully to make sure that the final concentration is given in the proper units.
Note: If a chemical used was less than 96% pure, the final concentration should be multiplied by the purity to obtain the actual concentration. For example, if a chemical used in a stock solution is 95% pure, the final calculated concentration of the stock solution should be multiplied by 0.95. To calculate the molarity of a standard solution:
Molarity = Number of Moles/Total Volume (liters)
Note: If solute is a percentage solution, the weight percentage must be taken in account. 16.0 QUALITY CONTROL
16.1 The preparation of all standards and stocks must be documented including the identification (ID) number, type, concentration, amount of solute, total volume, preparer, preparation dates, expiration dates, stock or chemical lot numbers, and solvent lot numbers.
16.2 When preparing a standard with calculations out of the normal for that analysis,
the calculations must be validated by Task Lead or quality assurance (QA) staff before proceeding.
16.3 The following expiration dates should be used for prepared standards/stocks if
one is not indicated in the associated method:
o Stock solutions: 1 year from date of preparation; o Standard solutions: 6 months from date of preparation; o Standard solutions expiration dates cannot extend past the expiration date of
the stock solution from which they were prepared. 17.0 PREVENTION
When possible, minimize the amount of chemicals used in the preparation of the standards/stocks. Prepare the smallest volume of standard/stock that can be used before the expiration date.
UNCONTROLLED ELECTRONIC COPY EFFECTIVE 5-2012

CONFIDENTIAL Standard Operating Procedure Procedure Number: ERG-MOR-022 Revision Number: 1 Revision Date: May 8, 2012 Page: 7 of 8 18.0 CORRECTIVE ACTION NA 19.0 WASTE MANAGEMENT Hazardous waste disposal is discussed in SOP ERG-MOR-033. 20.0 MAINTENANCE NA 21.0 SHORTHAND PROCEDURE NA
22.0 DOCUMENTATION AND DOCUMENT CONTROL
On each standard vial, a label must be affixed with the standard name (e.g., base, neutral, acid, or BNA surrogate), identification (ID) number, the standard expiration date, and the initials of the person who made the standard. The preferred method of standards documentation is the laboratory information management system (LIMS). The LIMS system has a Standards section to document ID number, type, concentration, amount of solute, total volume, preparer, preparation dates, expiration dates, lot numbers of chemical and solvent, and link the information to the appropriate QC samples. For commercial standards or stocks, the certificate of analysis (COA) can be scanned, imported, and linked with the appropriate standard/s. A sample Standards page from the LIMS system is presented in Figure 1. A notebook can be used for standards and stocks. Write the standard number and description so they are clearly visible, preferably at the top of a page in the notebook. Follow this with a short description of how the standard was made, including the amounts added, the glassware used, and the solvent(s) used. If a solid compound was used, note how it was dissolved. The brand and lot numbers of all chemicals, including the solvents, must be recorded as well as the equations used to calculate the final concentrations. If a stock solution was used, also record the concentration. Lastly, record the final concentrations of the chemicals in the standard solution.
23.0 REFERENCES NA
UNCONTROLLED ELECTRONIC COPY EFFECTIVE 5-2012
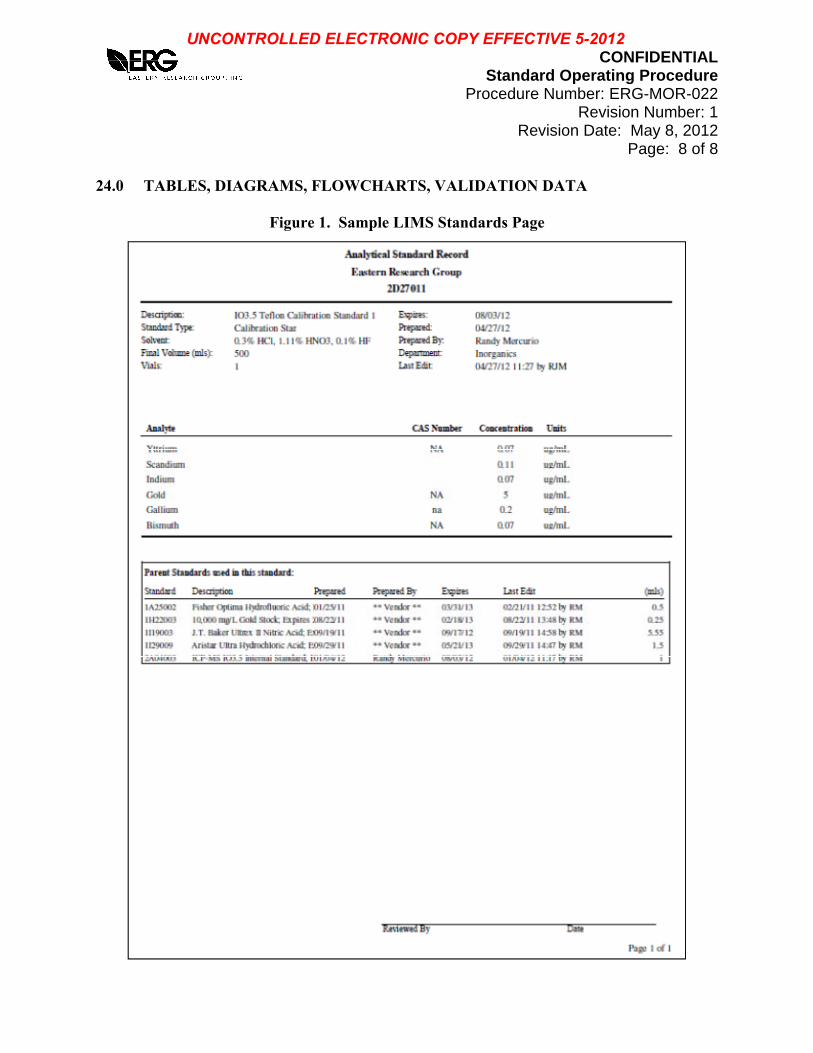
CONFIDENTIAL Standard Operating Procedure Procedure Number: ERG-MOR-022 Revision Number: 1 Revision Date: May 8, 2012 Page: 8 of 8 24.0 TABLES, DIAGRAMS, FLOWCHARTS, VALIDATION DATA
Figure 1. Sample LIMS Standards Page
UNCONTROLLED ELECTRONIC COPY EFFECTIVE 5-2012

UNCONTROLLED ELECTRONIC COPY EFFECTIVE 2-2013

CONFIDENTIAL Standard Operating Procedure
Procedure Number: ERG-MOR-033 Revision Number: 4
Revision Date: December 10, 2012 Page: 2 of 16
4.0 SCOPE AND APPLICATION
This document presents procedures for personnel who generate, handle, or are involved in the disposal of waste.
5.0 METHOD SUMMARY
N/A 6.0 DEFINITIONS
A hazardous waste handler is an individual who regularly transfers hazardous waste from the satellite accumulation points (SAPs) to the 180-day storage room.
A hazardous waste generator is any laboratory personnel who generates hazardous waste.
The health and safety coordinator (HSC) is responsible for managing health and safety programs at the ERG laboratory. A satellite accumulation point (SAP) is a designated location near the point of generation where waste is temporarily stored.
A small-quantity generator (SQG) is a facility that generates less than 1,000 kg (2,200 lbs) of hazardous waste and less than 1 kg (2.2 lbs) of acutely hazardous waste in a calendar month.
7.0 INTERFERENCES
N/A 8.0 SAFETY
Proper personal protective equipment (PPE), as outlined in the Hazardous Waste Management Program, the SOP for PPE (ERG-MOR-038), and/or Section 14.2.3 of this document, is required to be worn when handling hazardous waste.
9.0 EQUIPMENT
N/A
UNCONTROLLED ELECTRONIC COPY EFFECTIVE 2-2013

CONFIDENTIAL Standard Operating Procedure
Procedure Number: ERG-MOR-033 Revision Number: 4
Revision Date: December 10, 2012 Page: 3 of 16
10.0 MATERIALS
N/A 11.0 CHEMICALS, REAGENTS, AND STANDARDS
N/A 12.0 COLLECTION, PRESERVATION, SHIPMENT, AND STORAGE
Because waste disposal contractors are not currently permitted to accept dioxin-containing wastes, there are no disposal options for the dioxin-containing chemicals that ERG has archived. The following criteria define dioxin waste. The dioxin waste categories described below are subject to the RCRA regulations contained in 40 CFR Parts 261, 264, 265, 270, and 271:
Waste containing tetra- and pentachloro-dibenzo-p-dioxins and
-dibenzofurans;
Process wastes from the manufacturing use of tetra-, penta-, or hexachlorobenzenes under alkaline conditions;
Wastes from the production and manufacturing of tri-, tetra-, and
pentachlorophenols and their chlorophenoxy derivatives;
Discarded, unused formulations containing tri-, tetra-, and pentachlorophenols or formulations containing compounds derived from these chlorophenols; and
Soil contaminated with any of the wastes listed above.
The dioxin-containing analytical standards that ERG has on-site are to remain segregated and stored in the refrigerator in the 180-day storage room, which requires a key for entry.
13.0 CALIBRATION AND STANDARDIZATION
N/A 14.0 PROCEDURE
Any chemical or item contaminated with a chemical, including samples, should be initially considered hazardous waste until the Project Manager and/or HSC determines otherwise.
UNCONTROLLED ELECTRONIC COPY EFFECTIVE 2-2013
CONFIDENTIAL Standard Operating Procedure
Procedure Number: ERG-MOR-033 Revision Number: 4
Revision Date: December 10, 2012 Page: 4 of 16
14.1 Determination, Classification, and Packaging of Hazardous Waste
14.1.1 Determination
Not all waste is hazardous by EPA’s definition. Project Managers, with the help of the HSC or designee, must determine whether generated waste is hazardous. Section 24.1 has a summary of questions to help determine the applicability of the regulations from Title 40 CFR 262.11.
14.1.2 Classification
The Morrisville facility typically generates the following classifications of hazardous wastes:
F = from non-specific sources; U = hazardous compounds from discarded commercial products; D = characteristic (toxic, corrosive, ignitable, or reactive) wastes;
and P = acutely hazardous from discarded commercial products.
The waste disposal contractor uses these classification codes to correctly group and dispose of the waste. The HSC or designee, while reviewing the hazardous waste manifests, ensures that the correct classification codes are used for waste generated at ERG laboratory.
14.1.3 Packaging
Hazardous waste generated by ERG is disposed of in two major packaging categories:
Bulked wastes are produced routinely in relatively large volumes.
This waste group includes spent solvents, aqueous acids, discarded environmental samples (large volumes), and contaminated sample vials. Approved hazardous waste handlers bulk these wastes every 4-6 weeks. Note: although these are considered bulked wastes for our purposes, for DOT purposes, these are still non-bulk containers (49 CFR 171.8)
Lab pack wastes are chemical reagents contained in jars, vials, jugs,
bottles, and cans. This waste is best disposed of in its primary container. Lab packs are 20- or 30-gal fiber drums that hold individual containers of chemically compatible waste. Individual containers are packed in a fiber drum surrounded by layers of
UNCONTROLLED ELECTRONIC COPY EFFECTIVE 2-2013

CONFIDENTIAL Standard Operating Procedure
Procedure Number: ERG-MOR-033 Revision Number: 4
Revision Date: December 10, 2012 Page: 5 of 16
absorbent vermiculite material, which prevents shifting or breakage of small containers during transport.
Hazardous Waste Handlers should use the following list to determine which types of wastes can be bulked or lab-packed. The waste types with an asterisk (*) are typical wastes generated by the ERG facility.
Bulked Waste
- Halogenated flammable solvents* - Nonhalogenated flammable solvents* - Inorganic acids* - Organic acids - Aqueous waste contaminated with hazardous waste
Lab-Packed Waste
- Glass and metal contaminated with hazardous waste* - Paper and plastic contaminated with hazardous waste* - Poison A (poisonous gases) - Flammable gases - Non-flammable gases - Flammable liquids (i.e., those that cannot be bulked with
solvents) - Oxidizers - Flammable solids - Corrosive liquids - Corrosive solids - Irritants - Combustible liquids
When determining whether to group the waste as either bulked or lab-packed waste, Hazardous Waste Handlers should consider the following factors:
Bulk whenever possible (it is less expensive.). Use the same drum
of an appropriate size for compatible wastes until it is full (it is less expensive.).
For lab-packed waste, set the waste aside, generally in the
chemical storage (Room 139) or a designated location in the labs. The waste disposal contractor packages these wastes at the time of pick-up.
UNCONTROLLED ELECTRONIC COPY EFFECTIVE 2-2013

CONFIDENTIAL Standard Operating Procedure
Procedure Number: ERG-MOR-033 Revision Number: 4
Revision Date: December 10, 2012 Page: 6 of 16
Do not mix wastes that can be bulked with lab-packed wastes. If
the two are mixed, all the waste will need to be lab-packed.
Never mix non-hazardous waste with hazardous waste. The result is a larger quantity of hazardous waste.
14.2 Hazardous Waste Collection and Storage Procedures
ERG is allowed to store hazardous waste for up to 180 days, provided safe storage practices, as defined by the state and federal governments, are followed. The dedicated storage area is Room 139, the 180-day storage area. The 180-day counting begins when the first drop of waste is transferred to the 180-day storage area.
14.2.1 Collection and storage of in-laboratory waste
Hazardous Waste Generators must follow these steps to store waste properly in the SAPs:
Label all containers with Hazardous Waste labels, including the
constituents or at least the process generating the wastes (i.e., TO-13 waste) on the bottles;
All containers of hazardous waste must be sealed except when
pouring;
A maximum of 55 gal of hazardous waste and 1 kg acutely toxic waste is allowed at any one SAP; and
If waste storage presents a clutter problem in the laboratory hoods,
contact a Hazardous Waste Handler to transfer the waste to the 180-day storage area.
The following are additional requirements for properly storing specific types of wastes in the SAP and 180-day storage area:
Glass and Metal Waste
- All contaminated glass and metal waste will be collected in
closed containers labeled Waste Glass and Metal. These containers must be stored in the SAP. A Hazardous Waste
UNCONTROLLED ELECTRONIC COPY EFFECTIVE 2-2013

CONFIDENTIAL Standard Operating Procedure
Procedure Number: ERG-MOR-033 Revision Number: 4
Revision Date: December 10, 2012 Page: 7 of 16
Handler will periodically dispose of these in fiber drums located in the 180-day storage area.
- Place uncontaminated broken pipettes, test tubes, and other
items of broken glass in the designated Broken Glass bins or containers, not in the regular trash cans. This practice will prevent the janitorial staff from cutting themselves on broken laboratory glassware.
Solvent Waste
- All organic solvent wastes are collected in 4 liter amber
glass bottles in designated SAP areas. These are often transferred from the hood to a flammables or vented cabinet in the same SAP area when full before being bulked in the 180-day storage area.
Contaminated Paper and Plastic Storage
- Paper and plastic waste material that is contaminated with
chemicals (hazardous or nonhazardous) will be placed inside thick plastic bags and stored inside the fume hood until the bag is transported to the 180-day storage area by a Hazardous Waste Handler.
Aqueous Waste and Environmental Samples
- If possible, environmental samples and other aqueous
wastes should be stored in the original glass sample containers. NOTE: No Aqueous/Acid waste will be put in the solvent waste drum.
- When storing liquid waste, an adequate supply of spill
materials (vermiculite and/or absorbent padding) must be on hand to control and clean up potential spills. Refer to the Hazardous Waste Management Program for proper spill procedures.
Acids and Corrosives
- All acids and other corrosives must be stored in a separate
area with adequate secondary containment to ensure that if
UNCONTROLLED ELECTRONIC COPY EFFECTIVE 2-2013

CONFIDENTIAL Standard Operating Procedure
Procedure Number: ERG-MOR-033 Revision Number: 4
Revision Date: December 10, 2012 Page: 8 of 16
the chemical spills or leaks, it will not come into contact with containers of organic chemicals.
- When not in use or considered waste the acids or corrosives
are stored in segregated and labeled storage areas under the laboratory hood in the storage cabinets or in vented flammables cabinets.
14.2.2 Collection of Field-Generated Hazardous Waste
Project Managers are responsible for planning the collection, storage, and transportation of hazardous waste generated in the field. Typical field wastes will include:
Discarded PPE; and
Chemicals used on site (e.g., glassware rinsate).
Prior to the start of the job, Project Managers shall arrange for the client to accept the waste or contract with a waste disposal firm to pick up hazardous waste from the site.
NOTE: Because ERG does not have the necessary DOT license, employees are not allowed to transport hazardous wastes.
14.2.3 Bulking waste in the 180-day storage area
General Requirements
General Requirements for the Hazardous Waste Handlers to transfer the waste to 180-day storage area are:
- All containers must be approved hazardous waste containers.
- Use a dolly or cart to transport accumulated waste from the
SAPs to the 180-day storage area. If one is not available, carry all liquid waste inside secondary containers. Paint cans, buckets, and plastic tote bottles are acceptable secondary containers.
UNCONTROLLED ELECTRONIC COPY EFFECTIVE 2-2013

CONFIDENTIAL Standard Operating Procedure
Procedure Number: ERG-MOR-033 Revision Number: 4
Revision Date: December 10, 2012 Page: 9 of 16
- Prior to pouring waste materials, all flammable waste drums must be grounded with a clip wire to a grounding rod located in the area.
For all hazardous waste delivered to the 180-day storage area, the
following information must be recorded in the disposal logbook (Refer to Section 24.2 for a sample page):
- Date; - Quantity of waste; - Waste description; - Date disposed; - Initials of personnel disposing of waste.
Proper Packaging and Labeling
All wastes placed in the same container must be compatible with each other and the material with which the drum is constructed. The container must be labeled with a yellow hazardous waste label and the information on the label completed to include:
- Description of waste; - Generator's name and address; - EPA identification number (found in 40 CFR); and - Accumulation start date.
All containers and boxes of chemical waste to be disposed of in a lab pack must be marked with the following information:
- Name of the generator (ERG employee responsible for
waste); - Project or process description (i.e., TO-13 waste); and - Date that the waste was placed into the 180-day storage
area.
Proper Handling Procedures
The Hazardous Waste Handlers disposing of hazardous waste must use proper personal protection. PPE required for pouring liquid wastes are defined below:
UNCONTROLLED ELECTRONIC COPY EFFECTIVE 2-2013

CONFIDENTIAL Standard Operating Procedure
Procedure Number: ERG-MOR-033 Revision Number: 4
Revision Date: December 10, 2012 Page: 10 of 16
- Pouring acids: Face shield (or full-face respirator), gloves, lab coat, long pants, and closed-toe shoes must be worn at all times.
- Pouring solvents: Respiratory protection, eye protection
(unless full-face respirator is worn), lab coat, long pants, and protective gloves must be worn at all times.
Hazardous Waste Handlers should never dispose of waste alone; always dispose of the waste with two people (“buddy system”) in case of an emergency. An alarm system is installed and tested annually to notify other laboratory personnel if a problem occurs.
14.3 Disposal of Non-Hazardous Waste
Only limited types of waste may be poured down the sanitary sewer or placed in municipal waste dumpsters. If a laboratory employee has any doubt on proper disposal of any type of waste, the employee should check with the one of the Project Managers.
The Morrisville laboratory routinely disposes and recycles glass containers. The containers are first allowed to dry under a laboratory hood to evaporate remaining chemical residues, and then are triple rinsed with water. The glass bottles are then either recycled (if they are reagent bottles) or disposed of in the dumpster (if the bottles previously contained solvent waste or acids).
15.0 CALCULATIONS
N/A 16.0 QUALITY CONTROL
16.1 Performance
Hazardous waste regulations require that the dedicated storage room (the 180-day storage room) is inspected on a weekly basis by the HSC or designee. This inspection has historically been performed every Tuesday. In addition, the HSC or designee also inspects the SAPs on a weekly basis to verify safe waste storage practices and track waste accumulation levels. Periodic inspections performed by Lab Managers are held to ensure the procedures are followed. Periodic training is held to ensure personnel remain familiar with the procedures.
UNCONTROLLED ELECTRONIC COPY EFFECTIVE 2-2013

CONFIDENTIAL Standard Operating Procedure
Procedure Number: ERG-MOR-033 Revision Number: 4
Revision Date: December 10, 2012 Page: 11 of 16
16.2 Data Assessment
All waste storage procedures in the ERG laboratory will be reviewed by the ERG Hazardous Waste Specialist and periodically subject to inspection by an inspector from the North Carolina Division of Solid Waste Management.
17.0 PREVENTION
N/A 18.0 CORRECTIVE ACTION
N/A 19.0 WASTE MANAGEMENT
19.1 Waste Minimization
ERG will maintain the SQG status as required by our EMS. To minimize waste, ERG maintains a chemical inventory database which must be consulted prior to the purchase of any chemical. The database was created to minimize waste and to track materials that are in stock to prevent duplicate orders, and thus avoid unnecessary chemical storage and waste generation. See ERG-MOR-037 for more information on the chemical inventory procedures.
19.2 Waste Management Organization
The waste management program involves the following personnel, each with a set of specific responsibilities:
19.2.1 Project Manager Responsibilities
Adequately plan and budget for hazardous waste management; and
Ensure the laboratory is in compliance with all applicable regulations.
Project Manager is responsible for ensuring that project and lab personnel:
- Correctly label hazardous waste;
UNCONTROLLED ELECTRONIC COPY EFFECTIVE 2-2013

CONFIDENTIAL Standard Operating Procedure
Procedure Number: ERG-MOR-033 Revision Number: 4
Revision Date: December 10, 2012 Page: 12 of 16
- Segregate, collect, and store waste properly in the laboratory and in the field;
- Have access to and wear appropriate PPE; and - Are ready to respond to emergencies.
Give accurate records to project secretary that document worker training in hazardous waste handling procedures; and
Ensure that adequate supplies are available and procedures are in place for prompt emergency response.
19.2.2 Health and Safety Coordinator (or designee) Responsibilities
Conduct weekly inspections of both the SAPs and the 180-day
storage area to ensure that employees are disposing of hazardous waste in a timely manner to prevent excess and unsafe accumulation; complete and maintain inspection logs.
Compile an inventory list of wastes to be picked up and coordinate
with the hazardous waste disposal contractor;
Review and sign manifests prepared by the hazardous waste disposal contractor prior to off-site shipment of hazardous waste and ensure the signed manifests are returned within 60 days after the disposal of the wastes;
Conduct periodic hazardous waste training for all personnel working with hazardous waste;
Complete and file all reports with the State of North Carolina, any
disposal States as required, and EPA; and Retain all records.
19.2.3 Waste Generator Responsibilities
Waste generators are responsible for:
Disposing of waste in a timely fashion, labeling each type of waste
as it is generated;
UNCONTROLLED ELECTRONIC COPY EFFECTIVE 2-2013

CONFIDENTIAL Standard Operating Procedure
Procedure Number: ERG-MOR-033 Revision Number: 4
Revision Date: December 10, 2012 Page: 13 of 16
Segregating waste, placing in appropriate containers, and storing in designated storage locations (SAPs);
Being familiar with emergency response procedures, including
containment and clean-up of hazardous waste spills and the location of emergency flushing facilities; and
Notifying the hazardous waste handler when waste needs to be
moved to the 180-day storage area.
19.2.4 Hazardous Waste Handler Responsibilities
In addition to having all the Hazardous Waste Generator responsibilities (Section 19.2.3), Hazardous Waste Handlers are responsible for:
Safely transferring hazardous waste from the SAPs to the 180-day
storage area (see Section 14.2.3), including using the "buddy system" and wearing appropriate PPE during waste bulking/transfer operations;
Labeling each container in the 180-day storage area;
Entering all wastes transferred to the 180-day storage area into the
Waste Disposal Log;
Notifying the HSC when one month remains before disposal is required of the waste in the 180-day storage area;
Notifying the disposal contractor to order additional disposal
containers and spill cleanup supplies for the 180-day storage area as needed; and
Cleaning up any spills in the 180-day storage area.
20.0 MAINTENANCE
N/A 21.0 SHORTHAND PROCEDURE
N/A
UNCONTROLLED ELECTRONIC COPY EFFECTIVE 2-2013

CONFIDENTIAL Standard Operating Procedure
Procedure Number: ERG-MOR-033 Revision Number: 4
Revision Date: December 10, 2012 Page: 14 of 16
22.0 DOCUMENTATION AND DOCUMENT CONTROL
The Waste Disposal Log is located in the 180-day storage room (Room 139). All 180-day and SAP inspection logbooks currently in-use are stored in the Supply Room (Room 102). Archives of these logbooks are kept indefinitely in the Data Archives Room (Room 137). Signed hazardous waste manifests are stored in the Supply Room (Room 102) in a white binder labeled “ERG’s Hazardous Waste Records,” as instructed in SOP 089, “SOP for Hazardous Waste Inspections and Recordkeeping”.
23.0 REFERENCES
N/A 24.0 TABLES, DIAGRAMS, FLOWCHARTS, VALIDATION DATA
24.1 Determination of Hazardous Waste
24.2 Waste Disposal Logbook
UNCONTROLLED ELECTRONIC COPY EFFECTIVE 2-2013
CONFIDENTIAL Standard Operating Procedure
Procedure Number: ERG-MOR-033 Revision Number: 4
Revision Date: December 10, 2012 Page: 15 of 16
SECTION 24.1
Determination of Hazardous Waste In Title 40 CFR 262.11, the regulations provide the following list of questions for proper identification of waste:
Is the waste excluded from regulation under Title 40 CFR 261.4?
Is the waste listed in Subpart D (40 CFR 261.30 through 261.35)?
If the waste is not listed, does it exhibit any of the characteristics listed in Subpart C, Characteristics of Hazardous Wastes (40 CFR 261.20 through 261.24)?
See the referenced regulations for more hazardous waste determination details.
UNCONTROLLED ELECTRONIC COPY EFFECTIVE 2-2013

CONFIDENTIAL Standard Operating Procedure
Procedure Number: ERG-MOR-033 Revision Number: 4
Revision Date: December 10, 2012 Page: 16 of 16
SECTION 24.2 Waste Disposal Logbook
UNCONTROLLED ELECTRONIC COPY EFFECTIVE 2-2013
UNCONTROLLED ELECTRONIC COPY EFFECTIVE 4-2015
CONFIDENTIAL Standard Operating Procedure Procedure Number: ERG-MOR-045 Revision Number: 8 Revision Date: Feb. 16, 2015 Page: 2 of 13
by the ERG Research Triangle Park Laboratory. If samples are received that do not meet these requirements appropriate corrective action must be taken.
5.0 METHOD SUMMARY
When samples arrive, they are unpacked, inspected, accepted or voided and logged-in into the Laboratory Information Management System (LIMS). The information from the chain-of-custody (COC) forms for each batch of samples received at ERG is entered into the LIMS according to its respective project number (ERG-MOR-079). Information relative to the samples (number, type, collocated or duplicate sample number, analysis to be performed) should be provided prior to arrival by the Task Leader (TL) or Project Manager (PM).
6.0 DEFINITIONS COC Chain-of-Custody C Collocated D Duplicate
FB Field Blank Hg Mercury
IR Infrared LIMS Laboratory Information Management System NIST National Institute of Standards and Technology
P Primary PM Project Manager PUF Polyurethane Foam SOP Standard Operating Procedure SVOC Semivolatile Organic Compounds TL Task Leader
7.0 INTERFERENCES
Samples should be handled in a way to avoid contamination of samples. 8.0 SAFETY
8.1 The TL or PM should provide information on samples prior to their arrival so that the proper safety precautions can be taken.
8.2 Liquid samples should be handled with gloves; if a sample container is broken, it
should be transferred immediately to a fume hood for proper handling and disposal.
UNCONTROLLED ELECTRONIC COPY EFFECTIVE 4-2015
CONFIDENTIAL Standard Operating Procedure Procedure Number: ERG-MOR-045 Revision Number: 8 Revision Date: Feb. 16, 2015 Page: 3 of 13
9.0 EQUIPMENT
9.1 Heiss Gauge – capable of being zeroed and reading the vacuum or pressure of canister samples; or Weiss Gauge – capable of reading the vacuum or pressure of canister samples and calibrated annually by manufacturer.
9.2 IR Thermal sensor gun – calibrated annually by manufacturer and capable of
measuring temperatures from 4 to -25 C. 10.0 MATERIALS
Not applicable. 11.0 CHEMICALS, REAGENTS, AND STANDARDS
Not applicable. 12.0 COLLECTION, PRESERVATION, SHIPMENT, AND STORAGE
12.1 Canister samples are stored at room temperature in the air toxics laboratory. 12.2 Carbonyl cartridge samples are stored in refrigerator R-11. 12.3 PUF/XAD cartridge samples are stored in refrigerator R-7. 12.4 Hexavalent chromium filter samples are stored in freezer F-11. 12.5 Metals filter samples are stored at room temperature in the inorganic laboratory. 12.6 Other media should be stored according to the procedures described in the
appropriate method or analysis SOP. 12.7 The cold packs must be stored in the freezer in the shipping and receiving area in
time to refreeze prior to the next media shipment. 13.0 CALIBRATION AND STANDARDIZATION
13.1 The Weiss vacuum/pressure gauge is sent to the manufacturer annually for National Institute of Standards and Technology (NIST) traceable calibration.
UNCONTROLLED ELECTRONIC COPY EFFECTIVE 4-2015

CONFIDENTIAL Standard Operating Procedure Procedure Number: ERG-MOR-045 Revision Number: 8 Revision Date: Feb. 16, 2015 Page: 4 of 13
13.2 The Omegascope® thermometers are sent to the manufacturer annually for calibration. The calibration and subsequent testing of the devices are performed using instrumentation and standards that are traceable to NIST.
14.0 RECEIVING and LOG-IN PROCEDURE
14.1 Visually inspect each sample and each sample COC upon receipt. COC must include full, proper, and complete documentation (including but not limited to sample identification, collection site, time and date of sample collection, collector’s initials, and any comments regarding the sample). The sample acceptance criteria are listed in Section 16.0. Pay particular attention to the contents of coolers. Remove all items from coolers (including icepacks) to assure that no sample is left in the cooler.
14.1.1 Verify that the site code, collection date, any sample designation (Primary
(P), Duplicate (D), Collocated (C) 1 or 2, Field Blank (FB)), and container number (container number or canister number, if it is a canister, hexavalent chromium, or PUF/XAD sample) on COC are same as sample/sample container. If one of these parameters does not match, notify the PM.
14.1.2 If the sample falls outside of acceptable criteria stated in the program
instructions, or in Section 16.0 of this SOP (e.g., sample not at the proper temperature, sample container is broken, etc.), document on COC and immediately notify the PM so that a decision can be made whether to invalidate the sample.
14.1.3 The receiver shall initial the COC and record the date of receipt. The
condition of the sample upon receipt (such as temperature, canister pressure, color) should also be recorded on the COC. In the case of a carbonyl cartridge, hexavalent chromium filter, or
PUF/XAD cartridge sample, the receiver checks and records the sample temperature and the thermometer ID upon receipt on COC.
In the case of a canister sample, the receiver records the canister pressure upon receipt.
14.2 Invalidated samples are listed as VOID on the COC and in the LIMS. The reason for invalidation is recorded in the LIMS and on the COC if not already there.
UNCONTROLLED ELECTRONIC COPY EFFECTIVE 4-2015

CONFIDENTIAL Standard Operating Procedure Procedure Number: ERG-MOR-045 Revision Number: 8 Revision Date: Feb. 16, 2015 Page: 5 of 13
14.3 The LIMS log-in person assigns the next available unique number in the ERG LIMS. Samples are logged-in as they are listed on the COC forms.
14.4 Following LIMS log-in, each sample COC is labeled with its unique LIMS ID
number. Copies of each COC are to be separated (or, if not multiple copies, copied). Original COCs go with sample, copies of each COC are scanned and either given to PM or put into a centralized location by the person logging in the samples.
14.5 Also following LIMS log-in, the original COC is paired with each sample. Labels with a unique LIMS ID and sample date are printed for each carbonyl, metals, and canister sample. Once paired with their original COCs, the samples are placed in the appropriate storage area as listed in Section 12.
14.6 After the log-in of samples is complete, work orders are printed so the PM or their
designee must verify that the samples were logged-in correctly according to the copies of each COC.
14.7 Sample hold times vary by method; refer to appropriate analysis SOPs for required hold times. Those listed is this SOP refer to extraction hold times from the day of collection or analysis hold time when there is no associated extraction for that method. Adherence to specified hold times is documented by the LIMS and conveyed to the TL via LIMS Hold Time Alerts. Turnaround times are conveyed via program instructions and/or scheduled project meetings.
14.8 Any special procedures which apply to a set of samples should be made known to
the analysts by the TL or PM. 15.0 CALCULATIONS Not applicable. 16.0 QUALITY CONTROL
The PM or their designee verifies that the sample information has been logged into the LIMS correctly. The COC must be filled out in ink and include full, proper, and complete documentation (including but not limited to, time and date of sample collection, collector’s initials, and any comments regarding the sample). Listed below is a summary of the sample acceptance criteria, specific to common sample media.
UNCONTROLLED ELECTRONIC COPY EFFECTIVE 4-2015

CONFIDENTIAL Standard Operating Procedure Procedure Number: ERG-MOR-045 Revision Number: 8 Revision Date: Feb. 16, 2015 Page: 6 of 13
16.1 Special Projects Sample Acceptance Criteria
16.1.1 When samples are received for a new or special project, notify the PM and the recipient immediately. Follow the PM’s direction for sample acceptance if method is unknown.
16.2 Canister Sample Acceptance Criteria
16.2.1 If the canister valve is open upon arrival, the sample is invalid.
16.2.2 The site, collection date, and canister ID number (written in indelible ink) must match the accompanying chain of custody.
16.2.3 The canister pressure upon receipt:
If the gauge needle doesn’t move (stays on zero), the sample may be
void. If the canister vacuum is zero, there is a possibility that the canister leaked during transport. Notify the PM so that a decision can be made whether to invalidate the sample;
If the canister vacuum is greater than 15” Hg, notify the PM so that a
decision can be made whether to invalidate the sample. Depending on the collection time (3 hour vs. 24 hour), the sample may be valid;
If the canister vacuum is more than 3 inches Hg different from the final field vacuum, notify the PM so that a decision can be made whether to invalidate the sample. This does not apply to positive pressure readings, in psig. Note: canisters from sites at higher elevations may have larger pressure differences, check with PM;
There is no maximum positive pressure, psig, for a valid canister sample.
16.2.4 The sample is invalid if the sampling duration is less than 22 or greater
than 26 for a 24 hour sample. Add a comment about the sample in LIMS if it has a sampling duration between 22-23 hours or between 25-26 hours, so that the PM can make the decision whether to invalidate the sample.
16.2.5 The sample is flagged in LIMS if the sample is received out of hold time
of 30 days or the duration between cleaning and sampling is greater than 30 days.
UNCONTROLLED ELECTRONIC COPY EFFECTIVE 4-2015

CONFIDENTIAL Standard Operating Procedure Procedure Number: ERG-MOR-045 Revision Number: 8 Revision Date: Feb. 16, 2015 Page: 7 of 13
16.3 Carbonyl Cartridge Sample Acceptance Criteria
16.3.1 The cartridge envelope must be labeled in indelible ink with sample identification that includes the collection site ID and time/date of sample collection. This information is checked to make sure it matches the accompanying COC.
16.3.2 If the sample cartridge and envelope is visibly damaged, the sample is
invalid. Sample cartridges are not removed from the envelope for inspection unless the envelope is damaged.
16.3.3 If the sample is received above room temperature the sample should be
flagged in LIMS. Note: As stated in the Note in Section 10.12 of Method TO-11A, if samples are to be shipped to a central laboratory for analysis, the duration of the non-refrigerated period should be kept to a minimum, preferably less than two days.
16.3.4 The sample is invalid if the sampling duration is less than 22 or greater than 26 for a 24 hour sample.Add a comment about the sample in LIMS if it has a sampling duration between 22-23 hours or between 25-26 hours, so that the PM can make the decision whether to invalidate the sample.
16.3.5 The sample is flagged in LIMS if the sample is received out of hold time
of 14 days. 16.4 PUF/XAD Cartridge Sample Acceptance Criteria
16.4.1 If the site operator has noted the glass thimble is broken on the COC, the sample is invalid. Glass thimbles are not inspected in the shipping/receiving area unless there is visible damage to the plastic canister.
16.4.2 Likewise, if XAD has escaped from the cartridge, the sample is invalid.
16.4.3 The collection site, time/date of sample collection, , and container number must be written on the plastic canister label in indelible ink. This information is checked to ensure it matches the accompanying COC.
16.4.4 If the cartridge is received at a temperature > 21 C the sample is flagged
in LIMS.
16.4.5 The sample is invalid if the sampling duration is less than 22 or greater than 26 for a 24 hour sample. Add a comment about the sample in LIMS
UNCONTROLLED ELECTRONIC COPY EFFECTIVE 4-2015
CONFIDENTIAL Standard Operating Procedure Procedure Number: ERG-MOR-045 Revision Number: 8 Revision Date: Feb. 16, 2015 Page: 8 of 13
if it has a sampling duration between 22-23 hours or between 25-26 hours, so that the PM can make the decision whether to invalidate the sample.
16.4.6 The sample is flagged in LIMS if the sample is received out of hold time
of 14 days. 16.5 Hexavalent Chromium Filter Sample Acceptance Criteria
16.5.1 If the site operator has noted a tear, hole or water damage to the filter on
the COC, the sample is invalid. Hexavalent chromium filters are not inspected in the shipping/receiving area unless there is visible damage to the plastic canister.
16.5.2 The collection site, time/date of sample collection, and container number must be written on the plastic canister label in indelible ink. This information is checked to ensure it matches the accompanying COC.
16.5.3 If the cartridge is received at a temperature > 15 C the sample must be
flagged in LIMS.
16.5.4 The sample is invalid if the sampling duration is less than 22 or greater than 26 for a 24 hour sample. Add a comment about the sample in LIMS if it has a sampling duration between 22-23 hours or between 25-26 hours, so that the PM can make the decision whether to invalidate the sample.
16.5.5 The sample is flagged in LIMS if the sample is received out of hold time
of 21 days. 16.6 Metals Filter Sample Acceptance Criteria
16.6.1 If the site operator has noted water damage or a tear/hole to the filter that occurred prior to or during sampling, the sample is invalid. Metals filters are not inspected in the shipping/receiving area unless there is visible damage to the sample container.
16.6.2 The filter container or envelope must be labeled with a collection site and, time/date of sample collection written in indelible ink. This information must be checked against the accompanying COC to be sure it is correct and that all samples were received. Flow rate information must be included on either the sample COC or the sample container.
UNCONTROLLED ELECTRONIC COPY EFFECTIVE 4-2015

CONFIDENTIAL Standard Operating Procedure Procedure Number: ERG-MOR-045 Revision Number: 8 Revision Date: Feb. 16, 2015 Page: 9 of 13
16.6.3 If no COC is present (e.g. Oklahoma metals filters), create a COC listing each sample received.
16.6.4 The sample is invalid if the sampling duration is less than 22 or greater
than 26 for a 24 hour sample. Add a comment about the sample in LIMS if it has a sampling duration between 22-23 hours or between 25-26 hours, so that the PM can make the decision whether to invalidate the sample.
16.6.5 The sample is flagged in LIMS if the sample is received out of hold time
of 180 days.
16.7 Other Media, Aqueous Sample Acceptance Criteria
16.7.1 If the sample container is broken or leaking, the sample is invalid. 16.7.2 If the sample is received at a temperature higher than the method
requirements or out of method specified hold time, notify the PM. The sample may be invalid.
16.7.3 The sample identification, collection site, and time/date of sample
collection and container number must match the accompanying COC.
16.8 Other Media, Solid Sample Acceptance Criteria
16.8.1 If the container is broken or the sample has spilled from an open or broken container, the sample is invalid.
16.8.2 If the sample is received at a temperature higher than the method
requirements or out of method specified hold time, notify the PM. The sample may be invalid.
16.8.3 The sample identification, collection site, and time/date of sample
collection and container number must match the accompanying COC.
17.0 PREVENTION Not applicable. 18.0 CORRECTION ACTION
If samples are received that are not valid or acceptable based on this SOP, the PM for the project is informed of the samples involved and the issues. The PM contacts the client
UNCONTROLLED ELECTRONIC COPY EFFECTIVE 4-2015

CONFIDENTIAL Standard Operating Procedure Procedure Number: ERG-MOR-045 Revision Number: 8 Revision Date: Feb. 16, 2015 Page: 10 of 13
and/or resolves the issue and all data related to the samples are flagged with the appropriate caution regarding use and applicability.
19.0 WASTE MANAGEMENT Not applicable.
20.0 MAINTENANCE Not applicable.
21.0 SHORTHAND PROCEDURE
Read the entire SOP before following the shorthand procedure, as quality control is not thoroughly covered in this section.
21.1 Special Projects
21.1.1 Notify the PM and the recipient immediately upon receiving samples for a new or special project.
21.1.2 Follow the directions of the PM for proper receiving of the samples.
21.2 Canister Samples
21.2.1 Verify the site code, collection date, any sample designation (P, D, C 1 or 2, FB), and canister number;
21.2.2 Initial and date COC;
21.2.3 Check and document pressure on COC;
21.2.4 Notify the PM if at a vacuum > 15 inches Hg; 21.2.5 Notify the PM if at a vacuum of zero inches Hg; 21.2.6 Invalidate if canister valve is open or partially open; 21.2.7 Invalidate and notify PM if sampled less than 22 or greater than 26; 21.2.8 Flag in LIMS if past hold time or time between canister cleaning and
sampling is greater than 30 days;
UNCONTROLLED ELECTRONIC COPY EFFECTIVE 4-2015

CONFIDENTIAL Standard Operating Procedure Procedure Number: ERG-MOR-045 Revision Number: 8 Revision Date: Feb. 16, 2015 Page: 11 of 13
21.2.9 Store in Air Tox Lab.
21.3 Carbonyl Cartridges
21.3.1 Verify the site code, collection date, any sample designation (P, D, C 1 or 2, FB);
21.3.2 Initial and date COC;
21.3.3 Check and document receipt temperature and thermometer ID on COC; 21.3.4 Invalidate if cartridge is damaged;
21.3.5 Invalidate and notify PM if sampled less than 22 or greater than 26; 21.3.6 Flag in LIMs if past hold time; 21.3.7 Store in refrigerator R-11 with the accompanying COCs.
21.4 PUF/XAD Cartridges
21.4.1 Verify the site code, collection date, any sample designation (P, D, C 1 or 2, FB), and container number;
21.4.2 Initial and date COC; 21.4.3 Check and document receipt temperature and thermometer ID on COC; 21.4.4 Flag in LIMS if cartridge is > 21C; 21.4.5 Invalidate if glass thimble is broken; 21.4.6 Invalidate and notify PM if sampled less than 22 or greater than 26; 21.4.7 Flag in LIMs if past hold time; 21.4.8 Store in refrigerator R-7; COCs are clipped to the refrigerator door.
21.5 Hexavalent Chromium Filters
21.5.1 Verify the site code, collection date, any sample designation (P, D, C 1 or 2, FB), and container number;
UNCONTROLLED ELECTRONIC COPY EFFECTIVE 4-2015

CONFIDENTIAL Standard Operating Procedure Procedure Number: ERG-MOR-045 Revision Number: 8 Revision Date: Feb. 16, 2015 Page: 12 of 13
21.5.2 Initial and date COC; 21.5.3 Check and document receipt temperature and thermometer ID on COC; 21.5.4 Flag in LIMS if cartridge is > 15C; 21.5.5 Invalidate if filter is torn; 21.5.6 Invalidate and notify PM if sampled less than 22 or greater than 26; 21.5.7 Label the accompanying COC with the LIMS ID and attach COC to the
container with the sample inside. 21.5.8 Flag in LIMs if past hold time; 21.5.9 Store in freezer F-11.
21.6 Metals Filters
21.6.1 Verify the site code, collection date, any sample designation (P, D, C 1 or 2, FB);
21.6.2 The receiver initials and dates the COC, if present (if no COC present,
create a COC listing each sample received). COC should also be labeled with the LIMS IDs;
21.6.3 Invalidate if filter is torn; 21.6.4 Invalidate and notify PM if sampled less than 22 or greater than 26; 21.6.5 Flag in LIMs if past hold time; 21.6.6 Store in Inorganic Lab.
21.7 Other Media
21.7.1 Verify the site code, collection date, any sample designation (P, D, C 1 or 2, FB), and container number (as needed);
21.7.2 Initial and date COC; 21.7.3 Check and document receipt temperature and thermometer ID on COC;
UNCONTROLLED ELECTRONIC COPY EFFECTIVE 4-2015

CONFIDENTIAL Standard Operating Procedure Procedure Number: ERG-MOR-045 Revision Number: 8 Revision Date: Feb. 16, 2015 Page: 13 of 13
21.7.4 Invalidate and notify PM if temperature exceeds method requirements; if sampled less than specified collection time; if container is broken or leaking;
21.7.5 Flag in LIMs if past hold time; 21.7.6 The LIMS ID is recorded on COC and a label with the LIMS ID is affixed
to the sample container. 21.7.7 Store according to PM instructions.
22.0 DOCUMENTATION AND DOCUMENT CONTROL
The need for proper and complete documentation is essential. The documentation is the most reliable resource the laboratory has for knowing how to deal with the multitude of samples that come into a laboratory. If a sample is received with incomplete documentation, every effort should be made to complete the information necessary for the analysis of a sample.
23.0 REFERENCES
Datasystem User’s Manual, Promium, LLC.
24.0 TABLES, DIAGRAMS FLOWCHARTS, AND VALIDATION DATA
Not applicable.
UNCONTROLLED ELECTRONIC COPY EFFECTIVE 4-2015
UNCONTROLLED ELECTRONIC COPY EFFECTIVE 4-2011
CONFIDENTIAL Standard Operating Procedure Procedure Number: ERG-MOR-057 Revision Number: 1 Revision Date: March 3, 2011 Page: 2 of 7 4.0 SCOPE AND APPLICATION
This SOP covers general peer review requirements and does not cover project-specific requirements. Project-specific peer review requirements will be incorporated in project instructions or work plans. This SOP describes how to select a peer reviewer and the required involvement of the peer reviewer throughout the course of a specific project.
5.0 METHOD SUMMARY
NA 6.0 DEFINITIONS
DQO data quality objective PE professional engineer PM project manager QAPP quality assurance project plan QC quality control SOP standard operating procedure TL task leader
7.0 INTERFERENCES NA 8.0 SAFETY
NA 9.0 EQUIPMENT NA 10.0 MATERIALS NA 11.0 CHEMICALS, REAGENTS, AND STANDARDS NA
UNCONTROLLED ELECTRONIC COPY EFFECTIVE 4-2011

CONFIDENTIAL Standard Operating Procedure Procedure Number: ERG-MOR-057 Revision Number: 1 Revision Date: March 3, 2011 Page: 3 of 7 12.0 COLLECTION, PRESERVATION, SHIPMENT, AND STORAGE NA 13.0 CALIBRATION AND STANDARDIZATION NA 14.0 PROCEDURE
14.1 Selection of a Peer Reviewer
The selection of the peer reviewer is critical to maintaining proper project quality control (QC) of technical work. At project inception, the Project Manager (PM) and the Task Leader (TL) must evaluate the requirements of the specific project to assess the level of experience needed for assignment of a peer reviewer. The peer reviewer must be qualified to understand the technical aspects of the project and to comprehend the client’s expectations of the project. Other requirements include an understanding of the priorities, needs, and constraints to complete the project. It is also necessary for the peer reviewer to be aware of ERG’s contractual commitments and potential areas of liability and/or exposure. Normally, the choice of peer reviewer will be governed by the type of work conducted. Experience in a subject area is desired most often, but is not always a necessity. For those engineering projects requiring final approval by a registered professional engineer (PE), the Coordinating Professional Engineer for the office will guide the selection of the appropriate peer reviewer. For such projects, peer reviewer selection will be based upon knowledge of the subject area, level of experience, and availability throughout the duration of the project.
14.2 Responsibilities
This section describes the various responsibilities of the peer reviewer throughout the duration of a project. The peer reviewer should be involved in project planning, kick-off, routine progress meetings, results, and reports (preliminary, draft, and final). 14.2.1 Project Initiation
At project initiation, the peer reviewer selected must be qualified to understand the technical aspects of the project and the technical content
UNCONTROLLED ELECTRONIC COPY EFFECTIVE 4-2011
CONFIDENTIAL Standard Operating Procedure Procedure Number: ERG-MOR-057 Revision Number: 1 Revision Date: March 3, 2011 Page: 4 of 7
and quality needs and expectations from the client’s perspective. The peer reviewer must understand the timing and scope of his or her duties during the course of the project. Further, the peer reviewer must make the commitment of time and resources to perform proper peer review.
14.2.2 Project Instructions
Project instructions should be peer reviewed carefully before they are distributed to the project team to ensure the following: Project objectives are clearly stated, are appropriate, and are realistic. All information is clearly communicated. The project instructions
should clearly communicate expectations of all project team members with regard to budget, schedules, individual responsibilities, and milestones.
14.2.3 Review of Technical Work Products
All technical work products should be subjected to peer review. These documents include, but are not limited to: - Technical notes; - Test plans; - Quality Assurance Project Plans (QAPPs); - Preliminary reports; - Draft reports; - Final Reports; - Calculations; - Field data; and - Laboratory data. The areas to be covered in reviewing the technical work products include: The project objectives should be clearly stated, as in the QAPP data
quality objectives (DQOs). Of equal importance in the peer review is whether the project met its stated objectives. This should be documented on a data review checklist if pertinent to the project.
Where applicable, all national or local codes, standards, methods, SOPs, and/or contractual constraints should be employed and cited.
UNCONTROLLED ELECTRONIC COPY EFFECTIVE 4-2011

CONFIDENTIAL Standard Operating Procedure Procedure Number: ERG-MOR-057 Revision Number: 1 Revision Date: March 3, 2011 Page: 5 of 7
As above, the report must be technically defensible in the light of all relevant regulatory or codified requirements.
The work products must be reviewed to ensure that proper
documentation (appendices containing information generated during the course of the project) has been included and that assumptions and supplemental data sources are properly referenced.
The peer reviewer must consider carefully the conclusions and
recommendations made in work products. The conclusions and recommendations must address the client’s needs, must be complete, must be supported by the data and work, and should be implementable.
Adequate time should be budgeted for each peer reviewer to ensure that proper review is conducted and that peer review is not compromised as a result of schedule constraints. All peer review comments should be retained as a part of the project files. Peer review comments must be addressed by the PM or project team. It is recommended that the PM review how the peer review comments were addressed with the peer reviewer(s) prior to completing the subsequent draft of the work product.
14.2.4 Routine Project Data Review
At a minimum, 10% of laboratory data must be reviewed. However, if a systematic or large number of errors are found in the 10% review, more than 10% of the technical work products should be reviewed. As an option, an additional 1% of the technical work products can be reviewed by a second peer reviewer designated by quality staff or PM. The review should be documented on a data review checklist, located in the SOP if pertinent to the project. All peer review comments should be retained as a part of the project files. Peer review comments must be addressed by the PM or project team. Most projects involve calculations of some form; the selected peer reviewer will ensure that these calculations are adequately reviewed for mathematical accuracy. The selected peer reviewer will check a random number of these calculations personally to ensure that the proper review is being conducted. See SOP ERG-MOR-017 for evaluating the accuracy of spreadsheet data.
UNCONTROLLED ELECTRONIC COPY EFFECTIVE 4-2011

CONFIDENTIAL Standard Operating Procedure Procedure Number: ERG-MOR-057 Revision Number: 1 Revision Date: March 3, 2011 Page: 6 of 7
14.3 Problem Resolution
The peer reviewer is charged with providing comments and insights into the project throughout the course of the project. Any feedback on project progress or staff performance should be directed to the PM/TL, as appropriate. Any changes made or actions taken to address the concerns should be communicated to the peer reviewer, as well as reviewer concerns that will not be addressed and the reason the comments or concerns will not be addressed.
15.0 CALCULATIONS NA 16.0 QUALITY CONTROL
As noted in Section 14.1, peer review is critical to proper QC of technical work. The responsibilities of peer reviewers throughout the duration of a project are detailed in Sections 14.2.1 through 14.2.4. In addition, Section 14.2.4 refers to SOP ERG-MOR-017 for evaluating the accuracy of spreadsheet data.
17.0 PREVENTION NA 18.0 CORRECTIVE ACTION NA 19.0 WASTE MANAGEMENT NA 20.0 MAINTENANCE NA 21.0 SHORTHAND PROCEDURE NA
UNCONTROLLED ELECTRONIC COPY EFFECTIVE 4-2011

CONFIDENTIAL Standard Operating Procedure Procedure Number: ERG-MOR-057 Revision Number: 1 Revision Date: March 3, 2011 Page: 7 of 7 22.0 DOCUMENTATION AND DOCUMENT CONTROL
As noted in Section 14.2.3, all peer review comments should be documented on appropriate data review checklists and retained as part of project files.
23.0 REFERENCES
NA 24.0 TABLES, DIAGRAMS, FLOWCHARTS, VALIDATION DATA
NA
UNCONTROLLED ELECTRONIC COPY EFFECTIVE 4-2011

UNCONTROLLED ELECTRONIC COPY EFFECTIVE 5-2015

CONFIDENTIAL Standard Operating Procedure Procedure Number: ERG-MOR-079 Revision Number: 4 Revision Date: April 27, 2015 Page: 2 of 11 5.0 METHOD SUMMARY
All samples received at the ERG Laboratory are logged into the LIMS database. The LIMS generates a unique identification (ID) number for each sample, and maintains the pertinent collection information and data for each sample.
6.0 DEFINITIONS
COC - Chain of Custody Element - The name of the LIMS software used by ERG and sold by Promium, Inc. ID - Identification LIMS - Laboratory Information Management System QC - Quality Control SOP - Standard Operating Procedure TAT - Turnaround Time
7.0 INTERFERENCES
N/A 8.0 SAFETY
N/A 9.0 EQUIPMENT
9.1 Desktop computer connected to ERG’s Laboratory Intranet server BART (Y://).
9.2 Promium Element Software. 10.0 MATERIALS
N/A 11.0 CHEMICALS, REAGENTS, AND STANDARDS
N/A
12.0 COLLECTION, PRESERVATION, SHIPMENT, AND STORAGE
N/A
UNCONTROLLED ELECTRONIC COPY EFFECTIVE 5-2015

CONFIDENTIAL Standard Operating Procedure Procedure Number: ERG-MOR-079 Revision Number: 4 Revision Date: April 27, 2015 Page: 3 of 11 13.0 CALIBRATION AND STANDARDIZATION
N/A 14.0 PROCEDURE
14.1 Run the Element software and log on to the LIMS by entering your username and password.
14.2 Under the Sample Control option of the main menu, select the choice Work
Order. A window will appear on the screen with information on the Work Orders already in the LIMS.
14.3 Click the Add button to create a new Work Order with a number generated by the
LIMS. The scheme for the Work Order number is: YMMDDXX. Work Orders are generated on a project-by-project basis, i.e. only one project may be entered for every Work Order.
14.4 The following fields on the Project and Receipt tabs must be completed before the
LIMS will allow the Work Order to be saved. The Project and Receipt tabs of the Work Order window are presented in Table 24.1 and 24.2. Fields that must be manually updated are denoted with a solid bullet, while fields that auto-complete are denoted with an open bullet. It should be noted that it is sometimes necessary to change fields that are automatically populated (e.g. “Received by Person”), so care must be taken to make sure this information is correct.
Project Tab:
Client Project
o Client Project Manager o Lab Project Manager o Project Number o Date Received
Receipt Tab: o Date Logged In o Date Due o Received By Person o Logged In By Person o Turnaround Time (TAT)
Shipper Container Temperature (C) Shipped By
UNCONTROLLED ELECTRONIC COPY EFFECTIVE 5-2015

CONFIDENTIAL Standard Operating Procedure Procedure Number: ERG-MOR-079 Revision Number: 4 Revision Date: April 27, 2015 Page: 4 of 11
Once the Work Order has been completed with the correct information, click the green Save button to save the information.
14.5 To modify information in a Work Order already created, click the Edit button, make the necessary corrections, and then click the green Save button to save the changes.
Note: Only the last Work Order created can be deleted by clicking the Delete button in the Work Order window. All others may only be modified.
14.6 The Work Order window may be closed by clicking the Done button. If
individual sample information for a Work Order is going to be created or modified, the Samples>> button can be clicked to access this information.
14.7 Input individual sample information by selecting the Samples option in the
Sample Control menu or by clicking the Samples>> button in the Work Order window.
14.8 Select the appropriate Work Order number to the left of the window if the correct
number does not appear.
14.9 Enter the sample information from the COC form into the fields on the Sample Information and Containers tabs listed below:
Sample Information Tab
Sample Name Lab Matrix
o Report Matrix (Automatically populates based on Lab Matrix) Sample Type Analysis Sample Begin Date/Time/Zone Sample End Date/Time/Zone Sample Comments Applicable User Fields for canister number and pressure
Containers Tab
Sample Container Sample Location
The Sample Information and Container tabs of the Samples window are presented in Table 24.3 and 24.4. Keep in mind that available analyses will not appear in the window until a Matrix is chosen. Also, information entered into certain fields
UNCONTROLLED ELECTRONIC COPY EFFECTIVE 5-2015

CONFIDENTIAL Standard Operating Procedure Procedure Number: ERG-MOR-079 Revision Number: 4 Revision Date: April 27, 2015 Page: 5 of 11
such as Sample Name and Comments may be specific to a particular client and/or project. Note: Recurrent sampling events can be logged in using archived sample information by selecting the pull down arrow from the “Name” field and selecting the appropriate sample name. LIMS will import the information from the previous sample logged in under the same name. Edit the imported sample information appropriately and select “Save.”
14.10 Each time a sample is added, Element generates a LIMS ID number with the code
YMMDDXX-YY. Record this number in the upper right corner on the respective COC form.
Note: For multiple samples collected at the same site on the same day, new
samples can be added to the work order by selecting “Copy” at the bottom of the screen and editing the appropriate sample information.
14.11 Once the Work Orders and Sample Information have been entered for the day,
print the Work Orders using the Work Order option under the Print menu (or by clicking the print icon from the Sample window). Multiple Work Orders may be printed simultaneously by clicking the Multi button and selecting multiple Work Order numbers to print. The print template most used is the wko_withstorage template, but other templates may also be used. The Print Work Order window is presented in Table 24.5.
14.12 Print sample labels using the Sample Labels option under the Print menu (or, if
using the print icon from the Sample window, the Sample Labels Print window will automatically come up upon closing the Work Order Print window). Multiple sample labels may be printed simultaneously using the Multi button and choosing samples from the present day or other time periods. Canister sample labels use the [email protected] template and all others (carbonyl and metals samples) use the [email protected] template. Labels are printed using the Avery 5163 and 5160 varieties, respectively. The Print Sample Labels window is presented in Table 24.6.
14.13 After the Work Orders and Sample Labels have been printed, separate the white
and yellow copies of the COC forms and photocopy any white COC forms missing the yellow copy. Give the sample labels and white COC forms to the sample receipt person so they can be placed with the samples. Scan the yellow CoC forms and pass them along to the appropriate project manager with the printed work orders so that sample login can be reviewed.
14.14 Save the scanned copies of the CoCs to a designated location and insert into their
respective work order in LIMS. This is achieved by returning to the Work Order
UNCONTROLLED ELECTRONIC COPY EFFECTIVE 5-2015

CONFIDENTIAL Standard Operating Procedure Procedure Number: ERG-MOR-079 Revision Number: 4 Revision Date: April 27, 2015 Page: 6 of 11
option and selecting the PDF icon next to “Chain Of Custody”. A new window will open, select Add and choose the appropriate location and COC scan, then select Done. The COC PDF window is presented in Table 24.7.
14.15 The Project Manager or person designated by the Project Manager will compare
the Work Orders against the COC forms and indicate the errors to be corrected by the Sample Login person.
14.16 The Project Manager will update the status of the newly logged samples in the
Update Status window of the Laboratory menu. Samples may be queried in a variety of ways and displayed by Analysis or by Work Order. The samples or Work Orders to be updated are selected on the screen and updated to a status of Available, Invalid, or Cancelled. Invalid samples should have a comment in the Samples window including the reason for invalidation.
14.17 After the status updates and the necessary corrections have been made, the yellow
COC forms and Work Orders can be filed in the appropriate places. 15.0 CALCULATIONS
N/A
16.0 QUALITY CONTROL
16.1 After completing the login of samples for the day, the Work Orders generated should be checked against the COC forms to find any discrepancies. Errors are to be corrected in a timely fashion.
16.2 Work Orders are checked by the respective Project Manager or designee to provide another level of QC.
17.0 PREVENTION
N/A 18.0 CORRECTIVE ACTION
LIMS entries are checked by the Project Manager or designee. Corrections to entries are indicated on the Work Order printouts, and the sheets are returned to the sample logger so that the logger can make the necessary corrections.
19.0 WASTE MANAGEMENT
N/A
UNCONTROLLED ELECTRONIC COPY EFFECTIVE 5-2015
CONFIDENTIAL Standard Operating Procedure Procedure Number: ERG-MOR-079 Revision Number: 4 Revision Date: April 27, 2015 Page: 7 of 11 20.0 MAINTENANCE
Should any issues with the LIMS software arise, contact the ERG LIMS administrator. An annual service agreement is maintained for the Promium Element.
21.0 SHORT-HAND PROCEDURE
21.1 Create a Work Order for each project/site for which samples are received. Add individual samples to each Work Order using information from the COC forms.
21.2 Record LIMS ID numbers on the COC forms.
21.3 When all Work Orders and samples have been added to the LIMS, print the Work
Orders and sample labels.
21.4 Separate the white and yellow copies of the COC forms. The yellow copies are scanned and given to the Project Manager responsible for the samples along with the Work Orders.The white copies are returned to samples.
21.5 PDF scans of the COC forms are inserted into the respective LIMS work order. 21.6 The Project Manager checks the Work Orders against the COC forms.
21.7 The yellow CoC copies are then filed in a designated storage area.
22.0 DOCUMENTATION AND DOCUMENT CONTROL
22.1 White copies of COC forms are filed with the sample data packages and stored according to each project’s requirements. Yellow copies of COC forms are filed according to LIMS ID number in the laboratory’s central COC file cabinet. The yellow copies are transferred to long-term storage periodically.
22.2 Work Order printouts are mainly used to check the accuracy of data entry into the
LIMS. Work Order printouts are stored and/or disposed of according to the applicable Project Manager’s instructions.
23.0 REFERENCES
Element Datasystem User=s Manual, Promium LLC.
Promium website, www.promium.com
UNCONTROLLED ELECTRONIC COPY EFFECTIVE 5-2015

CONFIDENTIAL Standard Operating Procedure Procedure Number: ERG-MOR-079 Revision Number: 4 Revision Date: April 27, 2015 Page: 8 of 11 24.0 TABLES, DIAGRAM, FLOWCHARTS, VALIDATION DATA
24.1 Work Order window- Project tab:
24.2 Work Order window – Receipt tab:
UNCONTROLLED ELECTRONIC COPY EFFECTIVE 5-2015

CONFIDENTIAL Standard Operating Procedure Procedure Number: ERG-MOR-079 Revision Number: 4 Revision Date: April 27, 2015 Page: 9 of 11
24.3 Sample window – Sample Information tab:
24.4 Sample window – Containers tab:
UNCONTROLLED ELECTRONIC COPY EFFECTIVE 5-2015

CONFIDENTIAL Standard Operating Procedure Procedure Number: ERG-MOR-079 Revision Number: 4 Revision Date: April 27, 2015 Page: 10 of 11 24.5 Print Work Order window:
24.6 Print Sample Label window:
UNCONTROLLED ELECTRONIC COPY EFFECTIVE 5-2015
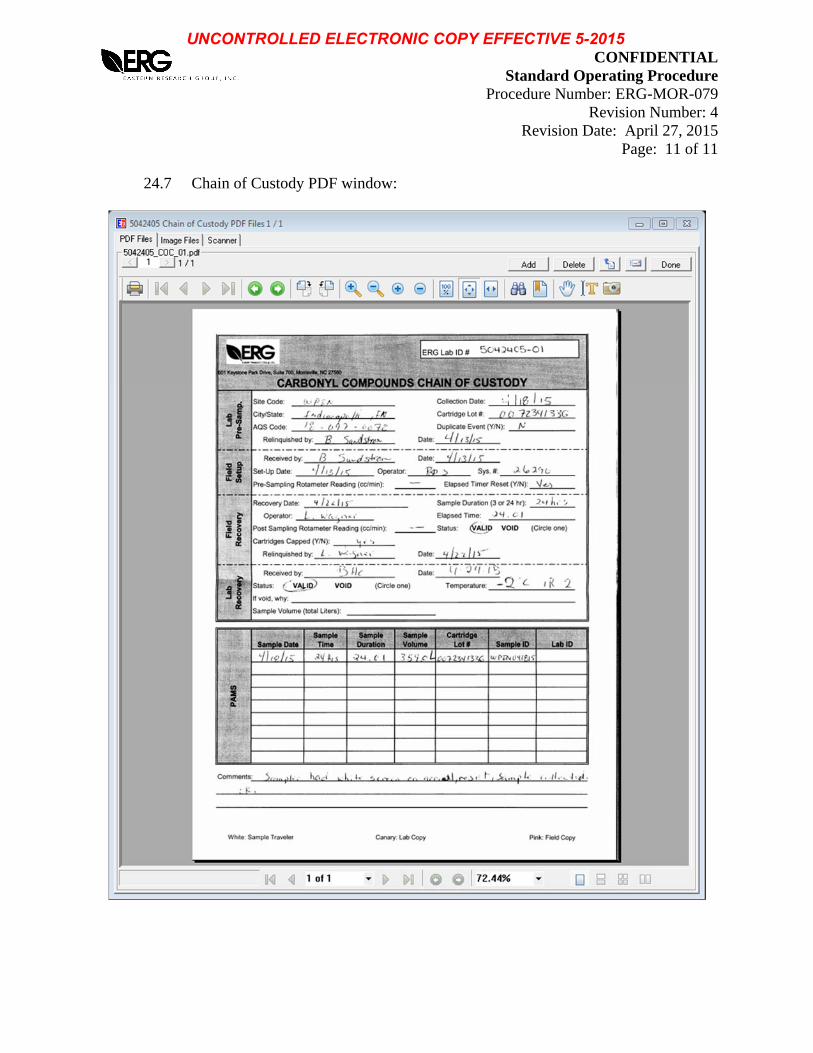
CONFIDENTIAL Standard Operating Procedure Procedure Number: ERG-MOR-079 Revision Number: 4 Revision Date: April 27, 2015 Page: 11 of 11
24.7 Chain of Custody PDF window:
UNCONTROLLED ELECTRONIC COPY EFFECTIVE 5-2015
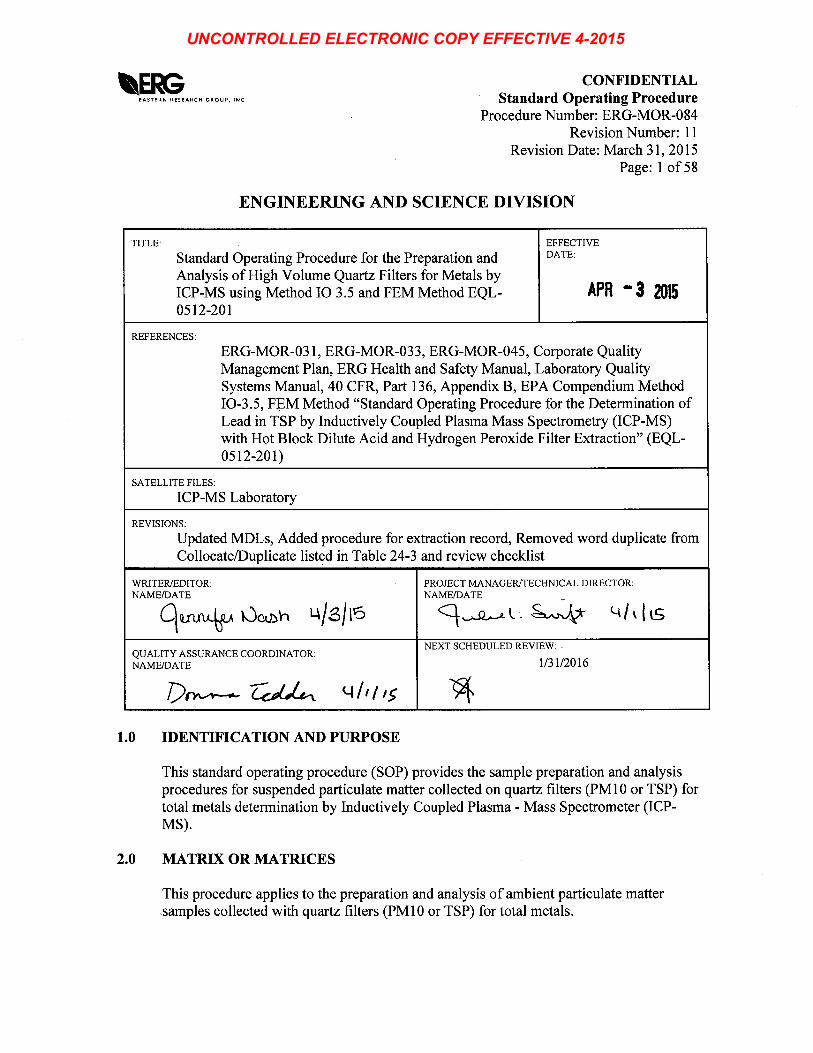
UNCONTROLLED ELECTRONIC COPY EFFECTIVE 4-2015

CONFIDENTIAL Standard Operating Procedure Procedure Number: ERG-MOR-084 Revision Number: 11 Revision Date: March 31, 2015 Page: 2 of 58 3.0 METHOD DETECTION LIMIT
3.1 Method Detection Limits (MDL)
3.1.1 The method detection limit (MDL) for each isotope is calculated
according to Appendix D: DQ FAC Single Laboratory Procedure v2.4, 8/30/2007. MDL values are determined from historic method blank (BLK2) data following the procedures outlined in the document above.
3.1.2 The y-intercept for each linear calibration must be set to zero. 3.1.3 Use the same internal standards, calibration standards, instrument method
and settings (sweeps and dwell) for the MDL study and field sample analysis.
3.1.4 The MDL determination should be reported in ng/L, ng/filter and ng/m3
(assuming 2000 m3 per sample). Refer to Table 24-1. 3.1.5 The MDL study should be repeated once per year and whenever a
significant change in background or instrument response is expected (e.g., detector change).
4.0 SCOPE AND APPLICATION
4.1 Scope
This procedure details the acid extraction and trace elemental analysis of ambient air samples using an inductively coupled plasma-mass spectrometer (ICP-MS). The extraction procedures are suitable for high-volume ambient air samples collected on quartz membrane filters, sized 8 x 10”. The procedure is applicable, but not limited to the metals listed in Table 24-1.
4.2 Applicability
This SOP is applicable to the analysis of suspended particulate matter collected with quartz filters. Acid digestion and filtration is required prior to analysis of quartz filter extracts. Analytes for which ERG has demonstrated the acceptability of this method are listed below. See Table 24-7 for a list of isotopes used for quantitation and monitoring.
UNCONTROLLED ELECTRONIC COPY EFFECTIVE 4-2015

CONFIDENTIAL Standard Operating Procedure Procedure Number: ERG-MOR-084 Revision Number: 11 Revision Date: March 31, 2015 Page: 3 of 58
Element Symbol CASRN Aluminum* Al 7429-90-5 Antimony Sb 7440-36-0 Arsenic As 7440-38-2 Barium* Ba 7440-39-3 Beryllium Be 7440-41-7 Cadmium Cd 7440-43-9 Calcium* Ca 7440-70-2 Chromium Cr 7440-47-3 Cobalt Co 7440-48-4 Copper* Cu 7440-50-8 Iron* Fe 7439-89-6 Lead Pb 7439-92-1 Magnesium Mg 7439-95-4 Manganese Mn 7439-96-5 Mercury Hg 7439-97-6 Molybdenum* Mo 7439-98-7 Nickel Ni 7440-02-0 Rubidium* Rb 7440-17-7 Selenium Se 7782-49-2 Strontium* Sr 7440-24-6 Thallium* Tl 7440-28-0 Thorium* Th 7440-29-1 Uranium* U 7440-61-1 Zinc* Zn 7440-66-6
* Elements not on our standard EPA UATMP/NATTS analysis list of elements. 5.0 METHOD SUMMARY
This SOP describes the multi-elemental determination of total metals by ICP-MS in ambient air samples collected on quartz filters following guidelines in EPA method IO-3.5 and EPA FEM Method “Standard Operating Procedure for the Determination of Lead in TSP by Inductively Coupled Plasma Mass Spectrometry (ICP-MS) with Hot Block Dilute Acid and Hydrogen Peroxide Filter Extraction” (EQL-0512-201). An 8"x 1" portion is cut from the exposed filter. The filter is digested in a HotBlock™ for 2.5 hours using an extraction fluid containing 1.5% hydrochloric acid (HCl), 5.55% nitric acid (HNO3) and 25 mg/L Au for mercury stabilization. Two aliquots of hydrogen peroxide (H2O2) are added after 1.5 hours and 2.0 hours of extraction and are allowed to effervesce. The extract is filtered and analyzed by ICP-MS. Data are collected using the manufacturer’s software.
UNCONTROLLED ELECTRONIC COPY EFFECTIVE 4-2015

CONFIDENTIAL Standard Operating Procedure Procedure Number: ERG-MOR-084 Revision Number: 11 Revision Date: March 31, 2015 Page: 4 of 58 6.0 DEFINITIONS AND ABBREVIATIONS
6.1 Definitions
6.1.1 Analytical Duplicate (DUP). A second aliquot of a sample extract that is analyzed from the original sample in order to determine the precision of the method. This sample is also referred to as a replicate. See Section 16.4 for further elaboration on duplicates.
6.1.2 Blank (BLK). An analytical sample designed to assess specific sources of
contamination. In this method there are two BLKs, the Laboratory Reagent Blank (LRB), which is always reported as BLK1 and the Method Blank (MB), which is always reported as BLK2.
6.1.3 Blank Spike (BS). A quality control sample (QCS) that contains a quartz
filter strip spiked with a known quantity of analytes that is carried through the entire extraction process. This sample is synonymous with the Laboratory Control Sample (LCS).
6.1.4 Calibration Blank. A blank solution containing all of the reagents in the
same concentration as those used in the analytical sample preparation when brought to final volume. This blank is not subject to the preparation method but contain the same matrix (i.e., the same amount of reagents and/or preservatives) as the sample preparations to be analyzed.
6.1.5 Calibration Standards. A series of known standard solutions used by the
analyst for calibration of the instrument (i.e., preparation of the analytical curve). The solutions are not subject to the preparation method but contain the same matrix (i.e., the same amount of reagents and/or preservatives) as the sample preparations to be analyzed.
6.1.6 Continuing Calibration Blank (CCB). A volume of ASTM Type I water
acidified with the same acid matrix as is present in the calibration standards used to verify after every CCV that the instrument blank checks are reading ≤ MDL.
6.1.7 Continuing Calibration Verification (CCV). A multi-element standard
solution prepared by the analyst and used to verify the stability of the instrument calibration with time, and the instrument performance during the analysis of samples. The CCV is the original calibration standard, whose concentration is at the midpoint of the calibration curve that is re-analyzed as a quality control (QC) sample.
UNCONTROLLED ELECTRONIC COPY EFFECTIVE 4-2015

CONFIDENTIAL Standard Operating Procedure Procedure Number: ERG-MOR-084 Revision Number: 11 Revision Date: March 31, 2015 Page: 5 of 58
6.1.8 Field Blank (FB). This is any sample that is submitted from the field and is identified as a blank. This also includes trip blanks.
6.1.9 High Standard Verification (HSV). The HSV is the highest calibration
standard that is reanalyzed after the ICB and before the analysis of samples to verify the accuracy of the calibration curve at that concentration.
6.1.10 Initial Calibration Blank (ICB). The ICB is a re-analysis of the
calibration blank, which is analyzed after the Initial Calibration Verification (ICV) and used to verify that the instrument blank checks read ≤ MDL.
6.1.11 Initial Calibration Verification (ICV). A solution prepared from a stock
standard solution obtained from a source separate from that utilized to prepare the calibration standards. The ICV is used to verify the concentration of the calibration standards and the adequacy of the instrument calibration.
6.1.12 Interference Check Standard (ICS). A solution that may contain only
interfering elements (ICSA) or both interfering elements and analytes of interest (ICSAB) in known concentrations that can be used to verify background and interference correction equations.
6.1.13 Interferents. Substances (atoms, ions, polyatomic ions, etc.) which may
affect the analytical result for the element of interest. 6.1.14 Internal Standard (ISTD). A non-target element added to a sample at a
known concentration after preparation but prior to analysis. Instrument responses to internal standards are monitored as a means of assessing overall instrument performance.
6.1.15 Laboratory Control Sample (LCS). A spiked aliquot of LRB with a
blank quartz filter used as a QCS that is prepared and brought through the entire digestion/extraction and analytical process to demonstrate spike recoveries. This sample is synonymous with the BS.
6.1.16 Laboratory Reagent Blank (LRB). An aliquot of ASTM Type I water
that is treated exactly as a sample including exposure to all labware, equipment, solvents, reagents and internal standards that are used with other samples that is always reported as BLK1. The LRB is used to determine if method analytes or other interferences are present in the laboratory environment, the reagents or apparatus.
UNCONTROLLED ELECTRONIC COPY EFFECTIVE 4-2015

CONFIDENTIAL Standard Operating Procedure Procedure Number: ERG-MOR-084 Revision Number: 11 Revision Date: March 31, 2015 Page: 6 of 58
6.1.17 Limit of Quantitation (LOQ). The lowest concentration of an analyte that produces a signal/response that is sufficiently greater than the signal/response of lab reagent blanks to enable reliable detection and quantification during routine lab operating conditions. Statistically defined, this is the concentration of analyte in sample matrix that produces an instrument signal/response that is 10 times the standard deviation above the LRB (at 99% confidence, n-1 degree freedom; see Table 24-2).
6.1.18 Linear Dynamic Range (LDR). The concentration range over which the
analytical working curve generated from the calibration standards is proven to remain linear. See Section 13.8 for more information on the LDR.
6.1.19 Lower Limit of Quantitation Check (LLQC). A check sample that is used to both establish and confirm the lower limit of quantitation and is prepared by spiking a low concentration of analyte into reagent water and carrying the solution through the entire preparation and analytical procedure.
6.1.20 Lower Limit of Quantitation Limit (LLQL). The lower limit of quantitation is considered the lowest reliable laboratory reporting concentrations and should be established from the lower limit of quantitation check sample and then confirmed using the lowest calibration point and/or from a low level calibration check standard.
6.1.21 Low Level Calibration Verification (LCV). A stock standard solution prepared using the same source as the calibration standards that is analyzed to verify the LLQL. The standard is prepared at the same concentration as the LLQL. An LCV is analyzed at the beginning, typically just before or after CCV1, and at the end of every analysis just before or after the final CCV.
6.1.22 Matrix Interference/Effect. In general, the interference and/or effect that
particular matrix constituents may cause during sample processing and/or analysis. Matrix effects may be determined to exist from the careful interpretation of QC samples and criteria. Examples of observed effects include but are not limited to poor recoveries of spikes/ISTD and poor percent differences.
6.1.23 Matrix Spike and Matrix Spike Duplicate (MS/MSD). A sample chosen
in a batch where additional filter strips are spiked prior to digestion/extraction with known quantities of specific analytes and carried through the entire analytical process to demonstrate their spike recoveries and precision.
UNCONTROLLED ELECTRONIC COPY EFFECTIVE 4-2015

CONFIDENTIAL Standard Operating Procedure Procedure Number: ERG-MOR-084 Revision Number: 11 Revision Date: March 31, 2015 Page: 7 of 58
6.1.24 Method Blank (MB). An aliquot of LRB with a blank quartz filter strip that is carried through the entire preparation and extraction process to demonstrate background contamination contribution from the filter and process and is always reported as BLK2.
6.1.25 Method Detection Limit (MDL). The minimum concentration of an
analyte that can be identified, measured, and reported with 99% confidence that the analyte concentration is greater than zero.
6.1.26 Performance Evaluation (PE) Sample. A sample of known composition
provided by a source outside the laboratory for analysis that evaluates the laboratory’s analytical performance.
6.1.27 Post Digestion Spike (PDS). A spiked aliquot of an already digested
sample used to demonstrate spike recoveries in the sample matrix when MS/MSD samples cannot be made. The analytical results of this spike may also be used to verify matrix interference in conjunction with the SRD results when the MS/MSD fail to meet criteria.
6.1.28 Quality Control Sample (QCS). A solution containing known
concentrations of method analytes that is used to fortify an aliquot of LRB matrix. The QCS is prepared from a source(s) external to the laboratory and is used to verify the laboratory’s analytical performance.
6.1.29 Serial Dilution (SRD). The dilution of a sample by a factor of five. If the
undiluted parent sample concentration is minimally a factor of 50 above the MDL, the diluted sample should agree with the parent sample concentration within ± 10% when corrected by the dilution factor. The SRD may indicate the influence of interferents.
6.1.30 Standard Reference Material (SRM). A prepared standard material that has certified metals concentrations, for example the NIST SRM 1648a (Urban particulate matter with certified concentrations of lead at 0.655 ± 0.033 mass fraction (in %)). The SRM is used to verify the extraction procedure.
6.1.31 Stock Standard Solution. A commercially prepared standard solution
(traceable to NIST or other certified standard sources), which can be diluted to derive other standards.
6.1.32 Tuning Solution. A solution used to determine acceptable instrument
performance prior to calibration and sample analyses. This solution is used for mass calibration, nebulizer optimization, auto lens optimization, and daily performance reports.
UNCONTROLLED ELECTRONIC COPY EFFECTIVE 4-2015
CONFIDENTIAL Standard Operating Procedure Procedure Number: ERG-MOR-084 Revision Number: 11 Revision Date: March 31, 2015 Page: 8 of 58
6.2 Abbreviations
amu Atomic Mass Units ASTM American Society for Testing and Materials CASRN Chemical Abstract Services Registry Number COC Chain of Custody cps Counts Per Second DI Deionized DQO Data Quality Objective HNO3 Nitric Acid ICP-MS Inductively Coupled Plasma - Mass Spectrometry kW Kilowatts L Liter(s) LDPE Low Density Polyethelyene LIMS Laboratory Information Management System MΩ Megohm MCA Multichannel Analyzer MQO Method Quality Objectives m Meter(s) m3 Cubic Meter(s) mg Milligram(s) mg/L Milligram(s) per liter(s) min Minute(s) mL Milliliter(s) mm Millimeter(s) ms Millisecond(s) ng Nanogram(s) ng/L Nanogram(s) per liter(s) ng/mL Nanogram(s) per milliliter(s) NIST National Institute of Standards and Technology QC Quality Control RSD Relative Standard Deviation RPD Relative Percent Difference SD Standard Deviation SOP Standard Operating Procedure Std. Standard μg/L Microgram(s) per liter μg/m3 Microgram(s) per cubic meter(s) μg/mL Microgram(s) per milliliter(s) μL Microliter (s) μm Micrometer v/v Volume per volume ratio
UNCONTROLLED ELECTRONIC COPY EFFECTIVE 4-2015
CONFIDENTIAL Standard Operating Procedure Procedure Number: ERG-MOR-084 Revision Number: 11 Revision Date: March 31, 2015 Page: 9 of 58 7.0 INTERFERENCES
Note: The background level of metals on a given lot of quartz filters can vary. Any background levels found on blanks should be documented for all the filters from the corresponding lot when available. It is recommended to consult 40 CFR Part 50, Section 6.1 Appendix G for guidance.
7.1 Laboratory Interferences
7.1.1 Wear powder-free nitrile or neoprene gloves when handling unexposed or
exposed filters.
7.1.2 Clean all equipment used in the sample preparation and analysis in a manner consistent with good laboratory practices for metals analysis (See Section 20.3 in this SOP and Section 14.3.1 in SOP ERG-MOR-031).
7.1.3 Use ASTM Type I DI water or equivalent, with a resistivity greater than
17.3 MΩ, for sample extraction and standard preparation. Record the water resistivity prior to use.
7.2 Chemical Interferences
Pay close attention to the nature of solutions introduced to the ICP-MS.
7.2.1 Nitric acid must be less than 2% (v/v) for ICP-MS analysis to minimize
the damage to the interface and to minimize isobaric molecular interferences. The use of platinum cones and other acid-resistant sample introduction components can be used for more aggressive acid matrices.
7.2.2 If higher acid extractions are required, dilute final digestate to 2% HNO3.
7.2.3 The final dilutions of sample extracts must match the acid content of the
calibration standards in order to match potential interferences.
7.2.4 The concentrations of dissolved solids in analysis solutions should be less than 2% to protect the sample interface on the instrument and prevent signal suppression. Higher concentrations may plug the sample and/or skimmer cone orifices.
Note: Protect the channel electron multiplier from high chemical
concentrations (high ion currents). The channel electron multiplier suffers from fatigue after being exposed to high ion currents. This fatigue can last from several seconds to hours depending on the extent of exposure. During this period, response factors are constantly changing, which causes
UNCONTROLLED ELECTRONIC COPY EFFECTIVE 4-2015

CONFIDENTIAL Standard Operating Procedure Procedure Number: ERG-MOR-084 Revision Number: 11 Revision Date: March 31, 2015 Page: 10 of 58
instrument instability that invalidates the calibration curve, and thereby, invalidates all associated sample results. A sodium bicarbonate (NaHCO3) sample matrix is known to cause this problem.
7.3 Instrument Interferences
7.3.1 Isobaric molecular and doubly charged ion interferences are caused by
polyatomic ions (e.g., the contribution of ArCl on the 75As signal) or more than one charge (example, MoO+ ions on Cd isotopes).
7.3.2 Spectral interferences result from the presence of other isotopes or ions
that have the same atomic weight or mass number as the analyte.
7.3.3 Transport interferences are a specific physical interference associated with the sample nebulization and transport process through the instrument. These usually result from sample matrix components that influence the aerosol formation or cause a change in the surface tension or viscosity. Changes in the matrix composition can cause observed signal suppression or enhancement.
7.3.4 Matrix interferences may be caused by elemental chemical and physical
properties in the samples. For matrices of known composition, match the composition of the calibration and QC standards to that of the samples. For matrices of unknown composition, use an ISTD that has been matched to the analytes’ chemical and physical properties (i.e., ionization potential, ±50 amu) so that the ISTD and element of interest behave similarly during the analytical process.
7.3.5 Memory interferences can occur when there are large concentration
differences between samples or standards that are analyzed sequentially. Sample deposition on the sample and skimmer cones, spray chamber, peristaltic pump tubing and the type of nebulizer all affect the extent of the memory interferences that are observed. The rinse period between samples must be long enough to eliminate significant memory interferences.
7.3.6 Lead values are reported from isotope 208; however, all three isotopes must be used to quantitate lead to allow for the variability of lead isotopes in nature. The following correction equation must be applied to isotope 208:
(1.000) (206Pb) + (1.000) (207Pb) + (1.000) (208Pb)
UNCONTROLLED ELECTRONIC COPY EFFECTIVE 4-2015

CONFIDENTIAL Standard Operating Procedure Procedure Number: ERG-MOR-084 Revision Number: 11 Revision Date: March 31, 2015 Page: 11 of 58 8.0 SAFETY
8.1 Personal protection should be used for all work performed in the inorganic laboratory, (e.g., gloves, safety glasses, laboratory coats, etc.).
8.2 The compressed gas cylinders must be stored and handled according to relevant
safety codes outlined in the corporate health and safety manual. In use, the cylinders must be secured to an immovable structure and moved using a gas cylinder cart.
8.3 Make sure that sample vials are kept capped and in racks to prevent spills.
8.4 All personnel should be trained in the handling, extraction and analysis of acid
samples for inorganic analysis. 8.5 Strong acids must not be stored with organic solvents or samples.
8.6 Follow normal laboratory safety procedures as outlined in the ERG Health and
Safety Manual and the site-specific laboratory SOP.
9.0 EQUIPMENT
9.1 ICP-MS
The PerkinElmer SCIEX™ ELAN® 9000 ICP-MS consists of an inductively coupled plasma source, ion optics, a quadrupole mass spectrometer, a computer that controls the instrument, data acquisition and data handling software (ELAN® Software SCIEXTM, Version 3.4), a printer, an autosampler (AS-93plus) and a recirculator. The quadrupole mass spectrometer has a mass range of 2 to 270 amu. Typical operating conditions are listed below. Typical Operating Conditions Plasma forward power 1.3 kW Plasma/Coolant argon flow rate 13.8 L/min Auxiliary argon flow rate 1.2 L/min Nebulizer flow rate 0.9 L/min Solution uptake rate 1.0 mL/min Spray chamber temperature Room Temperature Detector mode Dual (Pulse counting/Analog) Replicate integrations 3 Mass range 6 - 240 amu Dwell time 50 ms Number of MCA channels 1
UNCONTROLLED ELECTRONIC COPY EFFECTIVE 4-2015

CONFIDENTIAL Standard Operating Procedure Procedure Number: ERG-MOR-084 Revision Number: 11 Revision Date: March 31, 2015 Page: 12 of 58
Number of scan sweeps 20 Total acquisition time 4.2 min/sample
9.2 Digestion System
Environmental Express HotBlock™ Digestion System or equivalent system capable of maintaining a temperature of 95°C within ± 2˚C. This temperature will heat the samples to a temperature of ~85°C (±5°C).
10.0 MATERIALS
10.1 Graduated polypropylene sample vials with screw caps, 50 mL volume (certified to be within ± 0.2mL).
10.2 Branson 8510, sonication bath with heating capability.
10.3 Pipetters with adjustable volumes ranging from 0.5 μL to 10 mL and disposable
tips. Mechanical pipettes must be verified for accuracy quarterly (or every three months). Repeatable, mechanical pipettes, such as Eppendorf Research®, may be used and their accuracy should be verified on a quarterly basis to be within the manufacturer’s specifications. If a pipette’s accuracy exceeds the manufacturer’s specifications its use should be discontinued and it should be replaced or sent in for repair.
10.4 Reflux caps and FilterMate™ 2 μm Teflon® filters with plungers.
10.5 Miscellaneous: powder-free nitrile or neoprene gloves; disposable laboratory
wipes; self adhesive labels. 10.6 Volumetric flasks. Teflon®, Class A: 50, 100, 250 and 500 mL capacities.
10.7 Storage bottles. Wide and narrow mouth, Teflon® FEP (fluorinated ethylene propylene) with Tefzel ETFE (ethylene tetraflourethylene) screw closure: 50, 100, 250, 500, 1,000 and 2,000 mL capacities.
10.8 Wash bottles made of LDPE and Teflon® having 500 mL and 1 L capacities. 10.9 Plastic or Teflon® coated tweezers and Teflon stirring rods. 10.10 Filter cutting apparatus with 2 part Plexiglas board and plastic rotary cutter.
UNCONTROLLED ELECTRONIC COPY EFFECTIVE 4-2015

CONFIDENTIAL Standard Operating Procedure Procedure Number: ERG-MOR-084 Revision Number: 11 Revision Date: March 31, 2015 Page: 13 of 58 11.0 CHEMICALS, REAGENTS, STANDARDS AND THEIR PREPARATION
Note: In general, chemicals, reagents and commercial stock standards expire when specified by the manufacturer. If the manufacturer does not provide an expiration date then they shall expire one year from the opened date. Standards and other solutions prepared in-house expire as specified throughout the SOP. Proper disposal of hazardous wastes are discussed in detail in the Solid and Hazardous Wastes SOP (ERG-MOR-033). 11.1 High Purity Acids - ultrapure and concentrated stored in Teflon® Bottles. These
reagents are used for the preparation of sample extraction fluid and all standards. Note: Concentrated high purity reagents are not 100% of the specified reagent. It
should be understood that all percentages in this SOP are expressed in terms of volume per volume (v/v) rather than true percentages of reagent in solution.
11.1.1 Nitric Acid (HNO3), 60-70% 11.1.2 Hydrochloric Acid (HCl), 32-35% 11.1.3 Extraction fluid (1.5% (v/v) HCl, 5.55% (v/v) HNO3, and 25 mg/L Au). 11.1.4 Standard solvent (0.3% (v/v) HCl, 1.11% (v/v) HNO3 with 5 mg/L Au)
11.2 Hydrogen Peroxide (H2O2) - ultrapure and concentrated (30-32%) stored in
Teflon® bottles. This reagent is used in the extraction procedure.
11.3 Nitric Acid-Trace Metal Grade in 2.5 L glass for rinse blank and labware cleaning.
11.3.1 Rinse blank (2% (v/v) HNO3, 0.5% (v/v) HCl with 5 mg/L Au)
11.3.2 10% (v/v) HNO3 acid bath for labware cleaning
Preparation: The acid bath solution is prepared by adding 2.5L of concentrated trace metal grade HNO3 to 22.5 L of ASTM Type I DI water in a clean 42 L polypropylene acid bath tank. The acid bath should be stored in a fume hood.
11.4 ASTM Type I deionized water - with a resistivity greater than 17.3 MΩ.
11.5 Argon gas - purity > 99.996%, Oxygen < 5 mg/L, Hydrogen < 1 mg/L, Nitrogen
< 20 mg/L and Water < 4 mg/L.
UNCONTROLLED ELECTRONIC COPY EFFECTIVE 4-2015

CONFIDENTIAL Standard Operating Procedure Procedure Number: ERG-MOR-084 Revision Number: 11 Revision Date: March 31, 2015 Page: 14 of 58
11.6 Secondary Source Control Standards - A commercially prepared single- or multi-element standard from a secondary source (different manufacturer from the multi-element calibration standard). These NIST traceable calibration standards are used to produce the ICV, which is run as a verification of the instrument’s calibration for accuracy and precision.
11.7 Single-Element Stock Standard Solutions - Commercially prepared NIST
traceable standards from ultra high-purity grade chemicals or metals (99.99 – 99.999% pure) designed for use with ICP-MS instruments (e.g., Mercury Std.).
11.8 Multi-Element Stock Standard Solutions - Commercially prepared NIST traceable
standards from ultra high-purity grade chemicals or metals (99.99 – 99.999% pure) designed for use with ICP-MS instruments (e.g., ISTD solution).
11.9 Interference Check Standard - Commercially prepared standard that is diluted to
prepare ICSA and ICSAB interferent checks. 11.10 Smart Tune Solution - Although custom tuning solutions may be used, the tuning
solution for this SOP may be purchased through the manufacturer (Perkin Elmer #N8125040) or is prepared in-house using single-element standards to contain 10 μg/L of Be, Mg, Co, Rh, In, Ba, Ce, Pb, and U in 1% (v/v) HNO3.
To prepare 1 L of this solution, add 10 mL of Ultrex Nitric Acid to ~ 900 mL of ASTM Type I deionized water and add 10 μL of each 1,000 μg/mL single-element standard, then bring to volume. This solution may be stored in LDPE bottles but ideally in Teflon®. The expiration date is either that specified by the manufacturer or if prepared in-house, no later than the earliest expiration date of any standard used for preparation.
11.11 Dual Detector Cross Calibration Solution - Refer to Section 13.3 for the purpose
and final concentration of this solution. Although custom cross calibration solutions can be used, it may be purchased through the manufacturer (Perkin Elmer #8125032) or prepared in-house using single-element standards.
11.12 Multi-element ISTD stock standard – Commercially prepared standard that is
used in conjunction with the single-element standards for Sc, Ga, and Li to prepare the internal standard.
11.13 Internal Standard Spike Solution - Prepared standard used to manually spike all
calibration and QC standards as well as all samples that are analyzed by the ICP-MS.
UNCONTROLLED ELECTRONIC COPY EFFECTIVE 4-2015
CONFIDENTIAL Standard Operating Procedure Procedure Number: ERG-MOR-084 Revision Number: 11 Revision Date: March 31, 2015 Page: 15 of 58
11.14 Matrix Spike (MS) Standard - The MS standard is used to spike the BS/LCS and MS/MSD (See Section 16.3.2). Prepare the MS standard according to Table 24-6 with a final volume of 50 mL.
11.15 Post Digestion Spike (PDS) Standard - The PDS standard is used to spike the PDS
source sample. This post digestion spike is used to help determine if poor matrix spike recoveries are due to interferents. Spike 1 µL per 1 mL of sample analyzed.
11.16 Second Source Working Standard - The second source working standard is used
to create the ICV. 11.17 Citranox® Acid Cleaner and Detergent - Prepare a 5% solution by adding 500 mL
of Citranox® to 9.5 L of warm – hot tap water for labware cleaning and decontamination. This detergent bath should be changed about once every month, depending on use.
11.18 Standard Reference Material (SRM) - The standard reference material used to
prepare the SRM samples. NIST SRM 1648a (Urban particulate matter with certified concentrations of lead at 0.655 ± 0.033 mass fraction (in %) is used to verify the extraction procedure.
11.19 Lower Limit of Quantitation Check (LLQC) - This quality control sample is used to determine the LLQL, and is prepared by creating a spike solution that will create a final concentration of analyte in the sample matrix that produces and instrument signal/response that is 10x the standard deviation above the lab reagent blank (at 99% confidence; n-1 degrees of freedom). Lower limits of quantitation are verified when all analytes in the LLQC sample are detected within ± 30% of their true value.
12.0 COLLECTION, PRESERVATION, SHIPMENT, AND STORAGE
12.1 Collection and Handling of Filters
Whenever the filter is handled use clean disposable nitrile or neoprene gloves and if necessary clean Teflon® coated (no exposed metal surfaces) or plastic tweezers. Never touch the particulate laden surface of the filter and take care not to puncture or damage the filter with the tweezers. The filter should be folded in half lengthwise to prevent loss of particulate. See Section 16.1 for more information about filter condition.
12.2 Preservation and Storage of Filters
Samples do not have a preservative and can be stored for up to 180 days in ambient conditions. Upon retrieval from field sampling during humid or rainy
UNCONTROLLED ELECTRONIC COPY EFFECTIVE 4-2015

CONFIDENTIAL Standard Operating Procedure Procedure Number: ERG-MOR-084 Revision Number: 11 Revision Date: March 31, 2015 Page: 16 of 58
conditions be certain the filter is not moisture-laden. Damp filters may stick to the sample transport container causing damage and thereby invalidating the sample. If the sample is found to be moisture-laden allow the membrane to dry before enclosing in the transport container. Once the filter arrives at the laboratory, a unique LIMS identification number is assigned and placed on the outside of the COC, sample envelope and/or container for tracking and storage purposes. Extraction hold time is 180 days from the sample date.
12.3 Shipment of Filters
When filters are shipped to or from the laboratory follow proper handling instructions in Section 12.1 and take proper precautions when packing such that filters are not exposed to contaminants or damage during shipment.
13.0 CALIBRATION AND STANDARDIZATION
13.1 Daily Optimization Procedures
Daily optimization is performed through the software’s Smart Tune Wizard. Refer to Tables 24-4 and 24-5 for Optimization Procedures and Performance Specifications respectively. For more detailed information, the PerkinElmer Elan Version 3.4 Software Reference Guide is also available for reference as a PDF file on the desktop of the instrument computer.
13.2 Mass Calibration and Resolution
Before performing any kind of calibration or optimization, allow a period of not less than 30 minutes (preferably 1 hour) for instrument warm-up. After the warm-up, the mass calibration and resolution may be optimized using the tuning solution (see Section 11.11) by running a mass calibration and resolution optimization through the Smart Tune Wizard. Resolution at low mass is indicated by magnesium isotopes 24, 25, and 26. Resolution at high mass is indicated by lead isotopes 206, 207, and 208. These peaks may be viewed in the Interactive graphics window. For optimal performance, adjust spectrometer mass calibration to ± 0.05 amu and the resolution to produce a peak width of 0.70 ± 0.1 amu at 5% peak height. Repeat mass calibration and resolution optimization if it has shifted by more than ± 0.05 or ±0.1 amu respectively.
13.3 Dual Detector Cross Calibration
The dual detector cross calibration is used to provide a smooth transition from the pulse counting mode to the analog mode, which extends the linear dynamic range of the detector. Typically a 2% (v/v) nitric acid solution containing 200 µg/L of Mg, Cu, Rh, Cd, and Pb as well as 2000 µg/L of Be is used for this calibration
UNCONTROLLED ELECTRONIC COPY EFFECTIVE 4-2015
CONFIDENTIAL Standard Operating Procedure Procedure Number: ERG-MOR-084 Revision Number: 11 Revision Date: March 31, 2015 Page: 17 of 58
although custom solutions may be used. This calibration must be performed daily before each analysis to report values above the HCV.
13.4 Daily Performance
13.4.1 The daily performance report must be generated daily or before each analysis, whichever is more frequent.
13.4.2 Instrument stability must be demonstrated by running a daily performance
check using the tuning solution. A minimum of five replicates with resulting relative standard deviations of absolute signals for all analytes of less than 3% is required prior to calibration. Performance specifications for the daily performance are listed in Table 24-5.
13.5 Calibration
13.5.1 Prior to initial calibration, set up proper instrument software routines for
quantitative analysis (i.e., autosampler table, QC sample names etc.). The instrument must be calibrated using a minimum of a calibration blank and four non-zero calibration standards. Consideration should be give to adding more standards, particularly lower concentrations, in order to better define the LDR and quantitation limit (QL). A minimum of three replicate integrations with an RSD < 10.0% are required for data acquisition. RSDs > 10.0% are allowed for the first non-zero calibration standard (CAL2). Use the average of the integrations for instrument calibration and data reporting. To be considered acceptable, the calibration curve should have a correlation coefficient ≥ 0.998.
For a linear calibration to be considered acceptable, the calibration curve should have a correlation coefficient ≥ 0.998. The resulting curve should then be verified with mid-level and low-level calibration standards as described in Section 16.6.
Preparation: Non-blank calibration standards are prepared by diluting the calibration working standard to appropriate levels using the standard solvent.
13.5.2 For matrices of known composition, match the composition of the
calibration and QC standards to that of the samples. For matrices of unknown composition, use an ISTD that has been matched to the analytes chemical and physical properties (i.e., ionization potential, ±50 amu) so that the ISTD and element of interest behave similarly during the analytical process.
UNCONTROLLED ELECTRONIC COPY EFFECTIVE 4-2015
CONFIDENTIAL Standard Operating Procedure Procedure Number: ERG-MOR-084 Revision Number: 11 Revision Date: March 31, 2015 Page: 18 of 58
13.5.3 The rinse blank should flush the system between solution changes for blanks, standards, and samples. Allow sufficient rinse time (≥ 1 min) to remove traces of the previous sample. Solutions should aspirate for at least 30 seconds prior to the acquisition of data to establish equilibrium.
13.5.4 Refer to Section 11.1.4 for the preparation of standard solvent. Once
prepared, all calibration standards must be stored in Teflon® bottles/flasks.
Note: Commercial stock standards used to prepare calibration standards and other quality control standards must be used within their expiration date. Calibration blanks/standards and other QC standards made from the stock standards may be set to expire no later than the earliest expiration date of any standard used for preparation.
13.5.5 Refer to the quality control requirements presented in Table 24-3 for
calibration acceptance criteria.
13.6 Internal Standardization
13.6.1 Internal standardization must be used in all analyses to correct for instrument drift and physical interferences. ISTD quality control requirements as described in Section 16.7 must be followed.
13.6.2 Internal standards (ISTD) for this method are 45Sc, 69Ga, 89Y, 115In, and
209Bi for analytes beginning with mass 6 and ending with mass 238. The ISTDs 6Li, 72Ge, 103Rh, 159Tb & 165Ho may also be used if necessary. Internal standards must be manually added to each calibration standard after they are brought to volume in the proportion of 2.0 µL for every 1 mL. For example, add 200 µL of ISTD solution to a 100 mL standard.
13.6.3 Concentrations of the internal standards for this method are determined by
the concentration of each element that will produce an intensity that is sufficiently stable. Typical intensities are between 200,000 and 500,000 cps; however, ideal intensities may be as high as 1,000,000 cps.
13.6.4 The concentration of the internal standard must be added equally and in
the same manner to the calibration blank/standards, QC standards and samples.
13.6.5 Internal standardization must be used in all analyses to correct for
instrument drift and physical interferences. However, be aware that internal standards themselves may be responsible for polyatomic and/or doubly charged interferences.
UNCONTROLLED ELECTRONIC COPY EFFECTIVE 4-2015

CONFIDENTIAL Standard Operating Procedure Procedure Number: ERG-MOR-084 Revision Number: 11 Revision Date: March 31, 2015 Page: 19 of 58
13.7 Instrument Performance
13.7.1 After instrument calibration, an ICV and ICB must be analyzed for initial verification of the calibration curve. Refer to Sections 16.6.1, 16.2.2, and Table 24-3 for specific QC criteria.
13.7.2 To verify that the instrument is properly calibrated on a continuing basis,
analyze a CCV and CCB before the analysis of samples and after every 10 samples.
13.8 Linear Dynamic Range (LDR)
The LDR study is performed every 6 months to determine the maximum concentration level at which the initial calibration is linear. The recovery criteria for the LDR are 90-110%. Dilutions must be performed for elements with concentrations over 90% of the established LDR. If an LDR study has not been performed within 6 months, any analytes with concentrations over the highest calibration concentration must be diluted.
13.9 Lower Limit of Quantitation Limit (LLQL)
The LLQL study is performed every 6 months to determine the lowest concentration level at which data may be reported. This is done by extracting and analyzing a lower limit quantitation check (LLQC). The recovery criterion for the LLQC is 70-130%. Any results reported below the LLQL must be qualified as an estimated value.
14.0 PROCEDURE
14.1 LIMS Batch Procedure
Note: Please perform the following procedure the same day that you plan to begin the extraction. If something happens and the extraction cannot be performed, edit the bench sheet with the correct extraction date, both in LIMS and on the hardcopy bench sheets. 14.1.1 Log into Element. 14.1.2 From the “Laboratory” menu, select “Batch.” 14.1.3 With the Inorganics department selected from the drop-down menu at the
left of the screen, click “Add” at the bottom, left-hand corner. A blank bench sheet will appear. The following information should be input into
UNCONTROLLED ELECTRONIC COPY EFFECTIVE 4-2015

CONFIDENTIAL Standard Operating Procedure Procedure Number: ERG-MOR-084 Revision Number: 11 Revision Date: March 31, 2015 Page: 20 of 58
the bench sheet using the drop-down menus: 1) Preparation Method: ICP-MS Extraction and 2) Batch Matrix: Air
14.1.4 Select the appropriate inorganic analysis (“Metals Analysis – HiVol
20xx”) from the “Available” analysis box and press the right-facing arrow button.
Note: Options: 1.) Additional information may be added in the “comments” box for batches that are different from standard samples, for example samples that are for the Midlothian or Schools projects. Reagent lot numbers used in the extraction are also added in the comments section. 2.) You may choose to press “Copy” instead of “Add” from Step3. Use caution here, as both the analysis and comments from the copied batch will be included in the new batch and this information may need to be changed.
14.1.5 Press the save button. The new LIMS-created batch number will be visible
in the box to the left of the screen. 14.1.6 Select the “Bench Sheet” button at the bottom of the screen. This is where
you will include sample information and appropriate batch QC. 14.1.7 Click “Edit” at the bottom of the new screen. 14.1.8 At the top of the screen, press “Add” and select “Sample by Container.”
Select the samples from the list that you would like to include in the batch. For each sample, the following information needs to be included: 1) Initial (m3): This is the total flow through the filter as it was being sampled in the field. This information can be found or calculated from the information provided on the sample chain of custodies. Field blank samples are assigned the same volume as the primary sample collected on the same day. A field blank volume may also be an average of all the filter volumes for a given month. 2) Comments: Include two spaces followed by the sample ID for each sample in the list. This includes any additional designations such as C1, C2, FB, etc.
Note: A maximum of twenty samples may be selected for any given batch. If more than 20 samples are selected, additional batch QC must also be added to the bench sheet and extracted to meet the requirements described in Table 24-3.
14.1.9 Each batch requires QC to be prepared/extracted with each batch of
twenty samples. This QC is included in the bottom box on the screen. Required QC includes:
UNCONTROLLED ELECTRONIC COPY EFFECTIVE 4-2015

CONFIDENTIAL Standard Operating Procedure Procedure Number: ERG-MOR-084 Revision Number: 11 Revision Date: March 31, 2015 Page: 21 of 58
i. Duplicate Samples: One duplicate QC sample is added per batch. Click the “Add” button at the top of the screen and select “Duplicate.” Right click on a duplicate sample to assign its source sample and initial volume. This volume will be the same as the source sample. Duplicate samples must also be added for each collocated (C1/C2) or duplicate (D1/D2) spam type to be extracted.
ii. Blank Samples: Each batch must include one reagent blank and one
method blank per twenty samples.
a.) One blank (BLK) sample is already included. To add another, click the “Add” button at the top of the screen and select “Blank.”
b.) Change the sample name by right-clicking on each blank and selecting “Name.” BLK1 should be changed to “Reagent Blank” and BLK2 should be changed to “Method Blank.”
c.) Include the blank filter number in the comments section of the
Method Blank. iii. Spiked Samples: Each batch must include two spiked samples per
twenty samples.
a.) One matrix spike (MS) and one matrix spike dup (MSD) are included for Hi-Vol extractions. Click on “Add” and select “Matrix Spike” and “Matrix Spike Dup” to include these QC. For each of these QC samples, assign the same source sample. The volume will be the same as that source sample.
b.) Identifying spikes: For both matrix spikes and laboratory control samples, the appropriate spike ID, type, and volume will need to be assigned in the same manner. Right click on the sample QC and select “Spike 1 ID.” Select the appropriate standard from the list. Edit the “Spike 1 Type” to read “Pre-prep” and the “Spike 1 Volume” to read 500uL (or whatever volume is being used.)
iv. Post Spike (PS): Each batch must include one post spike (PS) sample
per twenty samples.
a.) One post spike is automatically included for Hi-Vol extractions. Assign the appropriate spike ID, type, and volume using the instructions provided above. The correct spike amount is 50 µL and the spike type is “Post-prep.”
UNCONTROLLED ELECTRONIC COPY EFFECTIVE 4-2015

CONFIDENTIAL Standard Operating Procedure Procedure Number: ERG-MOR-084 Revision Number: 11 Revision Date: March 31, 2015 Page: 22 of 58
v. Standard Reference Material: Each batch must include one SRM per twenty samples.
a.) Click on “Add” and select “Reference” to add the SRM to the
bench sheet. Add the SRM identification number as assigned during weighing in the comments section. Identify the reference standard used by right-clicking on “Spike 1 ID” and selecting the appropriate standard. Indicate the weight of SRM digested (in mg) in the Spike 1 Volume. “Spike 1 Type” should be listed as “Pre-prep.”
14.1.10 Print two copies of the bench sheet in landscape format. Both will need to
be signed on the “Extraction Reviewed by” line and dated once the extraction is complete. One copy is to be three-hole punched and placed in the Extraction Notebook, while the other is to be kept bound to the corresponding samples in the cabinet in the lab.
14.2 Filter Extraction Procedure
14.2.1 Prior to sample processing, be sure to turn on the HotBlock ™ and select the appropriate program and initiate to allow it to warm to extraction temperature. Be sure to allow the HotBlock™ interface establish connection with the block itself (shown on the screen as “Please Wait”) prior to beginning any extraction method. Failure to do this will cause the HotBlock™ to heat to higher than intended temperatures.
14.2.2 Wipe the filter-cutting apparatus and Teflon® rotary-cutter with a
Kimwipe® prior to use. 14.2.3 If the filter is not already folded in half, carefully fold the filter in half
along the 10” length with the side containing the particulates facing on the inside of the fold. Using the filter-cutting apparatus, align the 10” folded edge of the filter along the dashed line. Cut a 4" by 1" section of the folded filter using the Teflon® rotary-cutter.
14.2.4 Carefully fold the 4" by 1" section end over end into a size just larger than
the mouth of the extraction vial. Place the folded filter into the labeled extraction vial and push to the bottom using a pre-cleaned Teflon® stirring rod for each sample to be sure the filter is below the 10 mL line.
Note: Do not place the filter flush with the bottom of the sample tube, as
this will prevent proper acid flow through the tube during extraction. It is only necessary to make sure the filter is below the 10 mL line.
UNCONTROLLED ELECTRONIC COPY EFFECTIVE 4-2015

CONFIDENTIAL Standard Operating Procedure Procedure Number: ERG-MOR-084 Revision Number: 11 Revision Date: March 31, 2015 Page: 23 of 58
14.2.5 Add 0.5 mL of Matrix Spike Solution to the LCS, MS/MSD samples. Add 10 mL of extraction fluid (1.5% HCl (v/v), 5.55% HNO3 (v/v) and 25 mg/L Au) to each extraction tube with a mechanical pipette.
14.2.6 The SRM sample is prepared for extraction by adding a blank 8x1” filter strip to a clean sample vial as described in Section 14.2.4. The loaded vial is then weighed, zeroed, and then re-weighed after an aliquot of SRM standard of approximately 2-3 mg is added to the vial. Add 10 mL extraction fluid to the extraction tube.
Note: It may be more efficient to weigh several SRM standard vials for extraction at one time. The weight information should be recorded in the balance room notebook. Individual standards should be numbered with the date the vial was created (i.e. “01012013-SRM01”). The vial number should be recorded in the LIMS in the SRM sample comments in the bench sheet.
14.2.7 Print out a copy of the Quartz Extraction Record from L:\Metals Lab (an
example is shown in Table 24-10). Record the batch ID and extraction date. Record the temperature of the HotBlock™ as indicated by the calibrated thermometer, as well as the temperature indicated on the HotBlock UI.
14.2.8 Place all samples in a plastic HotBlock™ rack and place in HotBlock™.
Add a reflux cap to each sample tube. Record the time samples were placed in the HotBlock on the table printed above. Samples will be extracted for a total time of 2.5 hours at a HotBlock™ temperature of 95ºC and an approximate sample temperature of 85ºC.
Note: Monitor sample temperature with a thermometer in an extraction
tube with a reflux cap and 10 mL of extraction fluid. 14.2.9 After 1.5 hours of extraction, add 1.8 mL of hydrogen peroxide (H2O2)
and allow to effervesce for 0.5 hours. Add an additional 1.8 mL of H2O2 after 2 hours of extraction and allow to effervesce again for 0.5 hours. This completes the extraction process. Record the time both aliquots of H2O2 were added on the Quartz Extraction Record.
14.2.10 After extraction is complete, remove the rack of samples and allow them
to cool to room temperature. Record the time samples were removed, as well as the temperatures indicated by both the certified thermometer and HotBlock™ UI on the Quartz Extraction Record. Add 30 mL of DI water, cap, shake vigorously and allow to stand for 0.5 hours. This critical step must not be omitted; it allows the acid to diffuse from the filter into the
UNCONTROLLED ELECTRONIC COPY EFFECTIVE 4-2015

CONFIDENTIAL Standard Operating Procedure Procedure Number: ERG-MOR-084 Revision Number: 11 Revision Date: March 31, 2015 Page: 24 of 58
rinse. Record the time the DI water was added to the samples on the Quartz Extraction Record.
14.2.11 After this time period bring the sample volume to the 50 mL line on the
vial with a wash bottle filled with ASTM Type I DI water prior to filtering. Record the time the samples were brought to final volume on the Quartz Extraction Record.
Note: If the final volume exceeds 50 mL measure the amount exceeded
using an appropriate pipette and (usually the 1 or 5 mL) and record the final sample volume. Using the pipettor, pull sample from the vial in varying increments until enough liquid is removed so that the sample line is level with the 50 mL line on the vial. Add the amount of liquid removed to 50 mL and record that as the final volume. This information must be entered into the LIMS so that the final sample concentration is calculated and reported correctly. This overfilling may be avoided by using fine streamed wash bottles while adding the D.I. water.
14.2.12 Carefully filter the sample extract with a 2 µm FilterMate™ filter. Note: When using a FilterMate™, slowly plunge the filter through the
sample and be sure to get the filter all the way to the bottom. Do not force the filter or you will rupture the FilterMate™ filter. Ruptured filters that caused a loss of sample extract result in the re-extraction of that sample.
14.2.13 Homogenize the sample by inverting three times and then the extract is
ready to be analyzed. The extracted filter and FilterMate™ remain in the sample vial with the extract to be analyzed. This does not interfere with sample recoveries or analysis.
14.2.14 Record the sample slot the certified thermometer was placed in during the
sample extraction on the Quartz Extraction Record. After initialing the sheet, attach the Quartz Extraction Record to the batch paperwork.
14.3 LIMS Sequence Procedure
14.3.1 Log into LIMS Element Software. 14.3.2 From the “Laboratory” menu, select “Sequence.” 14.3.3 Click “Add” in the top right corner and select “Randy” as the Template ID
then click done. This will automatically add all of the calibration standards and QC samples for a typical analysis sequence.
UNCONTROLLED ELECTRONIC COPY EFFECTIVE 4-2015

CONFIDENTIAL Standard Operating Procedure Procedure Number: ERG-MOR-084 Revision Number: 11 Revision Date: March 31, 2015 Page: 25 of 58
14.3.4 Click the pull-down menu for “Source Batch” at the upper middle part of the screen and select the batch you are going to analyze. Then click the “Add” button and select “Batch QC Sample.” When the list of QC samples appears click the first sample and holding the shift button double-click the last sample and it will insert them into the sequence. Then click “Add” again and select “Batch Sample.” Add all of the samples listed as you did for the Batch QC Samples.
14.3.5 Arrange all of the samples according to the example below, being sure to
follow the requirements summarized in Table 24-3:
Autosampler Position
Sample Name
1 BTB0001-CAL1 2 BTB0001-CAL2 3 BTB0001-CAL3 4 BTB0001-CAL4 5 BTB0001-CAL5 6 BTB0001-ICV1 1 BTB0001-ICB1 5 BTB0001-HCV1 7 BTB0001-IFA1 8 BTB0001-IFB1 4 BTB0001-CCV1 2 BTB0001-LCV1 1 BTB0001-CCB1 9 B0B1707-BLK1 10 B0B1707-BLK2 11 B0B1707-SRM1 12 B0B1707-BS1 13 0020993-01 14 B0B1707-DUP1 15 B0B1707-MS1 16 B0B1707-MSD1 17 B0B1707-SRD1 18 B0B1707-PS1 4 BTB0001-CCV2 1 BTB0001-CCB2 7 BTB0001-IFA2 8 BTB0001-IFB2 4 BTB0001-CCV3 2 BTB0001-LCV2 1 BTB0001-CCB3
14.3.6 Right-click the SRD sample and choose the appropriate source sample
from your batch.
UNCONTROLLED ELECTRONIC COPY EFFECTIVE 4-2015

CONFIDENTIAL Standard Operating Procedure Procedure Number: ERG-MOR-084 Revision Number: 11 Revision Date: March 31, 2015 Page: 26 of 58
Note: Make sure that the source sample for the SRD is updated to the current batch SRD sample or your data will not be saved.
14.3.7 Using the shift key select all of the samples in the sequence and right-click to choose “Internal Standard ID” then select the ISTD you are using for this sequence.
14.3.8 Right-click each calibration standard and QC sample and select “Standard
ID” to set the current standard being used for each solution. 14.3.9 Click “Save” and print a double-sided copy in landscape format to use as
the cover of the data package and to help enter the sequence in the Elan software.
14.4 Filter Analysis Procedure
14.4.1 Prior to analyzing samples, check the instrument performance by
analyzing the tuning solution using the Daily Performance Check in the Smart Tune Wizard. The performance specifications that must be met are in Table 24-5. Also refer to Section 13.1 for other criteria. If the performance check fails, follow the optimization procedures in Table 24-4.
14.4.2 Before starting the calibration, be sure to flush the sample introduction
system with sufficient rinse blank and be certain the rinse blank bottle has enough solution for the analysis. Enter all sequence information (sample and QC sample names) into the autosampler and QC tables in the Elan software. The autosampler table should be named as the month, day and year (e.g., 01012010.sam) and saved. Create the file name for the collected data with the numeric month, day and year (e.g., 01012010.rep) in the Method window under the “Report” tab (upper right) in the “Report Filename” field. Any changes made to the method (i.e., QC tables) must be saved before you exit that screen or they will be lost.
14.4.3 Pour off the calibration blank/standards (Blank (CAL1), LOQ (CAL2),
CAL3, CAL4 and CAL5) and initial/continuing QC standards (ICV, ICB, ICSA, ICSAB, HSV, CCV, CCB) spiked with ISTD in the appropriate autosampler positions.
14.4.4 To start the analysis, highlight all samples in the autosampler table and
click “Build Run.” Then click “Run” in the following screen. Once the calibration has been completed and reviewed, save the calibration file with the same month, day and year as the .sam and .rep files in Section 14.4.2
UNCONTROLLED ELECTRONIC COPY EFFECTIVE 4-2015

CONFIDENTIAL Standard Operating Procedure Procedure Number: ERG-MOR-084 Revision Number: 11 Revision Date: March 31, 2015 Page: 27 of 58
and print the Quantitative Analysis Report to PDF to be included with the sequence files..
14.4.5 Label autosampler tubes with a black marker. Batch samples may be
prepared by adding 20 μL of ISTD into the autosampler tube and then adding 10 mL of sample. Mix the sample well and place in appropriate autosampler location for analysis.
14.4.6 The PDS sample is prepared by adding 1.0 uL of spike solution to 1.0 mL
of sample to be analyzed (i.e., 12 uL of PDS to 12 mL of sample). 14.4.7 Samples with analyte concentrations greater than 90% of the current LDR
must be diluted and re-analyzed.
14.5 Unexpected Instrument Shutdown In the event that the ICP-MS shuts down during an analysis the proper procedure to be followed by the analyst is: 14.5.1 Restart the instrument and allow it to warm-up for a minimum of 30
minutes but preferably one hour, especially if the instrument has been inoperable overnight and is at room temperature. If the analyst was present during the loss of the plasma and the instrument has not significantly cooled then a shorter time period for warm-up may be sufficient.
14.5.2 After the instrument has been thermally stabilized a new daily
performance report (DPR) should be analyzed with the operating conditions being used for the analysis.
14.5.3 If the DPR passes the analysts must check the calibration by analyzing a
continuing calibration verification (CCV) and a continuing calibration blank (CCB) to be sure the calibration is still valid. If the CCV & CCB passes the analyst may proceed with where the analysis left off. Any samples that didn’t complete their analysis should be repeated.
14.5.4 If the DPR, CCV or CCB do not pass the analysis must be terminated and
any samples not bracketed by valid CCV & CCB checks must be reanalyzed with a new analysis/calibration.
14.5.5 The DPR, CCV and CCB checks should be kept for documentation. The
DPR may be placed in the DPR binder and the CCV & CCB checks must be included with the data package. The analyst should document the event briefly in the sequence narrative so the reviewer is aware of the instrument shutdown.
UNCONTROLLED ELECTRONIC COPY EFFECTIVE 4-2015

CONFIDENTIAL Standard Operating Procedure Procedure Number: ERG-MOR-084 Revision Number: 11 Revision Date: March 31, 2015 Page: 28 of 58
14.6 LIMS Data Upload Procedure
14.6.1 When a data package is complete, the analyst will transfer the data from the instrument computer to network server BART.
14.6.2 To begin LIMS upload, open Element. Go to the laboratory menu and
click on “Data Entry/Review” In this window, select “Sequence” in the top left corner, making sure that “Inorganics” is selected from the drop-down menu. Highlight the correct sequence and click on “Create” in the Data Entry box in the top right corner. Once the spreadsheet is created in LIMS, select “DataTool” in the Data Entry box and save the file as the sequence name in the UserFiles folder of your harddrive (C:\ELMNT\UserFiles).
14.6.3 The DataTool interface should open to the “Select Data System Files”
window. In this window, check to make sure the correct file information is selected:
1) File Type: PE ELAN_REP(*.rep) 2) Drives: y:\Bart
14.6.4 In the box below Drives: select the folder the data is stored in for the
sequence. In the Bart drive, select the ICP-MS DATA folder, then the corresponding year, and finally the folder for the data the sequence was run.
14.6.5 All of the data files for that sequence will appear in the lower right-hand
box. Double-click on the appropriate data file and click “Auto Select” for each file that needs to be included in the sequence. (*Note: Only undiluted samples and sequence QC should be included here.)
14.6.6 Click “Done” when all sample and QC files have been selected to return to
the main window. Click “Merge Files” at the bottom of the window. DataTool will merge the files and show the data in the Data Transfer window.
Note: Review the content of the top windows in the Data Transfer window for red text. If there is any, the DataTool cross table requires editing. Seek the advice of the LIMS administrator to correct this.
14.6.7 Click “Save” and save the spreadsheet in the UserFiles folder of your hard
drive. Close DataTool.
UNCONTROLLED ELECTRONIC COPY EFFECTIVE 4-2015

CONFIDENTIAL Standard Operating Procedure Procedure Number: ERG-MOR-084 Revision Number: 11 Revision Date: March 31, 2015 Page: 29 of 58
14.6.9 In Element, go back to the Data Entry/Review window. The newly merged data should appear in the window. Click “Save” to save the files to Element and then “Query” in the Data Review box. Element will perform all necessary calculations at this point.
14.6.10 In the Data Entry/Review window, samples and QC can be reviewed for
pass/fails. Any data that does not pass its assigned criteria will have red text. Use appropriate data qualifiers to flag data that does not meet criteria.
14.7 LIMS Dilution Data Upload Procedure
Note: Dilution data is not uploaded with sequence QC, as this data is typically only required for one or two analytes in a given sample. Therefore, the data is hand-entered into Element. 14.7.1 Open Element and go to the Data Entry/Review window. Select the
sequence that the diluted sample was originally run with. Click on “Query.”
14.7.2 Scroll down to the needed sample information. Click “Edit” in the Data
Review box. Right click on the sample & analyte that has dilution information and select “Qualifiers” -> “Quick Analyte Qualifiers.” Select qualifier flag D-01 for dilutions.
14.7.3 In the IResult column, type the new dilution data. Make sure the new data
has been corrected for the dilution factor (i.e. results for a 5x dilution should be multiplied by 5 if the instrument software did not make the correction). In the Diln column, type the dilution factor for the sample.
14.7.4 Repeat steps 2 & 3 for any additional dilution data that needs to be input
for the sequence. If any QC data was altered (for example, Dups) then you will click on “Re-calc” and “Save.” If only sample information was altered, click “Save.”
14.7.5 Re-run the query to verify all dilution data was saved to the sequence. Note: In LIMS, the dilution factor is applied to the associated MDL as
well as to the sample concentration.
14.8 Data Review All instrument data should be first reviewed by the analyst and then a secondary reviewer, usually the project task lead for metals analysis. Both the analyst and secondary review must use the “Quality Control Requirements for Metals
UNCONTROLLED ELECTRONIC COPY EFFECTIVE 4-2015

CONFIDENTIAL Standard Operating Procedure Procedure Number: ERG-MOR-084 Revision Number: 11 Revision Date: March 31, 2015 Page: 30 of 58
Analysis” checklist to complete data review (see Figure 24-8). Reviewers must initial and date each parameter check on the review form to verify that each meets the established acceptance criteria. 14.8.1 Initial Calibration
In addition to the requirements outlined in Figure 24-8, the analyst and secondary reviewer must also verify that the intensities measured for reportable analytes in the calibration blank are acceptable and will not interfere with the sensitivity. A review of previously analyzed calibration blanks can demonstrate acceptable intensity values. The intensities of the internal standards in the calibration standard should be monitored relative to the intensities seen in the calibration blank.
14.8.2 Internal Standards
Internal standards must be monitored for each sample throughout a sequence; the measured intensities must stay between 60 and 125% of the measured intensity of internal standard in the calibration blank. See Section 16.7 for corrective actions to remedy internal standard intensities that are measured outside of this range.
14.8.3 Relative Standard Deviation’s RSD’s
Follow the prescribed acceptance criteria for RSD’s of calibration standards as listed in Table 24-3. Sample RSD’s should also be monitored throughout analysis. High RSD’s (greater than 20%) for concentrations above the MDL can indicate memory interference from previous samples, as well as other instrumentation issues that may need to be corrected before analysis can be continued.
14.8.4 Element/LIMS Data
The analyst and second reviewer must verify quantities imported into the LIMS reflect the raw data. This can be accomplished by checking a few analytes for random client samples and QC samples. Hand entered data (i.e., dilution) should be verified by the second reviewer to be certain the values, dilution factors and flags are properly inserted. The LIMS calculated final value should also be checked to ensure the system is correctly using the method’s custom equation.
UNCONTROLLED ELECTRONIC COPY EFFECTIVE 4-2015

CONFIDENTIAL Standard Operating Procedure Procedure Number: ERG-MOR-084 Revision Number: 11 Revision Date: March 31, 2015 Page: 31 of 58
14.8.5 Multiple Isotopes If an element has more than 1 monitored isotope, examine the
concentration calculated for each isotope, or isotope ratios, to detect a possible spectral interference. Consider both primary and secondary isotopes when evaluating the element concentration. In some cases, secondary isotopes may be less sensitive or more prone to interferences that the primary recommended isotopes; therefore, differences between the results do not necessarily indicate a problem with data calculated for the primary isotopes.
14.8.6 Reprocessing Data Reprocessed data must include reprocessing of all calibration standards
and QC samples associated with the reprocessed sample results. Original data shall be kept with the reprocessed data and annotated with the reason for reprocessing. It is imperative that the calibration file be saved as a separate file from the original calibration file. The reprocessed calibration file shall be renamed with the added distinction of “_reprocessed” (i.e. 03052010_reprocessed). All other samples including QC are automatically saved to the dataset file.
15.0 CALCULATIONS
15.1 Analyte Concentration
Metal concentration in the air sample should be calculated as follows:
9
Where:
C = concentration, ng metal/m3
Ci = metal concentration determined from Section 14.4, ng metal/L.
Vf = total sample extraction volume from extraction procedure (i.e., 0.05 L).
9 = [Usable filter area (8"×9")] / [Exposed area of one strip ((4"×1") × 2 (representing a strip that has been folded)]
Vstd = standard air volume pulled through the filter, m3
UNCONTROLLED ELECTRONIC COPY EFFECTIVE 4-2015

CONFIDENTIAL Standard Operating Procedure Procedure Number: ERG-MOR-084 Revision Number: 11 Revision Date: March 31, 2015 Page: 32 of 58
15.2 Method Detection Limits
The MDL is calculated as follows for the CFR MDL calculation method: MDL = (K) × (SD)
Where:
K = K Value as prescribed in Appendix D: DQ FAC Single Laboratory Procedure v2.4, 08/30/2007
SD = standard deviation of the historical BLK2 analysis. 15.3 Relative Percent Difference (RPD)
The RPD is calculated as follows:
2⁄ 100
Where:
R1, R2 = values that are being compared (i.e., duplicate and replicate analysis data)
15.4 Percent Recovery
Percent Recovery is calculated as follows:
100
15.5 Relative Standard Deviation (RSD)
RSD is calculated as follows:
100
16.0 QUALITY CONTROL
The analyst must perform the quality control checks listed in Table 24-3 and meet the requirements in this section. Data Quality Objectives (DQO) and data assessment criteria are determined from the results of the quality control samples. The DQO criteria are summarized in Table 24-3.
UNCONTROLLED ELECTRONIC COPY EFFECTIVE 4-2015
CONFIDENTIAL Standard Operating Procedure Procedure Number: ERG-MOR-084 Revision Number: 11 Revision Date: March 31, 2015 Page: 33 of 58
16.1 Sample Collection Quality Control
16.1.1 Filters which are dropped or become contaminated with any foreign matter (i.e., dirt, finger marks, ink, liquids, etc.) are invalid.
16.1.2 Filters with tears or pinholes that occurred before or during sampling are
invalid.
16.1.3 A power failure during a field sample collection event invalidates the sample collected during that event. See SOP ERG-MOR-045 for more information about the sample acceptance criteria.
16.2 Blanks
16.2.1 The Rinse Blank must be used to flush the system between standards and
samples. Refer to Section 11.3.1 for preparation details.
16.2.2 Initial Calibration Blank (ICB) is analyzed immediately following the initial calibration verification. The absolute value of the instrument response should be less than the method detection limit. If the ICB fails it may be re-analyzed twice. If the ICB still does not pass, the analysis should be terminated, the problem corrected and the ICV and ICB must be verified again before the analysis can continue. If the ICV or ICB still fail, recalibrate the instrument and verify the ICV and ICB again before continuing. If recalibration fails to correct the problem, all QC and samples included in the sequence must be flagged.
16.2.3 Continuing Calibration Blanks (CCB) are analyzed following each
continuing calibration verification sample. The acceptance criteria are the same as the ICB. If the first CCB analyzed fails it may be reanalyzed twice. If it fails again the analysis should be terminated, the instrument recalibrated and the initial QC repeated. If the CCB fails later in the analysis it may also be reanalyzed twice. If it continues to fail the affected analyte must be flagged. If multiple elements fail any samples analyzed before or after the failing CCB must be reanalyzed.
16.2.4 Laboratory Reagent Blank (LRB/BLK1) consists of all reagents
(extraction fluid) used to process samples and is carried through the entire preparation and extraction process to determine the background levels, if any, from the extraction fluid and process. If the absolute value of the analyte concentration of the LRB is less than or equal to the MDL (See Table 24-1), no further action is required. If the BLK1 fails it may be reanalyzed once. If it fails again and the concentration is greater than the MDL, but less than 5 times the MDL, the BLK1 and all associated
UNCONTROLLED ELECTRONIC COPY EFFECTIVE 4-2015
CONFIDENTIAL Standard Operating Procedure Procedure Number: ERG-MOR-084 Revision Number: 11 Revision Date: March 31, 2015 Page: 34 of 58
samples are flagged. If the concentration of a reported analyte is greater than 5 times the MDL all associated samples must have that analyte result blank subtracted and flagged as such.
16.2.5 The Method Blank (MB/BLK2) is prepared as an LRB but with the
addition of a blank quartz filter strip and analyzed as a sample to determine the background levels, if any, from the blank filter and extraction process. Resulting data is recorded and used to determine FAC MDL values. While the absolute value of resulting values should be less than the established MDL, there is no corrective action procedure should the BLK2 fail.
16.3 Spikes
16.3.1 Laboratory Control Sample (LCS/BS): An LCS is prepared and carried through the entire sample digestion process. At least one LCS is analyzed with each sample batch. The LCS is essentially a MB with a spike added and is referred to as a BS. The results of the spike recovery must be within 80 -120% of actual values, with the exception of Al and Sb. Mercury may recover within 75-125% of actual value. In cases where background contamination is present from the filter media, these criteria may fail; however, it is appropriate to subtract the known background concentration found in the method blank but if it still fails the LCS must be flagged appropriately.
16.3.2 Standard Reference Material (SRM) is prepared and carried through the entire sample digestion process. At least one SRM is analyzed with each batch. The SRM is a NIST Urban dust that is prepared with a blank filter and can be referred to as a SRM in the LIMS. The results of the SRM Pb recovery must be within 80 – 120% of the certified value. If not, the sample may be reanalyzed once. If the SRM still fails to meet criteria, all associated samples must be flagged.
16.3.3 Matrix Spike and Matrix Spike Duplicate (MS/MSD): A sample from an
extraction is chosen to be the source sample for the MS/MSD sample. Two extra filter strips are cut from the source sample filter for this purpose. They are prepared and carried through the entire preparation and extraction procedure as described in Section 14.2. These samples should recover within 75% to 125% of the true value. If not, the MS and/or MSD may be reanalyzed once each. If they still do not pass, examine the result of the PDS and SRD for possible matrix interference. If matrix interference is confirmed, the MS and/or MSD sample must be flagged as such. If the PDS and SRD are within their acceptance criteria and a matrix interference is not suspected, re-extraction of the samples should be
UNCONTROLLED ELECTRONIC COPY EFFECTIVE 4-2015

CONFIDENTIAL Standard Operating Procedure Procedure Number: ERG-MOR-084 Revision Number: 11 Revision Date: March 31, 2015 Page: 35 of 58
considered. Otherwise, all related samples may be flagged to indicate MS DQO failure.
Note: If the parent sample concentration is greater than 4 times the spike
concentration, the recovery criteria does not apply and the sample should be flagged appropriately.
16.3.4 Post Digestion Spike (PDS, also known as PS): The PDS is an analyzed
aliquot of an extracted sample that is spiked with the PDS standard (See Section 11.16). Preferably, the same sample that is used for the MS/MSD is also spiked for the PDS. The PDS spike addition should produce a minimum level of 10 times and a maximum of 100 times the QL. The spike recovery should be within ± 25%, or 75% to 125%, of the true spike value. If the PDS fails, the analyst should assess the SRD. If both the PDS and SRD fail for the same element it is an indication that matrix interference has occurred and any analytes that have failed should be flagged as possible matrix interference. In the event that the parent sample used for the PDS requires a dilution, the PDS should be prepared by diluting the sample and then spike with the PDS standard.
16.4 Duplicates
There are three types of duplicates found in this procedure: 16.4.1 Matrix spike duplicate (MSD): A true spiked laboratory duplicate of a
separate strip of the parent (also called source) sample filter used to prepare the matrix spike. The RPD for this duplicate is ± 20%.
16.4.2 Laboratory duplicate: This duplicate is also prepared with an additional
strip of the parent (or source) sample filter. An RPD of ± 20% from the parent sample values is required for values greater than or equal to 10 times the MDL.
16.4.3 Analytical duplicate (or replicate): A second aliquot of an extracted
sample analyzed using the same analytical method as the first, or primary aliquot. These are performed on duplicate and collocated samples collected in the field. The RPD for analytical duplicates (replicates) shall be less than or equal to ± 10% for values greater than or equal to 10 times the MDL. If a duplicate/collocated sample fails to meet the established criteria, the duplicate or collocated sample must be reanalyzed. If initial sample results are confirmed then the replicate or collocated sample must be flagged.
UNCONTROLLED ELECTRONIC COPY EFFECTIVE 4-2015

CONFIDENTIAL Standard Operating Procedure Procedure Number: ERG-MOR-084 Revision Number: 11 Revision Date: March 31, 2015 Page: 36 of 58
16.5 Performance Evaluation (PE) Samples
Performance evaluation samples should be obtained as available from independent sources and analyzed as a routine sample. PE samples are prepared and analyzed in the same way as field samples and should be analyzed in replicate to verify results.
16.6 Standard Checks
16.6.1 Immediately after the initial calibration, the ICV is analyzed. The measured concentrations should be within ±10%, or 90-110%, of the actual concentration. If the criteria are not met, reanalyze the standard. If the criteria are still not met, a fresh standard may be prepared and analyzed or repeat the initial calibration and ICV.
16.6.2 The HSV must be analyzed after the ICB and prior to analysis of samples.
The measured concentration should be within 95% to 105% of the actual concentration. If the HSV fails it may be reanalyzed twice. If the HSV still fails, a fresh standard may be prepared and analyzed. If it continues to fail, the instrument must be recalibrated and all initial QC must also be reanalyzed.
16.6.3 Before the analysis of samples and after every 10 samples during a batch
analysis, the calibration must be verified using a CCV. Results must be within 10%, or 90% - 110%, of the target value for each analyte to verify that the calibration is valid. If a standard check exceeds the limit, the analysis must be stopped and the check standard must be reanalyzed. If the target value exceeds the limit again, a fresh standard may be prepared and analyzed or the instrument must be recalibrated. Any samples analyzed before or after an invalid CCV must be reanalyzed, minimally for the failing element.
16.6.4 Following the first and last CCV of each analysis, an LCV must be analyzed. The measured Pb concentration should be within ± 30% of the true concentration. If the criteria are not met for the first LCV, reanalyze the standard once. If criteria still are not met, a fresh standard may be prepared and analyzed or terminate the analysis, correct any issues, and repeat the initial calibration, and reanalyze all initial QC. Should the second LCV fail for Pb, the analysis should be reanalyzed for Pb only.
16.6.5 Document each standard check value as a percent ratio of the actual value
over the target value.
UNCONTROLLED ELECTRONIC COPY EFFECTIVE 4-2015

CONFIDENTIAL Standard Operating Procedure Procedure Number: ERG-MOR-084 Revision Number: 11 Revision Date: March 31, 2015 Page: 37 of 58
16.7 Internal Standards
The intensities of all ISTDs must be monitored for every analysis (see Table 24-7 for isotopes). When the intensity of any ISTD fails to register between 60 to 125% of the intensity of that ISTD in the calibration blank, the following procedure is implemented:
16.7.1 If the intensities are too high as a result of the internal standard being
present in the sample, the sample must be diluted and reanalyzed with the addition of appropriate amounts of ISTD.
16.7.2 Repeat and increase the dilution until the internal standard intensities fall
within the prescribed window.
16.7.3 If the intensities are determined to be a result of instrument drift, stop the analysis, find and correct the problem, recalibrate if needed and reanalyze the affected samples since the last acceptable ISTD recoveries.
16.8 Interferences
16.8.1 The interference check standards (ICS) are analyzed at the beginning and
end of the run and for every 8 hours of continuous operation. They consist of two different standards, the ICSA and ICSAB. The interference check standards obtained from suppliers are never contaminant free. The certificate of analysis documents the levels found in each lot obtained. Therefore, the presence of target elements in the ICSA and ICSAB are expected and may vary from lot to lot of ICS solution used to make these standards. In some cases these contaminants may cause the ICSA or ICSAB to fail the QC requirements. It is acceptable to use the concentrations from the certificate of analysis to correct for these observed contaminants. The known concentrations of contaminants in the ICSA or ICSAB solutions may be subtracted from the experimental values and the established QC criteria must be met or the associated samples are flagged. Samples containing levels of the interferents above the levels in the ICS should be considered for dilution.
16.8.2 The first interference check standard (ICSA) contains only the interference
analytes of interest. Any components of the ICS that are calibrated by the instrument must recover within 20% of the expected value. Values obtained for reported analytes not present in the standard should be within 3 times the QL values (See Table 24-3). If the ICSA fails, it may be reanalyzed. If it fails again, a fresh standard may be prepared and analyzed. If it continues to fail, terminate the analysis and correct the
UNCONTROLLED ELECTRONIC COPY EFFECTIVE 4-2015
CONFIDENTIAL Standard Operating Procedure Procedure Number: ERG-MOR-084 Revision Number: 11 Revision Date: March 31, 2015 Page: 38 of 58
problem. .Any samples analyzed before or after a failing ICSA sample must be reanalyzed.
16.8.3 The second interference check standard (ICSAB) contains the same
concentration of interference analytes in the ICSA as well as a known concentration of reported analytes. The concentration of known analytes should be near the middle of the calibration curve. The values obtained for reported analytes should be within 80% to 120% of the known concentration. If the ICSAB fails it may be reanalyzed. If it fails again a fresh standard may be prepared and analyzed. If it continues to fail terminate the analysis and correct the problem. Any samples analyzed before or after a failing ICSAB sample must be reanalyzed.
16.8.4 Failing ICS are commonly the result of correction equations that need to
be adjusted for new instrument conditions. If this is suspected, calculate the new interference equations and reprocess the analytical sequences as described in Section 14.8.6.
16.9 Dilutions
16.9.1 Serial Dilution
The SRD analysis must be performed on one sample per batch, preferably on the parent sample chosen for the MS/MSD as guidance for poor recoveries in the spiked samples that may be due to matrix interference. The same sample matrix used to extract the parent sample must be used as the diluent. After the dilution is applied to the SRD results, the analyte concentration should be within 90% and 110% of the undiluted sample results if the parent sample analyte concentration is minimally a factor of 50 above the MDL in the original sample. If the SRD, MS/MSD, and PDS all fail for the same analyte, a matrix interference must be suspected and the QC data must be flagged for all affected elements. If matrix interference is not suspected, the SRD should be reprepared and analyzed a second time.
16.9.2 Sample Dilution
Any samples needing dilution due to concentrations exceeding the LDR or the presence of ISTD in the sample shall be diluted in an appropriate manner to bring the diluted concentration within the calibration curve and preferably near the mid-point. See Section 16.7 for dilutions required due to high ISTD recoveries. If the parent sample of a DUP/MS/MSD/PDS sample needs to be diluted, the dilution should be performed on each of these QC samples (See also Section 16.3.3). If the SRD was performed on
UNCONTROLLED ELECTRONIC COPY EFFECTIVE 4-2015

CONFIDENTIAL Standard Operating Procedure Procedure Number: ERG-MOR-084 Revision Number: 11 Revision Date: March 31, 2015 Page: 39 of 58
the parent sample of a DUP or PDS the results from the SRD may be used to report values of that parent sample if the 5 times dilution was appropriate. Note: Dilution also increases the associated MDL by the dilution factor, so care must be taken not to dilute a sample so that the corrected concentration value is less than increased MDL.
16.10 Initial Demonstration of Capability
Each analyst must demonstrate initial proficiency for sample preparation and analysis by generating data of acceptable accuracy and precision for four LCSs. For demonstration of proficiency, acceptable accuracy and precision is defined as having both RSD ≤20% and percent recovery of 75-125%. This demonstration is repeated whenever new staff receives training or significant changes in extraction procedure or instrumentation are made. The applicable LCS recoveries are collected and maintained in the staff training files.
16.11 Decontaminating/Cleaning Labware
Procedures for proper cleaning and removal of trace metals from labware are found in Section 14.3.1 in SOP ERG-MOR-031. Detergent bath preparation instructions can be found in Section 11.19. Transport/dip baths of DI water (“To” and “From” acid baths) should be labeled with the date they are filled with fresh DI and changed about once every month to minimize contaminants being brought to the acid bath and from being reintroduced to clean labware. This will not only extend the life of the acid bath but it will help reduce hazardous waste production. To be certain that the acid bath will effectively clean and not contaminate labware a 5x dilution should be analyzed to determine the background about once a month.
17.0 PREVENTION
When possible, minimize the amount of chemicals used in the preparation and analysis of the metals filters to reduce waste.
18.0 DATA REVIEW AND CORRECTIVE ACTION
18.1 Data Review Documentation Project files including at a minimum the information required in Section 22 are assembled and maintained by the performing analyst. Documentation for metals analysis by ICP/Mass Spectrometry will be reviewed for completeness and
UNCONTROLLED ELECTRONIC COPY EFFECTIVE 4-2015

CONFIDENTIAL Standard Operating Procedure Procedure Number: ERG-MOR-084 Revision Number: 11 Revision Date: March 31, 2015 Page: 40 of 58
meeting acceptance criteria by the Task Lead or secondary reviewer associated with the project or program requiring the analysis as described in this section. A second review of the data is performed by the Task leader or designated secondary reviewer using the QC review checklist (checklist) shown in Figure 24-8 to confirm that quality requirements have been met. Corrections and flags are added to the data consistent with the corrective action required for each review finding. Second level reviewers must complete, initial and date the checklist. The completed check list is included as part of the data package. Data not meeting SOP requirements are flagged and brought to the attention of the Project Manager for resolution.
18.2 Quality Staff Review
A minimum of 10% of the data is reviewed by ERG Quality Staff. Quality staff review checks that all SOP required quality parameters have been met and that data reviewers have completed their review checklists. Additional items may also be reviewed at the discretion of the data reviewer. Quality staff reviews are documented on the review form initiated in Section 18.1 by the primary data reviewer. Comments or issues with data identified by the Quality Staff reviewer are brought to the attention of the Project Manager for resolution. Quality Staff will use the review process as an indication of episodic or systematic quality program issues that may require improvements to the ERG laboratory quality system and or additional training for ERG staff. As an option, Quality Staff may request an additional review of 1% of the data from this method for a project. The one percent (1%) review will follow the guidance in Section18.2. Corrective action for metals by ICP/Mass Spectrometry analysis data quality issues are presented in Table 24-3. If required, a corrective action form is filled out as described in the ERG Laboratory Quality Systems Manual.
19.0 WASTE MANAGEMENT
Hazardous waste disposal is discussed in detail in SOP ERG-MOR-033. Sample digestate, including the extracted filter and FilterMate™ filter, is retained in its original tube for a period of at least 6 months from the sample date. After this time, sample digestate is disposed of by pouring it off in the satellite waste containers located in the laboratory. Used sample vials are disposed of in the laboratory waste bin.
UNCONTROLLED ELECTRONIC COPY EFFECTIVE 4-2015

CONFIDENTIAL Standard Operating Procedure Procedure Number: ERG-MOR-084 Revision Number: 11 Revision Date: March 31, 2015 Page: 41 of 58 20.0 MAINTENANCE
The ICP-MS system is not maintained under a service contract. The preventative and routine maintenance are performed by the analyst(s). In the event a maintenance issue cannot be addressed by the analyst a service call is placed with the manufacturer and when appropriate a service engineer will perform any necessary maintenance. All maintenance activities are documented in the instrument maintenance logs.
20.1 The following maintenance procedures need to be addressed daily.
20.1.1 Check sample waste container level. 20.1.2 Inspect liquid argon cylinder supply and its pressure to the instrument. 20.1.3 Inspect chiller coolant level and connections for possible leaks.
20.1.4 Inspect torch and aerosol injector tubes.
20.1.5 Inspect nebulizer for clogs.
20.1.6 Inspect sample capillary tubing to be sure it is clean and in good condition. 20.1.7 Check peristaltic pump tubing before operation. 20.1.8 At the end of each analysis, flush system for 5 minutes with the plasma on
with a maximum of 2% nitric acid, followed by deionized water. 20.1.9 Inspect vacuum pump oil level and replace as needed. 20.1.10 Inspect sample and skimmer cones for excessive salt build-up.
20.2 The following maintenance procedures need to be addressed quarterly (or more frequently if instrument performance indicates maintenance is needed). 20.2.1 Clean torch components and replace any worn O-rings on the torch
assembly. 20.2.2 Inspect and clean the RF coil. 20.2.3 Inspect nebulizer spray pattern. Clean and replace gem tips and O-rings as
necessary. 20.2.4 Check nebulizer components and replace worn O-ring on the transducer
face.
UNCONTROLLED ELECTRONIC COPY EFFECTIVE 4-2015

CONFIDENTIAL Standard Operating Procedure Procedure Number: ERG-MOR-084 Revision Number: 11 Revision Date: March 31, 2015 Page: 42 of 58
20.2.5 Check spray chamber drain fitting for leaks. 20.2.6 Check that pump rollers are clean and remove and clean pump head as
necessary. 20.2.7 Clean skimmer and sampling cones (See Section 20.3) and inspect orifices
for damage or corrosion. Replace cones and/or O-rings as needed. 20.2.8 Replace interface roughing and turbo backing vacuum pump oil. 20.2.9 Inspect autosampler rinse pump rollers and clean or replace as necessary.
20.3 Cleaning Sample Introduction Components
20.3.1 Fill small plastic tank for sonicating components with warm to hot 2%
Citranox® solution. Place torch, injector, spray chamber, gem tips, and transfer tube (remove all o-rings) into the tank. Sonicate all components for 15 minutes.
20.3.2 After removing the o-rings from the cones, gently insert each cone into a
separate beaker with enough detergent solution to cover completely and allow to soak for ~ 1.75 hours. Care must be taken to only handle cones by the base – any contact with either cone orifice can easily cause irreparable damage.
20.3.3 Rinse all components thoroughly with tap water followed by a thorough
rinse with DI water. 20.3.4 Place all components back in the cleaned tank/beakers with DI water and
sonicate for another 15 minutes. Cones should be contained in a separate container from the other sample introduction components.
20.3.5 Carefully remove sample introduction components and rinse thoroughly
with DI water. 20.3.6 Inspect cones under dissecting microscope to be sure that the edges of the
orifices are not damaged and that the surfaces inside and out of the cone orifice area have been cleaned well. If the cones still appear to be dirty, place in 2% HNO3 and sonicate for no more than 2 minutes (more than 2 minutes of acid exposure will damage the cones) then rinse thoroughly with DI water and reinspect. If cones are needed immediately they may be dried by spraying Dust Off® over the entire surface, taking care not to make physical contact with the cones.
UNCONTROLLED ELECTRONIC COPY EFFECTIVE 4-2015

CONFIDENTIAL Standard Operating Procedure Procedure Number: ERG-MOR-084 Revision Number: 11 Revision Date: March 31, 2015 Page: 43 of 58
All other sample components that need further cleaning should be sonicated for 2 or more minutes in 2% HNO3. Place in Class 100 hood or leave to air dry on a dust free cloth (e.g., Technicloth®) or Kimwipes® may be used.
20.3.7 For cones that are still dirty after the procedure described in 20.3.6 and
believed to be usable, refer to the Spectron Cone Cleaning Guide for additional procedures. Cones that are no longer usable may be returned to the manufacturer for recycling and platinum cones can be sent in for refurbishing.
21.0 SHORTHAND PROCEDURE
The flow chart shown in Figure 24-9 shows the procedural steps and sequence for analysis of inorganic samples.
22.0 DOCUMENTATION AND DOCUMENT CONTROL
22.1 All information concerning sample preparation, standard preparation, instrument conditions, etc., must be documented in the appropriate binders (i.e., Extraction Log, Daily Performance Reports, Standards Log etc.) and/or electronically in either the LIMS or the local instrument computer.
22.2 All calculations and the type of method for determining concentration must be
recorded in the analyst's notebook. Any unusual problems or conditions must also be noted.
22.3 Record all maintenance performed on the instrument in the maintenance logbook
for this particular instrument.
22.4 Record all sample analyses, including quality control samples, performed by the instrument in the ICP-MS run logbook for this particular instrument.
22.5 Reviewer must sign laboratory notebook weekly.
22.6 Any hard copies of instrument data should be filed chronologically. Electronic
copies of instrument data are maintained on the L: drive in the “Metals Lab” folder.
22.7 It is imperative the project documentation be updated following each analysis.
Analysts will copy raw instrument and QC files to a designated corporate network shared drive at the completion of each analysis sequence or batch. Primary data reviewers will use the data on the shared network drive for their data review
UNCONTROLLED ELECTRONIC COPY EFFECTIVE 4-2015
CONFIDENTIAL Standard Operating Procedure Procedure Number: ERG-MOR-084 Revision Number: 11 Revision Date: March 31, 2015 Page: 44 of 58
process. The completed data packages ready for upload into the ERG LIMS system will be retained on the network drive as the backup for this data.
22.8 All processed data are archived in the LIMS on the shared network drive. Data is archived monthly to compact disc (CD) or digital versatile disc (DVD), verified on the system where the data originated and stored for at least five years in the laboratory. An archive copy of a data package is retained for at least five years in the laboratory data storage. The data backup should include enough information to manually generate the numbers used for reporting.
22.9 Reporting
22.9.1 Sample results are uploaded into the LIMS in ng/L as analyzed. Any dilutions performed must be accounted for in the instrument software. The internal standard recoveries must be included with the result calculation. Final results should be reported in ng/m3 to three significant figures as shown in Section 12.1. If required by the sampling organization, results can also be reported in µg/m3 by multiplying the ng/m3 results by 1,000.
22.9.2 Sample results should not be corrected based on analyte results from the
laboratory blanks, field, trip, or filter lot blanks provided by sampling agencies, unless specifically requested. However, samples are blank-subtracted if any analyte is detected in the LRB at greater than 5 times the MDL as described in Section 16.2.4.
22.9.3 As stated in Section 11.2.6, samples with metal concentrations greater than
90% of the current LDR must be diluted and re-analyzed. The diluted value will be reported to the sampling agency.
22.9.4 Data should meet all specifications as presented in Table 24-3. If data does
not meet specifications, corrective reporting actions listed must be followed (flag or invalidate data).
23.0 REFERENCES
Ashley, K., R. N. Andrews, L. Cavazos, and M. Demange. 2001. Ultrasonic Extraction as
a Sample Preparation Technique for Elemental Analysis by Atomic Spectroscopy. Journal of Analytical Atomic Spectrometry 16:1147-1153.
Butler, O. T. and A. M. Howe. 1999. Development of an International Standard for the
Determination of Metals and Metalloids in Workplace Air Using ICP-AES: Evaluation of Sample Dissolution Procedures Through an Interlaboratory Trial. Journal of Environmental Monitoring 1:23-32.
UNCONTROLLED ELECTRONIC COPY EFFECTIVE 4-2015

CONFIDENTIAL Standard Operating Procedure Procedure Number: ERG-MOR-084 Revision Number: 11 Revision Date: March 31, 2015 Page: 45 of 58
Code of Federal Regulations – 40 CFR Part 136, Appendix B – Definition and Procedure for the Determination of the Method Detection Limit – Revision 1.11. Determination of Metals in Ambient Particulate Matter Using Inductively Coupled Plasma/Mass Spectrometry (ICP/MS). Compendium Method IO-3.5, In: Compendium of Methods for the Determination of Inorganic Compounds in Ambient Air. Center for Environmental Research Information, Office of Research and Development, U.S. Environmental Protection Agency, Cincinnati, OH, 45268, June 1999.
EPA Great Lakes Monitoring, Great Lakes Environmental Database website: http://epa.gov/greatlakes/monitoring/data_proj/glenda/codes/r_lim_tp.pdf. Federal Advisory Committee on Detection and Quantitation Approaches and Uses In Clean Water Act Programs. Appendix D: DQ FAC Single Laboratory Procedure v2.4, 8/30/2007.
Jalkanen, L. M. and E. K. Hasanen. 1996. Simple Method for the Dissolution of Atmospheric Aerosol Samples for Analysis by Inductively Coupled Plasma Mass Spectrometry. Journal of Analytical Atomic Spectrometry 11:365-369.
National Environmental Laboratory Accreditation Conference. 2003 NELAC Standard, EPA/600/R0-04/003, Approved June 5, 2003, Effective July 1, 2005.
Pekney, N. J. and C. I. Davidson. 2005. Determination of Trace Elements in Ambient Aerosol Samples. Analytica Chimica Acta 540:269-277.
PerkinElmer Elan® Version 3.4 Software Reference Guide, 2007. PerkinElmer Elan® 9000 Hardware Guide, 2003.
Reference Method for the Determination of Lead in Particulate Matter as PM10 Collected From Ambient Air. Code of Federal Regulations Title 40, Part 50, Appendix Q [2008]. Selection, Preparation and Extraction of Filter Material. Compendium Method IO-3.1, In: Compendium of Methods for the Determination of Inorganic Compounds in Ambient Air. Center for Environmental Research Information, Office of Research and Development, U.S. Environmental Protection Agency, Cincinnati, OH, 45268, June 1999. EPA Method 6020A, Inductively Coupled Plasma – Mass Spectroscopy. In: EPA SW-846, “Test Methods for Evaluating Solid Waste, Physical/Chemical Methods”. Spectron Cone Cleaning Guide. By Lawrence Neufeld, Spectron, Inc. Website: http://www.spectronus.com/uploadcache/1253135846-Cone_Cleaning_Final_909.pdf.
UNCONTROLLED ELECTRONIC COPY EFFECTIVE 4-2015

CONFIDENTIAL Standard Operating Procedure Procedure Number: ERG-MOR-084 Revision Number: 11 Revision Date: March 31, 2015 Page: 46 of 58
Standard Operating Procedure (SOP) For The Trace Elemental Analysis of Ambient Air Particulate Samples Using Inductively Coupled Plasma - Mass Spectrometry (ICP-MS). California Environmental Protection Agency, Air Resources Board, (SOP MLD 061), Rev. No. 1, January 1, 2007. USEPA Contract Laboratory Program, Statement of Work for Inorganic Analysis, Multi-Media, Multi-Concentration, ILM05.3, Analytical Methods for Inductively Coupled Plasma – Mass Spectroscopy, Exhibit D, G – Part B, March 2004. Yamashige, T., M. Yamamoto, and H. Sunahara. 1989. Comparison of Decomposition Methods for the Analysis of Atmospheric Particles by Atomic Absorption Spectrometry. Analyst 114:1071-1077.
UNCONTROLLED ELECTRONIC COPY EFFECTIVE 4-2015

CONFIDENTIAL Standard Operating Procedure Procedure Number: ERG-MOR-084 Revision Number: 11 Revision Date: March 31, 2015 Page: 47 of 58 24.0 TABLES, DIAGRAMS, FLOWCHARTS, VALIDATION DATA
Table 24-1. 2015 Method Detection Limits (MDLs) for Metals Hi-Vol Filters
Element
2015 MDL by FAC1
(ng/L)
2015 MDL by FAC2 (ng/filter)
2015 MDL by FAC2,3
(ng/m3) Aluminum * 88512 39830 19.9 Antimony 55.1 24.8 0.012 Arsenic 252.8 114 0.057 Barium * 17901 8055 4.03 Beryllium 9.468 4.26 0.002 Cadmium 25 11.24 0.006 Calcium * 873889 393250 197 Chromium 11376 5119 2.56 Cobalt 189.6 85.3 0.043 Copper * 2302 1036 0.518 Iron * 112437 50596 25.3 Lead 503 226 0.113 Magnesium * 202561 91152 45.6 Manganese 966.8 435 0.218 Mercury 28.5 12.82 0.006 Molybdenum * 628.3 283 0.141 Nickel 2542 1144 0.572 Rubidium * 69.2 31.1 0.016 Selenium 137.2 61.8 0.031 Strontium * 1721 774 0.387 Thallium * 1.57 0.705 0.0004 Thorium * 15.3 6.86 0.003 Uranium * 25.6 11.5 0.006 Zinc * 34975 15739 7.87
* Elements not on our standard analysis list of elements. † Total Chromium.
UNCONTROLLED ELECTRONIC COPY EFFECTIVE 4-2015

CONFIDENTIAL Standard Operating Procedure Procedure Number: ERG-MOR-084 Revision Number: 11 Revision Date: March 31, 2015 Page: 48 of 58
Table 24-2. 2015 Limit of Quantitation (LOQ) for Metals
Element ng/L Aluminum* 78015 Antimony 100 Arsenic 742 Barium* 32676 Beryllium 25.6 Cadmium 58.2 Calcium* 817139 Chromium† 11396 Cobalt 467 Copper* 3672 Iron* 205994 Lead 982 Magnesium* 264057 Manganese 1460 Mercury 59.2 Molybdenum* 553 Nickel 3935 Rubidium* 129 Selenium 428 Strontium* 2839 Thallium* 2.95 Thorium* 33.0 Uranium* 20.6 Zinc* 56292
* Elements not on our standard analysis list of elements † Total Chromium. Note: This calculation assumes a total volume of 2000 m3.
UNCONTROLLED ELECTRONIC COPY EFFECTIVE 4-2015

CONFIDENTIAL Standard Operating Procedure Procedure Number: ERG-MOR-084 Revision Number: 11 Revision Date: March 31, 2015 Page: 49 of 58
Table 24-3. Summary of Quality Control Procedures for Metals Analysis
Quality Control Check
Frequency Acceptance Criteria Corrective Action
Daily Performance Check (DPR)
Daily, prior to samples Mg-24 > 40,000 cps, < 3% RSD In > 300,000 cps, < 3% RSD Pb-208 >100,000, <3% RSD Ba/Ba++ and Ce/CeO < 0.03 Bkgd < 30 cps at Mass 220
1)Repeat analysis of DPR 2)Re-optimize instrument tuning parameters 3) Reprepare DPR standard 4) Perform instrument maintenance
Initial Calibration Standards (IC)
Daily, at least 5 calibration points
Correlation coefficient ≥ 0.998 & %RSD ≤ 10. RSDs >10 are acceptable for the CAL2 standard.
1) Repeat analysis of calibration standards 2) Reprepare calibration standards and reanalyze
Initial Calibration Verification (ICV)
Immediately after calibration
Recovery 90-110%, with the exception of Al
1) Repeat analysis of ICV 2) ) Reprepare ICV standard 3Recalibrate and reanalyze
Initial Calibration Blank (ICB)
Immediately after ICV Absolute value must be ≤ MDL 1) Locate and resolve contamination problems before continuing 2) Reanalyze, recalibrate or flag failing elements for the entire analysis when appropriate
High standard verification (HSV)
After ICB and before ICS Recovery from 95-105% with the exception of Al
1) Repeat analysis of HSV 2) Reprepare HSV
Interference Check Standard (ICSA/IFA)
Following the HSV, every 8 hours and at the end of each run
Within ±3 times LOQ from zero or from the standard background contamination when present
1) Repeat analysis of ICSA 2) Reprepare ICSA and analyze 3) Adjust correction equation(s) and reprocess entire analysis
Interference Check Standard (ICSAB/IFB)
Following each ICSA Recovery 80-120% of true value plus standard background contamination when present
1) Repeat analysis of ICSAB 2) Reprepare ICSAB and analyze 3) Adjust correction equation(s) and reprocess entire analysis
Continuing Calibration Verification (CCV)
Analyze before samples, after every 10 samples, and at the end of each run
Recovery 90-110%, with the exception of Al
1) Reanalyze CCV 2) Reprepare CCV 3) Recalibrate and reanalyze samples since last acceptable CCV
Low Calibration Verification (LCV)
At the beginning and end of each analysis, between the CCV and CCB
Recovery 70-130% for Pb only 1) Reanalyze LCV 2) Reprepare LCV 3) Recalibrate and reanalyze samples
since last acceptable LCV Continuing Calibration Blanks (CCB)
Analyzed after each CCV Absolute value must be ≤ MDL 1) Reanalyze CCB 2) Reanalyze samples since last
acceptable CCB Laboratory Reagent Blank (LRB/BLK1)
1 per 20 samples, a minimum of 1 per batch
Absolute value must be ≤ MDL 1) Reanalyze 2) If > MDL, but < 5x MDL, sample results for that element must be flagged for the entire analysis 3) If > 5x the MDL then sample results
for that element must be blank subtracted
Method Blank (MB/BLK2)
1 per 20 samples, a minimum of 1 per batch
Absolute value must be ≤ MDL. Note: The MB is used only for the purpose of MDL generation
This standard is not required by the method and there is no corrective action
UNCONTROLLED ELECTRONIC COPY EFFECTIVE 4-2015
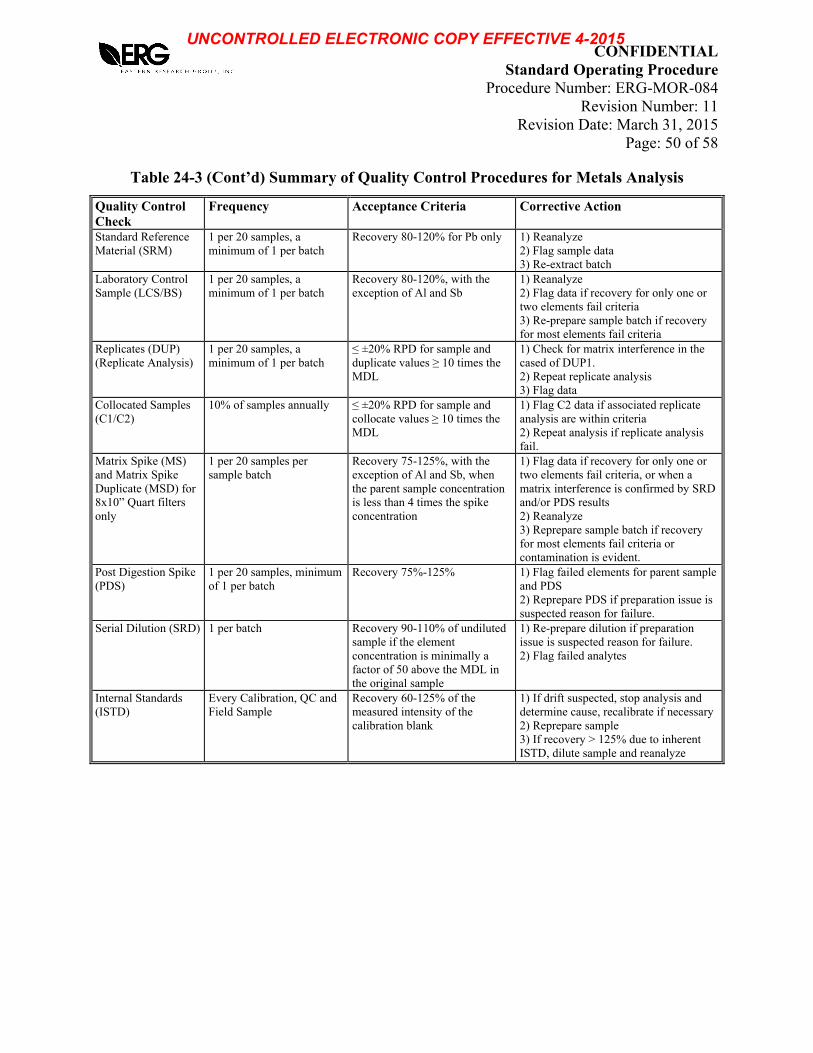
CONFIDENTIAL Standard Operating Procedure Procedure Number: ERG-MOR-084 Revision Number: 11 Revision Date: March 31, 2015 Page: 50 of 58
Table 24-3 (Cont’d) Summary of Quality Control Procedures for Metals Analysis
Quality Control Check
Frequency Acceptance Criteria Corrective Action
Standard Reference Material (SRM)
1 per 20 samples, a minimum of 1 per batch
Recovery 80-120% for Pb only 1) Reanalyze 2) Flag sample data 3) Re-extract batch
Laboratory Control Sample (LCS/BS)
1 per 20 samples, a minimum of 1 per batch
Recovery 80-120%, with the exception of Al and Sb
1) Reanalyze 2) Flag data if recovery for only one or two elements fail criteria 3) Re-prepare sample batch if recovery for most elements fail criteria
Replicates (DUP) (Replicate Analysis)
1 per 20 samples, a minimum of 1 per batch
≤ ±20% RPD for sample and duplicate values ≥ 10 times the MDL
1) Check for matrix interference in the cased of DUP1. 2) Repeat replicate analysis 3) Flag data
Collocated Samples (C1/C2)
10% of samples annually ≤ ±20% RPD for sample and collocate values ≥ 10 times the MDL
1) Flag C2 data if associated replicate analysis are within criteria 2) Repeat analysis if replicate analysis fail.
Matrix Spike (MS) and Matrix Spike Duplicate (MSD) for 8x10” Quart filters only
1 per 20 samples per sample batch
Recovery 75-125%, with the exception of Al and Sb, when the parent sample concentration is less than 4 times the spike concentration
1) Flag data if recovery for only one or two elements fail criteria, or when a matrix interference is confirmed by SRD and/or PDS results 2) Reanalyze 3) Reprepare sample batch if recovery for most elements fail criteria or contamination is evident.
Post Digestion Spike (PDS)
1 per 20 samples, minimum of 1 per batch
Recovery 75%-125% 1) Flag failed elements for parent sample and PDS 2) Reprepare PDS if preparation issue is suspected reason for failure.
Serial Dilution (SRD) 1 per batch Recovery 90-110% of undiluted sample if the element concentration is minimally a factor of 50 above the MDL in the original sample
1) Re-prepare dilution if preparation issue is suspected reason for failure. 2) Flag failed analytes
Internal Standards (ISTD)
Every Calibration, QC and Field Sample
Recovery 60-125% of the measured intensity of the calibration blank
1) If drift suspected, stop analysis and determine cause, recalibrate if necessary 2) Reprepare sample 3) If recovery > 125% due to inherent ISTD, dilute sample and reanalyze
UNCONTROLLED ELECTRONIC COPY EFFECTIVE 4-2015
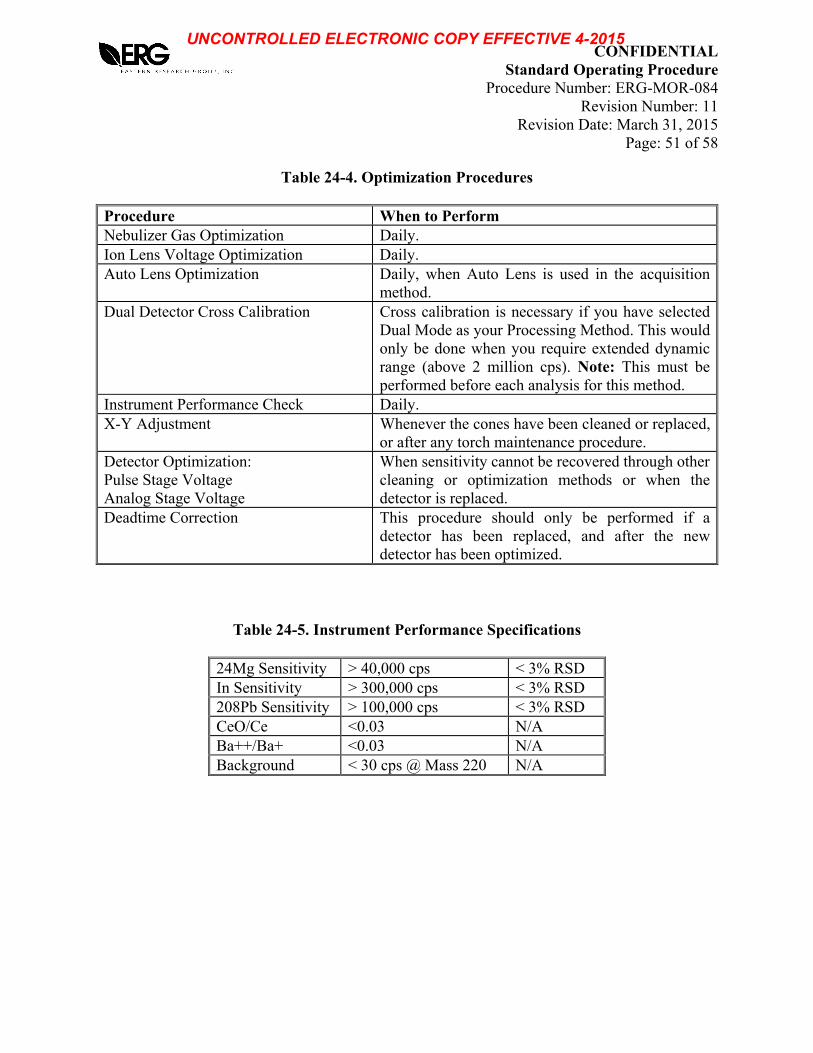
CONFIDENTIAL Standard Operating Procedure Procedure Number: ERG-MOR-084 Revision Number: 11 Revision Date: March 31, 2015 Page: 51 of 58
Table 24-4. Optimization Procedures
Procedure When to Perform Nebulizer Gas Optimization Daily. Ion Lens Voltage Optimization Daily. Auto Lens Optimization Daily, when Auto Lens is used in the acquisition
method. Dual Detector Cross Calibration Cross calibration is necessary if you have selected
Dual Mode as your Processing Method. This would only be done when you require extended dynamic range (above 2 million cps). Note: This must be performed before each analysis for this method.
Instrument Performance Check Daily. X-Y Adjustment Whenever the cones have been cleaned or replaced,
or after any torch maintenance procedure. Detector Optimization: Pulse Stage Voltage Analog Stage Voltage
When sensitivity cannot be recovered through other cleaning or optimization methods or when the detector is replaced.
Deadtime Correction This procedure should only be performed if a detector has been replaced, and after the new detector has been optimized.
Table 24-5. Instrument Performance Specifications
24Mg Sensitivity > 40,000 cps < 3% RSD In Sensitivity > 300,000 cps < 3% RSD 208Pb Sensitivity > 100,000 cps < 3% RSD CeO/Ce <0.03 N/A Ba++/Ba+ <0.03 N/A Background < 30 cps @ Mass 220 N/A
UNCONTROLLED ELECTRONIC COPY EFFECTIVE 4-2015
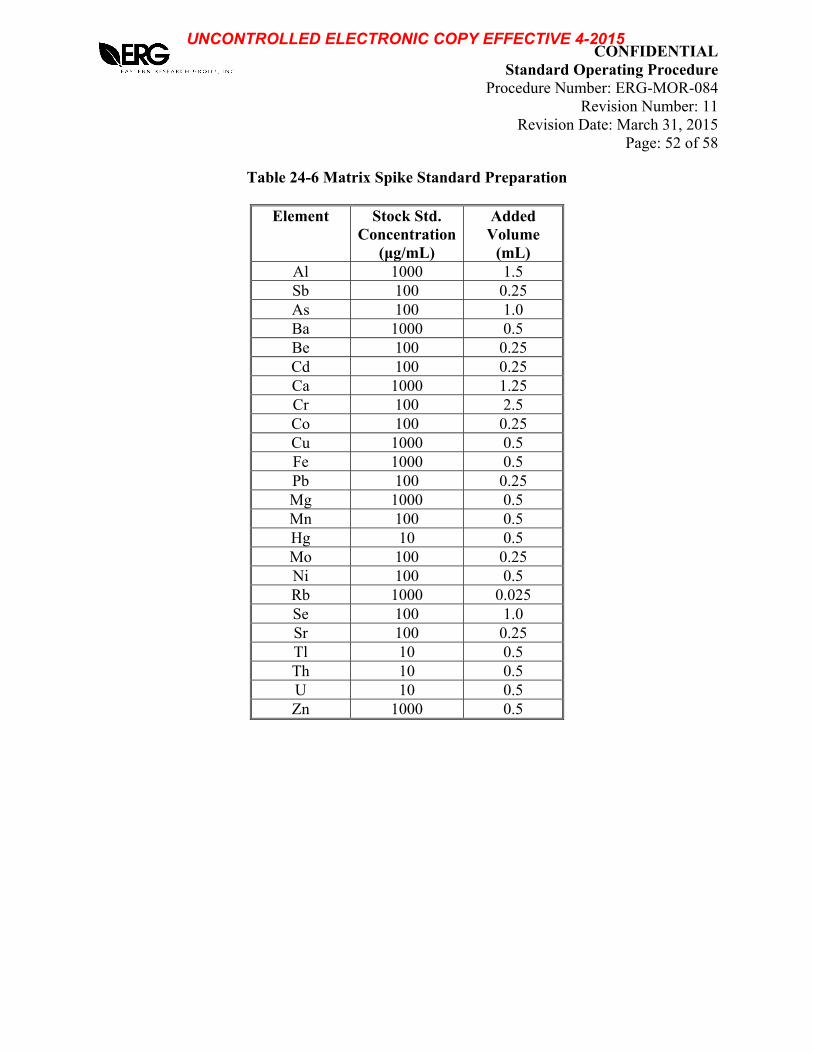
CONFIDENTIAL Standard Operating Procedure Procedure Number: ERG-MOR-084 Revision Number: 11 Revision Date: March 31, 2015 Page: 52 of 58
Table 24-6 Matrix Spike Standard Preparation
Element Stock Std. Concentration
(μg/mL)
Added Volume
(mL) Al 1000 1.5 Sb 100 0.25 As 100 1.0 Ba 1000 0.5 Be 100 0.25 Cd 100 0.25 Ca 1000 1.25 Cr 100 2.5 Co 100 0.25 Cu 1000 0.5 Fe 1000 0.5 Pb 100 0.25 Mg 1000 0.5 Mn 100 0.5 Hg 10 0.5 Mo 100 0.25 Ni 100 0.5 Rb 1000 0.025 Se 100 1.0 Sr 100 0.25 Tl 10 0.5 Th 10 0.5 U 10 0.5 Zn 1000 0.5
UNCONTROLLED ELECTRONIC COPY EFFECTIVE 4-2015
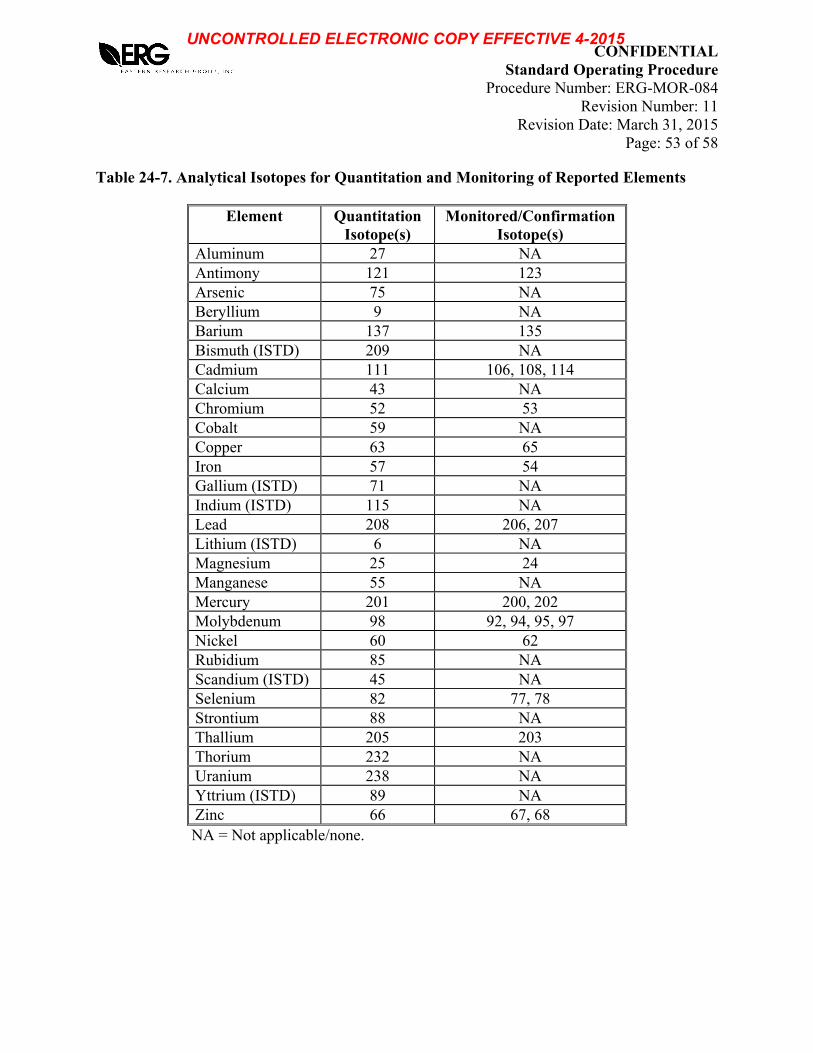
CONFIDENTIAL Standard Operating Procedure Procedure Number: ERG-MOR-084 Revision Number: 11 Revision Date: March 31, 2015 Page: 53 of 58 Table 24-7. Analytical Isotopes for Quantitation and Monitoring of Reported Elements
Element Quantitation Isotope(s)
Monitored/Confirmation Isotope(s)
Aluminum 27 NA Antimony 121 123 Arsenic 75 NA Beryllium 9 NA Barium 137 135 Bismuth (ISTD) 209 NA Cadmium 111 106, 108, 114 Calcium 43 NA Chromium 52 53 Cobalt 59 NA Copper 63 65 Iron 57 54 Gallium (ISTD) 71 NA Indium (ISTD) 115 NA Lead 208 206, 207 Lithium (ISTD) 6 NA Magnesium 25 24 Manganese 55 NA Mercury 201 200, 202 Molybdenum 98 92, 94, 95, 97 Nickel 60 62 Rubidium 85 NA Scandium (ISTD) 45 NA Selenium 82 77, 78 Strontium 88 NA Thallium 205 203 Thorium 232 NA Uranium 238 NA Yttrium (ISTD) 89 NA Zinc 66 67, 68 NA = Not applicable/none.
UNCONTROLLED ELECTRONIC COPY EFFECTIVE 4-2015

CONFIDENTIAL Standard Operating Procedure Procedure Number: ERG-MOR-084 Revision Number: 11 Revision Date: March 31, 2015 Page: 54 of 58
Figure 24-8. Quality Control Review Form (Page 1)
UNCONTROLLED ELECTRONIC COPY EFFECTIVE 4-2015

CONFIDENTIAL Standard Operating Procedure Procedure Number: ERG-MOR-084 Revision Number: 11 Revision Date: March 31, 2015 Page: 55 of 58
Figure 24-8. Quality Control Review Form (Page 2)
UNCONTROLLED ELECTRONIC COPY EFFECTIVE 4-2015

CONFIDENTIAL Standard Operating Procedure Procedure Number: ERG-MOR-084 Revision Number: 11 Revision Date: March 31, 2015 Page: 56 of 58
Figure 24-8. Quality Control Review Form (Page 3)
UNCONTROLLED ELECTRONIC COPY EFFECTIVE 4-2015
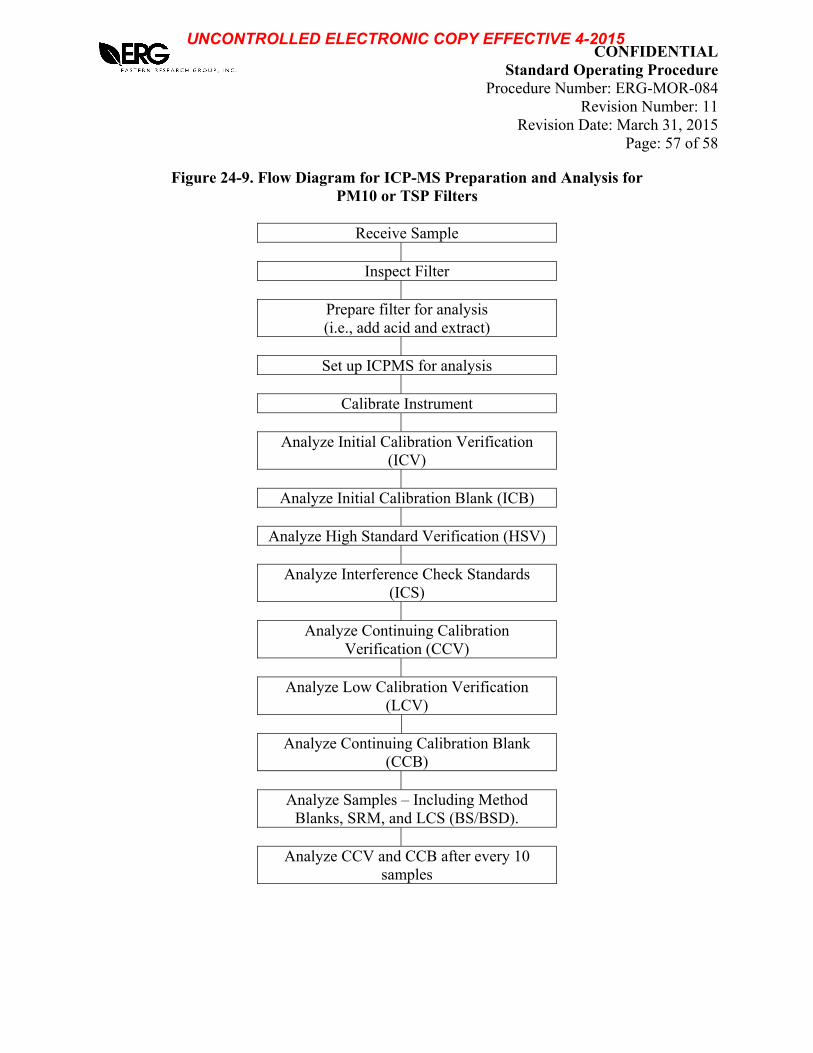
CONFIDENTIAL Standard Operating Procedure Procedure Number: ERG-MOR-084 Revision Number: 11 Revision Date: March 31, 2015 Page: 57 of 58
Figure 24-9. Flow Diagram for ICP-MS Preparation and Analysis for PM10 or TSP Filters
Receive Sample
Inspect Filter
Prepare filter for analysis (i.e., add acid and extract)
Set up ICPMS for analysis
Calibrate Instrument
Analyze Initial Calibration Verification
(ICV)
Analyze Initial Calibration Blank (ICB) Analyze High Standard Verification (HSV)
Analyze Interference Check Standards (ICS)
Analyze Continuing Calibration
Verification (CCV)
Analyze Low Calibration Verification (LCV)
Analyze Continuing Calibration Blank
(CCB)
Analyze Samples – Including Method Blanks, SRM, and LCS (BS/BSD).
Analyze CCV and CCB after every 10
samples
UNCONTROLLED ELECTRONIC COPY EFFECTIVE 4-2015
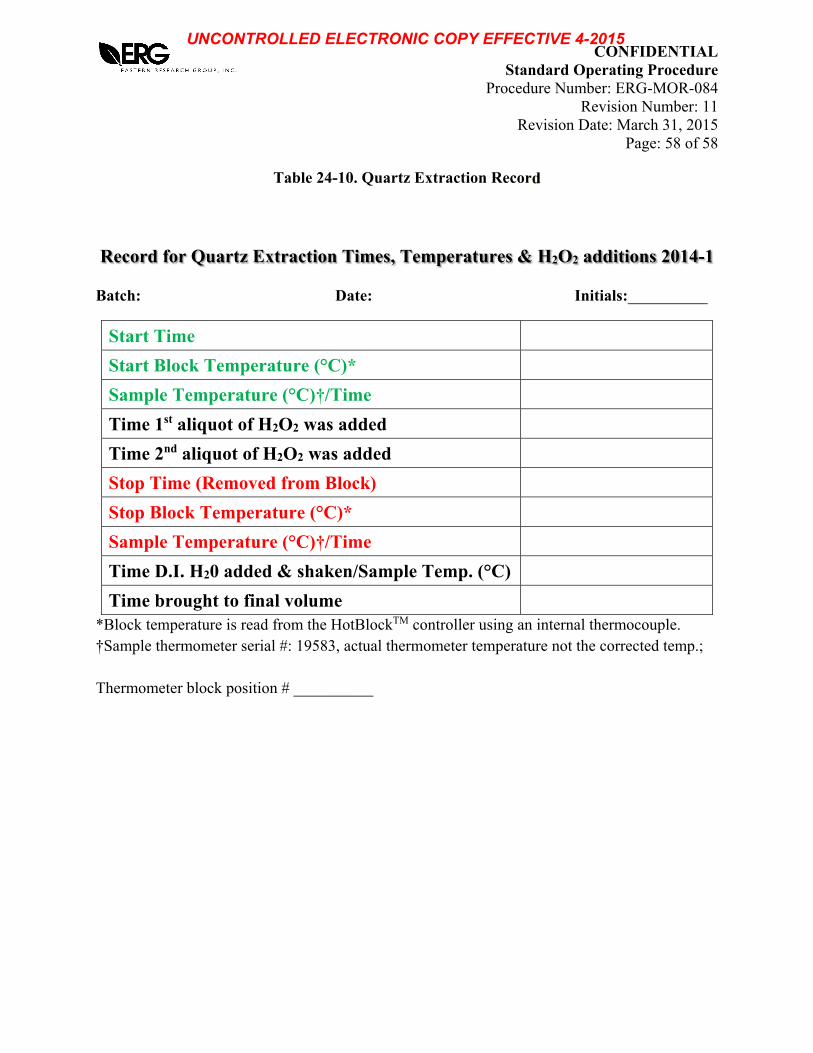
CONFIDENTIAL Standard Operating Procedure Procedure Number: ERG-MOR-084 Revision Number: 11 Revision Date: March 31, 2015 Page: 58 of 58
Table 24-10. Quartz Extraction Record
Record for Quartz Extraction Times, Temperatures & H2O2 additions 2014-1
Batch: Date: Initials:__________
Start Time
Start Block Temperature (°C)*
Sample Temperature (°C)†/Time
Time 1st aliquot of H2O2 was added
Time 2nd aliquot of H2O2 was added
Stop Time (Removed from Block)
Stop Block Temperature (°C)*
Sample Temperature (°C)†/Time
Time D.I. H20 added & shaken/Sample Temp. (°C)
Time brought to final volume
*Block temperature is read from the HotBlockTM controller using an internal thermocouple. †Sample thermometer serial #: 19583, actual thermometer temperature not the corrected temp.; Thermometer block position # __________
UNCONTROLLED ELECTRONIC COPY EFFECTIVE 4-2015

UNCONTROLLED ELECTRONIC COPY EFFECTIVE 4-2015

CONFIDENTIAL Standard Operating Procedure Procedure Number: ERG-MOR-085 Revision Number: 10 Revision Date: March 31, 2015 Page: 2 of 56 3.0 METHOD DETECTION LIMIT
3.1 Method Detection Limits (MDL)
3.1.1 The method detection limit (MDL) for each isotope is calculated
according to Appendix D: DQ FAC Single Laboratory Procedure v2.4, 8/30/2007, with the exception of arsenic. MDL values are determined from historic method blank (BLK2) data following the procedure in the document above.
In the case of arsenic, where the FAC MDL calculation method does not
provide MDLs lower than an analyte’s minimum risk level (MRL), the MDL method described in the CFR is employed instead. This involves spiking ten filters with a known concentration between 3 and 5 times the estimated MDL. The filters are then extracted and analyzed following the entire analytical method.
3.1.2 The y-intercept for each linear calibration must be set to zero. 3.1.3 Use the same internal standards, calibration standards, instrument method
and settings (sweeps and dwell) for the MDL study and field sample analysis.
3.1.4 The MDL determination should be reported in ng/L, ng/filter and ng/m3
(assuming 24.04 m3 per sample). Refer to Table 24-1. 3.1.5 The MDL study should be repeated once per year and whenever a
significant change in background or instrument response is expected (e.g., detector change).
4.0 SCOPE AND APPLICATION
4.1 Scope
This procedure details the acid extraction and trace elemental analysis of ambient air samples using an inductively coupled plasma-mass spectrometer (ICP-MS). The extraction procedures are suitable for low-volume ambient air samples collected on Teflon® membrane filters, sized up to 47 millimeters in diameter. The procedure is applicable, but not limited to the metals listed in Table 24-1.
4.2 Applicability
This SOP is applicable to the analysis of suspended particulate matter collected with Teflon® filters. Acid digestion of samples and filtration (if necessary) is
UNCONTROLLED ELECTRONIC COPY EFFECTIVE 4-2015

CONFIDENTIAL Standard Operating Procedure Procedure Number: ERG-MOR-085 Revision Number: 10 Revision Date: March 31, 2015 Page: 3 of 56
required prior to analysis of Teflon® filter extracts. Analytes for which ERG has demonstrated the acceptability of this method are listed below. See Table 24-7 for a list of isotopes used for quantitation and monitoring.
Element Symbol CASRN Aluminum* Al 7429-90-5 Antimony Sb 7440-36-0 Arsenic As 7440-38-2 Barium* Ba 7440-39-3 Beryllium Be 7440-41-7 Cadmium Cd 7440-43-9 Calcium* Ca 7440-70-2 Chromium Cr 7440-47-3 Cobalt Co 7440-48-4 Copper* Cu 7440-50-8 Iron* Fe 7439-89-6 Lead Pb 7439-92-1 Magnesium* Mg 7439-95-4 Manganese Mn 7439-96-5 Mercury Hg 7439-97-6 Molybdenum* Mo 7439-98-7 Nickel Ni 7440-02-0 Rubidium* Rb 7440-17-7 Selenium Se 7782-49-2 Strontium* Sr 7440-24-6 Thallium* Tl 7440-28-0 Thorium* Th 7440-29-1 Uranium* U 7440-61-1 Zinc* Zn 7440-66-6
* Elements not on our standard EPA UATMP/NATTS analysis list of elements. 5.0 METHOD SUMMARY
This SOP describes the multi-elemental determination of total metals by ICP-MS in ambient air samples collected on 47mm Teflon® filters following guidelines in EPA method IO-3.5 and EPA FEM Method “Standard Operating Procedure for the Determination of Lead in PM10 by Inductively Coupled Plasma Mass Spectrometry (ICP-MS) with Hot Block Dilute Acid and Hydrogen Peroxide Filter Extraction” (EQL-0512-202). The filters are digested in a HotBlock™ for 2.5 hours using an extraction fluid containing 1.85% nitric acid (HNO3), 0.5% hydrochloric acid (HCl), and 0.17% hydrofluoric acid (HF) with 8.33 mg/L of gold added for mercury stabilization. One aliquot of hydrogen peroxide (H2O2) is added after 1.5 hours of extraction and is allowed
UNCONTROLLED ELECTRONIC COPY EFFECTIVE 4-2015
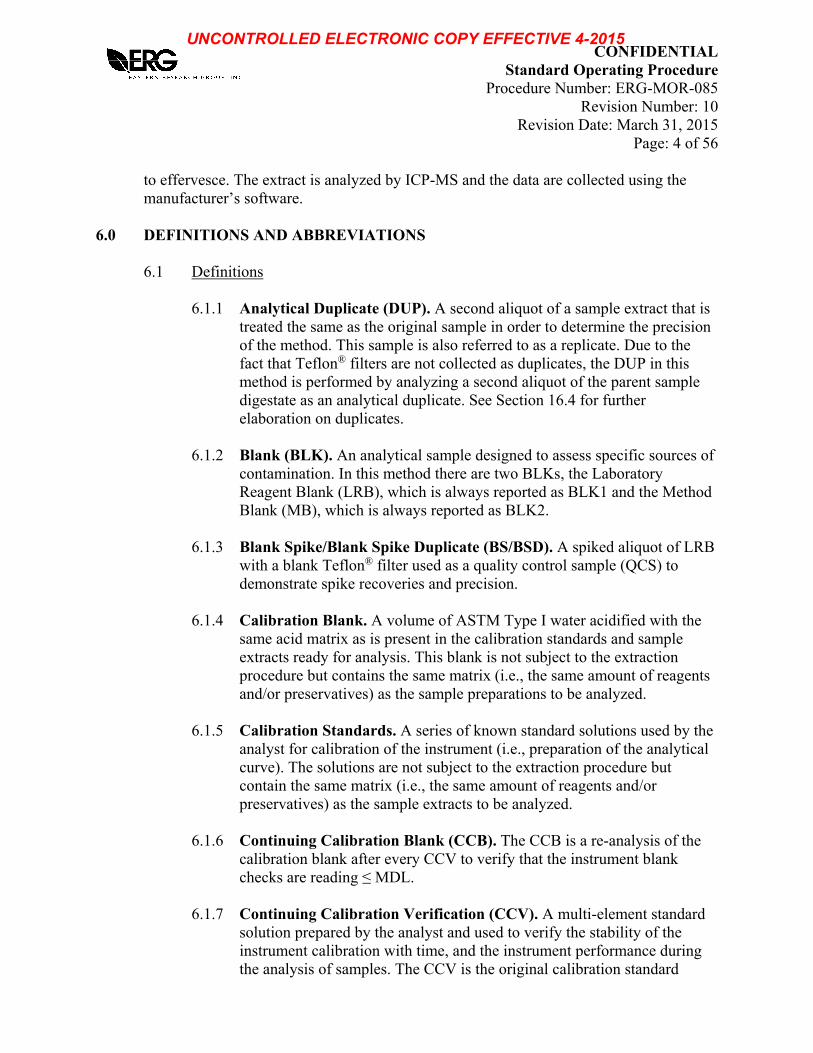
CONFIDENTIAL Standard Operating Procedure Procedure Number: ERG-MOR-085 Revision Number: 10 Revision Date: March 31, 2015 Page: 4 of 56
to effervesce. The extract is analyzed by ICP-MS and the data are collected using the manufacturer’s software.
6.0 DEFINITIONS AND ABBREVIATIONS
6.1 Definitions
6.1.1 Analytical Duplicate (DUP). A second aliquot of a sample extract that is treated the same as the original sample in order to determine the precision of the method. This sample is also referred to as a replicate. Due to the fact that Teflon® filters are not collected as duplicates, the DUP in this method is performed by analyzing a second aliquot of the parent sample digestate as an analytical duplicate. See Section 16.4 for further elaboration on duplicates.
6.1.2 Blank (BLK). An analytical sample designed to assess specific sources of
contamination. In this method there are two BLKs, the Laboratory Reagent Blank (LRB), which is always reported as BLK1 and the Method Blank (MB), which is always reported as BLK2.
6.1.3 Blank Spike/Blank Spike Duplicate (BS/BSD). A spiked aliquot of LRB
with a blank Teflon® filter used as a quality control sample (QCS) to demonstrate spike recoveries and precision.
6.1.4 Calibration Blank. A volume of ASTM Type I water acidified with the
same acid matrix as is present in the calibration standards and sample extracts ready for analysis. This blank is not subject to the extraction procedure but contains the same matrix (i.e., the same amount of reagents and/or preservatives) as the sample preparations to be analyzed.
6.1.5 Calibration Standards. A series of known standard solutions used by the
analyst for calibration of the instrument (i.e., preparation of the analytical curve). The solutions are not subject to the extraction procedure but contain the same matrix (i.e., the same amount of reagents and/or preservatives) as the sample extracts to be analyzed.
6.1.6 Continuing Calibration Blank (CCB). The CCB is a re-analysis of the
calibration blank after every CCV to verify that the instrument blank checks are reading ≤ MDL.
6.1.7 Continuing Calibration Verification (CCV). A multi-element standard
solution prepared by the analyst and used to verify the stability of the instrument calibration with time, and the instrument performance during the analysis of samples. The CCV is the original calibration standard
UNCONTROLLED ELECTRONIC COPY EFFECTIVE 4-2015

CONFIDENTIAL Standard Operating Procedure Procedure Number: ERG-MOR-085 Revision Number: 10 Revision Date: March 31, 2015 Page: 5 of 56
whose concentration is at the midpoint of the calibration curve that is re-analyzed as a quality control (QC) sample.
6.1.8 Field Blank. This is any sample that is submitted from the field and is
identified as a blank. This also includes trip blanks. 6.1.9 High Standard Verification (HSV). The HSV is the highest calibration
standard that is reanalyzed to verify the accuracy of the calibration curve at that concentration before the analysis of samples.
6.1.10 Initial Calibration Blank (ICB).The ICB is a re-analysis of the
calibration blank, which is analyzed after the ICV and used to verify that the instrument blank checks are ≤ MDL.
6.1.11 Initial Calibration Verification (ICV). A solution prepared from a stock
standard solution obtained from a source separate from that utilized to prepare the calibration standards. The ICV is used to verify the concentration of the calibration standards and the adequacy of the instrument calibration.
6.1.12 Interference Check Standard (ICS). A solution that may contain only
interfering elements (ICSA) or both interfering elements and analytes of interest (ICSAB) in known concentrations that can be used to verify background and interference correction equations.
6.1.13 Interferents. Substances (atoms, ions, polyatomic ions, etc.) which may
affect the analytical result for the element of interest. 6.1.14 Internal Standard (ISTD). A non-target element added to a sample at a
known concentration after preparation but prior to analysis. Instrument responses to internal standards are monitored as a means of assessing overall instrument performance.
6.1.15 Laboratory Control Sample (LCS). A spiked aliquot of LRB with a
blank Teflon® filter used as a QCS that is prepared and brought through the entire digestion/extraction and analytical process to demonstrate spike recoveries. This sample is synonymous with the BS/BSD.
6.1.16 Laboratory Reagent Blank (LRB). An aliquot of ASTM Type I water
that is treated exactly as a sample including exposure to all labware, equipment, solvents, reagents and internal standards that are used with other samples that is always reported as BLK1. The LRB is used to determine if method analytes or other interferences are present in the laboratory environment, the reagents or apparatus.
UNCONTROLLED ELECTRONIC COPY EFFECTIVE 4-2015

CONFIDENTIAL Standard Operating Procedure Procedure Number: ERG-MOR-085 Revision Number: 10 Revision Date: March 31, 2015 Page: 6 of 56
6.1.17 Limit of Quantitation (LOQ) – The lowest concentration of an analyte that produces a signal/response that is sufficiently greater than the signal/response of lab reagent blanks to enable reliable detection and quantification during routine lab operating conditions. Statistically defined, this is the concentration of analyte in sample matrix that produces an instrument signal/response that is 10 times the standard deviation above the LRB (at 99% confidence, n-1 degree freedom; see Table 24-2).
6.1.18 Linear Dynamic Range (LDR). The concentration range over which the
analytical working curve generated from the calibration standards is proven to remain linear. See Section 13.8 for more information on the LDR.
6.1.19 Lower Limit of Quantitation Check (LLQC) – A check sample that is used to both establish and confirm the lower limit of quantitation and is prepared by spiking a low concentration of analyte into reagent water and carrying the solution through the entire preparation and analytical procedure.
6.1.20 Lower Limit of Quantitation Limit (LLQL) – The lower limit of quantitation is considered the lowest reliable laboratory reporting concentrations and should be established from the lower limit of quantitation check sample and then confirmed using the lowest calibration point and/or from a low level calibration check standard.
6.1.21 Low Level Calibration Verification (LCV) – A stock standard solution prepared using the same source as the calibration standards that is analyzed to verify the LLQL. The standard is prepared at the same concentration as the LLQL. An LCV is analyzed at the beginning, typically just before or after CCV1, and at the end of every analysis just before or after the final CCV.
6.1.22 Matrix Interference/Effect. In general, the interference and/or effect that
particular matrix constituents may cause during sample processing and/or analysis. Matrix effects may be determined to exist from the careful interpretation of QC samples and criteria. Examples of observed effects include but are not limited to poor recoveries of spikes/ISTD and poor percent differences.
6.1.23 Method Blank (MB). An aliquot of LRB with a blank Teflon® filter that
is carried through the entire preparation and extraction process to demonstrate background contamination contribution from the filter and process and is always reported as BLK2.
UNCONTROLLED ELECTRONIC COPY EFFECTIVE 4-2015
CONFIDENTIAL Standard Operating Procedure Procedure Number: ERG-MOR-085 Revision Number: 10 Revision Date: March 31, 2015 Page: 7 of 56
6.1.24 Method Detection Limit (MDL). The minimum concentration of an analyte that can be identified, measured, and reported with 99% confidence that the analyte concentration is greater than zero.
6.1.25 Performance Evaluation (PE) Sample. A sample of known composition
provided by a source outside the laboratory for analysis that evaluates the laboratory’s analytical performance.
6.1.26 Post Digestion Spike (PDS). A spiked aliquot of an already digested
sample used to demonstrate spike recoveries in the sample matrix. The analytical results of this spike may be used to verify matrix interference in conjunction with the SRD results.
6.1.27 Quality Control Sample (QCS). A solution containing known
concentrations of method analytes that is used to fortify an aliquot of LRB matrix. The QCS is prepared from a source(s) external to the laboratory and is used to verify the laboratory’s analytical performance.
6.1.28 Serial Dilution (SRD). The dilution of a sample by a factor of five. If the
undiluted parent sample concentration is minimally a factor of 50 above the MDL, the diluted sample should agree with the parent sample concentration within ± 10% when corrected by the dilution factor. The SRD may indicate the influence of interferents.
6.1.29 Standard Reference Material (SRM) – A prepared standard material that has certified metals concentrations, for example the NIST SRM 1648a (Urban particulate matter with certified concentrations of lead at 0.655 ± 0.033 mass fraction (in %)). The SRM is used to verify the extraction procedure.
6.1.30 Stock Standard Solution. A commercially prepared standard solution
(traceable to NIST or other certified standard sources), which can be diluted to derive other standards.
6.1.31 Tuning Solution. A solution used to determine acceptable instrument
performance prior to calibration and sample analyses. This solution is used for mass calibration, nebulizer optimization, auto lens optimization, and daily performance reports.
6.2 Abbreviations
amu Atomic Mass Units ASTM American Society for Testing and Materials CASRN Chemical Abstract Services Registry Number
UNCONTROLLED ELECTRONIC COPY EFFECTIVE 4-2015

CONFIDENTIAL Standard Operating Procedure Procedure Number: ERG-MOR-085 Revision Number: 10 Revision Date: March 31, 2015 Page: 8 of 56
COC Chain of Custody cps Counts Per Second DI Deionized DQO Data Quality Objective ICP-MS Inductively Coupled Plasma - Mass Spectrometry kW Kilowatt(s) L Liter(s) LDPE Low Density Polyethelyene LIMS Laboratory Information Management System MΩ Megohm MCA Multichannel Analyzer MQO Method Quality Objectives m Meter(s) m3 Cubic Meter(s) mg Milligram(s) mg/L Milligram(s) per liter(s) min Minute(s) mL Milliliter(s) mm Millimeter(s) ms Millisecond(s) ng Nanogram(s) ng/L Nanogram(s) per liter(s) ng/mL Nanogram(s) per milliliter(s) NIST National Institute of Standards and Technology QC Quality Control RSD Relative Standard Deviation RPD Relative Percent Difference SD Standard Deviation SOP Standard Operating Procedures Std. Standard μg/L Microgram(s) per liter(s) μg/m3 Microgram(s) per cubic meter(s) μg/mL Microgram(s) per milliliter(s) μL Microliter μm Micrometer v/v Volume per volume ratio
7.0 INTERFERENCES
Note: The background level of metals on a given lot of Teflon® filters can vary. Any background levels found on blanks should be documented for all the filters from the corresponding lot when available. It is recommended to consult 40 CFR Part 50, Section 6.1 Appendix G for guidance.
UNCONTROLLED ELECTRONIC COPY EFFECTIVE 4-2015

CONFIDENTIAL Standard Operating Procedure Procedure Number: ERG-MOR-085 Revision Number: 10 Revision Date: March 31, 2015 Page: 9 of 56
7.1 Laboratory Interferences
7.1.1 Wear powder-free nitrile or neoprene gloves when handling unexposed or exposed filters.
7.1.2 Clean all equipment used in the sample preparation and analysis in a
manner consistent with good laboratory practices for metals analysis (See Section 20.3 in this SOP and Section 14.3.1 in SOP ERG-MOR-031).
7.1.3 Use ASTM Type I DI water or equivalent, with a resistivity greater than
17.3 MΩ, for sample extraction and standard preparation. Record the water resistivity prior to use.
7.2 Chemical Interferences
Pay close attention to the nature of solutions introduced to the ICP-MS.
7.2.1 Nitric acid must be less than 2% (v/v) for ICP-MS analysis to minimize
the damage to the interface and to minimize isobaric molecular interferences. The use of platinum cones and other acid-resistant sample introduction components can be used for more aggressive acid matrices.
7.2.2 If higher acid extractions are required, dilute final digestate to 2% HNO3.
7.2.3 The final dilutions of sample extracts must match the acid content of the
calibration standards in order to match potential interferences.
7.2.4 The concentrations of dissolved solids in analysis solutions should be less than 2% to protect the sample interface on the instrument and prevent signal suppression. Higher concentrations may plug the sample and/or skimmer cone orifices.
Note: Protect the channel electron multiplier from high chemical
concentrations (high ion currents). The channel electron multiplier suffers from fatigue after being exposed to high ion currents. This fatigue can last from several seconds to hours depending on the extent of exposure. During this period, response factors are constantly changing, which causes instrument instability that invalidates the calibration curve, and thereby, invalidates all associated sample results. A sodium bicarbonate (NaHCO3) sample matrix is known to cause this problem.
UNCONTROLLED ELECTRONIC COPY EFFECTIVE 4-2015
CONFIDENTIAL Standard Operating Procedure Procedure Number: ERG-MOR-085 Revision Number: 10 Revision Date: March 31, 2015 Page: 10 of 56
7.3 Instrument Interferences
7.3.1 Isobaric molecular and doubly charged ion interferences are caused by more than one atom (example, the contribution of ArCl on the 75As signal) or more than one charge (example, MoO+ ions on Cd isotopes).
7.3.2 Spectral interferences result from the presence of other isotopes or ions
that have the same atomic weight or mass number as the analyte.
7.3.3 Transport interferences are a specific physical interference associated with the sample nebulization and transport process through the instrument. These usually result from sample matrix components that influence the aerosol formation or cause a change in the surface tension or viscosity. Changes in the matrix composition can cause observed signal suppression or enhancement.
7.3.4 Matrix interferences may be caused by elemental chemical and physical
properties in the samples. For matrices of known composition, match the composition of the calibration and QC standards to that of the samples. For matrices of unknown composition, use an ISTD that has been matched to the analytes’ chemical and physical properties (i.e., ionization potential, ±50 amu) so that the ISTD and element of interest behave similarly during the analytical process.
7.3.5 Memory interferences can occur when there are large concentration
differences between samples or standards that are analyzed sequentially. Sample deposition on the sample and skimmer cones, spray chamber, peristaltic pump tubing and the type of nebulizer all affect the extent of the memory interferences that are observed. The rinse period between samples must be long enough to eliminate significant memory interferences.
7.3.6 Lead values are reported from isotope 208; however, all three isotopes must be used to quantitate lead to allow for the variability of lead isotopes in nature. The following correction equation must be applied to isotope 208:
(1.000) (206Pb) + (1.000) (207Pb) + (1.000) (208Pb) 8.0 SAFETY
8.1 Personal protection should be used for all work performed in the inorganic laboratory, (e.g., gloves, safety glasses, laboratory coats, etc.).
UNCONTROLLED ELECTRONIC COPY EFFECTIVE 4-2015
CONFIDENTIAL Standard Operating Procedure Procedure Number: ERG-MOR-085 Revision Number: 10 Revision Date: March 31, 2015 Page: 11 of 56
8.2 The compressed gas cylinders must be stored and handled according to relevant safety codes outlined in the corporate health and safety manual. In use, the cylinders must be secured to an immovable structure and moved using a gas cylinder cart.
8.3 Make sure that sample vials are kept capped and in racks to prevent spills.
8.4 All personnel should be trained in the handling, extraction and analysis of acid
samples for inorganic analysis.
8.5 Strong acids must not be stored with organic solvents or samples.
8.6 Follow normal laboratory safety procedures as outlined in the ERG Health and Safety Manual and the site-specific laboratory SOP.
9.0 EQUIPMENT
9.1 ICP-MS
The PerkinElmer SCIEX™ ELAN® 9000 ICP-MS consists of an inductively coupled plasma source, ion optics, a quadrupole mass spectrometer, a computer that controls the instrument, data acquisition and data handling software (ELAN® Software SCIEX™, Version 3.4), a printer, an autosampler (AS-93plus) and a recirculator. The quadrupole mass spectrometer has a mass range of 2 to 270 amu. Typical operating conditions are listed below.
Typical Operating Conditions
Plasma forward power 1.3 kW Plasma/Coolant argon flow rate 13.8 L/min Auxiliary argon flow rate 1.2 L/min Nebulizer flow rate 0.9 L/min Solution uptake rate 1.0 mL/min Spray chamber temperature Room Temperature Detector mode(s) Pulse counting/Analog Replicate integrations 3 Mass range 6 - 240 amu Dwell time 50 ms Number of MCA channels 1 Number of scan sweeps 20 Total acquisition time 4.2 min/sample
UNCONTROLLED ELECTRONIC COPY EFFECTIVE 4-2015

CONFIDENTIAL Standard Operating Procedure Procedure Number: ERG-MOR-085 Revision Number: 10 Revision Date: March 31, 2015 Page: 12 of 56
9.2 Digestion System
Environmental Express HotBlock™ Digestion System or equivalent system capable of maintaining a temperature of 95°C within ± 2˚C. This temperature will heat the samples to a temperature of ~85°C (±5°C).
10.0 MATERIALS
10.1 Graduated polypropylene sample vials with screw caps, 50 mL volume (certified to be within ± 0.2mL).
10.2 Branson 8510 sonication bath with heating capability.
10.3 Pipetters with adjustable volumes ranging from 0.5 μL to 10 mL and disposable
tips. Mechanical pipettes must be verified for accuracy quarterly (or every three months). Repeatable, mechanical pipettes, such as Eppendorf Research®, may be used and their accuracy should be verified on a quarterly basis to be within the manufacturer’s specifications. If a pipette’s accuracy exceeds the manufacturer’s specifications its use should be discontinued and it should be replaced or sent in for repair.
10.4 Miscellaneous: powder-free nitrile or nitrile gloves; disposable laboratory wipes;
self adhesive labels.
10.5 Volumetric flasks. Teflon®, Class A, 50, 100, 250 and 500 mL capacities.
10.6 Storage bottles. Wide and narrow mouth, Teflon® FEP (fluorinated ethylene propylene) with Tefzel® ETFE (ethylene tetraflourethylene) screw closure, 50, 100, 250, 500, 1,000 and 2,000 mL capacities.
10.7 Reflux caps and FilterMate™ 2 μm Teflon® filters. 10.8 Wash bottles made of LDPE and Teflon® having 500 mL and 1 L capacities. 10.9 Plastic or Teflon® coated tweezers.
11.0 CHEMICALS, REAGENTS, STANDARDS AND THEIR PREPARATION
Note: In general, chemicals, reagents and commercial stock standards expire when specified by the manufacturer. If the manufacturer does not provide an expiration date then they shall expire one year from the opened date. Standards and other solutions prepared in-house expire as specified throughout the SOP. Proper disposal of hazardous wastes are discussed in detail in the Solid and Hazardous Wastes SOP (ERG-MOR-033).
UNCONTROLLED ELECTRONIC COPY EFFECTIVE 4-2015
CONFIDENTIAL Standard Operating Procedure Procedure Number: ERG-MOR-085 Revision Number: 10 Revision Date: March 31, 2015 Page: 13 of 56
11.1 High Purity Acids - ultrapure and concentrated stored in Teflon® Bottles. These reagents are used for the preparation of sample extraction fluid and all standards.
Note: Concentrated high purity reagents are not 100% of the specified reagent. It
should be understood that all percentages in this SOP are expressed in terms of volume per volume (v/v) rather than true percentages of reagents in solution.
11.1.1 Nitric Acid (HNO3), 60-70% 11.1.2 Hydrochloric Acid (HCl), 32-35%
11.1.3 Hydrofluoric Acid (HF), 47-51% 11.1.4 Extraction fluid (0.5% (v/v) HCl, 1.85% (v/v) HNO3, 0.17% (v/v) HF and
8.30 mg/L Au) 11.1.5 Standard solvent (0.30% (v/v) HCl, 1.11% (v/v) HNO3, 0.10% (v/v) HF
with 5 mg/L Au) 11.2 Hydrogen Peroxide (H2O2) - ultrapure and concentrated (30-32%) stored in
Teflon® bottles. This reagent is used for the extraction procedure.
11.3 Nitric Acid - Trace Metal Grade in 2.5 L glass for rinse blank and labware cleaning.
11.3.1 Rinse blank (2% (v/v) HNO3, 0.5% (v/v) HCl with 5 mg/L Au) 11.3.2 10% (v/v) HNO3 acid bath for labware cleaning
Preparation: The acid bath solution is prepared by adding 2.5L of concentrated trace metal grade HNO3 to 22.5 L of ASTM Type I DI water in a clean 42 L polypropylene acid bath tank. The acid bath should be stored in a fume hood.
11.4 ASTM Type I deionized water - with a resistivity greater than 17.3 MΩ.
11.5 Argon gas - purity > 99.996%, Oxygen < 5 mg/L, Hydrogen < 1 mg/L, Nitrogen
< 20 mg/L and Water < 4 mg/L.
11.6 Secondary Source Control Standards - A commercially prepared single- or multi-element secondary source (different manufacturer from the multi-element calibration standard). These NIST traceable calibration standards are used to produce the ICV, which is run as a verification of the instrument’s calibration for accuracy and precision.
UNCONTROLLED ELECTRONIC COPY EFFECTIVE 4-2015

CONFIDENTIAL Standard Operating Procedure Procedure Number: ERG-MOR-085 Revision Number: 10 Revision Date: March 31, 2015 Page: 14 of 56
11.7 Single-Element Stock Standard Solutions - Commercially prepared NIST traceable standards from ultra high-purity grade chemicals or metals (99.99 – 99.999% pure) designed for use with ICP-MS instruments (e.g., Mercury Std.).
11.8 Multi-Element Stock Standard Solutions - Commercially prepared NIST traceable
standards from ultra high-purity grade chemicals or metals (99.99 – 99.999% pure) designed for use with ICP-MS instruments (e.g., ISTD solution).
11.9 Interference Check Standard - Commercially prepared standard that is diluted to
prepare ICSA and ICSAB interferent checks. 11.10 Smart Tune Solution - Although custom tuning solutions may be used, the tuning
solution for this SOP may be purchased through the manufacturer (Perkin Elmer #N8125040) or is prepared in-house using single-element standards to contain 10 μg/L of Be, Mg, Co, Rh, In, Ba, Ce, Pb, and U in 1% (v/v) HNO3.
To prepare 1 L of this solution, add 10 mL of Ultrex Nitric Acid to ~ 900 mL of
ASTM Type I deionized water and add 10 μL of each 1,000 μg/mL single-element standard, then bring to volume. This solution may be stored in LDPE bottles but ideally in Teflon®. The expiration date is either that specified by the manufacturer or if prepared in-house no later than the earliest expiration date of any standard or reagent used for preparation.
11.11 Dual Detector Cross Calibration Solution - Refer to Section 13.3 for the purpose
and final concentration of this solution. Although custom cross calibration solutions can be used, it may be purchased through the manufacturer (Perkin Elmer #8125032) or it is prepared in-house using single-element standards.
11.12 Multi-element ISTD stock standard – Commercially prepared standard that is
used in conjunction with the single-element standards for Sc, Ga, and Li to prepare the internal standard.
11.13 Internal Standard Spike Solution – Prepared standard used to manually spike all
calibration and QC standards as well as all samples that are analyzed by the ICP-MS.
11.14 Blank Spike (BS) Standard – The BS standard is used to spike the BS/BSD (See
Section 16.3). Prepare the BS standard according to Table 24-6 with a final volume of 50 mL.
11.15 Post Digestion Spike (PDS) Standard –The PDS standard is used to spike the PDS
source sample. This post digestion spike is used to help determine if poor matrix spike recoveries are due to interferents. Spike 1 µL/mL of sample analyzed.
UNCONTROLLED ELECTRONIC COPY EFFECTIVE 4-2015

CONFIDENTIAL Standard Operating Procedure Procedure Number: ERG-MOR-085 Revision Number: 10 Revision Date: March 31, 2015 Page: 15 of 56
11.16 Second Source Working Standard – The second source working standard is used to create the ICV.
11.17 Citranox® Acid Cleaner and Detergent - Prepare a 5% solution by adding 500 mL
of Citranox® to 9.5 L of warm – hot tap water for labware cleaning and decontamination. This detergent bath should be changed about once every month, depending on use.
11.18 Standard Reference Material (SRM) – The standard reference material used to
prepare the SRM samples. NIST SRM 1648a (Urban particulate matter with certified concentrations of lead at 0.655 ± 0.033 mass fraction (in %) is used to verify the extraction procedure.
11.19 Lower Limit of Quantitation Check (LLQC) –This quality control sample is used to determine the LLQL, and is prepared by creating a spike solution that will create a final concentration of analyte in the sample matrix that produces and instrument signal/response that is 10x the standard deviation above the lab reagent blank (at 99% confidence; n-1 degrees of freedom). Lower limits of quantitation are verified when all analytes in the LLQC sample are detected within ± 30% of their true value.
12.0 COLLECTION, PRESERVATION, SHIPMENT, AND STORAGE
12.1 Collection and Handling of Filters
Whenever the filter is handled use clean disposable nitrile or neoprene gloves and if necessary clean Teflon® coated (no exposed metal surfaces) or plastic tweezers. Never touch the membrane of the filter and take care not to puncture or damage the filter with the tweezers. See Section 16.1 for more information about filter condition.
12.2 Preservation and Storage of Filters
Samples do not have a preservative and can be stored for up to 180 days in ambient conditions. Upon retrieval from field sampling during humid or rainy conditions be certain the filter is not moisture-laden. Damp filters may stick to the sample transport container causing damage and thereby invalidating the sample. If the sample is found to be moisture-laden allow the membrane to dry before enclosing in the transport container. Once the filter arrives at the laboratory, a unique LIMS identification number is assigned and placed on the outside of the COC, sample envelope and/or container for tracking and storage purposes. Extraction hold time is 180 days from the sample date.
UNCONTROLLED ELECTRONIC COPY EFFECTIVE 4-2015
CONFIDENTIAL Standard Operating Procedure Procedure Number: ERG-MOR-085 Revision Number: 10 Revision Date: March 31, 2015 Page: 16 of 56 12.3 Shipment of Filters
When filters are shipped to or from the laboratory follow proper handling instructions in Section 12.1 and take proper precautions when packing such that filters are not exposed to contaminants or damage during shipment.
13.0 CALIBRATION AND STANDARDIZATION
13.1 Daily Optimization Procedures
Daily optimization is performed through the software’s Smart Tune Wizard. Refer to Tables 24-4 and 24-5 for Optimization Procedures and Performance Specifications respectively. For more detailed information, the PerkinElmer Elan Version 3.4 Software Reference Guide is also available for reference as a PDF file on the desktop of the instrument computer.
13.2 Mass Calibration and Resolution
Before performing any kind of calibration or optimization, allow a period of not less than 30 minutes (preferably 1 hour) for instrument warm-up. After the warm-up, the mass calibration and resolution may be optimized using the tuning solution (see Section 11.11) by running a mass calibration and resolution optimization through the Smart Tune Wizard. Resolution at low mass is indicated by magnesium isotopes 24, 25, and 26. Resolution at high mass is indicated by lead isotopes 206, 207, and 208. These peaks may be viewed in the Interactive graphics window. For optimal performance, adjust spectrometer mass calibration to ± 0.05 amu and the resolution to produce a peak width of 0.70 ± 0.1 amu at 5% peak height. Repeat mass calibration and resolution optimization if it has shifted by more than ± 0.05 or ±0.1 amu respectively.
13.3 Dual Detector Cross Calibration
The dual detector cross calibration is used to provide a smooth transition from the pulse counting mode to the analog mode, which extends the linear dynamic range of the detector. Typically a 2% nitric acid solution containing 200 µg/L of Mg, Cu, Rh, Cd, and Pb as well as 2000 µg/L of Be is used for this calibration although custom solutions may be used. This calibration must be performed daily before each analysis to report values above the HCV.
13.4 Daily Performance
13.4.1 The daily performance report must be generated daily or before each analysis, whichever is more frequent.
UNCONTROLLED ELECTRONIC COPY EFFECTIVE 4-2015
CONFIDENTIAL Standard Operating Procedure Procedure Number: ERG-MOR-085 Revision Number: 10 Revision Date: March 31, 2015 Page: 17 of 56
13.4.2 Instrument stability must be demonstrated by running a daily performance check using the tuning solution. A minimum of five replicates with resulting relative standard deviations of absolute signals for all analytes of less than 3% is required prior to calibration.
13.5 Calibration
13.5.1 Prior to initial calibration, set up proper instrument software routines for
quantitative analysis (i.e., autosampler table, QC sample names etc.). The instrument must be calibrated using a minimum of a calibration blank and four non-zero calibration standards. Consideration should be give to adding more standards, particularly lower concentrations, in order to better define the LDR and quantitation limit (QL). A minimum of three replicate integrations are required for data acquisition with an RSD < 10.0%. RSDs > 10.0% are allowed for the first non-zero calibration standard (CAL2). Use the average of the integrations for instrument calibration and data reporting.
For a linear calibration to be considered acceptable, the calibration curve should have a correlation coefficient ≥ 0.998. The resulting curve should then be verified with mid-level and low-level calibration standards as described in Section 16.6.
Preparation: Non-blank calibration standards are prepared by diluting the calibration working standard to appropriate levels using the standard solvent.
13.5.2 For matrices of known composition, match the composition of the
calibration and QC standards to that of the samples. For matrices of unknown composition, use an ISTD that has been matched to the analytes chemical and physical properties (i.e., ionization potential, ±50 amu) so that the ISTD and element of interest behave similarly during the analytical process.
13.5.3 The rinse blank should flush the system between solution changes for
blanks, standards, and samples. Allow sufficient rinse time (≥ 1 min) to remove traces of the previous sample. Solutions should aspirate for at least 30 seconds prior to the acquisition of data to establish equilibrium.
13.5.4 Refer to Section 11.1.4 for the preparation of standard solvent. Once
prepared, all calibration standards must be stored in Teflon® bottles/flasks.
Note: Commercial stock standards used to prepare calibration standards and other quality control standards must be used within their expiration
UNCONTROLLED ELECTRONIC COPY EFFECTIVE 4-2015

CONFIDENTIAL Standard Operating Procedure Procedure Number: ERG-MOR-085 Revision Number: 10 Revision Date: March 31, 2015 Page: 18 of 56
date. Calibration blanks/standards and other QC standards made from the stock standards may be set to expire no later than the earliest expiration date of any standard used for preparation.
13.5.5 Refer to the quality control requirements presented in Table 24-3 for
calibration acceptance criteria.
13.6 Internal Standardization
13.6.1 Internal standardization must be used in all analyses to correct for instrument drift and physical interferences. ISTD quality control requirements as described in Section 16.7 must be followed.
13.6.2 Internal standards (ISTD) for this method are 45Sc 69Ga, 89Y, 115In, and
209Bi for analytes beginning with mass 6 and ending with mass 238. The ISTDs6Li,, 72Ge 103Rh, 159Tb & 165Ho may also be used if necessary. Internal standards must be manually added to each calibration standard after they are brought to volume in the proportion of 2.0 µL for every mL. For example, add 200 µL of ISTD solution to a 100 mL standard.
13.6.3 Concentrations of the internal standards for this method are determined by
the concentration of each element that will produce an intensity that is sufficiently stable. Typical intensities are between 200,000 and 500,000 cps; however, ideal intensities may be as high as 1,000,000 cps.
13.6.4 The concentration of the internal standard must be added equally and in
the same manner to the calibration blank/standards, QC standards and samples.
13.6.5 Internal standardization must be used in all analyses to correct for
instrument drift and physical interferences. However, be aware that internal standards themselves may be responsible for polyatomic and/or doubly charged interferences.
13.7 Instrument Performance
13.7.1 After instrument calibration an ICV and ICB must be analyzed for initial
verification of the calibration curve. Refer to Sections 16.6.1, 16.2.2, and Table 24-3 for specific QC criteria.
13.7.2 To verify that the instrument is properly calibrated on a continuing basis,
analyze a CCV and CCB before the analysis of samples and after every 10 samples.
UNCONTROLLED ELECTRONIC COPY EFFECTIVE 4-2015

CONFIDENTIAL Standard Operating Procedure Procedure Number: ERG-MOR-085 Revision Number: 10 Revision Date: March 31, 2015 Page: 19 of 56 13.8 Linear Dynamic Range (LDR)
The LDR study is performed every 6 months to determine the maximum concentration level at which the initial calibration is linear. The recovery criterion for the LDR are 90-110%. Dilutions must be performed for elements with concentrations over 90% of the established LDR. If the LDR study has not been performed within 6 months, any elements with concentrations over the highest calibration concentration must be diluted.
13.9 Lower Limit of Quantitation Limit (LLQL)
The LLQL study is performed every 6 months to determine the lowest concentration level at which data may be reported. This is done by extracting and analyzing a lower limit quantitation check (LLQC). The recovery criterion for the LLQC is 70-130%. Any results reported below the LLQL must be qualified as an estimated value.
14.0 PROCEDURE
14.1 LIMS Batch Procedure
Note: Please perform the following procedure the same day that you plan to begin the extraction. If something happens and the extraction cannot be performed, edit the bench sheet with the correct extraction date, both in LIMS and on the hardcopy bench sheets. 14.1.1 Log into Element. 14.1.2 From the “Laboratory” menu, select “Batch.” 14.1.3 With the Inorganics department selected from the drop-down menu at the
left of the screen, click “Add” at the bottom, left-hand corner. A blank bench sheet will appear. The following information should be input into the bench sheet using the drop-down menus: 1) Preparation Method: ICP-MS Extraction and 2) Batch Matrix: Air
14.1.4 Select the appropriate inorganic analysis (“Metals Analysis – 47mm
20xx”) from the “Available” analysis box and press the right-facing arrow button. Note: Options: 1.) Additional information may be added in the “comments” box for batches that are different from standard samples, for example samples that are for the Midlothian or Schools projects. Reagent lot numbers used in the extraction are also added in the comment section. 2.) You may choose to press “Copy” instead of “Add” from Step3. Use
UNCONTROLLED ELECTRONIC COPY EFFECTIVE 4-2015
CONFIDENTIAL Standard Operating Procedure Procedure Number: ERG-MOR-085 Revision Number: 10 Revision Date: March 31, 2015 Page: 20 of 56
caution here as both the analysis and comments from the copied batch will be included in the new batch and this information may need to be changed.
14.1.5 Press the save button. The new LIMS-created batch number will be visible
in the box to the left of the screen. 14.1.6 Select the “Bench Sheet” button at the bottom of the screen. This is where
you will include sample information and appropriate batch QC. 14.1.7 Click “Edit” at the bottom of the new screen. 14.1.8 At the top of the screen, press “Add” and select “Sample by Container.”
Select the samples from the list that you would like to include in the batch. For each sample, the following information needs to be included: 1) Initial (m3): This is the total flow through the filter as it was being sampled in the field. This information can be found or calculated from the information provided on the sample chain of custodies. Field blank samples are assigned the same volume as the primary sample collected on the same day. A field blank volume may also be an average of all the filter volumes for a given month. 2) Comments: Include two spaces followed by the sample ID for each sample in the list. This includes any additional designations such as C1, C2, FB, etc.
Note: A maximum of twenty samples may be selected for any given batch. If more than 20 samples are selected, additional batch QC must also be added to the bench sheet and extracted to meet the requirements described in Table 24-3.
14.1.9 Each batch requires QC to be prepared/extracted with each batch of
twenty samples. This QC is included in the bottom box on the screen. Required QC includes:
i. Duplicate Samples: One duplicate QC sample is added per batch.
Click the “Add” button at the top of the screen and select “Duplicate.” Right click on a duplicate sample to assign its source sample and initial volume. This volume will be the same as the source sample. Duplicate samples must also be added for each collocated (C1/C2) or duplicate (D1/D2) sample type to be extracted.
ii. Blank Samples: Each batch must include one reagent blank and one
method blank per twenty samples.
a.) One blank (BLK) sample is already included. To add another, click the “Add” button at the top of the screen and select “Blank.”
UNCONTROLLED ELECTRONIC COPY EFFECTIVE 4-2015

CONFIDENTIAL Standard Operating Procedure Procedure Number: ERG-MOR-085 Revision Number: 10 Revision Date: March 31, 2015 Page: 21 of 56
b.) Change the sample name by right-clicking on each blank and
selecting “Name.” BLK1 should be changed to “Reagent Blank” and BLK2 should be changed to “Method Blank.”
c.) Include the filter lot number in the comments section of the Method Blank.
iii. Spiked Samples: Each batch must include two spiked samples per twenty samples.
a.) One laboratory control sample (BS) and one laboratory control
sample dup (BSD) are included for 47mm extractions. The BS should already be included, so click on “Add” and select “Laboratory Control Sample Dup” to add the second BS to the list. For each of these QC samples, include the Teflon filter lot blank in the comments section.
b.) Identifying spikes: For laboratory control samples, the appropriate spike ID, type, and volume will need to be assigned in the same manner. Right click on the sample QC and select “Spike 1 ID.” Select the appropriate standard from the list. Edit the “Spike 1 Type” to read “Pre-prep” and the “Spike 1 Volume” to read 500uL (or whatever volume is being used.)
iv. Post Spike (PS): Each batch must include one post spike (PS) sample per twenty samples.
a.) One post spike is automatically included for 47mm extractions.
Assign the appropriate spike ID, type, and volume using the instructions provided above. The correct spike amount is 50 µL and the spike type is “Post-prep.”
v. Standard Reference Material: Each batch must include one SRM per twenty samples.
a.) Click on “Add” and select “Reference” to add the SRM to the
bench sheet. Add the SRM identification number as assigned during weighing in the comments section. Identify the reference standard used by right-clicking on “Spike 1 ID” and selecting the appropriate standard. Indicate the weight of SRM digested (in mg) in the Spike 1 Volume. “Spike 1 Type” should be listed as “Pre-prep.”
UNCONTROLLED ELECTRONIC COPY EFFECTIVE 4-2015

CONFIDENTIAL Standard Operating Procedure Procedure Number: ERG-MOR-085 Revision Number: 10 Revision Date: March 31, 2015 Page: 22 of 56
14.1.10 Print two copies of the bench sheet in landscape format. Both will need to be signed on the “Extraction Reviewed by” line and dated once the extraction is complete. One copy is to be three-hole punched and placed in the Extraction Notebook, while the other is to be kept bound to the corresponding samples in the cabinet in the lab.
14.2 Filter Extraction Procedure
14.2.1 Prior to sample processing, be sure to turn on the HotBlock ™ and select the appropriate program and initiate to allow it to warm to extraction temperature. Be sure to allow the HotBlock™ interface establish connection with the block itself (shown on the screen as “Please Wait”) prior to beginning any extraction method. Failure to do this will cause the HotBlock™ to heat to higher than intended temperatures.
14.2.2 Place filter in a labeled extraction tube as far down as possible. This is done by gently gripping the Teflon® support ring with gloved fingers and bending the filter so that it fits in the tube. Use the tip of a gloved finger to slide the filter to the bottom of the tube.
14.2.3 Add 0.5 mL of Matrix Spike to BS/BSD samples. Add 30 mL of
extraction fluid (0.5% (v/v) HCl, 1.85% (v/v) HNO3, 0.17% (v/v) HF and 8.33 mg/L Au) to the extraction tube with the filter.
14.2.4 The SRM sample is prepared for extraction by adding a blank Teflon filter to a clean sample vial as described in Section 14.2.2. The loaded vial is then weighed, zeroed, and then re-weighed after an aliquot of SRM standard of approximately 2-3 mg is added to the vial. Add 30 mL extraction fluid to the extraction tube.
Note: It may be more efficient to weigh several SRM standard vials for extraction at one time. The weight information should be recorded in the balance room notebook. Individual standards should be numbered with the date the vial was created (i.e. “01012013-SRM01”). The vial number should be recorded in the LIMS in the SRM sample comments in the bench sheet.
14.2.5 Print out a copy of the Teflon Extraction Record from L:\Metals Lab (an
example is shown in Table 24-10). Record the batch ID and extraction date. Record the temperature of the HotBlock™ as indicated by the calibrated thermometer, as well as the temperature indicated on the HotBlock UI.
UNCONTROLLED ELECTRONIC COPY EFFECTIVE 4-2015
CONFIDENTIAL Standard Operating Procedure Procedure Number: ERG-MOR-085 Revision Number: 10 Revision Date: March 31, 2015 Page: 23 of 56
14.2.6 Place all samples in plastic HotBlock™ rack and place in HotBlock™. Add a reflux cap to each sample tube. Record the time samples were placed in the HotBlock on the table printed above. Samples will be extracted for a total time of 2.5 hours at a HotBlock™ temperature of 95ºC and an approximate sample temperature of 85ºC.
Note: Monitor sample temperature with a thermometer in an extraction
tube with a reflux cap and 30 mL of extraction fluid.
14.2.7 After 1.5 hours of extraction, add 1.8 mL of hydrogen peroxide (H2O2) and allow to effervesce for 0.5 hours. Record the time the aliquot of H2O2 was added on the Teflon Extraction Record.
14.2.8 Check the filters occasionally during extraction. If a filter floats out of the
acid, use acid-cleaned teflon stirring rods to push the filter below the extraction fluid.
14.2.9 After extraction, samples must be removed from the HotBlock™ as soon
as possible so they are not allowed to heat to dryness. Allow the samples to cool to room temperature. Record the time samples were removed, as well as the temperatures indicated by both the certified thermometer and HotBlock™ UI on the Teflon Extraction Record.
14.2.10 Leaving the Teflon filter in the sample vial, bring the sample volume to
the 50 mL line on the vial with a wash bottle filled with DI water prior to filtering. Record the time the samples were brought to final volume on the Teflon Extraction Record.
Note: If the final volume exceeds 50 mL, measure the amount exceeded
using an appropriate pipette (usually the 1 or 5 mL) and record the final sample volume. Using the pipettor, pull sample from the vial in varying increments until enough liquid is removed so that the sample line is level with the 50 mL line on the vial. Add the amount of liquid removed to 50 mL and record that as the final volume. This information must be entered into the LIMS so that the final sample concentration is calculated and reported correctly. This overfilling may be avoided by using fine streamed wash bottles while adding the D.I. water.
14.2.11 Homogenize the sample by inverting three times and then the extract is
ready to be analyzed. Should the sample contain noticeable particulate material, an aliquot of sample may be poured off and filtered with the use of a FilterMate™, however; this is not typically necessary. Alternatively, the sample may be allowed to rest until all debris settle. Care should be taken to not disturb the sample when transferring sample extract to an
UNCONTROLLED ELECTRONIC COPY EFFECTIVE 4-2015

CONFIDENTIAL Standard Operating Procedure Procedure Number: ERG-MOR-085 Revision Number: 10 Revision Date: March 31, 2015 Page: 24 of 56
autosampler tube. For samples with no noticeable particulate matter, it is not necessary to allow the sample to settle prior to analysis.
14.2.12 Record the sample slot the certified thermometer was placed in during the
sample extraction on the Teflon Extraction Record. After initialing the sheet, attach the Teflon Extraction Record to the batch paperwork.
14.3 LIMS Sequence Procedure
14.3.1 Log into LIMS Element Software. 14.3.2 From the “Laboratory” menu, select “Sequence.” 14.3.3 Click “Add” in the top right corner and select “Randy” as the Template ID
then click done. This will automatically add all of the calibration standards and QC samples for a typical analysis sequence.
14.3.4 Click the pull-down menu for “Source Batch” at the upper middle part of
the screen and select the batch you are going to analyze. Then click the “Add” button and select “Batch QC Sample.” When the list of QC samples appears click the first sample and holding the shift button double-click the last sample and it will insert them into the sequence. Then click “Add” again and select “Batch Sample.” Add all of the samples listed as you did for the Batch QC Samples.
14.3.5 Arrange all of the samples according to the example below, being sure to
follow the requirements summarized in Table 24-3:
Autosampler Position
Sample Name
1 BTB0001-CAL1 2 BTB0001-CAL2 3 BTB0001-CAL3 4 BTB0001-CAL4 5 BTB0001-CAL5 6 BTB0001-ICV1 1 BTB0001-ICB1 5 BTB0001-HCV1 7 BTB0001-IFA1 8 BTB0001-IFB1 4 BTB0001-CCV1 2 BTB0001-LCV1 1 BTB0001-CCB1 9 B0B1707-BLK1
10 B0B1707-BLK2
UNCONTROLLED ELECTRONIC COPY EFFECTIVE 4-2015

CONFIDENTIAL Standard Operating Procedure Procedure Number: ERG-MOR-085 Revision Number: 10 Revision Date: March 31, 2015 Page: 25 of 56
Autosampler Position
Sample Name
11 B0B1707-SRM1 12 B0B1707-BS1 13 B0B1707-BSD1 14 0020993-01 15 B0B1707-DUP1 16 B0B1707-SRD1 17 B0B1707-PS1 18 0020993-02 4 BTB0001-CCV2 1 BTB0001-CCB2 7 BTB0001-IFA2 8 BTB0001-IFB2 4 BTB0001-CCV3 2 BTB0001-LCV2 1 BTB0001-CCB3
14.3.6 Right-click the SRD sample and choose the appropriate source sample
from your batch.
Note: Make sure that the source sample for the SRD is updated to the current batch sample SRD sample or your data will not be saved.
14.3.7 Using the shift key select all of the samples in the sequence and right-click
to choose “Internal Standard ID” then select the ISTD you are using for this sequence.
14.3.8 Right-click each calibration standard and QC sample and select “Standard
ID” to set the current standard being used for each solution. 14.3.9 Click “Save” and print a double-sided copy in landscape format to use as
the cover of the data package and to help enter the sequence in the Elan software.
14.4 Filter Analysis Procedure
14.4.1 Prior to analyzing samples, check the instrument performance by
analyzing the tuning solution using the Daily Performance Check in the Smart Tune Wizard. The performance specifications that must be met are in Table 24-5. Also refer to Section 13.1 for other criteria. If the performance check fails, follow the optimization procedures in
Table 24-4.
UNCONTROLLED ELECTRONIC COPY EFFECTIVE 4-2015

CONFIDENTIAL Standard Operating Procedure Procedure Number: ERG-MOR-085 Revision Number: 10 Revision Date: March 31, 2015 Page: 26 of 56
14.4.2 Before starting the calibration be sure to flush the sample introduction system with enough rinse blank and be certain the rinse blank bottle has enough solution for the analysis. Enter all sequence information (sample and QC sample names) into the autosampler and QC tables (see Section 14.3.5). The autosampler table should be named as the month, day and year (e.g., 01012010.sam) and saved. Create the file name for the collected data with the numeric month, day and year (e.g., 01012010.rep) in the Method window under the “Report” tab (upper right) in the “Report Filename” field. Any changes made to the method (i.e., QC tables) must be saved before you exit that screen or they will be lost.
14.4.3 Pour off the calibration blank/standards (Blank (CAL1), LOQ (CAL2),
CAL3, CAL4 and CAL5) and initial/continuing QC standards (ICV, ICB, ICSA, ICSAB, HSV, CCV, CCB) spiked with ISTD in the appropriate autosampler positions.
14.4.4 To start the analysis, highlight all samples in the autosampler table and
click “Build Run.” Then click “Run” in the following screen. Once the calibration has been completed and reviewed, save the calibration file with the same month, day and year as the .sam and .rep files in Section 14.4.2 and print the Quantitative Analysis Report to PDF to be included with the sequence files.
14.4.5 Label autosampler tubes with a black marker. Batch samples may be
prepared by adding 20 μl of ISTD into the autosampler tube and then adding 10 mL of sample. Mix the sample well and place in appropriate autosampler location for analysis.
14.4.6 The PDS sample is prepared by adding 1.0 uL of spike solution to 1.0 mL
of sample to be analyzed (i.e., 10 uL of PDS to 10 mL of sample). 14.4.7 Samples with analyte concentrations greater than 90% of the current LDR
must be diluted and re-analyzed.
14.5 Unexpected Instrument Shutdown In the event that the ICP-MS shuts down during an analysis the proper procedure to be followed by the analyst is: 14.5.1 Restart the instrument and allow it to warm-up for a minimum of 30
minutes but preferably one hour, especially if the instrument has been inoperable overnight and is at room temperature. If the analyst was present during the loss of the plasma and the instrument has not significantly cooled then a shorter time period for warm-up may be sufficient.
UNCONTROLLED ELECTRONIC COPY EFFECTIVE 4-2015

CONFIDENTIAL Standard Operating Procedure Procedure Number: ERG-MOR-085 Revision Number: 10 Revision Date: March 31, 2015 Page: 27 of 56
14.5.2 After the instrument has been thermally stabilized a new daily
performance report (DPR) should be analyzed with the operating conditions being used for the analysis.
14.5.3 If the DPR passes the analyst must check the calibration by analyzing a
continuing calibration verification (CCV) and a continuing calibration blank (CCB) to be sure the calibration is still valid. If the CCV & CCB passes the analyst may proceed with where the analysis left off. Any samples that didn’t complete their analysis should be repeated.
14.5.4 If the DPR, CCV or CCB do not pass the analysis must be terminated and
any samples not bracketed by valid CCV & CCB checks must be reanalyzed with a new analysis/calibration.
14.5.5 The DPR, CCV and CCB checks should be kept for documentation. The
DPR may be place in the DPR binder and the CCV/CCB checks must be included with the data package. The analyst should document the event briefly in the sequence narrative so the reviewer is aware of the instrument shutdown.
14.6 LIMS Data Upload Procedure
14.6.1 When a data package is complete, the analyst will transfer the data from the instrument computer to BART.
14.6.2 To begin LIMS upload, open Element. Go to the laboratory menu and
click on “Data Entry/Review” In this window, select “Sequence” in the top left corner, making sure that “Inorganics” is selected from the drop-down menu. Highlight the correct sequence and click on “Create” in the Data Entry box in the top right corner. Once the spreadsheet is created in LIMS, select “DataTool” in the Data Entry box and save the file as the sequence name in the UserFiles folder of your harddrive (C:\ELMNT\UserFiles).
14.6.3 The DataTool interface should open to the “Select Data System Files”
window. In this window, check to make sure the correct file information is selected:
1) File Type: PE ELAN_REP(*.rep) 2) Drives: y:\Bart
14.6.4 In the box below Drives: select the folder the data is stored in for the
sequence. In the Bart drive, select the ICP-MS DATA folder, then the
UNCONTROLLED ELECTRONIC COPY EFFECTIVE 4-2015

CONFIDENTIAL Standard Operating Procedure Procedure Number: ERG-MOR-085 Revision Number: 10 Revision Date: March 31, 2015 Page: 28 of 56
corresponding year, and finally the folder for the data the sequence was run.
14.6.5 All of the data files for that sequence will appear in the lower right-hand
box. Double-click on the appropriate data file and click “Auto Select” for each file that needs to be included in the sequence. (*Note: Only undiluted samples and sequence QC should be included here.)
14.6.6 Click “Done” when all sample and QC files have been selected to return to
the main window. Click “Merge Files” at the bottom of the window. DataTool will merge the files and show the data in the Data Transfer window.
Note: Review the content of the top windows in the Data Transfer window for red text. If there is any, the DataTool cross table requires editing. Seek the advice of the LIMS administrator to correct this.
14.6.7 Click “Save” and save the spreadsheet in the UserFiles folder of your hard
drive. Close DataTool. 14.6.8 In Element, go back to the Data Entry/Review window. The newly merged
data should appear in the window. Click “Save” to save the files to Element and then “Query” in the Data Review box. Element will perform all necessary calculations at this point.
14.6.9 In the Data Entry/Review window, samples and QC can be reviewed for
pass/fails. Any data that does not pass its assigned criteria will have red text. Use appropriate data qualifiers to flag data that does not meet criteria.
14.7 LIMS Dilution Data Upload Procedure
Note: Dilution data is not uploaded with sequence QC, as this data is typically only required for one or two analytes in a given sample. Therefore, the data is hand-entered into Element. 14.7.1 Open Element and go to the Data Entry/Review window. Select the
sequence that the diluted sample was originally run with. Click on “Query.”
14.7.2 Scroll down to the needed sample information. Click “Edit” in the Data
Review box. Right click on the sample & analyte that has dilution information and select “Qualifiers” -> “Quick Analyte Qualifiers.” Select qualifier flag D-01 for dilutions.
UNCONTROLLED ELECTRONIC COPY EFFECTIVE 4-2015

CONFIDENTIAL Standard Operating Procedure Procedure Number: ERG-MOR-085 Revision Number: 10 Revision Date: March 31, 2015 Page: 29 of 56
14.7.3 In the IResult column, type the new dilution data. Make sure the new data has been corrected for the dilution factor (i.e. results for a 5x dilution should be multiplied by 5 if the instrument software did not make the correction). In the Diln column, type the dilution factor for the sample.
14.7.4 Repeat steps 2 & 3 for any additional dilution data that needs to be input
for the sequence. If any QC data was altered (for example, Dups) then you will click on “Re-calc” and “Save.” If only sample information was altered, click “Save.”
14.7.5 Re-run the query to verify all dilution data was saved to the sequence. Note: In LIMS, the dilution factor is applied to the associated MDL as
well as to the sample concentration.
14.8 Data Review All instrument data should be first reviewed by the analyst and then a secondary reviewer, usually the project task lead for metals analysis. Both the analyst and secondary review must use the “Quality Control Requirements for Metals Analysis” checklist to complete data review (see Figure 24-8). Reviewers must initial and date each parameter check on the review form to verify that each meets the established acceptance criteria. 14.8.1 Initial Calibration
In addition to the requirements outlined in Table 24-3, the analyst and secondary reviewer must also verify that the intensities measured for reportable analytes in the calibration blank are acceptable and will not interfere with the sensitivity. A review of previously analyzed calibration blanks can demonstrate acceptable intensity values. The intensities of the internal standards in the calibration standard should be monitored relative to the intensities seen in the calibration blank.
14.8.2 Internal Standards
Internal standards must be monitored for each sample throughout a sequence; the measured intensities must stay between 60 and 125% of the measured intensity of internal standards in the calibration blank. See Section 16.7 for corrective actions to remedy internal standard intensities that are measured outside of this range.
UNCONTROLLED ELECTRONIC COPY EFFECTIVE 4-2015
CONFIDENTIAL Standard Operating Procedure Procedure Number: ERG-MOR-085 Revision Number: 10 Revision Date: March 31, 2015 Page: 30 of 56
14.8.3 Relative Standard Deviation’s
Follow the prescribed acceptance criteria for RSD’s of calibration standards as listed in Table 24-3. Sample RSD’s should also be monitored throughout analysis. High RSD’s (greater than 20%) for concentrations above the MDL can indicate memory interference from previous samples, as well as other instrumentation issues that may need to be corrected before analysis can be continued.
14.8.4 Element/LIMS Data
The analyst and second reviewer must verify quantities imported into the LIMS reflect the raw data. This can be accomplished by checking a few analytes for random client samples and QC samples. Hand entered data (i.e., dilution) should be verified by the second reviewer to be certain the values, dilution factors and flags are properly inserted. The LIMS calculated final value should also be checked to ensure the system is using the correct equation.
14.8.5 Multiple Isotopes If an element has more than 1 monitored isotope, examine the
concentration calculated for each isotope, or isotope ratios, to detect a possible spectral interference. Consider both primary and secondary isotopes when evaluating the element concentration. In some cases, secondary isotopes may be less sensitive or more prone to interferences that the primary recommended isotopes; therefore, differences between the results do not necessarily indicate a problem with data calculated for the primary isotopes.
14.8.6 Reprocessing Data Reprocessed data must include reprocessing of all calibration standards
and QC samples associated with the reprocessed sample results. Original data shall be kept with the reprocessed data and annotated with the reason for reprocessing. It is imperative that the calibration file be saved as a separate file from the original calibration file. The reprocessed calibration file shall be renamed with the added distinction of “_reprocessed” (i.e. 03052010_reprocessed). All other samples including QC are automatically saved to the dataset file.
UNCONTROLLED ELECTRONIC COPY EFFECTIVE 4-2015
CONFIDENTIAL Standard Operating Procedure Procedure Number: ERG-MOR-085 Revision Number: 10 Revision Date: March 31, 2015 Page: 31 of 56 15.0 CALCULATIONS
15.1 Analyte Concentration
Metal concentration in the air sample should be calculated as follows:
Where:
C = concentration, ng metal/m3 Ci = metal concentration determined from Section 14.4, ng metal/L. Vf = total sample extraction volume from extraction procedure (i.e., 0.05
L). Vstd = standard air volume pulled through the filter, m3
15.2 Method Detection Limits
The MDL is calculated as follows for the CFR MDL calculation method: MDL = (t) × (SD)
Where: t = Student’s t value for a 99% confidence level and a standard deviation
estimate with n - 1 degrees of freedom [t = 3.14 for seven replicates] SD= standard deviation of the replicate analysis.
The MDL is calculated as follows for the FAC MDL calculation method: MDL = (K) × (SD)
Where:
K = Value as prescribed in Appendix D: DQ FAC Single Laboratory Procedure v2.4, 08/30/2007
SD= standard deviation of the historical BLK2 analysis. 15.3 Relative Percent Difference (RPD)
The RPD is calculated as follows:
2⁄
100
UNCONTROLLED ELECTRONIC COPY EFFECTIVE 4-2015

CONFIDENTIAL Standard Operating Procedure Procedure Number: ERG-MOR-085 Revision Number: 10 Revision Date: March 31, 2015 Page: 32 of 56
Where:
R1, R2 = values that are being compared (i.e., duplicate and replicate analysis data)
15.4 Percent Recovery
Percent Recovery is calculated as follows:
100
15.5 Relative Standard Deviation (RSD)
RSD is calculated as follows:
100
16.0 QUALITY CONTROL
The analyst must perform the quality control checks listed in Table 24-3 and meet the requirements in this section. Data Quality Objectives (DQO) and data assessment criteria are determined from the results of the quality control samples. The DQO criteria are summarized in Table 24-3.
16.1 Sample Collection Quality Control
16.1.1 Filters which are dropped or become contaminated with any foreign matter
(i.e., dirt, finger marks, ink, liquids, etc.) are invalid. 16.1.2 Filters with tears or pinholes that occurred before or during sampling are
invalid. 16.1.3 A power failure during a field sample collection event invalidates the
sample collected during that event. See SOP ERG-MOR-045 for more information about the sample acceptance criteria.
16.2 Blanks
16.2.1 The Rinse Blank must be used to flush the system between standards and
samples. Refer to Section 11.3.1 for preparation details.
UNCONTROLLED ELECTRONIC COPY EFFECTIVE 4-2015
CONFIDENTIAL Standard Operating Procedure Procedure Number: ERG-MOR-085 Revision Number: 10 Revision Date: March 31, 2015 Page: 33 of 56
16.2.2 Initial Calibration Blank (ICB) is analyzed immediately following the initial calibration verification. The absolute value of the instrument response should be less than the method detection limit. If the ICB fails it may be re-analyzed once. If the ICB still does not pass, the analysis should be terminated, the problem corrected and, the ICV and ICB must be verified again before the analysis can continue. If the ICV or ICB still fail, recalibrate the instrument and verify the ICV and ICB again before continuing. If recalibration fails to correct the problem, all QC and samples included in the sequence must be flagged.
16.2.3 Continuing Calibration Blanks (CCB) are analyzed following each
continuing calibration verification sample. The acceptance criteria are the same as the ICB. If the first CCB analyzed fails it may be reanalyzed once. If it fails again the analysis should be terminated, the instrument recalibrated and the initial QC repeated. If the CCB fails later in the analysis it may also be reanalyzed twice. If it continues to fail again the affected analyte must be flagged. If multiple elements fail any samples analyzed before or after the failing CCB must be reanalyzed.
16.2.4 Laboratory Reagent Blank (LRB/BLK1) consists of all reagents
(extraction fluid) used to process samples and is carried through the entire preparation and extraction process to determine the background levels, if any, from the extraction fluid and process. If the absolute value of the analyte concentration of the LRB is less than or equal to the MDL (See Table 24-1), no further action is required. If the BLK1 fails it may be reanalyzed once. If it fails again and the concentration is greater than the MDL, but less than 5 times the MDL, the BLK1 and all associated samples are flagged. If the concentration of a reported analyte is greater than 5 times the MDL all associated samples must have that analyte result blank subtracted and flagged as such.
16.2.5 The Method Blank (MB/BLK2) is prepared as an LRB but with the
addition of a blank Teflon® filter and analyzed as a sample to determine the background levels, if any, from the blank filter and extraction process. Resulting data is recorded and used to determine FACA MDL values. While the absolute value of resulting values should be less than the established MDL, there is no corrective action procedure should the BLK2 fail.
16.3 Spikes
16.3.1 Laboratory Control Sample (LCS): An LCS is prepared and carried through the entire sample digestion process. At least two LCS are analyzed with each sample batch. The LCS is represented by the BS/BSD
UNCONTROLLED ELECTRONIC COPY EFFECTIVE 4-2015
CONFIDENTIAL Standard Operating Procedure Procedure Number: ERG-MOR-085 Revision Number: 10 Revision Date: March 31, 2015 Page: 34 of 56
samples. They are prepared by spiking blank Teflon® filters and carrying them through the entire preparation and extraction procedure. The results must be within 80 -120% of actual values, with the exception of Al. Mercury may recover within 75-125% of actual value. If not, the BS and/or BSD may be reanalyzed once each. If criteria are still not met the batch of samples associated with the BS/BSD must be flagged for any analytes that failed in either or both. A re-extraction of the samples in this case is not possible because the entire available sample has been used.
16.3.2 Standard Reference Material (SRM) is prepared and carried through the entire sample digestion process. At least one SRM is analyzed with each batch. The SRM is a NIST Urban dust that is prepared with a blank filter and can be referred to as a SRM in the LIMS. The results of the SRM Pb recovery must be within 80 – 120% of the certified value. If not, the sample may be reanalyzed once. If the SRM still fails to meet criteria, all associated samples must be flagged.
16.3.3 Matrix Spike and Matrix Spike Duplicate (MS/MSD): Due to the lack of
actual sample duplicates for Teflon® filter sampling events, the traditional MS/MSD cannot be prepared. In place of the MS/MSD, a Blank Spike and Blank Spike Duplicate (BS/BSD) are prepared. See Section 16.3.1 for more detailed information.
16.3.4 Post Digestion Spike (PDS): In order to demonstrate spike recovery in an
actual sample matrix at least one PDS sample is analyzed with every batch. The PDS is an analyzed aliquot of an extracted sample that is spiked with the PDS standard (See Section 11.16). The PDS spike addition should produce a minimum level of 10 times and a maximum of 100 times the QL. The spike recovery should be within ± 25% or 75% to 125% of the true spike value. If the PDS fails, the analyst should assess the SRD. If both the PDS and SRD fail for the same element it is an indication that matrix interference has occurred and any analytes that have failed should be flagged as possible matrix interference. In the event that the parent sample used for the PDS requires a dilution, the PDS should be prepared by diluting the sample and then spike with the PDS standard.
16.4 Duplicates
There are two types of duplicates found in this procedure: 16.4.1 Blank spike duplicate (BSD): A true laboratory duplicate of the blank spike
prepared using a separate blank Teflon filter. The RPD for this duplicate is ± 20%.
UNCONTROLLED ELECTRONIC COPY EFFECTIVE 4-2015

CONFIDENTIAL Standard Operating Procedure Procedure Number: ERG-MOR-085 Revision Number: 10 Revision Date: March 31, 2015 Page: 35 of 56
16.4.2 Analytical duplicate (or a replicate): A second aliquot of an extracted sample analyzed using the same analytical method as the first, or primary aliquot. These are performed on duplicate and collocated samples collected in the field. The RPD for analytical duplicates (replicates) shall be less than or equal to ± 10% for values greater than or equal to 10 times the MDL. If a duplicate/collocated sample fails to meet the established criteria, the duplicate or collocated sample must be reanalyzed. If initial sample results are confirmed then the replicate or collocated sample must be flagged.
16.5 Performance Evaluation (PE) Samples
Performance evaluation samples should be obtained as available from independent sources and analyzed as a routine sample. PE samples are prepared and analyzed in the same way as field samples and should be analyzed in replicate to verify results.
16.6 Standard Checks
16.6.1 Immediately after the initial calibration, the ICV is analyzed. The measured concentrations should be within ±10%, or 90-110%, of the actual concentration. If the criteria are not met, reanalyze the standard. If the criteria are still not met, a fresh standard may be prepared and analyzed or repeat the initial calibration and ICV.
16.6.2 The HSV must be analyzed after the ICB and prior to analysis of samples.
The measured concentration should be within 95% to 105% of the actual concentration. If the HSV fails it may be reanalyzed once. If the HSV still fails, a fresh standard may be prepared and analyzed. If it continues to fail, the instrument must be recalibrated and all initial QC must also be reanalyzed.
16.6.3 Before the analysis of samples and after every 10 samples during a batch
analysis, the calibration must be verified using the CCV. Results must be within 10% or 90% to 110% of the target value for each analyte to verify that the calibration is valid. If a standard check exceeds the limit, the analysis must be stopped and the check standard must be reanalyzed. If the target value exceeds the limit again, a fresh standard may be prepared and analyzed or the instrument must be recalibrated. Any samples analyzed before or after an invalid CCV must be reanalyzed, minimally for the failing element.
16.6.4 Following the first and last CCV of each analysis an LCV must be analyzed. The measured Pb concentration should be within ± 30% of the
UNCONTROLLED ELECTRONIC COPY EFFECTIVE 4-2015

CONFIDENTIAL Standard Operating Procedure Procedure Number: ERG-MOR-085 Revision Number: 10 Revision Date: March 31, 2015 Page: 36 of 56
true concentration. If the criteria are not met for the first LCV, reanalyze the standard once. If criteria still are not met, a fresh standard may be prepared and analyzed or terminate the analysis, correct any issues, and repeat the initial calibration, and reanalyze all initial QC. Should the second LCV fail for Pb, the analysis should be reanalyzed for Pb only.
16.6.5 Document each standard check value as a percent ratio of the actual value
over the target value.
16.7 Internal Standards
The intensities of all ISTDs must be monitored for every analysis (see Table 24-7 for isotopes). When the intensity of any ISTD fails to register between 60 to 125% of the intensity of that ISTD in the calibration blank, the following procedure is implemented:
16.7.1 If the intensities are too high as a result of the ISTD being present in the
sample, the sample must be diluted and reanalyzed with the addition of appropriate amounts of ISTD.
16.7.2 Repeat and increase the dilution until the internal standard intensities fall
within the prescribed window.
16.7.3 If the intensities are determined to be a result of instrument drift, stop the analysis, find and correct the problem, recalibrate if needed and reanalyze the affected samples since the last acceptable ISTD recoveries.
16.8 Interferences
16.8.1 The interference check standards (ICS) are analyzed at the beginning and
end of the run and for every 8 hours of continuous operation. They consist of two different standards the ICSA and ICSAB. The interference check standards obtained from suppliers are never contaminant free. The certificate of analysis documents the levels found in each lot obtained. Therefore, the presence of target elements in the ICSA and ICSAB are expected and may vary from lot to lot of ICS solution used to make these standards. In some cases these contaminants may cause the ICSA or ICSAB to fail the QC requirements. It is acceptable to use the concentrations from the certificate of analysis to correct for these observed contaminants. The known concentrations of contaminants in the ICSA or ICSAB solutions may be subtracted from the experimental values and the established QC criteria must be met or the associated samples are flagged. Samples containing levels of the interferents above the levels in the ICS should be considered for dilution.
UNCONTROLLED ELECTRONIC COPY EFFECTIVE 4-2015

CONFIDENTIAL Standard Operating Procedure Procedure Number: ERG-MOR-085 Revision Number: 10 Revision Date: March 31, 2015 Page: 37 of 56
16.8.2 The first interference check standard (ICSA) contains only the interference
analytes of interest. Any components of the ICS that are calibrated by the instrument must recover within 20% of the expected value. Values obtained for reported analytes not present in the standard should be within 3 times the LOQ values (See Table 24-2). If the ICSA fails it may be reanalyzed. If it fails again a fresh standard may be prepared and analyzed. If it continues to fail, terminate the analysis and correct the problem. Any samples analyzed before or after an invalid ICSA sample must be reanalyzed.
16.8.3 The second interference check standard (ICSAB) contains the same
concentration of interference analytes in the ICSA as well as a known concentration of reported analytes. The concentration of known analytes should be near the middle of the calibration curve. The values obtained for reported analytes should be within 80% to 120% of the known concentration. If the ICSAB fails it may be reanalyzed. If it fails again a fresh standard may be prepared and analyzed. If it continues to fail terminate the analysis and correct the problem. Any samples analyzed before or after an invalid ICSAB sample must be reanalyzed.
16.8.4 Failing ICS are commonly the result of correction equations that need to
be adjusted for new instrument conditions. If this is suspected, calculate the new interference equations and reprocess the analytical sequences as described in Section 14.8.6.
16.9 Dilutions
16.9.1 Serial Dilution
The SRD analysis must be performed on one sample per batch, preferably with the parent sample chosen for the analytical duplicate and PDS. The same sample matrix used to extract the parent sample must be used as the diluent. After the dilution is applied to the SRD results, the analyte concentration should be within 90% and 110% of the undiluted sample results if the parent sample analyte concentration is minimally a factor of 50 above the MDL in the original sample. If the SRD and PDS fail for the same analyte, a matrix interference must be suspected and the data flagged for all affected elements. If matrix interference is not suspected, the SRD should be reprepared and analyzed a second time.
UNCONTROLLED ELECTRONIC COPY EFFECTIVE 4-2015
CONFIDENTIAL Standard Operating Procedure Procedure Number: ERG-MOR-085 Revision Number: 10 Revision Date: March 31, 2015 Page: 38 of 56
16.9.2 Sample Dilution
Any samples needing dilution due to concentrations exceeding the LDR or the presence of ISTD in the sample shall be diluted in an appropriate manner to bring the diluted concentration within the calibration curve and preferably near the mid-point. (See Section 16.7 for dilutions required due to high ISTD recoveries. If the parent sample of a DUP/PDS sample needs to be diluted, the dilution should be performed on each of these QC samples (See also Section 16.3.3). If the SRD was performed on the parent sample of a DUP or PDS the results from the SRD may be used to report values of that parent sample if the 5 times dilution was appropriate. Note: Dilution also increases the associated MDL by the dilution factor, so care must be taken not to dilute a sample so that the corrected concentration value is less than increased MDL.
16.10 Initial Demonstration of Capability
Each analyst must demonstrate initial proficiency for sample preparation and analysis by generating data of acceptable accuracy and precision for four LCSs. For demonstration of proficiency, acceptable accuracy and precision is defined as having both RSD ≤ 20% and percent recovery of 75%-125%. This demonstration is repeated whenever new staff receives training or significant changes in extraction procedure or instrumentation are made. The associated LCS recoveries are collected and maintained in the staff training files.
16.11 Decontaminating/Cleaning Labware
Procedures for proper cleaning and removal of trace metals from labware are found in Section 14.3.1 in SOP ERG-MOR-031. Detergent bath preparation instructions can be found in Section 11.19. Transport/dip baths of DI water (“To” and “From” acid baths) should be labeled with the date they are filled with fresh DI and changed about once every month to minimize contaminants being brought to the acid bath and from being reintroduced to clean labware. This will not only extend the life of the acid bath but it will help reduce hazardous waste production. To be certain that the acid bath will effectively clean and not contaminate labware a 5x dilution should be analyzed to determine the background about once a month.
17.0 PREVENTION
When possible, minimize the amount of chemicals used in the preparation and analysis of the metals filters to reduce waste.
UNCONTROLLED ELECTRONIC COPY EFFECTIVE 4-2015

CONFIDENTIAL Standard Operating Procedure Procedure Number: ERG-MOR-085 Revision Number: 10 Revision Date: March 31, 2015 Page: 39 of 56 18.0 DATA REVIEW AND CORRECTIVE ACTION
18.1 Data Review Documentation Project files including at a minimum the information required in Section 22 are assembled and maintained by the performing analyst. Documentation for metals analysis by ICP/Mass Spectrometry will be reviewed for completeness and meeting acceptance criteria by the Task Lead or secondary reviewer associated with the project or program requiring the analysis as described in this section. A second review of the data is performed by the Task leader or designated secondary reviewer using the QC review checklist (checklist) shown in Figure 24-8 to confirm that quality requirements have been met. Corrections and flags are added to the data consistent with the corrective action required for each review finding. Second level reviewers must complete, initial and date the checklist. The completed check list is included as part of the data package. Data not meeting SOP requirements are flagged and brought to the attention of the Project Manager for resolution.
18.2 Quality Staff Review A minimum of 10% of the data is reviewed by ERG Quality Staff. Quality staff review checks that all SOP required quality parameters have been met and that data reviewers have completed their review checklists. Additional items may also be reviewed at the discretion of the data reviewer. Quality staff reviews are documented on the review form initiated in Section 18.1 by the primary data reviewer. Comments or issues with data identified by the Quality Staff reviewer are brought to the attention of the Project Manager for resolution. Quality Staff will use the review process as an indication of episodic or systematic quality program issues that may require improvements to the ERG laboratory quality system and or additional training for ERG staff. As an option, Quality Staff may request a secondary review of 1% of the data from this method for a project. One percent (1%) review will follow the guidance in this section. Corrective action for metals by ICP/Mass Spectrometry analysis data quality issues are presented in Table 24-3. If required, a corrective action form is filled out as described in the ERG Laboratory Quality Systems Manual.
UNCONTROLLED ELECTRONIC COPY EFFECTIVE 4-2015

CONFIDENTIAL Standard Operating Procedure Procedure Number: ERG-MOR-085 Revision Number: 10 Revision Date: March 31, 2015 Page: 40 of 56 19.0 WASTE MANAGEMENT
Hazardous waste disposal is discussed in detail in SOP ERG-MOR-033. Sample digestate, including the extracted filter, is retained in its original tube for a period of at least 6 months from the sample date. After this time, sample digestate is disposed of by pouring it off in the satellite waste containers located in the laboratory. Used sample vials are disposed of in the laboratory waste bin.
20.0 MAINTENANCE
The ICP-MS system is not maintained under a service contract. The preventative and routine maintenance are performed by the analyst(s). In the event a maintenance issue cannot be addressed by the analyst a service call is placed with the manufacturer and when appropriate a service engineer will perform any necessary maintenance. All maintenance activities are documented in the instrument maintenance log.
20.1 The following maintenance procedures need to be addressed daily.
20.1.1 Check sample waste container level. 20.1.2 Inspect argon tank supply and its pressure to the instrument.
20.1.3 Inspect chiller coolant level and connections for possible leaks. 20.1.4 Inspect torch and aerosol injector tubes.
20.1.5 Inspect nebulizer for clogs.
20.1.6 Inspect sample capillary tubing to be sure it is clean and in good condition. 20.1.7 Check peristaltic pump tubing before operation.
20.1.8 At the end of each analysis, flush system for 5 minutes with the plasma on
with a maximum of 2% nitric acid, followed by deionized water. 20.1.9 Inspect vacuum pump oil and replace as needed. 20.1.10 Inspect sample and skimmer cones for excessive salt build-up.
20.2 The following maintenance procedures need to be addressed quarterly (or more
frequently if instrument performance indicates maintenance is needed).
20.2.1 Clean torch components and replace any worn O-rings on the torch assembly.
UNCONTROLLED ELECTRONIC COPY EFFECTIVE 4-2015
CONFIDENTIAL Standard Operating Procedure Procedure Number: ERG-MOR-085 Revision Number: 10 Revision Date: March 31, 2015 Page: 41 of 56
20.2.2 Inspect and clean the RF coil.
20.2.3 Inspect nebulizer spray pattern. Clean and replace gem tips and O-rings as necessary.
20.2.4 Check nebulizer components and replace worn O-ring on the transducer
face.
20.2.5 Check spray chamber drain fitting for leaks.
20.2.6 Check that pump rollers are clean and remove and clean pump head as necessary.
20.2.7 Clean skimmer and sampling cones (See Section 20.3) and inspect orifices
for damage or corrosion. Replace cones and/or O-rings as needed. 20.2.8 Replace interface roughing and turbo backing vacuum pump oil. 20.2.9 Inspect autosampler rinse pump rollers and clean or replace as necessary.
20.3 Cleaning Sample Introduction Components
20.3.1 Fill small plastic tank for sonicating components with warm to hot 2%
Citranox® solution.Place torch, injector, spray chamber, gem tips, and transfer tube (remove all o-rings) into the tank. Sonicate all components for 15 minutes.
20.3.2 After removing the o-rings from the cones, gently insert each cone into a
separate beaker with enough detergent solution to cover completely and allow to soak for ~ 1.75 hours. Care must be taken to only handle cones by the base – any contact with either cone orifice can easily cause irreparable damage.
20.3.3 Rinse all components thoroughly with tap water followed by a thorough
rinse with DI water. 20.3.4 Place all components back in the cleaned tank/beakers with DI water and
sonicate for another 15 minutes. Cones should be contained in a separate container from the other sample introduction components.
20.3.5 Carefully remove sample introduction components and rinse thoroughly
with DI water.
UNCONTROLLED ELECTRONIC COPY EFFECTIVE 4-2015

CONFIDENTIAL Standard Operating Procedure Procedure Number: ERG-MOR-085 Revision Number: 10 Revision Date: March 31, 2015 Page: 42 of 56
20.3.6 Inspect cones under dissecting microscope to be sure that the edges of the orifices are not damaged and that the surfaces inside and out of the cone orifice area has been cleaned well. If the cones still appear to be dirty place in 2% HNO3 and sonicate for no more than 2 minutes (more than 2 minutes of acid exposure will damage the cones) then rinse thoroughly with DI water and reinspect. If cones are needed immediately they may be dried by spraying Dust Off® over the entire surface, taking care not to make physical contact with the cones. All other sample components that need further cleaning should be sonicated for 2 or more minutes in 2% HNO3. Place in Class 100 hood or leave to air dry on a dust free cloth (e.g., Technicloth®) or Kimwipes® may be used. If cones are needed immediately they may be dried by spraying Dust Off® over the entire cone.
20.3.7 For cones that are still dirty after the procedure described in 20.3.6, and
believed to be usable, refer to the Spectron Cone Cleaning Guide for additional procedures. Cones that are no longer usable may be returned to the manufacturer for recycling and platinum cones can be sent in for refurbishing.
21.0 SHORTHAND PROCEDURE
The flow chart shown in Figure 24-9 shows the procedural steps and sequence for analysis of inorganic samples.
22.0 DOCUMENTATION AND DOCUMENT CONTROL
22.1 All information concerning sample preparation, standard preparation, instrument conditions, etc., must be documented in the appropriate binders (i.e., Extraction Log, Daily Performance Reports, Standards Log etc.) and/or electronically in either the LIMS or the local instrument computer.
22.2 All calculations and the type of method for determining concentration must be
recorded in the analyst's notebook. Any unusual problems or conditions must also be noted.
22.3 Record all maintenance performed on the instrument in the maintenance logbook
for this particular instrument.
22.4 Record all sample analyses, including quality control samples, performed by the instrument in the ICP-MS run logbook for this particular instrument.
22.5 Reviewer must sign laboratory notebook weekly.
UNCONTROLLED ELECTRONIC COPY EFFECTIVE 4-2015

CONFIDENTIAL Standard Operating Procedure Procedure Number: ERG-MOR-085 Revision Number: 10 Revision Date: March 31, 2015 Page: 43 of 56
22.6 Any hard copies of instrument data should be filed chronologically. Electronic copies of instrument data are maintained on the L: drive in the “Metals Lab” folder.
22.7 It is imperative the project documentation be updated following each analysis.
Analysts will copy raw instrument and QC files to a designated corporate network shared drive at the completion of each analysis sequence or batch. Primary data reviewers will use the data on the shared network drive for their data review process. The completed data packages ready for upload into the ERG LIMS system will be retained on the network drive as the backup for this data.
22.8 All processed data are archived in the LIMS on the shared network drive. Data is archived monthly to compact disc (CD) or digital versatile disc (DVD), verified on the system where the data originated and stored for at least five years in the laboratory. An archive copy of a data package is retained for at least five years in the laboratory data storage. The data backup should include enough information to manually generate the numbers used for reporting.
22.9 Reporting
22.9.1 Sample results are uploaded into the LIMS in ng/L as analyzed. Any dilutions performed must be accounted for in the instrument software. The internal standard recoveries must be included with the result calculation. Final results should be reported in ng/m3 to three significant figures as shown in Section 12.1. If required by the sampling organization, results can also be reported in µg/m3 by multiplying the ng/m3 results by 1,000.
22.9.2 Sample results should not be corrected based on analyte results from the
laboratory blanks, field, trip, or filter lot blanks provided by sampling agencies, unless specifically requested. However, samples are blank-subtracted if any analyte is detected in the LRB at greater than 5 times the MDL as described in Section 16.2.4.
22.9.3 As stated in Section 11.2.6, samples with metal concentrations greater than
90% of the current LDR must be diluted and re-analyzed. The diluted value will be reported to the sampling agency.
22.9.4 Data should meet all specifications as presented in Table 24-3. If data does
not meet specifications, corrective reporting actions listed must be followed (flag or invalidate data).
UNCONTROLLED ELECTRONIC COPY EFFECTIVE 4-2015

CONFIDENTIAL Standard Operating Procedure Procedure Number: ERG-MOR-085 Revision Number: 10 Revision Date: March 31, 2015 Page: 44 of 56 23.0 REFERENCES
Ashley, K., R. N. Andrews, L. Cavazos, and M. Demange. 2001. Ultrasonic Extraction as a Sample Preparation Technique for Elemental Analysis by Atomic Spectroscopy. Journal of Analytical Atomic Spectrometry 16:1147-1153. Butler, O. T. and A. M. Howe. 1999. Development of an International Standard for the Determination of Metals and Metalloids in Workplace Air Using ICP-AES: Evaluation of Sample Dissolution Procedures Through an Interlaboratory Trial. Journal of Environmental Monitoring 1:23-32. Code of Federal Regulations, 40, Ch. 1, Part 136, Appendix B – Definition and Procedure for the Determination of the Method Detection Limit – Revision 1.11. Determination of Metals in Ambient Particulate Matter Using Inductively Coupled Plasma/Mass Spectrometry (ICP/MS). Compendium Method IO-3.5, In: Compendium of Methods for the Determination of Inorganic Compounds in Ambient Air. Center for Environmental Research Information, Office of Research and Development, U.S. Environmental Protection Agency, Cincinnati, OH, 45268, June 1999.
EPA Great Lakes Monitoring, Great Lakes Environmental Database website: http://epa.gov/greatlakes/monitoring/data_proj/glenda/codes/r_lim_tp.pdf.
Federal Advisory Committee on Detection and Quantitation Approaches and Uses In Clean Water Act Programs. Appendix D: DQ FAC Single Laboratory Procedure v2.4, 8/30/2007. Jalkanen, L. M. and E. K. Hasanen. 1996. Simple Method for the Dissolution of Atmospheric Aerosol Samples for Analysis by Inductively Coupled Plasma Mass Spectrometry. Journal of Analytical Atomic Spectrometry 11:365-369. National Environmental Laboratory Accreditation Conference. 2003 NELAC Standard, EPA/600/R0-04/003, Approved June 5, 2003, Effective July 1, 2005. Pekney, N. J. and C. I. Davidson. 2005. Determination of Trace Elements in Ambient Aerosol Samples. Analytica Chimica Acta 540:269-277. PerkinElmer Elan® Version 3.4 Software Reference Guide, 2007. PerkinElmer Elan® 9000 Hardware Guide, 2003.
Reference Method for the Determination of Lead in Particulate Matter as PM10 Collected From Ambient Air. Code of Federal Regulations Title 40, Part 50, Appendix Q [2008].
UNCONTROLLED ELECTRONIC COPY EFFECTIVE 4-2015

CONFIDENTIAL Standard Operating Procedure Procedure Number: ERG-MOR-085 Revision Number: 10 Revision Date: March 31, 2015 Page: 45 of 56
Selection, Preparation and Extraction of Filter Material. Compendium Method IO-3.1, In: Compendium of Methods for the Determination of Inorganic Compounds in Ambient Air. Center for Environmental Research Information, Office of Research and Development, U.S. Environmental Protection Agency, Cincinnati, OH, 45268, June 1999. EPA Method 6020A, Inductively Coupled Plasma – Mass Spectroscopy. In: EPA SW-846, “Test Methods for Evaluating Solid Waste, Physical/Chemical Methods”. Spectron Cone Cleaning Guide. By Lawrence Neufeld, Spectron, Inc. Website: http://www.spectronus.com/uploadcache/1253135846-Cone_Cleaning_Final_909.pdf. Standard Operating Procedure (SOP) For The Trace Elemental Analysis of Ambient Air Particulate Samples Using Inductively Coupled Plasma - Mass Spectrometry (ICP-MS). California Environmental Protection Agency, Air Resources Board, (SOP MLD 061), Rev. No. 1, January 1, 2007. USEPA Contract Laboratory Program, Statement of Work for Inorganic Analysis, Multi-Media, Multi-Concentration, ILM05.3, Analytical Methods for Inductively Coupled Plasma – Mass Spectroscopy, Exhibit D, G – Part B, March 2004.
Yamashige, T., M. Yamamoto, and H. Sunahara. 1989. Comparison of Decomposition Methods for the Analysis of Atmospheric Particles by Atomic Absorption Spectrometry. Analyst 114:1071-1077.
UNCONTROLLED ELECTRONIC COPY EFFECTIVE 4-2015
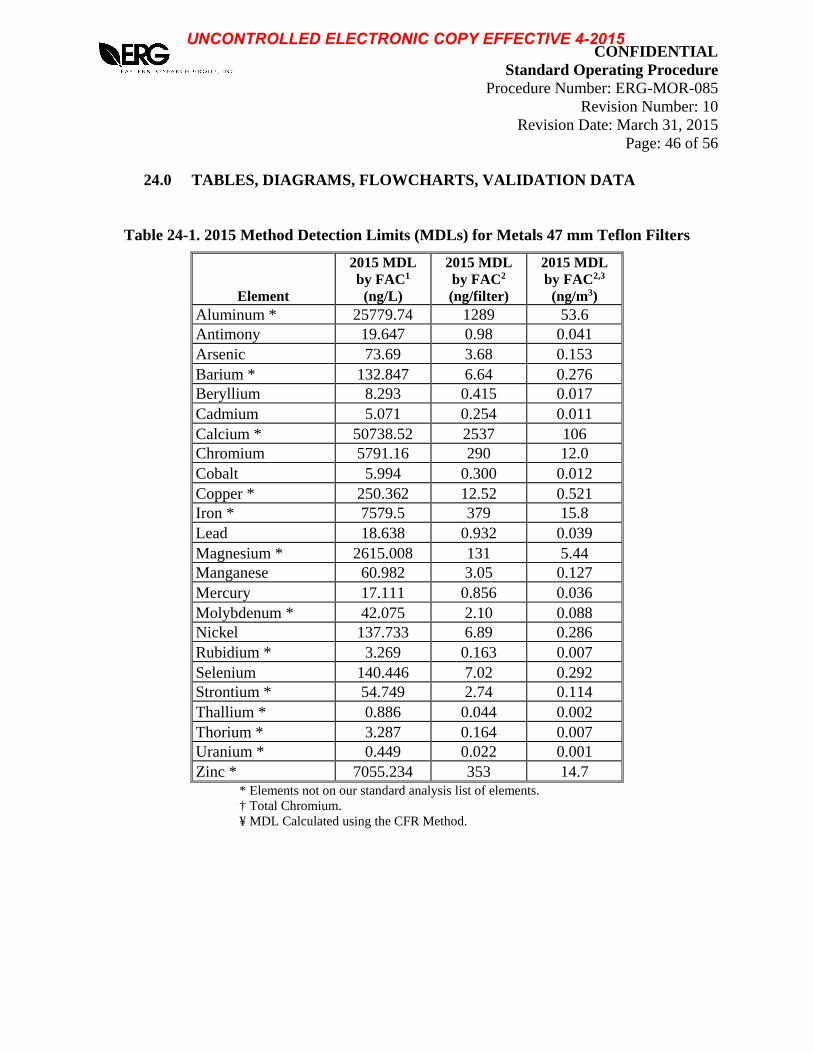
CONFIDENTIAL Standard Operating Procedure Procedure Number: ERG-MOR-085 Revision Number: 10 Revision Date: March 31, 2015 Page: 46 of 56
24.0 TABLES, DIAGRAMS, FLOWCHARTS, VALIDATION DATA
Table 24-1. 2015 Method Detection Limits (MDLs) for Metals 47 mm Teflon Filters
Element
2015 MDL by FAC1
(ng/L)
2015 MDL by FAC2 (ng/filter)
2015 MDL by FAC2,3
(ng/m3) Aluminum * 25779.74 1289 53.6 Antimony 19.647 0.98 0.041 Arsenic 73.69 3.68 0.153 Barium * 132.847 6.64 0.276 Beryllium 8.293 0.415 0.017 Cadmium 5.071 0.254 0.011 Calcium * 50738.52 2537 106 Chromium 5791.16 290 12.0 Cobalt 5.994 0.300 0.012 Copper * 250.362 12.52 0.521 Iron * 7579.5 379 15.8 Lead 18.638 0.932 0.039 Magnesium * 2615.008 131 5.44 Manganese 60.982 3.05 0.127 Mercury 17.111 0.856 0.036 Molybdenum * 42.075 2.10 0.088 Nickel 137.733 6.89 0.286 Rubidium * 3.269 0.163 0.007 Selenium 140.446 7.02 0.292 Strontium * 54.749 2.74 0.114 Thallium * 0.886 0.044 0.002 Thorium * 3.287 0.164 0.007 Uranium * 0.449 0.022 0.001 Zinc * 7055.234 353 14.7
* Elements not on our standard analysis list of elements. † Total Chromium. ¥ MDL Calculated using the CFR Method.
UNCONTROLLED ELECTRONIC COPY EFFECTIVE 4-2015
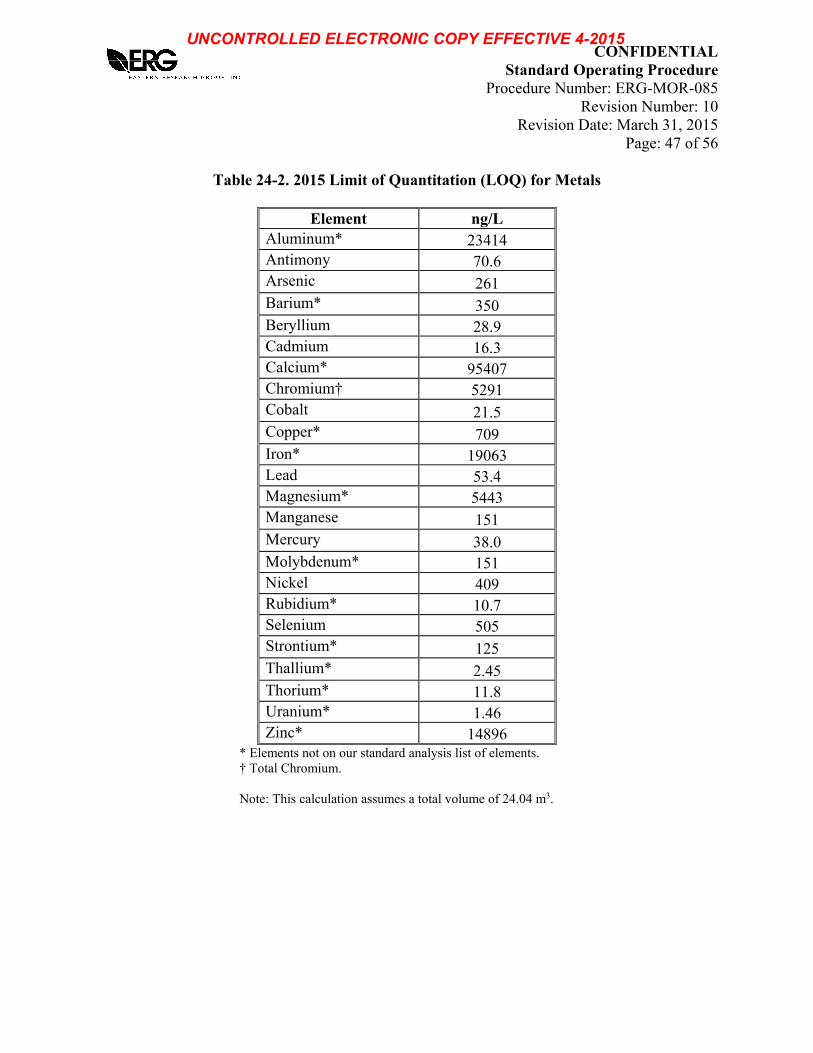
CONFIDENTIAL Standard Operating Procedure Procedure Number: ERG-MOR-085 Revision Number: 10 Revision Date: March 31, 2015 Page: 47 of 56
Table 24-2. 2015 Limit of Quantitation (LOQ) for Metals
Element ng/L Aluminum* 23414 Antimony 70.6 Arsenic 261 Barium* 350 Beryllium 28.9 Cadmium 16.3 Calcium* 95407 Chromium† 5291 Cobalt 21.5 Copper* 709 Iron* 19063 Lead 53.4 Magnesium* 5443 Manganese 151 Mercury 38.0 Molybdenum* 151 Nickel 409 Rubidium* 10.7 Selenium 505 Strontium* 125 Thallium* 2.45 Thorium* 11.8 Uranium* 1.46 Zinc* 14896
* Elements not on our standard analysis list of elements. † Total Chromium.
Note: This calculation assumes a total volume of 24.04 m3.
UNCONTROLLED ELECTRONIC COPY EFFECTIVE 4-2015
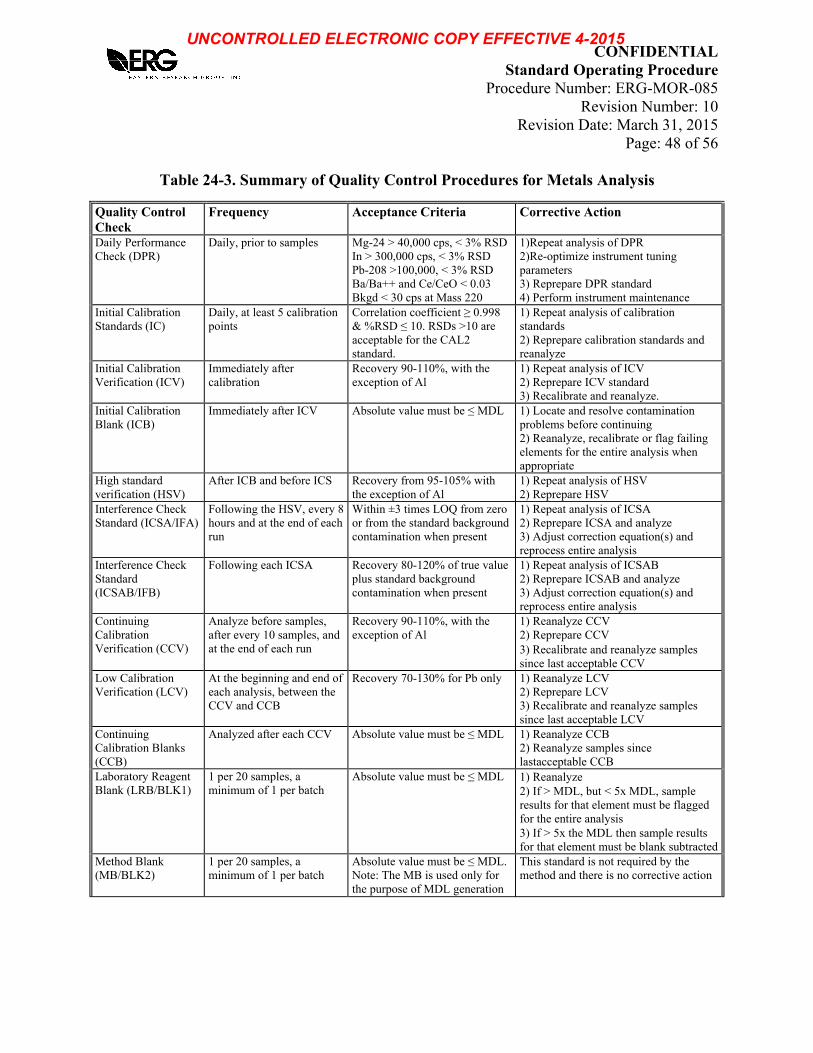
CONFIDENTIAL Standard Operating Procedure Procedure Number: ERG-MOR-085 Revision Number: 10 Revision Date: March 31, 2015 Page: 48 of 56
Table 24-3. Summary of Quality Control Procedures for Metals Analysis
Quality Control Check
Frequency Acceptance Criteria Corrective Action
Daily Performance Check (DPR)
Daily, prior to samples Mg-24 > 40,000 cps, < 3% RSD In > 300,000 cps, < 3% RSD Pb-208 >100,000, < 3% RSD Ba/Ba++ and Ce/CeO < 0.03 Bkgd < 30 cps at Mass 220
1)Repeat analysis of DPR 2)Re-optimize instrument tuning parameters 3) Reprepare DPR standard 4) Perform instrument maintenance
Initial Calibration Standards (IC)
Daily, at least 5 calibration points
Correlation coefficient ≥ 0.998 & %RSD ≤ 10. RSDs >10 are acceptable for the CAL2 standard.
1) Repeat analysis of calibration standards 2) Reprepare calibration standards and reanalyze
Initial Calibration Verification (ICV)
Immediately after calibration
Recovery 90-110%, with the exception of Al
1) Repeat analysis of ICV 2) Reprepare ICV standard 3) Recalibrate and reanalyze.
Initial Calibration Blank (ICB)
Immediately after ICV Absolute value must be ≤ MDL 1) Locate and resolve contamination problems before continuing 2) Reanalyze, recalibrate or flag failing elements for the entire analysis when appropriate
High standard verification (HSV)
After ICB and before ICS Recovery from 95-105% with the exception of Al
1) Repeat analysis of HSV 2) Reprepare HSV
Interference Check Standard (ICSA/IFA)
Following the HSV, every 8 hours and at the end of each run
Within ±3 times LOQ from zero or from the standard background contamination when present
1) Repeat analysis of ICSA 2) Reprepare ICSA and analyze 3) Adjust correction equation(s) and reprocess entire analysis
Interference Check Standard (ICSAB/IFB)
Following each ICSA Recovery 80-120% of true value plus standard background contamination when present
1) Repeat analysis of ICSAB 2) Reprepare ICSAB and analyze 3) Adjust correction equation(s) and reprocess entire analysis
Continuing Calibration Verification (CCV)
Analyze before samples, after every 10 samples, and at the end of each run
Recovery 90-110%, with the exception of Al
1) Reanalyze CCV 2) Reprepare CCV 3) Recalibrate and reanalyze samples since last acceptable CCV
Low Calibration Verification (LCV)
At the beginning and end of each analysis, between the CCV and CCB
Recovery 70-130% for Pb only 1) Reanalyze LCV 2) Reprepare LCV 3) Recalibrate and reanalyze samples since last acceptable LCV
Continuing Calibration Blanks (CCB)
Analyzed after each CCV Absolute value must be ≤ MDL 1) Reanalyze CCB 2) Reanalyze samples since lastacceptable CCB
Laboratory Reagent Blank (LRB/BLK1)
1 per 20 samples, a minimum of 1 per batch
Absolute value must be ≤ MDL 1) Reanalyze 2) If > MDL, but < 5x MDL, sample results for that element must be flagged for the entire analysis 3) If > 5x the MDL then sample results for that element must be blank subtracted
Method Blank (MB/BLK2)
1 per 20 samples, a minimum of 1 per batch
Absolute value must be ≤ MDL. Note: The MB is used only for the purpose of MDL generation
This standard is not required by the method and there is no corrective action
UNCONTROLLED ELECTRONIC COPY EFFECTIVE 4-2015

CONFIDENTIAL Standard Operating Procedure Procedure Number: ERG-MOR-085 Revision Number: 10 Revision Date: March 31, 2015 Page: 49 of 56
Table 24-3. Summary of Quality Control Procedures for Metals Analysis (cont’d)
Quality Control Check
Frequency Acceptance Criteria Corrective Action
Standard Reference Material (SRM)
1 per 20 samples, a minimum of 1 per batch
Recovery 80-120% for Pb only 1) Reanalyze 2) Flag sample data 3) Re-extract batch
Laboratory Control Sample (LCS/BS and BSD)
1 per 20 samples, a minimum of 1 per batch
Recovery 80-120%, with the exception of Al
1) Reanalyze 2) Flag data if recovery for only one or two elements fail criteria 3) Reprepare sample batch if recovery for most elements fail criteria
Replicates (DUP) (Replicate Analysis)
1 per 20 samples, a minimum of 1 per batch
≤ ±10% RPD for sample and duplicate values ≥ 10 times the MDL
1) Check for matrix interference in the cased of DUP1. 2) Repeat replicate analysis 3) Flag data
Collocated Samples (C1/C2)
10% of samples annually ≤ ±20% RPD for sample and collocate values ≥ 10 times the MDL
1) Flag C2 data if associated replicate analysis are within criteria 2) Repeat analysis if replicate analysis fails.
Post Digestion Spike (PDS)
1 per 20 samples, minimum of 1 per batch
Recovery 75%-125% 1) Flag failed elements for parent sample and PDS 2) Reprepare PDS if preparation issue is suspected reason for failure.
Serial Dilution (SRD) 1 per batch Recovery 90-110% of undiluted sample if the element concentration is minimally a factor of 50 above the MDL in the original sample
1) Re-prepare dilution if preparation issue is suspected reason for failure.2) Flag failed analytes
Internal Standards (ISTD)
Every Calibration, QC and Field Sample
Recovery 60-125% of the measured intensity of the calibration blank
1) If drift suspected, stop analysis and determine cause, recalibrate if necessary 2) Reprepare sample 3) If recovery > 125% due to inherent ISTD, dilute sample and reanalyze
UNCONTROLLED ELECTRONIC COPY EFFECTIVE 4-2015

CONFIDENTIAL Standard Operating Procedure Procedure Number: ERG-MOR-085 Revision Number: 10 Revision Date: March 31, 2015 Page: 50 of 56
Table 24-4. Optimization Procedures Procedure When to Perform Nebulizer Gas Optimization Daily. Ion Lens Voltage Optimization Daily. Auto Lens Optimization Daily, when Auto Lens is used in the acquisition
method. Dual Detector Cross Calibration Cross calibration is necessary if you have selected
Dual Mode as your Processing Method. This would only be done when you require extended dynamic range (above 2 million cps). Note: This must be performed before each analysis for this method.
Instrument Performance Check Daily. X-Y Adjustment Whenever the cones have been cleaned or replaced,
or after any torch maintenance procedure. Detector Optimization: Pulse Stage Voltage Analog Stage Voltage
When sensitivity cannot be recovered through other cleaning or optimization methods or when the detector is replaced.
Deadtime Correction This procedure should only be performed if a detector has been replaced, and after the new detector has been optimized.
Table 24-5. Performance Specifications
24Mg Sensitivity > 40,000 cps < 3% RSD In Sensitivity > 300,000 cps < 3% RSD 208Pb Sensitivity > 100,000 cps < 3% RSD CeO/Ce <0.03 N/A Ba++/Ba+ <0.03 N/A Background < 30 cps @ Mass 220 N/A
UNCONTROLLED ELECTRONIC COPY EFFECTIVE 4-2015
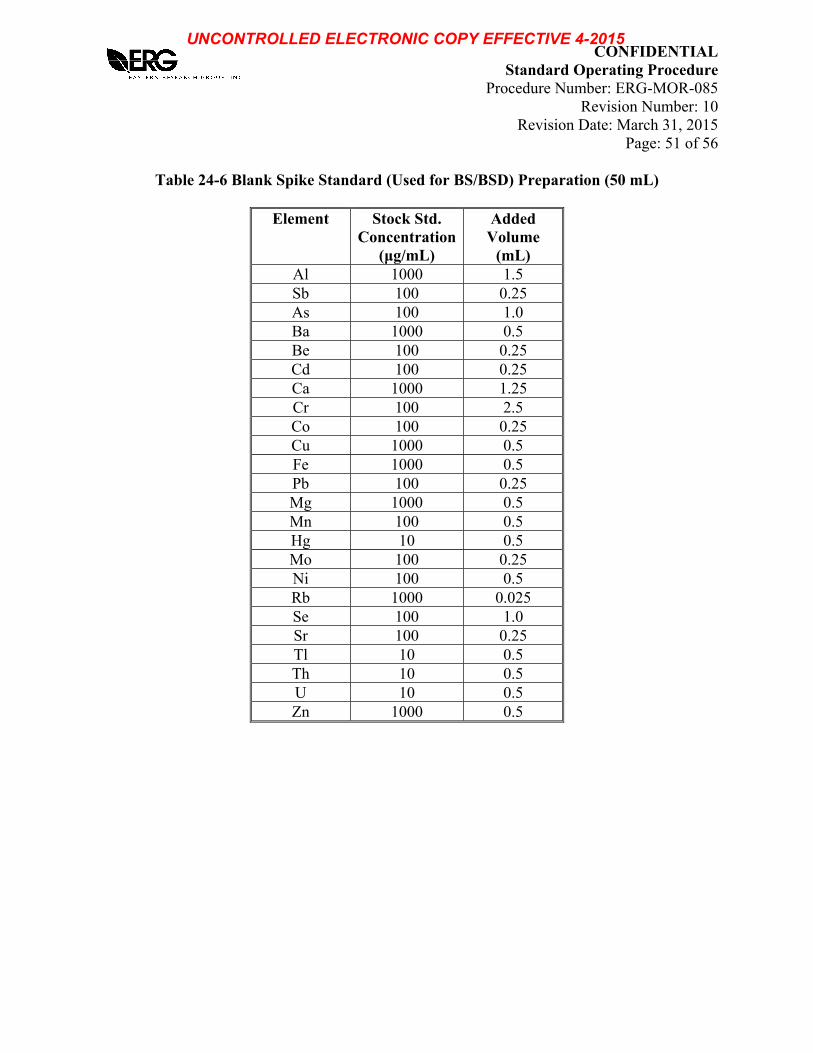
CONFIDENTIAL Standard Operating Procedure Procedure Number: ERG-MOR-085 Revision Number: 10 Revision Date: March 31, 2015 Page: 51 of 56
Table 24-6 Blank Spike Standard (Used for BS/BSD) Preparation (50 mL)
Element Stock Std. Concentration
(μg/mL)
Added Volume
(mL) Al 1000 1.5 Sb 100 0.25 As 100 1.0 Ba 1000 0.5 Be 100 0.25 Cd 100 0.25 Ca 1000 1.25 Cr 100 2.5 Co 100 0.25 Cu 1000 0.5 Fe 1000 0.5 Pb 100 0.25 Mg 1000 0.5 Mn 100 0.5 Hg 10 0.5 Mo 100 0.25 Ni 100 0.5 Rb 1000 0.025 Se 100 1.0 Sr 100 0.25 Tl 10 0.5 Th 10 0.5 U 10 0.5 Zn 1000 0.5
UNCONTROLLED ELECTRONIC COPY EFFECTIVE 4-2015

CONFIDENTIAL Standard Operating Procedure Procedure Number: ERG-MOR-085 Revision Number: 10 Revision Date: March 31, 2015 Page: 52 of 56
Table 24-7. Analytical Isotopes for Quantitation and Monitoring of Reported Elements
Element Quantitation Isotope(s)
Monitored/Confirmation Isotope(s)
Aluminum 27 NA Antimony 121 123 Arsenic 75 NA Beryllium 9 NA Barium 137 135 Bismuth (ISTD) 209 NA Cadmium 111 106, 108, 114 Calcium 43 NA Chromium 52 53 Cobalt 59 NA Copper 63 65 Iron 57 54 Gallium (ISTD) 71 NA Indium (ISTD) 115 NA Lead 208 206, 207 Lithium (ISTD) 6 NA Magnesium 25 24 Manganese 55 NA Mercury 201 200, 202 Molybdenum 98 92, 94, 95, 97 Nickel 60 62 Rubidium 85 NA Scandium (ISTD) 45 NA Selenium 82 77, 78 Strontium 88 NA Thallium 205 203 Thorium 232 NA Uranium 238 NA Yttrium (ISTD) 89 NA Zinc 66 67, 68 NA = Not applicable/none.
UNCONTROLLED ELECTRONIC COPY EFFECTIVE 4-2015

CONFIDENTIAL Standard Operating Procedure Procedure Number: ERG-MOR-085 Revision Number: 10 Revision Date: March 31, 2015 Page: 53 of 56
Figure 24-8. Quality Control Review Form (Page 1)
UNCONTROLLED ELECTRONIC COPY EFFECTIVE 4-2015
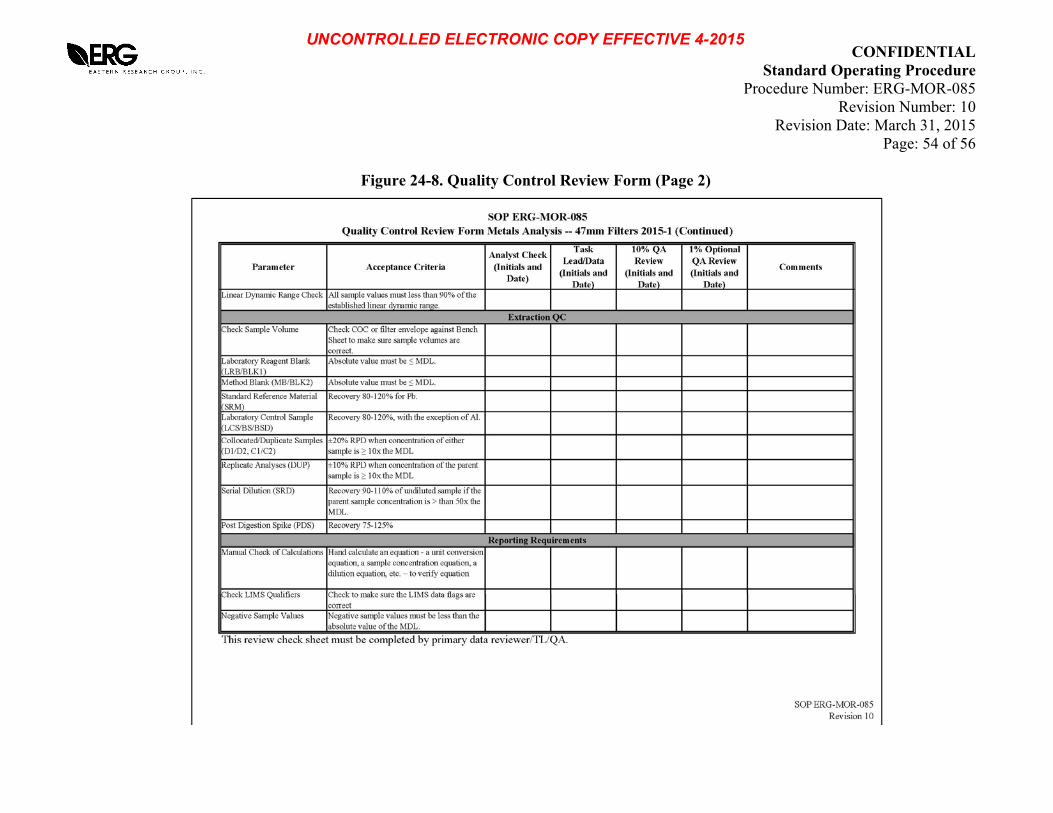
CONFIDENTIAL Standard Operating Procedure Procedure Number: ERG-MOR-085 Revision Number: 10 Revision Date: March 31, 2015 Page: 54 of 56
Figure 24-8. Quality Control Review Form (Page 2)
UNCONTROLLED ELECTRONIC COPY EFFECTIVE 4-2015
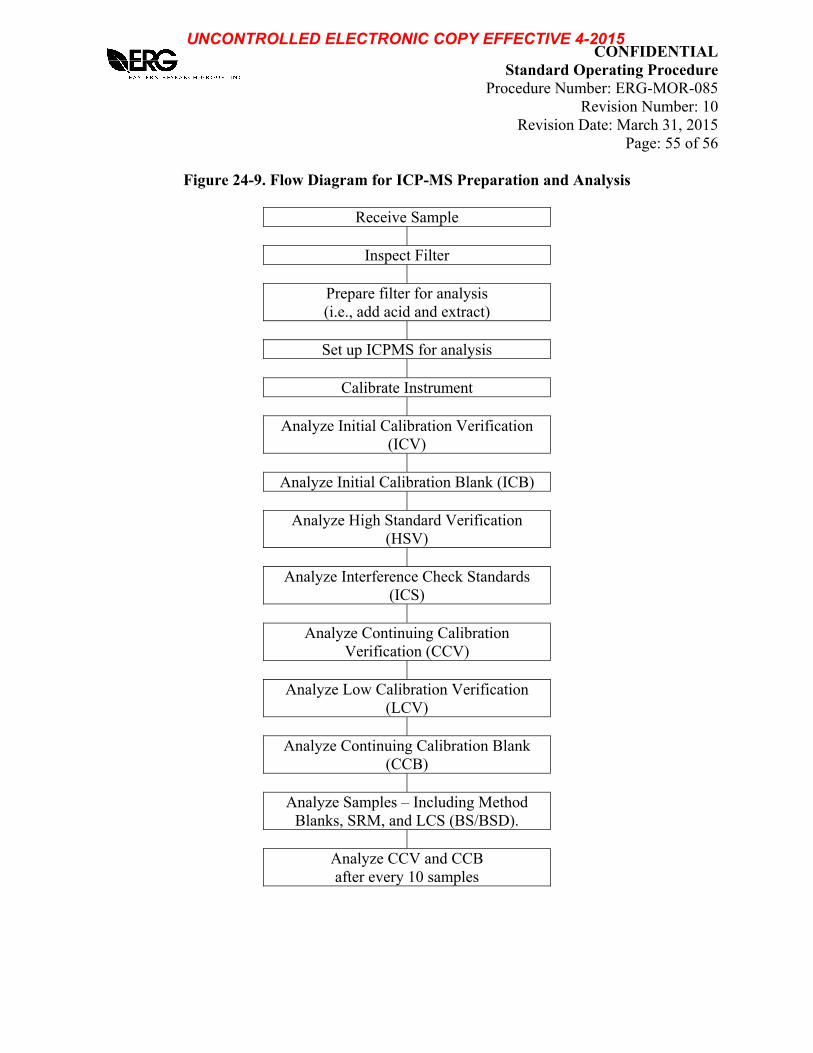
CONFIDENTIAL Standard Operating Procedure Procedure Number: ERG-MOR-085 Revision Number: 10 Revision Date: March 31, 2015 Page: 55 of 56
Figure 24-9. Flow Diagram for ICP-MS Preparation and Analysis
Receive Sample
Inspect Filter
Prepare filter for analysis (i.e., add acid and extract)
Set up ICPMS for analysis
Calibrate Instrument
Analyze Initial Calibration Verification
(ICV)
Analyze Initial Calibration Blank (ICB)
Analyze High Standard Verification (HSV)
Analyze Interference Check Standards
(ICS)
Analyze Continuing Calibration Verification (CCV)
Analyze Low Calibration Verification
(LCV)
Analyze Continuing Calibration Blank (CCB)
Analyze Samples – Including Method
Blanks, SRM, and LCS (BS/BSD).
Analyze CCV and CCB after every 10 samples
UNCONTROLLED ELECTRONIC COPY EFFECTIVE 4-2015
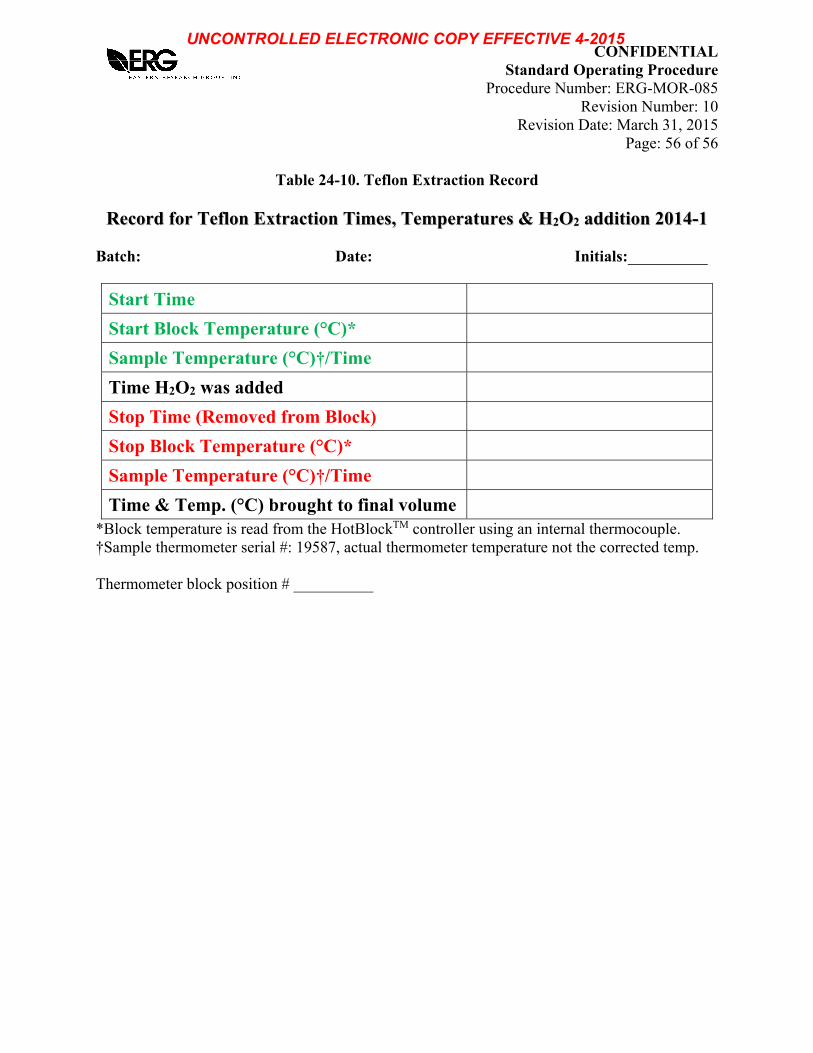
CONFIDENTIAL Standard Operating Procedure Procedure Number: ERG-MOR-085 Revision Number: 10 Revision Date: March 31, 2015 Page: 56 of 56
Table 24-10. Teflon Extraction Record
RReeccoorrdd ffoorr TTeefflloonn EExxttrraaccttiioonn TTiimmeess,, TTeemmppeerraattuurreess && HH22OO22 aaddddiittiioonn 22001144--11 Batch: Date: Initials:__________
Start Time
Start Block Temperature (°C)*
Sample Temperature (°C)†/Time
Time H2O2 was added
Stop Time (Removed from Block)
Stop Block Temperature (°C)*
Sample Temperature (°C)†/Time
Time & Temp. (°C) brought to final volume
*Block temperature is read from the HotBlockTM controller using an internal thermocouple. †Sample thermometer serial #: 19587, actual thermometer temperature not the corrected temp. Thermometer block position # __________
UNCONTROLLED ELECTRONIC COPY EFFECTIVE 4-2015

UNCONTROLLED ELECTRONIC COPY EFFECTIVE 10-2014
CONFIDENTIAL Standard Operating Procedure Procedure Number: ERG-MOR-098 Revision Number: 3 Revision Date: October 1, 2014 Page: 2 of 26 4.0 SCOPE AND APPLICATION
This document outlines the step-by-step process of extracting data from the LIMS, importing and coding the data via a Microsoft Access “Macro” database, and loading the data into EPA’s AQS database. Although the intent of this document is to provide instructions on how to extract, code, and load data for the National Monitoring Program, these steps may also be replicated and/or adjusted for any given subset of data for which extracting, coding, and/or AQS loading of the data may be necessary. Not every step or query described in Section 14 is applicable in every situation; some queries may need to be altered or may be skipped entirely. However, translated data sets are not affected by running unnecessary queries from the tools described in this SOP.
5.0 METHOD SUMMARY N/A 6.0 DEFINITIONS
AQS – EPA's “repository of ambient air quality data” and includes ambient air quality data for criteria pollutants and hazardous air pollutants, as well as meteorological data and metadata information on monitoring locations (http://www.epa.gov/ttn/airs/airsaqs/).
“AQS” Database – a Microsoft Access database where the AQS Tables are exported and
parsed out based on various client requests. AQS RB Template – the table in the Macro database where AQS coding is appended for
blank (field blank, trip blank, or lot blank) data; this table is directly loaded into AQS.
AQS RD Template – the table in the Macro database where AQS coding is appended for
raw (field sample, primary, or collocate) data; this table is directly loaded into AQS.
AQS RP Template – the table in the Macro database where AQS coding is appended for
precision (duplicates and/or replicates) data; this table is directly loaded into AQS.
LIMS – Laboratory Information Management System; the lab’s repository of
concentration data. “Macro” Database – a Microsoft Access database where queries are run to convert the
data into AQS format; queries are also run to perform QA on the AQS Tables that are generated and loaded into AQS.
UNCONTROLLED ELECTRONIC COPY EFFECTIVE 10-2014
CONFIDENTIAL Standard Operating Procedure Procedure Number: ERG-MOR-098 Revision Number: 3 Revision Date: October 1, 2014 Page: 3 of 26
POC – Parameter Occurrence Code, used in AQS to distinguish data from different sources for the same site, date, and pollutant.
QCData Template – a table in the Macro database where the QC (or precision) data are
appended after they have been quality assured; all queries in the Macro database run on this version of the QCData table because the names are formatted in a specific manner.
“Raw” Database – a Microsoft Access database where data is initially imported and
reviewed for completeness. Sampdata Template – a table in the Macro database where the Sample data are appended
after they have been quality assured; all queries in the Macro database run on this version of the Sampdata table because the names are formatted in a specific manner.
Worklist Spreadsheet – a Microsoft Excel table exported from LIMS that provides
information related to individual samples not available with the raw concentration data.
Worklist Template – a table in the Macro database where the Worklist data are appended
after they have been quality assured; all queries in the Macro database run on this version of the Worklist table because the names are formatted in a specific manner.
7.0 INTERFERENCES
N/A 8.0 SAFETY
N/A 9.0 EQUIPMENT
N/A
10.0 MATERIALS
N/A
11.0 CHEMICALS, REAGENTS, AND STANDARDS
N/A
UNCONTROLLED ELECTRONIC COPY EFFECTIVE 10-2014
CONFIDENTIAL Standard Operating Procedure Procedure Number: ERG-MOR-098 Revision Number: 3 Revision Date: October 1, 2014 Page: 4 of 26 12.0 COLLECTION, PRESERVATION, SHIPMENT, AND STORAGE
N/A
13.0 CALIBRATION AND STANDARDIZATION
N/A
14.0 PROCEDURE
The procedure described in this section produces two results: 1) it transcribes data from LIMS into AQS-coded files with the proper syntax to export and load directly into EPA’s AQS database; and 2) it compiles sample data, QC data, and subsequent sample information into a single table in Microsoft Access that is used to perform various data analyses. It is recommended that notes are taken for each transcription run-through. A log and notes of every data transcription/translation record error or change required to complete the format of the monitoring data shall be kept. A record of the number of records generated from each of the queries in the Macro database (as directed in specific steps in this SOP) shall be kept. It is especially important to note if a sample or its corresponding data are modified for any reason, the reason the change occurred, and how the omission or change was determined. A detailed, step-by-step list of instructions is provided below.
14.1 Generating a Worklist and Extracting Data from LIMS
Note: Extraction of data from ERG’s LIMS requires authorization to access LIMS data and experience using the LIMS system. 14.1.1 In LIMS, go to Laboratory and select Query Analysis Status.
14.1.2 In the “Query For:” drop-down menu, select the appropriate Lab Project
Manager (i.e. Julie Swift) and/or work order numbers. 14.1.3 Select the needed sampled date range (i.e. 12/31/12 23:59 through
4/1/13 00:00). Make sure the time for the last date of the range is 00:00 on the next day or data for samples taken on that date may not be included.
14.1.4 In the Status menu, select all status types except “not required.”
UNCONTROLLED ELECTRONIC COPY EFFECTIVE 10-2014

CONFIDENTIAL Standard Operating Procedure Procedure Number: ERG-MOR-098 Revision Number: 3 Revision Date: October 1, 2014 Page: 5 of 26
14.1.5 To the right of the window, order results by project name – analysis – sampled.
14.1.6 Choose Query. When the list appears in the window, select export and save the worklist as an Excel file in the desired C: or L: drive location.
14.1.7 Open the Excel file. Select the Data menu – Filter – Auto Filter.
14.1.8 Sort ascending for sample Status. All statuses marked “Canceled” can
be deleted. Sort ascending for Sample Type and delete the following: Audit samples, Filter Blanks, and Passive Blanks.
14.1.9 Review the Sample Type entries to be sure the sample type agrees with
the information in the Sample Name and Comments (C1, C2, etc.) entries.
14.1.10 Sort ascending for Status. For samples marked “Invalid,” review sample
comments and assign AQS null codes using the WorkUser10 column left of the comments. A list of null codes is provided in Table 14-1 (with the most commonly used codes in bold).
14.1.11 With all records showing, sort ascendingly by client (i.e. Region 4) and
note the highest and lowest work order number (the first seven digits of the Lab Number) for each client. This will be used to pull the actual concentration data.
14.1.12 To pull the concentration data from LIMS, go to Project Management –
Reports. 14.1.13 Choose client (i.e. Region 4). 14.1.14 Select work orders (on right of screen) corresponding to those on the
worksheet for this client (find the highest work order noted in Step 14.1.11 and choose, scroll to find the lowest work order, with the shift button held, choose the lowest work order – this will highlight all of the work orders between the two).
14.1.15 Choose destination – C:\ELMT\Userfiles\. 14.1.16 Choose custom – EDD Format – EEDStdExcel_ERG. 14.1.17 Select modified draft – when window opens sort left side of screen by
name – then on the right side of the screen, remove (uncheck) everything except the duplicates.
UNCONTROLLED ELECTRONIC COPY EFFECTIVE 10-2014

CONFIDENTIAL Standard Operating Procedure Procedure Number: ERG-MOR-098 Revision Number: 3 Revision Date: October 1, 2014 Page: 6 of 26
14.1.18 Select continue - report will be generated and saved in the destination chosen.
14.1.19 Email data and worklist Excel files to the person performing the data
conversion.
Table 14-1. List of Null Codes
Qualifier Code Qualifier Description
AA Sample Pressure out of Limits AB Technician Unavaliable AC Construction/Repairs in Area AD Shelter Storm Damage AE Shelter Temperature Outside Limits AF Scheduled but not Collected AG Sample Time out of Limits AH Sample Flow Rate out of Limits AI Insufficient Data (cannot calculate) AJ Filter Damage AK Filter Leak AL Voided by Operator AM Miscellaneous Void AN Machine Malfunction AO Bad Weather AP Vandalism AQ Collection Error AR Lab Error AS Poor Quality Assurance Results AT Calibration AU Monitoring Waived AV Power Failure AW Wildlife Damage AX Precision Check AY Q C Control Points (zero/span) AZ Q C Audit BA Maintenance/Routine Repairs BB Unable to Reach Site BC Multi-point Calibration BD Auto Calibration BE Building/Site Repair BF Precision/Zero/Span
UNCONTROLLED ELECTRONIC COPY EFFECTIVE 10-2014

CONFIDENTIAL Standard Operating Procedure Procedure Number: ERG-MOR-098 Revision Number: 3 Revision Date: October 1, 2014 Page: 7 of 26
Qualifier Code Qualifier Description
BG Missing ozone data not likely to exceed level of standard BH Interference/co-elution/misidentification BI Lost or damaged in transit BJ Operator Error BK Site computer/data logger down BL QA Audit BM Accuracy check BN Sample Value Exceeds Media Limit BR Sample Value Below Acceptable Range CS Laboratory Calibration Standard DA Aberrant Data (Corrupt Files, Aberrant Chromatography, Spikes, Shifts) DL Detection Limit Analyses FI Filter Inspection Flag
MB Method Blank (Analytical) MC Module End Cap Missing SA Storm Approaching SC Sampler Contamination ST Calibration Verification Standard TC Component Check & Retention Time Standard TS Holding Time Or Transport Temperature Is Out Of Specs. XX Experimental Data
14.2 Getting Started in Microsoft Access with the “Raw” Database.
14.2.1 Copy the Microsoft Access database entitled “QX 20XX RAW” from L:\Jaime\REFERENCES\ and paste into the designated location. Adjust the name of the database accordingly.
14.2.2 Import the Microsoft Excel Worklist spreadsheet (may need to do some
“un-formatting”of the file such as removing autofilters, unfreezing panes, unhiding columns, etc.) into the Microsoft Access “Raw” database as a table named “Worklist”.
14.2.3 In the Raw database, review the Worklist for errors such as multiple
samples on a single date, missing null codes, data from outside the date range of interest, etc. Make note of any errors, changes, deletions, etc. Resolve any issues with the Sample Log-in Leader or Project Manager and request that the Sample Log-in Leader make corrections in LIMS (if needed). Note any special flags that may be needed in the SampleUser5
UNCONTROLLED ELECTRONIC COPY EFFECTIVE 10-2014

CONFIDENTIAL Standard Operating Procedure Procedure Number: ERG-MOR-098 Revision Number: 3 Revision Date: October 1, 2014 Page: 8 of 26
column based on the SAMPLECOMMENTS column and available Qualifier Flags for AQS (http://www.epa.gov/ttn/airs/airsaqs/manuals/codedescs.htm). Also note any sites performing manual sampling, running PAMS samples or other samples of a different duration than 24 hours. This is needed for step 14.3.14.
14.2.4 Run the Query0 queries. The “Null Code” query checks to make sure all
invalid samples have a null code and the “Check Void” query ensures that all samples with “VOID” in the sample names have an “Invalid” sample status. Run the “Qualifier Flag” query to confirm that the correct qualifier flag has been added to the SampleUser5 field based on the SampleComments field.
14.2.5 Import each of the tabs (SAMPDATA, QCDATA, LNOTE) in the
Microsoft Excel raw data spreadsheet files into the Raw database. Do not let Microsoft Access assign a primary key during import. If data were pulled from LIMS in multiple spreadsheets, compile tabs of the same name together in a single table. Note that if the data have been pulled by Region (or method, etc.), a Region field needs to be added to the LNOTE table and updated after each successive import in the format “Region X”. The same flag in LIMS can be used to denote different things among different datasets. For example, A-01 is used for manual entry of comments in the LNOTE or ANOTE columns of the raw data. A sample from a site in Region 4 may have an A-01 flag denoting late arrival, while a sample from Region 2 may have an A-01 flag for surrogate recovery issues. Since both samples are denoted with A-01 in the raw data, another aspect of the data, such as Region in this case, must be used to distinguish to what the flag refers. Smaller data sets (data pulled from LIMS in a single spreadsheet) do not need this.
14.2.6 If data were pulled from LIMS in multiple spreadsheets, run the
“Confirm All Regions” queries to ensure that data for all of the regions was appended during the import process (for the Sampdata and LNOTE tables.
14.2.7 Run the “missing data” queries in the Raw database (Query1s). They
verify that the samples listed in the Worklist match the SAMPDATA and vice versa. If everything is correct, no records will appear in the results. If records appear, there are records in one table that do not match the other; this must be resolved before moving forward.
14.2.8 Resolve any missing data issues with the Project Manager and/or
Sample Log-in Leader. Often, data were not “locked” in LIMS and the
UNCONTROLLED ELECTRONIC COPY EFFECTIVE 10-2014

CONFIDENTIAL Standard Operating Procedure Procedure Number: ERG-MOR-098 Revision Number: 3 Revision Date: October 1, 2014 Page: 9 of 26
data must be re-pulled from LIMS. Be careful with the LNOTEs if additional data are appended into the existing tables. If these are added to the LNOTE table, they must agree with the original Region (or method) they were loaded with. Refer to 14.2.5 for further explanation.
14.3 Coding Raw Data in the “Macro” Database
14.3.1 Print out the AQS Steps Record Sheet spreadsheet (Figure 24-1) located at L:\Jaime\AQS. This is used to note the results from various queries and steps in the coding process.
14.3.2 Once the data are ready in the Raw database, copy the most recent Access MACRO database from L:\Jaime\REFERENCES and paste into the designated location. Adjust the name accordingly.
14.3.3 Delete the following tables in the Macro database (if they exist): D1s,
D2s, any “Data X” tables, Dups from QCDATA, Invalids, LNOTE, QA1 Dup Data, QA2 Worklist Data, QCDATA, Qualifiers, SAMPDATA, SAMPDATA + INVALIDS, SAMPDATA + INVALIDS + R1R2, and Worklist.
14.3.4 Delete data from (while leaving the shell table intact) the following six
TEMPLATE tables in the Macro database: AQS RA TEMPLATE, AQS RB TEMPLATE, AQS RP TEMPLATE, AQS RD TEMPLATE, QCDATA TEMPLATE, SAMPDATA TEMPLATE, WORKLIST TEMPLATE.
14.3.5 Compact the Macro database. This “deletes” items in Access’ memory
and reduces the size of the database. 14.3.6 Import the new Worklist, SAMPDATA, LNOTE, and QCDATA tables
from the RAW database used in steps 14.2. 14.3.7 In the Macro database, run queries 00A-00C to append the Worklist,
QCDATA, and SAMPDATA to their associated template tables (the template tables have formatted column names and data). Note the number of records in the record sheet. From this point forward, all data manipulations are done on the Template tables. This is useful in case there is a need to go back to the “original” versions of the data.
14.3.8 Run queries 00D1 and 00D2. These update the Units column in the
QCDATA and SAMPDATA TEMPLATES from “ng/m3 Air” or “ug/m3 Air” to “ng/m3” or “ug/m3”, respectively, which is the format in the reference (or LOOKUP) tables. Note the number of records changed
UNCONTROLLED ELECTRONIC COPY EFFECTIVE 10-2014
CONFIDENTIAL Standard Operating Procedure Procedure Number: ERG-MOR-098 Revision Number: 3 Revision Date: October 1, 2014 Page: 10 of 26
in the “UPDATE UNITS” slot on the record sheet. Run Query 00D3 to confirm the update in the SAMPDATA Template and check for any other unexpected units of measure.
14.3.9 Run queries 00E, 00F, and 00G. These update the Analysis column in
the Worklist, SAMPDATA and QCData TEMPLATES from “Metals Analysis – 47mm” or “Metals Analysis – HiVol” to just “Metals Analysis”, which is the format in the reference tables. Note the number of records changed in the “UPDATE ANALYSIS” slot on the record sheet.
14.3.10 Run 01A and 01B. These are similar checks as in step 14.2.7 above.
They verify that the samples listed in the Worklist Template match the SAMPDATA TEMPLATE and vice versa. If everything is correct, no records will appear in the results. If results appear, there are records in one table that do not match the other and this must be resolved before moving forward.
14.3.11 Run query 01C. This query looks for possible mislabeled blanks by
comparing the SampleType column and the SampleComments column in the Worklist Template. Any results must be resolved before moving forward.
14.3.12 Run query 01D1 and 01D2. These queries put site information for BOMA and TOOK into the SampleInfo1 column. These two sites (for metals only) are collocated and sometimes the Field Samples do not correspond to the primary (C1) sampler; this affects which POC should be used. Note that site info designated with “A” refers to the primary (C1) and “B” refers to the collocated (C2) sampler. Verify that these ran correctly by running query 01D3; a slight deviation in sample log-in sometimes affects the way these are listed. The SampleInfo3 column should say “TOOK A” or “TOOK B” for TOOK samples and “Roxbury A” or “Roxbury B” for BOMA samples. Should a dataset not contain these sites, the queries will simply not update these fields.
14.3.13 Run query 01E1 and 01E2. Query 01E1 trims the SampleName column
entries in the Worklist Template table to match the site id in the Project column. Query 01E2 handles sites with names that deviate from the typical four-letter site code (like INDEM). Verify that these queries ran correctly by running query 01E3. Check each trimmed site name to verify that it is correctly formatted.
14.3.14 Run query 01F1 to update start times and durations for any manual
samples. If no manual samples are included, a pop-up screen appears
UNCONTROLLED ELECTRONIC COPY EFFECTIVE 10-2014
CONFIDENTIAL Standard Operating Procedure Procedure Number: ERG-MOR-098 Revision Number: 3 Revision Date: October 1, 2014 Page: 11 of 26
stating that “no sites currently do manual sampling.” This should be noted when reviewing the Worklist in Section 14.2 and any sites doing manual samples added prior to running this query. Run query 01F2a to update the duration codes (from 24 to 3 hours) for any PAMS samples; run query 01F2b to update the duration codes for any 1-hour samples. Review the start times and start dates of all manual samples or PAMS samples to ensure that the proper start date and time has been applied to the SampleDate and StartTime fields using query 01F3 to manually update and confirm by running query 01F4.
14.3.15 Run query 01G1 through 01G3 to trim the year from the end of the
Methodcode or Analysis columns in the Worklist, Sampdata, and QCData Template tables.
14.3.16 Run query 01H1 and 01H2. These update the POC column of the
Worklist Template with the correct POC for TOOK and BOMA (refer to step 14.3.12 for the reason).
14.3.17 Run query 01I1 to verify that there is a POC in the POC Rules table for
every site-method-sample type combination. Any results that are returned must either be added to the POC Rules table or QA’ed to make sure a sample type was not mislabeled (such as a site that usually runs duplicates mislabeled as collocates or vice versa). Run query 01I2 to update the POC column in the Worklist Template with the POCs for all other site-method-sample type combinations. Run query 01I3 to confirm that all rows have been updated in the POC column. Any results must be resolved before moving forward.
14.3.18 Run query 01J to verify that the correct number of pollutants are
provided for each sample contained in the SAMPDATA Template. Any results returned need to be resolved before moving forward. SNMOC samples have 82 analytes; TO-15 (VOC) samples have 58 analytes; TO-13 (SVOC or PAH) samples have 22 analytes or 25 for the TO-13 plus Phenols list; TO-11A w/ MEK (carbonyl) samples have 13 analytes; IO-3.5 (metal or inorganic) samples have 11 analytes, or in the case of the extended list, 24; and Methane and hexavalent chromium have only one analyte each. Queries 01J2 through 01J4 may be used to resolve exact dups. Run query 01J2 to confirm that there are exact dups; run query 01J3a to make a table of the dups (“Dups to Resolve from Sampdata Template”) and then query 01J3b to delete the dups from the Sampdata Template. Lastly, run query 01J4 to group on the dups and append back into Sampdata Template. After completing this sequence of queries, re-run query 01J to confirm that the dups have been removed.
UNCONTROLLED ELECTRONIC COPY EFFECTIVE 10-2014

CONFIDENTIAL Standard Operating Procedure Procedure Number: ERG-MOR-098 Revision Number: 3 Revision Date: October 1, 2014 Page: 12 of 26
14.3.19 Run query 01Ka to look for any hexavalent chromium samples that have the HT flag in the SampleComments column of the Worklist Template. This flag is used to identify a sample that was exposed to an ambient temperature above a given level (60ºF) when not picked up the day after sampling and will be flagged with a qualifier code in AQS. Run query 01Kb to update the Qualifier column of the Worklist for any of the samples from query 01Ka. Verify that the number of samples updated in 01Kb matched the results from 01Ka. Run query 01Kc to confirm that the flag has been applied.
14.3.20 Run query 01L, which looks for any duplication in the Worklist
Template table. Any results that appear must be reconciled before moving forward.
14.3.21 Run query 01M1 through 01M3 to check for numerical results
associated with data flagged with the co-elution LIMS flag in the SAMPDATA Template table. Because data flagged with the co-elution flag could not be resolved by the instrument, any such results need to be reported to the Project Manager and likely changed to ND in the table as well as LIMS. Run query 01M1 to look for any such results. If found, run query 01M2 to make a table of the original data for record-keeping purposes. Run query 01M3 to manually update the numerical results to ND. Re-run query 01M1 to confirm that all of the changes have been made.
14.3.22 Run query 01N to confirm that all TNMOC results are numeric. These
results are put into LIMS manually and occasionally uploaded incorrectly. Any results that appear must be reconciled before moving forward.
14.3.23 Run query 01O. This updates the SAMPDATA Template with all the information from the Worklist Template. Note the number of records in the record sheet in the 01 slot. This number should match the number from the Import SAMP slot (assuming there have been no data changes such as the removal of dups).
14.3.24 Run query 02a1. This query links the QCDATA Template and the
Worklist Template and makes a new table “Dups from QCData”. This query is run to retrieve only duplicate sample data for the samples we’re loading into AQS and not all the other types of QC data that could be in the QCDATA Template table (such as LCS, spikes, etc). Note the number of records in the record sheet in the 02 slot. Run query 02a2 to look for dups in the new Dups from QCData tables; if any are identified, run query 02a3 to make a table of the dups (“Data with Dups in
UNCONTROLLED ELECTRONIC COPY EFFECTIVE 10-2014
CONFIDENTIAL Standard Operating Procedure Procedure Number: ERG-MOR-098 Revision Number: 3 Revision Date: October 1, 2014 Page: 13 of 26
Precision”) and resolve these with the Project Manager. Run query 02a4 to append the correct results back into the Dups from QCData table. After completing this sequence of queries, re-run query 02a2 to confirm that the dups have been resolved.
14.3.25 Run query 02b. This query verifies that the correct number of pollutants
is provided for each sample contained in the Dups from QC Data table, similar to step 14.3.18.
14.3.26 Because invalid samples are loaded into AQS but no data is generated
from LIMS for invalid samples, records must be created for invalid samples (records with no results for each applicable analyte per method). Run query 03a to ensure all invalid samples have been assigned null codes in the Worklist. Any results that appear must be reconciled before moving forward. Run query 03b to make an Invalids table for non-metal samples, then run query 03c to append in records for metals samples. Note that query 03b must be run first as it sets up the template of the table. Note the number of records from query 03b and 03c in the record sheet in the 03 slot.
14.3.27 Run query 04a to make a new table from the SAMPDATA TEMPLATE
called SAMPDATA + INVALIDS. Note the number of records in the record sheet in the 04 slot. Run query 04b to append in records from the Invalids table. The number of records from the 03 slot on the record sheet plus the number of records from the 04 slot should equal the total number of records now in the SAMPDATA + INVALIDS table. Note this total on the record sheet in the “Total in Samp+” slot.
14.3.28 Go into the design of the SAMPDATA + INVALIDS table. Scroll to
the bottom and change the “DL-NUMBER” and “RESULT-NUMBER” data types from binary to number and change the field size to double. Run query 04c to update these columns in the SAMPDATA + INVALIDS table. These columns will be used later to assign quantitation flags based on the MDLs and Results. (An error message may pop up when query 04c is run. This is because the query is trying to append “ND”s to a numerical field. Click OK, which will result in a null or blank in the RESULT (or DL)-NUMBER columns.)
14.3.29 Run query 04D to ensure that none of the results are in scientific
notation. If results are found, these need to be converted to standard format before moving on.
14.3.30 Skip query 04E and run query 04F. These queries look for results that
appear too low based on a few marker analytes. Investigate any results
UNCONTROLLED ELECTRONIC COPY EFFECTIVE 10-2014

CONFIDENTIAL Standard Operating Procedure Procedure Number: ERG-MOR-098 Revision Number: 3 Revision Date: October 1, 2014 Page: 14 of 26
and resolve with Project Manager. Skip query 04g and run query 04h to check on the number of NDs in a sample. This can be a marker for a mislabeled field blank. Investigate any results and resolve with Project Manager.
14.3.31 Run query 05. This formats the date, in case any unformatted dates get
through. Note this in the record sheet under the 05 slot. 14.3.32 Run query 06A1. This puts the Region in the Client column of the
Worklist Template by trimming the client name to Region X (this relates back to step 14.2.6). Run query 06A2 to verify that query 06A1 ran properly and resolve any records that appear.
14.3.33 Run query 06b1 to update the LNOTE-ANOTE MERGED column in
the SAMPDATA + INVALIDS table. Skip query 06b2 and run query 06b3 to append any instances of multiple flags into the LNOTE table. In the case of multiple flags, manually update the Description column in the LNOTE table to account for both flags. Often, the second flag is just the U flag (Under Detection Limit). Make sure that this description is always listed second in the Description field. Note that these are Region-specific, particularly the A-01x flags, in the case of large data sets.
14.3.34 Run query 06c to verify that all flag descriptions in the LNOTE table
appear in the LNOTE Descriptions reference table. If there are no results, move to the next step. If results appear, add the missing description from the LNOTE table to the LNOTE Descriptions table and assign the proper AQS flag, if needed. The Project Manager may need to be consulted to identify the proper description.
14.3.35 The LIMS flag D-F is used to denote any precision results with greater
than a method-specific percent difference between a primary and a duplicate/collocate. This flag is applied to the duplicate or the collocate record in LIMS. Because the duplicate data are loaded into AQS in the precision data table (RP or QA), and this table does not accept flags, the flag is essentially missed; thus, the flag needs to be moved to the primary sample for coding purposes in the case of duplicates. (Because both the primary and collocate are loaded into the Raw Data table (RD) in AQS, this is not a problem for collocated pairs). Run query 06d1 to check for D2 results with D-F flags and run query 06d2 to apply the flag to the D1s. Confirm that the number of records is the same for both queries. Run query 06d3 to confirm the flag has been added correctly. Confirm that this combination of Regions and LNOTEs is in the LNOTE and LNOTE Description tables using query 06d4.
UNCONTROLLED ELECTRONIC COPY EFFECTIVE 10-2014

CONFIDENTIAL Standard Operating Procedure Procedure Number: ERG-MOR-098 Revision Number: 3 Revision Date: October 1, 2014 Page: 15 of 26
14.3.36 Run query 06e1 to count how many results have a D flag applied but the dilution factor is 1. Run query 06e2 to confirm that samples with dilutions greater than 1 have a D flag applied. Run query 06e3 to confirm the total. Resolve any issues with the D flag with the Project Manager.
14.3.37 Run query 06f1 to get a preliminary count on how many records need qualifier codes. Run query 06f2 to create the table Qualifiers. (Note, if this is a small data set, remove the link between the Region field of the LNOTE table and the LNOTE-ANOTE Merged field of the SAMP+INV table in the design of the query.) If the number of records is not the same for query 06f1 and 06f2, run query 06f3 to see where the discrepancies lie and resolve them before moving on. Run query 06f4 to update the Client field in the SAMP + INV table then run query 06f5 to count how many records should have qualifiers as a second QA step. The number of qualifiers from query 06f5 should match the number in the Qualifier table. Note the number of records in the Qualifier table on the record sheet.
14.3.38 Run query 07AA to append non-metal non-detects to the AQS RD
TEMPLATE for AQS Raw Data (RD) coding. Note the number of records in the record sheet under the 07A slot. Run query 07AB to append metal non-detects to the AQS RD TEMPLATE. Also note this in the record sheet under the 07A slot.
14.3.39 Run query 07BA to append non-metal detects (and invalids) to the AQS
RD TEMPLATE. Note the number of records in the record sheet under the 07B slot. Run query 07BB to append metal detects (and invalids) to the AQS RD TEMPLATE. Also note this in the record sheet under the 07B slot. On the record sheet, sum the four values under 07AA-07BB and enter into the “Total in AQS” slot.
14.3.40 Run query 07C and enter the value in the Total Excluded row of the
record sheet. This value represents precision and blank data not converted yet to AQS code as well as excluded internal standards data that are not coded. This value plus the value in the “Total in AQS” slot should equal the value in the “Total in SAMP+” slot. If it does not, there is an error somewhere. Queries have been created to find some common mistakes: Run query 07D (and 07D2) to make sure the pollutants match properly. Run query 07E to verify all site-method-sample type combinations have been assigned a POC in the POC Rules table. Run query 07F to verify if there are any new sites not found in the LOOKUP – Site Info reference table. If there are still errors after these are run, further review is needed.
UNCONTROLLED ELECTRONIC COPY EFFECTIVE 10-2014

CONFIDENTIAL Standard Operating Procedure Procedure Number: ERG-MOR-098 Revision Number: 3 Revision Date: October 1, 2014 Page: 16 of 26
14.3.41 Run queries 08A and 08B to create tables for D1/C1 data and D2/C2 data, respectively. Note the numbers of records in the 08A and 08B slots on the record sheet. The number of records in each table should be similar, but may not be the same.
14.3.42 Run query 09A1 through 09A3 and note the number of records from
each query on the record sheet in slot 09A. Query 09A1 puts D2 data (with a precision id of 1) in the AQS RP TEMPLATE. Queries 09A2 and 09A3 add precision records for C1 and C2 (also with a precision id of 1) for non-metals and metals, respectively.
14.3.43 Run query 09B1 (for nonmetals) and 09B2 (for metals) and note each on
the record sheet in slot 09B1/2. These put R1 data into the AQS RP TEMPLATE. R1 data are available for both duplicate and collocated data (and uses a precision id of 2). Run query 09B3 and 09B4 to append replicate data for metals and nonmetals, respectively, to the AQS RP TEMPLATE for precision results for sites that do not run duplicate or collocated events. Note the number of records in the 09B3/4 slot on the record sheet.
14.3.44 Run query 09C and note the number of records on the record sheet in
slot 09C. This puts R2 data (with a precision id of 3) in the AQS RP TEMPLATE. These precision data correspond to duplicate data only.
14.3.45 Run query 09D1 (for nonmetals) and 09D2 (for metals) and note each on
the record sheet in slot 09D1/2. This puts R2 data into the AQS RP TEMPLATE. These precision data correspond to collocate data only (and uses a precision id of 2).
14.3.46 Total the number of records on the record sheet from slots 09A, B, C,
and D and enter into the Total in RP slot.
14.3.47 Run query 10A. This creates a copy of SAMPDATA + INVALIDS (minus blanks) and pastes into SAMPDATA + INVALIDS + R1R2. Note the number of records in the 10A slot on the record sheet. Run queries 10B and 10C. These append the replicate data (for all duplicates and collocates) into the SAMPDATA + INVALIDS + R1R2 table. Note the number of records in the 10B and 10C slots on the record sheet. These should be similar (or the same) as the number of records in the 08A and 08B slots. Run query 10D to append the replicates run on Field Samples, as described in 14.3.43. Note the number of records in the 10D slot on the record sheet. Total the number of records from 10A, B, C, and D and note in the Total in UATMP slot on the record sheet.
UNCONTROLLED ELECTRONIC COPY EFFECTIVE 10-2014

CONFIDENTIAL Standard Operating Procedure Procedure Number: ERG-MOR-098 Revision Number: 3 Revision Date: October 1, 2014 Page: 17 of 26
14.3.48 Run queries 11A and 11B. These append blank data for non-detect and detect non-metals into the AQS RB TEMPLATE table. Note the number of records in the 11A/B slot on the record sheet. Run queries 11C and 11D. These append blank data for non-detect and detect metals into the AQS RB TEMPLATE table. Note the number of records in the 11C/D slot on the record sheet. Total the number on the record sheet from slots 11A/B and 11C/D and note in the Total in RB slot. This number may match the number in the Total Excluded column on the record sheet (if the dataset didn’t contain any precision data, for example).
14.3.49 If an analyte co-elutes with another, the lab practice is to report it as
“ND”. However, this is not entirely accurate. All co-eluters have been flagged with a BH in the Qualifier-3 column of the AQS TEMPLATE table. Run query 12A to see if there are any co-eluters in the AQS RD Template table. Because BH is not a flag, but is a null code, AQS will not accept this coding. Run query 12B to 1) move the BH from the Qualifier-3 column to the null code column, 2) remove the 0 representing the ND, and 3) remove the ND flag. Note the number of records updated in the 12 slot on the record sheet and verify that the number of records from 12A match 12B.
14.3.50 Run query 13 to check for any instances of multiple qualifier codes and
resolve any results by manually splitting the codes into different Qualifier columns. Note the number of records in the 13 slot on the record sheet.
14.3.51 Run query 14A and 14B to do the same thing to the AQS RB Template
table for co-eluters as step 14.3.50. Note the number of records updated in the 14 slot on the record sheet and verify that the number of records from 14A match 14B.
14.3.52 Run query 15a, 15b, and 15c to create data tables for acrolein,
dichloromethane, and select GHGs as requested by the Project Manager. These tables need to be exported to Microsoft Excel and emailed to the Project Manager for a separate can study. Note the number of records on the record sheet for the 15 slot.
14.3.53 Run query 16 to add the LK flag to the Oklahoma sites’ acetonitrile data.
This was requested by the state as they recognize that their acetonitrile data periodically exhibits contamination issues.
UNCONTROLLED ELECTRONIC COPY EFFECTIVE 10-2014

CONFIDENTIAL Standard Operating Procedure Procedure Number: ERG-MOR-098 Revision Number: 3 Revision Date: October 1, 2014 Page: 18 of 26
14.4 Quality Assurance of the Raw Data in the “Macro” Database
14.4.1 To begin QA of the entire process, perform a manual QA of the data. Select data from the SAMP + INV + R1R2 table and write it down for a representative number of samples. Obtain the appropriate AQS codes for the method, parameter, etc., from the reference tables then use Queries QA 00a-c to visually verify that the coding is correct. These queries put in the site code, which makes it easier to find data by site. Pay special attention to any flags of interest that may have been needed for the dataset. Additionally, Query QA 00 can be used to specifically query blank sample data in the SAMP + INV table.
14.4.2 Skip Queries QA 01-02a/b and run Query QA 04 and 05 (01 through 02 are run by running Query 04-05). If the right two columns are fully populated for Query QA 04 and no results appear in 05, move to step 14.4.3. Otherwise, there is a discrepancy between the number of samples in the WORKLIST TEMPLATE and SAMP + INV + R1R2 tables that must be investigated before proceeding.
14.4.3 Run Queries QA 06-10. These queries make two tables, QA1 Dup Data
and QA2 Worklist Data. QA2 is essentially a worklist that includes replicate sample information (WORKLIST TEMPLATE does not). Run Query QA 13 and 16, skipping the ones in between. These compare the number of samples in the new table QA2 Worklist Data to the number of samples in SAMP + INV + R1R2, including replicates. The number of samples for each site/method should match. If they do not, this must be reconciled, and Queries QA 16a-c may be used to try to locate any differences.
14.4.4 Run Query QA 17 and 18. These compare the number of samples in the
WORKLIST TEMPLATE to the number of samples in AQS RD TEMPLATE for primary raw data only. The number for each site/method should match. If they do not, this must be reconciled, and Queries QA 16a-c may be used to locate any differences. Note Query QA 18 selects one pollutant from each method to “represent” a sample for each method.
14.4.5 Run Query QA 19 and 20a or 20b. These compare the number of
precision samples in the new table, QA2 Worklist Data, to the number of precision samples in AQS RP TEMPLATE. Query 20a includes each individual replicate dates while Query QA 20b provides a count of dates. The number for each site/method should match. If they do not, this must be reconciled; Queries QA 16a-c may be used to locate any differences. Note: Because non-detect results are not included in precision data,
UNCONTROLLED ELECTRONIC COPY EFFECTIVE 10-2014

CONFIDENTIAL Standard Operating Procedure Procedure Number: ERG-MOR-098 Revision Number: 3 Revision Date: October 1, 2014 Page: 19 of 26
many hex chrome replicates do not go in AQS RP TEMPLATE. Use Query QA 16b to confirm.
14.4.6 Run through Queries QA 21a-e. These queries look for duplicate
records in the SAMP + INV + R1R2, AQS RD TEMPLATE, AQS RP TEMPATE, Worklist Template, and AQS RB TEMPLATE tables. Any duplicates must be reconciled before moving forward.
14.4.7 Run Queries QA 22 and 23 or 23b. These compare the number of blank
samples in the WORKLIST TEMPLATE to the number of blank samples in AQS RB TEMPLATE. Query QA23 has separate queries, the first pulls all blanks and dates, while query QA 23b performs a count per site and method, similar to step 14.4.5. The number for each site/method should match. If they do not, this must be reconciled, and Queries QA 16a-c may be used to try to locate any differences.
14.4.8 Run Query QA 24. This query verifies that all invalid samples have a
null code. Results that appear in the results of the query must be given a null code.
14.4.9 Run Query QA 25a. This query confirms whether the correct MDLs are
applied to the VOC and SNMOC samples, which is occasionally a problem at the beginning of a new calendar year. MDLs that are different due to dilutions do not need to be corrected. Query QA 25b can be used to review data for certain pollutants. If changes are needed, run Query QA 25c, which creates a table of all MDLs for these methods. Query QA 25e1 is used to check for samples that need updating and Query 25e2 is used to update the erroneous MDLs to the correct MDLs in the SAMP + INV + R1R2 table. Query QA 25f1 and 25f2 perform similar queries on the AQS RD TEMPLATE table. The counts of these two queries should be identical. Run Query 25g, which is identical to Query 25a, and confirms that there is only one MDL listed per pollutant.
14.4.10 Run Query QA 26a to look for any R2s associated with invalid D2s and
valid D1s. These should not be loaded into AQS. Run Query QA 26b to confirm that they were not added to the AQS RP TEMPLATE. If coded properly, no records should appear.
14.4.11 Run Query QA 27 to look for instances of multiple AQS flags in a single
Qualifier flag column. Separate any flags that appear by manually adding the second flag to a new Qualifier flag column (such as Qualifier-4, if empty).
UNCONTROLLED ELECTRONIC COPY EFFECTIVE 10-2014

CONFIDENTIAL Standard Operating Procedure Procedure Number: ERG-MOR-098 Revision Number: 3 Revision Date: October 1, 2014 Page: 20 of 26
14.4.12 Run Query QA 28 to check for results in scientific notation in the Sampdata + Inv + R1R2 table. Step 14.3.29 runs a similar query (Query 04D) on the Sampdata + Invalids table.
14.4.13 Ask another AQS coder to review the files to visually inspect that each
file type matches the transaction type (RD, RP, etc). This reviewer shall compare at least one non-ND result for every method contained in each AQS file to the individual reports sent to the clients by the Project Manager to serve as an outside review, per Section 16.0. Both the primary AQS coder and the secondary reviewer should fill out and sign the AQC Quality Control Review Checklist (shown in Figure 24-2) in the AQS binder.
14.5 Creating and Loading Audit Results into AQS
14.5.1 Obtain ERG’s quarterly NAAQS FEM Audit Results data in spreadsheet
format from the QA Coordinator. Copy and paste the audit results into a new tab. Remove any excess spacing. Inset header information into new columns per the example shown in Figure 24-3.
14.5.2 In the Macro database, delete any data in the AQS RA Template table
and the Audit Results table. Import the data from the new tab in the audit spreadsheet into the Audit Results table.
14.5.3 Run Query ZAudit 01 to append the results from the Audit Results table
into the AQS RA Template table. 14.5.4 Copy the high-level results from the 1st Actual Value and 1st Indicated
Value columns and paste next to the low-level results in the 2nd Actual Value and 2nd Indicated columns.
14.5.5 Run Query ZAudit 02 to delete the high-level result rows that are no
longer needed. 14.5.6 Run Query ZAudit 03 to reduce the Indicated results down to three
decimal places. Confirm that trailing zeros were not removed; add back in if needed.
14.5.7 Export to text and ask a reviewer to QA the text file. 14.5.8 Load the text files into AQS via the Exchange Network Services Center.
Correct any load errors necessary. Update the Black Lab Notebook for AQS.
UNCONTROLLED ELECTRONIC COPY EFFECTIVE 10-2014
CONFIDENTIAL Standard Operating Procedure Procedure Number: ERG-MOR-098 Revision Number: 3 Revision Date: October 1, 2014 Page: 21 of 26
14.6 Exporting and Loading Raw Data into AQS
14.6.1 Compare and Compact Macro database. 14.6.2 Create a new “QX 20XX AQS” database.
14.6.3 Export the AQS TEMPLATE tables to this database from the Macro
database.
14.6.4 Design Make Table and Delete queries to remove any data that doesn’t need AQS upload. Design Make Table queries for any sites that want data sent to them directly. There’s an electronic copy identifying such data at L:\Jaime\AQS\AQS Special Requests List.xls (Figure 24-4). These queries may be imported from other AQS databases and rerun.
14.6.5 After approval from the secondary review (per Step 14.4.13, export each
RD, RP, RB, and/or RA TEMPLATE table to text by right-clicking on each table, selecting EXPORT; select TEXT as the file type and adjust file name as necessary; click on OK; select DELIMITED and then NEXT; choose OTHER and add the “|” character and chose NONE for the TEXT QUALIFIER then select NEXT; then hit FINISH. Review each file.
14.6.6 Load the text files into AQS via the Exchange Network Services Center.
Correct any load errors until the data are approved in AQS and post the files for public access.
14.6.7 Update the Black Lab Notebook for AQS (notebook # 00329 as of this
revision). Append the WORKLIST TEMPLATE and SAMP + INV + R1R2 tables from the MACRO database into the compiled database for the appropriate NMP reporting year.
15.0 CALCULATIONS
N/A
16.0 QUALITY CONTROL
Greater than 50 queries are located inside the Microsoft Access “Macro” database and are designed to provide a check of common errors (such as duplicate records) that may be encountered during the coding process. The AQS coder shall complete the AQS Quality Control Review Checklist upon completion of the procedures in Section 14.
UNCONTROLLED ELECTRONIC COPY EFFECTIVE 10-2014

CONFIDENTIAL Standard Operating Procedure Procedure Number: ERG-MOR-098 Revision Number: 3 Revision Date: October 1, 2014 Page: 22 of 26
A reviewer shall inspect the text files to be loaded into AQS by comparing the text files to the original reports sent to the clients by the Project Manager. The reviewer shall inspect one concentration above the detection limit per method per AQS text file and complete an AQS Quality Control Review Checklist after review, as specified in step 14.4.13. A hardcopy of the AQS Quality Control Review Checklist shall be maintained per the instructions in Section 22.0.
17.0 PREVENTION
N/A
18.0 CORRECTIVE ACTION N/A
19.0 WASTE MANAGEMENT
N/A
20.0 MAINTENANCE
N/A 21.0 SHORTHAND PROCEDURE
N/A
22.0 DOCUMENTATION AND DOCUMENT CONTROL
The latest version of the Macro and POC Table (for the reference tables) databases shall be posted on the L drive after every update. The current versions are posted at L:\Jaime\REFERENCES. The AQS Special Requests and AQS Record Sheet spreadsheets are also posted and kept up-to-date at L:\Jaime\AQS. The black AQS laboratory notebook (# 00329) shall be updated whenever data is uploaded into AQS or changes are made to existing data (and associated metadata) in AQS. This notebook shall be maintained per the laboratory’s record-keeping procedures. Hard copies of the AQS Quality Control Review Checklist are maintained in the white AQS binder for a minimum of one year. Afterwards, these hard copies shall be archived per the laboratories archival procedures.
UNCONTROLLED ELECTRONIC COPY EFFECTIVE 10-2014

CONFIDENTIAL Standard Operating Procedure Procedure Number: ERG-MOR-098 Revision Number: 3 Revision Date: October 1, 2014 Page: 23 of 26 23.0 REFERENCES
Information about EPA’s AQS database may be found at the following web address: http://www.epa.gov/ttn/airs/airsaqs/basic_info.htm
24.0 TABLES, DIAGRAMS, FLOWCHARTS, VALIDATION DATA
Figure 24-1. AQS Steps Record Sheet
DATASETIMPORT QCIMPORT SAMPIMPORT WORKUPDATE UNITSUPDATE ANALYSIS01020304TOTAL IN SAMP+ 050607A07BTOTAL IN AQSTOTAL EXCLUDED08A08B09A D2/C209B1/2 R109B3/4 R1 for FS09C R2 for D209D1/2 R2 for C2TOTAL IN RP10A10B10C10DTOTAL IN UATMP11A/B11C/DTOTAL IN RB1213141516
UNCONTROLLED ELECTRONIC COPY EFFECTIVE 10-2014

CONFIDENTIAL Standard Operating Procedure Procedure Number: ERG-MOR-098 Revision Number: 3 Revision Date: October 1, 2014 Page: 24 of 26 Data set: _______________________________
Date Coded: ____________________________
AQS Coder: ____________________________
Reviewer: ______________________________
Method/Pollutant Group Acceptance Criteria Coder Initials
and Date
Reviewer Initials and
Date Comments/Corrections Needed
IO-3.5 (Metals) Results above detection limit in AQS text file must agree with result reported to the client.*
Hexavalent Chromium Results above detection limit in AQS text file must agree with result reported to the client.*
TO-11A (Carbonyls) Results above detection limit in AQS text file must agree with result reported to the client.*
TO-15 (VOC) Results above detection limit in AQS text file must agree with result reported to the client.*
TO-13 (SVOC) Results above detection limit in AQS text file must agree with result reported to the client.*
SNMOC Results above detection limit in AQS text file must agree with result reported to the client.*
Other (Phenols, Methane, Audit Results, etc)
Results above detection limit in AQS text file must agree with result reported to the client.*
N/A = not applicable to this load *Reviewer checks 1 concentration per method per upload batch
Figure 24-2. AQS Quality Control Review Checklist
UNCONTROLLED ELECTRONIC COPY EFFECTIVE 10-2014

CONFIDENTIAL Standard Operating Procedure Procedure Number: ERG-MOR-098 Revision Number: 3 Revision Date: October 1, 2014 Page: 25 of 26
Audit Sample
ID Filter ID Analyte ERG Result Assigned Value %Recovery %Diff Audit ERG ID Date Analyzed Analyst Result#
RTI-2013-03-001 T2667962 Lead 2.837 2.963 95.8 -4.34 Q1 2014 3022208-10 3/11/2014 RM 1
RTI-2013-03-001 T2667953 Lead 2.703 2.963 91.2 -9.20 Q1 2014 3022208-11 3/11/2014 RM 2
RTI-2013-03-001 T2667955 Lead 2.875 2.963 97.0 -3.01 Q1 2014 3022208-12 3/11/2014 RM 3
RTI-2013-04-001 T2667982 Lead 8.801 8.994 97.8 -2.17 Q1 2014 3022208-22 3/11/2014 RM 1
RTI-2013-04-001 T2667994 Lead 8.894 8.994 98.9 -1.12 Q1 2014 3022208-23 3/11/2014 RM 2
RTI-2013-04-001 T2667996 Lead 8.691 8.994 96.6 -3.42 Q1 2014 3022208-24 3/11/2014 RM 3
Figure 24-3. Sample Lead Audit Header Information
UNCONTROLLED ELECTRONIC COPY EFFECTIVE 10-2014

CONFIDENTIAL Standard Operating Procedure Procedure Number: ERG-MOR-098 Revision Number: 3 Revision Date: October 1, 2014 Page: 26 of 26
Figure 24-4. AQS Special Requests List
UNCONTROLLED ELECTRONIC COPY EFFECTIVE 10-2014

UNCONTROLLED ELECTRONIC COPY EFFECTIVE 5-2015
CONFIDENTIAL Standard Operating Procedure Procedure Number: ERG-MOR-099 Revision Number: 2 Revision Date: May 4, 2015 Page: 2 of 14 3.0 METHOD DETECTION LIMIT
The LIMS system DataTool has a template called MDL Study that can be used to determine MDLs based on the same method used in ERG-MOR-010. Independent of how the MDLs are determined, the annual MDLs must be entered into LIMS from the QA Admin>Analysis Analyte screen. The entered MDLs are reviewed by QA staff prior to reporting. The MDL in LIMS will be multiplied by the dilution factor which is entered into the LIMS from the instrument file. If a sample is diluted, the MDL is multiplied by the dilution factor to obtain the actual MDL of the sample, since the concentration of the minimum detectable amount will become higher with each dilution.
4.0 SCOPE AND APPLICATION
All samples at the ERG laboratory are logged, tracked, batched, data uploaded, and reported using the LIMS. Samples received at the laboratory are logged into the LIMS following the procedures in the SOP for Sample Login to the Laboratory Information Management System, ERG-MOR-079. Not every step described in this SOP is applicable to every analytical method.
User access to the LIMS is graduated. People are granted permission only to the tasks they need.
5.0 METHOD SUMMARY
Samples at the ERG laboratory are logged, tracked, batched, data uploaded, and reported using the LIMS. The system records all sample data, information pertaining to each sample, and allows for data reporting. The LIMS also aids in the verification that the data meets the project needs with pre-set control limits.
6.0 DEFINITIONS COA Certificate of Analysis ERG Eastern Research Group ID Identification LIMS Laboratory Information Management System MDL Minimum Detection Limit NMP National Monitoring Program PM Project Manager QA Quality Assurance QAPP Quality Assurance Project Plan
UNCONTROLLED ELECTRONIC COPY EFFECTIVE 5-2015
CONFIDENTIAL Standard Operating Procedure Procedure Number: ERG-MOR-099 Revision Number: 2 Revision Date: May 4, 2015 Page: 3 of 14 QC Quality Control RPD Relative Percent Difference SOP Standard Operating Procedure TL Task Lead 7.0 INTERFERENCES
N/A 8.0 SAFETY
N/A 9.0 EQUIPMENT
Promium® Element Laboratory Management Systems (LIMS) for commercial and public sector soil, water, air testing laboratories.
10.0 MATERIALS
N/A
11.0 CHEMICALS, REAGENTS, AND STANDARDS
Information for prepared or commercially-bought standards can be entered and tracked by a LIMS-generated standard ID number in the Standards section of the Laboratory menu. Vendor certificates of analysis (COA) can be scanned, imported, and linked with the appropriate standards (SOP ERG-MOR-022).
12.0 COLLECTION, PRESERVATION, SHIPMENT, AND STORAGE
Collection, preservation, shipment, and storage information for samples received at the laboratory are logged into the LIMS following the procedures in the SOP for Sample Login to the Laboratory Information Management System, ERG-MOR-079.
13.0 CALIBRATION AND STANDARDIZATION
Calibrations can be entered into Calibration under the Laboratory menu; however, the individual chromatographic software is considered to be more useful than the LIMS calibration section at this time.
UNCONTROLLED ELECTRONIC COPY EFFECTIVE 5-2015
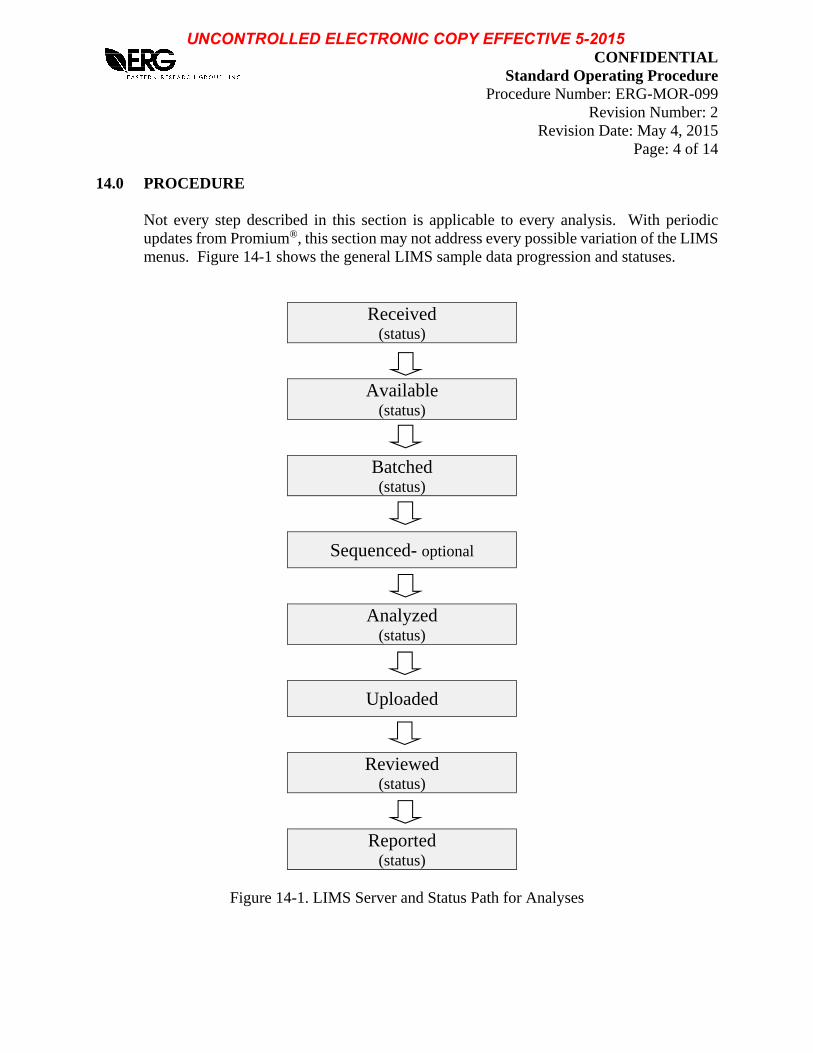
CONFIDENTIAL Standard Operating Procedure Procedure Number: ERG-MOR-099 Revision Number: 2 Revision Date: May 4, 2015 Page: 4 of 14 14.0 PROCEDURE
Not every step described in this section is applicable to every analysis. With periodic updates from Promium®, this section may not address every possible variation of the LIMS menus. Figure 14-1 shows the general LIMS sample data progression and statuses.
Received (status)
Available (status)
Batched (status)
Sequenced- optional
Analyzed (status)
Uploaded
Reviewed (status)
Reported (status)
Figure 14-1. LIMS Server and Status Path for Analyses
UNCONTROLLED ELECTRONIC COPY EFFECTIVE 5-2015

CONFIDENTIAL Standard Operating Procedure Procedure Number: ERG-MOR-099 Revision Number: 2 Revision Date: May 4, 2015 Page: 5 of 14
14.1 LIMS Batch Procedure
14.1.1 Log into Element. 14.1.2 If more than one batch of samples is “Available” use the Query
Analysis Status tool under the Laboratory menu. Query for available samples under the desired analysis, start by clicking Order Results By choosing Sampled and LabNumber. Select the desired number of samples choosing the oldest ones first unless otherwise specified.
14.1.3 From the Laboratory menu, select Batch. With the desired
department selected from the drop-down menu at the left of the screen, click Add at the bottom, left-hand corner. A blank batch sheet will appear. (You may choose to press Copy instead of Add. Use caution here, as the analysis, surrogates, and comments from the copied batch will be included in the new batch and this information may need to be changed.)
14.1.4 Using the drop down menus, fill in or confirm the Department,
Preparation Method, Batch Matrix, and any Surrogates used. Fill in the Comments field to include any additional information required.
14.1.5 Select the appropriate analysis from the Available analysis box and
press the right-facing arrow button. Be sure to select the analysis denoting the correct year when there are multiple choices, such as “TO-15 yyyy”, where yyyy is the year.
14.1.6 Press the Save button. The new LIMS-created batch number will be
visible in the box to the left of the screen. The numbering scheme BYMDDNN is as follows, the first field is the letter “B”. The second field is a number for the year, starting with “1” for 2011 and so on. The third field is a letter for the month of the year starting with “A” for January, the next two fields (fourth and fifth) are for day of the month, and lastly the last two fields (sixth and seventh) are for the batch # on that day.
14.1.7 Select Bench Sheet at the bottom of the screen or from the
Laboratory menu. To make modifications begin by clicking the Edit button at bottom of the window.
UNCONTROLLED ELECTRONIC COPY EFFECTIVE 5-2015

CONFIDENTIAL Standard Operating Procedure Procedure Number: ERG-MOR-099 Revision Number: 2 Revision Date: May 4, 2015 Page: 6 of 14
14.1.8 At the top of the screen, press Add and select Sample by Container. Select the samples from the list that you would like to include in the
batch. Take care to keep all primary and field blank sample pairs as well as duplicate pairs together in the same batch. Note: For some analyses, a maximum of twenty samples may be selected for any given batch. If more than 20 samples are selected, additional batch QC must also be added to the bench sheet and extracted to meet the method requirements.
14.1.9 Right click on a sample to bring up a menu, and select Initial. Fill in
the value for the total collection volume. This will be listed on the sample’s corresponding chain of custody, or calculated from the given flow and time values. Repeat this for each sample in the batch. Field blank samples are assigned the same volume as the primary sample collected on the same day.
14.1.10 From the right click menu choose Comments and fill in the site code
for each sample as it appears on the bench sheet including any C1, C2, or FB designations.
Note: For some analyses two spaces are required before entering comments for formatting reasons.
14.1.11 Each batch will need a number of QC samples included. The exact
requirements for batch QC will vary between analyses, but there are three common types that will be used. Each type of QC can be added to a batch using the Add command, but the most commonly used QC will be included in the batch automatically after samples are included for most analyses. QC samples will be named by the Batch ID followed by an identifying suffix with a numeral(x).
i. Blank Samples: Each batch will contain at least one Blank Sample
(-BLKx). Be sure to confirm the presence of any surrogates used in the analysis using the right click menu.
ii. Spiked Samples: Various types of spiked samples are used in
different analyses including Laboratory Control Spikes (-BSx), Matrix Spikes (-MSx), Matrix Spike Duplicates (-MSDx), and Post Spikes (-PSx). As with blank samples confirm any surrogates with the right click menu, but also include the Spike ID, Type and Amount for each spiking solution used.
UNCONTROLLED ELECTRONIC COPY EFFECTIVE 5-2015

CONFIDENTIAL Standard Operating Procedure Procedure Number: ERG-MOR-099 Revision Number: 2 Revision Date: May 4, 2015 Page: 7 of 14
iii. Duplicate Samples: Include one Duplicate (-DUPx) QC sample for each duplicate or collocated sample in the batch. Using the right click menu assign a Source sample to each Duplicate, and change the Initial volume to match that of the source sample.
14.1.12 Once all field sample, QC samples have been added and the required information has been updated, print any necessary copies of the bench sheet. If an extraction log is kept, store a copy of the bench sheet in it. A copy of the bench sheet is also kept with the chain of custodies for that batch.
14.2 LIMS Sequence Procedure
14.2.1 From the Laboratory menu, select Sequence. 14.2.2 Click Add at the top right, window labeled Template ID will appear.
Select the template for the desired method or choose cancel to continue without a template.
14.2.3 Click the pull-down menu for Source Batch and select a batch for
analysis. Next click Add and first select Batch QC Sample. This shows a list of all blanks, spikes, and duplicates. Select all the QC samples that will be run in the sequence and double click to add them to the sequence. Repeat this choosing Add again but selecting Batch Sample to add all desired LIMS samples. It is necessary to keep all primary/field blank pairs and duplicate sample pairs with all corresponding QC samples together in the same sequence.
14.2.4 In addition to Batch QC, Sequence QC must also be included. If using
a template the most common sequence QC will be added automatically but any QC sample can be manually added from the Add command.
14.2.5 Once all samples and QC are placed in a sequence they must be placed
in the desired run order as per method requirements, typically beginning with QC checks and then sets of samples broken up by additional running QC, and ending with any final QC.
14.2.6 After establishing a desired run order right click on any QC or
calibration standards and choose Standard ID, then double click on the LIMS standard used in the selected sample. If an internal standard is used select all samples in the sequence and select the correct Internal Standard ID using the right click menu. Any sample
UNCONTROLLED ELECTRONIC COPY EFFECTIVE 5-2015
CONFIDENTIAL Standard Operating Procedure Procedure Number: ERG-MOR-099 Revision Number: 2 Revision Date: May 4, 2015 Page: 8 of 14
prepared from an existing sample (such as PS, BS, or SRD) also needs the Source Sample defined using the right click menu.
14.2.7 Once completed, review the sequence for any omissions or errors,
make necessary corrections, and click the green Save button. 14.2.8 Print a copy of the sequence. File the sequence print out in the
appropriate location. The numbering scheme YYMMXXX is as follows, the first field is “YY” for the last two digits of the year. The second field is “MM” for the month number. The third field is “XXX” for the number of sequence in the order they are created starting with 001.
14.3 LIMS Data Upload Procedure
14.3.1 The sample data generated on the instruments is reduced by the analyst via instrument software. When data reduction is complete for a batch or sequence of samples, the analyst will transfer the data from the instrument computer to network server ‘bart’ (Y:). This server is backed-up daily.
14.3.2 To begin data upload onto LIMS, open Element. Go to the
Laboratory menu and click on Data Entry/Review. First choose the department of the analysis being uploaded from the drop down menu on the left, and then in the top left corner choose Sequence or Batch depending on the analysis. Select the desired sequence or batch from the list and click on Create in the Data Entry tab in the top right corner. Next click DataTool. In DataTool, select the appropriate File Type at the top right and choose y: [\\bart\airtoxics] under Drives. In the box below choose the folder containing the desired instrument data files.
14.3.5 All of the data files for that sequence will appear in the lower right-
hand box. Double-click on the appropriate data file/s or click Auto Select for each file that needs to be included in the sequence.
Note: Only undiluted samples and sequence QC should be included here.
14.3.6 Press Done when all sample and QC files have been selected to return
to the main window. Click Merge Files at the bottom of the window.
UNCONTROLLED ELECTRONIC COPY EFFECTIVE 5-2015

CONFIDENTIAL Standard Operating Procedure Procedure Number: ERG-MOR-099 Revision Number: 2 Revision Date: May 4, 2015 Page: 9 of 14
Data Tool will merge the files and show the data in the Data Transfer window.
Note: Review the content of the top windows in the Data Transfer window for red text indicating unmatched data. If there is any red text, the DataTool cross table requires editing. If possible, match the unmatched data and proceed. If needed, seek the advice of the TL or the LIMS administrator to correct this.
14.3.7 Press Save and save this new spreadsheet with any filename. 14.3.8 In Element, at the Data Entry/Review window, the merged data will
automatically be imported into the data entry table. Press Save to save the data to Element and then Query in the Data Review box. Element will perform all necessary calculations at this point.
14.3.9 In the Data Entry/Review window, samples and QC can be reviewed
for pass/fails. Any data that does not pass its assigned criteria will have red text. Use the Summary of Quality Control Procedures tables in the individual analytical SOPs or in Section 4.0 of the NMP QAPP to decide if criteria have been met and the appropriate corrective action (flagging data, voiding sample, etc.) have been applied. The possible data qualifiers are listed in Table 24-1. Change the Status to “Reviewed”.
14.4 After data is uploaded into LIMS, the data package is reviewed by TL using the
QA review checklist from the individual analytical SOPs. After which, 10% is reviewed by the QA staff using the same checklist. After the QA staff review, the data is ready for reporting.
14.5 Data reporting is to be done by the Project Manager (PM). The QA staff will
notify the PM when their review is complete. Samples marked “Reviewed” are available for final reporting.
14.6 LIMS Data Reporting Procedure
14.6.1 Go to the Project Management menu and click on Reports. 14.6.2 First choose the client and project of the data being reported from the drop
down menu on the top.
UNCONTROLLED ELECTRONIC COPY EFFECTIVE 5-2015

CONFIDENTIAL Standard Operating Procedure Procedure Number: ERG-MOR-099 Revision Number: 2 Revision Date: May 4, 2015 Page: 10 of 14
14.6.3 Choose a standard Format for the report and electronic data deliverable (EDD) or choose a Custom format for the report or the EDD.
14.6.4 Choose a Destination for the EDD and a printer for the report (PDF995). 14.6.5 On the left side of the screen, select the desired work orders. 14.6.6 Check the appropriate analysis box in the middle screen. 14.6.7 Next click Modified Final, if a note to mark the work order as “Closed”
comes up, press No. 14.6.8 Now choose the samples (and QC, if needed) to be reported in the window
that opens up and click Continue. The PDF report opens up. Save all but the last page of the report to the desired destination. The EDD, which is an Excel file, is generated at the same time and located in the destination chosen in a previous step.
14.6.9 Invalid samples are listed in the report letter to the client or as a separate
excel table. The reporting formats are templates and have been set up with certain required elements. These reports contain the data qualifiers, footnotes, MDLs, and final units assigned to the reported data. Data reporting is typically done monthly, with a month’s worth of samples reported for an individual site. A comprehensive annual NMP data report is prepared each year and includes data statistics, data characterization, and program-wide quality discussion.
15.0 CALCULATIONS When necessary, standardized procedures for transforming raw data from measured units to final concentrations use calculations listed in the individual analytical SOPs. These calculations were set up in the LIMS and verified annually by QA staff. The TO-15 and SNMOC initial and final units are the same, ppbv and ppbC, respectively. The TO-11A initial units are µg/mL and final units are ppbv. TO-13A has initial units of ng/µL and final units of ng/m3. The metals analysis has initial units of ng/L and final units of ng/m3. Hexavalent chromium has initial units of ng/mL and final units of ng/m3. Promium® provides a LIMS worksheet to validate algorithms that are utilized in the LIMS system to perform calculations, such the final results from the initial results, standard percent recovery, and RPD between replicate analyses. In the Print window,
UNCONTROLLED ELECTRONIC COPY EFFECTIVE 5-2015

CONFIDENTIAL Standard Operating Procedure Procedure Number: ERG-MOR-099 Revision Number: 2 Revision Date: May 4, 2015 Page: 11 of 14
press Analysis Info and choose the template “axi-validation”. These calculations are verified with hand calculations biannually by QA staff and documented.
16.0 QUALITY CONTROL
16.1 Each section in LIMS has an “Audit” button. Clicking this button will open a new window that displays the changes made in the applicable section. Element keeps track of the who, when, and what during the editing of information in the LIMS. Right-clicking the mouse in the audit window allows the information to be sorted in various ways and also allows the audit information to be exported or printed.
16.2 Data quality criteria are addressed in the individual analytical SOPs. Data quality
and data reduction is reviewed by the TL and 10% of the data is subsequently reviewed by QA staff.
16.3 Data reports are reviewed by the PM prior to being sent to the client.
Note: If requested by a client, uncertainty values can be entered into the Analysis/Matrix screen.
17.0 PREVENTION
N/A
18.0 CORRECTIVE ACTION Promium® updates are available for the LIMS software automatically and occur often. See the LIMS administrator for any LIMS issues.
19.0 WASTE MANAGEMENT
N/A
20.0 MAINTENANCE
The LIMS system is under an annual service contract with Promium® maintained by the Office Manager. The LIMS administrator is responsible for supporting the periodic updates initiated by Promium®. The Promium updates are first uploaded to an updates folder, then into the LIMS. The updates are uploaded after the monthly reports go out to give the administrator time to fix any potential issues found during testing. The current version number is located at the top of the dashboard.
UNCONTROLLED ELECTRONIC COPY EFFECTIVE 5-2015

CONFIDENTIAL Standard Operating Procedure Procedure Number: ERG-MOR-099 Revision Number: 2 Revision Date: May 4, 2015 Page: 12 of 14 21.0 SHORTHAND PROCEDURE
N/A
22.0 DOCUMENTATION AND DOCUMENT CONTROL
N/A
23.0 REFERENCES
Element Datasystem User’s Manual, Promium®, LLC Promium website, www.promium.com; also available on the Help menu in the LIMS system.
24.0 TABLES, DIAGRAM, FLOWCHARTS, VALIDATION DATA Table 24-1. List of LIMS Data Qualifiers
Qualifier Description
9 Negative value detected – Zero reported A-01 (Custom Value) B Analyte is found in the associated blank as well as in the sample. (CLP B-flag) B-01 Value is laboratory reagent-blank subtracted.
B-02 Method Blank value exceeds MDL due to background from filter media. Acceptable LRB analysis data indicates the batch was not contaminated.
B-04 Value is laboratory method blank subtracted. BS-01 Recovery is biased due to high humidity. C-02 This result was determined using the calibration from the confirmation column. CE Not reportable due to a co-eluting compound. D This result obtained by dilution. D-01 This result obtained by diluting and reanalyzing the sample. D-F Duplicate exceeds DQO criteria.
D-R Duplicate RPD greater than 20%; however, parent sample and duplicate values are less than 10 times the MDL.
E The concentration indicated for this analyte is an estimated value above the calibration range of the instrument. This value is considered an estimate. (CLP E-flag)
GC-BS Compound exceeds Blank Spike criteria.
I-01 Due to matrix interference, the sample cannot be accurately quantified. The reported result is qualitative.
I-02 This result is outside of the EPA recommended holding time.
UNCONTROLLED ELECTRONIC COPY EFFECTIVE 5-2015

CONFIDENTIAL Standard Operating Procedure Procedure Number: ERG-MOR-099 Revision Number: 2 Revision Date: May 4, 2015 Page: 13 of 14 Table 24-1. List of LIMS Data Qualifiers (continued)
Qualifier Description
I-03 Polyatomic interference in ICS standard. Interferent not present in significant levels in samples.
ICS-01 Interference check exceeds criteria. INT Not reportable due to interference.
J Detected but below the Reporting Limit; therefore, result is an estimated concentration. (CLP J-Flag)
L-01 Analyte exceeds HSV criteria. Sample concentrations below the CCV value are accepted based on acceptable CCV recovery.
LK Analyte identified; Reported value may be biased high. LL Analyte identified; Reported value may be biased low.
MS-01 Non-homogeneous matrix interference. Serial Dilution and /or Post spike verifies parent sample value.
NC Analyte could not be confirmed using the confirmation column. O-01 This compound is a common laboratory contaminant.
O-02 Due to matrix interference, the sample cannot be accurately quantitated. The reported result is qualitative.
O-03 The concentration reported is an estimated value above the linear quantitation range. Dilution and reanalysis is being performed and an amended report will follow.
O-04 This sample was analyzed outside the EPA recommended holding time. O-05 This sample was extracted outside the EPA recommended holding time. PRELIM Preliminary result. Revised report to follow. PS-01 Post spike exceeds DQO criteria. PS-02 Post spike was outside of the control limits due to matrix interference. QB-01 Compound fails method blank criteria
QB-02 The method blank contains analyte at a concentration above the MRL; however, concentration is less than 10% of the sample results, which is negligible according to method criteria.
QM-01 The spike recovery for this QC sample is outside of established control limits due to sample matrix interference.
QM-05 The spike recovery was outside acceptable limits for the MS and /or MSD due to matrix interference. The LCS and /or LCSD were within acceptable limits showing that the laboratory is in control and the data is acceptable.
QM-06 Due to noted non-homogeneity of the QC sample matrix, the MS/MSD did not provide reliable results for accuracy and precision. Sample results for the QC batch were accepted based on LCS/LCSD percent recoveries and RPD values.
QM-07 The spike recovery was outside acceptance limits for the MS and/or MSD. The batch was accepted based on acceptable LCS recovery.
UNCONTROLLED ELECTRONIC COPY EFFECTIVE 5-2015

CONFIDENTIAL Standard Operating Procedure Procedure Number: ERG-MOR-099 Revision Number: 2 Revision Date: May 4, 2015 Page: 14 of 14 Table 24-1. List of LIMS Data Qualifiers (continued)
Qualifier Description
QM-4X The MS/MSD recovery exceeds criteria because the parent sample concentration is greater than 4 times the spike concentration. Sample results for the QC batch were accepted based on acceptable BS/BSD recoveries.
R-F Replicate exceeds DQO criteria.
S-01 The surrogate recovery for this sample is not available due to sample dilution required from high analyte concentration and/or matrix interference.
S-02 The surrogate recovery for this sample cannot be accurately quantified due to interference from coeluting organic compounds present in the sample extract.
S-04 The surrogate recovery for this sample is outside of established control limits due to a sample matrix effect.
S-06 The recovery of this surrogate is outside control limits due to sample dilution required from high analyte concentration and/or matrix interference.
S-DUP Duplicate analysis confirmed surrogate failure due to matrix effects. S-FS These surrogates are not spiked in the method blank(s) or blank spike(s).
S-GC Surrogate recovery outside of control limits. The data was accepted based on valid recovery of the remaining surrogate.
S-HI High surrogate recovery was confirmed as a matrix effect by a second analysis.
S-LIM Surrogate recoveries outside method QC limits. Site matrix effects verified by 10% duplicate analysis (including sample duplicate and MS/MSD analysis).
S-LOW Low surrogate recovery confirmed as a matrix effect by a second analysis.
S-MS Surrogate recovery outside of acceptance window confirmed as matrix effect by analysis of MS/MSD on this sample.
S-QC The Surrogate result exceeded the QC limits; however, the percent recovery was acceptable. Sample results for the QC batch were accepted based on percent recoveries of the QC data.
SRD-01 Serial dilution exceeds the control limits. S-Rec Sample received by laboratory outside of initial extraction hold time – 14 days. U Under detection limit. Z-01 (Custom Value)
UNCONTROLLED ELECTRONIC COPY EFFECTIVE 5-2015

Appendix B
DRI Standard Operating Procedures

DRI STANDARD OPERATING PROCEDURE Page: 2 of 29 Date: 10/03/14 Title: X-Ray Fluorescence (XRF) Analysis of Number: 2-209.8 Aerosol Filter Samples (PANalytical Epsilon 5) Revision: 8
1. GENERAL DISCUSSION
1.1 Purpose of procedure
This standard operating procedure is intended to:
provide a very basic understanding of the principles of X-Ray Fluorescence (XRF) analysis;
describe a method for the determination of elemental concentrations from ambient and source aerosol filter samples using the PANanlytical Epsilon 5 XRF analyzer;
detail the concerns and procedures which will ensure a state-of-the-art XRF analysis measurement process.
This procedure will be followed by all analysts at the Environmental Analysis Facility of the
Division of Atmospheric Sciences of the Desert Research Institute.
1.2 Measurement principle
Analysis of aerosol filter samples using the PANalytical Epsilon 5 XRF analyzer is based on energy dispersive x-ray fluorescence of elemental components in a thin film sample. The emissions of x-ray photons from the sample are integrated over time and yield quantitative measurements of elements ranging from aluminum (Al) through uranium (U) and semi-quantitative measurements of sodium (Na) and magnesium (Mg). A spectrum of X-ray counts versus photon energy is acquired and displayed during analysis, with individual peak energies corresponding to each element and peak areas corresponding to elemental concentrations. The advantages of XRF analysis include high sensitivity for a number of elements, the ability to analyze small quantities of sample, and the non-destructive nature of the analysis. In addition, because x-ray fluorescence depends on the quantum absorption and emission of photons at the M, L, and K orbitals, the technique is insensitive to the chemical state of the elements. Disadvantages include the subjection of the sample to a vacuum, resulting in loss of some volatile species such as hydrocarbons, ammonia, nitrate, chlorine, and bromine.
The source of x-rays in the PANalytical Epsilon 5 analyzer is a side window dual anode x-ray tube
with both Scandium (Sc) and Tungsten (W) anodes. X-rays are focused on one of 11 secondary targets which in turn emit polarized x-rays used to excite a sample. X-rays from a secondary target are absorbed by the sample, exciting electrons to high level orbitals. As the electrons return to their ground state, photons are emitted which are characteristic of the quantum level jumps made by the electron; the energy of the emitted photons are, therefore, characteristic of the elements contained in the sample. The fluoresced photons are detected in a solid state Germanium X-ray detector. Each photon that enters the detector generates an electrical charge whose magnitude is proportional to the photon's energy. The electrical signals from the detector are sorted into energy channels, counted, and displayed. A sample spectrum consists of characteristic peaks superimposed on a background caused by the scatter of x-rays from the tube into the detector. Spectra are collected for a specified length of time and stored on disk for later processing.
DRI uses seven different analysis conditions during a single analysis run to maximize sensitivity to
the full range of elements reported. Each of the analysis conditions, which correspond to different

DRI STANDARD OPERATING PROCEDURE Page: 3 of 29 Date: 10/03/14 Title: X-Ray Fluorescence (XRF) Analysis of Number: 2-209.8 Aerosol Filter Samples (PANalytical Epsilon 5) Revision: 8
secondary targets, x-ray tube voltage and current, and energy detection range, is designed for a specific group of elements.
1.3 Measurement interferences and their minimization
The XRF is subject to measurement uncertainties from:
Too much deposit material. Because DRI's XRF analysis and data processing programs for aerosol samples are designed specifically for thin films, x-ray spectra are subject to distortion if unusually heavy deposits are analyzed. This is due to internal absorption of both incident and emitted x-rays within the samples. Optimum loading is ~150 μg/cm2 (1 mg/filter for 37 mm filters and 2 mg/filter for 47 mm filters). Adjustments in filter deposit area and sampling time and flow should be made to insure deposits are within this range.
Too little deposit material. At low concentrations counting statistics and signal noise will dominate the calculations of elemental concentrations. Adjustments in filter deposit area and sampling time and flow should be made to insure deposits are at least 15 μg/cm2.
Inhomogeneous deposits. The x-ray beam is focused on an area ~ 9 x 16 mm in the center of the filter. The results are extrapolated to the entire deposit area of the filter during data processing. Therefore, the center of the filter must be representative of the entire deposit. This effect is minimized by using the sample spinner during analysis which rotates the sample cup at 12 rpm.
Large particles. Absorption of both incident and emitted x-rays occurs in the presence of large particles. This particularly affects the light elements (Na through sulfur [S]). In addition, large particles may be enriched in certain elements and may bias results in the same matter as inhomogeneous deposits.
Filter thickness. Increased x-ray scattering is caused by increased filter thickness, increasing in turn the spectral background and causing problems for accurate background subtraction and quantification of elements at low concentrations. Additional uncertainties are introduced if filter thickness varies considerably within a lot, again making accurate background subtractions difficult. The solutions to these problems include using filters from a reputable manufacturer (e.g., Pall, Whatman, MTL), including blanks from each manufacturing lot in the formulation of background/blank spectra, and inspecting each filter over a light table before use.
Background contamination. While small levels of contaminations may be corrected during blank subtraction, such contaminations rarely are at consistent levels, and uncertainties can be relatively high, particularly if the contaminants correspond to elements of interest. Using filters from reputable manufacturers and performing acceptance tests on all manufacturing lots will reduce the affect of contaminations.
Filter types. The DRI XRF analysis and data processing procedures are primarily oriented toward Teflon membrane filters, which are analytically clean, are thin to reduce scattering, and have known pore size and particle collection efficiencies. Historically, glass or quartz fiber filters have been used for Total Suspended Particulate (TSP) or PM10 monitoring. These filters may be analyzed but, due to their composition, render analysis results for light elements

DRI STANDARD OPERATING PROCEDURE Page: 4 of 29 Date: 10/03/14 Title: X-Ray Fluorescence (XRF) Analysis of Number: 2-209.8 Aerosol Filter Samples (PANalytical Epsilon 5) Revision: 8
meaningless. Since particles are trapped within the filter matrix of quartz or glass-fiber filters, x-ray absorption within the filter fibers adds additional uncertainty. In addition, blank contamination levels and variations among manufacturers and manufacturing lots can be orders of magnitude higher for glass or quartz-fiber filters than for Teflon. Recommended filters are Teflon membrane filters from Pall or Whatman.
Damaged filters. Uncertainties in results from analyzing the damaged portion of a filter are obvious. However, the x-ray signal is heavily dependent upon distance of the filter from the x-ray tube and from the detector. If filter is damaged so as to cause sagging or puckering which changes these distances, analysis results will also be affected.
1.4 Ranges and typical values of measurements obtained by this procedure
A wide range of aerosol concentrations can be measured with this method, provided adjustments to
deposit area and sampling flow and time are made to insure optimum loading on the filters (~150 μg/cm2). Filter loadings between 15 and 1000 μg/cm2 may be used, but results for heavily loaded samples may require manual corrections during data processing and results for lightly loaded filters will have concentrations below detection limits for many elements.
1.5 Typical lower quantifiable limits
The lower quantifiable limits (LQLs) of DRI's XRF analysis depend on a number of factors,
including type of filter media, manufacturer of filter media, consistency of filters with respect to thickness and background contaminations, analysis counting time, analysis conditions, and element. Typical three sigma minimum detection limits for Teflon membrane filters are presented in Table 1-1.
Precision is determined largely by the homogeneity of the filter deposit, rather than the analyzer
itself. DRI specifications call for ±10% on each element or within ±3 times the analytical uncertainties, whichever is larger. The analytical uncertainties are propagated from the counting statistics of the elemental peaks and background spectra.
1.6 Responsibilities of personnel for carrying out portions of this procedure
All analysts in the laboratory should read and understand the entire standard operating procedure
prior to performing XRF analysis, which includes system operation, actual analysis, data processing, and immediate review of the QA data as it is produced to correct system problems.
It is the responsibility of the XRF supervisor to ensure the XRF analyses procedures are properly
followed, to examine and document all replicate, QA standards, calibration results, and acceptance test data, to designate samples for reanalysis, to arrange for maintenance and repair, to maintain the supplies and gases necessary to insure uninterrupted analysis, and to deliver the analysis results to the project manager within the specified time period.

DRI STANDARD OPERATING PROCEDURE Page: 5 of 29 Date: 10/03/14 Title: X-Ray Fluorescence (XRF) Analysis of Number: 2-209.8 Aerosol Filter Samples (PANalytical Epsilon 5) Revision: 8
Table 1-1. MDLs.
MDL
(µg/cm2) MDL
(µg/cm2) MDL
(µg/cm2) Na 0.204 Cu 0.002 Sb 0.023 Mg 0.176 Zn 0.004 Cs 0.036 Al 0.038 Ga 0.006 Ba 0.042 Si 0.009 As 0.004 La 0.048 P 0.006 Se 0.002 Ce 0.090 S 0.001 Br 0.002 Sm 0.087 Cl 0.003 Rb 0.001 Eu 0.071 K 0.006 Sr 0.002 Tb 0.071 Ca 0.014 Y 0.002 Hf 0.032 Sc 0.057 Zr 0.006 Ta 0.018 Ti 0.007 Nb 0.005 W 0.013 V 0.001 Mo 0.003 Ir 0.006 Cr 0.002 Pd 0.012 Au 0.007 Mn 0.003 Ag 0.006 Hg 0.006 Fe 0.002 Cd 0.005 Tl 0.004 Co 0.002 In 0.009 Pb 0.004 Ni 0.002 Sn 0.013 U 0.005
1.7 Definitions
MLK Lines: A series of x-ray lines corresponding to electron transitions to the M, L.
and K orbitals. Secondary Target: A metal foil upon which the primary x-rays from the x-ray tube are
focused. Emission of "secondary" x-rays are in turn focused on the sample to be analyzed.
1.8 Related procedures
SOP's related to XRF analysis activities which should be reviewed in conjunction with this
document are:
DRI SOP #6-014r1 Laboratory Ethics.
DRI SOP #6-015r1 Demonstration of Capability.
Any SOP's dealing with filter handling and shipping in conjunction with the specific sampling method used.
DRI SOP #6-013r0 Creation, Revision, Distribution, and Archiving of Standard Operating Procedures.

DRI STAN Title: X-R Aero
The progr
2. A
2.1 A
T(Fsaalin
NDARD OPER
Ray Fluorescencosol Filter Sam
ramming, mai
APPARATUS
Apparatus an
The PANalyticFigure 2-1) aample changellows almost n the queue w
RATING PROC
ce (XRF) Analymples (PANalyt
ntenance, and
S, INSTRUM
nd instrumen
cal Epsilon 5and the comper and a sampcontinuous a
while an analy
Figure 2
CEDURE
ysis of tical Epsilon 5)
d troubleshoot
MENTATION
ntation
5 EDXRF anputer workstale chamber th
analysis of samsis is taking p
2-1. PANalyt
ting manuals f
N, REAGEN
alyzer contaiation. The Xhat can hold umples by alloplace in the is
tical Epsilon
for the PANal
TS, AND FO
ins two mainXRF cabinet up to 51 sampowing operatsolated analys
n 5 x-ray cabi
PagDat
Nu Rev
lytical Epsilon
ORMS
n componentsincludes an
ples. The largtors to load ansis chamber.
inet.
ge: 6 of 29ate: 10/03/umber: 2-209.vision:
n 5 system.
s, the XRF caintegrated ro
ge sample chand unload sam
9 /14 .8 8
abinet obotic amber mples

DRI STANDARD OPERATING PROCEDURE Page: 7 of 29 Date: 10/03/14 Title: X-Ray Fluorescence (XRF) Analysis of Number: 2-209.8 Aerosol Filter Samples (PANalytical Epsilon 5) Revision: 8
2.1.1 Characterization
The PANalytical EDXRF analyzer running under DRI’s analysis protocol uses seven different excitation conditions to maximize sensitivity to select groups of elements (see Table 2-1). Each sample is placed in the analysis chamber and analyzed under a vacuum.
Table 2-1. Summary of Epsilon 5 analysis conditions.
Z Element Condition Analysis time Line ROI (LL)
Kev ROI (UL)
Kev Secondary target kV mA 11 Na @CaF2 400 Ka 0.983 1.098 CaF2 25 24 12 Mg @CaF2 400 Ka 1.195 1.313 CaF2 25 24 13 Al @CaF2 400 Ka 1.426 1.547 CaF2 25 24 14 Si @CaF2 400 Ka 1.677 1.802 CaF2 25 24 15 P @CaF2 400 Ka 1.945 2.075 CaF2 25 24 16 S @CaF2 400 Ka 2.242 2.376 CaF2 25 24 17 Cl @CaF2 400 Ka 2.552 2.690 CaF2 25 24 19 K @CaF2 400 Ka 3.239 3.386 CaF2 25 24 20 Ca @Fe 300 Ka 3.614 3.767 Fe 40 15 21 Sc @Fe 300 Ka 4.011 4.170 Fe 40 15 22 Ti @Fe 300 Ka 4.415 4.603 Fe 40 15 23 V @Fe 300 Ka 4.853 5.046 Fe 40 15 24 Cr @Fe 300 Ka 5.310 5.510 Fe 40 15 25 Mn @Ge 300 Ka 5.792 5.998 Ge 75 8 26 Fe @Ge 300 Ka 6.292 6.505 Ge 75 8 27 Co @Ge 300 Ka 6.814 7.033 Ge 75 8 28 Ni @Ge 300 Ka 7.358 7.585 Ge 75 8 29 Cu @Ge 300 Ka 7.920 8.153 Ge 75 8 30 Zn @Ge 300 Ka 8.504 8.747 Ge 75 8 31 Ga @Mo 300 Ka 9.112 9.363 Mo 100 6 33 As @Mo 300 Ka 10.390 10.661 Mo 100 6 34 Se @Mo 300 Ka 11.064 11.344 Mo 100 6 35 Br @Mo 300 Ka 11.755 12.047 Mo 100 6 37 Rb @Mo 300 Ka 13.208 13.525 Mo 100 6 38 Sr @Mo 300 Ka 13.967 14.296 Mo 100 6 39 Y @Mo 300 Ka 14.748 15.092 Mo 100 6 40 Zr @Ag 300 Ka 15.554 15.912 Ag 100 6 41 Nb @Ag 300 Ka 16.382 16.755 Ag 100 6 42 Mo @Ag 300 Ka 17.233 17.623 Ag 100 6 46 Pd @CeO2 300 Ka 20.866 21.331 CeO2 100 6 47 Ag @CeO2 300 Ka 21.833 22.320 CeO2 100 6 48 Cd @CeO2 300 Ka 22.824 23.333 CeO2 100 6 49 In @CeO2 300 Ka 23.839 24.373 CeO2 100 6 50 Sn @CeO2 300 Ka 24.878 25.437 CeO2 100 6 51 Sb @CeO2 300 Ka 25.942 26.528 CeO2 100 6

DRI STANDARD OPERATING PROCEDURE Page: 8 of 29 Date: 10/03/14 Title: X-Ray Fluorescence (XRF) Analysis of Number: 2-209.8 Aerosol Filter Samples (PANalytical Epsilon 5) Revision: 8
Table 2-1. Continued.
Z Element Condition Analysis time Line ROI (LL)
Kev ROI (UL)
Kev Secondary target kV mA 55 Cs @CeO2 300 Ka 4.182 4.375 CeO2 100 6 56 Ba @Al2O3 300 Ka 31.633 32.379 Al2O3 100 6 57 La @Al2O3 300 Ka 32.847 33.630 Al2O3 100 6 58 Ce @Al2O3 300 Ka 34.089 34.911 Al2O3 100 6 62 Sm @Al2O3 300 Ka 39.319 40.322 Al2O3 100 6 63 Eu @Al2O3 300 Ka 40.696 41.750 Al2O3 100 6 65 Tb @Al2O3 300 Ka 43.532 44.696 Al2O3 100 6 72 Hf @Mo 300 La 7.739 8.006 Mo 100 6 73 Ta @Mo 300 La 7.981 8.254 Mo 100 6 74 W @Mo 300 La 8.227 8.507 Mo 100 6 77 Ir @Mo 300 La 8.987 9.287 Mo 100 6 79 Au @Mo 300 La 9.514 9.827 Mo 100 6 80 Hg @Mo 300 La 9.784 10.104 Mo 100 6 81 Tl @Mo 300 La 10.057 10.386 Mo 100 6 82 Pb @Mo 300 La 10.332 10.669 Mo 100 6 92 U @Ag 300 La 13.309 13.743 Ag 100 6
2.1.2 Safety Systems
Chapter 3 of the “Epsilon 5 EDXRF Spectrometer System User’s Guide” contains a complete description of all safety precautions that need to be adhered to while operating the XRF analyzer. The most important of these are described below
Exposure to X-rays: The X-ray cabinet contains two indicators that tell personnel in the laboratory that x-rays are being produced: the yellow “X-ray emitting lamp” on top of the cabinet will be illuminated and the three yellow “X-rays ON” lamps on the control panel will also be illuminated. If any of these lamps fail the x-ray source is automatically shut off. X-ray dosimeters are placed in the XRF laboratory on the instrument cabinet, at the computer workstation and at the entrance door. These dosimeters are collected quarterly by the UNR Radiation Safety Office for analysis. Exposure reports are kept in the XRF laboratory Radiation Safety Manual and can be reviewed at any time. Exposure to Beryllium: The spectrometers x-ray detector and x-ray tube contain toxic Beryllium (Be), but during normal operation these units are sealed within the x-ray cabinet and the operator should have no contact with either assembly. If it is necessary to gain access to one of these assemblies contact the XRF laboratory supervisor first.
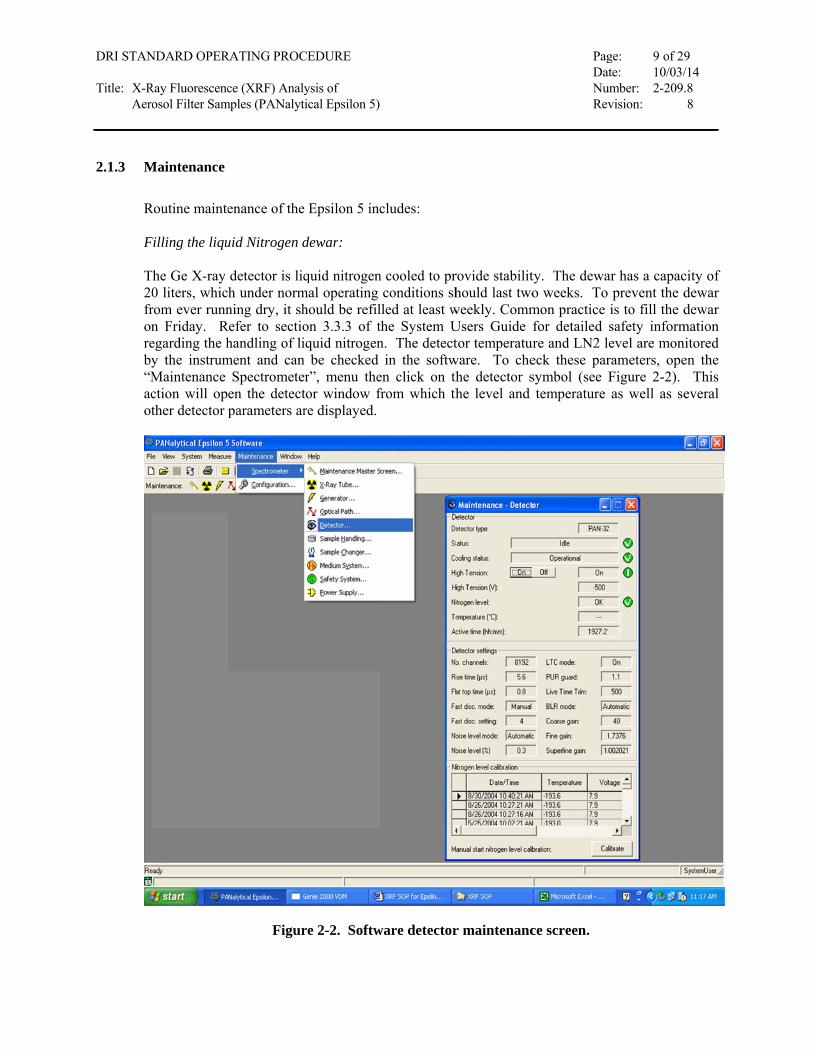
DRI STAN Title: X-R Aero
2.1.3 M
R F T20fronreby“Macot
NDARD OPER
Ray Fluorescencosol Filter Sam
Maintenance
Routine mainte
Filling the liqu
The Ge X-ray 0 liters, whicrom ever runnn Friday. Regarding the hy the instrumMaintenance ction will opther detector p
RATING PROC
ce (XRF) Analymples (PANalyt
enance of the
uid Nitrogen d
detector is liqh under normning dry, it sh
Refer to sectiohandling of li
ment and canSpectromete
en the detectparameters ar
Figur
CEDURE
ysis of tical Epsilon 5)
e Epsilon 5 inc
dewar:
quid nitrogenmal operatinghould be refilon 3.3.3 of tiquid nitrogen
n be checked er”, menu thetor window fre displayed.
re 2-2. Softw
cludes:
n cooled to prconditions sh
lled at least wthe System Un. The detect
in the softwen click on thfrom which th
ware detector
rovide stabilithould last two
weekly. CommUsers Guide tor temperatu
ware. To chehe detector she level and
r maintenanc
PagDat
Nu Rev
ty. The dewao weeks. To mon practice for detailed
ure and LN2 leck these parsymbol (see Ftemperature
ce screen.
ge: 9 of 29ate: 10/03/umber: 2-209.vision:
ar has a capacprevent the dis to fill the dsafety informevel are monrameters, opeFigure 2-2).as well as se
9 /14 .8 8
city of dewar dewar
mation nitored en the This everal

DRI STANDARD OPERATING PROCEDURE Page: 10 of 29 Date: 10/03/14 Title: X-Ray Fluorescence (XRF) Analysis of Number: 2-209.8 Aerosol Filter Samples (PANalytical Epsilon 5) Revision: 8
Filling the X-ray tube cooling water vessel: Since the instrument must be shut down prior to filling of the x-ray tube cooling water vessel, this procedure should only be accomplished by the XRF laboratory supervisor. Detailed instructions for this procedure are contained in the Epsilon 5 software Help, under the “User Maintenance”, “Routine” menus. Checking the vacuum pump oil level Since the instrument must be shut down prior to checking the vacuum pump oil level, this procedure should only be accomplished by the XRF laboratory supervisor. Detailed instructions for this procedure are contained in the Epsilon 5 software Help, under the “User Maintenance”, “Routine” menus.
2.1.4 Spare parts list
It is essential that the following spare parts and supplies be kept on hand to insure minimal
interruptions in analysis:
Mylar sheets, 2 X 2" precut squares, 3.6 μm thickness (Somar Spectrofilm, #3615-33).
Tweezers for handling filters (Millipore flat tipped stainless steel tweezers, #62-000067).
Kimwipes, large (VWR, #34255) and small (VWR, #34155).
Copies of current "Epsilon 5 XRF Analysis Logsheet".
2.1.4.1 Reagents
The chemicals required for XRF analysis are:
methanol in a squeeze bottle for cleaning the sample holders and the filter loading area liquid nitrogen for detector cooling
2.1.4.2 Forms
All samples are logged into the EAF LAN upon receipt at the laboratory. A sample analysis list
will be prepared by the laboratory or XRF supervisor indicating which samples will be analyzed and any special instructions. Filter IDs from the analysis list are transferred to the XRF analysis log sheet when filters are loaded into the machine for analysis. Figure 2-3 shows an example of analysis list and logsheet.
Figure 2-3. Sample Analysis list.

DRI STAN Title: X-R Aero
3. C
3.1 Pstandard
T
mstarofcoin
NDARD OPER
Ray Fluorescencosol Filter Sam
CALIBRATI
Preparation os
Three types ofmultiple elemetandards requre stored in Pef volatile elemonditions. Cern the XRF lab
RATING PROC
ce (XRF) Analymples (PANalyt
ION STAND
of working st
f standards areent thin film ire preparatioetriSlides andments. NIST rtificates of e.
CEDURE
ysis of tical Epsilon 5)
DARDS
tandards, ran
e used with thstandards from
on; they are usd kept in a coo
standards arelemental conc
nges of stand
he DRI XRF:m μMatter, ased as receiveol dark cabinee stored in thecentrations ar
dard values, a
: elemental thand NIST certed from the set when not ine XRF room ire provided by
PagDat
Nu Rev
and traceabi
hin film standtified standar
supplier. Then use to retardin the sample y the manufac
ge: 11 of 2ate: 10/03/umber: 2-209.vision:
ility to prima
dards from μMrds. None of e μMatter stand oxidation an
cabinet at amcturer and are
29 /14 .8 8
ary
Matter, f these ndards nd loss mbient e filed
DRI STANDARD OPERATING PROCEDURE Page: 12 of 29 Date: 10/03/14 Title: X-Ray Fluorescence (XRF) Analysis of Number: 2-209.8 Aerosol Filter Samples (PANalytical Epsilon 5) Revision: 8
3.2 Use
The DRI XRF system is recalibrated approximately every 12 months using the μMatter thin film standards. Recalibration is also performed whenever the QA standard indicated a drift of >±5% in calibration. Standards including elements from Na to U are analyzed in standard 47 mm filter holders under the filter analysis application (Filterxxxyy, where yyy = month and xx = year). Calibration factors in μg/cm2 per counts per second per milliamp are calculated for each element using linear regression analysis by the Epsilon 5 software package.
3.3 Typical accuracy of calibration standards
The μMatter standards are accurate to ±5% relative, as stated by the manufacturer. 4. PROCEDURES The typical flow of samples and data for DRI XRF analysis is depicted in Figure 4-1.

DRI STANDARD OPERATING PROCEDURE Page: 13 of 29 Date: 10/03/14 Title: X-Ray Fluorescence (XRF) Analysis of Number: 2-209.8 Aerosol Filter Samples (PANalytical Epsilon 5) Revision: 8
Generate XRF analysis runlist and record Filter IDs on XRF Log
Sheet with tray ID and position number
With gloved hands, clean lab bench, filter holders, retainer rings, and sample cups with methanol and
let dry
Arrange filter slides and filter holder parts on counter in a row
of 8
Load filter (with deposit side downward but not touching bench
top) into filter holder base and place retainer ring on top to secure filter
Place a filter holder in each sample cup and place cup in it's respective
position in the tray (a set of 8 cups/tray)
Install tray in it's place in the X-ray sample chamber
Initiate XRF analysis program
Scan barcode IDs from XRF analysis list and verify that tray
positions correspond to XRF Log Sheet
Associate tray with "Measure Queue" sequence in analysis
program
Start analysis including 10% replicate analysis from previous run
and 10% performance standards
At completetion of each run, produce database file of analyzed
data
Review analysis of QA standards
• Spectrum calibration• QA standard• Replicate
Examine spectra for peak broadening, excessive overlaps, and
detectable peaksPerform Level I data validation Archive XRF data
Return filters for cold storage
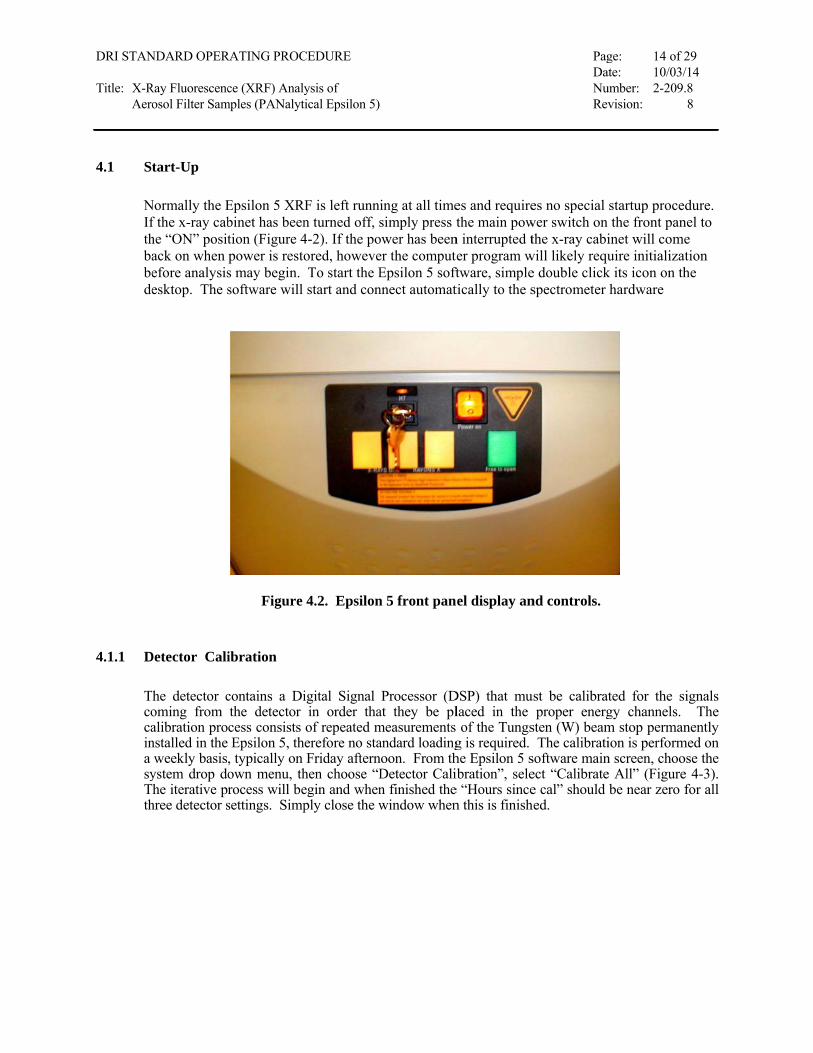
DRI STAN Title: X-R Aero
4.1 S
NIfthbabede
4.1.1 D
Tcocaina syTth
NDARD OPER
Ray Fluorescencosol Filter Sam
tart-Up
Normally the Ef the x-ray cabhe “ON” positack on when efore analysisesktop. The s
Detector Cali
The detector coming from alibration pronstalled in the weekly basis
ystem drop doThe iterative prhree detector s
RATING PROC
ce (XRF) Analymples (PANalyt
Epsilon 5 XRbinet has beention (Figure 4power is restos may begin. software will
Figure
ibration
contains a Dithe detector cess consists Epsilon 5, th
, typically on own menu, throcess will besettings. Simp
CEDURE
ysis of tical Epsilon 5)
RF is left runnin turned off, s4-2). If the poored, howeveTo start the Estart and con
4.2. Epsilon
igital Signal in order thaof repeated merefore no staFriday aftern
hen choose “Degin and whenply close the w
ing at all timesimply press t
ower has beener the computeEpsilon 5 softnnect automat
n 5 front pan
Processor (Dat they be plmeasurements andard loadingnoon. From thDetector Calin finished thewindow when
es and requirethe main pow
n interrupted ter program w
ftware, simpletically to the s
el display an
DSP) that mulaced in the of the Tungsg is required. he Epsilon 5 sibration”, selee “Hours sincen this is finish
PagDat
Nu Rev
es no special wer switch on the x-ray cabi
will likely reque double clickspectrometer
nd controls.
ust be calibratproper energ
sten (W) beam The calibrati
software mainect “Calibratee cal” should
hed.
ge: 14 of 2ate: 10/03/umber: 2-209.vision:
startup procethe front pan
inet will comeuire initializa
k its icon on thhardware
ted for the sgy channels. m stop permanion is performn screen, chooe All” (Figurebe near zero f
29 /14 .8 8
dure. nel to e
ation he
ignals The
nently med on ose the e 4-3). for all

DRI STAN Title: X-R Aero
4.1.2 R
Figure 4-4
NDARD OPER
Ray Fluorescencosol Filter Sam
Routine Oper
4a-f shows th
RATING PROC
ce (XRF) Analymples (PANalyt
Figur
ration
he typical flow
CEDURE
ysis of tical Epsilon 5)
re 4-3. Softw
w of events th
are detector
hat takes place
calibration w
e during an X
PagDat
Nu Rev
window.
XRF analysis.
ge: 15 of 2ate: 10/03/umber: 2-209.vision:
29 /14 .8 8

DRI STAN Title: X-R Aero
Computeranalysis libarcodes
a)
Metal sle
Tra
c)
Sample train queue fanalysis
Idenfor sdurin
e)
NDARD OPER
Ray Fluorescencosol Filter Sam
generated st with
XRF
eeve
Loameta
y ID
ay for
ntification sample ng analysis
RATING PROC
ce (XRF) Analymples (PANalyt
Log Sheet
ded filter in eaal cup
Tray ID
PoID
CEDURE
ysis of tical Epsilon 5)
ach
Sample tray of 8
cups
Measure Que
osition D
XRF Protocol Filter sampl
QA Standards
Loadedeposidownw
Retaini
b)
8
d)
eue
le ID
f)
X-Cha
M
d filter, it side ward
ing ring
M
X-chan
Sample Tray
-ray amber
Mechanical arm
PagDat
Nu Rev
P f
Mechanical arm
-ray sample nger chamber
Livacu
m
ge: 16 of 2ate: 10/03/umber: 2-209.vision:
Filter holder
Petri slide withfilter sample
X-rlightduri
analy
m
d of X-ray uum chamber
QA Standarloaded by
mechanical a
AdditiQA
Stand
29 /14 .8 8
r
h
ray t on ing ysis
rd
arm
ional A dard

DRI STANDARD OPERATING PROCEDURE Page: 17 of 29 Date: 10/03/14 Title: X-Ray Fluorescence (XRF) Analysis of Number: 2-209.8 Aerosol Filter Samples (PANalytical Epsilon 5) Revision: 8
Figure 4-4. Typical flow of events during an XRF analysis.
4.1.3 Filter Loading
The filter loading procedure depends on the filter media to be analyzed (1) quartz- or glass-fiber
filters or (2) Teflon-membrane filters. The procedures are different for these two options. The XRF Supervisor may designate special handling and loading procedure for unusual samples or project requirements. The notes at the top of the analysis list should be read carefully before handling the samples.
Glass-fiber or quartz filters are infrequently analyzed at DRI by XRF for elements heavier than
sulfur. Sulfur and lighter elements cannot be measured quantitatively on glass fiber or quartz filters due to high, variable background levels of these elements on these filter media and due to high absorption and backgrounds resulting from the relatively thick filter media.
Glass fiber and quartz filters are most frequently in the form of 8" X 10" sheets used in hi-vol
samplers. Sample punches are taken from these large sheets for analysis. Teflon membrane filters analyzed at DRI are generally 25, 37, or 47 mm diameter ring-mounted
filters. The sample holders used in the DRI XRF are custom-designed holders for 25, 37 or 47 mm filters Sample punches of glass fiber or quartz filters using DRI's sample punch are placed into 47 mm holders. Other sizes of filters may be accommodated; refer to the analysis list or XRF Supervisor for additional instructions.
The 25, 37 and 47 mm holders are designed to fit in the solid sample cups in the XRF sample trays.
All three styles consist of two parts: a holder base and a friction-fit retainer ring. The holders are labeled on the side with a number between 1 and 8 which corresponds to a position
in the sample tray; the retainer rings are not numbered. Select a complete set of holder bases and retainer rings for positions 1 through 8. Each sample tray can accommodate up to eight sample cups and the sample exchanger can hold up to six sample trays, so a maximum of 48 samples can be loaded at any one time.
Filters are loaded in the following manner:
Wipe the work area clean with a methanol-dampened Kimwipe. Using latex gloves which have been carefully wiped with a methanol-dampened Kimwipe after
being slipped on (to remove loose particles from the gloves), carefully wipe each sample holder base and retainer ring with methanol-dampened Kimwipes. Insure that all surfaces are free of particles, particularly the inner lip of the holder bases and the side of the retainer ring which will be contacting the filter. Place the holder bases on the clean Kimwipe in rows of 8 holders each; place the cleaned retainer rings on top of the holder bases. Carefully wipe the surface of eight sample cups with a second methanol-dampened Kimwipe place them in a row above the eight holders. Figure 4-5 shows the 47mm filter holder and the solid sample cup used for the analysis of filters.

DRI STANDARD OPERATING PROCEDURE Page: 18 of 29 Date: 10/03/14 Title: X-Ray Fluorescence (XRF) Analysis of Number: 2-209.8 Aerosol Filter Samples (PANalytical Epsilon 5) Revision: 8
Referring to the XRF analysis list, select filters for analysis. The first two analysis trays for a particular project will include 16 first-time analyses and no replicates. Subsequent trays will include replicates at the rate of 1 per tray. The goal is to run approximately 10% replicates. Final adjustments in the number of replicates run are made in the final tray for a given project.
Retrieve the samples to be analyzed from the XRF sample cabinet and lay the selected filters
evenly across the Kimwipe, in rows of 8 filters each, beneath each filter holder. (The filters are still in their labeled containers at this step).
Locate a current Epsilon 5 XRF Analysis Logsheet (Figure 2-4). Note: the QA gross counts
ranges on the Analysis Logsheets change slightly when the XRF is recalibrated; make sure the latest version of the Analysis Logsheet is used. Complete the project, run ID (as specified in the analysis list), filter type and size, and sample load date and technician's initials sections as shown in Figure 2-4.
Complete the sample IDs positions with the filter IDs selected for this run, referring to the XRF
Analysis List and making sure that the correspondence of holder number and sample ID is the same on the XRF Analysis Logsheet as on the loading table.
Check the filters for visual defects, large particles, filter damage, or other abnormalities which
may affect the quality of the analysis. Note any problems in the comments section of the Analysis Logsheet.
Teflon Membrane Filter Loading
The following steps are followed to load ring-mounted membrane filters into the filter holders:
— After wiping a pair of tweezers clean with a methanol-dampened Kimwipe, remove the
filter from the first petri dish or PetriSlide. Examine the deposit closely for defects not previously noted. Remove carefully all large or loose particles which may fall off during analysis.
— Carefully move the retainer ring from the corresponding holder base (avoid touching the
lower surface which will contact the filter). Turn the filter over (face down) and place it into the holder base.
— Place the retainer ring over the filter, squeeze it slightly to reduce its circumference, and
place it over the filter to hold it flat. Insure that the opening in the retainer ring is oriented toward the right. Note: the filters must be completely flat against the inner lip of the holder bases: the x-ray signal is sensitive to distance traveled, and slight changes in the distance between the x-ray tube, the filter, and the detector will have measurable effects.
— Proceed in a similar manner for the remaining samples.
— Each loaded filter holder must now be carefully loaded into the corresponding sample cup.
The filter holders must lay flat in the sample cup, so take extreme care to ensure that you lower the filter holders straight down into the cup. The sample cups can now be loaded into a sample tray. Each sample tray has a letter designation that corresponds with its position in the XRF sample changer.
DRI STANDARD OPERATING PROCEDURE Page: 19 of 29 Date: 10/03/14 Title: X-Ray Fluorescence (XRF) Analysis of Number: 2-209.8 Aerosol Filter Samples (PANalytical Epsilon 5) Revision: 8
— After all samples are loaded, double check that the sample ID on the Logsheet matches the ID on the empty filter container for each position.
— If samples will not be loaded immediately into the XRF sample chamber, place a large,
clean Kimwipe over the holders and place the Analysis Logsheet on top.
Quartz or Glass Fiber Filter Loading The following steps are followed to load glass fiber or quartz filters into the filter holders:
— Locate the box of Mylar sheets (3.6 μm, 2 X 2 inch squares) in the XRF sample cabinet. — Open the box of Mylar and carefully remove the top tissue paper; a sheet of Mylar should
accompany the tissue paper due to static attraction. — Carefully move the retainer ring from the corresponding holder base (avoid touching the
lower surface which will contact the filter). — Place the Mylar over the first holder base. Holding one corner of the Mylar with tweezers,
remove the tissue paper, leaving the Mylar draped over the filter holder.
— After wiping a pair of tweezers clean with a methanol-dampened Kimwipe, remove the filter from the first petri dish or PetriSlide. Examine the deposit closely for defects not previously noted. Remove carefully all large or loose particles which may fall off during analysis.
— Turn the filter over (face down) and place it into the holder base. Center the punch in
holder base opening. — In a similar manner, place a second Mylar square over the filter punch. Although the two
Mylar sheets are not electrostatically attracted to one another, they are attracted to most other objects, including tweezers, fingers, sample holder bases, and the tissue paper. Some caution is necessary to insure both Mylar squares are lying flat.
— Place the retainer ring over the filter, squeeze it slightly to reduce its circumference, and
place it over the filter to hold it flat. Note: the bottom Mylar sheet and the filter must be completely flat against the inner lip of the holder bases: the x-ray signal is sensitive to distance traveled, and slight changes in the distance between the x-ray tube, the filter, and the detector will have measurable effects. The bottom Mylar must be as free as possible of wrinkles. Careful tension on alternate corners of the Mylar will generally remove residual wrinkles. Caution: take care that the retainer ring does not pop out as tension is applied to the Mylar.
— Each loaded filter holder must now be carefully loaded into the corresponding sample cup.
The filter holders must lay flat in the sample cup, so take extreme care to ensure that you lower the filter holders straight down into the cup. The sample cups can now be loaded into a sample tray. Each sample tray can hold up to eight sample cups and has a letter designation that corresponds with its position in the XRF sample changer.

DRI STANDARD OPERATING PROCEDURE Page: 20 of 29 Date: 10/03/14 Title: X-Ray Fluorescence (XRF) Analysis of Number: 2-209.8 Aerosol Filter Samples (PANalytical Epsilon 5) Revision: 8
— Proceed in a similar manner for the remaining samples. — After all samples are loaded, double check that the sample ID on the Logsheet matches the
ID on the empty PetriSlide for each position. If samples will not be loaded immediately into the XRF sample chamber, place a large, clean Kimwipe over the holders and place the Analysis Logsheet on top.
4.1.4 Loading the sample chamber
Before opening the sample changer cover, check the front panel to ensure that the green “Free to Open” lamp is lit. The cover is interlock protected to prevent the robotic sample changer arm from moving while the cover is open thereby preventing damage to the arm and/or the operator. If the cover is open when the sample changer arm is ready to change the sample, the software will show a warning window on the computer screen requesting that the operator close the sample chamber cover. It is good practice to check the progress of the current analysis, if it is nearly complete, the operator should wait until the sample is finished and the next one is loaded before proceeding with the reloading of the sample chamber. If you are in the middle of loading the sample chamber and the software requests that you close the sample chamber cover, simply finish what you are doing to a convenient point and close the cover to allow the machine to change samples. Sample trays are loaded into the sample changer with the letter written on the sample tray (A-F) matching the etched letter in the sample chamber (Figure 4-4 d). The trays are keyed to prevent them from being loaded backwards in the sample chamber; this ensures samples one through eight are in the proper order. When all trays have been loaded, close the sample chamber lid.
4.2 Filter Analysis
Once sample trays are loaded into the X-ray cabinet sample chamber, analysis can begin. To start an analysis go to the computer workstation and ensure that the Epsilon 5 software is currently running (it should always be running) and choose the “Sample Changer Measurements” option under the “Measure” menu (Figure 4-5).

DRI STAN Title: X-R Aero
Frthbebech Ifthad F(tchm
NDARD OPER
Ray Fluorescencosol Filter Sam
rom this windhe tray, this ween entered thegin. Next thhange the col
f these are thehese samples dded to the en
or analysis ofthe bottom hohosen from th
membrane filte
RATING PROC
ce (XRF) Analymples (PANalyt
Figure 4-5
dow sample Iwill enable thehe sample poshe operator simor to yellow.
e first samplesare being addnd of the queu
f filters (47mmorizontal tray he list of applers is set as th
CEDURE
ysis of tical Epsilon 5)
. Software s
Ds can be adde “Sample id:”sition color shmply drags thSee Figure 4
s added to theded to a queueue.
m, 37mm or 2on the left haications, usua
he default app
ample chang
ded to the ana” window at thould be bluehe samples ov-6 for an expl
e queue the Ste that has ana
25mm) the saand side of Figally the applicplication.
ger measurem
alysis queue bthe bottom ofe indicating alver to the “Melanation of th
tart button mualysis in progr
ample trays usgure 4-5). Thcation setup f
PagDat
Nu Rev
ments windo
by clicking onf the screen. Oll is well and easure queue”
he sample colo
ust be selecteress they will
sed are the “2he applicationfor the measur
ge: 21 of 2ate: 10/03/umber: 2-209.vision:
w.
n its position Once the ID hanalysis can ”. This actionors.
ed, otherwise automatically
2x4” sample cn for analysis rement of Tef
29 /14 .8 8
in has
n will
if y be
cups is
flon

DRI STAN Title: X-R Aero
Wanim
4.5 S
Trath Wnodadeiscl
NDARD OPER
Ray Fluorescencosol Filter Sam
Figu
When the analny problems wmmediately n
hut-Down
Typically the Eay cabinet canhe “Off” posit
When power iotify the XRFamage due toetectors high s shut down anlosely monito
RATING PROC
ce (XRF) Analymples (PANalyt
re 4-6. Softw
ysis of a sampwere encountotify the XRF
Epsilon 5 systn be shut dowtion.
is removed frF laboratory so liquid nitrog
voltage powend the x-ray c
ored.
CEDURE
ysis of tical Epsilon 5)
ware Help sc
ple is successtered during aF laboratory s
tem is left runwn by simply p
om the Epsilosupervisor or hgen depletion er supply if thcabinet is left
reen definin
sfully compleanalysis the sasupervisor.
nning at all timpressing the “
on 5 or when his/her designby the softwa
he liquid nitrot on, it is impe
g sample cha
eted the samplample will be
mes, but in th“Power On” s
the software nee. The x-raare (the softwogen runs too erative that th
PagDat
Nu Rev
anger window
le indicator we red. If any s
he event of answitch on the
is shut downay detector is
ware will shut low), therefo
he liquid nitro
ge: 22 of 2ate: 10/03/umber: 2-209.vision:
w colors.
will be green. samples are re
n emergency tcontrol panel
n, immediatelyprotected frodown the
ore if the softwogen level be
29 /14 .8 8
If ed
the X-l to
y om
ware

DRI STANDARD OPERATING PROCEDURE Page: 23 of 29 Date: 10/03/14 Title: X-Ray Fluorescence (XRF) Analysis of Number: 2-209.8 Aerosol Filter Samples (PANalytical Epsilon 5) Revision: 8
5. QUANTIFICATION
5.1 Calibration procedures
Calibration of the Epsilon 5 XRF analyzer is achieved by analyzing µMatter thin film standards. The software package calculates a linear regression line for each element using Nuclepore blanks and at least two standards for each element. The calibration line for Cu is shown in Figure 5-1. The results of the calibration for each element are stored with the application and a hardcopy is filed in the XRF laboratory. For elements where no standards are available a calibration factor is obtained by plotting instrument response versus atomic number and interpolating the factor for the missing element. This operation is performed by the XRF laboratory supervisor using Microsoft Excel spreadsheet software. Electronic copies of the calibration curves for each condition are saved in Excel spreadsheets and posted in the laboratory information management system. Full calibrations are performed when the QA standard that is analyzed daily falls outside acceptable limits or when any significant repair or parts replacement is performed on the instrument.
5.2 Calculations
The Epsilon 5 software integrates the peaks for each element, performs the deconvolution routine (to account for interelement interferences) and then uses the calibration data for each element to convert the raw counts data to micrograms per square centimeter for reporting. All sample data is stored in the results database on the XRF computer. In order to process batches of filters the data must be saved via the results window to a text file that is converted into a database file for final processing. To select filter results for export, open the results window for the application and highlight the samples, then click the show report button to create the report. To save the data as an exportable text file, print the report to a comma delimited file. This operation is illustrated in Figure 5-2.
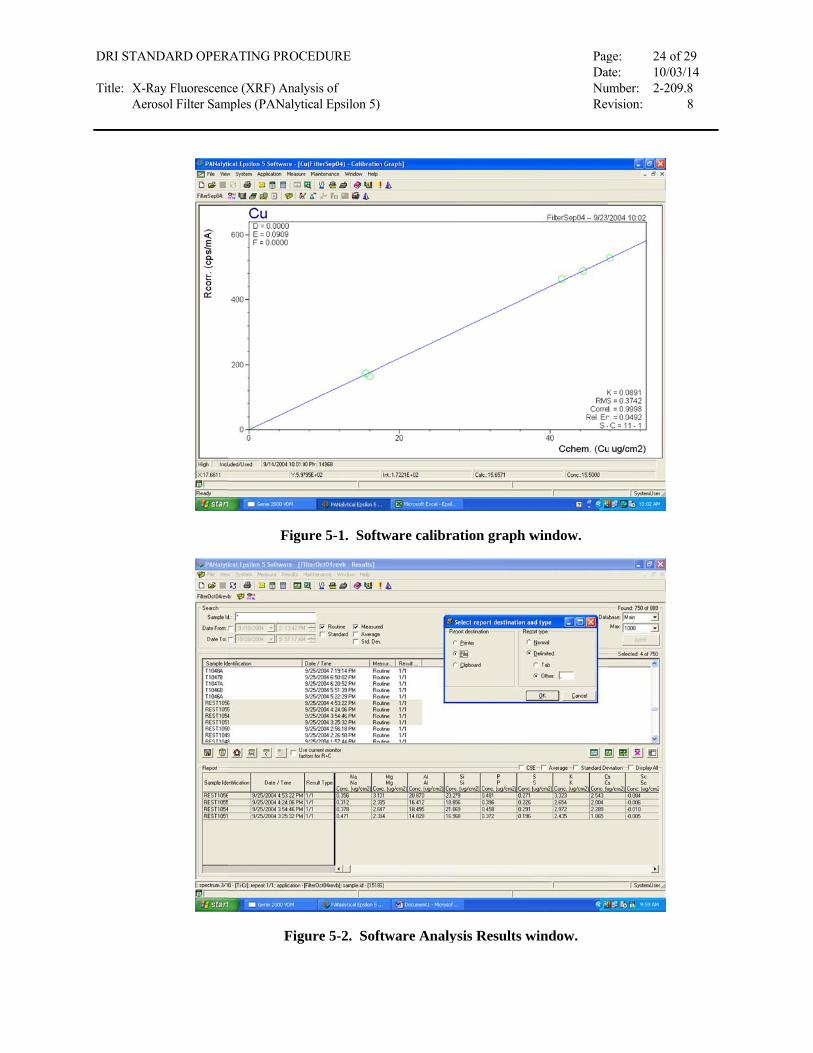
DRI STAN Title: X-R Aero
NDARD OPER
Ray Fluorescencosol Filter Sam
RATING PROC
ce (XRF) Analymples (PANalyt
Figu
Fig
CEDURE
ysis of tical Epsilon 5)
ure 5-1. Soft
ure 5-2. Soft
tware calibra
ftware Analy
ation graph w
ysis Results w
PagDat
Nu Rev
window.
window.
ge: 24 of 2ate: 10/03/umber: 2-209.vision:
29 /14 .8 8
DRI STANDARD OPERATING PROCEDURE Page: 25 of 29 Date: 10/03/14 Title: X-Ray Fluorescence (XRF) Analysis of Number: 2-209.8 Aerosol Filter Samples (PANalytical Epsilon 5) Revision: 8
6. QUALITY CONTROL
Quality control for the XRF analyzer consists of checking the performance of the analyzer against a QA standard which is analyzed every day and looking at replicate analyses.
6.1 Performance testing
A multi-element Micromatter thin film standard is run daily to monitor for instrument drift. Using the Epsilon 5 software the latest results can be displayed while the instrument is still processing the analysis queue. Each day check the results for the QA standard and record the concentrations in micrograms per square centimeter on the XRF Micromatter Multielement QA Standard analysis logsheet. Upper and lower bounds (± 5%) are listed on the logsheet. If the concentration is between these bounds no action is necessary, if it is out of bounds the XRF supervisor must be immediately notified and the problem must be fixed before analysis continues.
6.2 Reproducibility testing
Replicates of analyzed samples are performed at the rate of 10%. This corresponds to one replicate per analysis tray after the first tray. The general pattern to be followed is one tray with two replicates, followed by three trays with one replicate each. This generally corrects for the changing number of original samples which can be analyzed in each batch due to the number of replicates. The total number of replicates is compared to the total number of filters prior to the last run for a given project, and additional replicates are placed in the last tray to insure a 10% replicate rate. Replicate data is examined during the data validation and spectra review step. In general, the replicate μg/cm2 data should be within ± 10% or within 3 times the reported analytical uncertainties. Exceptions to these criteria may be made for such species as chlorine and bromine, which may vaporize under the high vacuum and decrease between the first and second analyses.
6.3 Validation Codes
Flags for all laboratory chemical analysis are defined in Table 6-1. During loading and unloading of the filters from the analyzer the operator should record and flags on the analysis logsheet.

DRI STANDARD OPERATING PROCEDURE Page: 26 of 29 Date: 10/03/14 Title: X-Ray Fluorescence (XRF) Analysis of Number: 2-209.8 Aerosol Filter Samples (PANalytical Epsilon 5) Revision: 8
Table 6-1. Validation codes and their meanings.
Flag Meaningb Blank. b1 Field/dynamic blank.b2 Laboratory blank.b3 Distilled-deionized water blank.b4 Method blank.b5 Extract/solution blank.b6 Transport blank. c Analysis result reprocessed or recalculated.c1 XRF spectrum reprocessed using manually adjusted
background. d Sample dropped. f Filter damaged or ripped.f1 Filter damaged, outside of analysis area.f2 Filter damaged, within analysis area.f3 Filter wrinkled.f4 Filter stuck to PetriSlide.f5 Teflon membrane separated from support ring.f6 Pinholes in filter. g Filter deposit damaged.g1 Deposit scratched or scraped, causing a thin line in the
deposit. g2 Deposit smudged, causing a large area of deposit to be
displaced.g3 Filter deposit side down in PetriSlide.g4 Part of deposit appears to have fallen off; particles on
inside of PetriSlide.g5 Ungloved finger touched filter.g6 Gloved finger touched filter. h Filter holder assembly problem.h1 Deposit not centered.h2 Sampled on wrong side of filter.h4 Filter support grid upside down- deposit has widely
spaced stripes or grid pattern.h5 Two filters in PetriSlide- analyzed separately. i Inhomogeneous sample deposit.i1 Evidence of impaction - deposit heavier in center of
filter. i2 Random areas of darker or lighter deposit on filter.i3 Light colored deposit with dark specks.

DRI STANDARD OPERATING PROCEDURE Page: 27 of 29 Date: 10/03/14 Title: X-Ray Fluorescence (XRF) Analysis of Number: 2-209.8 Aerosol Filter Samples (PANalytical Epsilon 5) Revision: 8
Flag Meaningi4 Non-uniform deposit near edge - possible air leak. m Analysis results affected by matrix effect.m1 Organic/elemental carbon split undetermined due to an
apparent color change of non-carbon particles during analysis; all measured carbon reported as organic.
m2 Non-white carbon punch after carbon analysis, indicative of mineral particles in deposit.
m3 A non-typical, but valid, laser response was observed during TOR analysis. This phenomena may result in increased uncertainty of the organic/elemental carbon split. Total carbon measurements are likely unaffected.
n Foreign substance on sample.n1 Insects on deposit, removed before analysis.n2 Insects on deposit, not all removed.n3 Metallic particles observed on deposit.n4 Many particles on deposit much larger than cut point of
inlet. n5 Fibers or fuzz on filter.n6 Oily-looking droplets on filter.n7 Shiny substance on filter.n8 Particles on back of filter.n9 Discoloration on deposit. q Standard.q1 Quality control standard.q2 Externally prepared quality control standard.q3 Second type of externally prepared quality control
standard.q4 Calibration standard. r Replicate analysis.r1 First replicate analysis on the same analyzer.r2 Second replicate analysis on the same analyzer.r3 Third replicate analysis on the same analyzer.r4 Sample re-analysis.r5 Replicate on different analyzer.r6 Sample re-extraction and re-analysis.r7 Sample re-analyzed with same result, original value
used. s Suspect analysis result. v Invalid (void) analysis result.v1 Quality control standard check exceeded ± 10% of
specified concentration range.

DRI STANDARD OPERATING PROCEDURE Page: 28 of 29 Date: 10/03/14 Title: X-Ray Fluorescence (XRF) Analysis of Number: 2-209.8 Aerosol Filter Samples (PANalytical Epsilon 5) Revision: 8
Flag Meaningv2 Replicate analysis failed acceptable limit specified in
SOP. v3 Potential contamination.v4 Concentration out of expected range. w Wet Sample.w1 Deposit spotted from water drops.
Analysis results are categorized as valid, suspect, or invalid. Unflagged samples, or samples with any
flag except 's' or 'v' indicate valid results. The 's' flag indicates results of suspect validity. The 'v' flag indicates invalid analysis results. Chemical analysis data validation flags are all lower case.
Data validation feedback
Begin data validation by verifying that all data entry is correct: sample ID's, deposit areas, and flags on the Logsheet and the printouts should match. If there are any discrepancies, note them on the XRF Validation Summary. Next, examine the results for internal consistency and "reasonableness" of the XRF data. Categories to check are presence of elements whose concentrations are usually below the detection limit for typical ambient air samples, unusual elemental ratios, and replicate analysis results. Since data from the QA standard has already been checked, and since its composition is unlike aerosol samples, do not apply these checks to the QA standard.
The XRF Analysis Logsheet and results data file are reviewed by the XRF Supervisor or his designee. Any samples with incorrect or questionable data are noted on the XRF Validation Summary, record the filter ID, analysis condition, problem, along with steps taken to resolve any problems. Once all data has been validated and any necessary corrections are made in the database, the line labeled "QA Chks" on the XRF Analysis Logsheet is initialed. Hardcopies of all data validation summary sheets are filed in the XRF laboratory.
7. REFERENCES
PANalytical , Epsilon 5 EDXRF Spectrometer System User’s Guide, First Edition March 2003 8. DOCUMENT CHANGES 7/30/07: r3 – minor formatting changes. Added signature blocks to title page. Note that original
SOP started as r1 and not r0. 10/12/09: r4 – Changed to reflect the installation of the new dual anode Sc/W x-ray tube.

DRI STANDARD OPERATING PROCEDURE Page: 29 of 29 Date: 10/03/14 Title: X-Ray Fluorescence (XRF) Analysis of Number: 2-209.8 Aerosol Filter Samples (PANalytical Epsilon 5) Revision: 8
12/10/09: r5 Updated MDL table
12/17/10 r6 Updated XRF logbook example
07/09/12: r7 Updated MDL table and conditions table to reflect changes to analysis protocol made during the March 2012 calibration. Deleted section 6.3 regarding control charts.
10/03/14: r8 Updated SOP with pictures and flow chart figures.