PEER REVIEW SUMMARY REPORT - EPA
56
Summary Report External Letter Peer Review of Draft Report “National Coastal Condition Assessment 2015” Contract No. EP-C-17-023 Task Order 68HERH21F0155 Prepared for: U.S. Environmental Protection Agency Office of Water Office of Wetlands, Oceans, and Watersheds William Jefferson Clinton Building 1200 Pennsylvania Avenue, N. W. Washington, DC 20460 Attn: Kendra Forde and Hugh Sullivan Prepared by: Versar, Inc. 6850 Versar Center Springfield, VA 22151 Peer Reviewers: Brendan E. Hickie, Ph.D. David A. Nemazie, M.S. Donald Scavia, Ph.D. Michael R. Twiss, Ph.D. May 7, 2021
-
Upload
khangminh22 -
Category
Documents
-
view
4 -
download
0
Transcript of PEER REVIEW SUMMARY REPORT - EPA

Summary Report External Letter Peer Review of Draft Report
“National Coastal Condition Assessment 2015”
Contract No. EP-C-17-023 Task Order 68HERH21F0155
Prepared for: U.S. Environmental Protection Agency
Office of Water Office of Wetlands, Oceans, and Watersheds
William Jefferson Clinton Building 1200 Pennsylvania Avenue, N. W.
Washington, DC 20460 Attn: Kendra Forde and Hugh Sullivan
Prepared by: Versar, Inc.
6850 Versar Center Springfield, VA 22151
Peer Reviewers: Brendan E. Hickie, Ph.D. David A. Nemazie, M.S.
Donald Scavia, Ph.D. Michael R. Twiss, Ph.D.
May 7, 2021

External Letter Peer Review of Draft Report “National Coastal Condition Assessment 2015”
i
TABLE OF CONTENTS
I. INTRODUCTION..............................................................................................................2
II. CHARGE TO REVIEWERS ............................................................................................4
III. SUMMARY OF PEER REVIEWER COMMENTS ......................................................6
I. General Impressions ........................................................................................................7
II. Response to Charge Questions ........................................................................................9
IV. INDIVIDUAL REVIEWER COMMENTS ...................................................................19
Brendan E. Hickie, Ph.D. ...................................................................................................20
David A. Nemazie, M.S. ....................................................................................................31
Donald Scavia, Ph.D. .........................................................................................................39
Michael R. Twiss, Ph.D. ....................................................................................................45

External Letter Peer Review of Draft Report “National Coastal Condition Assessment 2015”
2
I. INTRODUCTION EPA, states and tribes began implementing the National Aquatic Resource Surveys (NARS) in 2006. The surveys were initiated to provide answers to the following: What is the condition of the nation’s waters? What is the relative importance of stressors in the assessment of condition? Are conditions in our waters getting better, worse, or staying the same? The surveys are designed to assess the condition of the nation’s waters using a probability-based approach on a five-year rotating basis, with one type of water resource under assessment in each year. The four areas of assessment are: coastal water, wetlands, lakes, and rivers and streams. The National Coastal Condition Assessment 2015 (NCCA) is the product of an EPA, state, and tribal partnership. The NCCA provides information on the condition of the nation’s coastal waters using a suite of indicators including biological, chemical and physical indicators. This report provides results from 2015 and compares these data to data collected during earlier coastal assessments, including surveys prior to the start of NARS. During the summer of 2015, field crews sampled 1060 coastal sites. Of these, 699 represented 27,479 square miles of estuarine waters, while 361 represented 7,119 square miles of nearshore waters and embayments of the Great Lakes. Crews used standardized field methods to sample each site. The resulting data were compared to benchmarks to assess coastal condition, using categories such as good, fair or poor. The NCCA report and related information were developed for dissemination to the public. These data and results are considered Influential Scientific Information (ISI) because all or part of the data may be used for decision-making in various EPA, state, and tribal programs. The NCCA report presents data that were collected in 2015 with methods originally used in the peer reviewed National Coastal Condition Assessment 2010 report and previous research. This report also compares 2015 data to comparable data that were collected in the 2005-2006 time period and in 2010. The results from those surveys are presented in the NCCR IV (see https://www.epa.gov/national-aquatic-resource-surveys/national-coastal-condition-report-iv-2012) and the NCCA 2010 Report (see https://www.epa.gov/national-aquatic-resource-surveys/national-coastal-condition-assessment-2010-report). The data analyses rely on indicators to assess biological condition (benthic invertebrates), water quality (phosphorus, nitrogen, chlorophyll a, dissolved oxygen and water clarity), sediment condition (sediment contaminants and toxicity), ecological fish tissue (contaminants in whole fish) and human health risks (microcystin, enterococci, contaminants in fish tissue) in coastal waters. The survey design, analytical approach, and condition benchmarks have undergone peer review at different phases of their development or are derived from peer-reviewed approaches. The purpose of the requested letter review is for EPA to receive written comments from individual experts. Versar has selected four experts to serve as peer reviewers. Three of the four peer reviewers have a firm background in aquatic ecology, including at least one with expertise related to the ecology of brackish estuarine waters and at least one with expertise related to the ecology of the Great Lakes. These three peer reviewers also have expertise in one or more of the following areas:
• biological monitoring • water chemistry

External Letter Peer Review of Draft Report “National Coastal Condition Assessment 2015”
3
• stressor analysis • sediment or fish tissue contaminants or human health risks associated with contaminants
in fish tissue. The fourth peer reviewer has expertise in ecotoxicology and trophic transfer of contaminants in fish tissue to their predators. In addition, because the NCCA report and related information are targeted nationwide and have been developed for dissemination to the public, one reviewer also has the ability to assess the report in its function to synthesize information to educate the public and decision makers. Peer Reviewers: Brendan E. Hickie, Ph.D. Trent University Peterborough, Ontario Canada K9L 0G2 Expertise: Bioaccumulation, Fish, Risk Assessment, etc. David A. Nemazie, M.S. University of Maryland Center for Environmental Science Cambridge, MD 21613 Expertise: Public Communications Donald Scavia, Ph.D. University of Michigan Ann Arbor, MI 48104 Expertise: Estuarine/Coastal Monitoring Michael R. Twiss, Ph.D. Clarkson University Potsdam, NY, 13699-5805 Expertise: Great Lakes

External Letter Peer Review of Draft Report “National Coastal Condition Assessment 2015”
4
II. CHARGE TO REVIEWERS Charge Questions: 1. Does the organization and content of the NCCA 2015 Report seem appropriate and does it present the material in an understandable manner for its target audience (i.e. general public or environmental policymakers)? For example:
a. Are the goals, purpose, and design of the study clearly described for the target audience? b. An important aspect for the reader to understand is that the NCCA assesses coastal condition at national and regional population scales and should not be used to estimate the conditions at any specific site. Is this clear to the reader? c. Are the results presented in a manner that is clear and intuitive to the reader? We would like your thoughts on whether the text and graphic formats convey the information effectively or if other approaches would be more intuitive.
2. The NCCA 2015 Report presents results at the combined national estuary and combined Great Lakes scales. The report contains links to the NCCA dashboard for readers interested in regional condition estimates.
a. Is this a reasonable way to provide a brief national report while still making regional results available to the reader? b. Are there additional features that you would like to see presented in future iterations of the NCCA dashboard?
3. The NCCA biological indicators have been published in the peer-reviewed literature. Are these biological indicators being appropriately applied and do they support the NCCA’s goal of assessing the condition of the nation’s coastal waters at national and broad regional scales, and trends over time? Is the information presented for the biological condition indictors presented in a clear and understandable manner in the report? Please respond to this question for the following biological indices.
a. M-AMBI for estuarine analyses b. M-OTI for Great Lakes analyses
4. The metrics for the Sediment Quality Index have been published in the peer reviewed literature, and the procedure used to combine these metrics first published in the National Coastal Condition Assessment 2010 (EPA 841-R-15-006). Is the Sediment Quality Index being appropriately applied and does it support the NCCA’s goal of assessing the condition of the nation’s coastal waters at national and broad regional scales, and trends over time? Is the presented in a clear and understandable manner in the report? 5. The Eutrophication index (previously called the water quality index) has been used to assess EPA coastal waters for over fifteen years starting with the National Coastal Condition Report II (EPA-620/R-03/002). Does this index and each individual eutrophication-related measure support the NCCA’s goal of assessing the condition of the nation’s coastal waters at national and

External Letter Peer Review of Draft Report “National Coastal Condition Assessment 2015”
5
broad regional scales, and trends over time? Are the Eutrophication – related indicators used in the report clearly explained to the reader? 6. The Ecological Fish Contaminant Index was first developed and published in the National Coastal Condition Assessment 2010 (EPA 841-R-15-006) and was modified for this report. Is the underlying approach for the analysis of the Ecological Fish Tissue Contaminant Index scientifically sound? Note: This question is optional. The one ecotoxicology peer reviewer will focus on this question, but if you feel qualified, you are welcome to weigh in on this topic. Answering this question should be based on both the Summary Report and Chapter 7 of the Technical Support Document (TSD). Specifically, consider the following three aspects of the approach.
a. Are the receptors of concern appropriate and do they adequately represent the wildlife populations potentially impacted by eating whole fish? b. Are the formulas for deriving screening values from Toxicity Reference Values appropriate? c. Is use of the NOAEL for calculating screening values appropriate?
7. Is the approach used for analyzing contaminants for human health-based fish consumption benchmarks in fish fillet tissue composite samples in the Great Lakes and assessing the population of waters above or at/below benchmarks acceptable and based on sound scientific principles?
a. Is the information presented clear and understandable? 8. The NCCA compares results between survey cycles and presents changes over time in the condition of the population of coastal systems covered by the NCCA design. Is the information on these differences or changes in condition from the previous reports explained and clear to the reader?
a. Is the approach used to assess change over time in NCCA based on sound scientific principles and described clearly in the report? b. Are the conclusions regarding changes in coastal condition over time supported by the results?
9. What is the most important concern you have with the report that was not covered in your answers to the questions above?

External Letter Peer Review of Draft Report “National Coastal Condition Assessment 2015”
6
III. SUMMARY OF PEER REVIEWER COMMENTS

External Letter Peer Review of Draft Report “National Coastal Condition Assessment 2015”
7
I. General Impressions Overall, the reviewers generally found the NCCA 2015 Report to be a well organized and highly informative report with clearly defined objectives that are then presented clearly and effectively, and in a manner that is well suited to a general audience with a modest level of scientific knowledge and an interest in the state of the environment. This is achieved by clearly written text that finds a good balance in describing the underlying science while avoiding unnecessary jargon and detail (for the most part), and distilling the results into a set of readily understandable indices that are then effectively interpreted in brief sections of text. The figures used to present the results are clear and easy to interpret for most reasonably well-informed readers, and supporting text and examples should aid readers that are less familiar with the presentation of scientific results. The conclusions presented in the report were well balanced and openly discussed some of the challenges that such a large-scale study presents when trying to interpret result namely the problems with the high incidence of areas that were unassessed due to difficulties in collecting samples in some areas. The ecotoxicology expert noted that as a scientist reading this document, he naturally found instances where he wanted more details in the report, and thus had to remind himself that a person like him is not the primary audience. Despite this, some of his comments may reflect his desire for more details than are needed for a general audience. The ecotoxicology expert was also instructed to conduct a detailed review of Chapter 7 of the Technical Support Document (TSD) stated that the TSD was also well crafted, although he did find a few elements in Chapter 7 that should be revised for clarity, transparency, and may warrant some revision in the future. The reviewers also made some general observations for consideration, as summarized below.
• Good, Fair, Poor designations: o One reviewer stated that the conditions “good,” “fair,” and “poor” we never
defined within this document. The reviewer recognizes that the conditions are defined based on the specific indicators within the technical document and believes general definitions would help the reader have a clear picture of what good, fair, and poor mean in the context of the Report. The reviewer recommends that a box simply defining “good,” “fair,” and
“poor” in context of: 1) ecological condition; 2) human uses such fishing, swimming, and recreating would be appropriate for this audience.
o Another reviewer stated that there needs to be more information brought in from the Technical Report. If the Summary Report was only intended for the general public, the level of explanation and coverage is probably ok. But, in several places, the report claims to be useful to water resource managers and environmental policy makers. In this regard, the reviewer thinks there needs to be more information on the basis of the “good, fair, poor” assessments.
• Assessments: o One reviewer is concerned about the “not assessed” category. For example, it was
not clear until the reviewer looked at charts in more detail that, “50% good” meant 50% of all areas, not 50% of assessed area. It seems to him that 50% of all areas can be misleading, especially when comparing scores over times when the % area assessed changed. This issue is noted several times in the report, but the reviewer is not sure it is done clearly enough, nor strongly enough because it can completely mask reality.

External Letter Peer Review of Draft Report “National Coastal Condition Assessment 2015”
8
The reviewer suggests EPA rethink this approach to consider reporting % of assessed areas instead of % of all areas. Particularly when a large portion of area is not assessed or when the % assessed changes a lot.
• Sample Design - spatial: o The reader is given no sense of the actual extent or distribution of sample sites.
Again, for the public that is probably ok. But for others, it is unknown if there was one sample taken in the Chesapeake Bay or in Lake Erie or 100s?
• Sample Design – temporal: o If, as it appears, these stations were only visited once (or a second time for
statistical over sampling), then the reviewer wonders if the eutrophication indicators really have any meaning. Unlike sediment and fish that integrate over time, the water quality parameters are highly dynamic seasonally. How can one sample per year capture eutrophication? This is also true for the toxic algae measures.
• Uneven explanations: o One reviewer indicated that it is not clear why, for example, an entire page is
allocated to ELISA, yet virtually nothing on other measures. If “good, fair, poor” indicator definitions were to be included the full-page on ELISA can be eliminated to make room.
o This reviewer also stated that it was not clear why the Lake Erie Eutrophication Cause/Effect was singled out.
• Comparisons with other NARS programs: o One reviewer felt these comparisons were interesting, but thinks they might be
more informative if appropriate results from other NARS programs were added to the graphics instead of just included in the paragraphs.
• Redundant paragraphs: o One reviewer noted that much of the language is repeated over and over. Perhaps
there is some way to consolidate some of it to make room for some more of the background information.
One reviewer suggested the following edits:
• Greater scientific literacy can be assumed in a reader of the NCCA Report. For example, the use of specific terms like ‘cyanobacteria’ rather than using ‘algae’ as a colloquial term to include algae (eukaryotic protists) and cyanobacteria (prokaryotes) is useful.
• The NCCA should be quantified as summer-specific assessment. With climate change occurring, winter is the season that is changing the most and may perhaps show the greatest response to stressors such as eutrophication and contaminants.
• There are specific requests listed under Specific Observations for increased clarity in the presentation of some figures.
• The Great Lakes are an enormous freshwater system. There is a need to incorporate the connecting waters in this system, which are recognized by treaty by the United States to be integral components of the Great Lakes (Boundary Waters Treaty, 1909) and are defined by the NCCA as nearshore waters.

External Letter Peer Review of Draft Report “National Coastal Condition Assessment 2015”
9
II. Response to Charge Questions 1. Does the organization and content of the NCCA 2015 Report seem appropriate and does it present the material in an understandable manner for its target audience (i.e. general public or environmental policymakers)? For example: 1a. Are the goals, purpose, and design of the study clearly described for the target audience? Overall, the reviewers generally found the organization and content of the NCCA 2015 Report to be appropriate and presented the material in an understandable manner for its target audience (i.e., general public or environmental policymakers). One reviewer indicated the NCCA 2015 Report does an excellent job at explaining goals, purpose, and design of the study. Another reviewer noted that the scale is understood and the design of the sampling is well presented and repeated several times throughout the document so that the average lay person or environmental manager would be able to understand the goals, purpose, and design of this ongoing assessment exercise. However, one reviewer had concerns about the “environmental policymaker” audience. This reviewer stated that if the Summary Report was only intended for the general public, the level of explanation and coverage is probably ok. But to be useful to water resource managers and environmental policymakers there needs to be more information brought in from the Technical Report. One reviewer stated that the design of the study is more difficult to describe for a document like this where technical details cannot be allowed to bog down the presentation and make it more difficult to read. One reviewer also suggested that there may be some value to explain how past NCCA reports have been used to help impact policies, regulations, or “behavior” particularly related to implementation of best management practices.
1b. An important aspect for the reader to understand is that the NCCA assesses coastal condition at national and regional population scales and should not be used to estimate the conditions at any specific site. Is this clear to the reader? Overall the reviewers felt that it was clear to the reader that the NCCA assesses coastal condition at national and regional population scales and should not be used to estimate the conditions at any specific site. One reviewer mentioned specifically that the design was not aimed at identifying or sampling known “hotspots” or “areas of concern” which are dealt with in other programs. Another reviewer stated that the maps and text delineate the scale of the various contiguous US coastlines that are part of the sampling design, but noted it would be additionally useful to state in the title and executive summary that the estuaries do not include those in Alaska or any other US territory. Additionally this reviewer thought the design is adequately stated so that the conclusions should be readily interpreted on the basis of each Great Lake’s nearshore zone (or the Great Lakes collectively) and the estuaries of large coastal regions on the East, Gulf, and West coasts.

External Letter Peer Review of Draft Report “National Coastal Condition Assessment 2015”
10
1c. Are the results presented in a manner that is clear and intuitive to the reader? We would like your thoughts on whether the text and graphic formats convey the information effectively or if other approaches would be more intuitive. One reviewer stated the results are presented in a clear and very effective manner in the main body of the report. The graphics are quite easy to understand and the explanatory graphics and text on page 19 is very helpful for a lay audience. Another reviewer noted that the results are mostly presented in a clear and intuitive manner and appreciated the effort to synthesize the data down to provide as simple a presentation of the data as possible while still maintaining enough spatial and temporal (when possible) detail. Some of the reviewers provided additional comments and recommendations, as summarized below.
• Lack of definitions for “good, fair, and poor”; that gap may leave it too subjective to the reader to be useful.
• The use of bar graphs, with numeric annotation and the use of error lines on the graphs are good, but concerned that the information on unassessed areas might be confusing.
o For example, it was not clear that “50% good” meant 50% of all areas, not 50% of assessed area. It seems that 50% of all areas can be misleading, especially when comparing scores over times when the % area assessed changed. This issue is noted several times in the report, but the reviewer was not sure it is done clearly enough, nor strongly enough because it can completely mask reality. Suggest EPA rethink this approach to consider reporting % of assessed
areas instead of % of all areas. Particularly when a large portion of area is not assessed or when the % assessed changes a lot.
• In several instances, the data could be presented more intuitively. Examples were provided by the reviewer.
• One additional graphic that could be considered would be maps that show the good fair and poor areas along the coast lines in different colors. A caveat to this is that it may encourage readers to start interpreting them in site-specific terms which is not desired.
2. The NCCA 2015 Report presents results at the combined national estuary and combined Great Lakes scales. The report contains links to the NCCA dashboard for readers interested in regional condition estimates. 2a. Is this a reasonable way to provide a brief national report while still making regional results available to the reader? Most of the reviewers agreed that this is a reasonable way to provide a brief national report while still making regional results available to the reader. One reviewer stated that the “National Coastal Condition Assessment 2015” report is essentially an extended summary of the more extensive Technical Support Document. A document of this length provides a good overview and allows trends in coastline condition (where available) to be conveyed. Another reviewer said this document is an excellent entry point for a broad audience. People interested in more detail can then follow the links. This reviewer uses documents like this when teaching introductory environmental science at his university and can often use data from associated websites or databases to develop assignments – they are very effective teaching aids. The reviewers provided additional comments and recommendations, as summarized below.

External Letter Peer Review of Draft Report “National Coastal Condition Assessment 2015”
11
• This seems like a rational compromise between national and regional reporting. But, when the reviewer downloaded a subset of the data, it was pretty hard to understand without metadata.
o For example, the column headings were undecipherable. This may not be important for the general public, but the reviewer imagines managers and policymakers, or their staff, would need it.
• One reviewer found that it was barely mentioned that this “National Report” was only related to the 48 contiguous states and left off a mention of Alaska and Hawaii. This reviewer believes referring to other assessment reports focused on Alaska and Hawaii would serve the reader well.
• This reviewer thought it may be more useful to have a separate report for the Great Lakes, even if the data were collected within the same time-frame. While there may be some redundancies it may be easier for the reader to handle the vast difference between these ecosystems as well as some of the indicators.
2b. Are there additional features that you would like to see presented in future iterations of the NCCA dashboard? Two of the reviewers provided additional comments and recommendations for additional features that they would like to see presented in future iterations of the NCCA dashboard. These are summarized below.
• The order of the Great Lakes is presented in a non-intuitive manner in the dashboard. An added feature that is not available in the printed report but readily possible on the NCCA dashboard would be the possibility of listing the lakes by elevation, or total area of nearshore, or even alphabetically.
• Assessments of “trash” may also be a good indicator to consider in the future which may be simplified if the video sampling analysis becomes more broadly understood and incorporated.
• One reviewer believes a few indicators can be removed – particularly the ones that do not show any significant variations in results in the entire country or region (microcystins, enterococci, and PFOS*. The ephemeral nature of microcystins and enterococci may make interpreting their lack of finding within the environment much more likely due to the lack of time-series sampling. Because microcystins were never rated anything lower than “good”, this reviewer recommended that the methodology of measuring microcystins should be removed in its entirety. For example, the PFAS call-out box seems to be an appropriate size for this new indicator.
o *As the understanding of the PFAS class of chemicals becomes better understood, as well as its sampling and analytical methodologies, this indicator may be worth keeping either for PFOS and/or other members of the PFAS family. This reviewer knows there has been some sampling of fish tissue estuarine waters. If standard methods for collection and measuring advance, it may be worthwhile expanding this indicator throughout the nation – at least 1 time. If the results remain “within acceptable limits” for >90% of the samples, then the reviewer would recommend dropping it entirely.

External Letter Peer Review of Draft Report “National Coastal Condition Assessment 2015”
12
3. The NCCA biological indicators have been published in the peer-reviewed literature. Are these biological indicators being appropriately applied and do they support the NCCA’s goal of assessing the condition of the nation’s coastal waters at national and broad regional scales, and trends over time? Is the information presented for the biological condition indictors presented in a clear and understandable manner in the report? Please respond to this question for the following biological indices. 3a. M-AMBI for estuarine analyses One reviewer stated that the use of past data to support the M-AMBI (multivariate Marine Biotic Index developed by the AZTI-Spain) approach to assessing benthic habitat condition is appropriate since the data were collected in previous coastline surveys in a consistent manner and the M-AMBI can be applied retrospectively, as stated in the report. Another reviewer indicated that these are described and represented clearly, but expressed concerns about ‘good, fair, poor’ indicators. In this regard, the reviewer thinks there needs to be more information on the basis of the “good, fair, poor” assessments. The reviewer appreciates that these differ among the various indexes and indicators, but including some graphics or tables (or at least an example like Table 5.7 in the Technical Report) would be helpful. It could even be an appendix to the Summary Report because, while it’s all in the TSD, it would be good to have a sense that it is justified. Otherwise, it feels like “some folks got together and decided.” One reviewer was not an expert in these techniques but he found their explanation to be simple and accurate. The use of biological indicators has been used for decades and is very important to integrator. This reviewer is glad to see progress being made in those biological indicators, presumably using collection techniques and species that better reflect today’s understanding. 3b. M-OTI for Great Lakes analyses One reviewer stated the benthic Oligochaete Trophic Index (B-OTI) is appropriately applied. Use of oligochaete trophic indices is a well-established approach to evaluating eutrophic conditions that was developed over four decades ago (Howmiller & Scott 1977; Lauritsen et al. 1985; Milbrink 1983). This reviewer felt the data are presented clearly. Since there is a rich data base (dating back to 2010) this strengthens the temporal trend analysis. Also, the caveats regarding the use of the B-OTI (Chapter 4.1) is well described so a reader can judge the confidence in the findings. The remaining comments from the reviewers were identical to those provided above for the M-AMBI for estuarine analyses. 4. The metrics for the Sediment Quality Index have been published in the peer reviewed literature, and the procedure used to combine these metrics first published in the National Coastal Condition Assessment 2010 (EPA 841-R-15-006). Is the Sediment Quality Index being appropriately applied and does it support the NCCA’s goal of assessing the condition of the nation’s coastal waters at national and broad regional scales, and trends over time? Is the presented in a clear and understandable manner in the report? Overall the reviewers felt that the Sediment Quality Index is applied appropriately and the presentation is understandable. One reviewer stated that the index includes benchmarks regarding toxicity, which are of ultimate interest and by using exposure-based assays the NCCA is able to assess toxicity of contaminants (specific and interactive effects), including those that are unknown or have unknown interactions (synergistic, additive, competitive). As designed, the

External Letter Peer Review of Draft Report “National Coastal Condition Assessment 2015”
13
approach will provide a reasonable impression of the nation’s coastal waters at national and broad regional scales, and trends over time. Another reviewer indicated that these are described and represented clearly, but reiterated concerns about ‘good, fair, poor’ indicators that were discussed above. 5. The Eutrophication index (previously called the water quality index) has been used to assess EPA coastal waters for over fifteen years starting with the National Coastal Condition Report II (EPA-620/R-03/002). Does this index and each individual eutrophication-related measure support the NCCA’s goal of assessing the condition of the nation’s coastal waters at national and broad regional scales, and trends over time? Are the Eutrophication – related indicators used in the report clearly explained to the reader? Overall the reviewers generally agreed that Eutrophication Index and each individual eutrophication-related measure support the NCCA’s goal of assessing the condition of the nation’s coastal waters at national and broad regional scales, and trends over time. One reviewer stated that the eutrophication index (based on nutrient concentrations [total nitrogen, total phosphorus), total chlorophyll-a, dissolved oxygen concentrations, and water clarity) is an appropriate means by which to measure the range of trophic status in estuarine and Great Lakes nearshore waters and it is well explained in the report. With respect to the ability to measure trends over time, the approach used by the NCAA is appropriate for five-year intervals for conditions measured during summer (the field season). However, it is important to note in the report that sampling is just during the summer. Therefore, the assessment of the lake nearshore and estuary condition is solely for one season of the year – nearshore Great Lakes regions and estuaries may have different conditions at other time s of the year – and so making statements about changes in condition should qualify that these are for a specific time of year. For example, we have discovered extensive blooms of algae on Lake Erie in the depth of winter (February; Twiss et al., 2012), which is linked to summer time hypoxia is the central basin of this lake (Wilhelm et al., 2013; Reavie et al., 2016). Perhaps other blooms occur on other lakes, in coastal estuaries, during winter but we are generally ignorant to coastal condition during seasons other than summer and this may be important to consider. Another reviewer reiterated concerns about ‘good, fair, poor’ indicators that were discussed above. This reviewer was also concerned about the sampling design for water quality measures. It appears that the stations are sampled only once (with some resampling for statistical purposes). This reviewer found it hard to believe that the real nature of the regions’ eutrophication status can be captured this way. These measures vary dramatically over the season. The public communicator reviewer noted that the indicators are clearly explained to the reader.

External Letter Peer Review of Draft Report “National Coastal Condition Assessment 2015”
14
6. The Ecological Fish Contaminant Index was first developed and published in the National Coastal Condition Assessment 2010 (EPA 841-R-15-006) and was modified for this report. Is the underlying approach for the analysis of the Ecological Fish Tissue Contaminant Index scientifically sound? Note: The one ecotoxicology peer reviewer will focus on this question. Answering this question should be based on both the Summary Report and Chapter 7 of the Technical Support Document (TSD). 6a. Are the receptors of concern appropriate and do they adequately represent the wildlife populations potentially impacted by eating whole fish? Only the ecotoxicology expert responded to Charge Question #6, including a detailed review of Chapter 7 of the TSD. His comments are listed below.
• The list of Receptors of Concern (TSD Table 7.2) appears to be reasonable choices for the most part. He could see adding lake trout and/or coho salmon as receptors of interest for the Great Lakes but as all that is used to characterize them further is body weight (TSD Table 7.3) they may not add much more to the process.
• TSD Table 7.3 should be revised and he has some concerns about a few of the values.
First, we go from a list of species in Table 7.2 to just one unnamed member from each receptor group – The species selected for inclusion in the table should be named. Which bird from the list weighs 0.13 kg? What are the fish species that weigh 0.34 kg and 23.42 kg? How were these fish weights selected, given that fish keep growing with age? He sees that the minimum weight of each receptor was chosen in order to derive the highest FIR values for each species. If the unidentified marine mammal is a harbor seal, the minimum size of an adult may be 58.8 kg but a newly weaned juvenile may be about 10 or 15 kg.
• In addition, the fish selected as ROCs come from different thermal regimes but there is
no means provided to adjust metabolic rate and feeding rate for water temperatures.
• The reviewer doesn’t understand how the 340g fish has a feeding rate equivalent to 6.4% of body weight per day while the 550g (warm-blooded) mammal has a mass-specific feeding rate of 7.6% per day. The feeding rate for this fish seems to be too high in this comparison. The metabolic rate (and hence feeding rate) for a homeotherm should be about 10-fold higher than for an equivalent sized poikilotherm.
• He also doesn’t understand how the food ingestion rate for the 23.42 kg fish is just 0.23%
of body weight per day with an FIR that is only 2.5 times more than the freshwater fish that is 70 times smaller. Would a 23 kg tuna get by eating just 54 grams of food per day? This expert thinks these numbers need to be re-examined. Are there calculation errors? The reviewer has not examined the equations in Sample et al (1996) and Sample and Arenal (1999) to see if what he thinks is a problem is with their equations, but he does note that these references are now getting quite old and there have been considerable advances in measuring “field metabolic rates” in the last 20 years.

External Letter Peer Review of Draft Report “National Coastal Condition Assessment 2015”
15
Note: Three of the reviewers deferred response to Charge Question #6 to the ecotoxicology expert. The public communicator reviewer thought the indicator was explained in a manner that was understandable to a broad population. If selenium was never found to be above current standards – could/should it be removed as a parameter? Perhaps with only spot checks in future assessments. 6b. Are the formulas for deriving screening values from Toxicity Reference Values appropriate? The ecotoxicology expert has no concerns with the equations used for deriving the TRVs as they are aimed at a level similar to a screening-level risk assessment other than perhaps a re-examination of the estimates of FIR (noted above). There are ways to improve on these calculations by aiming to adopt a more species-specific approach for the selected ROCs such as using a bioaccumulation model calibrated for each ROC (body size, growth rate, metabolic and feeding rate, and better characterization of their prey). Doing that may not result in much of a change in the TRV but it would likely improve the confidence level associated with it. This reviewer has noted in places that the equations deal with each ROC in a fairly generic way as they are essentially defined by body size and do not address changes with life history such as longevity, growth, reproductive effort, etc. that can affect bioaccumulation processes and hence toxicity. This generic approach may be fine for relatively small organisms with short life spans like a mink, but it may not work as well for larger long-lived mammals such as harbor seals, bottlenose dolphin or walrus which have a large maternal investment in nursing their progeny. As he notes in his comments (re page 53) lactational transfer of lipophilic contaminants like PCBs which can result in progeny having higher tissue concentrations than all other members of the population. This could make them more sensitive receptors of concern than smaller mammals like mink. 6c. Is use of the NOAEL for calculating screening values appropriate? The ecotoxicology expert stated that in general, NOAELs are suitable for calculating screening values for this type of report. It is difficult for him to say more here as there is no description in the TSD (Chapter 7.4.4) of how the NOAELs were selected for the various contaminants considered, what endpoints they were associated with, nor were the values provided or references they were drawn from. This lack of transparency must be addressed before he would be able to comment on the process. 7. Is the approach used for analyzing contaminants for human health-based fish consumption benchmarks in fish fillet tissue composite samples in the Great Lakes and assessing the population of waters above or at/below benchmarks acceptable and based on sound scientific principles? One reviewer noted that approach to measuring fish contaminants is acceptable. The use of sample from a homogenization of five composite fish fillets is a technique used to provide an example of a sample representative of a fishing effort and the tissue most likely consumed (fillet). This is similar to the EPA Great Lakes Fish and Monitoring Survey Program that samples lake trout (in all lakes, walleye in Lake Erie) on 5-year cycles, and uses 10-fish (entire fish)

External Letter Peer Review of Draft Report “National Coastal Condition Assessment 2015”
16
composites. I appreciate the EPA stating the more conservative Great Lakes Sport Fish Advisory Task Force benchmark (110 ppb) versus the EPA benchmark of 300 ppb for mercury. 7a. Is the information presented clear and understandable? Two reviewers stated the reference to the standard approaches used for the Great Lakes is clear and understandable. One of these reviewers has concerns with the use of “assessing the population of waters.” Population of waters makes sense from a statistical analysis perspective but can easily be misinterpreted by the broad audience this report is meant to communicate to. Another reviewer noted that the results are clearly presented except for the data for PFOS (Figure 4.8.3), which must be re-configured to reduce ambiguity (see Section III for details). One reviewer (public communicator) is concerned with how the broader public may misinterpret the difference scales for mercury and PCBs. This reviewer does not understand the differences between EPAs cancer and noncancer benchmarks for PCBs. The fact that 70% meet the Canner Benchmark of >18 ppb for PCBs vs the Noncancer Benchmark of 44% with the higher level of PCB >73 ppb. The reviewer questions whether this was an error. The reviewer does not believe that was properly explained within the text. 8. The NCCA compares results between survey cycles and presents changes over time in the condition of the population of coastal systems covered by the NCCA design. Is the information on these differences or changes in condition from the previous reports explained and clear to the reader? 8a. Is the approach used to assess change over time in NCCA based on sound scientific principles and described clearly in the report? The reviewers generally felt the approach used to assess change over time in NCCA is based on sound scientific principles and described clearly in the report and provided additional comments and recommendations. These are summarized below.
• The change over time results were very useful. This report has taken an appropriately conservative approach to the analysis particularly pertaining to the changes to “Not Assessed” percentages.
• While referring to some results as “statistically significant” may be unclear to some – it offers the clarity to the vast majority of the potential readers.
• It was not clear until the reviewer looked at charts in more detail that, “50% good” meant 50% of all areas, not 50% of assessed area. It seems to the reviewer that 50% of all areas can be misleading, especially when comparing scores over times when the % area assessed changed. This issue is noted several times in the report, but the reviewer is not sure it is done clearly enough, nor strongly enough because it can completely mask reality.
o Suggest EPA rethink this approach to consider reporting % of assessed areas instead of % of all areas. Particularly when a large portion of area is not assessed or when the % assessed changes a lot.
• With the exception of the limitations due to inter-seasonal timeframes (see response to Section II.5 above), the approach to show changes in coastal condition over time (at 5-year intervals) is appropriate. The use of standard techniques and sample site selection

External Letter Peer Review of Draft Report “National Coastal Condition Assessment 2015”
17
based on sound statistical protocols increase the confidence the sampling techniques are able to produce results that allow an assessment any change in status over time.
• The issue of changes in the number of sites “not assessed” is problematic in presenting and interpreting the temporal changes and the report does a good job of making that clear.
8b. Are the conclusions regarding changes in coastal condition over time supported by the results? Three of the reviewers felt the conclusions regarding changes in coastal condition over time are supported by the results. In addition, one reviewer noted where there are caveats (e.g., limited benthic samples due to selected sites that had hard substrate, which prevented effective sample collection), these are stated in the text (-callouts on the figures-). These stated caveats provide a good self-critique and do not try to cache information and thereby increase confidence in the conclusions by showing the reader that a very objective approach to data analysis and transparency in reporting was conducted. Another reviewer (public communicator) indicated the conservative approach that was employed in the analysis supports the interpretation of the results. For that reason, this reviewer was pleased to see the comparisons and found it to be an important part of the conclusions and the entire report. One reviewer reiterated concerns about “unassessed areas” that were discussed above. 9. What is the most important concern you have with the report that was not covered in your answers to the questions above? All the reviewers expressed their most important concern that they have with the draft report, as summarized below.
• There needs to be some more information brought in from the Technical report. • The lack of definitions of “good, fair, and poor” and what that means from an ecological
or human health perspective because different people can have different definitions for those three categories. The reviewer also asked if there was ever consideration of a category called “Excellent?” In the future, that may add value to the understanding of our coastal systems.
• The two figures in the executive summary only show the percent of areas in good condition which may present an overly positive spin on the content of the report. The reviewer thinks these bar charts should show the good, fair, and poor percentages so that they are consistent with the figures in the main body of the report. Busy people may only read the executive summary and miss this important information. Along with that, the sections for each of the indicators should present a consistent set of information.
• The absence of the connecting waters in the Great Lakes system is misleading. According to Annex 2 of the Great Lakes Water Quality Protocol of 2012 (Canada, USA) the large rivers (St. Marys, St. Clair, Detroit, Niagara) and that connect the Great Lakes and that drain them (St. Lawrence River) are part of the lakes system. The Boundary Waters Treaty (1909) also considers these waterways to be part of the Great Lakes. By the definition used in the NCAA, nearshore water of the Great Lakes are < 30 m deep or < 5 km from shore, whichever is encountered first. Thus, all the connecting waters (including fluvial Lake St. Clair between the St. Clair River and the Detroit River) would be defined as Great Lakes nearshore waters. Figure 2.1 shows that these connecting waters are omitted (grey lines) in the NCCA.

External Letter Peer Review of Draft Report “National Coastal Condition Assessment 2015”
18
• The rivers, strait, and fluvial lake that connect and naturally drain the Great Lakes-St. Lawrence River system are referred to as connecting waters (sometimes as connecting channels). Connecting waters are natural meeting places for biota and people and all are main transportation corridors. Each connecting water that is a major river has specifically contaminated areas that reflect past and present industrial activity that gravitated to these regions. Vast and biodiverse wetlands and important fish spawning areas exist in most of these regions, yet they are under tremendous stresses (EC/USEPA, 2009). Connecting waters serve as important ecological, social, and economic intersections in the Great Lakes ecosystem yet they have not received the same degree of attention as the lakes. The fact that these Great Lakes nearshore areas are neglected by the NCCA is a major oversight. The reviewer realizes that it would be a significant undertaking to incorporate these waters into the NCCA, and he suspects that that will occur in the future. In the interim, the reviewer strongly suggests that the US EPA clarify that the connecting waters are not included in the NCCA, just as they should state that the NCCA is for the contiguous United States only.
Numerous specific observations on draft report “National Coastal Condition Assessment 2015 were made by page and paragraph number. The ecological expert also provided specific observations on draft “National Coastal Condition Assessment 2015 TSD.” The observations included editorial suggestions, technical inaccuracies, and additional details on technical issues mentioned in the charge question responses.

External Letter Peer Review of Draft Report “National Coastal Condition Assessment 2015”
19
IV. INDIVIDUAL REVIEWER COMMENTS

External Letter Peer Review of Draft Report “National Coastal Condition Assessment 2015”
20
Brendan E. Hickie, Ph.D. Trent University

External Letter Peer Review of Draft Report “National Coastal Condition Assessment 2015”
21
Peer Review Comments of Draft Report “National Coastal Condition Assessment 2015” Brendan E. Hickie, Ph.D. May 3, 2021 I. GENERAL IMPRESSIONS Overall, this is a well organized and highly informative report with clearly defined objectives that are then presented clearly and effectively, and in a manner that is well suited to a general audience with a modest level of scientific knowledge and an interest in the state of the environment. This is achieved by clearly written text that finds a good balance in describing the underlying science while avoiding unnecessary jargon and detail (for the most part), and distilling the results into a set of readily understandable indices that are then effectively interpreted in brief sections of text. The figures used to present the results are clear and easy to interpret for most reasonably well-informed readers, and supporting text and examples should aid readers that are less familiar with the presentation of scientific results. The conclusions presented in the report were well balanced and openly discussed some of the challenges that such a large-scale study presents when trying to interpret result namely the problems with the high incidence of areas that were unassessed due to difficulties in collecting samples in some areas. As this is only the second NCCA report, the true value of the program will only be realized in future years when the temporal changes in these indices can be examined over several decades, and I look forward to seeing them. The value will be enhanced further as methods are refined based on experience in running such a large sampling program and by adding new measures as are noted in the final section of the report. As a scientist reading this document, I naturally found instances where I wanted more details in the report, and thus had to remind myself that a person like me is not the primary audience. Despite this, some of my comments may reflect my desire for more details than are needed for a general audience. The Technical Support Document was also well crafted, although I did find a few elements in Chapter 7 that should be revised for clarity, transparency, and may warrant some revision in the future. II. RESPONSE TO CHARGE QUESTIONS II. RESPONSE TO CHARGE QUESTIONS 1. Does the organization and content of the NCCA 2015 Report seem appropriate and does it present the material in an understandable manner for its target audience (i.e. general public or environmental policymakers)? For example: 1a. Are the goals, purpose, and design of the study clearly described for the target audience? Yes, I believe the report does a good job of describing the goals and purpose of the report. The design of the study is more difficult to describe for a document like this where technical details cannot be allowed to bog down the presentation and make it more difficult to read. I have identified a few places where modest additions to the description of the design may help in the table below.

External Letter Peer Review of Draft Report “National Coastal Condition Assessment 2015”
22
1b. An important aspect for the reader to understand is that the NCCA assesses coastal condition at national and regional population scales and should not be used to estimate the conditions at any specific site. Is this clear to the reader? Yes, I believe that is quite clear. It may be worth mentioning specifically that the design was not aimed at identifying or sampling known “hotspots” or “areas of concern” which are dealt with in other programs. 1c. Are the results presented in a manner that is clear and intuitive to the reader? We would like your thoughts on whether the text and graphic formats convey the information effectively or if other approaches would be more intuitive. Yes, the results are presented in a clear and very effective manner in the main body of the report. The graphics are quite easy to understand and the explanatory graphics and text on page 19 is very helpful for a lay audience. One additional graphic that could be considered would be maps (similar to those on page 18) that show the good fair and poor areas along the coast lines in different colors. A caveat to this is that it may encourage readers to start interpreting them in site-specific terms which is not desired. 2. The NCCA 2015 Report presents results at the combined national estuary and combined Great Lakes scales. The report contains links to the NCCA dashboard for readers interested in regional condition estimates. 2a. Is this a reasonable way to provide a brief national report while still making regional results available to the reader? Yes it is. This document is an excellent entry point for a broad audience. People interested in more detail can then follow the links. I use documents like this when teaching introductory environmental science at my university and can often use data from associated websites or databases to develop assignments – they are very effective teaching aids. 2b. Are there additional features that you would like to see presented in future iterations of the NCCA dashboard? No comment 3. The NCCA biological indicators have been published in the peer-reviewed literature. Are these biological indicators being appropriately applied and do they support the NCCA’s goal of assessing the condition of the nation’s coastal waters at national and broad regional scales, and trends over time? Is the information presented for the biological condition indictors presented in a clear and understandable manner in the report? Please respond to this question for the following biological indices. 3a. M-AMBI for estuarine analyses No Comment

External Letter Peer Review of Draft Report “National Coastal Condition Assessment 2015”
23
3b. M-OTI for Great Lakes analyses No Comment 4. The metrics for the Sediment Quality Index have been published in the peer reviewed literature, and the procedure used to combine these metrics first published in the National Coastal Condition Assessment 2010 (EPA 841-R-15-006). Is the Sediment Quality Index being appropriately applied and does it support the NCCA’s goal of assessing the condition of the nation’s coastal waters at national and broad regional scales, and trends over time? Is the presented in a clear and understandable manner in the report? No Comment 5. The Eutrophication index (previously called the water quality index) has been used to assess EPA coastal waters for over fifteen years starting with the National Coastal Condition Report II (EPA-620/R-03/002). Does this index and each individual eutrophication-related measure support the NCCA’s goal of assessing the condition of the nation’s coastal waters at national and broad regional scales, and trends over time? Are the Eutrophication – related indicators used in the report clearly explained to the reader? No Comment 6. The Ecological Fish Contaminant Index was first developed and published in the National Coastal Condition Assessment 2010 (EPA 841-R-15-006) and was modified for this report. Is the underlying approach for the analysis of the Ecological Fish Tissue Contaminant Index scientifically sound? Note: The one ecotoxicology peer reviewer will focus on this question. Answering this question should be based on both the Summary Report and Chapter 7 of the Technical Support Document (TSD). 6a. Are the receptors of concern appropriate and do they adequately represent the wildlife populations potentially impacted by eating whole fish? The list of Receptors of Concern (TSD Table 7.2) appears to be reasonable choices for the most part. I could see adding lake trout and/or coho salmon as receptors of interest for the Great Lakes but as all that is used to characterize them further is body weight (TSD Table 7.3) they may not add much more to the process. TSD Table 7.3 should be revised and I have some concerns about a few of the values. First, we go from a list of species in Table 7.2 to just one unnamed member from each receptor group – The species selected for inclusion in the table should be named. Which bird from the list weighs 0.13 kg? What are the fish species that weigh 0.34 kg and 23.42 kg? How were these fish weights selected, given that fish keep growing with age? I see that the minimum weight of each receptor was chosen in order to derive the highest FIR values for each species. If the unidentified marine mammal is a harbor seal, the minimum size of an adult may be 58.8 kg but a newly weaned juvenile may be about 10 or 15 kg. In addition, the fish selected as ROCs come from different thermal regimes but there is no means provided to adjust metabolic rate and feeding rate for water temperatures.

External Letter Peer Review of Draft Report “National Coastal Condition Assessment 2015”
24
I also don’t get how the 340g fish has a feeding rate equivalent to 6.4% of body weight per day while the 550g (warm-blooded) mammal has a mass-specific feeding rate of 7.6% per day. The feeding rate for this fish seems to be too high in this comparison. The metabolic rate (and hence feeding rate) for a homeotherm should be about 10-fold higher than for an equivalent sized poikilotherm. I also don’t get how the food ingestion rate for the 23.42 kg fish is just 0.23% of body weight per day with an FIR that is only 2.5 times more than the freshwater fish that is 70 times smaller. Would a 23 kg tuna get by eating just 54 grams of food per day? I think these numbers need to be re-examined. Are there calculation errors? I have not examined the equations in Sample et al (1996) and Sample and Arenal (1999) to see if what I think is a problem is with their equations, but I do note that these references are now getting quite old and there have been considerable advances in measuring “field metabolic rates” in the last 20 years. 6b. Are the formulas for deriving screening values from Toxicity Reference Values appropriate? I have no concerns with the equations used for deriving the TRVs as they are aimed at a level similar to a screening-level risk assessment other than perhaps a re-examination of the estimates of FIR (noted above). There are ways to improve on these calculations by aiming to adopt a more species-specific approach for the selected ROCs such as using a bioaccumulation model calibrated for each ROC (body size, growth rate, metabolic and feeding rate, and better characterization of their prey). Doing that may not result in much of a change in the TRV but it would likely improve the confidence level associated with it. I have noted in places that the equations deal with each ROC in a fairly generic way as they are essentially defined by body size and do not address changes with life history such as longevity, growth, reproductive effort, etc. that can affect bioaccumulation processes and hence toxicity. This generic approach may be fine for relatively small organisms with short life spans like a mink, but it may not work as well for larger long-lived mammals such as harbor seals, bottlenose dolphin or walrus which have a large maternal investment in nursing their progeny. As I note in my comments (re page 53) lactational transfer of lipophilic contaminants like PCBs which can result in progeny having higher tissue concentrations than all other members of the population. This could make them more sensitive receptors of concern than smaller mammals like mink. 6c. Is use of the NOAEL for calculating screening values appropriate? In general, NOAELs are suitable for calculating screening values for this type of report. It is difficult for me to say more here as there is no description in the TSD (Chapter 7.4.4) of how the NOAELs were selected for the various contaminants considered, what endpoints they were associated with, nor were the values provided or references they were drawn from. This lack of transparency must be addressed before I would be able to comment on the process. 7. Is the approach used for analyzing contaminants for human health-based fish consumption benchmarks in fish fillet tissue composite samples in the Great Lakes and assessing the
External Letter Peer Review of Draft Report “National Coastal Condition Assessment 2015”
25
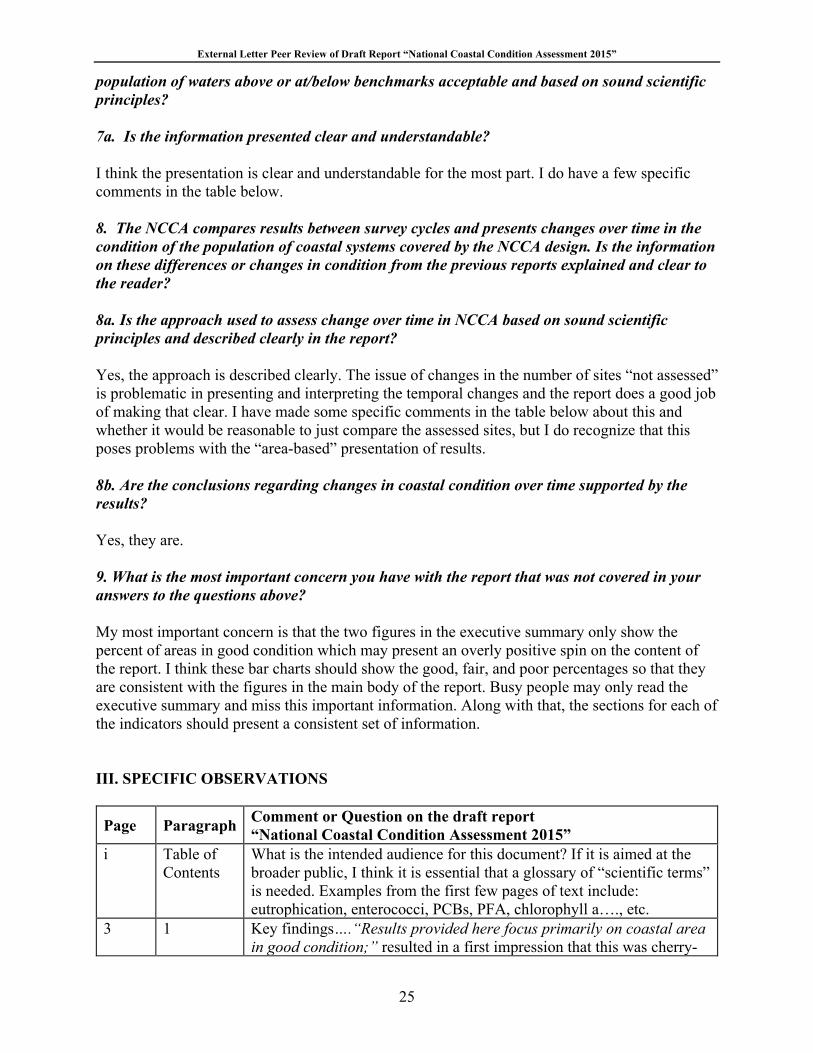
population of waters above or at/below benchmarks acceptable and based on sound scientific principles? 7a. Is the information presented clear and understandable? I think the presentation is clear and understandable for the most part. I do have a few specific comments in the table below. 8. The NCCA compares results between survey cycles and presents changes over time in the condition of the population of coastal systems covered by the NCCA design. Is the information on these differences or changes in condition from the previous reports explained and clear to the reader? 8a. Is the approach used to assess change over time in NCCA based on sound scientific principles and described clearly in the report? Yes, the approach is described clearly. The issue of changes in the number of sites “not assessed” is problematic in presenting and interpreting the temporal changes and the report does a good job of making that clear. I have made some specific comments in the table below about this and whether it would be reasonable to just compare the assessed sites, but I do recognize that this poses problems with the “area-based” presentation of results. 8b. Are the conclusions regarding changes in coastal condition over time supported by the results? Yes, they are. 9. What is the most important concern you have with the report that was not covered in your answers to the questions above? My most important concern is that the two figures in the executive summary only show the percent of areas in good condition which may present an overly positive spin on the content of the report. I think these bar charts should show the good, fair, and poor percentages so that they are consistent with the figures in the main body of the report. Busy people may only read the executive summary and miss this important information. Along with that, the sections for each of the indicators should present a consistent set of information. III. SPECIFIC OBSERVATIONS
Page Paragraph Comment or Question on the draft report “National Coastal Condition Assessment 2015”
i Table of Contents
What is the intended audience for this document? If it is aimed at the broader public, I think it is essential that a glossary of “scientific terms” is needed. Examples from the first few pages of text include: eutrophication, enterococci, PCBs, PFA, chlorophyll a…., etc.
3 1 Key findings….“Results provided here focus primarily on coastal area in good condition;” resulted in a first impression that this was cherry-

External Letter Peer Review of Draft Report “National Coastal Condition Assessment 2015”
26
Page Paragraph Comment or Question on the draft report “National Coastal Condition Assessment 2015” picking the good news and leaving lesser outcomes to later in the document that some readers might not get to.
2 2 The descriptions of the indicators is good as far as it goes but this section “What did the survey evaluate” and the following Key findings” gives no background whatsoever on how the rankings of “good” to “poor” were determined. This means of ranking or scoring is described starting on page 13 – maybe noting this in the executive summary would be good? It may be useful to include a brief outline on how these indicators were evaluated, scored, or ranked (not sure what the best term would be). A fairly generic example could be given in a figure.
3 and 4
Figures ES.1 and ES.2
These bar charts only show the percent “good”, while accompanying text provides limited and inconsistent information on the proportions ranked as fair or poor. Also, it is not shown how these have changed since the 2010 report (although a few are mentioned in the text). “Change over time” is one of the three core purposes of the survey. What I’m getting at is that the report should strive for consistent treatment/representation of the data from start to finish. These figures should be stacked bar charts showing percent “good, fair and poor” here in the executive summary?
3 last paragraph
“In the West” strikes me as a vague. Does it mean “along the West coast”? I finally see that “West” is defined on page 18.
4 1 Was there a contaminant that dominated at the “poor” locations (if so, which one(s)), or did it vary with location?
5 1 “Lake Erie was rated poor for phosphorus in 48% of the nearshore area.” Is it more appropriate to say “….in 48% of sampled nearshore locations.” They don’t really mean the same thing. This issue carries throughout the document – one of extrapolating from sampled “points” to “area”.
6 1 Is it still routine for USEPA to report concentrations as ppb or ppm? As opposed to mg/kg or ug/kg? I note that metric units are used in some places in the report (e.g., page 14 – Enterococci and Algal Toxins)
6 2 The conclusion section correctly highlights eutrophication as a significant problem, but is it the most significant? (It is noted on page 22 that it is “one of the most critical …”) Any mention of contaminant issues (mercury and PCBs) is notably absent from the conclusions which I believe is entirely inappropriate given that only 15% and of estuarine/coastal and 17% of Great Lakes report good results for ecological effects of contaminated fish (the lowest of the seven indicators.
8 1 I like that the design followed a stratified random method of site selection. The report reports results in terms of “percent of area” that ranks a s good, fair, or poor, but Chapter 2 does not describe how the transition from sampling “sites” to report results in terms of “area” is

External Letter Peer Review of Draft Report “National Coastal Condition Assessment 2015”
27
Page Paragraph Comment or Question on the draft report “National Coastal Condition Assessment 2015” achieved. Was some process used for this transition or is the use of “area” just a change in wording?
8 3 “Coming up in this report” is a good construct. 11 3 It would be prudent to list the contaminants measured for the indicator
“Ecological Effects of Fish Tissue Contamination” 13 2 The section on fish collection makes no mention of well-known factors
(species, trophic levels, size, age, lipid content) affecting concentrations of bioaccumulative contaminants such as PCBs and mercury. How was this addressed in sampling, making composite samples and data interpretation?
13 4 Scores of “0” are classified as poor, scores of “1” are good. What scores as “fair”? This shows up elsewhere in the report.
14 1 Could a reference be provided for where these selected “benchmarks for adverse effects” are summarized? I would assume they are in the TSD which is referenced in several other palaces in this report.
14 4 It appears as though the “ecological effects” evaluated here are for the traditional “growth, mortality, reproduction” endpoints, and that effects based on biomarkers for endocrine disruption, immunotoxicity, etc. are not used. I understand that there are challenges in doing so but would encourage that they be given some mention and be considered as significant endpoints in the future. They are especially important for assessing toxicity in species that cannot be tested in the lab, such as marine mammals. I also note here that the underlying NOAELs used in scoring this indicator are not summarized in Chapter 7 of the TSD.
15 1 What are the target fish species and minimum size for both freshwaters and estuaries?
15 3 This paragraph mixes metric (0.3 milligrams/kg) and ppb in the same paragraph. Consistent units should be used throughout. (ppm and ppb are increasingly viewed as outdated. Numerous other instances of this throughout the document.
15 4 Source for the PFOS benchmark? 19 The explanation of how to read/interpret the bar charts is very well
done and should be very helpful in making the document more accessible for the general public. Well done!
24 It is nice to see that by doing stratified random sampling, sediment quality appears to be good in most places. Should it be noted that this strategy may miss small known hotspots? I do recognize that the NCCA is not aimed at reporting on hotspots (nor does it exclude them) but their existence should be noted.
27 3 Mixing of metric units (used in the scientific community) and imperial (square miles used in the public sphere of the U.S.) always seems odd to me. Just a Canadian thing!
31 How these data for mercury are presented is fine, as is the text on this page, however, interpreting it from a risk perspective (and therefore the

External Letter Peer Review of Draft Report “National Coastal Condition Assessment 2015”
28
Page Paragraph Comment or Question on the draft report “National Coastal Condition Assessment 2015” ranking) is difficult to make sense of as I don’t know what sort of fish were used in the samples and how that could shape the results. As noted elsewhere – species, trophic level, age, and size all affect mercury concentrations.
33 This page is a very helpful guide – please keep it. 35,36 Given that there was a high proportion of sites where samples could not
be collected or assessed, will EPA use these data to modify or refine the site selection process to reduce this problem in the future? Not something for this report.
37 Fig 4.2.1 In this figure and others, is the Average condition a simple arithmetic mean of the values presented for the five lakes? Or is the average based on scores at all the sample sites across the lakes which would effectively be a weighted mean (taking into account the number of sites on each lake)? This comes back to the use of “percent of nearshore area” in these figures.
38 Fig 4.2.2. It is noted that Lake Huron saw a significant drop in area rated good, yet this is not discussed. Are there any reasons for this drop?
39 Fig 4.3.1 The results here for Lake Ontario look bad until one sees that it is because 58% was unassessed. When one excludes the “unassessed”, Lake Ontario shows a 50:50 split between good and fair sites. As noted previously, can the selection of sample sites be refined to reduce the large number of unassessed sites in Lake Ontario?
41 Fig 4.4.1 and text
As noted elsewhere, it is not clear what fish are being monitored here with regard to species, size/age, and trophic level. Doing wildlife risk assessment should aim to match the sample make-up to the diet of the wildlife of concern (ROC). If the fish sample is a composite of the fish caught, how does it compare to the “food basket” for the wildlife?
42 Fig 4.4.2 This figure appears to send a positive message that contaminants of concern are in decline, but may be due to the inclusion of the unassessed sites in making up the bar charts (i.e., “may not reflect a true change”). It appears that the statistical analysis includes the “not assessed category”, but a good case could be made to exclude it from the analysis. I guess it comes down to whether the percentages represent “sampling sites” versus “areas” which I have raised previously. It would be nice to know which contaminant(s) are driving this apparent decline. Is it PCBs? Interesting too that the text focuses on selenium – but it is not clear why selenium deserves this level of attention.
43 and 44
While not an expert in this area, I suspect that Enterococci and algal toxin levels would be transitory in nature and likely to be more elevated when water temperatures are warmest (July/August). This would suggest then that timing of sampling could be a factor in detecting samples (areas?) that exceed the benchmarks. Is this addressed anywhere in sample design or analysis?

External Letter Peer Review of Draft Report “National Coastal Condition Assessment 2015”
29
Page Paragraph Comment or Question on the draft report “National Coastal Condition Assessment 2015”
45 Fig 4.7.1 Good to see in the lower right text box that EPA is reviewing field procedures for fish sampling. Reducing the “not assessed” areas would be very helpful – Of the 36% of Lake Ontario assessed, 75% is below the benchmark which may be closer to the true situation than the 27% shown in the figure.
46 subscript 11
Thanks for including the description of how the composite samples were formed. It would be nice to know what species were included in this effort and how it reflects what fishers tend to consume (similar issue as noted regarding fish samples for the “Ecological Effects” indicator – I suspect that would be a frequent question from people that would read this report.
47 Table 4.8.1 ppb versus ug/kg or ng/g? Units should be consistent throughout the document. (good to see on the following page that ppb is related to mg/kg). I assume these are expressed on a tissue wet weight basis (ah – this is stated in the following page).
48 Figures 4.8.1 and 4.8.2
It is still not clear how data from 152 composite fish samples are transformed into nearshore areas of “n” square miles. I’m guessing that the random sample taken within each “sampling block” is deemed to be representative of a certain area. This seems to preclude the possibility of any significant variability within blocks – which clearly is not the case as shown by contaminant hotspots (Great Lakes Areas of Concern). I also find it hard to accept describing the fish data as a “sampled population”. This seems to be a statistical view rather than a biological view of “population”.
50 4 Could you include here the web links where these data can be found. I imagine they are given elsewhere in the document, but it is helpful to place them in more than one location, especially when they are noted like this.
51 1 Good that the issue of changes in sampling success is raised as a possible driver of the apparent changes.
52 Table 5.1 This table is a repeat of table 4.8.1. I don’t see any need to include it again.
53 2 The approach presented in Chapter 7 of the TSD updating the “ecological fish tissue contaminant index” is suitable for this sort of screening level risk assessment. I will note, however, that the relatively simple approach used excludes the important process in marine mammals of lactational transfer of lipophilic contaminants like PCBs which can result in progeny having higher tissue concentrations than all other members of the population. This could make them more sensitive receptors of concern than smaller mammals like mink.
53 5 I appreciate the inclusion of the “What’s Next” section. As it was raised in several locations in the report, it would be good to add a statement on what changes in sampling strategy/effort were taken to

External Letter Peer Review of Draft Report “National Coastal Condition Assessment 2015”
30
Page Paragraph Comment or Question on the draft report “National Coastal Condition Assessment 2015” reduce the number of “not assessed” locations that impede the interpretation of some indices
55 I don’t see the reference to the TSD included here. Will it be added?
Page Paragraph Comment or Question on the draft report “National Coastal Condition Assessment 2015 TSD”
76 1 Does this include marine mammals that inhabit estuaries such as bottlenose dolphin, harbor seals, etc. that are especially adept at bioaccumulating POPs? OK (P84 Mink are used as ROC mammal due to small size and highest ingestion rate). The wildlife exposure handbook makes no reference to contaminant transfer by lactation which has been shown to be equivalent to an extra trophic level.
77 2 Reference to Wagemann (1997) is fine but could, none the less, be updated to confirm it remains valid.
77 2 “including congeners 8…” ? Does this mean that other congeners may be included in some cases or does it mean Only these congeners are included?
81 last Are there errors or uncertainties associated with these scaling factors set by Sample and Arenal 1999). As noted in my answers to the charge questions, I have concerns about the FIR values presented in Table 7.3 (page 80)
81 table 7.4 Does FW = fresh water. Are these also used for marine species? Where did the NOAELs used in Eqn7-3 come from that are used to derive the TRVs reported in table 7-4? A table of them needs to be added along with references and what the endpoints they were associated with. There should also be some description about how these NOAELs were selected, or a reference given regarding this. Not including the NOAELs is a significant loss in transparency.
84 table 7.6 It is noted that two mammal receptor group SVs were calculated and the more sensitive FW group was used in the EFTCI. What was the marine species? I presume it was harbor seal. I assume the SVs for mink were deemed more sensitive?

External Letter Peer Review of Draft Report “National Coastal Condition Assessment 2015”
31
David A. Nemazie, M.S.
University of Maryland Center for Environmental Science

External Letter Peer Review of Draft Report “National Coastal Condition Assessment 2015”
32
Peer Review Comments of Draft Report “National Coastal Condition Assessment 2015” David A. Nemazie, M.S. April 25, 2021 I. GENERAL IMPRESSIONS The National Coastal Condition Assessment 2015 is written for a broad audience. Most scientific terms are defined in a simple manner that most individuals with a high school education should be able to read. Policy makers would be able to pick up the general essence of the coastal conditions at a national and regional scale. The Report is organized very well and the authors maintained an easy format throughout that made it simple to follow along. The graphs showing the data were easy to understand. The use of “call-out” boxes associated with the graphs was most helpful. The comparisons to earlier NCCA data-sets were helpful and easy to interpret. The use of percentages of samples associated “good,” “fair,” and “poor” conditions were also easy to understand. However, the conditions “good,” “fair,” and “poor” we never defined within this document. I recognize that the conditions are defined based on the specific indicators within the technical document. I believe general definitions would help the reader have a clear picture of what good, fair, and poor mean in the context of the Report. Without definitions the reader may make up their own sense of what it means. The reader may get frustrated by the simple questions of what does “good” really mean? If the water is “poor” does it mean it is dangerous to human health?? I recommend that a box simply defining “good,” “fair,” and “poor” in context of: 1) ecological condition; 2) human uses such fishing, swimming, and recreating would be appropriate for this audience. The photos, tables, and other graphics were generally appropriate. However, I’ve noted some specific recommendation for changes to consider below. Highlighted boxes (often with a green background) offered useful additional information without overburdening the reader. II. RESPONSE TO CHARGE QUESTIONS 1. Does the organization and content of the NCCA 2015 Report seem appropriate and does it present the material in an understandable manner for its target audience (i.e. general public or environmental policymakers)? For example: 1a. Are the goals, purpose, and design of the study clearly described for the target audience? The NCCA 2015 Report does an excellent job at explaining goals, purpose, and design of the study. Although perhaps difficult to do, there may be some value to explain how past NCCA reports have been used to help impact policies, regulations, or “behavior” particularly related to implementation of best management practices. 1b. An important aspect for the reader to understand is that the NCCA assesses coastal condition at national and regional population scales and should not be used to estimate the conditions at any specific site. Is this clear to the reader?

External Letter Peer Review of Draft Report “National Coastal Condition Assessment 2015”
33
Yes, it is very clear that site specific data are not available and that the data are aggregated into regions. 1c. Are the results presented in a manner that is clear and intuitive to the reader? We would like your thoughts on whether the text and graphic formats convey the information effectively or if other approaches would be more intuitive. As noted above, my greatest concern was the lack of definitions for “good, fair, and poor.” I believe that gap may leave it too subjective to the reader to be useful. 2. The NCCA 2015 Report presents results at the combined national estuary and combined Great Lakes scales. The report contains links to the NCCA dashboard for readers interested in regional condition estimates. 2a. Is this a reasonable way to provide a brief national report while still making regional results available to the reader? I found that it was barely mentioned that this “National Report” was only related to the 48 contiguous states and left off a mention of Alaska and Hawaii. I believe referring to other assessment reports focused on Alaska and Hawaii would serve the reader well. Therefore, I thought it may be more useful to have a separate report for the Great Lakes, even if the data were collected within the same time-frame. While there may be some redundances it may be easier for the reader to handle the vast difference between these ecosystems as well as some of the indicators. 2b. Are there additional features that you would like to see presented in future iterations of the NCCA dashboard? The Report did mention using several new indicators such as microplastics and nitrogen isotopes in sediment. Assessments of “trash” may also be a good indicator to consider in the future which may be simplified if the video sampling analysis becomes more broadly understood and incorporated. However, I believe a few indicators can be removed – particularly the ones that do not show any significant variations in results in the entire country or region (microcystins, enterococci, and PFOS*. The ephemeral nature of microcystins and enterococci may make interpreting their lack of finding within the environment much more likely due to the lack of time-series sampling. Because microcystins were never rated anything lower than “good”, I recommend that the methodology of measuring microcystins should be removed in its entirety (delete page 30). For example, the PFAS call-out box seems to be an appropriate size for this new indicator.

External Letter Peer Review of Draft Report “National Coastal Condition Assessment 2015”
34
*As the understanding of the PFAS class of chemicals becomes better understood , as well as its sampling and analytical methodologies, this indicator may be worth keeping either for PFOS and/or other members of the PFAS family. I know there has been some sampling of fish tissue estuarine waters. If standard methods for collection and measuring advance, it may be worthwhile expanding this indicator throughout the nation – at least 1 time. If the results remain “within acceptable limits” for >90% of the samples, then I would recommend dropping it entirely. 3. The NCCA biological indicators have been published in the peer-reviewed literature. Are these biological indicators being appropriately applied and do they support the NCCA’s goal of assessing the condition of the nation’s coastal waters at national and broad regional scales, and trends over time? Is the information presented for the biological condition indictors presented in a clear and understandable manner in the report? Please respond to this question for the following biological indices. 3a. M-AMBI for estuarine analyses I’m not an expert in these techniques but I found their explanation to be simple and accurate. The use of biological indicators has been used for decades and is very important to integrator. I am glad to see progress being made in those biological indicators, presumably using collection techniques and species that better reflect today’s understanding. 3b. M-OTI for Great Lakes analyses I’m not an expert in these techniques but I found their explanation to be simple and accurate. The use of biological indicators has been used for decades and is very important to integrator. I am glad to see progress being made in those biological indicators, presumably using collection techniques and species that better reflect today’s understanding. 4. The metrics for the Sediment Quality Index have been published in the peer reviewed literature, and the procedure used to combine these metrics first published in the National Coastal Condition Assessment 2010 (EPA 841-R-15-006). Is the Sediment Quality Index being appropriately applied and does it support the NCCA’s goal of assessing the condition of the nation’s coastal waters at national and broad regional scales, and trends over time? Is the presented in a clear and understandable manner in the report? I’m not an expert in sediment assessments but based on my limited experience, the Sediment Quality Index is being used appropriately. It was well explained and understandable to a general audience. The trends over time are appropriate and simple to understand. 5. The Eutrophication index (previously called the water quality index) has been used to assess EPA coastal waters for over fifteen years starting with the National Coastal Condition Report II (EPA-620/R-03/002). Does this index and each individual eutrophication-related measure support the NCCA’s goal of assessing the condition of the nation’s coastal waters at national and broad regional scales, and trends over time? Are the Eutrophication – related indicators used in the report clearly explained to the reader?

External Letter Peer Review of Draft Report “National Coastal Condition Assessment 2015”
35
Yes, the Eutrophication Index has the appropriate indicators and they appear to be interpreted properly within the 2015 data set as well as the changes over time. The indicators are clearly explained to the reader. 6. The Ecological Fish Contaminant Index was first developed and published in the National Coastal Condition Assessment 2010 (EPA 841-R-15-006) and was modified for this report. Is the underlying approach for the analysis of the Ecological Fish Tissue Contaminant Index scientifically sound? Note: This question is optional. The one ecotoxicology peer reviewer will focus on this question, but if you feel qualified, you are welcome to weigh in on this topic. Answering this question should be based on both the Summary Report and Chapter 7 of the Technical Support Document (TSD). Specifically, consider the following three aspects of the approach. Specifically, consider the following three aspects of the approach. 6a. Are the receptors of concern appropriate and do they adequately represent the wildlife populations potentially impacted by eating whole fish? I do not feel qualified. However, I think that the indicator was explained in a manner that was understandable to a broad population. If selenium was never found to be above current standards – could/should it be removed as a parameter? Perhaps with only spot checks in future assessments. NOTE: I found it surprising that fish in Lake Erie had the least amount of contamination. 6b. Are the formulas for deriving screening values from Toxicity Reference Values appropriate? I do not feel qualified to comment. 6c. Is use of the NOAEL for calculating screening values appropriate? I do not feel qualified to comment. 7. Is the approach used for analyzing contaminants for human health-based fish consumption benchmarks in fish fillet tissue composite samples in the Great Lakes and assessing the population of waters above or at/below benchmarks acceptable and based on sound scientific principles? 7a. Is the information presented clear and understandable? I have concerns with the use of “assessing the population of waters.” Population of waters makes sense from a statistical analysis perspective but can easily be misinterpreted by the broad audience this report is meant to communicate to. I’m also concerned with how the broader public may misinterpret the difference scales for mercury and PCBs. Frankly, I do not understand the differences between EPAs cancer and noncancer benchmarks for PCBs. The fact that 70% meet the Canner Benchmark of >18 ppb for PCBs vs the Noncancer Benchmark of 44% with the higher level of PCB >73 ppb. Is that an error?? I do not believe that was properly explained within the text.

External Letter Peer Review of Draft Report “National Coastal Condition Assessment 2015”
36
8. The NCCA compares results between survey cycles and presents changes over time in the condition of the population of coastal systems covered by the NCCA design. Is the information on these differences or changes in condition from the previous reports explained and clear to the reader? 8a. Is the approach used to assess change over time in NCCA based on sound scientific principles and described clearly in the report? Yes, the change over time results were very useful. This report has taken an appropriately conservative approach to the analysis particularly pertaining to the changes to “Not Assessed” percentages. While referring to some results as “statistically significant” may be unclear to some – it offers the clarity to the vast majority of the potential readers. 8b. Are the conclusions regarding changes in coastal condition over time supported by the results? The conservative approach that was employed in the analysis supports the interpretation of the results. For that reason, I was pleased to see the comparisons and found it to be an important part of the conclusions and the entire report. 9. What is the most important concern you have with the report that was not covered in your answers to the questions above? Please see my general comments in section I above regarding the lack of definitions of “good, fair, and poor” and what that means from an ecological or human health perspective. This is my greatest concern with the draft Report as different people can have different definitions for those three categories. Also was there ever consideration of a category called “Excellent.” In the future, that may add value to the understanding of our coastal systems. III. SPECIFIC OBSERVATIONS
Page Paragraph Comment or Question on the draft report “National Coastal Condition Assessment 2015”
TOC #1
Exec Summary
For both “Estuaries” and “Nearshore Great Lakes” recommend a better delineation for “Ecological Indicators” and Human Health Indicators – perhaps an additional indentation
1 1 Recommend that it’s made clear this is assessment is only for the 48 contiguous states.
3 1 2nd sent: should be “areas” 3 3 Consider changing “however” to “while” since that is a positive change
even if it impacts the interpretation of the analysis of results 4 2 “…algal blooms are ephemeral and produce…” This sentence also
suggests that all harmful algal blooms produce toxins but the definition used in this report clearly states a harmful algal bloom, can be harmful due to its ability to consume oxygen.

External Letter Peer Review of Draft Report “National Coastal Condition Assessment 2015”
37
Page Paragraph Comment or Question on the draft report “National Coastal Condition Assessment 2015”
4 2 Last sentence: refers to recreational fisherman checking with the “…state health department…” – elsewhere in the document it correctly suggests that fisherman “should consult state, tribal, or local advisories” which is much broader than this sentence.
6 1 2nd sent: Recommend changing “In addition…” to “However” 6 4 2nd sent: “EPA, other federal agencies, and states…” should “tribes” be
added to this list?? 7 3 3rd sent: “A variety…” I recommend including groundwater into this
list. 7 Last para Last sent: “…nationwide data collection and reporting…” 7 Note #2 Is not referenced within the text on that page as best as I can find 9 4 2nd sent: This is a very awkward sentence and the use of “…waters of
interest in groups (or strata)…” sounds like legalize and may be misinterpreted by a general audience.
10 Fig 2.1 I do not recommend you use the word “population” in reference to waters. That’s too much of a statistical term and can easily be misinterpreted to refer to organisms, fish, or humans.
13 2 3rd sent: recommend “…5-20…” instead of “…five to 20…” 18 “West” If SF Bay is the largest estuary in the West region is the word
“sampled” necessary. That implies there is a larger estuary in the West region that was not sampled. If so, which one and why not??
19 Fig 3.0.2 The graphic is missing the region header of “North East” 20 1 Not sure what a “low-level” predator is within this context – due you
mean mummichog as the graphic suggests. Too easy to misconstrue. Certainly some high level predators, such as sturgeon or stiped bass eat worms, mollusks, and crustaceans.
21 3.1.2 1st small interpretive box: “…the improvement was, in part, due to…” I think that may better capture what is taking place without while maintaining a conservative approach to this potential bias.
21 Text in header
Due to the bias you may want to use the word “indicates” within this sentence
26 3 Not sure what “protective” means in this sentence. Too easy to misconstrue.
27 Last para If 79% were at or below benchmarks and 21% were not assessed did any samples have excess selenium. If not, then clearly state that. If a few and the percentages are rounding errors perhaps just state the number that were above benchmarks. Presumably it would be a VERY low number of sites.
28 I think this is a good time to mention that grab sampling often does not capture ephemeral events such as such as being measured for enterococci contamination.
Page 29 and 30
Page 30 refers to one site that had microcystins above benchmark but page 29 states “in all” estuarine waters. So does that mean the one sample of microcystin was in the Great Lakes or is there an error in the

External Letter Peer Review of Draft Report “National Coastal Condition Assessment 2015”
38
Page Paragraph Comment or Question on the draft report “National Coastal Condition Assessment 2015”
text? I found the answer on page 44. Therefore page 30 should refer to one sample with high microcystin in Lake Erie.
31 1 Last sent: remove “themselves” as it is not needed. 34 Maps I found the use of a blackened line to delineate the sampling area to be
VERY difficult to see. I recommend changing the color so it stands. If that change is made then the regional estuarine should also match that same color.
41 2 Again, the use of “protective” in the context of benchmarks used to assess condition. I do not believe that word should be used in this context as it can be easily misconstrued.
42 Last para Same comment that I made for page 27 regarding selenium. 47 3 PFAS are a group of synthetic chemicals…” 52 Table 5.1 This is the same table as 4.8.1 - does this need to be repeated here as
opposed to being simply referenced

External Letter Peer Review of Draft Report “National Coastal Condition Assessment 2015”
39
Donald Scavia, Ph.D. University of Michigan

External Letter Peer Review of Draft Report “National Coastal Condition Assessment 2015”
40
Peer Review Comments of Draft Report “National Coastal Condition Assessment 2015” Donald Scavia, Ph.D. April 14, 2021 I. GENERAL IMPRESSIONS Good, Fair, Poor designations: While I appreciate the desire for brevity in the summary report, I think there needs to be more information brought in from the Technical Report. If the Summary Report was only intended for the general public, the level of explanation and coverage is probably ok. But, in several places, the report claims to be useful to water resource managers and environmental policy makers. In this regard, I think there needs to be more information on the basis of the “good, fair, poor” assessments. I appreciate that these differ among the various indexes and indicators, but including some graphics or tables (or at least an example like Table 5.7 in the Technical Report) would be helpful. It could even be an appendix to the Summary Report because, while it’s all in the TSD, it would be good to have a sense that it is justified. Otherwise, it feels like “some folks got together and decided”. Assessments: I am concerned about the “not assessed” category. For example, it was not clear until I looked at charts in more detail that, “50% good” meant 50% of all areas, not 50% of assessed area. It seems to me that 50% of all areas can be misleading, especially when comparing scores over times when the % area assessed changed. This issue is noted several times in the report, but I am not sure it is done clearly enough, nor strongly enough because it can completely mask reality. In fact, I suggest EPA rethink this approach to consider reporting % of assessed areas instead of % of all areas. Particularly when a large portion of area is not assessed or when the % assessed changes a lot. Sample Design - spatial: The reader is given no sense of the actual extent or distribution of sample sites. Again, for the public that is probably ok. But for others, it is unknown if there was one sample taken in the Chesapeake Bay or in Lake Erie or 100s? The maps on page 10 are not very useful and they are basically repeated regionally later on. So, it might be useful to replace them with a couple examples of actual sample stations for the Chesapeake Bay and Lake Erie (for example). Sample Design – temporal: If, as it appears, these stations were only visited once (or a second time for statistical over sampling), then I wonder if the eutrophication indicators really have any meaning. Unlike sediment and fish that integrate over time, the water quality parameters are highly dynamic seasonally. How can one sample per year capture eutrophication? This is also true for the toxic algae measures. Uneven explanations: It is not clear why, for example, an entire page is allocated to ELISA, yet virtually nothing on other measures. If “good, fair, poor” indicator definitions were to be included, as I suggest above, the full-page on ELISA can be eliminated to make room. It was also not clear why the Lake Erie Eutrophication Cause/Effect was singled out. I’m pretty sure this kind of description (it’s actually a useful caveat for interpreting the results) could have been included many other times for other places and issues. Why this one? Comparisons with other NARS programs: These comparisons were interesting, but I think they might be more informative if appropriate results from other NARS programs were added to the graphics instead of just included in the paragraphs.

External Letter Peer Review of Draft Report “National Coastal Condition Assessment 2015”
41
Redundant paragraphs: This is not a big deal (and maybe it’s necessary) but much of the language is repeated over and over. Perhaps there is some way to consolidate some of it to make room for some more of the background information I mentioned above. II. RESPONSE TO CHARGE QUESTIONS 1. Does the organization and content of the NCCA 2015 Report seem appropriate and does it present the material in an understandable manner for its target audience (i.e. general public or environmental policymakers)? For example: 1a. Are the goals, purpose, and design of the study clearly described for the target audience? Yes, it has in general, but I have concerns about the “environmental policymaker” audience. This is addressed in the General Impressions. 1b. An important aspect for the reader to understand is that the NCCA assesses coastal condition at national and regional population scales and should not be used to estimate the conditions at any specific site. Is this clear to the reader? Yes, this has been made clear in several places. 1c. Are the results presented in a manner that is clear and intuitive to the reader? We would like your thoughts on whether the text and graphic formats convey the information effectively or if other approaches would be more intuitive. The use of bar graphs, with numeric annotation is good. The use of error lines on the graphs are also good. I worry that the information on unassessed areas might be confusing. This is addressed in the General Impressions section. 2. The NCCA 2015 Report presents results at the combined national estuary and combined Great Lakes scales. The report contains links to the NCCA dashboard for readers interested in regional condition estimates. 2a. Is this a reasonable way to provide a brief national report while still making regional results available to the reader? This seems like a rational compromise between national and regional reporting. But, when I downloaded a subset of the data, it was pretty hard to understand without metadata. For example, the column headings were undecipherable. This may not be important for the general public, but I imagine managers and policymakers, or their staff, would need it. 2b. Are there additional features that you would like to see presented in future iterations of the NCCA dashboard? Not at this time.

External Letter Peer Review of Draft Report “National Coastal Condition Assessment 2015”
42
3. The NCCA biological indicators have been published in the peer-reviewed literature. Are these biological indicators being appropriately applied and do they support the NCCA’s goal of assessing the condition of the nation’s coastal waters at national and broad regional scales, and trends over time? Is the information presented for the biological condition indictors presented in a clear and understandable manner in the report? Please respond to this question for the following biological indices. 3a. M-AMBI for estuarine analyses These are described and represented clearly, but see General Impressions on my concerns about ‘good, fair, poor’ indicators. 3b. M-OTI for Great Lakes analyses These are described and represented clearly, but see General Impressions on my concerns about ‘good, fair, poor’ indicators. 4. The metrics for the Sediment Quality Index have been published in the peer reviewed literature, and the procedure used to combine these metrics first published in the National Coastal Condition Assessment 2010 (EPA 841-R-15-006). Is the Sediment Quality Index being appropriately applied and does it support the NCCA’s goal of assessing the condition of the nation’s coastal waters at national and broad regional scales, and trends over time? Is the presented in a clear and understandable manner in the report? These are described and represented clearly, but see General Impressions on my concerns about ‘good, fair, poor’ indicators. 5. The Eutrophication index (previously called the water quality index) has been used to assess EPA coastal waters for over fifteen years starting with the National Coastal Condition Report II (EPA-620/R-03/002). Does this index and each individual eutrophication-related measure support the NCCA’s goal of assessing the condition of the nation’s coastal waters at national and broad regional scales, and trends over time? Are the Eutrophication – related indicators used in the report clearly explained to the reader? These are described and represented clearly, but see General Impressions on my concerns about ‘good, fair, poor’ indicators. I am also concerned about the sampling design for water quality measures. It appears that the stations are sampled only once (with some resampling for statistical purposes). I find it hard to believe that the real nature of the regions’ eutrophication status can be captured this way. These measures vary dramatically over the season. 6. The Ecological Fish Contaminant Index was first developed and published in the National Coastal Condition Assessment 2010 (EPA 841-R-15-006) and was modified for this report. Is the underlying approach for the analysis of the Ecological Fish Tissue Contaminant Index scientifically sound? Note: This question is optional. The one ecotoxicology peer reviewer will focus on this question, but if you feel qualified, you are welcome to weigh in on this topic. Answering this question should be based on both the Summary Report and Chapter 7 of the Technical Support Document (TSD). Specifically, consider the following three aspects of the approach.

External Letter Peer Review of Draft Report “National Coastal Condition Assessment 2015”
43
6a. Are the receptors of concern appropriate and do they adequately represent the wildlife populations potentially impacted by eating whole fish? I will defer to the ecotoxicology expert on this. 6b. Are the formulas for deriving screening values from Toxicity Reference Values appropriate? I will defer to the ecotoxicology expert on this. 6c. Is use of the NOAEL for calculating screening values appropriate? I will defer to the ecotoxicology expert on this. 7. Is the approach used for analyzing contaminants for human health-based fish consumption benchmarks in fish fillet tissue composite samples in the Great Lakes and assessing the population of waters above or at/below benchmarks acceptable and based on sound scientific principles? 7a. Is the information presented clear and understandable? Yes, reference to the standard approaches used for the Great Lakes is clear and understandable. 8. The NCCA compares results between survey cycles and presents changes over time in the condition of the population of coastal systems covered by the NCCA design. Is the information on these differences or changes in condition from the previous reports explained and clear to the reader? 8a. Is the approach used to assess change over time in NCCA based on sound scientific principles and described clearly in the report? These are presented clearly, but see my comments in the General Impressions section about the impacts of ‘unassessed areas”. This needs to be better described, and perhaps addressed differently. 8b. Are the conclusions regarding changes in coastal condition over time supported by the results? See notes above on “unassessed areas” 9. What is the most important concern you have with the report that was not covered in your answers to the questions above? While I appreciate the desire for brevity in the summary report, I think there needs to be some more information brought in from the Technical report. See General Impressions.

External Letter Peer Review of Draft Report “National Coastal Condition Assessment 2015”
44
III. SPECIFIC OBSERVATIONS
Page Paragraph Comment or Question on the draft report “National Coastal Condition Assessment 2015”
4 3 Should be “Great Lakes” not “estuarine” 9 3 What is the justification for 30m/5km. Seem pretty arbitrary? 10 Maps These are really not very useful here, and redundant with later maps.
Maybe replace with examples of what the sampling stations look like in a few places?
14 4 Why is selenium singled out compared to other chemicals? There is no explanation.
52 3 The microcystin sentences are confusing. It starts saying there were no exceedances, but then reports pretty low % areas below the benchmarks

External Letter Peer Review of Draft Report “National Coastal Condition Assessment 2015”
45
Michael R. Twiss, Ph.D. Clarkson University

External Letter Peer Review of Draft Report “National Coastal Condition Assessment 2015”
46
Peer Review Comments of Draft Report “National Coastal Condition Assessment 2015” Michael R. Twiss, Ph.D. April 25, 2021 I. GENERAL IMPRESSIONS Overall, the NCCA 2015 Report provides a sound analysis of the observations used to assess coastal conditions, synthesizes the data into readily communicated information for summary, and it states conclusions that follow from the data presented. The information is presented at the scientific literacy level of an interested stakeholder or environmental manager at both national and regional scales. Caveats in the data analysis are noted and explanations are provided when these are stated. The power in the NCCA program is the adherence to standardized protocols using scientifically defensible techniques for sample site selection, sampling, and data analysis, that is providing a sound long-term coastal ecosystem assessment. Some edits are suggested. A) Greater scientific literacy can be assumed in a reader of the NCCA Report. For example, the use of specific terms like ‘cyanobacteria’ rather than using ‘algae’ as a colloquial term to include algae (eukaryotic protists) and cyanobacteria (prokaryotes) is useful, as noted in the specific comments (see Section III). B) The NCCA should be quantified as summer-specific assessment. With climate change occurring, winter is the season that is changing the most and may perhaps show the greatest response to stressors such as eutrophication and contaminants. C) There are specific requests (see Section III, below) for increased clarity in the presentation of some figures. For example, the presentation of individual Great Lakes is clear, although order of Great Lakes as presented misses the opportunity to provide an additional gradient of elevation. The hydraulic residence time of the Great Lakes system is approximately 600 years (Quinn 1992) and a gradient of increasing water salinity from Lake Superior down to Lake Ontario exists and also a cumulative impact gradient as the watersheds of each lake are progressively more populated. D) Finally, the Great Lakes are an enormous freshwater system. As noted in Section II.9, there is a need to incorporate the connecting waters in this system, which are recognized by treaty by the United States to be integral components of the Great Lakes (Boundary Waters Treaty, 1909) and are defined by the NCCA as nearshore waters. Boundary Waters Treaty. 1909. https://www.ijc.org/en/boundary-waters-treaty-1909 Quinn, F. H. (1992). Hydraulic residence times for the Laurentian Great Lakes. Journal of Great
Lakes Research, 18(1), 22-28.

External Letter Peer Review of Draft Report “National Coastal Condition Assessment 2015”
47
II. RESPONSE TO CHARGE QUESTIONS 1. Does the organization and content of the NCCA 2015 Report seem appropriate and does it present the material in an understandable manner for its target audience (i.e. general public or environmental policymakers)? For example: 1a. Are the goals, purpose, and design of the study clearly described for the target audience? Yes. People who have a stake in water resources nationally or on a local scale will be able to understand the language used in this report and the way in which results are presented. The approach that the NCCA takes is very well described. The scale is understood and the design of the sampling is well presented and repeated several times throughout the document so that the average lay person or environmental manager would be able to understand the goals, purpose, and design of this ongoing assessment exercise. 1b. An important aspect for the reader to understand is that the NCCA assesses coastal condition at national and regional population scales and should not be used to estimate the conditions at any specific site. Is this clear to the reader? Yes, the maps and text delineate the scale of the various contiguous US coastlines that are part of the sampling design. However, it would be additionally useful to state in the title and executive summary that the estuaries do not include those in Alaska or any other US territory – this is not discovered by a reader until page 13 of the pdf. The design is adequately stated so that the conclusions should be readily interpreted on the basis of each Great Lake’s nearshore zone (or the Great Lakes collectively) and the estuaries of large coastal regions on the East, Gulf, and West coasts. 1c. Are the results presented in a manner that is clear and intuitive to the reader? We would like your thoughts on whether the text and graphic formats convey the information effectively or if other approaches would be more intuitive. The results are mostly presented in a clear and intuitive manner. I appreciated the effort to synthesize the data down to provide as simple a presentation of the data as possible while still maintaining enough spatial and temporal (when possible) detail. In several instances, the data could be presented more intuitively. For example, Figure 4.8.3 is not at all intuitive (see comment in Section III). Also, in Chapter 4, the order of the Great Lakes is presented in a non-intuitive manner (neither by size, area, nor even alphabetically). It would be best to list them in order of elevation, which indicates director of water flow (see Section III for specific details). 2. The NCCA 2015 Report presents results at the combined national estuary and combined Great Lakes scales. The report contains links to the NCCA dashboard for readers interested in regional condition estimates. 2a. Is this a reasonable way to provide a brief national report while still making regional results available to the reader? Yes, the “National Coastal Condition Assessment 2015” report is essentially an extended summary of the more extensive Technical Support Document. A document of this length

External Letter Peer Review of Draft Report “National Coastal Condition Assessment 2015”
48
provides a good overview and allows trends in coastline condition (where available) to be conveyed. 2b. Are there additional features that you would like to see presented in future iterations of the NCCA dashboard? As noted above, the order of the Great Lakes is presented in a non-intuitive manner in the dashboard. An added feature that is not available in the printed report but readily possible on the NCCA dashboard would be the possibility of listing the lakes by elevation, or total area of nearshore, or even alphabetically. 3. The NCCA biological indicators have been published in the peer-reviewed literature. Are these biological indicators being appropriately applied and do they support the NCCA’s goal of assessing the condition of the nation’s coastal waters at national and broad regional scales, and trends over time? Is the information presented for the biological condition indictors presented in a clear and understandable manner in the report? Please respond to this question for the following biological indices. 3a. M-AMBI for estuarine analyses The use of past data to support the M-AMBI (multivariate Marine Biotic Index developed by the AZTI-Spain) approach to assessing benthic habitat condition is appropriate since the data were collected in previous coastline surveys in a consistent manner and the M-AMBI can be applied retrospectively, as stated in the report. 3b. M-OTI for Great Lakes analyses Yes, the benthic Oligochaete Trophic Index (B-OTI) is appropriately applied. Use of oligochaete trophic indices is a well-established approach to evaluating eutrophic conditions that was developed over four decades ago (Howmiller & Scott 1977; Lauritsen et al. 1985; Milbrink 1983). Yes, the data are presented clearly. Since there is a rich data base (dating back to 2010) this strengthens the temporal trend analysis. Also, the caveats regarding the use of the B-OTI (Chapter 4.1) is well described so a reader can judge the confidence in the findings. Howmiller, R. P., & Scott, M. A. (1977). An environmental index based on relative abundance
of oligochaete species. Journal (Water Pollution Control Federation), 809-815. Lauritsen, D. D., Mozley, S. C., & White, D. S. (1985). Distribution of oligochaetes in Lake
Michigan and comments on their use as indices of pollution. Journal of Great Lakes Research, 11(1), 67-76.
Milbrink, G. (1983). An improved environmental index based on the relative abundance of oligochaete species. Hydrobiologia, 102(2), 89-97.
4. The metrics for the Sediment Quality Index have been published in the peer reviewed literature, and the procedure used to combine these metrics first published in the National Coastal Condition Assessment 2010 (EPA 841-R-15-006). Is the Sediment Quality Index being appropriately applied and does it support the NCCA’s goal of assessing the condition of the

External Letter Peer Review of Draft Report “National Coastal Condition Assessment 2015”
49
nation’s coastal waters at national and broad regional scales, and trends over time? Is the presented in a clear and understandable manner in the report? Yes, the Sediment Quality Index is applied appropriately and the presentation is understandable. The index includes benchmarks regarding toxicity, which are of ultimate interest and by using exposure-based assays the NCCA is able to assess toxicity of contaminants (specific and interactive effects), including those that are unknown or have unknown interactions (synergistic, additive, competitive). As designed, the approach will provide a reasonable impression of the nation’s coastal waters at national and broad regional scales, and trends over time. 5. The Eutrophication index (previously called the water quality index) has been used to assess EPA coastal waters for over fifteen years starting with the National Coastal Condition Report II (EPA-620/R-03/002). Does this index and each individual eutrophication-related measure support the NCCA’s goal of assessing the condition of the nation’s coastal waters at national and broad regional scales, and trends over time? Are the Eutrophication – related indicators used in the report clearly explained to the reader? This is a topic in which I have the greatest amount of expertise to share. In brief, yes, the eutrophication index (based on nutrient concentrations [total nitrogen, total phosphorus), total chlorophyll-a, dissolved oxygen concentrations, and water clarity) is an appropriate means by which to measure the range of trophic status in estuarine and Great Lakes nearshore waters and it is well explained in the report. With respect to the ability to measure trends over time, the approach used by the NCAA is appropriate for five-year intervals for conditions measured during summer (the field season). However, it is important to note in the report that sampling is just during the summer. Therefore, the assessment of the lake nearshore and estuary condition is solely for one season of the year – nearshore Great Lakes regions and estuaries may have different conditions at other time s of the year – and so making statements about changes in condition should qualify that these are for a specific time of year. For example, we have discovered extensive blooms of algae on Lake Erie in the depth of winter (February; Twiss et al., 2012), which is linked to summer time hypoxia is the central basin of this lake (Wilhelm et al., 2013; Reavie et al., 2016). Perhaps other blooms occur on other lakes, in coastal estuaries, during winter but we are generally ignorant to coastal condition during seasons other than summer and this may be important to consider. Reavie, E., Cai, M., Twiss, M.R, Carrick, H.J., Davis, T., Johengen, T., Gossiaux, D., Smith,
D.E., Palladino, D., Burtner, A., and Sgro, G. 2016. Diatom production in Lake Erie is an important driver of summer hypoxia. Journal of Great Lakes Research, 42: 608-618.
Twiss, M.R., McKay, R.M.L., Bourbonniere, R.A., Bullerjahn, G.S., Carrick, H.J., Smith, R.E.H., Winter, J.G., D’souza, N., Furey, P.C., Lashaway, A.R., Saxton, M.A., and Wilhelm, S.W. 2012. Diatoms abound in ice-covered Lake Erie: An investigation of offshore winter limnology in Lake Erie over the period 2007 to 2010. Journal of Great Lakes Research, 38(1):18-30.
Wilhelm, S. W., LeCleir, G.R., Bullerjahn, G.S., McKay, R.M., Saxton, M.A., Twiss, M.R., Bourbonniere, R.A. 2013. Seasonal changes in microbial community structure and activity imply winter production linked to summer hypoxia in a large lake system. FEMS Microbiology Ecology 87(2), 475-485.

External Letter Peer Review of Draft Report “National Coastal Condition Assessment 2015”
50
6. The Ecological Fish Contaminant Index was first developed and published in the National Coastal Condition Assessment 2010 (EPA 841-R-15-006) and was modified for this report. Is the underlying approach for the analysis of the Ecological Fish Tissue Contaminant Index scientifically sound? Note: This question is optional. The one ecotoxicology peer reviewer will focus on this question, but if you feel qualified, you are welcome to weigh in on this topic. Answering this question should be based on both the Summary Report and Chapter 7 of the Technical Support Document (TSD). Specifically, consider the following three aspects of the approach.
6a. Are the receptors of concern appropriate and do they adequately represent the wildlife populations potentially impacted by eating whole fish? 6b. Are the formulas for deriving screening values from Toxicity Reference Values appropriate? 6c. Is use of the NOAEL for calculating screening values appropriate? I am not responding to question 6. 7. Is the approach used for analyzing contaminants for human health-based fish consumption benchmarks in fish fillet tissue composite samples in the Great Lakes and assessing the population of waters above or at/below benchmarks acceptable and based on sound scientific principles? Yes. The approach to measuring fish contaminants is acceptable. The use of sample from a homogenization of five composite fish fillets is a technique used to provide an example of a sample representative of a fishing effort and the tissue most likely consumed (fillet). This is similar to the EPA Great Lakes Fish and Monitoring Survey Program that samples lake trout (in all lakes, walleye in Lake Erie) on 5-year cycles, and uses 10-fish (entire fish) composites. I appreciate the EPA stating the more conservative Great Lakes Sport Fish Advisory Task Force benchmark (110 ppb) versus the EPA benchmark of 300 ppb for mercury. 7a. Is the information presented clear and understandable? Yes, the results are clearly presented except for the data for PFOS (Figure 4.8.3), which must be re-configured to reduce ambiguity (see Section III for details). 8. The NCCA compares results between survey cycles and presents changes over time in the condition of the population of coastal systems covered by the NCCA design. Is the information on these differences or changes in condition from the previous reports explained and clear to the reader? 8a. Is the approach used to assess change over time in NCCA based on sound scientific principles and described clearly in the report? With the exception of the limitations due to inter-seasonal timeframes (see response to Section II.5 above), the approach to show changes in coastal condition over time (at 5-year intervals) is

External Letter Peer Review of Draft Report “National Coastal Condition Assessment 2015”
51
appropriate. The use of standard techniques and sample site selection based on sound statistical protocols increase the confidence the sampling techniques are able to produce results that allow an assessment any change in status over time. 8b. Are the conclusions regarding changes in coastal condition over time supported by the results? Yes, the conclusions stated are supported by the results. In addition, where there are caveats (e.g., limited benthic samples due to selected sites that had hard substrate, which prevented effective sample collection), these are stated in the text (-callouts on the figures-). These stated caveats provide a good self-critique and do not try to cache information and thereby increase confidence in the conclusions by showing the reader that a very objective approach to data analysis and transparency in reporting was conducted. 9. What is the most important concern you have with the report that was not covered in your answers to the questions above? The absence of the connecting waters in the Great Lakes system is misleading. According to Annex 2 of the Great Lakes Water Quality Protocol of 2012 (Canada, USA) the large rivers (St. Marys, St. Clair, Detroit, Niagara) and that connect the Great Lakes and that drain them (St. Lawrence River) are part of the lakes system. The Boundary Waters Treaty (1909) also considers these waterways to be part of the Great Lakes. By the definition used in the NCAA, nearshore water of the Great Lakes are < 30 m deep or < 5 km from shore, whichever is encountered first. Thus, all the connecting waters (including fluvial Lake St. Clair between the St. Clair River and the Detroit River) would be defined as Great Lakes nearshore waters. Figure 2.1 shows that these connecting waters are omitted (grey lines) in the NCCA. The rivers, strait, and fluvial lake that connect and naturally drain the Great Lakes-St. Lawrence River system are referred to as connecting waters (sometimes as connecting channels). Connecting waters are natural meeting places for biota and people and all are main transportation corridors. Each connecting water that is a major river has specifically contaminated areas that reflect past and present industrial activity that gravitated to these regions. Vast and biodiverse wetlands and important fish spawning areas exist in most of these regions, yet they are under tremendous stresses (EC/USEPA, 2009). Connecting waters serve as important ecological, social, and economic intersections in the Great Lakes ecosystem yet they have not received the same degree of attention as the lakes. The fact that these Great Lakes nearshore areas are neglected by the NCCA is a major oversight. I realize that it would be a significant undertaking to incorporate these waters into the NCCA, and I suspect that that will occur in the future. In the interim, I strongly suggest that the US EPA clarify that the connecting waters are not included in the NCCA, just as they should state that the NCCA is for the contiguous United States only. Boundary Waters Treaty. 1909. https://www.ijc.org/en/boundary-waters-treaty-1909 EC/USEPA (Environment Canada and United States Environmental Protection Agency), 2009.
State of the Great Lakes 2009. Environment Canada and United States Environmental Protection Agency. ISBN 978-1-100-14102-2; EPA 905-R-09-031; Cat No. En161-3/1-2009E-PDF.

External Letter Peer Review of Draft Report “National Coastal Condition Assessment 2015”
52
Great Lakes Water Quality Protocol of 2012 https://binational.net/2012/09/05/2012-glwqa-aqegl/ III. SPECIFIC OBSERVATIONS
Page Paragraph Comment or Question on the draft report “National Coastal Condition Assessment 2015”
1 2 “The NCCA focuses on estuaries and the Great Lakes due to their ecological and economic importance.” Missing connecting waters.
4 2 Again, the risk to humans was low; 55% of estuarine area was at or below EPA’s human health benchmark for mercury in fish tissue (43% of estuarine area was not assessed). Missing almost half of sites. BE more conservative in statement
4 last “Areas with hard substrate or areas covered with invasive zebra and quagga mussels often prevented sampling, affecting the ability of the NCCA to determine condition in many areas.” High energy environment prevents fine sediment accumulation in much of the nearshore.
5 2 “The NCCA continues to investigate ways to improve sediment assessment success.” See comment directly above.
5 4 “Six percent of nearshore area had fish with mercury levels above the human health benchmark based on analysis of plugs from fish fillet tissue.” This is not clear since it states on page 7 (Contaminants in Fish Tissue) that “In the Great Lakes only, EPA collected additional fish to assess fillet tissue for polychlorinated biphenyls (PCBs), per- and polyfluoroalkyl substances (PFAS), and mercury, using entire fillets.” Does this mean that in GL and estuaries that tissue plugs are measured for Hg? On pg. 20 (para. 4) it says that fillets are compared in addition to the “300 ppb benchmark” but does this mean that the values in fillets were compared to the benchmark or also compared to Hg in tissue plugs?. According to page 37 (para. 2) this is correct, so it would be better to make this more clear earlier in the text.
7 3 “Estuaries and the Great Lakes also receive pollutants and sediments from activities far upstream.” Not Lake Superior. It is the headwater of the Great Lakes system. Like all the GL it receives atmospheric input of contaminants, e.g. toxaphene (Muir, D. C., Whittle, D. M., David, S., Bronte, C. R., Karlsson, H., Backus, S., & Teixeira, C. (2004). Bioaccumulation of toxaphene congeners in the Lake Superior food web. Journal of Great Lakes Research, 30(2), 316-340.) pesticide used heavily in the Southern United States.

External Letter Peer Review of Draft Report “National Coastal Condition Assessment 2015”
53
Page Paragraph Comment or Question on the draft report “National Coastal Condition Assessment 2015”
7 Footnote 2 As a GL limnologist, I am aware of the use of the term estuaries in the GL. However, these refer to small tributaries that contain water chemistry very different from the receiving waters of the nearshore GL. They are not used with respect to the very large rivers (St. Marys, St. Clair, Detroit, Niagara) that drain one Great Lake to the next and the Upper St. Lawrence River, all of which are considered nearshore waters of the GL. This distinction should be made clear in this document.
8 2 “The NCCA focused on the 48 contiguous states….” This should be stated in the Executive Summary as well.
11 Ecological indicators - Eutrophication
Suggest replacing the phrase “…microscopic algae that cause such blooms.” with “…phytoplankton, microscopic algae and cyanobacteria, which may cause blooms).”
11 Human-Health Indicators-Algal Toxins and para. 3
Suggest replacing “Algal Toxins” with “cyanotoxins”, since no algae produce microcystins (the are produced by cyanobacteria, a type of phytoplankton).
12,14, 29 , 44
3, 6, 1, title Suggest replacing “Algal Toxins” with “cyanotoxins”, as described above unless this includes toxins such as those produced by dinoflagellates (red-tides) or others (e.g. diatom-produced toxins).
12 20
Footnote 3 1
Suggest rephrasing “Benthic macroinvertebrates are insects, worms, mollusks and crustaceans that live in sediments. To “benthic…. in and on sediments…” to more accurately state the benthic habitat as is stated in the figure cation on page 20.
22 1 Suggest rephrasing “Excess nutrients can cause increased growth of algae, known as harmful algal blooms.” To “Excess nutrients can cause increased growth of phytoplankton (algae and cyanobacteria), known as harmful algal blooms.”.
22 1 Suggest rephrasing “Decomposing algae and plants consume dissolved oxygen, stressing aquatic life and ecosystems. “ to “Decomposing biomass consumes dissolved oxygen, stressing aquatic life and ecosystems.”
34 2 Lake Erie: it is indeed the warmest in summer but also the coldest in winter, both factors are due to its shallow nature.

External Letter Peer Review of Draft Report “National Coastal Condition Assessment 2015”
54
Page Paragraph Comment or Question on the draft report “National Coastal Condition Assessment 2015”
34 Figure 4.0.1. Why are the lakes listed in this order? Why not list them by elevation above sea level to indicate direction of flow to the ocean (Superior, Huron/Michigan*, Erie, Ontario)? Technically Lake Huron and Michigan are one lake with two large basins.
34 Figure 4.0.1. No. Lake Ontario drains to the North Atlantic Ocean via the St, Lawrence River only (not the Niagara and St. Lawrence Rivers, as stated); the way it is written, someone might think that Lake Ontario has two outflows.
34 Figure 4.0.1. Lake Huron: Point of interest is that it includes two large bays: Georgian Bay and Saginaw Bay. Yes, but of more interest is that it contains the largest freshwater island in the world, Manitoulin Island.
36 bottom Mention of the Huron-Erie Corridor (aka HEC) is stated. I know what this refers to (it refers to the region at the outflow of Lake Huron (the St. Clair River – Lake St. Clair – Detroit River) system. The average reader not familiar with the Great Lakes would not know what the HEC is. I suggest adding a map that contains all the lake names, and the names of the connecting waters (rivers, strait, fluvial lakes) in the system.
37 1 I know of no example of excessive algal growth hampering navigation. Of greater concern is overabundance of a macrophytic alga Cladophora that grows in nearshore regions, sometime extensively.
38 1 See note above (39,2): Change test from “Because it is shallower and warmer than the other lakes,…” to “Because it is shallower and warmer than the other lakes during summer,…”.
38 Footnote 9 Change to read: Chlorophyll a levels are frequently used to estimate phytoplankton (microalgae and cyanobacteria) biomass present.
Chapter 4
Figures showing the Great Lakes data in bar graphs
I like having the Great Lakes summed data at the top of the figure. However, why are individual lakes listed in this order? There should be a reason. Adding value to the figures by indicating water flow (list in order from Lake Superior to Lake Ontario) would be advantageous – for example, Does condition decrease with distance downstream?.
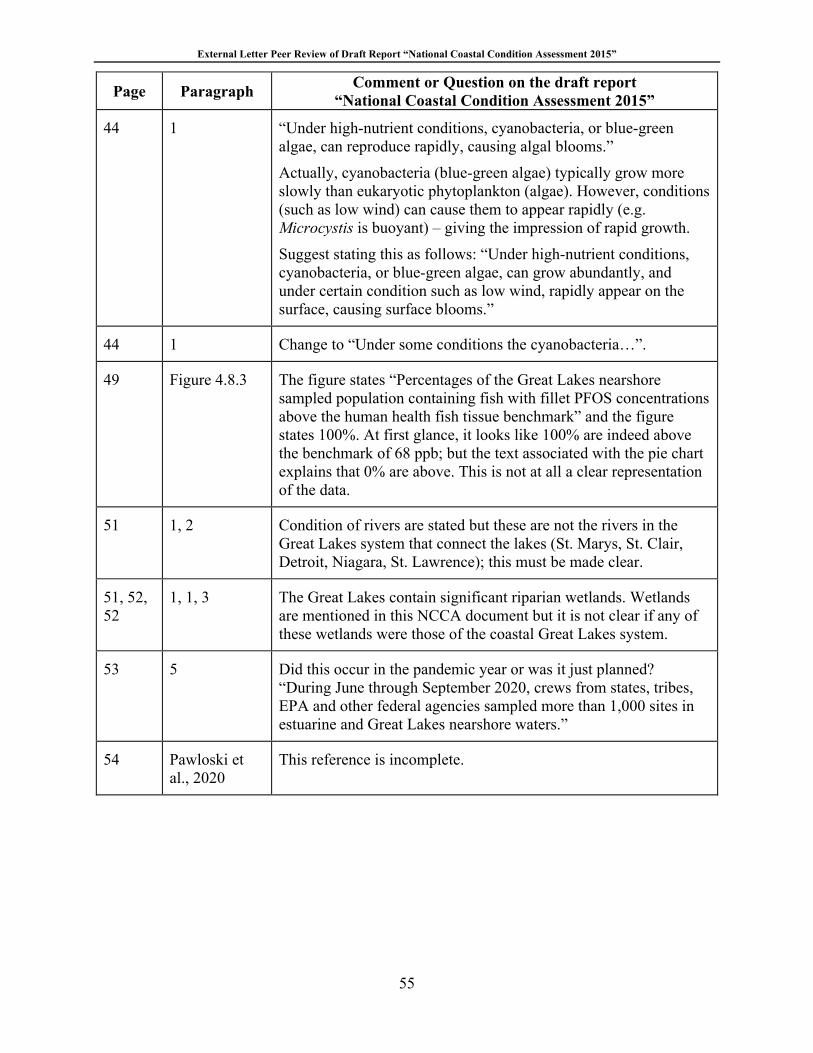
External Letter Peer Review of Draft Report “National Coastal Condition Assessment 2015”
55
Page Paragraph Comment or Question on the draft report “National Coastal Condition Assessment 2015”
44 1 “Under high-nutrient conditions, cyanobacteria, or blue-green algae, can reproduce rapidly, causing algal blooms.” Actually, cyanobacteria (blue-green algae) typically grow more slowly than eukaryotic phytoplankton (algae). However, conditions (such as low wind) can cause them to appear rapidly (e.g. Microcystis is buoyant) – giving the impression of rapid growth. Suggest stating this as follows: “Under high-nutrient conditions, cyanobacteria, or blue-green algae, can grow abundantly, and under certain condition such as low wind, rapidly appear on the surface, causing surface blooms.”
44 1 Change to “Under some conditions the cyanobacteria…”.
49 Figure 4.8.3 The figure states “Percentages of the Great Lakes nearshore sampled population containing fish with fillet PFOS concentrations above the human health fish tissue benchmark” and the figure states 100%. At first glance, it looks like 100% are indeed above the benchmark of 68 ppb; but the text associated with the pie chart explains that 0% are above. This is not at all a clear representation of the data.
51 1, 2 Condition of rivers are stated but these are not the rivers in the Great Lakes system that connect the lakes (St. Marys, St. Clair, Detroit, Niagara, St. Lawrence); this must be made clear.
51, 52, 52
1, 1, 3 The Great Lakes contain significant riparian wetlands. Wetlands are mentioned in this NCCA document but it is not clear if any of these wetlands were those of the coastal Great Lakes system.
53 5 Did this occur in the pandemic year or was it just planned? “During June through September 2020, crews from states, tribes, EPA and other federal agencies sampled more than 1,000 sites in estuarine and Great Lakes nearshore waters.”
54 Pawloski et al., 2020
This reference is incomplete.