, ftR300338 - Records Collections - EPA
243
Park West Two Cliff Mine Road CORPORATION ^ 1 DRAKE CHEMICAL SITE LOCK HAVEN CLINTON COUNTY, PENNSYLVANIA EPA WORK ASSIGNMENT NUMBER 10-3L31 CONTRACT NUMBER 68-01-6699 NUS PROJECT NUMBER 0710.21 MARCH 1984 SUBMITTED FOR NUS BY: APPROVED: D-31-1-4-12 DRAFT DC-/-2--RILS-D / REMEDIAL INVESTIGATIONREPORT (PHASE I) V - LEACHATE STREAM AREA RICHARD M. NINESTEEL P.E. E. DENNIS ESCHER. P.E. PROJECT MANAGER MANAGER, REMEDIAL PLANNING , ftR300338 IA Halliburton Company ;.
-
Upload
khangminh22 -
Category
Documents
-
view
8 -
download
0
Transcript of , ftR300338 - Records Collections - EPA

Park West TwoCliff Mine Road
CORPORATION ^ 1
DRAKE CHEMICAL SITELOCK HAVEN
CLINTON COUNTY, PENNSYLVANIA
EPA WORK ASSIGNMENTNUMBER 10-3L31
CONTRACT NUMBER 68-01-6699
NUS PROJECT NUMBER 0710.21
MARCH 1984
SUBMITTED FOR NUS BY: APPROVED:
D-31-1-4-12DRAFTDC-/-2--RILS-D
/REMEDIAL INVESTIGATION REPORT (PHASE I) V -LEACHATE STREAM AREA
RICHARD M. NINESTEEL P.E. E. DENNIS ESCHER. P.E.PROJECT MANAGER MANAGER, REMEDIAL PLANNING
, ftR300338IA Halliburton Company ;.

•I
DRAFT
CONTENTS
r
SECTION € " • " • • PAGE
EXECUTIVE SUMMARY V ES-1
1.0 INTRODUCTION 1-11.1 SITE HISTORY AND DESCRIPTION 1-11.2 SCOPE AND PURPOSE 1-3
2.0 DESCRIPTION OF INVESTIGATION 2-12.1 SUBSURFACE INVESTIGATION 2-12.1.1 INTRODUCTION 2-12.1.2 DRILLING PROGRAM 2-22.1.3 MONITORING WELL INSTALLATION 2-32.1.4 WASTE COLLECTION AND HANDLING 2-72.1.5 ONSITE BURIED PIPELINE LOCATIONS 2-72.2 MONITORING WELL SAMPLING 2-72.3 SOIL SAMPLING 2-102.3.1 SHALLOW AUGER BORINGS 2-102.3.2 OFF SITE SURFACE SOILS 2-112.3.3 SPLIT BARREL SAMPLES 2-122.3.4 SURFACE SOIL - NEAR LEACHATE STREAM 2-122.3.5 SUBSURFACE SOIL - NEAR LEACHATE STREAM 2-142.4 SURFACE WATER AND SEDIMENT SAMPLING 2-142.4.1 SURFACE WATER 2-152.4.2 SEDIMENT 2-152.5 AQUATIC SURVEY 2-152.5.1 SAMPLE STATIONS 2-192.5.2 PHYSICAL PARAMETERS FOR WATER 2-212.5.3 FISH 2-212.5.4 BENTHIC MACROINVERTEBRATE 2-232.5.5 DIATOM SURVEY 2-282.6 TERRESTRIAL SURVEY 2-28
3.0 RESULTS OF INVESTIGATION 3-13.1 SITE GEOLOGY 3-13.1.1 PHYSIOGRAPHIC SETTING 3-13.1.2 STRATIGRAPHY 3-13.1.3 STRUCTURE 3-23.1.4 SUBSURFACE SOILS 3-73.2 HYDROGEOLOGY 3-73.2.1 REGIONAL HYDROGEOLOGY 3-73.2.2 SITE HYDROGEOLOGY 3-83.2.3 CHEMICAL ANALYSIS 3-213.2.4 CHEMICAL TRANSPORT 3-293.2.5 ENVIRONMENTAL AND HEALTH AND SAFETY CONCERNS 3-29
RR300339

DRAFT
CONTENTS (CONTINUED)
SECTION . 4' PAGE\
3.3 SUBSURFACE SOIL 3-333.3.1 CHEMICAL ANALYSIS 3-333.3.2 CHEMICAL TRANSPORT 3-433.3.3 ENVIRONMENTAL AND HEALTH AND SAFETY CONCERNS 3-433.4 SURFACE SOIL 3-453.4.1 CHEMICAL ANALYSIS 3-453.4.2 CHEMICAL TRANSPORT 3-493.4.3 ENVIRONMENTAL AND HEALTH AND SAFETY CONCERNS 3-503.5 SURFACE WATER AND SEDIMENT 3-503.5.1 SURFACE WATER ' 3-503.5.2 SEDIMENT 3-553.6 AQUATIC SURVEY 3-663.6.1 INTRODUCTION 3-663.6.2 PHYSICAL WATER PARAMETERS 3-723.6.3 FISH . 3-743.6.4 BENTHIC MACROINVERTEBRATES 3-743.6.5 DIATOM SURVEY 3-1033.7 TERRESTRIAL SURVEY 3-1083.7.1 AREA NO. 1 DRAKE CHEMICAL SITE 3-1113.7.2 AREA NO. 5 HAMMERMILL BALLFIELD 3-1123.7.3 AREA NO. 6 LEACHATE SWALE AND LEACHATE CHANNEL 3-1123.7.4 AREA NO. 7 CASTENEA TOWNSHIP PARK 3-1143.7.5 SUMMARY 3-116
4.0 HEALTH RISK ASSESSMENT 4-14.1 INTRODUCTION 4-14.2 EXPOSURE PATHWAY ANALYSIS 4-24.2.1 SOURCE OF CONTAMINATION - 4-24.2.2 ROUTES OF TRANSPORT 4-34.2.3 RECEPTORS 4-34.3 ANALYTICAL DATA BASE 4-34.3.1 AIR SAMPLING 4-44.3.2 GROUNDWATER SAMPLING 4-44.3.3 SUBSURFACE SOILS 4-44.3.4 SURFACE SOILS 4-44.3.5 SURFACE WATER AND SEDIMENT 4-54.3.6 FISH TISSUE 4-54.3.7 HISTORICAL DATA 4-54.4 CRITICAL CONTAMINANTS DETECTED 4-64.5 ASSESSMENT OF CRITICAL CONTAMINANTS 4-84.5.1 FEN AC 4-84.5.2 ARSENIC 4-94.5.3 DICHLOROBENZENE 4-94.5.4 PENTACHLOROPHENOL . 4-104.5.5 OTHER COMPOUNDS 4-104.6 SUMMARY 4-11
ill

IIIIII
DRAFT
CONTENTS (CONTINUED)
SECTION PAGE
REFERENCES R-1
APPENDICES
A NUS BORING LOGSB AMERICAN COLOR AND CHEMICAL COMPANY BORING LOGS
1 C SCIENTIFIC A N D COMMON NAMES O F FISH SPECIESCOLLECTED IN BALD EAGLE CREEK, BETWEEN SPRINGCREEK AND FISHING CREEK
I, HR3003UI

1 DRAFT
TABLES
NUMBER - PAGE
I 2-1 STATION LOCATIONS AND DESCRIPTIONS 2-20AQUATIC SURVEY
2-2 REFERENCES USED FOR IDENTIFICATION OF 2-26| MAJOR MACROINVERTEBRATE GROUPSi AQUATIC SURVEY
3-1 MONITORING WELL INFORMATION 3-9i 3-2 WELL POINT INFORMATION 3-11; 3-3 HYDRAULIC CONDUCTIVITIES 3-12
3-4 GROUNDWATER ELEVATIONS 3-143-5 VERTICAL HEADS AND BARCAD INFORMATION r . ,- 3-15
! 3-6 WATER LEVEL ELEVATIONS Cr" " - 3-163-7 GROUNDWATER INDICATORS ( cutf 3-223-8 GROUNDWATER INORGANICS (ug/l) ^ 3-233-9 GROUNDWATER ORGANICS (ug/l) 3-253-10 ONSITE GROUNDWATER TOXICITY DATA - 3-30
INORGANICS (ug/03-11 OFFSITE GROUNDWATER TOXICITY DATA - 3-31
INORGANICS (U9/I)3-12 GROUNDWATER TOXICITY DATA - ORGANICS (ug/l) 3-323-13 SUBSURFACE SOIL INDICATORS 3-343-14 SUBSURFACE SOILS - METALS (mg/kg) 3-353-15 SUBSURFACE SOILS - ORGANICS (ug/kg) 3-383-16 SUBSURFACE SOIL CONCENTRATION RANGES - 3-44
: METALS (mg/kg)3-17 SURFACE SOIL INDICATORS 3-463-18 SURFACE SOIL METALS (mg/kg) 3-47
i 3-19 SURFACE SOILS-- ORGANICS (ug/kg) 3-48i 3-20 SURFACE WATER INDICATORS 3-51
3-21 SURFACE WATER - INORGANICS (ug/l) 3-52. 3-22 SURFACE WATER ORGANICS (ug/l) 3-531 3-23 ONSITE SURFACE WATER TOXICITY DATA (ug/l) 3-56* 3-24 OFFSITE SURFACE WATER TOXICITY DATA (ug/l) 3-57
3-25 SEDIMENT INDICATORS 3-581 3-26 SEDIMENT - METALS (mg/kg) 3-59I 3-27 SEDIMENT - ORGANICS (ug/kg) 3-60
3-28 SEDIMENT CONCENTRATION RANGES - METALS (mg/kg) 3-671 3 - 2 9 SUMMARY OF HISTORICAL WATER QUALITY DATA FROM 3-70
THE BALD EAGLE CREEK DRAINAGE3-30 TEMPERATURE, DISSOLVED OXYGEN, pH, AND 3-73
. CONDUCTIVITY MEASUREMENTSI 3-31 SCIENTIFIC AND COMMON NAMES OF FISH 3-751 3-32 NUMBER AND WEIGHT OF FISH SPECIES COLLECTED 3-76
FROM BALD EAGLE CREEK AND THE SUSQUEHANNA RIVER
I\ ' R.R3003W

DRAFT
TABLES (CONTINUED)
w
NUMBER Cp'^'-'-r PAGE
3-33 LENGTH, WEIGHT, AND AGE OF FISH COLLECTED FOR ' 3-77TISSUE ANALYSIS
3-34 INVERTEBRATE TAXA COLLECTED FROM BALD EAGLE 3-78CREEK AND THE SUSQUEHANNA RIVER
3-35 NUMBERS AND PERCENT COMPOSITION OF BENTHIC 3-82MACROINVERTEBRATES
3-36 PERCENT SIMILARITY VALUES (PSc) CALCULATED 3-85BETWEEN BENTHIC MACROINVERTEBRATE SAMPLESTATIONS
3-37 NUMBERS AND PERCENT COMPOSITION OF BENTHIC 3-87MACROINVERTEBRATES, BY STATION, COLLECTED FROMBALD EAGLE CREEK AND SUSQUEHANNA RIVER
3-38 D VALUES, REDUNDANCY (r), TOTAL TAXA AND 3-104TOTAL NUMBERS OF MACROINVERTEBRATES TAKEN ATEACH STATION
3-39 PERCENT COMPOSITION AND DIVERSITY INDICES 3-105OF DIATOMS OBSERVED IN SAMPLES
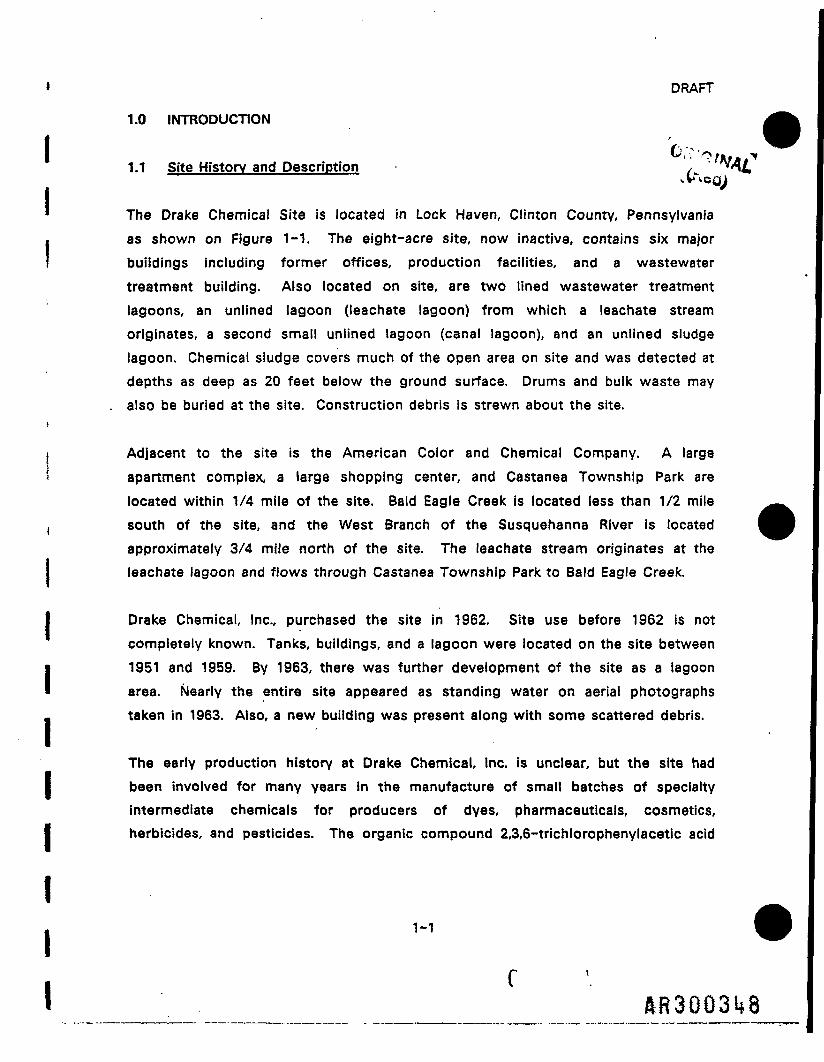
3-40 SPECIES COMPOSITIONS OF SUBAREAS 3-1094-1 CRITICAL COMPOUNDS DETECTED IN DRAKE 4-7
CHEMICAL SITE LEACHATE STREAM AREA (OFFSITE)
Vi

IDRAFT
FIGURES
NUMBER - C PAGE
1-1 LOCATION MAP " 1-22-1 APPROXIMATE LOCATION OF KNOWN BURIED PIPELINES 2-82-2 SOIL SAMPLING LOCATIONS 2-132-3 SURFACE WATER AND SEDIMENT SAMPLING LOCATIONS 2-162-4 SURFACE WATER, SEDIMENT SAMPLING LOCATIONS 2-17
AND AQUATIC SURVEY LOCATIONS3-1 MONITORING WELL LOCATIONS, GROUNDWATER -, 3-3
CONTOURS, CROSS SECTION LOCATIONS -—T-it» V.3-2 GEOLOGIC CROSS SECTION 0^ 3-43-3 GEOLOGIC CROSS SECTION v 3-53-4 GEOLOGIC CROSS SECTION 3-63-5 MAIN SOURCES OF STREAM 3-20
1
I
1
I

DRAFT
EXECUTIVE SUMMARY
Introduction s
A Remedial Investigation (Rl) was performed at the Drake Chemical Site tocharacterize the types and extent of contamination. This report presents thefindings of the Remedial Investigation (Phase I) pertaining to the leachate streamwhich flows through Castanea Township Park, the park itself, and the southernportion of the site where the leachate lagoon and canal lagoon are located.Another report will follow which will present the findings of all tasks performedduring the Remedial Investigation.
The Site
The Drake Chemical Site is located in Lock Haven, Clinton County, Pennsylvania.The eight-acre site, now inactive, contains six major buildings including formeroffices, production facilities, and a wastewater treatment building. Also locatedon site, are two lined wastewater treatment lagoons, an unlined lagoon (leachatelagoon) from which a leachate stream originates, a second small unlined lagoon(canal lagoon), and an unlined sludge lagoon. Chemical sludge covers much of theopen area on site and was detected at depths as deep as 20 feet below the groundsurface. Drums and bulk waste may also be buried at the site. Construction debrisis strewn about the site.
Adjacent to the site is the American Color and Chemical Company. A largeapartment complex, a large shopping center, and Castanea Township Park arelocated within 1/4 mile of the site. Bald Eagle Creek is located less than 1/2 milesouth of the site, and the West Branch of the Susquehanna River is locatedapproximately 3/4 mile north of the site. The leachate stream originates at theleachate lagoon and flows through Castanea Township Park to Bald Eagle Creek.
ES-1

DRAFT
The Drake Chemical Company was involved for many years in the manufacture ofsmall batches of specialty intermediate chemicals for producers of dyes,pharmaceuticals, cosmetics, herbicides, and pesticides. The organic compound2,3,6-trichlorophenylacetic acid (Fenac), used as a herbicide, was manufactured atthe plant and is a major site contaminant.
Objectives and Approach
The objectives of the Phase I Remedial Investigation Report are to define thegeologic and hydrogeologic Conditions at and in the vicinity of the ieachate stream,characterize soil and groundwater contamination in the vicinity of the leachatestream, characterize contamination of surface waters, sediments, and aquatic lifein the leachate stream and off site surface water bodies, and present the results ofa terrestrial ecology survey.
To meet these objectives, a subsurface investigation, including exploratory boringsand monitoring well installation, was conducted. Environmental sampling of soils,surface water, sediment, and groundwater was peformed. An aquatic survey andterrestrial ecology survey were also performed.
Results of Investigation
Chemical contamination was found in various media in the vicinity of the leachatestream, including groundwater, soils, surface water and sediment. A wide range oforganic and inorganic chemicals were detected in both onsite and off sitemonitoring wells. Data indicate that contamination is highest near the site and atshallow depths. Groundwater may discharge into the stream during periods of highgroundwater levels when the surface of the water table intersects the leachatestream bed. Otherwise, the groundwater flows toward the east to northeast
In soil and sediment samples, Fenac was found to be a good indicator ofcontamination. Where Fenac concentrations were elevated, other chemicalconcentrations were elevated. The opposite also appears to be true. The sampling
ES-2

iiiiii
DRAFT
of soil and sediment in and around the leachate stream was meant only to confirmand supplement results from an extensive sampling program conducted by EPA in1982. The highest concentrations of soil and sediment contamination were found inthe leachate lagoon and the leachate system channel. Some Fenac contaminationwas detected in the sediment in Bald Eagle Creek downstream from the leachatestream. The leachate lagoon on site contained both organic and inorganiccontamination.
Results of fish tissue analyses and off site surface water analyses indicate thatthere is presently little impact of leachate contamination on aquatic life and waterquality in Bald Eagle Creek. The greatest risk of exposure, although relatively low,is posed by direct contact with compounds in the leachate stream area.
ES-3
iiI
DRAFT
1.0 INTRODUCTIONr/•-, .-,.\»», ; ;
1.1 Site History and Description ,
The Drake Chemical Site is located in Lock Haven, Clinton County, Pennsylvaniaas shown on Figure 1-1. The eight-acre site, now inactive, contains six majorbuildings including former offices, production facilities, and a wastewatertreatment building. Also located on site, are two lined wastewater treatmentlagoons, an unlined lagoon (leachate lagoon) from which a leachate streamoriginates, a second small unlined lagoon (canal lagoon), and an unlined sludgelagoon. Chemical sludge covers much of the open area on site and was detected atdepths as deep as 20 feet below the ground surface. Drums and bulk waste mayalso be buried at the site. Construction debris is strewn about the site.
Adjacent to the site is the American Color and Chemical Company. A largeapartment complex, a large shopping center, and Castanea Township Park arelocated within 1/4 mile of the site. Bald Eagle Creek is located less than 1/2 milesouth of the site, and the West Branch of the Susquehanna River is locatedapproximately 3/4 mile north of the site. The leachate stream originates at theleachate lagoon and flows through Castanea Township Park to Bald Eagle Creek.
Drake Chemical, Inc., purchased the site in 1962. Site use before 1962 is notcompletely known. Tanks, buildings, and a lagoon were located on the site between1951 and 1959. By 1963, there was further development of the site as a lagoonarea. Nearly the entire site appeared as standing water on aerial photographstaken in 1963. Also, a new building was present along with some scattered debris.
The early production history at Drake Chemical, Inc. is unclear, but the site hadbeen involved for many years in the manufacture of small batches of specialtyintermediate chemicals for producers of dyes, pharmaceuticals, cosmetics,herbicides, and pesticides. The organic compound 2,3,6-trichlorophenylacetic acid
1-1
HR3003U8

I1II

Ii
DRAFT
(Fenac*), used as a herbicide, was manufactured at the plant and is a major sitecontaminant.
Drake Chemical, Inc. was cited several times between 1973 and 1982 for violationsof environmental and health and safety regulations. CA
The United States Environmental Protection Agency (EPA), began emergencyclean-up activities at the site on February 28, 1982, after Drake Chemical, Inc.,failed to respond to a request for voluntary cleanup. During the emergency clean-up, drums, sludges, and liquids from process and storage tanks were removed fromthe site. The clean-up was completed on April 21, 1982. The EnvironmentalResponse Team (ERT) of EPA performed an Extent of Contamination Study inMarch, 1982 which focused on the area around the leachate stream.
In August 1982, the EPA requested a remedial action study of the Drake ChemicalSite. Activities included preparation of a Remedial Action Master Plan (RAMP) byRoy F. Weston (1/83), a Work Plan for a Remedial Investigation and FeasibilityStudy by the Remedial Planning Office of NUS Corporation (5/83), and aToxicological Impact Assessment by the Region III Field Investigation Team (FIT)of NUS Corporation (9/83).
1.2 Scope and Purpose
This report (Phase I) presents the findings of the Remedial Investigation performedby NUS in areas near the leachate stream. These areas include the leachatestream which flows through Castanea Township Park, the park itself, the southernportion of the site where the leachate lagoon and canal lagoon are located, and thearea of the site which is north of the leachate lagoon and south of the unlinedsludge lagoon. Another report (Phase II) will follow which will present the findingsof all tasks performed during the Remedial Investigation.
*Fenac is registered under a British patent to Union Carbide Agricultural ProductsCompany, Inc.
1-3
ftR o

DRAFT
The objectives of this Phase I Remedial Investigation Report are as follows:
• Define geologic conditions, including soil type and depth
• Define the geologic framework of the portions of the site covered by thisreport
'CRi• Define the hydrogeologic conditions at and in the vicinity of the leachate x(
stream
• Characterize soil contamination in the vicinity of the leachate stream
• Characterize the contamination of groundwater in the vicinity of theleachate stream
• Characterize the contamination of surface waters, sediments, and aquaticlife in the vicinity of the leachate stream
• Present the results of a terrestrial ecology survey performed in thevicinity of the leachate stream.
Site remedial investigation activities were scheduled to allow the feasibility studyfor the leachate stream to commence before the feasibility study for the rest ofthe site, hence the need for this Phase I Remedial Investigation Report. This "fast-track" approach will allow remedial actions relating to the leachate stream toproceed as quickly as possible.
1-4
A

DRAFT
2.0 DESCRIPTION OF INVESTIGATION
2.1 Subsurface Investigation'fcfciO
2,1.1 Introduction C"
2.1.1.1 Objectives
The subsurface investigation verified and expanded the existing limited geologic,hydrogeologic, and soil data base in the vicinity of the Drake Chemical Site. Theprimary objectives of the investigation were to define the geologic framework,hydrogeologic regime, groundwater and soil quality, and the sources, extent andrate of migration of contamination in the vicinity of the site.
2.1.1.2 Scope of Report
The information contained in this section focuses upon the leachate lagoon areaand leachate stream. However, hydrogeologic information is provided for theentire site study area to present a complete data base. A detailed report on themain site is contained under a separate cover.
2.1.1.3 Scope of Investigation
The objectives of the investigation were achieved through the implementation of asoil boring and groundwater monitoring program. The content of the program isgenerally summarized below:
• 26 shallow hand augered borings were done to define the volume, extentand characteristics of onsite waste. The borings also characterized onsite and offsite soils, shallow geology, and shallow hydrogeology.
2-1
I RR300352

DRAFT
• 14 monitoring wells constructed of 2 inch PVC pipe were installed alongthe leachate stream, onsite in the old canal bed, and on American Colorand Chemical property. r _^
.(r -*• 9 offsite monitoring wells constructed of 4 inch PVC pipe were installed.
• 3 deep exploratory boreholes were installed to define local geology andidentify deep groundwater quality. Two of the borings penetrated bedrockand were converted into open borehole monitoring wells. The other boringwas converted to a screened PVC monitoring well.
• 6 multi-level gas driven sampler systems were installed around theperimeter of the site to obtain vertical head and contaminant distributioninformation.
• 9 shallow observation driven well points, constructed of 2 inch stainlesssteel pipe, were installed into the leachate stream bed, on the perimeterof the pond at the southern end of the site, and offsite.
The locations of the monitoring wells and borings are shown in Figures 3-1.Monitoring well information is contained in Table 3-1. Observation well pointinformation is contained in Table 3-2.
2.1.2 Drilling Program
2.1.2.1 Equipment
The drilling program was conducted from August 28 to September 30, 1983. Thedrilling subcontractor was Empire Soils Investigations, Inc. based in Orchard Park,New York. Empire mobilized two drilling rigs, CME 75 and Acker ADII, toimplement the program. The drilling rig used at each borehole is identified on theindividual boring logs attached in Appendix A. All drilling activities wereconducted under the direct supervision of a NUS geologist. The use of grease or
2-2
HR300353

DRAFT
oil on the drill rods or augers was minimized and all quality control measures wereimplemented during drilling to avoid any cross contamination of formationsencountered. r
0?Shallow soil samples were obtained by NUS personnel with a 3-1/4" O.D. handxbucket auger in soils. A General Model 440 power auger was used to advance theboring in areas of high resistance.
2 A 22 Decontamination
A decontamination area was designated on the site. A high-pressure sprayer wasused for all decontamination activities. The drilling rigs were completely washedand rinsed prior to the beginning of the drilling program. After completion of eachboring the equipment used was decontaminated with detergent and rinse waterusing the high pressure sprayer. All decontamination water was collected andstored on site in labeled drums.
At each drilling site, a decontamination area was set up for personnel and lightequipment decontamination. All decontamination water, protective clothing, andsolids were drummed at each hole, labeled, and moved on site.
The split spoon sampler was decontaminated as described in Section 2.3.3, whichdescribes sampling methodology.
2.1.3 Monitoring Well Installation
2.1.3.1 PVC Monitoring Wells
PVC monitoring wells were installed using 6-1/4 inch ID hollow stem augers in mostcases. In the installation of three of the 2 inch PVC wells, 3-3/4 inch ID hollowstem augers were used. A center plug was used inside the bottom of the auger toprevent formation materials from entering the auger. The procedure to advancethe boring consisted of first advancing the auger to the sample depth. The center
2-3

Ii
DRAFT
plug was then removed from inside the augers. A split barrel sampler and samplerod string were inserted inside the auger. The sample was then taken via aStandard Penetration Test (using a 140 Ib. weight dropped a distance of 30 inches)and blow counts recorded. The sample rods were then removed. The sample washandled as described in Section 2.3.3. The center plug was reinserted afterobtaining water level information, then the augers were advanced to the nextsampling point or target depth and the process repeated. .\''
Once at the target depth, the center plug was removed and the borehole wassounded to determine the depth of the boring and if sand was running into theaugers under hydrostatic pressure. The PVC monitoring well was then assembled inthe borehole using flush-jointed PVC casing. PVC machine slotted pipe with 10 slotsize openings (.01 inch) was used as the monitoring well screen. A bottom plug wassecured to the bottom of the screen. All PVC materials were decontaminated andhandled with clean gloves. Clean tarps were used around the drilling area and onthe truck to eliminate contact of the PVC with contaminated materials. The topof the PVC casing was covered to prevent entry of foreign materials into the well.Clean, washed, medium-to-coarse-grained, well-sorted, quartz sand was poured inthe annulus between the PVC pipe and auger. The annulus was continuouslysounded to determine the depth of the sand. The augers were slowly pulled up asthe sand was placed in the annulus. Once the artificial sand pack reached the topof the selected monitoring interval, there was approximately a 10 minute wait forthe sand to settle. Additional sand was added to bring the sand level back up to theselected depth.
Bentonite pellets were slowly poured down the annulus between the casing and theborehole wall above the artificial sand pack. The augers were slowly removed asthe bentonite pellets were introduced. The hole was continuously sounded todetermine the depth and thickness of the bentonite seal. The thickness of thebentonite seal ranged from 2 to 5 feet in the boreholes, depending on whatthickness was necessary to adequately seal off the formation to be monitored fromoverlying formations. After the bentonite seal had set, a cement bentonite groutwas pumped into the hole using a tremie pipe until undiluted grout flowed at the
2-4
AR300355

DRAFT
surface. The remaining augers were then removed. A protective steel casing withlocking cap was placed around each well to prevent damage to the well. A cementcollar was placed around the protective casing to prevent surface water infiltrationalong the annulus. Complete construction details of all monitoring wells rare---documented in Appendix A. r
All PVC wells were developed using an air compressor to airlift the groundwaterout of the well until the discharge water was silt free. All development water wascollected and properly disposed of.
2.1.3.2 Exploratory Borings
Exploratory borings MW-E1 and MW-E2 were advanced in unconsolidated materialusing hollow stem auger with split-barrel sampling. The augers were advanced atleast 5 feet in shale, until refusal. A four inch PVC pipe was set into the boringand the annulus between the pipe and borehole was pressure grouted to preventcross contamination and/or fluid migration into the shale from the upperformations. The grout was allowed to set for about 72 hours. The bedrock wasthen cored using a conventional corebarrel and NX size drill bit. Percent recoveryand Rock Quality Designation (RQD) are recorded on the boring logs in Appendix A.The boring was developed using an air compressor to airlift the water. Pneumaticpacker pressure tests were performed on both boreholes. Exploratory boring MW-E3 was completed the same as the PVC monitoring wells.
2.1.3.3 Gas Driven Multi-Level Samplers
The gas-driven multi-level samplers were installed using an Acker ADII drilling rig.Temporary 4 inch steel casing was driven at 5 foot intervals and cuttings washedout by a 3-5/8 inch tri-cone roller bit. Recirculation water was collected andchanged every 5 feet to prevent the spread of contamination. Split barrel sampleswere obtained at selected intervals where lithologic samples were not availablefrom adjacent exploratory borings.
2-5
AR300356.

DRAFT
The temporary casing was advanced to refusal and backfilled with cleanmedium-to-coarse, well sorted, quartz sand to the desired sample point. ABARCAD gas driven sampler was then placed into the boring and the sand filterwas extended to the top of the designed communication interval. The sand wasallowed to settle and a bentonite pellet seal was placed above the sand, to the next r _„_.„OK'.(•>'desired communication interval. The sequence was repeated for the upper twoBARCAD gas-driven samplers. A shallow 1 inch PVC well was placed above theBARCAD's to indicate perched water during periods of heavy precipitation and inspring. Construction details of each multi-level sampler system is presented inAppendix A.
The multi-level gas driven sampler system allows the approximation of verticalhead distributions and is capable of obtaining discrete vertical groundwater qualityinformation. Nitrogen gas is introduced from a tank into the outer one-half or oneinch tubing through the use of a sampling head. This gas pressure closes the checkvalve in the sampler unit and forces water in the BARCAD up to the surfacethrough a 3/16 inch nylon inner tubing. Gas pressure is relieved and the BARCADis allowed to recharge, then the sampling process is repeated until a sufficientamount of water has been collected for the analyses required.
Vertical head distribution information was obtained in the multi-level samplers byinserting a capillary tube between the 3/16 inch inner and one-half inch or one inchouter tubing. First, a loop was made at the surface end of the capillary tube and asmall amount of water was introduced into the loop. The other end of the capillarytubing was inserted between the inner and outer sampler tubes. When groundwaterwas encountered, the small amount of water within the loop at the surface endmoved. Comparisons between water levels obtained from the multi-level samplersand cluster wells are accurate within a foot.
2.1.3.4 Observation Well Points
A series of eight driven well points were installed within the bed of the leachatestream and on the perimeter of the pond on the south end of the site. Borings were
2-6
1.R3Q0351

DRAFT
initiated with pick and shovel followed by the use of a post hole digger and handauger. Two inch diameter well points with 1.5 foot long stainless steel JohnsonRedhead, .01 inch slot size screens, were set into the hand auger boring and driveninto the ground with a sledge hammer. Cement was placed around the standpipe toprevent infiltration of surface water into the borehole. The well points weredeveloped by the use of a surge block. The leachate stream was dry during theinstallation of the well points. Depths of the well points and groundwaterinformation are listed in Table 3-2.
2.1.4 Waste Collection and Handling
All drilling cuttings, drilling return fluid, and development water was collected,drummed, and transported on site for storage. All drums were labeled as to theircontents and origin. A total of 64 drums were stored onsite by the main plantoffice.
2.1.5 Onsite Buried Pipeline Locations
Buried pipelines in the vicinity of the site were located before drilling operationsbegan. Pipelines were located and staked by utility or municipal officials. Buriedplant pipe lines were identified from plant plan maps obtained from the LockHaven city engineer. Figure 2-1 identifies lines in the vicinity of the site.
Buried lines in gravel beds may act as a conduit for groundwater flow or as apossible source of contamination. Pipeline locations are a useful reference forfuture site remedial activity.
23. Monitoring Well Sampling
Groundwater samples were collected to determine the character and extent ofgroundwater contamination beneath the site and in the vicinity of the site. Thisreport is concerned with groundwater quality in the vicinity of the leachatestream.
2-7
RR3Q0358

DRAFT
BARCAD samplers were installed in selected monitoring wells to provide apermanent sampling system at several fixed levels in the borehole. This set ofsamples was used to establish and monitor vertical water quality parameterdistributions. Qf
Before any monitoring well was sampled, a photoionization detector (PID) was usedfor measuring air quality in and around the well to determine if respiratoryprotection was required. The well water level was then determined and a minimumof 5 well casing volumes were purged from the well to assure a representativegroundwater sample. All wells were allowed to recharge to the initial water levelbefore a sample was collected. If any well did not recharge within 24 hours, it wasnoted in the field logs, and a sample was collected if there was a sufficient volumeof water to collect a representative sample.
Monitoring wells not equipped with BARCAD samplers were sampled by using asuction pump or PVC bailer. Sampling equipment was thoroughly cleaned after useto eliminate cross-contamination of the samples.
Monitoring wells equipped with BARCAD samplers were sampled by connecting thesampler to a tank of compressed nitrogen. The gas pressure forced water from theappropriate level so that a sample could be collected.
After groundwater samples were collected, they were shipped to a laboratory foranalysis. All chain-of-custody; sample handling, packaging, preservation, andshipping; recordkeeping; and documentation requirements were performed inaccordance with the Quality Assurance Plan and the Sampling Plan.
A total of 14 groundwater samples, including a duplicate, were collected in thevicinity of the leachate stream. Monitoring well locations are shown on Figure 3-1.Onsite monitoring wells included M1, MS, M6, and M7. Offsite monitoring wellsincluded M10, Mil A, M11B, M12A, M13, and M14. All monitoring wells, exceptthose equipped with BARCAD samplers, were sampled on October 15, 1983.
2-9
RR300359

DRAFT
Monitoring wells equipped with BARCAD samplers were sampled on October 28,1983.
The results of monitoring well sampling are presented in Section 3.2 of this report.
Soil Sampling
Subsurface and surface soil samples were collected during drilling operations andby taking auger samples at various locations.
2.3.1 Shallow Auger Borings
The shallow soil borings were advanced with the use of a hand bucket auger or two-man power auger. The power auger was used to advance boreholes that proved tobe impenetrable with the bucket auger and to quicken the pace of drilling. Thepower auger was used on 14 of the 26 borings. When the sampling interval wasreached, the power auger was withdrawn from the boring and the bucket auger wasused to obtain the sample.
A few of the deeper power auger borings onsite extended below the water table,which was commonly found 12 to 15 feet below ground surface. A bentonite sealwas placed in these borings at appropriate depths to prevent downwardcontaminant migration through the borings into the underlying saturatedformations penetrated. However, it was observed during drilling of these holesthat the water and soil encountered in the aquifer was commonly discolored,odorous, and often times measurable with an HNU at significant to high levels.Analytical data of samples taken from these depths also have shown this zone to becontaminated.
The area of the site south of the lined lagoons is composed of mixed fill containingbricks, construction material, wooden boards, and other miscellaneous debris. Forthe most part, the soils were found to be impenetrable with either the bucket orthe power auger. Soil and analytical samples for this area were obtained during the
2-10

DRAFT
groundwater monitoring program using a drill rig. Also, the area adjacent to thebuildings on site was covered with a thick layer of asphalt which was impenetrablewith the power auger. Sample borings in these areas were located as close aspossible to the buildings where asphalt was not present.
Decontamination v -
Two bucket augers were utilized during the program so that one could bedecontaminated while the other was in use. The bucket auger used to take theanalytical sample was decontaminated prior to each sampling. Power auger andbucket auger extensions were decontaminated after each hole and at the end ofeach day.
Decontamination consisted of a high pressure spray of soapy water and a rinsespray of water. The source of the water was a city fire hydrant located justoutside the fence line of the Drake Chemical Site. Brushes were used to scrub allsampling residue off the augers and extensions.
23.2 Off Site Surface Soils
In addition to the borings, surface soil samples were obtained from offsite locationsin the Castanea Township Park and the Hammermill Ballfield areas to determinethe presence of offsite contamination. These samplers were taken with a cleansmall shovel or trowel.
Decontamination
The trowel and small shovel used to collect the samples were rinsed clean withwater between each sample. Any soil adhering to these tools was scrubbed off withB brush. The source of the water was the fire hydrant adjacent to the DrakeChemical Site.
2-11
RR3QQ361

DRAFT
2.3.3 Split Barrel Samples
Split barrel samples were obtained at each drilling location. The 18 inch samplerwas advanced via the Standard Penetration Test through the hollow stem auger ortemporary driven casing to obtain a sample. Blow counts were recorded fqr eachsample.
The split barrel sampler was opened on a clean tarp for visual examination of thesample. The sample was lithologically logged and a representative sampleretained. Soil samples for chemical analysis were obtained by shaving the samplewith a clean knife and using only the center of the sample for the sample. Shavingthe samples was done to remove the part of the sample that was in contact withthe split barrel sampler, to avoid picking up any residual contamination from thesampler that may have been left by previous soil samples. Similar samples foranalyses were obtained for analysis by splitting a sample vertically. Thisminimized the variation in sample results caused by the change of concentrationwith depth as each sample was thus representative of the entire sampling interval.The lithologic descriptions of the samples are presented on the boring logs .inAppendix A.
The split-barrel sampler, knife, and other tools in contact with the sample weredecontaminated using a two-stage wash with soap and water and clean rinse water.The re-assembled split-spoon sampler was placed on a clean tarp and handled in amanner that minimized contamination.
23.4 Surface Soil - Near Leachate Stream
A total of 16 surface soil samples were collected in the vicinity of the leachatestream. Sampling locations are shown on Figures 3-1 (borings) and 2-2 (other).
Onsite sampling locations included Boring 14 and monitoring well M1. Offsitesampling locations included the Hammermill Paper Company property, Castanea
2-12
RR300362

"oIo(A
5
SR3Q0363

DRAFT
Township Park property, and the borings for monitoring wells Mil, M12, M13, andM14. The results of surface soil sampling are presented in Section 3.4.
r<:. .
23.5 Subsurface Soil - Near Leachate Stream , •'
A total of 35 subsurface soil samples were collected in the vicinity of the leachatestream. Sampling locations are shown on Figures 3-1 (borings) and 2-2 (park).Onsite sampling locations included Boring 14, TB-1, and monitoring wells Ml, M5,M6, and M7. Offsite sampling locations included Castanea Township Park(cornfield) and the borings-for monitoring wells M11, M12, M13, and M14. Theresults of subsurface soil sampling are presented in Section 3.3.
2.4 Surface Water and Sediment Sampling
( S u r f a c e water and sediment samples were collected to determine the character andextent of contamination in onsite and offsite areas. This report is concerned withsamples collected in the vicinity of the leachate stream, namely the leachate andcanal lagoons, the leachate stream itself, Bald Eagle Creek, and the West Branchof the Susquehanna River. Bald Eagle Creek and the West Branch of theSusquehanna River were sampled during the Aquatic Survey which is discussed laterin this report.
All samples were collected by using a pond (or dip) sampler or a bucket. Onsitesamples were composite samples, while the offsite samples were grab samples.Composite samples were formed by taking equal amounts of sample from threeseparate locations and combining them. Sampling equipment was thoroughlycleaned after each use to eliminate cross-contamination of the samples.
After surface water and sediment samples were collected, they were shipped to alaboratory for chemical analysis. All chain-of-custody; sample handling,packaging, preservation, and shipping; recordkeeping; and documentationrequirements were performed in accordance with the Quality Assurance Plan andthe Sampling Plan.
2-14
RR3-0036U

DRAFT
2.4.1 Surface Water
A total of 14 surface water samples were collected in the vicinity of the leachatestream. Sampling locations are shown on Figure 2-3 and 2-4. Onsite samplinglocations included the leachate lagoon and the canal lagoon. Offsite samplinglocations included Bald Eagle Creek and the West Branch of the Susquehanna River.The leachate stream was to be sampled, but was dry in August and October on thedays of sampling. Onsite samples were collected on August 8 and 9, 1983. Offsitesamples were collected between October 10 and 13, 1983, during the aquaticsurvey. The results of surface water sampling are presented in Section 3.5.1.
V.V
2.4.2 Sediment \frvfy
A total of 14 sediment samples were collected at the same time as the surfacewater samples. Onsite sampling locations were the same as for the surface watersamples. Offsite sampling locations included the leachate stream, Bald EagleCreek, and the Susquehanna River. Sampling locations are shown on Figure 2-3 and2-4. The results of sediment sampling are presented in Section 3.5.2.
2.5 Aquatic Survey
Few ecological or populational studies of Bald Eagle Creek have been performed,with the exception of benthic macroinvertebrate studies conducted for theHammermill Paper Company and a project completed by Lock Haven State Collegepersonnel. All fish collections made during the latter study were upstream of LockHaven. A list of species is presented in Appendix C for comparison purposes withcurrent collections.
The present study included fish collections for flesh residue analysis, benthicmacroinvertebrate and diatom diversity comparisons, analysis for physical waterparameters for water and surface water and sediment sampling.
2-15

o jo
P : 1 I I !Sn I /i1 A-L,ill ft fty 6 2 & ° * ***SS I I 3 I B

IC/5|c'O > . r-r-.
i£:£ .• • , It
2
lm
si • NI i ^— ni . *
o *•oi2"D
O
(/) Ulm c2 5
•OCO"


DRAFT
The objectives of the aquatic survey were as follows:
• Summarize available literature pertaining to the aquatic biologicalcommunity in the vicinity of the Drake Chemical Site.
• To characterize basic physical chemical parameters present in the studyarea during the survey period October 11-13, 1983. *-• •"' f\t >7^
wC'iecy• To collect multi-species fish samples for subsequent analysis of residue
levels in tissue.
• To evaluate effects of discharges or leachates from the defunct DrakeChemical Company on the benthic diatom and macroinvertebratecommunity structure.
The use of biological organisms to evaluate water quality of aquatic ecosystems isan established technique. While physical chemical surveys reveal water conditionsat the time of sample collection, biological communities are a reflection of thepresent and past stream conditions (Wilhelm, 1967). Benthic macroinvertebrates
' are excellent organisms for evaluating water quality because of their relatively lowmotility long life cycles (generally 3 months - 1 year), representation of diversetrophic levels, and ease of collection.
i Traditionally two techniques, indicator organisms or diversity, have been used to' assess the effect of outside influences on biological communities. The theory,
«central in part to both of these approaches, is that community composition (speciesoccurrence) is the result of an interaction of biotic and abiotic components presentin the environment. Different categories of benthic organisms, even within thesame family or even genus, are generally physiologically unique and will responddifferently to changes in water quality, resulting in characteristic communitystructures (Resh and Unzicker, 1975 and Milbrink, 1973).
2-18
RR300369

DRAFT
The indicator organism approach attempts to categorize groups of organismsaccording the their ability to withstand changes in water quality. The futility ofapplying pollution tolerance classification on entire groups of organisms at thegenus level (or higher taxonomic levels) is well documented in the scientificliterature (Resh and Unzicker, 1975). Unfortunately, taxonomy of benthicmacroinvertebrates occurring in North America is not developed sufficiently toidentify specimens to the species level. In addition, water quality requirementsand tolerances for various classes of pollutants are not available for most speciesof aquatic invertebrates. As a result, the use of indicator organisms to assesswater quality in short-term or cursory surveys, where invertebrate groups are 'identified to a genus or higher classification level, is tenuous.
Evaluation of water quality using diversity, number of species, and individuals hasbecome an important tool to the aquatic biologist. The use of diversity is based onthe concept that under similar water quality conditions the same number ofspecies, not necessarily the same species, will occur at any two sites (Patrick,1949; Wilhm, 1967). Unstressed biotic communities typically are characterized bythe presence of a few species with many individuals and many species with a fewindividuals. Degradation of water quality produces limiting factors that causedetectable changes in community structure. A number of mathematical formulashave been developed to summarize and express diversity (Perkins, 1983). Diversityvalues calculated using diversity indices are dependent in part on the taxonomiclevel of benthic organisms that are assigned by the investigator. Therefore,caution should be exercised when evaluating calculated diversities so that the samelevel of taxonomy is used for the values being compared.
2.5.1 Sample Stations
Figure 2-4 presents the locations of the nine established sampling stations and theirproximity to the leachate stream from the site. A description of these stations isgiven in Table 2-1.
2-19
flR30037Q

DRAFT
TABLE 2-1
DRAKE CHEMICAL SITESTATION LOCATIONS AND DESCRIPTIONS
AQUATIC SURVEY
StationNumber ____________Station Location and Description__________________
1001 Bald Eagle Creek approximately 0.5 kilometers upstream of leachatestream. Riffle area, water depth 10-15 cm, substrate rock-rubble, gravel.Creek width approximately 45 meters.
1002 Bald Eagle Creek approximately 1.2 kilometers upstream of leachatestream. Riffle area, water depth 10-15 cm, substrate rock-rubble, gravel.Creek width approximately 45 meters.
1003 Bald Eagle Creek approximately 0.1 kilometers downstream of leachatestream. Water flowing rapidly but not a riffle area, water depth 20-25cm, substrate rock-rubble, gravel, sand, and silt. Creek width 65 meters.
1004 Bald Eagle Creek approximately 0.9 kilometers downstream of theleachate stream (vicinity of Castanea bridge). Water flowing rapidly butnot a riffle area, water depth 12-15 cm, substrate rock-rubble, gravelsand. Creek width 65 meters.
1005 Bald Eagle Creek approximately 2.5 kilometers downstream of theleachate stream. Water flowing rapidly, but not a riffle area, water depth25 - 50 cm, substrate rock-rubble, gravel, and sand. Creek widthapproximately 65 meters.
1006 Bald Eagle Creek approximately 3.3 kilometers downstream of theleachate stream (vicinity PA State Route 220 and Railroad Bridge).Riffle area, water depth 12-20 cm, substrate rock-rubble some gravel.Creek width approximately 60 meters.
1007 Susquehanna . River approximately 0.3 kilometers downstream of BaldEagle Creek confluence. Riffle area (sampling on remnants of an eeltrap), water depth 15-30 cm, substrate boulders, some rock rubble.
1008 Susquehanna River approximately 1.2 kilometers upstream of Bald Eagleconfluence (vicinity of runway end - Piper Memorial Airport). Not a rifflearea, water depth 40-60 cm, substrate rock-rubble. Sampling areasincluded aquatic macrophyte beds and their associated soft sediments.
1009 Susquehanna River approximately 1 kilometer downstream of Bald EagleCreek confluence. Shallow water area, water depth 15-30 cm, substrategravel, mud, silt some rock rubble.
2 20"

DRAFT
2.5.2 Physical Parameters for Water
Temperature, dissolved oxygen, pH, and conductivity were determined for watersamples at each station. Temperature was measured with an NBS-traceablemercury thermometer. Dissolved oxygen was measured with the Modified WinklerTitration Method. An Analytical Instruments pH meter was used to measure pH.Conductivity was determined from water samples returned to the laboratory. Theresults are presented in Section 3.6.2.
2.5.3 _•-. • ' " '
2.5.3.1 Fish Collection
Fish collections, for subsequent flesh tissue analyses, were initiated onOctober 10, 1983. Because the effectiveness of fishing gear varies with the habitatsampled and the fish species present, a variety of fishing gear was used to ensurethat several fish species and adequate tissue samples were obtained. Fishingmethods included gill nets, hoop nets, electroflshing, and forage fish traps.
At each fish station, one 6 panel, experimental gill net with mesh sizes of 0.5, 1.0,2.0, 2.5, 3.0 and 3.5 square inches, was set diagonally to the shore with the smallestmesh inshore. The net extended to approximately mid-channel at the Bald EagleCreek stations. One 4-foot baited hoop net with 0.25 in. mesh and a 50-foot lead
' was set for each station. These nets were positioned with the opening facingdownstream. Forage fish traps (0.25 in. mesh) were also baited and placed at eachstation. All nets and traps were set on October 10, 1983. Those at Stations 1001,
: 1003, 1004, and 1007 were pulled immediately after electroflshing on October 11,. 1983, for a soak time of approximately 24 hours. Those at Station 1008 were
retrieved on October 12, 1983.
Electrofishing gear consisted of. a backpack shocker mounted in an 8-foot pram.Two personnel manned the shocking probes (220 AC voltage with 1 to 2 amps was
! used). Sampling proceeded upstream for a period of 10 minutes. In addition,
2-21

DRAFT
qualitative samples of benthic fish species were collected from riffle habitats usinga 0.25 inch mesh kick sieve.
After being collected, all fish to be used for flesh analyses were immediatelycounted and placed on ice in containers labeled for each station. All remainingspecimens (forage fish) were preserved with 10 percent formalin and stored forsubsequent identification and processing.
^ '-IN/1'2.5.3.2 Fish Processing*- *"' ' ' *-~J
Fish collected for flesh analyses were assigned station and log numbers and wereprocessed in the following manner. Specimens were identified, measured for totallength (mm), and individually weighed to the nearest gram using a calibratedChattilon autopsy balance. A sample of fish scales from each specimen wasremoved from the left side immediately below the anterior half of the dorsal fin.Scale samples were placed in labeled envelopes for subsequent laboratory analysisof age and growth.
Each specimen was then filleted and skinned, taking care to retain only edibleflesh, free of internal organs, bone, and skin. Prior to their use and between eachspecimen, filleting utensils were washed in hot, detergent water and rinsed withdistilled water. Surfaces in contact with the fish or flesh sample were coveredwith a clean sheet of aluminum foil which was replaced between specimens.
Flesh samples were placed in two, individually tied, labeled plastic bags and againplaced on ice. Upon completion of filleting all specimens, flesh samples wereimmediately packaged, deep frozen, and transferred to the custody of thecontracting agent.
2.5.3.3 Age Determination
Fish scales were stained with alizarin red, and mounted on labeled microscopeslides (Bagenal, 1973). Scales were then read with the aid of a Bausch and Lomb
2-22
SR300373

DRAFT
overhead microscope slide projector. Several scales from each fish were examinedand the age determined from an evaluation of annul! (growth rings). Interpretiveinformation from established data bases was used for age confirmation (Carlander,1969).
2.5.4 Benthic Macroinvertebratef^2.5.4.1 Benthic Macroinvertebrate Collection .'• .————————————————————— ^-'--
Macroinvertebrates were collected with a D-frame net (30 cm wide x 25 cm high)using equal time and effort at each site (Frost, et. al., 1971, Benfield et. al., 1974).The technique involved placing the net against the stream bottom and thoroughlydisturbing the substrate directly upstream by kicking. Macroinvertebratesdislodged from the substrate are carried into the net by water current. A singlesample was constituted by pooling two subsamples collected over a period of 1minute each from the same area.
Kicknet sampling of macroinvertebrates has been a useful and effective method infield monitoring since 1958. The use of kicknets as employed in this project issupported by scientific literature and is accepted for use by regulatory agencies.According to Frost, et. al. (1971), kicknet samples from similar habitats provideconsistent information, and samples collected by different people showed littlevariation when habitats were similar. Frost, et. al. (1971) noted that 87 percent ofall benthic taxa were collected with two kicknet samples. The capture rate did notreach 100 percent until 10 samples had been collected.
The high efficiency of capture with kicknet samples found by Frost, et. al. (1971)was supported by the work of Crossman and Cairns (1974). They compared bottomand surface artificial substrate samplers with bottom (kick) net and Surbersampling results. When compared to the artificial substrate sampler, kicknetsampling resulted in the lowest variability of diversity indices. Pollard and Kinney(1979), in an U.S. EPA document, also compared the kicknet technique to othersampling methods. They found that the kicknet method collected more taxa and
2-23
ftR30037U

DRAFT
individuals per sample with equivalent or lower variability than the Surber samplerand the Portable Invertebrate Box Sampler. In addition the Fisheries Section,.Game and Fish Division, Georgia Department of Natural Resources, is usingkicknet sampling in its evaluation of important river systems within the WaltonDistrict of the East Central Region. The technique is being used to maximizegeneration of macroinvertebrate baseline data in a short period of time (Hess,1979).
Samples were fixed with 10 percent formalin and returned to the laboratory wherethe macroinvertebrates were separated from the substrate, sorted, identified, andcounted.
Samples were analyzed individually for number of taxa and number of individualsper taxon. Community analyses on either individual or pooled samples includedcommunity diversity (Shannon-Weiner) index, percent composition by taxa, andpercent similarity index.
2.5.4.2 Benthic Invertebrate Sample Stations
Five sampling areas on Bald Eagle Creek and three sites in the Susquehanna Riverwere selected for study. Descriptions and locations of all sampling stations arepresented in Table 2-1 and Figure 2-4. Stations 1002 and 1001, upstream of DrakeChemical outfall, function as reference stations. Stations 1003 through 1007,downstream of the Drake outfall, have the potential of being affected by anydischarge from the site. Three sampling stations in the Susquehanna River weresampled to evaluate the influences that Bald Eagle Creek and/or the leachatestream may have on the rivers' benthic community. Station 1008, located in theWest Branch of the Susquehanna River upstream of its confluence with Bald EagleCreek, serves as a reference station for the West Branch of the Susquehanna River.
At each sampling station macroinvertebrates were collected in transect 1/4 and3/4 of the distance across the stream or river, near the north (N) and south (S)
2-24

DRAFT
bank, respectively. Sample stations were selected as much as possible to be similarin terms of substrate characteristics, depth, width, and current speed.
2.5.4.3 Benthic Invertebrate Laboratory Analysis O
Preserved samples were stained with rose bengal to aid in the detection ofmacroinvertebrates from substrate and debris. Benthic samples were placed in aNo. 60 U. S. Standard Sieve (250u) and rinsed with tap water to removepreservative and stain. Following this rinse, macroinvertebrates were sorted fromthe sample into major taxonomic groups with the aid of a stereomicroscope. Aftersorting, 70 percent ethanol was used for the preservation of all organisms.
Annelids and chironomidae taken in collections required examination with acompound microscope for identification. These organisms were mounted on glassmicroscope slides with CMC mounting media and dried in an incubator at 40-50°Cfor a minimum of 48 hours. Completed slides were stored for identification.
The majority of the macroinvertebrates collected were identified to at least thegeneric level. Major taxonomic references used for the identification ofinvertebrates are presented in Table 2-2.
2.5.4.4 Benthic Macroinvertebrates Methods of Analysis
Estimates of diversity (information per individual) as defined by Shannon-Weinerwere made:
3 - I, li '<>« *N
where D - information per individual; N » total number of individuals; n; « totalnumber of individuals in the ith species; s - the number of species in the sample fora given station.
2-25!I

DRAFT
TABLE 2-2
DRAKE CHEMICAL SITEREFERENCES USED FOR IDENTIFICATION OF MAJOR
MACROINVERTEBRATE GROUPSAQUATIC SURVEY
Taxonomic Group ___________References________________
Nemertinea Gibson, R., and Young, 1976
Polychaeta Foster, 1976
Oligochaeta:Naididae Brinkhurst and Jamieson, 1974Tubificidae Stimpson, et.al., 1982
Gastropoda:Ancylidae Basch, P.F., 1963
Isopoda Williams, 1976
Ephemeroptera Alien and Edmunds, 1963Bednarik and McCafferty, 1979Edmunds, et.al, 1976Morihara and McCafferty, 1979
Odonata:Anisoptera Needham and Westfail, 1955Zygoptera Walker, 1953
Megaloptera Davis, 1903
Coleoptera:Elmidae Brown, 1972
Trichoptera Flint, 1964Ross, 1944Wiggins, 1977
Diptera:Chironomidae Beck, 1976, Mason, 1973, Roback, 1957,
Simpson and Bode, 1980, Steiner, et.al, 1982,Simuliidae Stone and Jamnback, 1955,
Snoddy and Noblet, 1976
General References: Pennak, 1978Merritt and Cummins, 1978Edmundson, 1959
2"26
R&3GG377

DRAFT
Estimates of redundancy were computed as follows:
m Dmax - DDmax - D min
whereDmax « (1/N)[log2N! - Slog2(N/S)!]
Dmin - (1/N)tlog2N! - Iog2 (N-(S-I))!]
The redundancy value is an expression of the dominance of one or more species andis inversely proportional to the number of species (Cairns and Dickson 1971).
These diversity indexes (D and r) respond to changes in community structure. Forexample, when large numbers of individuals and small numbers of taxa are found,as in effected areas of streams receiving organic wastes, a large probability existsthat an individual species observed in a sample belongs to a taxa previouslycollected. Therefore, a considerable repetition of information exists andredundancy (r) is high, whereas information per individual species (D) is low. Cleanwater areas contain smaller numbers of individuals per taxon and large variety oftaxa. Because less repetition of information per individual exists, information perindividual (D) is greater and redundancy (r) lower (Cairns and Dickson 1971).
Information per individual (D) values less than 1 are reported for aquaticcommunities subjected to areas of heavy organic pollution, from 1 to 3 .formoderate pollution, and values greater than 3 in clean water areas. (Wilhm andDorris, 1968).
A community comparison index, percent similarity, was computed to evaluate thesimilarity in species composition between sampling stations. This index isexpressed as:
PSC « 1 00-0.52"] a-b | - Smin (a,b)
2-27
fti300378

DRAFT
where PSC is the percent similarity and a and b are the percentages of a species insamples A and B. This indice qualitatively measures the relative similarity ofspecies composition in two samples. The PSC is only an empirical measure and isnot an estimate of a statistical parameter of the population from which thesamples are drawn. PSC values can range from 0 to 100. A value of 0 indicatesthat the species composition in the two samples is entirely different and a value of100 indicates complete similarity.
••
2.5.5 Diatom Survey
Samples for qualitative analysis of diatoms were collected from rocks removedfrom each station sampled for macroinvertebrates. Samples from transect stations1001, 1002, 1003 were composited whereas those for transects 1004 through 1008were separated by north and south near shore areas of the stream. One or tworocks from each area were brushed and the resultant suspension was diluted withdistilled water. Burn mounts were prepared by drying an aliquot from each sampleon No. 1, 18 mm2 coverslips which were heated for 3 hours on a hot plate (320°C)and mounted on glass slides with Hyrax. A random point was chosen at the edge ofeach coverslip and a vertical transect was scanned at 1000 X until at least 100diatoms were identified. Counts were converted to percent composition for therelative abundance of each diatom species. Shannon-Weiner and percent similarityindices were calculated using the formulae described for benthicmacroinvertebrates.
2,6 Terrestrial Survey
On October 5 and 6, 1983, a reconnaissance of the Drake Chemical Site and thesurrounding areas was performed. The purpose of the investigation was tocharacterize terrestrial vegetation in the site vicinity.
Manufacturing operations at the site included the production of the herbicideFenac. Fenac is a solid under environmental conditions and exhibits limitedsolubility in water (203 mg/l at 22 °C). In its commonly available form as Fenatrol,
2-28
RR300379

DRAFT
a-17.3 percent aqueous solution of the sodium salt, it is primarily used to provide' control of annual and.perennial broadleaves and grasses in non-crop areas such as
utility rights-of-way. The only crop species which has clearance for use withFenatrol is sugarcane, where it is used to provide pre-emergence, season-longcontrol of weeds such a Johnson grass (Sorghum nalepense). Fenac is also effectiveagainst submerged aquatic weeds when applied prior to flooding. *;
Crop damage thresholds range from 100 to 10,000 micrograms per Kilogram(Ug/Kg). At customary application rates, these concentrations are rare. Fenac ispersistent. At standard agricultural application rates of 4 to 20 Ibs. per acre,herbicide residue would be anticipated for 1-2 years. These application rates areroughly equivalent to soil concentrations of 2,000 to 10,000 (ug/Kg).
Because of Fenac's persistence and the fact that in the past studies, it mirrored thedistribution of other compounds found in the leachate channel sediments, it wasselected as an indication of the extent of contamination within the leachatechannel. Lateral dispersion of the compound away from the leachate channelshould be evidenced by vegetative stress in response to its herbicidal properties. Inaddition, surface erosion from the site may carry Fenac residue onto adjacentareas, again evidenced by vegetative stress. Finally, groundwater seeps, if any,from the site may be identified by vegetative stress induced by Fenac.
The terrestrial vegetation survey is therefore intended to serve as an indicator ofextent of contamination. The presence of stressed vegetation is not a problem in
! and of itself; rather it indicates potential contamination by Fenac and/or othertoxic substances which may have migrated from the site. For the purpose of thesurvey, it was assumed that anomalies in vegetative cover in the vicinity of thesite and leachate channel may be related to the presence of Fenac and/or other
; toxic compounds unless the anomalies could be attributed to physical factors (e.g.,season, soil conditions, competition with other species, etc.).
2-29I\ BR300380

DRAFT
3.0 RESULTS OF INVESTIGATION
3.1 Site Geology ,fc'
3.1.1 Physiographic Setting v
The Drake Chemical Site is located in the transition zone between the AlleghenyPlateau Province and the Appalachian Mountain section of the Valley and RidgePhysiographic Province. It is situated in an alluvial valley formed by Bald EagleCreek and the Susquehanna River. Regional topography is rugged, with elevationsranging from 530' msl to 2,017' msl. South of the site Bald Eagle Mountain risessteeply from Bald Eagle Creek, while north of the site the land rises moregradually to the steep hills of the Allegheny Plateau.
3.1.2 Stratigraphy
The regional stratigraphic sequence in the area consists of Devonian age shales andlimestones which are underlain by Silurian and Ordivician limestones. Thissequence is cut by stream valleys.
Many shallow holes have been drilled in the area and in the surrounding region.Regional shallow borings were drilled by the Baltimore District U. S. Army Corpsof Engineers, Commonwealth of Pennsylvania Department of Transportation, LockHaven State College and the Clinton County Housing Authority. These borings aredocumented in the Lock Haven, PA Phase I General Design MemorandumAppendices (Corps of Engineers, 1980). Drilling logs of borings installed by theAmerican Color and Chemical Company are attached in Appendix B.
The lithology of the Drake Site consists of a clayey to sandy silt which increases ingrain size downward to a sand and gravel, then into sandstone fragments. Thesandstone fragments are underlain by a fractured shale. The shale is partiallyreplaced by alluvial materials near Bald Eagle Creek as reflected in the three deepexploratoryborings drilled by NUS, MW-E1 to MW-E3. Boring locations are
3-1
RR30Q3SI

DRAFT
presented in Figure 3-1. Lithology in the vicinity of the site is illustrated by crosssections in Figures 3-2 to 3-4. ' _
r
Exploratory boring MW-E1 encountered shale at a depth of 40 feet and wasadvanced 40 feet into the shale. Fractures were predominately low to moderateangle between 40 to 66 feet deep and nearly vertical from 66 to 80 feet deep.Calcite veins were common within the fractures. A detailed description ispresented in the boring log in Appendix A. The fractured shale may be underlain bya fractured limestone (Map, Corps of Engineers, 1980). However, the depth ofcontact is not known. The-fracturing of the bedrock is primarily stress relief fromthe river valley. As the boreholes' drilled were not very deep, the actual totaldepth of fracturing in the river valley was-not determined.
Boring logs and well point information in the vicinity of the leachate lagoonindicate a higher silt content of the subsurface materials near the lagoon than isfound elsewhere in the area. This gives the low hydraulic conductivity results andis also shown by the mounded groundwater table. Along the leachate stream, thebed is composed of a silty clay. The clay content varies along the stream bed.Higher clay contents and low hydraulic conductivities were observed near therailroad tracks in the upper end of the stream and in Castanea Township Park.
3.1.3 Structure
The site is located approximately 5 miles southeast of the Snow Shoe Syncline(Taylor, 1977). The regional structure of the southeast limb of the syncline has anaverage strike of N60°E and a dip of 20° to 50°NW. The actual strike and dip of theshale at the site could not be determined.
Several regional joint systems are reported to be prominent. One of the mostpronounced is a NW-SE trending set oriented approximately perpendicular to theregional structural trend (Corps of Engineers, 1980). No major faults are known toexist in the immediate area of Lock Haven.
3-2

iO;zHi
>lim
gig
rn »o
3
V
i

i*lio|0 8 o ro §
O! m0
w — ._0 | >
'33'>::*im_.<T(.2 m1 Oim pISOSo 2s •> o
ien"'
MV.'I9& OE.-U 22C*.Mwi^QRt

_______,—————————.——————————————————:————-—'————————— in* * g ^ £ S 2 3 §§ g 8 ° O O O ° * 2
m
o'3
V CO!(/>,(/>
CD
—e=
s
-•' •
=' —m —— f J i
CLAYSTONb,WEATHERED
CO&
1
\\1 ' /"
- / h, / S
_ U> 'oi 'tn !oiOB l<o OO 'O O
i -t(j> 01 "ISS 8 S
ftR30038'5

o
O33
O Ox r-m O2 C)O O
> o
5 p co? tn to.- °-2 m
f 2
m

If DRAFT
3.1.4 Subsurface Soils
Onsite soils consist primarily of clayey silt. Construction debris and waste sludgeoverlays the clayey silt on parts of the site.
Offsite natural soils are primarily of Ashton Huntington Association. The soil isusually well drained with moderate permeability and high moisture holdingcapacity. The soils generally tend to coarsen downward into sand at 5 to 15 feet indepth.
3.2 Hvdrogeoloqy
3.2.1 Regional Hydrogeoiogy
The Lock Haven area is in the Susquehanna River Basin. The regional groundwaterflow of the Lock Haven area is controlled primarily by the West Branch of theSusquehanna River and Bald Eagle Creek. The unconfined (water table) shallowaquifer has a direct hydrologic connection with the river system. It is evident fromthe groundwater flow data obtained from Hammermill Paper Company that locallyalong the stream banks the shallow groundwater flow direction is toward thestreams. Thus, Bald Eagle Creek and the West Branch of the Susquehanna River
; are the discharge points for the shallow groundwater. Regionally the groundwaterflow through Lock Haven is east to northeast toward the confluence of Bald EagleCreek and the West Branch of the Susquehanna River.
! Groundwater normally discharges into the nearby streams except during periods of1 high flow and flooding in which case the steams would recharge the aquifer nearI their banks.
The shallow unconfined aquifer in the Lock Haven area consists of alluvial depositsI and the underlying fractured shale bedrock. The fractured bedrock is hydraulically
connected to the overlying sandstone fragments or adjacent alluvial deposits. Thelower limit of the unconfined aquifer is not known. However, a fractured
3-7
AB3QQ387

DRAFT
limestone may exist under the shale which may be hydrologically connected to theshale. The greatest depth of fracturing would occur in the river valley and wouldsubstantially decrease toward the mountains which border the river valley.
'••'•3.2.2 Site Hydrogeology \
The hydrogeology of the site is very complex. Basically, the groundwater regimeat the site consists of saturated alluvial deposits overlying fractured shale bedrock.The bedrock and overlying deposits are hydraulically connected, forming theunconfined aquifer in the area. Monitoring well locations are presented inFigure 3-1. Monitoring well and observation well point information is presented inTables 3-1 and 3-2, respectively.
The unconsolidated alluvial deposits consist of sandy to clayey silt deposits at thesurface grading downward into coarse grained sand and gravel and sandstonefragment deposits with increasing depth. Hydraulic conductivities within theunconsolidated deposits range from 1.4 x 10~5 cm/sec, found in a silty sandencountered at a depth of approximately 15 feet (Monitoring Well M-6), to 8.4 x10 ~3 cm/sec, found in a sand and gravel formation encountered at a depth of 31feet (Monitoring Well M-3). As shown by comparing the screened intervals ofmonitoring wells, given in Table 3-1, with the hydraulic conductivities and screenedformations of the wells, given in Table 3-3, there is a considerable variation inhydraulic conductivities, both vertically and horizontally, within the unconsolidateddeposits. These variations are caused by both formation changes and bygradational changes in the relative percentages of silts, sands, and clays withineach lithologic unit. These horizontal and vertical variations in lithology andhydraulic conductivity make the aquifer a heterogeneous aquifer.
In the southern part of the site, a mounded water table was found, extending acrossthe American Color and Chemical property along a swale which runs perpendicularto the leachate lagoon. This condition is caused by a greater depth of silt in thisarea than is commonly found across the site. This silt has a low horizontal andvertical hydraulic conductivity.
3-8

o oa a.
o in o o o oo o o o o .c o •=
O
i Ut
a ao ct- "~«so
•o ei= S!II!O 5|
LJ
a
CM T ^ in o »- t CM ^r CM to eo in int - t o o m n o j (•> CM o o> -• OB -•o> o co c rx ro r* rs. r» r» en <o to rx en co enin (O in in in in in m in in in in in in in in in
P£3! (3
« 5 =< * u 2
I" flil *1E °o
O5 « COr t ^ - ^ -
f M t » . m « c M r x — ; C N oo J c o m ' - o ^NO <o- - « M f > . < O t > 5 f i r v t o < M
in
05 en o) en en co o en o o 03 03 en en 09 09
S — • c n » - i n c o c M c o r ^ c n o t o c n^ o in ~
c
w —
o in ' e n c v i i n o o o ocd rx m r>i ee e> cs ee s p gc o c e <cin . . , , , . i i i , i i i i i t iI i i ' ' i p c B c o ' c M i o i n p p p p
— ? 10 CM n -•-•"-•-•
a p en p p p co p p in in in p p in in in inCN ro co en co ro p <N co <o e n i n c n - ; » 7 - - ^ ;
SCO CO CO..
i i i i i T CM CM CM
I i i i i i i I i i ? 2 2 2 2 2 S S
S
t

J2 aoc o o o o o o o o o o o o o i n m o o— — ^ co CM in co rx in v n n co in p -• -r coa Q o o o o o o o o o o o o d o o£2
q
co>
«- .2OUJ — _ : ~ _ : » w i « t N r t ' « r ' - ' o p c o o o e n o o_ _ inO _c J£ — .~ : ;« i>i ift m in in in m i« i« «* in1 waO
co=
12 > E i n j n i n i n S i n i n i n i n i n i n i n i n i n i n -O 2\ a.
2 r x t n u s t o c o ' ^ ^ t o i n — o —• »- rx to rj =to e o c M i n r x o o t o < o i n c o > - o c a < — O J T - ®">= r x c o c o ' r e n c o i x c o t o ' t r x r x e n i n i n r x "5.• S ( O O C O C O C O i n i n O C O C M T O C O T C M ' - _"Jo c M « o e n » - - . o o i n ' c — t x c o f ^ r x — - e n £
5 —• en o CM CM CM" CM" •- •- CM CM" CM -- -• co co £•"^ C O C M C O C O C O C O C O C O C O C O C O C O C O C O C O C O —
o c o e o c M O c o e n « - o r x o ic o e n c M a c M i n o c o i n - - c n o c B c n c o — •—• co —• PV •- co in CM o. <o i~- — CM i Ix ce'
0>O ^ w - ., . _ _ . . . .
C= « m o s ^ r - . « — f < o e n - - o o f o o ~ < o ^ £" c o ^ — • e » O 8 » c n i n c o ^ i n c o » a > c o - . c o Sr x i n o c n o ^ r x c o c o c o n c M t e t o c M — • g/si en OJ « rx" co" ix" ix? eo co" co" e» o" en en" cd o <w l ^ ^ T r n — ? — r ^ r f v ^ ~ i n ^ ^ T i n
(A
15t o o r - o o o i n o o T c o i o o i n o S^ _ . . . . . . . . . . . . . . . . . * . *o — r x o - f c o ^ c o — i n ^ c B — T o s e o i n o °
C S ~ - C M C O C M » - C M < — C M C M C O C O C O M - - C M C O , -cp > i i i i i i i i i i i i i i i i £a; Q en p co p p p in e o in in -r p p co p 5uc i x O ' » e o " > ' " a ' i n « — - N - e o c o c o i n o yOT — «- CM <- "• =
£ o-32
° e d I 0 i 0 - « i 0 o i 0 e i 0 o - / i o i 0 o o i f l « >53
is |°li r^,w" is2 C M t C M C M C M C M C M C M C M — -T -T N N — -T S_i °2o a § ff
r o c wi -i 55
S 55 o o ~" '£ D.U. u. v> 0>£0==3w
» < « _ - . . .. « a> a -C O C f l —— »- —— T-T-,-.-.-.-.-^^.,. .,I I I I I I I I I I I I I I I IS S S S S S S S S S S 2 S S S S
3-10
SR300390

DRAFT
TABLE 3-2
WELL POINT INFORMATIONDRAKE CHEMICAL SITE
Well Depth toPoint Depth Groundwater
Number (Feet) (Feet) _______ Location ___________
WP-1 6.5 1.5 North of Leachate Lagoon
WP-2 6.5 2.0 West of Leachate Lagoon
WP-3 6.5 1.5 West of Leachate Lagoon
WP-4 6.5 1.5 South of Leachate Lagoon
WP-5 2.5 1.02 Leachate Stream near R.R.3
WP-6 5.5 1.0 Leachate Stream near R.R.
WP-7 3.5 3.0 Leachate Stream between PineStreet and Highway 220
WP-8 3.5 Dry ' Leachate Stream in Castena Park
WP-9 18.5 12.0 North of site, S.E. corner of WalnutStreet and Jaystreet Exit
' Location of well points shown on Figure 3-5.2)' Water found at surface, level in completed
riser pipe 0.5' above stream bed.3\' Water flowed at surface, level in completed
riser pipe 1.0' above stream bed.
3-11

DRAFT
TABLE 3-3
HYDRAULIC CONDUCTIVITIESDRAKE CHEMICAL SITE
Monitored HydraulicWell No. _______Formation_______ Conductivity (cm/sec)
El Shale 8.5 x 10~*E2 Shale 7.0 x TO'*E3 Sandstone Fragments 3.4 x 10
M1 Silt and Sand 7.0 x 10^M2 Sandstone Fragments 7.5 x 10J,M3 Sand and Gravel 8.4 x 10__M4 Sand and Gravel 6.5 x 10~j:M5 Sand 7.4 x 10*M6 Sand 1.4 x 10 J?M7 Silt 2.9 x 10J?M8 Sand, Sandstone Fragments 4.4 x 10 .M9 Silt and Sand 5.5 x 10~*M10 Sand, Sandstone Fragments 2.4 x 10~M11A Sand and Gravel 3.5 x 10~,M12A Sand and Gravel 8.0 x 10~M13 Sand and Gravel 7.4 x 10~M14 Sand and Gravel 9.5 x 10%M15 Gravel 1.5 x 10^M16 Sandstone Fragments 9.4 x 10~M17 Sandstone Fragments, Gravel 3.3 x 10\M18 Sandstone Fragments 3.0 x 10~M19 Sand . 8.7 x 10"gM20 Sandstone Fragments, Gravel 2.3 x 10~M21 Silt, Sand and Gravel 5.5 x 10
3-12
ftR300392

DRAFT
The shale bedrock underlying the unconsolidated deposits beneath the site ishydraulically connected to the overlying sediments as shown by the similarity ofthe water levels measured in the monitoring wells installed into bedrock with waterlevels of monitoring wells installed in the unconsolidated deposits. The hydraulicconductivity of the shale is dependent on and controlled by the degree and depth offracturing, and the orientation of the fractures. Hydraulic conductivities in thebedrock were calculated to be 8.5 x 10~4 cm/sec and 7.0 x 10~4 cm/sec in wells EHand E-2, respectively. ''
vCGroundwater flow direction regionally and across the northern part of theAmerican Color and Chemical Property and the Drake Site is east to northeast,eventually discharging into Bald Eagle Creek or the West Branch of theSusquehanna River. Flow direction in the mounded area varies as shown in theequi-potential map (Figure 3-1). Flow direction in the vicinity of the leachatestream is described in detail later in this section. Although local flow directionswithin the bedrock are controlled by fracture orientation, the overall flowdirection probably parallels the flow direction in the overlying sediments, as theyare hydraulically connected. Water level elevations are presented for theconventional and multi-level samplers in Tables 3-4 and 3-5, respectively. Waterlevels at the American Color and Chemical property are presented in Table 3-6.
Highway 220 and the Jay Street by-pass cut through the study area. The highwaysystem is 30 to 40 feet above the site at certain locations. This acts as anhydraulic barrier during spring and extended periods of precipitation. The highwaymounds water and may seasonally prevent or retard contaminant migration fromthe Drake Site. This is supported by the observed seeps on the west side of thehighway and the groundwater quality observed in MW-M16, 17, and 20 across thehighway from the site. This could be substantiated by addition borings along thehighway. The amount of time during the year which this would act as a barrier isimportant in determining the extent of potential contaminant migration past thehighway.
3-13
&R300393

- DRAFT
TABLE 3-4
GROUNDWATER ELEVATIONS '>--DRAKE CHEMICAL SITE *<**;>.,?•
i_____________________ Date______________________Well No. 10/07/83 10/13/83 10/28/83 01/19/84 02/17/84
M-1 547.761 547.86 549.70 551.46 —2M-2 544.48 544.78 544.78 546.71 548.98M-3 543.85 543.85 544.04 545.92 549.35M-4 542.25 542.45 542.45 545.77 549.65M-5 546.74 547.34 547.57 550.30M-6 548.62 . 548.92 549.80 551.01M-7 552.32 552.67 552.78 555.12M-8 544.81 544.81 545.06 547.80M-9 550.20 550.80 551.20 553.52 553.40M-10 ' 545.33 545.53 - 548.57 .M-11A (Deep) 536.63 539.83 537.13 543.31M-1 IB (Shallow) 537.73 539.83 539.73 542.24M-12A (Deep) 542.10 538.17 542.70 539.57M-12B (Shallow) 542.27 541.40 543.07 545.87M-13 541.35 541.50 541.96 543.81 549.25M-14 544.09 544.59 544.89 547.10 550.69M-15 540.63 540.53 540.98 543.63 548.93M-16 540.95 540.85 . 541.20 543.83 548.45M-17 541.88 541.83 541.98 544.87 548.68M-18 543.16 543.31 543.24 ' 547.06 549.96M-19 542.90 542.90 542.95 546.52 552.4M-20 538.40 538.75 539.27 541.75M-21 542.21 542.11 542.51 545.01 548.91E-1 545.04 545.09 545.19 546.84 548.34E-2 543.12 543.27 543.39 546.45 549.42E-3 543.34 543.44 543.49 546.09 550.14
1) In feat above mean sea level2) Water levels obtained two days after crest of flood on Bald Eagle Creek, some
locations were not accessible.
\ 3-14i
&R30039U

DRAFT
TABLE 3-5
VERTICAL HEADS AND BARCAD INFORMATIONDRAKE CHEMICAL SITE
Length of Tubing AboveLocation/Date Water Levels1 _____ Top of Casing2 _____
B - 1A 546.89 2.2B - 1C 546.44 3.0B - 2A 546.05 1.0B - 2B 545.77 1.2B - 2C 545.13 2.0B - 3A 544.47 1.7B - 4A 542.91 0.3B - 4B 543.09 1.7B - 4C 542.73 2.6B - 5A 543.90 2.1B - 5C 543.70 3.5B - 6A 554.93 1.5B - 6B 544.82 1.9B - 6C 544.59 2.5
1 In feet above Mean Sea Level (MSL) water levels obtained on 10/28/83.2 In feet.
] 3-15t
M.3QQ395

DRAFT
TABLE 3-6
WATER LEVEL ELEVATIONSAMERICAN COLOR AND CHEMICAL
Well No. 08/16/83 09/12/83 10/12/83
MW-1 547.19 546.59 546.24MW-2A 546.30 545.82 545.59MW-2B 546.12 545.45 545.17MW-4 545.64 545.43 544.99MW-5 550.40 549.74 549.24MW-6 ' 549.23 548.68 548.16MW-7 549.79 546.69 548.08MW-8 555.94 555.74 555.60MW-9 558.43 555.51 555.33MW-10 557.84 557.66 557.53MW-11 555.94 555.14 554.60MW-12 558.11 557.78 556.77MW-13 548.03 547.39 546.89MW-14 547.27 546.58 547.49MW-15 555.38 555.10 555.56MW-16 555.10 555.16 555.22MW-17 545.18 544.86 546.75MW-18A 545.41 545.07 544.73MW-18B 545.52 545.16 544.98MW-19A 555.43 554.88 554.51MW-19B 550.55 549.11 548.17
Elevations are in feet and measured from a datum of sea level.
3-16
RB300396

DRAFT
The old Pennsylvania Canal runs north to south along the American Color andChemical and Drake Site boundary. The canal was reported to be filled in withdebris during operation of Drake. Water supply and sanitary sewer lines surroundedby clay run within the old bed. Interviews with residents and city officials indicatethat the canal was less than 20 feet in depth and was not lined. Monitoring wellsMW-M1 and MW-M8 are located in the old canal and water levels support that thecanal area is hydrologically connected to the unconsolidated aquifer. Sludge wasencountered in both borings as shown on the boring logs in Appendix A. Thehydraulic conductivities of the materials in the canal are generally slightly lowerthan the area surrounding the canal, as shown by comparisons of the estimates ofhydraulic conductivities given in Table 3-3.
Buried pipelines are discussed in Section 2.1.5 and located on Figure 2-1. Pipelinesburied in a gravel bed may act as a conduit for groundwater flow or as a source ofcontamination if leaks develop.
Existing Wells
A water supply inventory was conducted and found no water wells in operation inthe vicinity of Drake. Two abandoned bedrock wells are present on the AmericanColor and Chemical property. One well location, near building 74, had a turbinepump in place while the other had the pump dismantled. The 12-inch diameter wellwith the dismantled pump, in building 36, had a depth of 138 feet. The water levelin the well was observed in May 1983 to be approximately 14.2 feet below surface.The well was reported to have been idle for approximately 20 years. An abandonedcity well, 85 feet deep, is located near an old city garage near East Clinton Street.American Color and Chemical Company has 21 monitoring wells, ranging in depthfrom 12 to 40 feet, located as shown in Figure 3-1.
3-17

Aquifer Characteristics
DRAFT'€>.-„., MX
Hydraulic conductivity testing was conducted on all monitoring wells using a bailtest for wells in unconsolidated material or pneumatic packer pressure tests forbedrock wells. Hydraulic conductivities are summarized in Table 3-3.
Hydraulic gradients and average groundwater velocities were calculated fordifferent areas of the site. A hydraulic gradient of 0.004 in the unconsolidatedmaterials was determined for the northern portion of the site.Downgradient of the site in the vicinity of Highway 220, the gradient is reduced toapproximately 0.002. This is generally comparable to the regional gradient of0.0035. An average regional linear flow velocity range 4 to 16 feet per year wascalculated for the unconsolidated material and 3.5 to 20 ft/yr for the consolidatedmaterial. The influence of the elevated highway may act as a recharge barrier andreduce groundwater flow velocity near the highway. The average flow velocity ofthe perched groundwater would be substantially lower than the average flowvelocity of the rest of the site.
Leachate Stream Hvdrogeology
Physical Characteristics
The leachate stream is approximately 1,620 feet long. It physically extends fromthe base of the railroad track bed near the leachate lagoon at Drake Chemical toBald Eagle Creek. A cross section along the stream is presented in Figure 3-4.This figure shows the soils present and groundwater levels in relation to the streambed.
Stream Hydrology
The leachate stream is an intermittent stream that flows south into Bald EagleCreek from the southern edge of the site. The main source of the leachate streamis base flow derived from groundwater discharge. The main groundwater discharge
1 3-18I
ftR300398

I
DRAFT
area is located west of Highway 220, approximately halfway between Pine Streetand the railroad tracks.
The stream bed west of Highway 220 varies in width from 10 to 25 feet and isdevoid of vegetation. The primary sources of the stream during dry periods are (A)small seeps of less than 1 gpm at the base of the railroad tracks originating fromthe mound around the leachate lagoon, (B) surface runoff from wet areas west ofthe Hammermill ball field, (C) groundwater discharge along the stream, and (D)Highway 220 seeps and storm runoff. East of Highway 220 the stream bed narrowsdown to 2 feet in width at the base and is vegetated. Surface runoff and seepsfrom the east side of Highway 220 drain into the stream east of the highway.
Throughout the period of study, groundwater elevations, stream flow, leachatelagoon surface water elevation, and seeps were observed and generally comparedwith general precipitation. During most of the period of study the leachate streamwas dry. No flow was observed between August 1983 and January 1984. Most flowoccurs during the spring time when groundwater elevation and base flow are thehighest. However, no quantitative stream flow information is available.
During February 1984, Bald Eagle Creek rose to 22.5 feet above normal levels,approximately 1.5 feet above flood stage. Observations made during the floodindicated that the leachate stream flooded. Two main seeps were observedoriginating from the railroad embankment, as shown in Figure 3-5.
Groundwater discharge into the stream bed would be proportional to groundwaterelevations. The elevated Highway 220 may act as a hydraulic barrier togroundwater flow from the Drake Site. This may cause an increase in groundwaterlevels west of the highway and increase groundwater discharge into the streamfrom the area between Drake and Highway 220 and from the area south of thestream from Hammermill property.
The hydraulic conductivity of the stream bed is low enough (approximately 10~5 -10~6 cm/sec) to cause local shallow confining conditions near the railroad tracks.
3-19
&R3QG399

®
NNOTE OBSERVATION WELLPOINT WP-8 IS LOCfl
THE STREAM BED NEAR MA - MIIA S B
x •
WP-7»
-. v. ./ ... i. •, . -LEGEND*• ' .
' (T) SMALL SEEPS ALONG RAILROAD TRACKSX© GROUNDWATER DISCHARGE (AREA OF DISCHARGE
. INCREASES WITH HIGHER WATER TABLE)(?) SEERftGE S RUNOFF COLLECTION DITCHES
ALONG HIGHWAYWP-I OBSERVATION WELL POINT
FIGURE 3-5
IMUSOAHalllburtonCompany

DRAFT
This is indicated by water levels in WP 5 and 6 being above the stream bed. In thearea between Drake Chemical and Pine Street the hydraulic conductivity of thebed is slightly higher (approximately 10~5 cm/sec). In this area, the stream bedintersects the groundwater table and base flow occurs. East of the highway theclay bed is thicker and has a lower permeability (approximately 10~6 cm/sec). Nowater was encountered during installation of the well point in the stream bed inCastanea Township Park. ^"iG
Stream flow which primarily originates east of Highway 220 would flow through aculvert under the highway and into Castanea Township Park. The stream wouldhave limited infiltration into the groundwater in this stretch during normal flowconditions due to the low hydraulic conductivity of the base of the stream bed.However, the amount of stream flow infiltrating into the ground would increasewith higher flow as the water level would rise to contact higher hydraulicconductivity materials higher up on the stream bank. The stream, as well asgroundwater in the township park discharges into Bald Eagle Creek.
3.2*3 Chemical Analysis
All groundwater samples were analyzed for priority pollutants, Fenac, TOH, TOC,sulfate, chloride, pH, conductivity, and ammonia. Analytical results are presentedin Tables 3-7, 3-8, and 3-9.
Fenac was detected in the onsite wells at concentrations ranging from 2,300 to57,000 micrograms per liter (ug/l)- Fenac concentration in the offsite monitoringwells ranged from not detectable to 389 yg/l.
The following inorganics were found in the onsite and offsite groundwater, with theexceptions that cyanide was not detected in offsite wells and selenium was notdetected in onsite wells:
3-21

DRAFT
TABLE 3-7
GROUNDWATER INDICATORSDRAKE CHEMICAL SITE r__
Fenac TOH TOCSample No. _____Description_____ ug/l ug/l ug/l
MW-M1 Monitoring Well M1 2,300 10,500 98,000
MW-M5 Monitoring Well M5 57,000 27,100 365,000
MW-M6 Monitoring Well M6 9,400 15,600 204,000
MW-M7 Monitoring Well M7 8,900 13,400 232,000
MW-M10 Monitoring Well M10 - 4,040 157,000
MW-M11A Monitoring Well M11A 2.3 316 211,000
MW-M11B Monitoring Well M11B - 7 42,000
MW-12A Monitoring Well M12A 0.6 427 168,000
MW-M13 Monitoring Well M13 0.6 89 162,000
MW-M13-1 Monitoring Well M13 (Duplicate) 0.4 1,140 70,000
MW-M14 Monitoring Well M14 79 10,100 177,000
MW-B6A Monitoring Well B6 A Level 389 14,200 31,200
MW-B6B Monitoring Well B6 B Level 248 8,400 29,000
MW-B6C Monitoring Well 86 C Level - 368 15,700
TOH - Total Organic HalogenTOC - Total Organic Carbonug/l - Micrograms per liter
3-22
HR30QW2

in HIo t
n
0 0 O gO ~ O O l f l _ f _ f a ) C M O O O « - ^ t O n i n r N
O *" P>J «- *" t <-"CN CM °>
CO §§2 SS UJegM, O
5 w< >.. < (Oi8 IO
moo O
(>•'••-' •"" ~
o
o v cs mu _ t1/ w; ,A woo r. • eo S «-
o om a>2 Ow co
CN •- — V CO
oo
<o
«S
IO
i iI „ || | |,| I2 E ! 2 n « ( o £ o o > - o g a 2 — "3.C.S< < < c a a 3 U U U U U ^ ^ S S z c A H N i
3-23
AR30Q*tQ3

ftk
* • «.* -—
» . ? 5 , S
o-
<o m • c o v / ' " ' *» - - « - C O V V < Oeo
co
' l i . tl .I II I I I I ! I 1 I ! § 1 I I e
M
£OJ8uII
a
3-24
RR300WU

<S o i i i i o o i i i i i i i n i i r x i i i i5 y (M f <0 CMI
i v '(. VG,^*f?.*y/
a i i i i i o t i i i i i i i i i i i i i iT
i otO
5
o5 m i i i i o o o i i i i o o i i i a i o i i" c e —•-•-. o o g o ni •- co in CMS
-S ? l P ' S ' - g S S S S ' S ' S ' S ' S 1 1 1 1*~ o ro in
V V V V ' —•
I O O I 9 O — I I O I O I O I I I I—•»- - . i n — - o —• in^ ^r CM
ml2 l o i i i i t i i i c M i i e i o i o i o i i i i- * -—> ^ in c^ ^ f^
CM -• CM
2 i o i o — i i i o ti in <» CM- —3 n -S v
oc0)£Q.S.1 I
S 1 ' 5-§ 1 I I 2 s a . . §
•i????i|l'. f S i S ! I ? f5 CM n rr_ n g | | N ± c » c | | CM |^ ^ r- m •a -a c — - C M " a. a. a o o-- a>
3-25

I I I I I I C O I I I I I O Q O I I I O O I I I-• .- in -. -. .
i o i o i i i i i i i i r^ o co r^ i o «J i i i- ~ - § - " - -V V V
I o i I I I i o o i i i i ro i o i i 101 i—« —• i— CM o •—
O C M I O I t o o l i l e c M o o e i o i ^ e t n—•co CM —• —• co —• o co m o> C M C O C M—' —• f^ CO ^ CM
V V V ^" A
n i i i i i i i i i i i i i t i i i i i i i
e i i i i i i i i i i i i i i i i i i i
v
z sIso o
O '
3-26

DRAFT
• aluminum• ammonia• arsenic _...• barium• beryllium• cadmium• chromium• cobalt• copper• cyanide• iron• lead• manganese• mercury• nickel• selenium• thallium• zinc.
Field blanks from groundwater sampling contained detectable concentrations ofammonia, chloride, copper, iron, sulfate, and zinc.
Organic compounds detected in onsite monitoring wells include:
• bis (2-ethylhexyl)phthalate: • 1,2-dichlorobenzenei
• 1,3-dichlorobenzeneI • 1,4-dichlorobenzene' • 3,3'-dichlorobenzidine, • nitrobenzene! • 1,2,4-trichlorobenzene
• 2,4-dichlorophenol• 2,4-dinitrophenol
3-27
IB30GW7

DRAFT
pentachlorophenolphenolbenzenechlorobenzenechloroform • '1,2-dichloroethaneethylbenzenemethylene chloride0-xylene
Organic compounds detected in offsite monitoring wells include:
• bis(2-ethylhexyl)phthalate• 1,2-dichlorobenzene• 1,4-dichlorobenzene• diethyl phthalate• di-n-butyl phthalate• phenol• benzene• chlorobenzene• chloroform• 1,2-dichloroethane• methylene chloride• toluene• 1,2-trans-dichloroethylene• acetone• o-xylene
Field blanks from groundwater sampling contained detectable concentrations ofbis(2-ethylhexyl) phthalate, di-n-butyl phthalate, chloroform, 1,2-dichloroethane,methylene chloride, and o-xylene.
i 3-28i
&R30QUQ8

DRAFT
3.2.4 Chemical Transport
Monitoring wells MW-14 and MW-B6 show the highest levels of contamination alongthe leachate stream. Analyses from MW-B6 indicate that contamination is highestin the shallow sample and quality improves with depth. This groundwater,especially near B6, may discharge into the stream during periods of highgroundwater levels when the surface of the water table intersects the stream bed.Otherwise, the groundwater would flow toward the east to northeast.
MW-M13, located south of the leachate stream has generally background qualitygroundwater with the exception of arsenic. The arsenic may be derived frominfiltration from the stream or from another offsite source.
At the lower end of the leachate stream monitoring wells M11 A and B and M12Aindicate water quality slightly poorer than background. Arsenic is at slightlyhigher concentrations than in MW-13 in the deeper monitoring wells.
3.2.5 Environmental and Health and Safety Concerns
Tables 3-10 and 3-11 compare the onsite and offsite inorganic concentrations,respectively, with drinking water standards and EPA water quality criteria forhuman health and aquatic life. The values given are for comparison only.Groundwater is not used as a source of drinking water in the vicinity of the site. Itis not known if groundwater ultimately flows to a body of surface water.
Table 3-12 compares the onsite and offsite concentration ranges with water qualitycriteria for human health and aquatic life. As stated previously, the values are forcomparison purposes only.
3-29
RR300U09

u.<cc0
aa^
c0k.<(
1 5a<ny5(9i1 HI
I!7 °S
2z_t?«<
0 >
IsisO H
i s i §, . o , " ? , ? , " 3 . ". . i • 1 7 S ' 5 51 ' v in CM ' inco r*. °<o
5 d o "o
«2= _;U X<°
§ l o oto eo o i ^ . g otvo o < o - i « i 5 < M , 3 l | ? t r , § ?' ' 5 i e i ' o 1 N ' n ' ^ ° § § - §_: § -• ^ o _ ,MN
£"3CDIcaET
ws -^
a = •-2 » ec0
(M I*-, , § , I . . • • • • • • • ' ' ' ' ' 'd <=
c 2|ix^
«co" o
, , = , o o , 1 , | i , g , 5 J o , 5 |
o*r
" ^1IP 1- I? g£ flsl
gS Il|i50 |o*S
• <=> o § 0! . . . . . • 1 - ' s • i • s • • • 5 • 55 S
5 Its ,g HllI *55S oin
c c55o
o
. , I § « 7 v 8 « v „, =c_> I • • o — ^ <•-, ws^s 1 5 E a ?
i 5• ?5S- g ge H « o •£, S o£-1 -J Z « »
3-30i

u.ga
-.£3§
«a*co>'cCwaca
? 5aAM2
1
iI a,< =5wo*
— *5 if"* o0 1-
S 3 — w
<<£
i i o i c o « - i r f i < o i o i i x o i n i o r x— f -in ^ • CM incoco i^in o in i o .—in o io rx o toCM O Ooo
1 l O I O C O I O I C O I O I h i O O l O OT co- o t o »-o<o orx^ — -to cb J ^ o— rv ^m1 CM 1 O - 1 -Iin 0> — • •v -coo •~o
1 |x o 1 1C 03— • O O CM — •0 0CM — •CM •-
_ I I C M I I x l l l l l l l l l l l l l l= tO g jf
X *" o
CM CO0 00 0o o
c >12h
1 I O I O O I ( O I O I O ! * t « O ! C O O«- + o in •«•— ->o— o --co oo • «—o — o inoo
^iU uiX =
|o |I§I
1 1 1 1 1 IOI I O O I O I 1 I O I Oo o o in o oO O CO O Ogt- o" ininCM CM
oS 2- « . -2
m 5 5 "»uu 2 _t S -ob J S 5 cW > i > S
«
1 I O O I O I U 9 I 1 I O I C M I O I 1 1in o •- + in — •0 —•— in
e e J29 « Cu e ou
o o co in i i o * - c M i n o c M o i o i o i c o. . » i i n * " »i >• t «i * CM *CM «• o »§-• CM O OOCMOCOinO • «- O CM010 •» —• i in —f mot co i egCM •- O) -• CM O IX CM O ^ CO T-i i r - - m i i — r - c o s L .o o - • o o c o S oSO I O CM I ~ ——• o fx —r o o —'O O 03 O a B- - - - ° e.
v v v v —? v s ms « e E-!?•«-
§5 S2 X
3-31

H-u >
EC
.
.213 £u x<0
co co ro i i i i o vn i CM o i o i o i i i i i ito to to \f> to • <o in orx rx rx co co in oCM" o"CM
oooo i oooooomooooooooo-TCMCMCM oooincMcoinaOinoooooo»»--•-• tOlOOCMOCM CMCOCMOOOOinUS
",?"O
o it) — -oocM--rx— •
a
I I« - °
COu
o to i- en -•o o o o
S ft2IIIO u coU
OOOOOOOO I OOOOOCOOOOOOOOOO OOO O)|xi-o 00 O OOTT^- oooo o o in *» -f nm o ^ o s n — n «- -r—• in co —• «—co
o o o o o*P o o So ococs CM co oo «- «- co co co in "I co co mOJCO —• CM • v v —-T-^eorx —- CM <— A CMii i i i i i i i i i i i t i i iQOOOQQQOoQoaoaaooQaaooozzzzzzzzzzzzzzzzzzzzzzz
ou
o o o o o i n - r o ocotflto*r--'~'-m*a'CNcM--(Oinlffcotniflir> CMi i i i i i i i i i i i i i A i i i i iQ Q Q Q D Q Q Q O Q Q O Q O ° Q Q Q Q Q Q Q DZZZZZZZZZZZZZZZZZZZZZZZ
« a 9« I £1 « 8 £ s** ® B ® c a 03 —. cvsiSH.i i i _ _ s s i _ 8. c 111 111! . I l l I!
If.o aZ =>.
3-32

DRAFT
3.3 Subsurface Soil
3.3.1 Chemical Analysis
All 20 onsite samples were analyzed for Fenac. Eighteen onsite samples wereanalyzed for parameters on the HSL
All 15 offsite samples were analyzed for Fenac. Only one offsite sample wasanalyzed for HSL parameters. The remaining 14 samples were analyzed only forthe base/neutral and acid extractable organic fractions.
Analytical results are presented in Tables 3-13, 3-14, and 3-15.
Fenac was detected in onsite samples at concentrations ranging from 180 to 26,000micrograms per kilogram (ug/kg). Fenac was not detected in offsite samplesexcept in the boring soils for monitoring well M14, where the concentrationsranged from not detectable to 2,100 ug/kg.
Inorganics detected onsite include:
• aluminum• antimony• arsenic• barium• beryllium• boron• cadmium• chromium• cobalt• copper• cyanide• iron• lead
3-33
HR300M3

DRAFT
NA - not analyzedVig/kg - Micrograms per kilogrammg/kg - Milligrams per kilogram
TABLE 3-13
SUBSURFACE SOIL INDICATORSDRAKE CHEMICAL SITE
Sample Fenac TOH TOCNo. ________Description________ uq/kq mg/kg mq/kg
SO-32 Boring 14 2-2.5 ft. 180 <100 11,000SO-33 Boring 14 3.5-4 ft. 1,700 <100 17,600SO-68 Castanea Twp. Park - 2ft. <10 NA 73,900
CornfieldSO-70 M11 3-4.5 ft. <10 NA NASO-71 M11 5.5-7 ft. <10 NA NASO-72 M11 9.5-11 ft. <10 NA NASO-74 M12 ' 3-4.5 ft. <10 NA NASO-75 M12 5.5-7 ft. <10 NA NASO-76 M12 9-10.5 ft. <10 NA NASO-91 Ml 3-4.5 ft. 320 NA NASO-92 Ml 6-7.5 ft. 820 NA NASL-93 Ml 9-10.5 ft. 410 NA NASL-94 M1 12-13.5 ft. 330 Na NASO-105 TB-1 9-11 ft. 26,000 NA NASO-106 TB-1 11-13 ft. 5,200 NA NASO-107 TB-1 15-16.5 ft. 6,400 NA NASO-111 M13 3-4.5 ft. <10 NA NASO-112 M13 5.5-7 ft. <10 NA NASO-113 M13 9-10.5 ft. <10 NA NASO-114 M13 15-16.5 ft. <10 NA NA
' SO-117 M14 3-4.5 ft. <10 NA NASO-118 M14 5.5-7 ft. 790 NA NASO-119 M14 9-10.5 ft. 2,100 NA NASO-120 M14 15-16.5 ft. 1,700 NA NASO-125 M7 5-6.5 ft. 11,000 NA NASO-126 M7 10-11.5 ft. 4,200 ' NA NASO-127 M7 15-16.5 ft. 1,100 NA NASO-128 M7 20-21.5 ft. 230 NA NASO-129' M6 5-6.5 ft. 3,300 NA NASO-130 M6 10-11.5 ft. 12,000 NA NASO-131 M6 15-16.5 ft. 16,000 NA NASO-132 M6 20-21.5 ft. 15,000 NA NASO-133 M5 10-11.5 ft. 8,400 NA NASO-134 M5 15-16.5 ft. 16,000 NA NASO-135 M5 20-21.5 ft. 12,000 NA NA
3-34
RR300MU

O O r- in
Oto
I CD0°to
ino —7 AO r-<o
6
CM
?=O 5
(Ooow
^ o^ CM g
f - V c O I X V V V r - V r -
o in _, gS i m °- <=>. m. CM co „ co-. m. CM*»— -if) .mo—-inc£)Ococo^rv^'OO»i"in'eovmm.-v vcoe»'-v^-^--.c)<-v v v^
s P § £,nO CD O * *^C T j v c o c o o v v t -
_° i**.iX u»* •** 3
S in^in '-u,me^t>f's- m.. *:10.inveorxovocriecicMV—•loid'-v v v.-
= in o= in.!!:°U5^S^S2ScMo'«.§'-S
Sco •"S*§°. do0-10. 'TO-o-oco'*. ix!*^e''-din
°-"5.*!to a o"00O C CNtO <D I
g U
3-35

CMP to1"-
to o § rxS S^ WCM§ CM o-"> OCMw. in^dino^'P^rOo"05. o°°. coOO'-'-oCO V CM CO V V v S t O r - V r - t O T O - V V V V CO
co ino in in oin 0 qm to^rx
en •;CM
co in
coCM ml—• rx i
oo 0 qrx o c M § - i n - . m. oe».fO — —f.x~md-;in«jo—.co-f — cooo'- — to^ v S S d v v ^ u J - v ^ u s c o d t b v v v VCM
o CM §
ixinen-cMto
|xCM
0 ,to in
«• ,CM in
o-..co
8'I
I in! S,S o ,t u) to m
1|uull = 5 «
in in oo to as co <N en
en « CM o o«« SS in T"? o "?"".-.-SdindcMoieod-.en.eri^^. ots-;-inf _ ' v _ f - l § V V V . - V t O V M i n « - - ' C M V V V V - -
",2S S i o «!« K *" C ci = _; I l = 0 | | l _ « S.^ls= 9-E.2e-2e:.scp2iiS 1 UsHMisaspsii
3-36

t
co oCM
to in
COS2m_
to to to o
S Cw"*, g 's -
1 * °. ui uj fe; "• C "f f~ ***•Ai5| |,„ 3 m K |, a «o u g5 to Q a. °"
o in in o<a to o 03 CM «— CM m ix -. r- in»^'«K<«int_--««oN.^-*!dod-5«r M V C M C M O V V * - t - - - V O 3 < O C O C M - - V V V V i n
o e:Sin in in o roCM o oo -r CM CM «-• oo -• m — oo 3^T-*5! o'md'^'d" "'d'o'd'-"'
I |o ® 5o in in o oo c M i n O m » - c M f x o'-meo • S i s
C M O * C n ' . —- • • » CM CM • • ' • ®.-• .po .mow -toOooinco .inOOf-cow o "•
3 aro
=
_ e =2 CB =
o v E
3-37

i ?-- *o sco
!toOjjj55
s g*CO °
O <* CO
in Crx CM .I r- IX%* i
I S53^5" os i- I-
r- %u to1
u.tcCO§to
.II€9^ £CO a OI §0O C CM10 O I
I I 1 I I 1 I I I I I I
O> COI I I I i— I I i- I I I I
I I I i Z Z Z Z Z Z Z
I I I i Z Z Z Z Z Z Z Z
I I I i Z Z Z Z Z Z Z Z
, , , , 1 1
z z z z zI I I I Z Z Z Z Z Z Z Z
co coi i I , I i —• i eo 3
£
5
gS | „ 5> I . i 2
S .2 S 5-J3 J3 C Q.
5 o >_ _ 2 wo
O S. S n O I 1C
3-38
RR300U18

?
UJIMU
8;LU
CO i .M,3 to *: ua ea < o< = = <f- to Q a.
I I i i Z Z Z Z Z Z Z Z
CM «^ " fxoi^i<O in
ZZ
tO CO!
I CD o i- 7to in
r- | COI CD VOK'to ^
O H ,to ro
I I I I Z Z Z Z Z Z Z
I I I I I I I I I <— 00 I
i i i I i i i I I i I eg
I I I I 1 I I I I I I
I I I I I I I I I I I CM
to 7CD
«3"a
<D
§ g
"
3-39

§>
LU Eiin Q LU tuSlS|LU 3 m3 to 2 iu_ a < eg< 3 = <r- to a a.
toCM mi—• fx *
o57to o
s -"
o o o oo oCO (O —. 10 <M f ,- r m - f - r — i x i i i i i i
to ih
oCM „. in:I , - , , 1 1 1 1 1 1 1 1
05 C| < < < < < < < <1 i i i Z Z Z Z Z Z Z Z
I i i i Z Z Z Z Z Z Z Z
,to co|
rx -;^ f
o"
^co"?7 = <20^7to m
< < < < < < < <I r- I i Z Z Z Z Z Z Z Z
^ , i i i i i i i i i
aaa1n, i«
3-40

I
LU '
£%_,SiSiS23 U) 2 LUS m < o< = = <i- co O a.
in2m"?
co oCM
I 5 2Oto
CMco in—• co •os7(O o
o 7to in
co m7 f to
to in
CO
ooo ^i i i i i i i i , in tx i
ooC5
rx oi -• , , i I I I i i —• I
og 0I in i i i in i , i i i i
oo
OI I I I I I I I I CO I I
05 »;N -"" 00
O Oin rxI I CO CM I I I I I I I I
co2rxb-7
I r- I I I I I I I I I I C
ax!a •"3 _«
8CO Oo •=
(B = O™ .x o w
otgco I
aa
09•a
° ££3(0O
S 10 ca a co
2 3 a>0)13 1P -, 2 •
o e> = 5>
t O O „o c E oo 3 i Z
3-41

DRAFT
• manganese• mercury• nickel• selenium• thallium C~• tin• vanadium• zinc.
The same parameters were detected in offsite samples except for antimony, boron,thallium, and tin.
Organic compounds detected in onsite subsurface soil samples include:
• benzo(a)pyrene• bis(2-ethylhexyl)phthalate• fluoranthene• benzene• chlorobenzene• toluene• B-BHC• a-endosulfan• endrin
Organic' compounds detected in offsite subsurface soil samples include:
• bis(2-ethylhexyl)phthalate• methylene chloride• acetone• heptachlor
3-42
RR300U22

DRAFT
Lab blanks contained detectable concentrations of methylene chloride, acetone,and heptachlor. The pesticides analysis was validated as "unacceptable" accordingto quality assurance protocol and was hot repeated as it is meaningless.
It appears that Fenac can be used as an indication of subsurface soil contamination.Where Fenac concentrations are elevated, other chemical concentrations areelevated. The opposite also seems to be true, that is, low concentrations of Fenacare accompanied by low concentrations of other chemicals.
tr-
C^
3.3.2 Chemical Transport
Chemicals present in subsurface soils could migrate to the groundwater. This couldhappen by infiltration of precipitation through the soil surface dissolving chemicalsor causing them to be transported by other means. Groundwater could also contactcontaminants causing them to migrate off site.
33.3 Environmental and Health and Safety Concerns
Table 3-16 compares the concentration ranges of metals detected in subsurface soilin the vicinity of the leachate stream with typical concentrations found in theenvironment or in the earth's crust. Values given are averages or concentrationranges.
There are no EPA standards for soil contamination from organic chemicals.Generally, organic compounds are not typically found in soil. Their presencesuggest that industrial and potentially hazardous wastes may have been disposed ofor spilled on the ground over a period of time, possibly to the depths encountered.Another possibility is chemical transport from the ground surface through thesubsurface via surface water infiltration and subsequent transport.
3-43

DRAFT
TABLE 3-16
SUBSURFACE SOIL CONCENTRATION RANGES - METALS (mg/kg)DRAKE CHEMICAL SITE
Drake Chemical Typical ConcentrationParameter Concentration Range In Soil or Earths Crust
Aluminum 650-9,900 88,000 _^Antimony <1-1.8 0.2-0.5 <"'Arsenic 1.5-100 6.0Barium 5.0-113 430Beryllium <0.25-1.5 2-10Boron <5-10.8 2-100Cadmium <0.05-2.0 0.01-0.70Chromium 1.5-61.0 5-3,000Cobalt <2.5-21.9 8.0Copper 4.1-159 2-100Cyanide <0.25-1.0Iron 945-18,700Lead 4.4-90 2-200Manganese 13.8-456 100-4,000Mercury <0.1-2.2 0.01-3.40Nickel 2.2-23.3 40Selenium <0.1-1.2 0.2-0.5Thallium <0.5-1.2 5Tin <1-1.0 6Vanadium < 10-20 100Zinc 15.5-327 50
mg/kg - Milligrams per kilogram< - Less than
3-44

DRAFT
3;4 Surface Soil
3.4.1 Chemical Analysis
The onsite sample from Boring 14 was analyzed for Fenac, TOH, and TOC. Onesample from the boring for monitoring well M1 was analyzed only for Fenac. Theother sample from this same boring was analyzed for the parameters on the HSL /•and Fenac.
All offsite samples were analyzed for Fenac. One offsite sample was analyzed forthe parameters on the HSL Five offsite samples were analyzed only for thebase/neutral and acid extractable organics fraction. Analytical results arepresented in Tables 3-17, 3-18, and 3-19.
Only two samples contained detectable concentrations of Fenac. The onsitesample from the boring for monitoring well Ml contained a Fenac concentrationranging from 6,200 to 6,600 ug/kg. The offsite sample from the boring formonitoring well M14 contained 78 U9/k9 of Fenac.
Only two samples, one on site and one off site, were analyzed for metals. Metalsdetected in surface soil samples include:
• aluminum• arsenic• barium• beryllium• boron• cadmium• chromium• cobalt• copper• iron• lead
3-45

DRAFT
TABLE 3-17
DRAKE CHEMICAL SITESURFACE SOIL INDICATORS
Sample Fenac TOH TOCNo. ________Description________ ug/kg mg/kg mg/kg
SO-31 Boring 14-Surface 78 <100 15,000SO-58 Dry Streambed-Hammermill Paper Co. <10 <100 74,000SO-59 Hammermill Paper Co. <10 <100 22,700SO-60 Hammermill Paper Co. - Ballfield <10 <100 50,600SO-61 Hammermill Paper Co. - Ballfield <10 <100 29,300SO-62 Castanea Twp. Park - Field <10 <100 20,700SO-66 Castanea Twp. Park - Drainage Ditch <10 <100 24,100SO-67 Castanea Twp. Park - Cornfield <10 NA 59,800SO-69 Castanea Twp. Park - Field <10 <100 61,700SO-69 Mil-Surface <10 NA NASO-73 Ml2 - Surface <10 NA NASO-90 Ml - Surface % 6,200 NA NASO-101 M1 - Surface 6,600 NA NASO-110 M13 - Surface <10 NA NASO-115 M14 - Surface <10 NA NASO-116 M14 - Surface <10 NA NA
ug/kg - Micrograms per kilogrammg/kg - Milligrams per kilogramTOH - Total Organic HalogenTOC - Total Organic CarbonNA - Not analyzed
3-46

DRAFT
TABLE 3-18
DRAKE CHEMICAL SITESURFACE SOIL METALS (mg/kg)
SO-67Castanea Twp. SO-90 Typical
Parameter Park Cornfield M1 Concentration
Aluminum 5,480 2,260 88,000Arsenic 10 54 6Barium 90 28.4 430Beryllium 1 0.5 2-10Boron <50 5.9 2-100Cadmium 0.35 0.5 10-700Chromium 10 9.9 5-3,000Cobalt 15 2.8 8Copper 25 42.0 2-100Iron 11,300C 7,400Lead 19 90 2-200Manganese 594 161 100-4,000Mercury 0.2 0.6 0.01-3.4Nickel 20 11.4 40Selenium 0.7 <0.1 0.2-0.5Thallium <0.5 0.65 5Tin NDB 2.1 6Vanadium 20 7.2 100Zinc 96 80.0 50
mg/kg - Milligrams per kilogramC - corrected due to detection in lab blankNDB - not detected due to detection in lab blank
3-47

DRAFT
TABLE 3-19
SURFACE SOILS - ORGANICS (ug/kg) (DRAKE CHEMICAL SITE i
SO-67 SO-69 SO-73 SO-90 SO-110 SO-115 SO-116Castanea Twp.
Parameter Park Cornfield Mil M12 Ml M13 M14 M14
fluoranthene - 3,100 -pyrene - 2,200 - - -2,4,6-trichloro- - - 2,000 -phenol
methylene chloride 433 C NA NA NA NA NAendrin U - NA 20 NA NA NAPCS-1242 U - NA 600 NA NA NA
U - data was unacceptable (meaningless)C - corrected due to detection of parameter in lab blankUg/kg - Micrograms per kilogramNA - Not Analyzed— Not detected
3-48

DRAFT
• manganese» mercury 7• nickel• selenium• thallium• tin• vanadium• zinc.
Organic compounds detected in surface soil samples include:
• fluoranthene• pyrene• 2,4,6-trichlorophenol• methylene chloride• endrin• PCB-1242
The QA validation of some of the pesticide analysis rated it as unacceptable (dataare not within established control limits. The deficiencies imply the results are notmeaningful.
It appears that Fenac can be used as an indication of surface soil contamination.Where Fenac concentrations are elevated, other chemical concentrations are alsoelevated. The opposite also appears to be true.
3.4.2 Chemical Transport
Chemicals present In surface soils could possibly migrate to offsite surface soil,groundwater, and/or surface water. Chemicals could migrate off site to soil orsurface water through erosion and transport by surface water runoff or by theflooding of Bald Eagle Creek. Chemicals could migrate to groundwater bydownward migration via infiltration..
3-49

DRAFT
3.4.3 Environmental and Health and Safety Concerns
Table 3-18 compares the concentration ranges of metals detected in surface soil inthe vicinity of the leachate stream with typical concentrations found in theenvironment or in the earth's crust. The values given are ranges or averages. C 7 "
3.5 Surface Water and Sediment
3.5.1 Surface Water
3.5.1.1 Chemical Analysis
Onsite samples were analyzed for priority pollutants, trichlorophenylacetic acid(Fenac), total organic halogens (TOH), total organic carbon (TOC), sulfate,chloride, pH, and conductivity. Five offsite samples were analyzed for prioritypollutants, Fenac, total dichlorobenzenes, and TOH. The remaining 6 offsitesamples were analyzed for the indicator parameters Fenac, TOH, anddichlorobenzenes. The analytical results of surface water samples are presented inTables 3-20, 3-21, and 3-22.
Fenac was detected in the leachate lagoon and in the canal lagoon atconcentrations ranging from 124 to 855 micrograms per liter (ug/l). Fenac was notdetected in Bald Eagle Creek upstream of the site or at the confluence betweenBald Eagle Creek and the leachate stream. Fenac concentrations in Bald EagleCreek downstream of the site ranged from 0.5 to Q.7
One of three Susquehanna River samples which was taken downstream of itsconfluence with Bald Eagle Creek, contained Fenac at a concentration of 0.9 U9/I-
Inorganics detected in onsite surface water samples include:
• aluminum• arsenic
3-50

DRAFT
TABLE 3-20
SURFACE WATER INDICATORSDRAKE CHEMICAL SITE v
TotalSample Fenac TOH Dichloro-
benzeneNo. _______Description_______ ug/l ug/l us/1
L-03 Leachate Lagoon 855 Q 715 NAL-04 Canal Lagoon 423 Q 430 NAL-06 Leachate Lagoon 124 Q 845 NASW-1001 Station 1 - Upstream Bald Eagle Cr. - 45 NASW-1002 Station 2 - Upstream Bald Eagle Cr. - 10SW-1003A Station 3 - Leachate Stream at 34
Bald Eagle Cr.SW-1003B Station 3 - Leachate Stream at 29
Bald Eagle Cr.SW-1004 Station 4 - Downstream Bald Eagle Cr. 7 42 -SW-1005 Station 5 - Bald Eagle Cr. 4 33 -SW-1006 Station 6 - Bald Eagle Cr. 0.5 42SW-1007 Station 7 - Susquehanna River 0.9 33SW-1008A Station 8 - Susquehanna River - 9.7SW-1008B Station 8 - Susquehanna River 23SW-1009 Station 9 - Susquehanna River 16
ug/l - Micrograms per literQ - Questionable analysisNA - Not Analyzed— Not Detected
3-51

xT01
^ui'
eeB
t 2 ens< "as§ sal
03 _ O
IIIi 5 0153-0
< — •'
lit— o —i 10 co
2 'S <o_ O) »
o o 2 < o o o o 8 < o < o
_oo° O) «7 <S SI
,§18
I a cc-J O *
ceo a o
co to
< S < co
o o o < o o oCM^ — '-Z'"inf~V V V V V V V
0 < C M < C O
o
g o g « - - - - « • - - - . « «v v v v
g • o §in Cn *.- o c o - i o > < o o « - Gi - O O O - O O ^ T J . O - C M C M C MC O C M — t o - > ! ~ i n » - i n e o c o o o o o c M ^
o OO O 00"I £ in rx S m" Oin »— o o - ._ o - - rx co
c_ou
u O• ~«M (DS T3^- Oa,;1 S52 -. e a,
•ao §<£ o
o ^^ o o — —i S & w wj (^ 3.Z O
3-52
RR300U32

- "IO O CD° a>hv « w^ LUC
to 2 §
ca o 2S "5 E!O O) O <8v— Q CO CDI UJ Co i;5-o-'w«-5©m
< o 28s * EO CD U <0_ ffl S 0>I LU CO i;
1 Sio 01 toV « hiJ, UJ Ml
O*—V
I
§
T 03 Oo co
coco
oCO
co i cov v
O <?
co ao J= o^i, u S-J g a1 CM
2 5 £a "~ 15a co co g
mi 5 = to a*= 2 B 5 » 2« - s -2 ao -5,
i? t !!jn co i to oja co -a E E
o>cb 5 e .uillf£osli a o1 ! — C
•r,' '3 O V I
3-53

DRAFT
• barium• cadmium• chloride» chromium• copper
t• cyanide• iron• lead• manganese• sulfate• zinc
Inorganics detected in offsite surface water samples include:
• aluminum• barium• cadmium• iron• manganese• zinc
Field blanks from surface water sampling contained detectable levels of cadmium,cyanide, and zinc.
Organics detected in onsite surface water samples include:
• dl-n-butyl phthalate• methyl chloride• methylene chloride
Organic compounds detected in offsite surface water samples include:
• bis(2-ethylhexyl)phthalate
3-54

•
DRAFT
3,3'-dichlorobenzidinedi-n-butyl phthalate
Field blanks from surface water sampling contained a detectable concentration ofmethylene chloride.
3.5.1.2 Chemical Transport
Chemicals present in the surface water could migrate off site to soil, surfacewater and groundwater. Migration to offsite soil and surface water could occur ifthe onsite lagoons overflowed or discharged to the leachate stream. Flooding ofBald Eagle Creek could also cause contaminants to migrate. Chemicals couldmigrate downward to groundwater since the leachate lagoon is unlined.
3.5.1.3 Environmental and Health and Safety Concerns
Tables 3-23 and 3-24 compare the onsite and offsite concentration ranges ofinorganics and organics with drinking water standards and water quality criteria forhuman health and aquatic life. The values given should be used for comparisonpurposes only.
3.5.2 Sediment
3.5.2.1 Chemical Analysis
Onsite samples were analyzed for priority pollutants and Fenac. Five offsitesamples were analyzed for priority pollutants, Fenac, total dichlorobenzenes, andTOH. The six remaining offsite sediment samples were analyzed for the indicatorparameters Fenac, dichlorobenzene, and TOH. Analytical results appear inTables 3-25, 3-26, and 3-27. As expected, the sediment samples contained morecompounds and higher concentrations than the corresponding surface watersamples.
3-55
&R3QQU3S

tza
9MK
CD°_|
202CO3a-.0)
I
13.
IO§ 55
~o093
•;reCOIc1z
o**
u >*C "*
w, 'xC. O
i o i •- i n (O in i o I i irx coTT in r • • CM •<»•o in co iinO rxiCM O
oo
~lU X<o
l O I C O I O C O C M I O l 1 IO OTT o in o rx ^rrr to CD i T uo a>1 - CM 1 1•". T" R §" g
CMCM
0 g^b = ="no:
t CM 1 1 1 1 1 1 1 1 1 t 1 1 ICM0O
0
"o'xol-
* 'I O I O I C O O O I O I 1 10 0— • + O o in o o
— 'O CM O Oo - - -o «— in inorx
x^£2trSLu LU -a _
|s H|iLU 3 S ™* S *0
_| SQ s
i i i i o i o i o , o i n o o ,o o o in • o o0 O CO CO O OO r * m o min • inCM CO CM
eDto1- >« -S5 n C <5 °§ mi
«l O O O I t O I O I O I I I I 1in o -• + o in
O — CMg
1 CO 1 I
1000en o o
*• •"
co i en CDo — • — •
o
ooooSs
1 1 1 1
1 1 1 1
(-"" fM;V
»-coocoo>-*-<tocr)incoico i ^ to in i i i -r in -• co ii o i - o o o - i i§—• —• co *- in •- in co ~in , tncorxincM
O(Q CO
I f =o IT OOO
o
.. ' IX , , ,CM rx co A ** A A 'o CM T Q Q Q D •-- S a ZZZZV§
COQ.
OO
co a J= -rj= o £ a O
CD
.E §| t5 o gg „ g> £0= !2!5^2J=o5.ogIx = = a<<oaOOOOOirjSea.corxi ja
"3-56

0 >11J= O
to
JU
1 0 1 •-T inooCMO
o
s3
<
m **
t) "X<o
1 O 1 COTT CO
1in
£•asCO
^ ffl CCif "~ u
1 CM 1 1CMooo •
3I
—
'xp
1 O 1 O
i T co in i o i , i rxT • • CM Tm co ,infx
o
i o ro CM i o i i , oo T in o rxCD 1 T in- CM 1 1
O) -• T O, rx coo -•oCMCM
1 1 1 1 1 t 1 1 1 1
.
1 CO O O 1 O 1 1 1 O•f o o in o— O CM Oo •Or- inoo"rx
CO 1 CO 1 1
O 1 O O OT TOOCD O) O O
"
i co i en o>O r- r-
O OO
0 OOOOo o0 0
in Tr- CO
CMICO
?*•sa OJ T3!
lsl! §i o i o i o in o oo o in • o oo co co o oo «- in o" inm • in
£Q
111
I O O O I CD I O I O Ix- CM
o in
.O
I §,.§ O T CO CM *•.CM t- To §5 _. ,_
CM^-»— »— <*— m*— rxr-o<t<tco Q QQQOv v v v Z v v v v v c M Z Z r - Z Z ZZZ
Aluminum
Arsenic
Barium
Cadmium
Chloride
Chromium
Copper
Cyanide
Iron
Lead
Manganese
oI 0
cito rxj
ocjS
1 1
bis(2-ethylhe
phthalate
3,3'-dichlorol
215||
ff
It1 0)3 E
CO
°"TJ -oS is!™ ® CO -—ouCOc_eo.co
o * •=00E c c
til
C
5»2
v
o
co e13 co «
IIIill.. + CO1 * +
3-57
J11QOMI

DRAFT
TABLE 3-25
SEDIMENT INDICATORSDRAKE CHEMICAL SITE
TotalSample Fenac TOH DichlorobenzeneNo. _____Description_____ ug/l ug/l ____ua/l_____
SED-03 Leachate Lagoon 1,040 Q NA 5,580 Q
SED-04 Canal Lagoon - NA 640 Q
SED-06 Leachate Lagoon 1,830 Q NA 4,290 Q
SED-1001 Station 1 - Upstream Bald - - 150 CEagle Creek
SED-1002 Station 2 - Leachate Stream 2,140 <100,000 NDB
SED-1003A Station 3 - Leachate Stream 1,060 <100,000 420 Cat Bald Eagle Creek
SED-1003B Station 3 - Leachate Stream 1,020 < 100,000 270 Cat Bald Eagle Creek
SED-1004 Station 4 - Downstream 35 < 100,000 190 CBald Eagle Creek
SED-1005 Station 5 - Bald Eagle Creek 95 <100,000 140 C
SED-1006 Station 6 - Bald Eagle Creek 8 < 100,000 150 C
SED-1007 Station 7 - Susquehanna River 6 < 100,000 250 C
SED-1008A Station 8 - Susquehanna River 20 < 100,000 100 C
SED-1008B Station 8 - Susquehanna River - < 100,000 250 C
SED-1009 Station 9 - Susquehanna River - <100,000 210 C
yg/l - Micrograms per literQ - questionable analysisNA - not analyzedC - corrected due to detection in lab blankNDB - not detected due to detection in lab blank< Less than— Not detected
3-58

p-
Q 2 0 1
fflto »S « a ii aA « - --2JQ CD V) CO CMLUtO UJ
.O 5 CO C5 O«- o O CO1 m t - £2 • to <o aI«to
22 =O m E
Q 03 «•»LU ffl COto -1
O oO O O COC O O O C M O O O O f x r x e O C M O O
• CO CM • • • - • — O CM • • CO• — T O • • c o e o o r - r x - - i n c o c M r x-• — CO CM — C M C J C O C M T C M O » - — C M C O
OO O COT c o c o m C O O O C M o o, , - - , c M i n - - c o - - c o c o c o • - i n
< C O < • • O 5 < C O O C O - - r x u O T i nZ r - Z c M — C O Z C M T ' C O C O O ' - ' - C n r x
CO
<o2 c!O 10 OI J= o,o u aLUto c-i
o oO O O COc n r x C M T C O c o c o r x c o o o• o c o t - - t o r - - - c o i n o j c o • »o -• in • ' C o c o c n c o T - -o - T C OC N - - - - — — C M t - ' - C M - f C O O — O J ^ L O
o oO O COC O C O C O T C O O r - C O O — C 3
• CN LO 03 • -CM > - ( x i - O C O -CMi n c M c o • • r x e o » - c O ' - c M • o — o —CM — r - m o i n c o c M T r x c D O ' — v c o r x
O O COO T O C M i n c O O C D C O C M C O O OTT ' t O t O • • • - - r x O — • -CO
• C O • ' C M C M T T C M C M - O C O i n r xC O i n r x — O ' - O S C M C M C M O S O ' - C M ' - C M
oQ.
3.
A = a i.P. <? S o.— E« CO
CO S CO ffl OiI J= oQ u aLU a alto ® -j
I
3 l l 5 ^ E § l a , g a 3 ug s =-
3-59
CDa
IItlv

« i
i a h _ ®g o to « a
S_Eslo S to a o
ill7-gSQ <o i:LU CD COCO -1
o o o o o00 TCOCO CM "—CO CO COTCMO CMO CM —c M i r x i n m i i n i V c o i ' - i ' — O M C O I C M T I I I I C M V
o oo ooooo oo 5oo 2 oo— — rx — rxtncoco coco T ". T CM co °. oco— vincocoeococMioo— i i I i CM — CM rx eo — I i iTin
ooo o o o oO CM — T CO — CM CO f-OCM TO O GOTO— — CO O) — I CM I I — I — 1 in CN <O I I CM CM I CM I CM — CM
Oo' oooo o P o co m ooCOTLO m o — eo co co in CM r- CM in
— CM •— I I in CO CO — I I I t CM O5 — 1 r- | V I I T — —
o o __. gl
Si 111;LU COto
o o oOO OO o O o O Oco— — CM tO — — LOT— tO— T— CMv v . - i n i i i — i — i i i i co CM v i ,- v i i oj i v •-
tgcoo co o 5 O O . _. 'O
LU ffl Sco 5 . •
to 2
T _ C!9 10 oI C OD to aUJ o oto -i
co S c
00000050 o~o«x3 _, ao_,ooo_,ooooooo™o o ° o o ° o o o o ^ooeocDOcogin o o co. o co o coTors.corx — T°.cococorxinco^cM i comcotoT I rx i .— «-comevjcococo —
3"
8 o= a o ° aa ° °J3 O CO O OOO OI i i i i i .- i i c o i i n l c o i i i i i rx T i in i ito
Oao aa a oaa aoaaooaoaoo oo-n o 2 o o S o o o o oooaj TcoS in °l o o <-(Hococj)CMOO) —
C O i n c M I T C M ^ I I C O I T C O C O I I I— — COCO — TOJinoj
3-60

-
LU eg >tocS o
-(JJ
2 e: 2 £* o a
o— cov i i i i i i i i i i i i i i rx
o co ato fl,
o 2 co "5 o— O O CQ1 co i: *, 5
22=:O CO cp- J~ ffl
LU 0> CO(O -1 i
to
O CO OI J= oQ o 5LU « co'to » -j
rx rx rx— I I I I I I (N I I I I I I I CN
— T eo oV I I I I I I I I I C M — i i i —
I I I I I I C M I I I I I C O I I C M
T COI I I I I I I CO I I I I I I I CO
aa' ao,O 00
ao
ocn inco10. CMTCO rxoco CM i — — — i I i — v v i co rx i
T C|0 ffl O OQ S o! o ooUJ O ffli ° TOCO _)l I I I I I — I I I I CO — i CO I I
co S cO <0 oa "5 °LU ffl co'to o-J
oooo| owoooog owo rx m — co " ^o —co CM — — — — i I — in to i I C M I i
_ostocoeonS0j=
VTCM^ an
iline
benzyl
alcohol
dibenzofuran
oc2~Sa
2-methylnaph'
3-nitroaniline
ocCD
pentachloroph
phenol
benzole
acid
"5i~ -».
4-methyl
phei
chlorobenzene
CDo czs 5o o
methylene chl
1,1,1-trichloro
acetone
B-BHC
tn
CMTCM1CDUa.
20)2,u1
x?a>3.
= *
S3agn
&§i cr
^A3. a
T3C O"SH2
» z
3-61
.JA iULKIU

DRAFT
Fenac was detected in the leachate lagoon sediment at concentrations rangingfrom 1,040 to 1,830 ug/l- Fenac was not detected in the canal lagoon sediment.The Fenac concentration was 2,140 ug/l in the leachate stream sediment andranged between 1,020 to 1,060 ug/l in sediment at the confluence of Bald EagleCreek and the leachate stream. Downstream Fenac concentrations in sedimentranged from not detectable to 95 ug/l- Fenac was not detected in Bald EagleCreek sediment upstream from the leachate stream.
Analyses for metals in onsite sediment samples were not available for this report.
Metals detected in offsite sediment samples Include:
• aluminum• arsenic• barium• beryllium• cadmium• chromium• cobalt• copper• iron• lead• manganese• mercury• nickel• tin• vanadium• zinc
The field blank from sediment sampling contained detectable concentrations ofiron, lead, and manganese.
3-62

DRAFT
Organic compounds detected in onsite sediment samples include:
acenaphtheneacenaphthyleneanthracenebenzo(a)anthracenebenzo(a)pyrenebenzo(b)fluoranthenebenzo(g,h,i)perylenebis(2-ethylhexyl) phthalatechrysenedibenzo(a,h)anthracene1,2-dichlorobenzene1,3-dichlorobenzene1,4-dichlorobenzenedi-n-butyl phthalate1,2-diphenylhydrazinefluoranthenefluoreneindeno(1,2,3-cd) pyrenenaphthalenenitrobenzeneN-nitrosodiphenyiaminephenanthrenepyrene1,2,4-trichlorobenzeneanilinebenzyl alcoholdibenzofuran2-methylnaphthalene3-nitroanilinebenzoic acid4-methylphenol
3-63

DRAFT
• chlorobenzene• methylene chloride• acetone• B-BHC
Organic compounds detected in offsite sediment samples include:
• acenaphthene• acenaphthylene• anthracene• benzo(a)anthracene• benzo(a)pyrene• benzo(b)fluoranthene• benzo(g,h,i)perylene• benzo(k)fluoranthene• bis(2-ethylhexyl)phthalate• butyl benzyl phthalate• chrysene• dibenzo(a,h)anthracene• 1,2-dichlorobenzene• 1,4-dichlorobenzene• diethyl phthalate• di-n-butyl phthalate• di-n-octyl phthalate• 1,2-diphenylhydrazine• fluoranthene• fluorene• indeno(1,2,3-cd) pyrene• naphthalene• nitrobenzene• N-nitrosodiphenylamine• phenanthrene• pyrene
3-64

DRAFT
• 1,2,4-trichlorobenzene• pentrachlorophenol• phenol• chlorobenzene• methylene chloride• 1,1,1-trichloroethane* PCB-1242
The field blank from sediment sampling contained detectable concentrations of1,2-dichlorobenzene; 1,3-dichlorobenzene; diethyl phthalate; phenanthrene;chlorobenzene; methylene chloride; and acetone.
It appears that Fenac can be used to identify contamination in sediment samples.Where Fenac concentration were elevated, other chemical concentrations wereelevated. The opposite also appears to be true.
An ERT investigation was conducted in 1982 in conjunction with preparation of anExtent of Contamination (EOC) report. The EOC report focused on the leachatelagoon and leachate stream and the degree to which contaminants may havemigrated from the site via the leachate stream. Soils were sampled along sixtransects, perpendicular to the leachate stream, from its source to Bald EagleCreek. Surface water and sediment were sampled at 13 stations within theleachate channel as well as Bald Eagle Creek. All ERT samples were analyzed forFenac. The sediment samples were analyzed for the acid/base/neutral extractablepriority pollutants.
The ERT results indicated that predominant components of the leachate lagoonsediments were Fenac (400-2,830 ug/kg), dichlorobenzene (all isomers 290-1,840ug/kg), nitrobenzene (2,100 ug/kg), phenol (5,100 ug/kg), nitrotoluene (1,100Ug/kg), and dichlorophenol (1,200 ug/kg). The composition of sediment samplestaken over the course of the leachate channel was similar to that of the leachatelagoon. Fenac and dichlorobenzene were considered to typify contaminantdistribution within the leachate channel.
3-65

DRAFT
Fenac was found to be confined almost exclusively to the leachate channel, whilethe distribution of dichlorobenzene more closely reflected the pattern of sedimentdeposition within the channel and adjacent areas.
3.5.2.2 Chemical Transport
Chemicals present in onsite sediments and the leachate stream channel couldmigrate with sediment transport via surface water with subsequent downstreamdeposition. Flooding of the site and adjacent areas could also cause sedimentcontaminants to migrate offsite. Distribution in accord with sedimentation mightbe anticipated as the compounds detected tend to absorb to clays and silts. Duringthe ERT investigation, Fenac exhibited higher concentrations in backwater areaswithin the channel, supporting the conclusion.
3.5.2.3 Environmental and Health and Safety Concerns
Table 3-28 compares onsite and offsite concentration ranges of metals with valuestypically found in soils or in the earth's crust. Values given are averages or ranges.
There are no typical concentrations for organic compounds in sediment.
3.6 Aquatic Survey
3.6.1 Introduction
Bald Eagle Creek originates in a swamp, upstream from Hannah, Centre County,Pennsylvania and flows northeast 73 kilometers (46 miles), through Bald EagleValley to its confluence with the West Branch of the Susquehanna River near LockHaven, Pennsylvania. Agriculture and woodlands dominate land in the Bald Eagledrainage basin. The underlying geology of the drainage basin is complex and highlyvariable due to the geological folds of the Appalachian ridge and valley province.Sandstones, shales, and some limestone of the Upper and Middle Devonian periods
3-66

DRAFT
TABLE 3-28
SEDIMENT CONCENTRATION RANGES - METALS (mg/kg)DRAKE CHEMICAL SITE
Concentration Concentration TypicalParameter Range On Site Range Off Site Concentration
Aluminum ' 8,400-25,800 88,000
Arsenic 5.44-14.0 6.0
Barium 73-182 430
Beryllium 1.62-5.59 2-10
Cadmium 0.65-1.58 10-700
Chromium 12.8-57.8 5-3,000
Cobalt 38-185 8
Copper 24.9-268 2-100
Iron 21,700-43,100
Lead 22.2-71.6 2-200
Manganese 627-9,600 100-4,000
Mercury 0.033-0.536 0.01-3.4
Nickel 100-178 40
Tin 9.8-26 6
Vanadium 15-94 100
Zinc 273-755 50
mg/kg - Milligrams per kilogram
3-67

DRAFT
result in soft, moderately fertile water which becomes increasingly fertiledownstream (Pennsylvania Fish Commission, unpublished data 1983).
Numerous tributaries enter Bald Eagle Creek along its nearly linear course, thelargest being Beech Creek from the north and Spring and Fishing Creeks from thesouth. Approximately 30 miles downstream from its origin, Bald Eagte Creek isimpounded forming Blanchard Reservoir. Water quality standards of theCommonwealth of Pennsylvania classify Bald Eagle Creek into three water usecategories. From its origin to Laurel Run the creek is designated as a cold waterfishery, and is thereby protected for the maintenance and/or propagation of fishand associated flora and fauna indigenous to a cold water habitat (PADER, 1979).From Laurel Run to Nittany Creek, which enters the Blanchard Reservoir, stockedtrout are maintained from February 15 to July 31, and the creek is to bemaintained as such. The remaining stretch of Bald Eagle Creek, from NittanyCreek to the mouth, including the areas sampled for the present study, isdesignated as protected for warm water fish and additional flora and faunaindigenous to a warm water habitat (PADER, 1979).
Previous water quality monitoring and aquatic surveys of the Bald Eagle Creekwatershed have been conducted by private and governmental agencies. A summaryof this information is presented to provide baseline data, help characterize theenvironmental status of the Creek, and to identify historic sources of chemicalcontamination and/or habitat degradation.
The Bureau of Water Quality Management (BWQM) of the Pennsylvania Departmentof Environmental Resources (PADER) has performed a number of statewide surveyswhich have included samplings within the Bald Eagle Creek watershed. Thedrainage is included in Region 6 of the Comprehensive Water Quality ManagementProgram (COWAMP), an area including fourteen (14) counties in centralPennsylvania. The region contains numerous rivers and streams, totallingapproximately 3,403 stream miles. Water quality within the region is generallygood by Pennsylvania Water Quality Standards, with about 84 percent of the streammiles meeting these standards (PADER, 1982). The remaining stream miles exhibit
3-68

ii
DRAFT
chronic or intermittent water quality problems, primarily from acid mine drainagefrom abandoned mines but also from agricultural runoff and domestic sewage.
A summary of water quality sampling results for Bald Eagle Creek and two (2) ofits tributaries (Spring Creek and Fishing Creek) is presented in Table 3-29. Theupper reaches of Bald Eagle Creek appear to have maintained good water qualitywith the exception of some organic enrichment due to agricultural and sewagedischarges (PADER, 1974). However, downstream conditions deteriorate due to theinput of industrial as well as domestic waste. Styrene and oil spills occurred inFishing Creek in 1979 and 1980 respectively (PADER, 1982). In 1980, Spring Creekwas discovered to contain the chemicals Kepone and Mirex due to leaching fromwaste areas. These chemicals were found to occur in fish flesh samples inconcentrations high enough to cause the banning of fishing (W. Parsons, BWQM,Personal communication). Corrective action has been initiated, however, leachingof these chemicals into Spring Creek continues. Although no longer constituting amajor impact, a discharge from the Hammermill Paper Company until 1978 causeddramatic reductions in the water quality of the lower Bald Eagle Creek, dueprimarily to organic enrichment and high biological oxygen demand (BOD) (Instituteof Paper Chemistry, 1979).
In 1976, flesh tissue from fish collected approximately 1.5 miles upstream from themouth of Bald Eagle Creek was sampled for PCBs and eleven (11) heavy metals.The results are also presented in Table 3-29. PCBs were found in a sample of sixpredator fish at a concentration of 0.08 ug/kg wet weight, which is far below theFDA "action level" of 5 ug/kg. In a sample of five bottom feeders, no detectablelevels were found (Breznia, 1977). These flesh tissue samples contained nine of theeleven metals at low concentrations. Levels were below the established tolerancelimits for edible fish flesh set by the U.S. FDA and/or Canadian Food and DrugDirectorate (Brezina and Arnold, 1977).
3-69

LL<Ka
o<zLL
IIo) eCM UJ
CO
51?£ LU
Po
c T inCD N "> CO
2 « § - LO —
1 3 I I o co 2.21 5 <D (/) . *
e l l * * - ~
1 I I i s g os - »
i- C " — CD O-
l i t ; ' ° °< •£ — CD E.- c o = a rx -•O)0 — 13 O, _? — O CM
S 1 § S g 5 z d c i= ' I ' « § »I S 1 I f a * I S 8m a> ° "° .£ 2 .* 2 _• m1 E o. > oo
E — =
^ ^ T i ^ o - ^ w S ' ^ r ^^ vw « ^ •"•= -- .r § o .*<D o> _c « 2 CD .£ 2 .22 i <3 *"^
tfl - O 5 0) *- (Q CO CO
W ft_ O £_ *•* S-' 3 ®« K w a - § w S g «£ t o _ i ^ ™ ® *""* — £ — toa _ c - o ^ jj9 H= h- o
"wz —,£: C-E £^ LZs" ^®_* ^*g is o> *£. -O > Q ® 3 C ® C » ^ . J 2 . S — W - .
5?i T CM CM !> rx.co -2 ES « 35 2 CQ,I £ • " . " . • " , - °"."" (E c£ oe of ™ e 'x'
S i i 3 1 ll =Q. a. a. Q. m m < CMS o»___ jg
I "T T J2. Prx rx Jo •>i T rx<a cot?5 O)
E Eeo to-. *t ^ ^ _. q) _-i 3)(P Q) Q} <D O (D *-£ £ £ £ £« £go — • o — o -T o -? o §•£• o 2( ® 2u 2 2«= « «,O>__ O5 C35— CD— O5CDO O5CDOco = ra m CD C caC <e=p cs^eUJ O LU^ LU O LU O L U C C L U C C
2-5 ^ g 2-S 2 .£ ^inE 2mEiSS IS tSS SB Sd^ tnd.2
3-70

toacSa!
4- ——e "S e •§•O CD _. O , ~^
>- C O E *r « —__. S co-2ra S"°^® ~aj^u. *-CD O)WO i:-.Q.yo ^3 «
O^ C.** O « C 1-1 tfl CO m <D ™ *QQ> ii 3 C^ OS? ^ W y 3 *-
ill l! Pi i J—— _>» __» »•» W tW
O r » — > <D r- _ _
S Ii ° " log S'i-2 " «E 5-IP ilj III «f=l.! I i --•a=*o -C ' •_• O «o 2 W a> 3ffl'23c8tD CD -nB m *^ £ *" O j_ "O .Q § w 3 O) 3
III 1*1 all 15»Is1 i i 1c _ eo P ..- £ eo .-: P "S S co J2 j= T? —g»=2"ilffl CD fe
inc
? I o Q"N I" E * .^E^ra-co 5 >.C t o TJ S *""* "— "•^ O «J ri m >-> -_ *-•
ca
» £ « ^>-0 3"S-Dr£ S*CQOSO 3 |= WHi l!i If!! Hill ! . 12'Sc '§:='° o™e S S 0 ' ® c a a ^>"3.H f f l m W 'RIBx,D) »a)C?™?2 = tS -x!:•! =§1 -If5 octll^ 1 5£ soo)5. 'oE> SSffl1— '"•— 05""' S o2 _"Ov. ijiu ^^•nj: 2 J: 2 o — * E m* ^°
ill ii! |!i{ j!i!jj i i!!|||e IllSli | gl |
T T CO T CM CNrx. • rx as rx co co_ O3 05 ~ O5 O5 O5O5 —- r>- r~ —* »-
« s? of c - of of of— • UJ LU O LU LU LUO 9 9 " 999i C* 2£ g S 2
T Trx rx2 o _ en o, co . rx coQ m QQ O5 O5CO *~ CD *~ *~05 05
CD
! 1 | II!0 ) 0 O 0 0 0[So O) CS OS O)c e 5 5 5S ex ex jg j» .!2CD t/3 tO u. u. u_
~3-7TIi
RR300U51

DRAFT
3.6.2 Physical Water Parameters ;
Temperature, dissolved oxygen, pH, and conductivity measurements for each of thenine stations are presented in Table 3-30. Temperatures ranged from 14.0°C(Station 1008) to 17.6°C (Stations 1001 and 1003), expected values for shallowstreams during this season. Dissolved oxygen was high at all stations ranging from7.8 mg/l to 12.8 mg/l based upon the solubility of oxygen at th'e recordedtemperatures. The percent saturation ranged from 82 percent to 90 percent forthe Bald Eagle Creek stations. Stations 1008 and 1009 on the Susquehanna Riverexhibited supersaturation levels of oxygen of 101 percent and 128 percent,respectively. High oxygen values would be expected in cool water of shallowstreams with numerous riffles to provide aeration. Also, as oxygen measurementswere taken during daylight hours, photosynthetic oxygen contributed to thesevalues. The pH of Bald Eagle Creek was consistently that of a weak base withvalues of 7.8 to 8.0. However, at station 1008 of the Susquehanna River, pH was3.8. This highly acidic water was most likely due to acid mine drainage whicheffects much of the Susquehanna River in this region. The effects of this acidicwater on the aquatic life were very noticable with normal stream flora and faunareduced in abundance and supplanted with acidiophilic forms. At the confluence ofBald Eagle Creek and the Susquehanna River the mixing of these basic and acidicwaters produced a distinctly visible reaction which produced floccuiant material atthe interface zone. Complete mixing was not achieved for several stream milesand at the downstream Susquehanna River station (1009) which was located nearthe shoreline continguous with Bald Eagle Creek. The pH was reduced only slightlyto a neutral (7.0) state.
Conductivity values were within the range expected for Bald Eagle Creek and thelower Susquehanna River station (340 to 420 mhos/cm). However, reflecting theacidic state of the upper Susquehanna River station, conductivity increased to 580Umhos/cm. With the exception of Station 1008 on the Susquehanna River, allmeasured physical parameters were within expected ranges and indicate favorableconditions for stream flora and fauna.
3-72
fcR300 52

t<tro
OS
' I*u z3 ZQ <
pO COZ 3< tn _. i_22 CD3^ S m
° Z* M* **P UJ m t- CO« »S0a *o££ <M J dM*H Hi898
(O <o m* t/f|i& — e
LU S
_j <
2
|| S g 8 |c E0 §o •=
II O O O) COQ j . . . .
cc5CO S CM 10 CM COU SZ CO O3 O) 00ffl '0. 03co
T.Ico g-2 — co co r CMo c • • •tO CD r*. O) CO CO.2 aa >S
o0
-. 2® 2 «> M <° **co g • • • •
i
cO «~ CM CO ^>^ _ O O O Oa o o o o5) - - - -
3-73
§ 0 0 0 0o m co ^rT t CO IO P)
CO O) CO CO O
CO O O —• COCO O) O) O CM
r- t->
m m a> *t aoCO CO CO O CM
r- r-
CM fs t*. O CMrx LO in W to
LO co px. eo 050 0 O 0 O0 0 O O 0
—— -

DRAFTr-
3.6.3 Rsh &t\t<. -
3.6.3.1 Fish Collection •"-
A total of 16 species of fish representing 7 families was collected or observed atthe Bald Eagle Creek and Susquehanna River stations (Table 3-31). The speciescomposition indicates a warm water fishery which is consistent with thePennsylvania stream classification for the lower reaches of these streams (PADER,1979). Sunfish (bass, crappie, rock bass, bluegill) were the most abundant predatoryfish, foraging on a base of minnows, darters, and benthic macroinvertebrates.Bottom feeders included carp, white suckers, and catfish. Although not collected,one brown trout was observed in the vicinity of Station 1003.
Table 3-32 presents the results of fish collections at each station and the totalweight and length range for each species. Stations 1002 and 1006 werequalitatively sampled by kick seine only. With the exception of Station 1008,where acidic waters occurred and both diversity and abundance were reduced, fishcollections were comparable between stations. Generally, the species presentindicate moderate to good water quality; however, due to the fish's mobility andability to rapidly recolonize areas, the present fish community may not berepresentative of past stream conditions.
3.6.3.2 Tissue Analysis
Thirty-six (36) fish specimens were examined for chemical residue (Table 3-33).These fish included both predatory fish and bottom feeders ranging in age from 2 to5 years! Tissue samples were analyzed for the herbicide Fenac. Ten milliliterextracts of the tissue were prepared and analyzed. The detection limit for thisanalysis was 12 ug/kg. No detectable levels of Fenac were detected in any fishflesh sample.
3.6.4 Benthic Macroinvertebrates
Tables 3-34 and 3-35 present a summary of the total (all sampling stationscombined) macroinvertebrates collected and their relative abudances (expressed as
3-74

DRAFT
TABLE 3-31 -'(—
SCIENTIFIC AND COMMON NAMES OF FISH .'COLLECTED FROM BALD EAGLE CREEK AND THE SUSQUEHANNA RIVER
OCTOBER 10-13, 1983
Scientific Name___ ___Common Name
Esocidae PikeEsox niger Chain Pickerel
Cyprinidae Minnows/CarpCyprinus carpio Common CarpNocomis micropogon River ChubPimephales notatus Bluntnose MinnowSemotilus corporalis Fall Fish
Catostomidae SuckersCatostomus commersoni White Sucker
Ictaluridae Freshwater CatfishIctalurus nebulosus Brown BullheadNoturus flavus Stonecat
Centrachidae SunfishAmbloplites rupestris Rock BassLepomis SunfishLepomis macrochirus BluegillMicropterus dolomieui Smallmouth BassPomoxis nigromaculatus Black Crappie
Salmonidae Trout*Salmo trutta Brown Trout
Percidae PerchEtheostoma olmstedi Tessalated DarterEtheostoma zonale Banded DarterPercina peltata Shield Darter
*Observed, not collected
3-75
AB300U55

DRAFT
TABLE 3-32
NUMBER AND WEIGHT OF FISH SPECIES COLLECTED FROMBALD EAGLE CREEK AND THE SUSQUEHANNA RIVER (
OCTOBER 10-13, 1983
Station Species Total No. Total Wt. (gm) Length Range (mm)
1001 Chain Pickerel 1 30.0 163Common Carp 2 2,390.0 406-457River Chub 1 30.0 135Brown Bullhead 1 215.00 264Rock Bass 6 520.0 142-189Bluegill 1 15.0 82Black Crappie 10 545.0 122-177
1002* Tessalated Darter 2 2.6 47-55Banded Darter 5 7.7 33-57
1003 White Sucker 1 735.0 385Bluegill 1 • 15.0 77Black Crappie 3 185.0 155-181Tessalated Darter 3 2.1 36-41Banded Darter 1 0.9 41
1004 Common Carp 2 2,435.0 420-480River Chub 1 27.9 130Fall Fish 1 120.0 229White Sucker 1 980.0 443Rock Bass 2 140.0 140-153Sunfish sp. 2 83.5 110-138Tessalated Darter 1 1.2 50Shield Darter 1 6.6 82
1006* ' Stonecat 1 11.9 103Tessalated Darter 3 3.5 37-55Banded Darter 1 2.8 59
1007 Bluntnose Minnow 1 4.7 75Rock Bass 1 110.0 169Bluegill 2 33.7 83-104Smallmouth Bass 3 173.8 57-209Black Crappie 2 80.0 142-147
1008 Rock Bass 3 275.0 145-178
Total 66 9,182.9
*Fish sampled with kick seine only.3-76

DRAFT
TABLE 3-33
LENGTH, WEIGHT, AND AGE OF FISH COLLECTED FOR TISSUE ANALYSISOCTOBER 10-13, 1983
Station Species ___ Length (mm) Weight (g) Age (yrs)
1001 Carp 457 1,310 5Carp 406 1,080 4Rock Bass 189 130 4Rock Bass 185 125 4Rock Bass 160 80 4Rock Bass 147 60 4Rock Bass 145 65 4Rock Bass 142 60 3Black Crappie 177 75 3Black Crappie 173 60 3Black Crappie 172 65 2Black Crappie 169 65 2Black Crappie 164 55 2Black Crappie 163 60 2Black Crappie 157 60 2Black Crappie 142 40 2Black Crappie 141 40 2Black Crappie 122 25 2
1003 White Sucker 385 735 3Black Crappie 155 50 2Black Crappie 181 75 3Black Crappie 161 60 2
1004 Carp 420 1,145 4Carp 448 1,290 5White Sucker . 443 980 5Rock Bass 140 70 3Rock Bass 153 70 3Fall Fish 229 120 3
1007 Smallmouth Bass 142 50 2Smallmouth bass 209 120 3Rock Bass 169 110 4Black Crappie 147 40 2
, Black Crappie 142 40 2i
1008 Rock Bass 145 60 3i Rock Bass 159 90 4i Rock Bass 178 125 4
3-77
ftR3001*57

DRAFT
TABLE 3-34
INVERTEBRATE TAXA COLLECTED FROM BALD EAGLECREEK AND THE SUSQUEHANNA RIVER IN THEVICINITY OF LOCK HAVEN, PENNSYLVANIA
OCTOBER 11-13, 1983
Phylum: NemertineaProstoma graecense (Bohmig)
Phylum: Nematoda
Phylum: Annelida
Class: PoJychaeta
Order: SabellidaSabellidae
Manyunkia speciosa Leidy 1858
Class: Clitellata
Subclass: Oligochaeta
Order: HaplotaxidaEnchytraeidaeNaididae
Chaetogaster von BaerNais bretscheri (Michaelson, 1899)Nais communis Piguet 1906Nais variabilis Piguet 1906Pristine Ehrenberg
TubificidaePeloscolexImmature tubificidae without capilliforms
Phylum: Molluscs
Class: Gastropoda
Order: BasommatophoraAncylidae
Ferrissia rivularls (Say, 1817)
Phylum: Arthropods
Class: Malacostraca
Order: IsopodaAsellidae
Asellus Geoffrey St. Hillaire
3-78

DRAFT
TABLE 3-34INVERTEBRATE TAXA COLLECTED FROM BALD EAGLECREEK AND THE SUSQUEHANNA RIVER IN THEVICINITY OF LOCK HAVEN, PENNSYLVANIAPAGE TWO
C
Class: Insecta
Order: EphemeropteraSiphlonuridae
Isonychia EatonBaetidae
Baetis brunneicolor McDunnough 1925Baetis tricaudatus Dobbs 1923Pseudocloeon KlapalekStenacron JensenStenonema TraverStenonema ithaca (Clemens & Leonard, 1924)Stenonema mediopunctatum (McDonnough, 1926)Stenonema modestum (Banks, 1910)Stenonema pulchellum (McDonnough, 1926)
EphemerellidaeSerratella serratoides (McDonnough, 1930)
CaenidaeCaenis Stephens
EphemeridaeEphemera Linnaeus
Order: OdonataSuborder: Anisoptera
LibellulidaeSympetrum Newman
Suborder: ZygopteraCoenagrionidae
Ischura CharpentierOrder: Hemiptera
CorixidaeOrder: Megaloptera
SiaiidaeSialis Latreille
CorydalidaeCorydalus cornutus (Linnaeus, 1758)
Order: ColeopteraElmidae
Ancvronvx variegata (Germar, 1824)Optioservus ampliatus (Fall, 1925)Optioservus fastiditus (LeConte, 1850)Optioservus trivittatus (Brown, 1930)Stenelmis Dufour
3-79

DRAFT
TABLE 3-34INVERTEBRATE TAXA COLLECTED FROM BALD EAGLECREEK AND THE SUSQUEHANNA RIVER IN THEVICINITY OF LOCK HAVEN, PENNSYLVANIAPAGE THREE
Order: TrichopteraPsychomyiidae
Psychomvia flavida Hagen, 1861Polycentropodidae
Neureclipsis McLachlanHydropsychidae
Cheumatopsvche WallengrenHvdropsvche hageni Banks, 1905Hydropsvche sp IIHvdropsvche bifida group
HydroptiiidaeHydroptila delineata Morton, 1905Leucotrichia pictipes (Banks, 1911)
SericostomatidaeAgarodes Banks, 1899
Order: DipteraSimuliidae
Simullum vittatum (Zetterstedt, 1838)Tipulidae
Antocha OstensackenChironomidaeTanypodinae
Pentaneura PhillippiOrthocladiinae
Brillia KiefferCardiocladius KiefferCricotopus WulpCricotopus bicinctus (Meigen 1818)Cricotopus intersectus gr.Cricotopus svlvestris gr.Cricotopus trifascia gr.Eukjefferiella ThieremannEukiefferiella bavarica gr.Eukiefferiella discoloripes gr.Eukiefferiella pseudomontana gr.Eukiefferiella potthasi gr.Nanocladius KiefferOrthocladius Wulp
3-80

DRAFT
TABLE 3-34INVERTEBRATE TAXA COLLECTED FROM BALD EAGLECREEK AND THE SUSQUEHANNA RIVER IN THEVICINITY OF LOCK HAVEN, PENNSYLVANIAPAGE FOUR
ChironominiCryptochironomus KiefferDicrotendipes neomodestus Malloch 1915Microtendipes KiefferPolypedilum KiefferStenochironomus Kieffer
TanytarsiniCladotanytarsus KiefferRheotanytarsus BauseTanytarsus coffmani Roback 1975Tanytarsus glabrescens gr.Tanytarsus guerlus gr.
CeratopogonidaeRhagionidae
Atherix variegata Walker 1848
3-81

DRAFT
TABLE 3-35
NUMBERS AND PERCENT COMPOSITION OFBENTHIC MACROINVERTEBRATES
Total % ofTaxa_______ Number Total
3-82
Prostoma graecense 318 1.68NEMATODA 19 .0.10PLANARIDAE 17 0.09Manyunkia speciosa 39 0.21LUMBRICULIDAE 7 0.04ENCHYTRAEIDAE 15 0.08Chaetogaster 2 0.01Nais bretscheri 382 2.02Nais communis 57 0.30Nais variabalis 8 0.04Pristina 13 0.07Peloscolex 13 0.07immature tub, w/o cap. 5 0.03GASTROPODA 54 0.29Ferrissia rivularis 219 1.16Asellus 8 0.04Isonvchia 71 0.37Baetis brunneicolor 19 0.10Baetis tricaudatus 1 0.01Pseudocloeon 87 0.46Stenacron 2 0.01Stenonema 5 0.03Stenonema mediopunctatum 43 0.23Stenonema modestum 25 0.13Stenonema pulchella 12 0.06Serratella serratoides 3 0.02Caenis 233 1.23Ephemera 1 0.01Svmpetrum 1 0.01Ischnura 4 0.02CORIXIDAE . . 1 0.01Corvdalus cornutus 18 0.10Sialis 2 0.01Ancvronyx variegata 1 0.01Optioservus 50 0.26Optioservus amplus 1 0.01Optioservus fastidius 1 0.01Optioservus trivittatus 1 0.01Stenelmis 7 0.04

DRAFT
TABLE 3-35NUMBERS AND PERCENT COMPOSITION OFBENTHIC MACROINVERTEBRATESPAGE TWO
Total % of_______Taxa_______ Number Total
Psychomyia flacida 3 0.02Neureclipsis 33 0.17Cheumatopsyche 9816 51.82Hvdropsvche hageni 788 4.16Hvdropsvche sp II 530 2.80Svmphitopsyche bifida grp 3919 20.69Hydroptiia delineata 139 0.73Leucotrichia pictipes 3 0.02Nectopsyche 4 0.02Oecetis 3 0.02Agarodes 2 0.01Simulium vittatum 141 0.74Antocha 128 0.68pentaneura 5 0.03Brillia 1 0.01Cardiocladius . 33 0.17Cricoptopus bicinctus 3 0.02Cricotopus trifascia grp 292 1.54Cricotopus sylvestris grp 4 0.02Cricotopus 314 1.66Eukiefferiella bavarica grp 5 0.03Eukiefferiella discoloripes grp 186 0.98Eukiefferieila pseudomontana grp 4 0.02Eukieffereilla potthasti grp 124 0.65Naocladius 1 0.01Orthocladius 2 0.01Cryptochironomus 10 0.05Dicrotendipes neomodestus 23, 0.12Microtendipes 107 0.56Polypedilum 153 0.81Stenochironomus 3 0.02Cladotanytarsus 26 0.14Rheotanvtarsus 74 0.39Tanvtarsus coffmanl 14 0.07Tanytarsus glabrescens grp 109 0.58Tanvtarsus guerlus grp 135 0.71CERATOPOGONIDAE 4 0.02Atherix variegata ___36 0.19
TOTAL 18942 100.00
3-83

DRAFT
the percent each taxa represents the total number of invertebrates). A total of18,806 individuals representing 77 taxa distributed among the following groupswere collected: Diptera (27), Trichoptera (11), Coleoptera (6), Megaloptera (2),Hemiptera (1), Odonata (2), Ephemeroptera (12), Crustacea (1), Mollusca (2),Oligochaeta (9), Polychaeta (1), Turbellaria (1), Nematoda (1). Themacroinvertebrate taxa and distributions collected during this survey were similarto those reported in studies completed by the Institute of Paper Chemistry (IPC) in1974 and 1978.
Percent similarity analysis (PSc) indicate that samples taken in Bald Eagle Creekexcept for Station 1003 have a moderate to high degree of similarity (PSc rangingfrom 62.4 between Stations 1006N and 1002N to 91.65 between Stations 1004N and1001N (Table 3-36). Taxa present at Station 1003 are similar to those observed atother stations in Bald Eagle Creek, however, differences exist in their relativeabundance (Table 3-37). This results in less similarity between Station 1003 andother stations sampled. Stations 1002, 1001, 1004, and 1006 are dominated by theTrichopteran Cheumatophysche. Cheumatophysche generally account for morethan 50 percent of the total number of organisms collected at these stations. Thedominance of Cheumatopsyche is reflected in the relatively high redundancy values(r>0.50) calculated for these stations (Table 3-38). Many species of the genus,Cheumatopsvche, are known to be tolerant of organic enrichment.
It is well established that the distribution of benthic macroinvertebrates is, in part,dependent on abiotic factors. Physical characteristics at Station 1003 differ fromthose encountered at other Bald Eagle Creek sample stations. Water is deeper,currents slower, and the substrate softer and more varied at this station resultingin a somewhat different aquatic habitat. Station 1003 does not support as dense apopulation of Cheumatopsvche as other stations. Cheumatopsyche, whilenumerically important at this station, is codominant with the Gastropod Ferrissiarivularis and the Ephemeropteran Caenis on the north side of Station 1003. Caenisand the Naidid Nais are the codominant taxa at this station on the south side of thecreek.
3-84

5 co
o
« EH£LU CC Z W
I s«2
U CO£aB. UJH
o o en oo • «— to o • T r- as LO eno • - » • • • • • •r- OO CO O ^ 00 PX. r- px. px, *— CM CO tNpx, to to PX. L O C O rx. LO
r x . c j ) u 3 - - f O i 4 n - - c N C y J O m L O ' — O C N C OO C O t O C N L O L O C O « - . r x O C N ' - C N ^ T « -t r > ' v r - - r x . x O c o t x - j - — • m - c o c o o ot o c o c n e o c N « C O O O C O L O O
< £g- OCO o
EtryjCO >fl. S 2~0 oo2g §3^2Sso
O « - L O L O C O
L O P X . O O C N
z F ^uj B So
D W5O CN3 • o<f O
CMOo
L O t - < — ' 3 - c D c o r x . r x . c O ' —L O < — c s i o o ' s r e O L O O j c M r x .
O ) f O L O U 3 L O O C N C \ I O O 3 a ir x . L O . -- -. o ^t «- »- o> 05o . . . . . . . . .f O C O - x T O I ^ t ' J - C O O M ' - C OL O C M . C M C S I C N J C M C N r -
c o c oc o c o
o o c N C M C O L n c o o c n r xP x . P O O 5 f > x - - ^ c v ) C D C »t o t e t o c N c o t o c o c o c o
t - . p x . C O ' v t ' - C O P x - - L O t O t r ! C N t O r - O ) C Oc o c o o c o t o o o - " • e o c o c n t ^ . r x . o- } . . . . . . .r x . C O t - L O O c n — ' C M t O ' - C O C N O ' - ' —c o c o r x . T j - x r c o p x . t o LO —• -•
. .§ 0 0 . 0 0 0 0 0 0 0 0 0 0 0 0 0o o o o o o o o o o o o o o o
3-85

09UJ
zrxoo
C O O 5 L O C O O 5 » — C Q L O O O C O O O ' 3 ? ' O « —O l O C M O O O 5 p x . t — p x . . . < — . . - 0 0• o o - L o o m•— 00 O »- OO CM O O O«— OO
Px.
e n o r r c n e n co CM to CM en «— LO o LO »- op x . c o e o o c n o M T O j c N p x , r x . p x . - c o mor - ^ T C S I l O " — • v t O C S J - ' O C M P x , 0 0 0 0T- i— «- Px.
p x o c s c n r - c n c M L O o c n o N i a L O e o
c n p x . c o o ' — L O ' - e n c v j c n - x T • L Oo •C N C M i — O M O C M C O C N O O O O O
CM r-
C M O P X . - - C N c o t M c n L O c n t ot O L O p x . p x . - q ' o O ' — — ' e o p x c Mt o c M O « - c n o o i - o o « -
LO
in
E$I £EC O$ 2
175£2"""" — CO OM LO CO LO
e O t O O M L O O - x T O - x T O L Or - C O C M t ^ - ' - L O P x . ^ t OL O P X . L O L O O M m • in in co co
{2i ^ii ' §^ca>5> LUt 5 to zCC Uv "» ^
SSg i119 '
p x . o o « - - - c o r x . - C M L o- f . . . . . . - f .c o c n o o o f t N ' - p x . o c oc o p x - e o c N o o e o en to
L O O J f O O i n < - 0 1 0 O « - O 3 < — L O « - C M O M» - C » t - p x . - - e \ l r - p CM O CO CM p CM
C M C Q t - • c M O O - - f « — O -t O O -• «-c o t o c o o o c M c o c o p x . en coo
H W R 5. m Z C O Z C O Z C O Z C O Z C O C O Z C O Z Z C OaJOW — j" c M ( M « - - - o o c O f i - — • c o t o p x . p x . e o e o r o c nCOQ:—I2U o o o o o o o o o o o o o o o o<UJ<<< O O O O O O O O O O O O O O O OI— Q. O CO 0. I - i - - - r - t - r - . - - - r - - - - - - - r - i - - - - -
3-86

DRAFT
TABLE 3-37
NUMBERS AND PERCENT COMPOSITION OFBENTHIC MACROINVERTEBRATES, BY STATION.
COLLECTED FROM BALD EAGLE CREEK AND SUSQUEHANNA RIVEROCTOBER 11-12, 1983
Date 10/12/83Station 1002Replicate ____ N ____
___ % N
Prostoma graecense 20 1.38 14NEMATODA 15 1.04PLANARIDAE - - 4 0.18Manvunkia speciosa - - 18 0.82LUMBRICULIDAE • _ . _ _ -ENCHYTRAEIDAE - - 1 0.05Chaetogaster -Nais bretscheri 77 5.31 12 0.55Nais communis - - 4 0.18Nais variabalis -Pristina -Peloscolex - - 9 0.41imm. tub, w/o cap -GASTROPODA . -Ferrissia rivularis 8 0.55Asellus - - 1 0.05Isonvchia - - 13 0.59Baetis brunneicolor 14 0.64Baetis tricaudatus -Pseudocloeon 9 0.62 23 1.05Stenacron -Stenonema -Stenonema mediopunctatum - - 12 0.55Stenonema modestum - - 3 0.14Stenonema pulchella 1 0.07 4 0.18Serratella serratoides - - 1 0.05Caenis - - 1 0.05Ephemera -Svmpetrum -Ischnura -CORIXIDAE - - 1 0.05Corydalus cornutus 2 0.14Sialis - - 1 0.05Ancvronvx variegata - - 1 0.05Optioservus 11 0.76 .8 0.37Optioservus amplus -Optioservus fastidius -Optioservus trivittatus -Stenelmis 4 0.28Psvchomyia flavida -
3-87

DRAFT
TABLE 3-37NUMBERS AND PERCENT COMPOSITION OFBENTHIC MACROINVERTEBRATES, BY STATION,COLLECTED FROM BALD EAGLE CREEK AND SUSQUEHANNA RIVEROCTOBER 11-12, 1983PAGE TWO
Date 10/12/83Station 1002Replicate ____N_________
# % # %
Psvchomvia flavida -Neureclipsis 1 0.07 8 0.37Cheumatopsvche 644 44.44 917 41.97Hvdropsvche hageni 12 0.83 62 2.84Hvdropsvche sp II 8 0.55 3 0.14Svmphitopsyche bifida grp 200 13.80 834 38.17Hvdroptila delineata 29 2.00 12 0.55Leucotrichia pictipes -Nectopsvche . -Oecetis -Agarodes -Simulium vittatum 23 1.59 47 2.15Antocha 28 1.93 34 1.56Pentaneura -Brillia -Cardiocladius - - 14 0.64Cricoptopus bicinctus - - - -Cricotopus trifascia grp 120 8.28 36 1.65Cricotopus svlvestris grp - -Cricotopus 86 5.94 47 2.15Eukiefferiella bavarica grp -Eukiefferiella discoloripes grp - - 4 0.18Eukiefferiella pseudomontana grp -Eukiefferiella potthasti grp -Nanocladius -Orthocladius -Cryptochironomus -Dicrotendipes neomodestus -Microtendipes . 41 2.83Polvpedilum 4 0.18Stenochironomus -Cladotanvtarsus -Rhetanvtarsus 34 2.35Tanvtarsus coffmani -Tanvtarsus glabrescens grp 17 1.17 11 0.50Tanvtarsus guerlus grp 51 3.52 4 0.18CERATOPOGONIDAE -Atherix variegata __8 0.55 __3 0.14TOTAL 1449 100.00 2185 100.00
3-88

DRAFT
TABLE 3-37 'NUMBERS AND PERCENT COMPOSITION OFBENTHIC MACROINVERTEBRATES, BY STATION,COLLECTED FROM BALD EAGLE CREEK AND SUSQUEHANNA RIVEROCTOBER 11-12, 1983PAGE THREE
Date 10/11/83Station 1001Replicate ____N_____ __
Prostoma graecense 23 1.20 11 0.43NEMATODA 1 0.05PLANARIDAE - - 3 0.12Manyunkia speciosa 3 0.16 10 0.39LUMBRICULIDAE - - 6 0.23ENCHYTRAEIDAE 2 0.10Chaetogaster -Nais bretscheri 29 1.51 55 2.15Nais communis -Nais yariabalis 5 0.26Pristina -Peloscolex 4 0.16imm. tub, w/o cap -GASTROPODA . 2 0.10Ferrissia rivularis 9 0.47 36 1.41Asellus - - 5 0.20Isonychia - - 9 0.35Baetis brunneicolor 1 0.05 1 0.04Baetis tricaudatus 1 0.05Pseudocloeon 3 0.16 5 0.20Stenacron -Stenonema -Stenonema mediopunctatum 9 0.47 17 0.66Stenonema modestum -Stenonema pulchella - - 1 0.04Serratella serratoides -Caenis 4 0.16Ephemera - - 1 0.04Svmpetrum -Ischnura -CORIXIDAE -Corvdalus cornutus 2 0.10Sialis - - 1 0.04Ancyronyx variegata -Optioservus 5 0.26 10 0.39Optioservus amplus -Optioservus fastidius -Optioservus trivittatus 1 0.05Stenelmis 3 0.16
3-89

DRAFT
TABLE 3-37NUMBERS AND PERCENT COMPOSITION OFBENTHIC MACROINVERTEBRATES, BY STATION,COLLECTED FROM BALD EAGLE CREEK AND SUSQUEHANNA RIVEROCTOBER 11-12, 1983PAGE FOUR
Date 10/11/83Station 1001Replicate ____N_____ _
# %
Psvchomyia flacida - - 1 0.04Neureclipsis - - 4 0.16Cheumatopsvche 1379 71.75 1675 65.43Hvdropsvche hageni 12 0.62 28 1.09Hvdropsvche sp II 36 1.87 23 0.90Svmphitopsvche bifida grp 285 14.83 429 16.76Hvdroptila delineata 25 1.30 16 0.63Leucotrichia pictipes - - -Nectopsyche -Oecetis -Agarodes -Simulium vittatum 8 0.42 41 1.60Antocha 11 0.57 7 0.27pentaneura - - - -Brillia -Cardiocladius -Cricoptopus bicinctus -Cricotopus trifascia grp 17 0.88 31 1.21Cricotopus sylvestris grp -Cricotopus 11 0.57 38 1.48Eukiefferiella bavarica grp 4 0.21Eukiefferiella discoloripes grp -Eukiefferiella pseudomontana grpEukieffereilla potthasti grp 3 0.16Naocladius -Orthocladius -Cryptochironomus -Dicrotendipes neomodestus 2 0.10 6 0.23Microtendipes . 15 0.78 6 0.23Polypedilum 1 0.05Stenochironomus -Cladotanvtarsus 1 0.05 19 0.74Rheotanvtarsus -Tanvtarsus coffmani 3 0.16Tanvtarsus glabrescens grp 2 0,10 31 1.21Tanvtarsus guerlus grp 7 0.36 25 0.98CERATOPOGONIDAE -Atherix variegata __1 0.05 __1 0.04TOTAL 1922 100.00 256 100.00
3-90

DRAFT
TABLE 3-37NUMBERS AND PERCENT COMPOSITION OFBENTHIC MACROINVERTEBRATES, BY STATION,COLLECTED FROM BALD EAGLE CREEK AND SUSQUEHANNA RIVEROCTOBER 11-12, 1983PAGE FIVE
Date 10/11/83Station 1003Replicate ____N____ _
% # % v
Prostoma graecense 120 19.17 15 2.56NEMATODA -PLANARIDAE -Manyunkia speciosa 4 0.64LUMBRICULIDAE -ENCHYTRAEIDAE -Chaetogaster -Nais bretscheri 31 4.95 72 12.31Nais communis 20 3.19 13 2.22Nais variabalis -Pristina 6 0.96Peloscolex -imm. tub, w/o cap - - 1 0.17GASTROPODA . 36 5.75 12 2.05Ferrissia rivularis 41 6.55 45 7.69Asellus - - -Isonvchia ' -Baetis brunneicolor -Baetis tricaudatus -Pseudocloeon -Stenacron - - 2 0.34Stenonema 2 0.32 2 0.34Stenonema mediopunctatum - -Stenonema modestum -Stenonema pulchella -Serratella serratoides . -Caenis 42 6.71 170 29.06Ephemera -Svmpetrum -Ischnura -CORIXIDAE . _ _Corvdalus cornutus 2 0.32Slalis - - 1 0.04Ancvronyx variegata -Optioservus 2 0.32 1 0.17Optioservus. amplus -Optioservus fastidius -Optioservus trivittatus -Stenelmis -
3-91
&830GUI

DRAFT
TABLE 3-37NUMBERS AND PERCENT COMPOSITION OFBENTHIC MACROINVERTEBRATES, BY STATION,COLLECTED FROM BALD EAGLE CREEK AND SUSQUEHANNA RIVEROCTOBER 11-12, 1983PAGE SIX
Date 10/11/83Station 1003Replicate ____ N ____
#' % # %
Psvchomvia flacida - -Neureclipsis 6 0.96 9 1.54Cheumatopsvche 101 16.13 117 20.00Hvdropsvche hageni 3 0.48 4 0.68Hvdropsvche sp II 6 0.96 19 3.25Svmphitopsvche bifida grp 19 3.04 41 7.01Hvdroptila delineate 11 1.76 22 3.76Leucotrichia pictipes -Nectopsvche 2 0.32 2 0.34Oecetis -Agarodes - - 2 0.34Simulium vittatum -Antocha 1 0.16Pentaneura -Brillia -Cardiocladius -Cricoptopus bicinctus -Cricotopus trifascia grp 13 2.08Cricotopus sylvestris grp -Cricotopus 51 8.15 1 0.17Eukiefferiella bavarica grp -Eukiefferiella discoloripes grp -Eukiefferiella pseudomontana grp -Eukieffereilla potthasti grp -Naocladius -Orthocladius -Cryptochironomus - - 3 0.51Dicrotendipes neomodestus 7 1.12 6 1.03Microtendipes . 38 6.07 3 0.51Polypedilum 3 0.51Stenochironomus - - 3 0.51Cladotanvtarsus 6 0.96Rheotanytarsus -Tanvtarsus coffmani 6 0.96 4 0.68Tanvtarsus glabrescens grp 19 3.04 3 0.51Tanvtarsus guerlus grp 25 3.99 9 1.54CERATOPOGONIDAE -Atherix variegata ___6 0.96 ___1 0.17TOTAL 626 100.00 585 100.00
3-92

DRAFT
TABLE 3-37NUMBERS AND PERCENT COMPOSITION OFBENTHIC MACROINVERTEBRATES, BY STATION,COLLECTED FROM BALD EAGLE CREEK AND SUSQUEHANNA RIVEROCTOBER 11-12, 1983PAGE SEVEN
Date 10/11/83Station 1004Replicate ____N
# % # %
Prostoma graecense 68 2.91 26 2.85NEMATODA - - 2 0.22PLANARIDAE 2 0.09 1 0.11Manyunkia speciosa -LUMBRICULIDAE •ENCHYTRAEIDAE -Chaetogaster -Nais bretscheri 11 0.47 73 8.01Nais communis 1 0.04Nais variabalis -Pristina , 5 0.21Peloscolex -imm. tub, w/o cap 1 0.04GASTROPODA . - - 4 0.44Ferrissia rivularis 10 0.43 69 7.57Asellus - - 1 0.11Isonychia - - '3 0.33Baetis brunneicolor - - 1 0.11Baetis tricaudatus -Pseudocloeon - - 4 0.44Stenacron -Stenonema 1 0.04Stenonema mediopunctatum - -Stenonema modestum - - 5 0.55Stenonema pulchella -Serratella serratoides -Caenis 7 0.30 7 0.77Ephemera -Svmpetrum -Ischnura -CORIXIDAE -Corvdalus cornutus 2 0.32 2 0.22Sialis -Ancvronvx variegata -Optioservus 7 0.30 4 0.44Optioservus amplus - - 1 0.11Optioservus fastidius -Optioservus trivittatus -Stenelmis -
3-93
&R30GH73

DRAFT
J
TABLE 3-37NUMBERS AND PERCENT COMPOSITION OFBENTHIC MACROINVERTEBRATES, BY STATION,COLLECTED FROM BALD EAGLE CREEK AND SUSQUEHANNA RIVEROCTOBER 11-12, 1983PAGE EIGHT
Date 10/11/83Station 1004Replicate ____ N _____
Psvchomvia flacida - - 1 0.11Neureclipsis 3 0.13 1 0.11Cheumatopsvche 1675 71.58 439 48.19Hvdropsvche hageni 28 1.20 59 6.48Hvdropsvche sp II 23 0.98 44 4.83Svmphitopsvche bifida grp 429 18.33 104 11.42Hvdroptila delineata 10 0.43 4 0.44Leucotrichia pictipes -
. Nectopsyche -Oecetis -Agarodes -Simulium vittatum - - 1 0.11Antocha 4 0.17 20 2.20pentaneura -Brillia -Cardiocladius 2 0.09Cricoptopus bicinctus -Cricotopus trifascia grp 6 0.26 9 0.99Cricotopus svlvestris grp -Cricotopus 1 0.04 2 0.22Eukiefferiella bavarica grp 1 0.04Eukiefferiella discoloripes grp 21 0.90Eukiefferiella pseudomontana grp -Eukieffereilla potthasti grp 19 0.81 2 0.22
I Naocladius -| Orthocladius - - 2 0.22
Cryptochironomus -Dicrotendipes neomodestus - - 2 0 . 22
j Microtendipes . -' Polypedllum - - 4 0.44
Stenochironomus - - - -Cladotanvtarsus -Rheotanvtarsus - 2 0.22Tanvtarsus coffmani 1 0 . 04
, Tanvtarsus glabrescens grp -Tanvtarsus guerlus grp 2 0.09 10 1.10
1 CERATOPOGONIDAE -Atherix variegata - __ 2 0.09 __ 2 0.22TOTAL 2340 100.00 911 100.00
3-94

DRAFT
TABLE 3-37NUMBERS AND PERCENT COMPOSITION OFBENTHIC MACROINVERTEBRATES, BY STATION,COLLECTED FROM BALD EAGLE CREEK AND SUSQUEHANNA RIVEROCTOBER 11-12, 1983PAGE NINE
Date 10/11/83Station 1006Replicate ____N____
% & O /———__••BM——M •.•JM W H-L B
Prostoma graecense - - 10 0.67NEMATODA -PLANARIDAE 4 0.21 3 0.20Manyunkia speciosa 4 0.21LUMBRICULIDAE - - 1 0.07ENCHYTRAEIDAE -Chaetogaster -Nais bretscheri 11 0.58 10 0.67Nais communis 7 0.37Nais variabalis -Pristina -Peloscolex -imm. tub, w/o cap -GASTROPODA . -Ferrissia rivularis 1 0.05Asellus -Isonychia 3 0.16 39 2.61Baetis brunneicolor - - 1 0.07Baetis tricaudatus -Pseudocloeon 6 0.32 13 0.87Stenacron -Stenonema -Stenonema mediopunctatum - - 4 0.27Stenonema modestum 3 0.16 11 0.74Stenonema pulchella - - 3 0.20Serratella serratoides - - 1 0.07Caenis - - 2 0.13Ephemera -Svmpetrum -Ischnura -CORIXIDAE -Corvdalus cornutus 4 0.21 5 0.33
Ancyronvx variegata -, Optioservus 2 0.11
Optioservus amplus -Optioservus fastidius -Optioservus trivittatus - -
! Stenelmis -i —————
s 3-95

DRAFT
TABLE 3-37NUMBERS AND PERCENT COMPOSITION OFBENTHIC MACROINVERTEBRATES, BY STATION,COLLECTED FROM BALD EAGLE CREEK AND SUSQUEHANNA RIVEROCTOBER 11-12, 1983PAGE TEN
Date 10/11/83Station 1006Replicate ____ N ____
Psvchomyia flacida - - 1 0.07Neureclipsis -Cheumatopsvche 1156 61.23 855 57.15Hvdropsvche hageni 240 12.71 130 8.69Hvdropsvche sp II 42 2.22 40 2.67Svmphitopsyche bifida grp 352 18.64 275 18.38Hvdroptila delineate - - 10 0.67Leucotrichia pictipes - - 3 0.20Nectopsvche -Oecetis - - 1 0.07Agarodes -Simulium vittatum 4 0.21 4 0.27Antocha 5 0.26 14 0.94Pentaneura -BrilliaCardiocladius 1 0.05Cricoptopus bicinctus 3 0.16Cricotopus trifascia grp 4 0.21 7 0.47Cricotopus svlvestris grp -Cricotopus 12 0.64 4 0.27Eukiefferiella bavarica grp -Eukiefferiella discoloripes grp 19 1.01 21 1.40Eukiefferiella pseudomontana grp - - 4 0.27Eukieffereilla potthasti grp 5 0.26 21 1.40Naocladius -Orthocladius -Cryptochironomus -Dicrotendipes neomodestus -Microtendipes - -Polypedilum -Stenochironomus - - -Cladotanvtarsus -Rheotanvtarsus -Tanytarsus coffmani -Tanvtarsus glabrescens grp -Tanvtarsus guerlus grp -CERATOPOGONIDAE -Atherix variegata __ - __ I __ 3 0.20TOTAL 1888 100.00 1496 100.00
3-96

DRAFT
TABLE 3-37NUMBERS AND PERCENT COMPOSITION OFBENTHIC MACROINVERTEBRATES, BY STATION,COLLECTED FROM BALD EAGLE CREEK AND SUSQUEHANNA RIVEROCTOBER 11-12, 1983PAGE ELEVEN
Date 10/11/83Station 1007Replicate ____N____ _
Prostoma graecense 1 0.04 - -NEMATODA - - - -PLANARIDAE -Manyunkia speciosa -LUMBRICULIDAE -ENCHYTRAEIDAE 1 0.04Chaetogaster -Nais bretscheri 1 0 . 04Nais communis -Nais variabalis 3 0.11Prlstina -Peloscolex -imm. tub, w/o cap -GASTROPODA . -Ferrissia rivularis -Asellus - - 1 5.00Isonvchia • 4 0.15Baetis brunneicolor 1 0 . 04Baetis tricaudatus -Pseudocloeon 24 0.90Stenacron -Stenonema -Stenonema mediopunctatum -Stenonema modestum 1 0 . 04Stenonema pulchella 3 0.11Serratella serratoides 3 0.11Caenis 1 0.04Ephemera -Svmpetrum - - - . -Ischnura -CORIXIDAE -Corydalus cornutus - - 1 5 . 00Sialis , -Ancvronvx variegata -Optioservus -Optioservus amplus -Optioservus fastidius 1 0 . 04Optioservus trivittatus -Stenelmis -
3-97
6R300U77

DRAFT
TABLE 3-37NUMBERS AND PERCENT COMPOSITION OFBENTHIC MACROINVERTEBRATES, BY STATION,COLLECTED FROM BALD EAGLE CREEK AND SUSQUEHANNA RIVEROCTOBER 11-12, 1983PAGE TWELVE
Date 10/11/83Station 1007Replicate ____N_______
# % # %
Psvchomyia flacida -Neureclipsis -Cheumatopsvche 858 32. 13Hvdropsvche hageni 210 7.87Hvdropsvche sp II 286 10.71Symphitopsyche bifida grp 951 35.62Hydroptila delineata -, - -Leucotrichia pictipes -
. Nectopsvche -Oecetis - - -Agarodes - -Simulium vittatum 12 0.45Antocha 4 0.15Pentaneura 5 0.19Brillia - - 1 5.00Cardiocladius 16 0.60Cricoptopus bicinctus - - - -Cricotopus trifascia grp 47 1.76Cricotopus svlvestris grp 4 0.15Cricotopus 31 1.16 8 40.00Eukiefferiella bavarica grp -Eukiefferiella discoloripes grp 121 4.53Eukiefferiella pseudomontana grp -Eukieffereilla potthasti grp 74 2.77 - -Naocladius -Orthocladius -Cryptochironomus -Dicrotendipes neomodestus -
i Microtendipes . -Polypedilum - - 3 15.00Stenochironomus -
j Cladotanvtarsus -i Rheotanvtarsus -
Tanvtarsus coffmani -| Tanvtarsus glabrescens grp 4 0.15. Tanvtarsus guerlus grp -
CERATOPOGONIDAE -Atherix variegata ___ 3 0.11 ___ 6 30.00
i TOTAL 2670 100.00 20 100.00
3-98

DRAFT
TABLE 3-37NUMBERS AND PERCENT COMPOSITION OFBENTHIC MACROINVERTEBRATES, BY STATION,COLLECTED FROM BALD EAGLE CREEK AND SUSQUEHANNA RIVEROCTOBER 11-12, 1983PAGE THIRTEEN
Date 10/11/83Station 1008Replicate ____N____ __
Prostoma graecense 6 75.00 4 10.81NEMATODA - - 1 2.70PLANARIDAE -Manvunkia speciosa -LUMBRICULIDAE 'ENCHYTRAEIDAE - - 1 2.70Chaetogaster -Nais bretscheri -Nais communis - - 11 29.73Nais variabalisPristine 1 12.50 1 2.70Peloscolex -imm. tub, w/o cap -GASTROPODA . -Ferrissia rivularis -Asellus -Isonychia -Baetis brunneicolor -Baetis tricaudatus -Pseudocloeon -Stenacron -StenonemaStenonema mediopunctatum -Stenonema modestum -Stenonema pulchella - -Serratella serratoides -Caenis -Ephemera -Svmpetrum -Ischnura -CORIXIDAE -Corydalus cornutus -Sialis -Ancvronvx variegata -Optioservus -Optioservus amplus -Optioservus fastidius _ - - _Optioservus trivittatus -Stenelmis -
3-99
SR301U79

DRAFT
TABLE 3-37NUMBERS AND PERCENT COMPOSITION OFBENTHIC MACROINVERTEBRATES, BY STATION,COLLECTED FROM BALD EAGLE CREEK AND SUSQUEHANNA RIVEROCTOBER 11-12. 1983PAGE FOURTEEN
Date 10/11/83Station 1008Replicate ____N______
Psvchomyia flacida -Neureclipsis -Cheumatopsvche -Hvdropsvche hageni -Hvdropsvche sp II -Svmphitopsyche bifida grp -Hydroptila delineate -Leucotrichia pictipes -Nectopsvche -Oecetis -Agarodes -Simulium vittatum 1 12.50Antocha " -Pentaneura -Brillia -Cardiocladius -Cricoptopus bicinctus -Cricotopus trifascia grp - -Cricotopus sylvestris grp - - -Cricotopus - - 18 48.65Eukiefferiella bavarica grp -Eukiefferiella discoloripes grp -Eukiefferiella pseudomontana grp -Eukieffereilla potthasti grp -Naocladius -Orthocladius -Cryptochironomus -Dicrotendipes neomodestus -Microtendipes . -Polvpedilum -Stenochironomus -Cladotanvtarsus -Rheotanytarsus - - 1 2.70Tanvtarsus coffmani - -rTanvtarsus glabrescens grp -Tanvtarsus guerlus grp -CERATOPOGONIDAE ' -Atherix variegata . - __- __z ___I,TOTAL 8 100.00 37 100.00
3-100

• DRAFT
TABLE 3-37NUMBERS AND PERCENT COMPOSITION OFBENTHIC MACROINVERTEBRATES, BY STATION,COLLECTED FROM BALD EAGLE CREEK AND SUSQUEHANNA RIVEROCTOBER 11-12, 1983PAGE FIFTEEN
Date 10/12/83 . -Station 1009 ' 'Replicate N S
# % #
Prostoma graecense -NEMATODA -PLANARIDAE -Manvunkia speciosa -LUMBRICULIDAE -ENCHYTRAEIDAE 7 4.83 3 3.00Chaetogaster 2 1.38Nais bretscheri - • -Nais communis 1 0.69Nais variabalis -Pristina -Peloscolex -imm. tub, w/o cap - - 3 3.00GASTROPODA - -Ferrissia rivularis -Asellus -Isonvchia -Baetis brunneicolor -Baetis tricaudatus -Pseudocloeon -Stenacron -Stenonema - ' -Stenonema mediopunctatum -Stenonema modestum -Stenonema pulchella -Serratella serratoides -Caenis -Ephemera -Svmpetrum 1 0.69Ischnura 4 2.76CORIXIDAE -Corvdalus cornutus -Sialis -Ancvronyx variegata -Optioservus -Optioservus amplus -Optioservus fastldius -Optioservus trivittatus -Stenelmis -
3-101

DRAFT
TABLE 3-37NUMBERS AND PERCENT COMPOSITION OFBENTHIC MACROINVERTEBRATES, BY STATION,COLLECTED FROM BALD EAGLE CREEK AND SUSQUEHANNA RIVEROCTOBER 11-12, 1983PAGE SIXTEEN
Date 10/12/83Station 1009Replicate ____N_____ __
Psvchomyia flacida - - - -Neureclipsis - - 1 1.00Cheumatopsvche -Hvdropsvche hageni -Hvdropsvche sp II -Svmphitopsyche bifida grp -Hydroptila delineate • _ _ _Leucotrichia pictipes -Nectopsvche -Oecetis 2 1.38Agarodes -Simulium vittatum -Antocha -Pentaneura -Brillia -Cardiocladius -Cricoptopus bicinctus -Cricotopus trifascia grp 2 1.38 - -Cricotopus sylvestris grp • -Cricotopus 4 2.76Eukiefferiella bavarica grp -Eukiefferiella discoloripes grp -Eukiefferiella pseudomontana grp -Eukieffereilla potthasti grp - - - -Naocladius 1 0.69Orthocladius -Cryptochironomus 2 1.38 5 5.00Dicrotendipes neomodestus - - - -Microtendipes . 4 2.76Polvpedilum 87 60.00 51 51.00Stenochlrohomus -Cladotanvtarsus -Rheotanvtarsus 17 11.72 20 20.00Tanvtarsus coffmani -Tanvtarsus glabrescens grp 7 4.83 15 15.00Tanvtarsus guerlus grp 2 1.38CERATOPOGONIDAE 2 1.38 2 2/00Atherix variegata __- __- __- ___-TOTAL 145 100.00 100 100.00
3-102
RR30GW2

DRAFT
Diversity values (D) in the study area range from 1.48 to 3.92 (Stations 1004N and1003N, respectively, Table 3-38). Although D values tend to be lower on thenorthern side of Bald Eagle Creek no distinct differences were attributed to theDrake Chemical Site. At the time of this study no point source discharge from thesite to Bald Eagle Creek were observed. The stream that carries discharges toBald Eagle Creek from the site was dry.
In general, sampling stations in the Susquehanna River are characterized as havingsparse populations with few taxa. There is little similarity existing among theSusquehanna River stations and with those in Bald Eagle Creek. The onlySusquehanna River station that is similar to the Bald Eagle Creek sampling stationsin terms of taxa occurrence is Station 1007 south side. This station, althoughlocated in the Susquehanna River, is strongly influenced by water flow from BaldEagle Creek. Macroinvertebrate distributions at Station 1007S are probably due tocolonization of macroinvertebrates drifting from epicenters in Bald Eagle Creek.A moderate degree of similarity is seen between Station 1007S and Stations 1002,1001, 1004, and 1006 (range of PSc 51.8 to 76.7).
3.6.5 Diatom Survey
A total of 53 species of diatoms were observed in samples from the eight transectstations (Table 3-39). The diatom assemblages indicated that three types of waterquality were present for the eight transects. Areas of stations that wereinfluenced only by water from Bald Eagle Creek (Stations 1001 through 1006) haddominant species such as Achnanthes minutissima. Amphora perpusilla, andRhoicosphenia curvata that are indicative of highly oxygenated, neutral to slightlyalkaline water (Lowe, 1974). The station on the Susquehanna River upstrem of BaldEagle Creek (Station 1008) had dominant diatoms such as Eunotia exigua andNavicula bergeri that are indicative of acidic waters. At Station 1007, wherewaters were mixed from Bald Eagle Creek and Susquehanna River, Achnanthesminutissima was the only dominant diatom (78 to 82 percent). Cyclotellameneghiniana (1.0 to 2.7 percent) and Anomoeoneis vitrea (6.2 percent) were
3-103
HR3QOU83

DRAFT
TABLE 3-38
D VALUES, REDUNDANCY (r), TOTAL TAXA ANDTOTAL NUMBERS OF MACROINVERTEBRATES
TAKEN AT EACH STATION
Station ________Replicate______
S___ N
Dr#taxa/total#
2.99* 2.371002 0.48 0.64
24/1449 36/2185
1.72 2.041001 0.74 0.68
35/1922 34/2560
3.92 3.341003 0.29 0.41
28/626 28/585
1.48 2.831004 0.76 0.54
26/2340 33/911
1.80 2.261006 0.69 0.63
22/1888 29/1496
2.10 . 2.501007 0.29 . 0.59
6/20 27/2670
1.94 1.061008 0.48 0.78
7/37 3/8
2.07 2.321009 ' 0.47 0.55
8/100 16/145
3-104

w eW . uj
So|z K £— u. < .0
co — ' < to£ s 5 S5 w o ™
05 — CO _•« Q S 3 2CO Z Q W 'J_! 2 > 2 *"03 o CE tf C_l S UJ * LU£ t co _; a~ uj _ LU o
lsj"e°Pc3b — * ?S
. S&iUJ §
^ _ _
COoo
rx0o^
s0*™
in=>*-
COi i i i r o i r a i i i i i i t i i i i i i n t o i i i
o o co tnrx
Z
z
I I I I O I O I I I I I I I I I I I I I O I O Iin CM eo -•
IX,
i i i e » i I - C M C O I i i i r x i i i i i i c o i i n iO CM CO -- CM O tco
CO
Z
i m i i i i o i m i I O I I I I I I L O I O Id co - —' - inrx
i i i i i i o i i n r o i i i i t i ^ t i o i i i ico co i -f eo <-CO
CO
to
i i i i o o i i i i i i i i i o i i m i i ar .-' _: o --
CO
I i c o c o i r M i c o i n C Q I I C O I I I I i c o iO O O 5 C M « - O CM O
CM
zi i i i i m i o) ro ii C O C D I I i CD i i
co o o -^ o d
3
—
CO
z
i i i i i i o i o c o i c o i i i c o i i i i i i t od W d d r^ ^
i l l i i c o i r x i r x i i i tx . i i i i i i r x . irx' o o e d
ir-
o
oQEou
i i co TT i i r x i c o i i to i i i ^ i to to i i itiOCM COO i- C M - - - - CM
— "OO
CMOa
2(AOa£ou
nToocEcO
i i i c o i n i c o i o c o i i i i c o o c o i ' i i i i i id « - * T C O O OCOCO
I l l r x - - l i - I ^ C M I I I I t l t x . 1 1 1 1 1 1 1
d d co o> CM in-• CM
« 05CO m -» CO O
^ . 0) -5 — C 13O ^ . ~ g 3 g W f f l - Q
5 *. .i||il III HI Iglli-ilii! =J!iiiiisii!i--iiiEc|S|l|jJ|ol|§l||Ec_ll_ISl
I^^I^lUlJlcjJdulllLjIu-l
1 1 1 1
1 1
1 1 1 1
i i ino
i i o in-• 05
1 1 1
i rxrx.
1 05 T-
t- CO
to CM-• CO
i rx m ^O — Tf
1 1 CO TO CM
1 1 CO tOo rx
rx, rx CM <od o CM co
01o•o8u^
iDhonema
<livaceoides
arvulum
irgestinum
Iddd
.('-
3-105

t*5Q
coCOCO
COLU rr- 1z S §> § 5H 5co to 2
illa§«isSZQ§^_ _5 S?j!jio
H* CL» O —5 O A.
COoo
rx0o
io"
inoo~
•xfo— "
COs^
I
CMoO
CO
z
Z
CO
z
to
CO
Z
to
z
"wOQ£oo
o75oaEoU
oU5oaoU
1
1
1
1
1
rxCM
COCM
O5
O
«rxd
O5^
COCM
cnCM
varlans
eloslra
•s.
»T cn i i i I i i i i i i i i i n i i c o i I O 5 I 05 >- «^- O CO CM O ••- *- o cn
05o o i i i i i i i i 1 1 1 1 0 1 1 0 1 1 1 0 1 c n o C N °in co — • — • i- • •— • o
i i i i i i i i i i i i c n i i i i i i i i cor-in" COo • •«- o
05cai t o i i n i i t n o inm i i m i t n i i n i i n i n cn to m °
. . . . . . . r- in COr - O C M C M > - O O O O O O • •— • o
I l l l l h x I O t l l r x O 5 I O I I I O 5 l l l COCM^-i— o corx. • 1C CO rx <- r- r- • •
- — CO 0 ,-godi n o i i i c o i o i c o 0 0 1 i i i i i i i f o \ f >»— r co
i i i co i co co co •— co i r x c o i i i c o i t o i i i i o CM cnCNJ. Tj- fx.
O O O C M C O C O rxTT C M 1 • ••- — • CO O ^
05d
i i i i i o i i c o r x i I •<! cn i i i cn I eo i 11 corx<r- \ft to
o cn co *9* o o *— •CM CM O
i i i i c n i o c M c o o t o c o i n i c o i c o i i i i o o cn. . . . . . . . . CM O CO
^ e M r x » - « c r » - o c M o o • •CO CO 0 m
COdi i r x i i i i c D i n r x i n o i x . i i i r x i r x . i i i i cocotn
o in«-to^coo o o • •— * CM O
i i co •— I co i cn T T C M C M c n t o c o i c o i i i i I I incorx.. . . ... . . . . . . CM o coo e o c n e o c M c M c o c o i r - o i - • •
-9 O
i i i i n i c o i - t r i n m c o i n i i i n t c o i i i i i i otoco. . . . . . . CM O5 CO
" ° •-- °- - - ° CM'd
I I I X . I I C M I CMCM r x c n r x i i i - r i i i i i i o — _ •o c M - h x f M o r x O — • • •o co o
<A3 X
a «> 1=5 5*«« ™ e C ™= » ? -S £ u> e? S S i £ w * ~a § » ® g o « ^ o f e
S" ? SE - § « § • = « 2 e §8»€ Se--Scl ^113^ w| |SSSs col^fs&'ll g .*||_I5 o=fB t
|illlilHI|llll|llil|l{|i «||l iz z z z z z z z z z z z z z z'lz z z 'd ce co to colco r- z co LU co
3-106

DRAFT
common and present only at Station 1007. These diatoms reflect a slightly acidicto neutral pH and oxygenated waters in the mixing zone of Station 1007.
A community comparison index or similarity index which provides a percentagesimilarity of species common to two communities was used to compare the northand south areas of each station transect. Similarity indices (Table 3-39) were high(0.83 to 0.99) for transects 1004, 1006, 1007 and 1008 which indicates that diatompopulations of each respective north and south area were only slightly different (1to 7 percent). The similarity index for diatoms at station 1006 was very low (0.02)which reflected the large difference (99.98 percent) of water quality between thenorth and south shore zones. The northern zone of station 1006 received water "?/V\primarily from the Susquehanna River which contained acidic mine drainage '" ' ^whereas the southern shore zone received water from Bald Eagle Creek.
Shannon-Weiner diversity indices for the diatom assemblages were highest (2.33 to4.06) at sampling points that received water from Bald Eagle Creek and lowest(1.11 to 1.56) at stations influenced by the Susquehanna River (Table 3-39).
Evenness expresses the distribution of individuals among the species present wherea maximum value of 1.0 represents all species of the sample have an equal numberof individuals. Evenness indices reflected the same trend as Shannon indices;highest values (0.55 to 0.81) for Bald Eagle Creek and lowest values (0.35 to 0.43)for the stations influenced by the Susquehanna River.
In summary, diatom species composition and diversity indices indicated that duringthe short term prior to sampling. Bald Eagle Creek had an absence of gross organicpollution, was neutral to slightly alkaline, and had well oxygenated waters. Diatompopulations at stations on the Susquehanna River were typical of streams affectedby acidic mine drainage. No differences of diatom populations among the stationscould be attributed to the Drake Chemical Site.
3-107

DRAFT
3.7 Terrestrial Survey
The primary route of concern for offsite migration is via a leachate channel, whichmay emanate from the unlined leachate lagoon. The leachate is conducted via acorrugated metal pipe (CMP) through a railroad grade adjacent to the leachatelagoon and emerges at the head of a swale. From this point the leachate channelmeanders across the flood plain for approximately 1,620 feet to its confluence withBald Eagle Creek. The channel ranges from 20 to 50 feet in width within theswale, which continues for approximately 550 feet downstream of the culvert. Atthis point, the flow is conveyed under South Pine Street and the channel assumes asteeper gradient and more compact cross section. This general configuration1persists for the remainder of the channel reach to Bald Eagle Creek.
The swale area lies adjacent to a ballfield on the Hammermill Paper Companyproperty. In addition, the leachate channel traverses Castanea Township Parkafter passing under Route 220. The leachate channel itself has been surrounded bya snow fence and signed to discourage contact by the general public. In addition,the Castanea Township Park has been closed indefinitely until the extent of dangerfrom the leachate stream has been fully characterized.
To facilitate presentation of the results of this survey, the site and vicinity havebeen divided into seven subareas as noted below.
1. Drake Site2. K-Mart/American Color & Chemical Area3. Gorham Property4. Abandoned Residential Development5. Hammermill Ballfield6. Leachate Swale and Leachate Channel7. Castanea Township Park
Table 3-40 presents an overview of the species composition by area and by life5V
form (i.e., grasses and brambles, shrubs, trees). Reference to this table identifies
3-108

t. I< r « . X X X X X X X X X X X X X X X X XX XQ I
CO
X X X X X X X X X X X X X X X XXXXX
X X X X X
C M X X X X X X X
XX XX
OE« o «= _ _ != CD - , c oCO -. =
Z
O
e X " CD •»_ • O ^ ?? t3 *•• .2 = -) toI !*„ Ejsglo s |odjS = « ?| Eco
coUuCO"o
g.£ co
o>
CO
COii-»MCJ oO CO
toCD•acocouCO
•g e 3E-5CO
i £uE3«,x;«i — o.i/j = ._;aj— vjw — rn~|— ._!<!.-, ^^"ea—""'^!*.^.~ *^ • ^.^ — ^^ ^i» ^ CO "^ * \ _ LU S L '^ ^^ n ^ ^3 »U _ ^^ »fm
03 5 CD S < CO I Q. < 5 $ CQ O -^ CO H I J CD I- CD 0. Q. O CO > UJ Q
£CD (A= £ 3-• s i
3-109 co
t -2 Na •
X X X X X X X X XX X XXXX X
X XXX f.* /•
V (
X X X X X X X XX
£aZo
coZcO£oo
j>
eoin9•aCO
to
Q coo 5.= >.c-5.c
•o 2•Z, couuCOcoi_CDUSCD
o
a •=-i Q
a.
CO
Oco
CD coO £
ii~ 3
eo
CO CDco O)
-^ % t 9 o> O^5 g CO CO T3 CO
S8|o i ~ *I HI iti UJ CD
r- CV3 g
CD
"O /2Q> w
|I 125 gJS. o O
3-110
ftR300ti90

DRAFT
species within each life form and provides a convenient means of noting the variousspecies found during the survey.
)General descriptions of each of the subareas in the vicinity of the leachate stream,follow. Emphasis has been placed upon any notation of vegetative stress during thesite reconnaissance. As this phase of the report deals only with the leachatestream area, descriptions are given only for subareas 1,5,6, and 7.
3.7.1 Area No. 1 Drake Chemical Site
The Drake Chemical Site occupies an area of approximately eight areas all ofwhich are enclosed by a security fence. The site is essentially devoid ofvegetation. Where chemical spills may have been a contributing factor, the lack ofvegetation can be adequately explained by the normal conduct of operations duringactive manufacturing. The latter would have involved site grading, includinggrading of demolition material, and equipment movement across the site. It mayalso have included intentional use of herbicides to suppress vegetative growtharound the manufacturing buildings, or the use of the site for the disposal ofchemical sludge.
The embankments of the lagoons were found to be sparsely colonized by pioneerspecies of grasses and small black locust and wild black cherries.
The only trees noted above 15 feet in height were black locust in a lowlying areaimmediately northwest of the manufacturing buildings. Older black locust in thisarea had died; however, younger black locust on elevated areas in the vicinity werefound to be living.
Vegetation from seed sources surrounding the site would have difficulty becomingestablished due to the hardened surface soil, or lack of soil in the areas covered bydemolition waste.
3-111
RR3QQW1—————'•" •"•-"-•- iu.iiuimnil.il'

DRAFT
Inspection of the leachate lagoon evidenced no aquatic plant life. However, waterstriders (Gerris sp.) and Dytiscid water beetles were noted. The latter appeared tobe present in large numbers in the shallower portions of the lagoon.
Rabbits (Svlvilagus floridanus) have been noted frequenting the site by NUS fieldpersonnel and killdeer (Charadrius vociferous) were noted during the sitereconnaissance. There are also reports of waterfowl having been sighted onimpoundments at AC&C immediately to the west of the Drake Site.
3.7.2 Area No. 5 Hammermill Ballfield
This tract lies to the southwest of the Drake Site and the leachate stream andencompasses approximately nine acres, most of which is maintained as openland,either as the ballfield or mowed field between the ballfield and Route 220. Whilethe ballfield is primarily vegetated by fescues, the open field supports native weedspecies such as asters, goldenrod, and foxtails in addition to fescues. A large openarea lies to the southwest of the ballfield. This area is apparently being utilized byHammermill for disposal of a flyash byproduct. During wet periods, leachate froma portion of the flyash residue apparently flows along the right field line of theballfield, ponding slightly near the dugout area and then moving to the northeasttoward the leachate swale. Vegetative stress as a result of this discharge isapparent over the course of the drainage, dissipating as the flow turns toward theleachate swale.
3.7.3 Area No. 6: Leachate Swale and Leachate Channel
Upon exiting from a pipe culvert under the railroad grade, leachate flows through aswale to a second culvert under South Pine Street. The leachate channel is clearlydefined within the swale as a barren zone approximately 25 to 40 feet in width.Vegetation was either present or absent, with no intergrade between vegetated andbarren areas. Little, if any, vegetative stress was noted along the periphery of thebarren area. A willow and small black locust within 10 feet of the barren area atthe head of the swale showed no evidence of vegetative stress. Although the
3-112
A83G8U92

DRAFT
reconnaissance was not exhaustive, no isolated zones of impact appear to existaway from the main channel. Lowlying portions of the swale were heavilyvegetated with sedges and clump grasses adapted to the moist conditions. Higherground was found heavily colonized by goidenrod, asters, and other typical uplandherbaceous vegetation and small trees.
The character of the leachate channel changes downstream of the culvert underSouth Pine Street. The gradient becomes steeper with a corresponding compressionof the channel cross section.
Riparian cover between South Pine Street and Route 220 includes more woodyspecies such as sapling silver maples and black locust. The clear demarcationbetween affected and unaffected vegetation remains however, with the barrenzone reduced to four to six feet in width.
The leachate is then conveyed under Route 220, and ultimately traverses theCastanea Township Park for a distance of approximately 550 feet before joiningBald Eagle Creek. The final reach of the leachate stream through the Park areaappears to exhibit a moderate gradient which increases with proximity to BaldEagle Creek. This is evident from limited meandering and delta formation at thehead of this reach, and sharper channel definition as the leachate proceedsdownstream. The effect on riparian vegetation again appears to follow the patternof sediment deposition, with no observable vegetative stress beyond the perimeterof the barren channel.
The banks of this reach of the leachate channel support more mature woodyvegetation than is the case further upstream. Box elder, trembling, and quakingaspen, wild black cherry, black locust, willow, elm, ash, and hickory were amongthe tree species noted.
Herbaceous cover and understory consist primarily of foxtails, American vetch, andgoidenrod near Route 220, with goidenrod, shrubby dogwood, small saplings, and afew brambles further downstream.
3-113
AR3QO«*93

t•
DRAFT
At one point a trembling aspen immediately adjacent to the leachate channel wasfound to be defoliated, while others further from the channel exhibited good growthcharacteristics. While this may have resulted from proximity to the leachate, itssignificance is questionable.
3.7.4 Area No. 7: Castanea Township Park
This tract lies between Route 220 and Bald Eagle Creek, consisting ofapproximately 12 acres to the east of the leachate channel and four acres to thewest of the channel. An access road is located along Bald Eagle Creek along thesourthern periphery of the park. Peripheral areas are treed, but the park itself hasbeen cleared for ballfields, a picnic pavillion, swings, and an exercise course.Approximately one acre of the park has been planted with field corn. This area islocated near the Park entrance to the southwest. Small ornamental plantings ofblack birch, blue spruce, European larch, tulip, poplar and apples were noted duringthe site reconnaissance. In addition, a few large box elders, silver maples, andNorway spruce were apparently left in place during landscaping of the park.
Without periodic mowing, the herbaceous cover in the park has reverted to amixture of fescue, orchardgrass, and weed species typical of the early stages ofopen field succession. The latter include foxtails, goidenrod, asters, and a numberof mature forbs.
Approximately one acre of wooded land, about half of which is lowland, is withinthe northeastern section of the park. In addition to cattails and sedges, thelowland portion supports sparse tree cover, including willow, box elder, andhawthorns. Elms, ash, silver maples, and a few birch were found on the uplandportion of this tract.
In addition to the leachate channel, described in the preceding section, scrublandbordering the park to the north and wooded riparian land along Bald Eagle Creekrepresent the only other woodland in the park vicinity. The scrubland was found tosupport a mixture of sumac, black locust, wild black cherry, and brambles. While
3-114

DRAFT
most of this cover was low, a few of the black locust may have reached 40 feet inheight. The banks of Bald Eagle Creek support large box elders, black locust, and afew willows.
Because of the location of the park within the flood plain of Bald Eagle Creek andthe apparent positive correlation between Fenac concentrations and patterns ofsediment distribution, isolated impact zones might have been anticipated atvarying distances from the leachate channel. However, no evidence of stressedvegetation was found during the site reconnaissance which would indicatedistribution of Fenac away from the leachate channel. This is consistent withsampling results summarized in the EOC re part.
Observation of the present poor condition of the cornfield within the park has ledto speculation that Fenac present in the soil might be a contributing factor. Theplants themselves are stunted, reaching a maximum height of about four feet, oronly about half that which might be expected. When formed, the ears are poorlydeveloped.
Fenac is not approved for use with corn, and would probably exert an effect uponthe germanating seeds if it was present in the soil, killing the plants in that stage.In addition, observation of the cornfield during the site reconnaissance showed avigorous growth of foxtails, which would not be expected if herbicidalconcentrations of Fenac were present in the soil. No zones of vegetative stresswere detected between the leachate channel and the cornfield. In all probability,the substandard growth of the corn is due to poor management practices, i.e., soilimprovement, weed control, cultivation, etc. or to use of inferior seed.
The park is essentially an open field community, and should support a variety ofrodent species. During the site reconnaissance, a rabbit was flushed from cover inthe lowland area to the northeast, and a white-tailed deer (Odocoileus virginianus)was sighted within the leachate channel enclosure.
3-115

DRAFT
3.7.5 Summary
The site itself is essentially without vegetation. The effects from leachatecontaining Fenac, among other contaminants, were noted within the leachatechannel. The leachate channel itself is devoid of vegetation over its entire1,620 foot length. Field observations noted no significant affects upon terrestrialvegetation beyond the established channel as a result of the leachate stream.
Drainage from a flyash-like residue was found to have adversely affected someherbaceous vegetation along the right field line of the Hammermill ballfield. Thishas been noted only for the scale of completeness. At this time there is no reasonto suspect any connection with site activities or with the leachate.
A cornfield on the Castanea Township Park property exhibits poor growth form andproductivity as a result of poor management or inferior seed selection. Noevidence exists to suggest that the leachate is in any way responsible for poorgrowth of the corn.
As noted previously, anomalies in vegetation which could be adequately explainedwith reference to physical factors were not considered "vegetational stress" for thepurposes of this survey. This survey was undertaken at a time when many of thedeciduous trees were beginning to lose their leaves. This was especially true in thecase of box elder. Similarly, many of the warm season grasses and otherherbaceous vegetation had flowered and were beginning to die back.
3-116

IDRAFT
4.0 HEALTH RISK ASSESSMENT
4.1 Introduction
The purpose of a risk assessment is to evaluate the risks posed by hazardous wastesite conditions to the general public and to remedial action personnel. Typically,this process involves identification of the hazardous compounds of greatest, concern,definition of significant contaminant migration routes and exposure pathways,prediction of the compounds' environmental fate and likely concentration at pointsof exposure, and an assessment of possible health effects in light of probableexposure scenarios.
In performing a risk assessment, several factors must be considered. Theseinclude:
• Present site conditions, as defined by the remedial investigations;
• Relevance of current and historical analytical data;
• Physical, chemical, and biological variables affecting the environmentalfate and mobility of compounds;
• Potential human receptors and their likelihood of exposure andsusceptibility to those compounds; and
• Health effects associated with exposure to those compounds, and anyascertainable synergistic, additive, or inhibitory effects.
The extent to which each of the above factors is to be evaluated depends upon thescope and objectives of a given risk assessment. Conversely, any limitations to theextent to which these factors can be evaluated will limit the scope of riskassessment that can be performed and the conclusions which can be inferred. Suchlimitations may include the validity and applicability of laboratory data, relevance
4-1
ftR3QQi*97

DRAFT
of toxiological data to site-specific exposure scenarios, and the degree ofpredictability of such variables as probabilities of exposure or environmentalconcentration at a particular point or time.
The objective of this risk assessment is to evaluate the chemical hazards andhealth risks associated with the leachate stream extending southward from theDrake Chemical Site to Bald Eagle Creek. This report will describe the variousexposure pathways, identify critical chemical contaminants, and assess potentialhealth effects of exposures. Because the risk assessment is focused only on theleachate stream, this evaluation may not be applicable to all site conditions andimpacts as a whole. Additionally, as with any risk assessment procedure, technicaland procedural, limitations may preclude assignment of risk in absolute terms incertain situations. Where relevant, significant limitations will be discussed in theappropriate sections to follow.
4.2 Exposure Pathway Analysis
Simply stated, an exposure pathway is the environmental route by which acontaminant may reach a susceptible receptor. In order for a pathway to becomplete, three factors must be present: a source of contamination, a route ofcontaminant transport, and human receptors within, or at the end of, that route.
4.2.1 Source of Contamination
Although it is presumed that the contaminants in the leachate stream originatedfrom a source or sources on the Drake Chemical Site, it is beyond the scope of thisfocused risk assessment to identify and evaluate those potential sources.Therefore, for the purpose of evaluating the health risks posed within the leachatearea, the leachate stream, itself, will be regarded as the contaminant source.
4-2
&R3Q6U98

DRAFT
4.2.2 Routes of Transport
The primary modes of environmental contaminant transport from the leachatestream are via surface and groundwater movement of suspended or dissolvedcontaminants. Although airborne migration of vapors and contaminated paniculatematter also may be considered, data indicate the highest contaminantconcentrations are adsorbed on sediment. This, and the propensity of the area forflooding suggest that the airborne route is of little significance in comparison.
4.2.3 Receptors
The nearest business and residential populations to the leachate area areapproximately 1/4 to 1/2 mile to the north and northwest of the leachate area.The leachate area, extends south and east from the Drake Chemical Site, awayfrom those populations. However, the stream extends across or is adjacent topublic use areas, including the Hammermill Paper Company baseball field and theCastanea Township Park. There is no reported groundwater use in the area.Therefore, those persons subject to the greatest risk from the leachate stream arethe transient populations who may come into direct contact with the leachatewhile using the recreational areas. Also potentially at risk are those persons usingBald Eagle Creek for fishing or other recreational purposes, downstream from theconfluence of the leachate stream and the creek.
43 Analytical Data Base
One of the most critical factors in risk assessment is the type of analytical dataavailable as input. An ideal data base will include samples of all media associatedwith of exposure pathways from the source, analysis for all critcial compounds andindicators and valid analytical data of verifiable quality. The types of analyticaldata available for the various media in the leachate stream area are described inthe following sections.
4-3
RR308U99

DRAFT
4.3.1 Air Sampling
Data characterizing vapor or paniculate contaminants in air in the leachate areaare not available. Site conditions, however, suggest that the air exposure pathwayis of relatively low significance.
4.3.2 Groundwater Sampling
Seven groundwater samples were collected from monitoring wells (B6, M14, M13,M11A, M11B, M12A, and M12B) near the leachate stream, four onsite monitoringwells nearest the leachate stream (Ml, M5, M6 and M7), and one well (M10) on theAmerican Color and Chemical property above the leachate area. All groundwatersample analysis included Fenac, TOH, TOC and organic and inorganic prioritypollutants.
4.3.3 Subsurface Soils
Subsurface soil samples were collected during the drilling of four monitoring wellsin the leachate area (Mil, M12, M13, M14). These were analyzed for Fenac, TOH,TOC, and organic priority pollutants. Subsurface samples collected from fiveonsite wells above the leachate area (M1, M5, M6, M7, and M10), one sample fromCastanea Township Park, and one onsite soil boring (TB-1), were analyzed forFenac, TOH, TOC, and both organic and inorganic priority pollutants. A soil boring(Boring 14) between the canal and leachate lagoons on site was analyzed only forFenac, TOH, and TOC. Results of pesticide analyses of these samples weredetermined "unacceptable" by the data validation process, and are not included inthis risk assessment.
4.3.4 Surface Soils
Surface soil samples were collected from several locations both on the DrakeChemical Site and in and near the leachate stream area. Of those surface soilsamples collected in the leachate area, only the one from the Castanea Township
4-4

DRAFT
Park cornfield was analyzed for organic and inorganic priority pollutants, as well asfor Fenac and TOC. Surface soil samples from four leachate area monitoring welllocations (M11, M12, M13, M14) were analyzed for Fenac and organic prioritypollutants. The remaining seven leachate stream and adjacent area soil samplesand one from onsite soil boring 14, were analyzed only for Fenac, TOH, and TOC.A surface soil sample from onsite well Ml was analyzed for Fenac and prioritypollutants only.
4.3.5 Surface Water and Sediment
Three onsite leachate lagoon samples were analyzed for Fenac, TOH,dichlorobenzenes, and organic and inorganic priority pollutants. A total of threesample locations in Bald Eagle Creek (one upstream, one at the leachate streamconfluence, and one downstream of the leachate stream), and one location in theleachate stream, were sampled and analyzed for organic and inorganic prioritypollutants, TOH, dichlorobenzenes, and Fenac. Two additional downstream BaldEagle Creek samples were collected and analyzed for TOH, dichlorobenzenes, andFenac only.
Sediment samples were collected from the same locations and analyzed for thesame parameters, with the exception that TOH was not analyzed in the threeonsite lagoon sediment samples.
43.6 Rsh Tissue
Thirty-six fish specimens were collected from sampling stations in Bald EagleCreek and the Susquehanna River for Fenac analysis. Fenac was not detected inthe fish tissues.
43.7 Historical Data
In March 1982, the USEPA ERT conducted an Extent of Contamination (EOC) studyof aqueous and sediment samples along the length of the leachate stream, as well
4-5
'
&R3G05QI

DRAFT
as soil samples from several transects extending laterally from the leachatestream. The EOC study focused on thirteen compounds of interest. Apparentlyexcluded from the study were inorganics, volatile organics, and pesticides. On thebasis of that study, the ERT concluded that the contaminants generally attenuatedalong the length of the leachate stream due to soil and sediment adsorption, andthat Fenac and dichlorobenzenes are the best indicators of the extent ofcontamination in the leachate area.
4.4 Critical Contaminants Detected
The results of sampling analysis from the remedial investigation are discussedthroughout Section 3.0 of this report, and are summarized in Tables 3-7 through3-28. On the basis of the inherent toxicities of the compounds detected, theirrelative concentrations, and the most probable exposure pathways, severalcompounds were selected as representing the greatest potential risks. Thesecritical compounds, the sampling media in which detected, and their range ofconcentrations are presented in Table 4-1.
Although a wide variety of organic and inorganic compounds were detected amongthe many samples analyzed, selection of the most critical compounds wassomewhat limited by variations in the parameters analyzed for among the differentsamples. As pointed out in Section 4.3, the analytical data base varied among thedifferent sample types both within and among Ihe various sampling media. Forexample, potentially significant compounds such as benzene, chloroform,methylene, chloride, and 1,2-dichloroethane were detected in groundwater samplesfrom offsite monitoring wells in the leachate stream area. However, there are nocorresponding volatile organic analyses available for related subsurface and surfacesoil samples. On the basis of the site-specific condition that local groundwaterdoes not pose a significant exposure pathway and human health risk, thesecompounds were not included in the critical compound list. Had they beenanalyzed for and detected in soil samples, they may have been included in that list,possibly modifying the assessed risk of the leachate area.
4-6
&R3G0502

DRAFT
TABLE 4-1
CRITICAL COMPOUNDS DETECTED IN DRAKECHEMICAL SITE LEACHATE STREAM AREA (OFFSITE)
___Compound___ ____Media____ Concentration Range
Fenac Groundwater N.D - 389 ug/literSubsurface Soils <10 — 2,100 ug/kgSurface Soils <10 ug/kg (all samples)Surface Water N.D. — 7 ug/literSediments N.D. — 2,140 ug/kgSediments (EOC) 60 — 13,000 ug/kgSurface Water (EOC) N.D. — 2,080 ug/literSurface Soils (EOC) N.D. — 810 U9/kg
Arsenic Groundwater 19 — 2,880 ug/literSubsurface Soils 5 mg/kg (one sample)Surface Soils 10 mg/kg (one sample)Surface Water <10 ug/liter (all samples)Sediments 5.44 — 14.0 mg/kg
Dichlorobenzene (Total) Surface Water N.D. (All samples)Sediments N. D. — 420 ug/kg (c)Surface Soils (EOC) N.D. — 7,320 ug/kgSediments (EOC) N.D. — 18,100 u/kg
Pentachlororophenol Groundwater N.D. (all samples)Sediments N.D. — 211 U9/kgSubsurface Soil N.D. — 4,400 ug/kg
N.D. - Not detectedc * corrected for lab blankEOC - Data from ERT March 1982 Extent of Contamination Survey< * Less than
4-7
&R388583

i
DRAFT
While such limitations preclude accurate quantification of health risks, they dopermit an appraisal of site conditions and the possible risks involved. Sufficientindicator data are available to perform a reasonable, qualitative assessment.
4.5 Assessment of Critical Contaminants
Because of the aforementioned variations in the analytical data base, ameaningfully, quantitative comparison of each relevant sampling location cannotbe made. Therefore, this section will discuss in more qualitative terms the healthrisks associated with the compounds selected as most indicative of the hazardsposed by the leachate stream.
4.5.1 Fenac
Fenac, or 2,3,6-trichlorophenylacetic acid, is a persistent herbicide which wasmanufactured at the Drake Chemical Site. Its presence on the site has beendescribed as "ubiquitous", and as an indicator of other onsite contaminants. Anoral dosage of Fenac of 1,780 mg/kg body weight has been shown to be lethal to 50percent of the experimental rats so exposed, and a dermal dosage of 3,160 mg/kghas proven fatal to 50 percent of exposed laboratory rabbits. It is considered to beonly moderately acutely toxic to humans, with a probable lethal oral doseestimated to be between 0.5 and 5 grams/kg (between one ounce and one pint for a150 pound person).
Although there are no estimates of long term exposure effects to humans, atwo-year feeding trial in which rats were fed a diet containing 2,000 mg/kg bodyweight Fenac showed no ill effects. In comparison, the highest concentration foundin the leachate stream was a sediment containing 13 mg/kg of soil. At this level ofFenac, a 70 kg person would have to consume in excess of 10,000 kg of sediment toingest 2,000 mg/kg of Fenac. Although this suggests that health risks of acuteexposures are low, Fenac is a persistent compound and any delayed effects of longterm exposure have not yet been identified. The compound is soluble in water (200mg/liter) and can be expected to migrate through the leachate area via
4-8
RR3QQ50U

DRAFT
groundwater discharge or via rainfall or flooding. Persons with chronic skindiseases or sensitivity to chemicals are generally advised to avoid use or contactwith pure Fenac. However, the risks associated with acute exposure to the levelsof Fenac detected in the leachate area appear to be low.
4.5.2 Arsenic»
Arsenic is a highly toxic compound from which both acute and chronic toxicity canbe expected, and it is a recognized carcinogen. Epidemiologic studies havesuggested that arsenic in drinking water may be related to increased incidence ofskin cancer, and industrial and agricultural exposures have been implicated incancer of the skin and respiratory tract (Hammond). Although is described asinsoluble in water, it was detected in groundwater samples. The finding of arsenicin the leachate area samples is worthy of note in that the highest concentrationwas found in the well nearest Bald Eagle Creek, and the lowest at the upper end ofthe leachate stream, near the Drake leachate lagoon. In general, arsenic levels ingroundwater were higher in the leachate area than on site. The increased levels ofarsenic in the groundwater near the creek suggests possible contamination of thecreek, with consequent bioaccumulation and potential risk for persons making useof Bald Eagle Creek. Sediment samples from the creek contained as high as14 mg/kg arsenic downstream from the leachate stream confluence. Bycomparison, EPA Water Quality Criteria recommend 2.2 ng/l as the level of arsenicin water which may result in an incremental increase of cancer risk of one in onemillion over a lifetime.
4.5.3 Dichlorobenzene
Dichlorobenzenes are described along with Fenac as one of the best indicators ofcontamination at the Drake Chemical Site. Total dichlorobenzene concentrationsup to 18,100 ug/kg were detected in sediment samples from the leachate stream.
The 1,2- and 1,4- isomers of dichlorobenzene were found most commonly. Theseare moderately toxic compounds, via inhalation exposures, but the 1,4-isomer is
4-9
DRAFT
considered to be more toxic orally than the 1,2-isomer. Both pure compounds mayproduce a painful irritating effect to the skin and mucous membranes, but are notwell absorbed through the skin. However, it is not highly likely that casual contactwith dichlorobenzene-contaminated soils would cause significant adverse effects.It is useful, however, as a measure of general site contamination.
4.5.4 Pentachlorophenol
Pentachlorophenol is a very toxic compound which may be absorbed through the rf**fskin and gastrointestinal tract. The lethal oral dose for 50 percent of anV
experimental rat population was found to be 50 mg/kg; for hamsters, 168 mg/kg.The minimum acute lethal dose for sheep and calves was shown to be 120 and 140mg/kg, respectively.
Dermal penetration is the most dangerous exposure pathway. Acute skin exposuremay result in a contact dermatitis. Extended periods of exposure toPentachlorophenol have resulted in a persistent chloracne.
Pentachlorophenol was found in only one leachate stream sediment sample at211 ug/kg, and in only one subsurface soil sample (MW 14) at 4400 yg/kg. Becausesurface soil analyses did not include Pentachlorophenol, it is not possible todetermine the significance of health risk, if any, due to pentachlorophenolthroughout the leachate stream area. Because of pentachlorophenol's presence inthe two samples near the stream, and because of its capability for dermalabsorption, there is a potential risk posed to persons using the recreational areasnear the stream. Risks posed by casual, intermittent contact with contaminatedsoils would be low. Extended periods of contact may result in increased risk ofdermal exposure, especially among sensitive individuals.
4.5.5 Other Compounds
Three organic compounds detected in groundwater samples were omitted from theCritical Compound list (Table 4-1) because groundwater useage is not a significant
4-10

DRAFT
human exposure pathway at the Drake Chemical Site. These compounds, benzene,chloroform, and 1,2-dichloroethane, are of indirect significance in that all threeare carcinogens, and all three are present at levels exceeding acceptable dailyintake levels (assuming groundwater used as drinking water at an average usagerate of 2 liters per day). The presence of these compounds in the groundwatersuggest their possible presence in other media. Further evaluation of remedialalternatives should address the presence, extent, and source of these volatileorganic compounds in the leachate stream area.
4.6 Summary
This risk assessment was an evaluation of potential health risks presently posed bythe leachate stream area of the Drake Chemical Site. The risk assessment wasperformed qualitatively on the basis of selected compounds indicative of thepotential risks posed by the variety of compounds detected in the samples. Thefindings of the risk assessment indicate that the greatest risk of exposure, althoughrelatively low, is posed by direct contact with dermally active or absorbentcompounds present in the leachate area. Of secondary importance were risks posedby compounds which may be discharged into Bald Eagle Creek and accumulated byaquatic life. To date, no significant impact has been found on aquatic life in BaldEagle Creek due to the Drake Site. Although of less importance from thestandpoint of exposure pathway significance, groundwater was found contaminatedwith highly toxic, carcinogenic compounds which may be significant to further
ievaluation of mitigative measures in the leachate stream area.
4-11
&R3005QT

DRAFT
REFERENCES
Site-Specific
Quinn, E., September 8, 1983. A Toxicological Impact Assessment of DrakeChemical, Inc. TDD No. F3-8303-22 (FIT III). NUS Corporation, Philadelphia,Pennsylvania.
EPA, ERT. March 1982. Extent of Contamination, Drake Chemical Company,Lock Haven, Pennsylvania. Edison, New Jersey.
Non Site-Specific
Alien, R. K. and Edmunds, G. F., 1963. "A Revision of the Genus Ephemerella(EphemeropterarEphemerellidae). VI. The Subgenus Serratella in North America."Ann. Ent. Soc. Amer. 56:583-600.
Bagenal, T. B. (ed.), 1973. The Proceedings of an International Symposium on theAging of Fish. Unwin Brothers Limited.
Basch, P. F., 1963. "A Review of the Recent Freshwater Limpet Snails of NorthAmerica." Bull, of the Mus. of Comp. Zool. 129(8):399-461.
Beck, W. M., Jr., 1976. "Biology of the Larval Chironomids." Fla. St. Dept. Envir.Reg. Tech. Ser. 2(1): 1-58.
Bednarik, A. F. and McCafferty, W. P., 1979. Biosvstematic Revision of the GenusStenonema (EphemeroptrarHeptageniidae). Can. Bull, of Fish and Ag. Sciences.
; No. 201.
' Benfield, E. F., Hendricks, A. C., and Cairns, J. Jr., 1974. "Proficiencies of TwoArtificial Substrates in Collecting Stream Macroinvertebrates." Hvdrobiologia
: 45(4):431-440.
R-1
ftR308588

DRAFT
Bpezina, E. R. (ed.), 1977. PCBs in Pennsylvania Waters. PADER Bureau of WaterQuality Management Publication No. 51.
Brezina, E. R. and Arnold, M. V., 1977. Levels of Heavy Metals in Fishes fromSelected Pennsylvania Waters. PADER Bureau of Water Quality ManagementPublication No. 50.
Brinkhurst, R. 0. and Jamieson, B. G. M., 1974. Aquatic Oligochaeta of the World.Univ. of Toronto Press.
Brown, H. P., 1972. Aquatic Dryopoid Beetles (Coleoptra) of the United States.EPA.
Cairns, J., Jr. and Dickson, K. L, 1971. "A Simple Method for the BiologicalAssessment of the Effects of Waste Discharges on Aquatic Bottom-DwellingOrganisms." Jour. Wat. Poll. Cont. Fed. 43:755-772.
Carlander, K. D., 1969. Handbook of Freshwater Fishery Biology Vol. I and II.Ames: Iowa State Univ. Press.
Crossman, J. S. and Cairns, J., Jr., 1974. "A Comparative Study Between TwoDifferent Artificial Substrate Samplers and Regular Sampling Techniques."Hvdrobiologia 44(4):517-522.
Davis, K. C., 1903. "Sialididae of North and South America." N.Y. State Mus. Bull.68:441-487.
Edmunds, G. F., Jensen, S. L, and Berner, L, 1976. The Mayflies of North andCentral America. Minneapolis:University of Minn. Press.
Edmundson, W. T., (ed.), 1959. Freshwater Biology. John Wiley and Sons.
R-2
R8380589

DRAFT
Flint, 0. S., 1964. "Notes on Some Nearctic Psychomyiidae with Special Referenceto Their Larvae (Trichoptera)." Proc. U.S. National Mus. 115:467-481.
Foster, N., 1976. Biota of Freshwater Ecosystems Identification Manual No. 4.Freshwater Polychaetes (Annelida) of North America. EPA, Cincinnati, Ohio.
Frost, S., Huni, A., and Kershaw, W. E., 1971. "Evaluation of a Kicking Techniquefor Sampling Stream Bottom Fauna." Can. J. Zool. 49(2):167-173.
Gibson, R. and Young, J. 0., 1976. "Freshwater Nemerteans." Zool. J. Linn. Soc. "f58:177-218. '7''
. Hammond, P. B. and Bellies, R. P., 1980. "Metals." Casarett and Doull'sToxicology, Second Edition, Doull, J., Klassen, C. D., and Amdur, M. O. (ed.). NewYork: Macmillian Publishing Co., Inc.
Hess, T., 1979. Final Report: Evaluation of Some Important River Systems withinthe Walton District of the East Central Region-Upper South River Basin. ProjectNo. EC-3. Georgia Department of Natural Resources, Game and Fish Division.
Institute of Paper Chemistry, 1974. A Biological Study of Bald Eagle Creek in theVicinity of Lock Haven, Pennsylvania. Project 3229. Report One - A ProgressReport to Hammermill Paper Company.
i
Institute of Paper Chemistry, 1979. A Biological Water Quality Study of BaldEagle Creek near Lock Haven, Pennsylvania. Project 3229. Report Two - AProgress Report to Hammermill Paper Company.
] Lowe, R. L, 1974. Environmental Requirements and Pollution Tolerance ofFreshwater Diatoms. 670/4-74-005, EPA, Cincinnati, Ohio.
iMason, W. T., 1973. An Introduction to the Identification of Chironomid Larvae.Div. Poll. Sun/., Fed. Water Poll. Contr. Admin., Cincinnati, Ohio.
R-3
&R3G05IQ

DRAFT
Merritt and Cummins, 1978. An Introduction to the Aquatic Insects of NorthAmerica. Dubuque, lowa:Kendall-Hunt Publishing Company.
Millbrink, G., 1983. "An Improved Environmental Index Based on the RelativeAbundances of Oligochaeta Species." Hvdrobiologia 102:89-97.
Marihara, D. K. and McCafferty, W. P., 1979." "The Baetis Larvae of NorthAmerica (Ephemeroptera:Baetidae)." Trans. Amer. Ent. Soc. 105:139-221.
Needham and Westfall, M. J., 1955. A Manual of Dragonflies of North America.University of California Press.
Parson, W., December 27, 1983. Personal Communication. PADER, Bureau ofWater Quality Management, Williamsport, Pennsylvania.
Patrick, R., 1949. "A Proposed Biological Measure of Stream Conditions, Based ona Survey of the Conestoga Basin, Lancaster County, Pennsylvania." Proc. Acad.Nat. Sci. Phlla. 51:277.
PADER, 1974. A Listing of Aquatic Biological Stream Investigations, June 1968 toJanuary 1974. Bureau of Water Quality Management Publication No. 35.
i
PADER, 1979. Title 25, Rules and Regulations, Article II, Water Resources,| Chapter 93, Water Quality Standards.
i PADER, 1982. Commonwealth of Pennsylvania Water Quality Inventory (Section\
'< 305(01 P.L 95-217). Bureau of Water Quality Management.
| " Pennak, R. W., 1978. Freshwater Invertebrates of the United States. John Wileyand Sons.
1Perkins, J. L 1983. "Bioassay Evaluation of Diversity and Community Comparison
f Indexes." Jour. Wat. Poll. Cont. Fed. 55(5):522-530.
, R-4
RR3Q08U

DRAFT
Pollard, J. E. and Kinney, W. L, 1979. Assessment of MacroinvertebrateMonitoring Techniques in an Energy Development Area. A Test of the Efficiencyof Three Macroinvertebrate Sampling Methods in the White River. EPA, 600/7-79-163.
Resh, V. H. and Unzicker, J. D., 1975. "Water Quality Monitoring and AquaticOrganisms: The Importance of Species Identification." Jour. Wat. Poll. Cont. Fed.47(1):9-19.
Roback, S. S., 1957. "The Immature Tendipedids of the Philadelphia Area."Monogr. Acad. Phila. 9:1-152. -,,,-,,
'A'.'<$
Ross, H. H., 1944. "The Caddisflies, or Trichoptera of Illinois." Bull. III. Nat. Hist.Surv. 23:1-326.
Simpson, K. W. and Bode, R. W., 1980. Common Larvae of Chironomidae (Diptera)from New York State Streams and Rivers, with Particular Reference to the Faunaof Artificial Substrates. New York State Museum Bulletin No. 439.
Snoddy, E. L. and Noblet, R., 1976. Identification of the Immature Slack Flies(Diptera: Simuliidae) of the Southeastern U.S. with Some Aspects of the AdultRole in Transmission of Leucocvtozoon Smithi to Turkeys. South CarolinaAgricultural Exp. Sta., Clemson University.
Steiner, J. W., Doughman, J. S., and Moore, C. R., 1982. A Generic Guide to theLarvae of the Nearctic Tanytarsini. U. S. Department of Interior, Geologic Survey.
Stone, A. and Jamnback, H. A., 1955. The Black Flies (Diptera:Simuliidae). NewYork State Museum Bulletin No. 349.
Walker, E. M., 1953. The Odonata of Canada and Alaska. Part I, General. Part II,The Zygoptera-Damselflies. Vol. 1. Toronto:University of Toronto Press.
R-5-
88300512

R-6
DRAFT
Wiggens, G., 1977. Larvae of the North American Caddlsfly Genera. Toronto:University of Toronto Press.
Wilhm, J. L, 1967. "Comparisons of Some Diversity Indices Applied to Populationsof Benthic Macroinvertebrates in a Stream Receiving Organic Wastes." Jour. Wat.Pollut. Cont. Fed. 39:1673-1683.
Wilhm, J. L and Dorris, T. C., 1968. "Biological Parameters for Water QualityCriteria." Bio Science 18(6):477-481.
Williams, W. D., 1976. Freshwater Isopods (Asellidae) of North America. EPA,Cincinnati, Ohio. ^
&R300513

APPENDIX A
NUS BORING LOGS

TEST BORING N*PROJECT NAME DRAKE CHEMICAL PROJECT N2 0710.12RFO| DRIST /FNRINFpR J.KASPER n&ll MNR nONTRArTOR
SURFACE Fl F.VATION 557.02
LITHOLOGY
SURFACEMIXED FILL
WOOD FRAGMENTS AND MIXED FILL
MIXED FILL
LOOSE BROWN SAND, LITTLE SILT,GRAY MOTTLING OCCASIONAL, MOIST(SM)
SAME AS ABOVE WITH OCCASIONALBLACK ZONES (SM)
LOOSE BROWN SAND. SLACK ZONESCOMMON, SUBROUNDED SANDSTONEFRAGMENTS AT BASE , WET ( SW) /
ILuING METH
PROF
ILE
P
1Sfiv$
§
^
H-UJulu.IQ.
d
3.0
6.5
8.5
11.0
15.0
16.5
nn HOLLOW STEM AUGER nnST T.K UP FLFVATION
SOlu SAMPLE
NUMB
ER
1
2
^
4
5PE
NE TRATION
( INC
HES)
24
18
24
if
\
'\
RECO
VERY
( INC
HES )
1
3
18
»g»
V\u,***
u]UJu.
x"
Q
3.05.05.06.5
9.0II. 011.413,0"V*
I5.B
>
BLOWS/6"
1- 1-1/1.0'
4-9-2
2-2-2-3
3n4A\'\-&l;
1 .
TB-1LOCATION
BY KAK DflTE 10/20/83 CHK'C .. DATELOCK HAVEN. PA ON -SITE
EMPIRE SOILS INVESTIGATION nRli i fa JOE JENSENLLING DATE 9/2B/83 rnm
STATIC WAT
ERLE
VEL, FfET
>*"
BORING-CASING
DIAM
ETER
,INCHES
33/4 IDHOLLOWSTEMAUGER
\vJ\^
ROCK SAMPLE
tr RECO
VERY %
.a
-P0"
Q
•
\i•
SCALE l" = _5j_VEFITICAL
WELL CONSTRUCTION DETAILS(NOT TO HORIZONTAL SCALE)
3 ^P
\ vV;U '' .|V- BENTONITE
fiR3005l5
REMARKS

TEST BORING NS B-|PROJECT NAME DRAKE CHEMICAL PROJECT N2GFOI GRIST /FNfilWFFB J.KASPER - J.PRIEUR nDRM I ACKER AD H nSURFACE ELEVATION 556.95
LITHOL06Y
SURFACE
MEDIUM STIFF BROWN CLAYEY SILT,SOME SAND. (ML)
STIFF BROWN CLAYEY SILT. SOMESAND. (ML)
MEDIUM STIFF BROWN SILTY FINETO MEDIUM SAND, TRACE OF CLAY(SM)
DENSE BROWN AND GRAY FINE TOMEDIUM GRAINED SANDSTONEFRAGMENTS AND DENSE GRAVEL.
VERY DENSE RED AND SRftY FINE TOMEDIUM GRAINED SANDSTONEFRAGMENTS. SOME DARK GRAY SHALEFRAGMENTS, SOME BLUE FINE GRAVEL
*ILulNG METH
PROFILE
SiSr CS
ffir*naitit
fei_&£*•if f '"V*m
DEPTH,
FEE
T
4.5
12.0
27.0
32.0
<nn DRIV
0710.12 LOCATIONRILLING CONTRACTORIN CASING nn
STICK IIP Fl FV/ATION
SOIL SAMPLE
NUMBER
1
2
3
4
5
6
PENETRATION
( INCHES)
18
18
18
18
16
18
RECO
VERY
(INCHES
I
18
12
8
<
14
15
9
i-UJ
x~c.UJo
5.06.5
8.09.5
13.014,5
^<;TO,
23.02*5"
28.O29.5
BLOWS/6'
3-4-4
9-5-8
/""
<«-$
\\\\ r\ \.
10 7-8
\/
3O-27-2I
75-35-60
LOCK HAVEN .PA AC 8 C PROPERTYEMPIRE SOILS INVESTIGATION npiMFR BILLLING DATE 9/14/83 rnn2.17
< u.S "-U _jP "U.
^
\>!•
\)
BORI
NG-C
ASIN
GDI
AMET
ER,
INCH
ES
4"DRIVENCASING
y
ROCKSAMPLE
Z
isV
RECO
VERY %
^
V1
s?QO01
V.
SKURA
SCALE " = _5l_ VERTICAL
WELL CONSTRUCTION DETAILS(NOT TO HORIZONTAL SCALE)
£ J8t •:-?
i" PVC if. j Sit;SCHD. 40 — ij ;• ;;;':
\ 6*-llM/ 8.5- \, ij ;5::
y.u «*«. v
a,';; ;';
OUTER ——— 88HS?TUBNG &jy*??
17.0- 'iffiji
20.0- KJ
25.0- &%
_t*j »;",
260-111
{IIP
32.0- pHii
a$?^r>,^; , t>
iiv^S
'
li
'r.vi; lc
•S$$S
;fe*"
4$|g
CEMENT /BENTONITEGROUTBENTONIT
-SAND
-BENTONITE
-SAND
•BENTONIT
-SAND
— BARCAOSAMPLE
-BENTONIT
-SAND
-'/z" POLETHYLENE TUBINGAND Vi«" NYLON INNER TUBIN
S O'
&R3005I6.
REMARKS
' 3

PROJECT NAME DRAKE CHEMICAL PROJECT N2 07IO 12 LOCATION LOCK HAVEN, PA AC 8 C PROPERTY
nBii i ACKER ADD riRSURFACE Fl FVATItlN 55848
LITHOLOGY
SURFACESTIFF BROWN FINE SANDY SILT AND FILL(ML)
MEDIUM DENSE BROWN SILTY FINE TOMEDIUM SAND, SOME FINE GRAVEL,TRACE FILL (SM)
STIFF BROWN FINE SANDY SILT (ML)
MEDIUM DENSE BLACK SILTY FINE TOMEDIUM SAND (SM)
VERY DENSE GRAY MEDIUM TO COARSEGRAINED WEATHERED SANDSTONE
ILLING METH
UJ
utoiiisppHi
ji::::".-.v
H
Hf
UJUJu.
Q.UJa
-5,0
•m DRIVE1ilLLING COt•J CASING
JTRACTrw. EMPIRE SOILS INVESTIGATION npll i to BILL SKURAnHi
STICK UP ELEVATION •
SOIL SAMPLE
NUMB
ER
1
2
3
4
5
6
7
ENETRATION
INCHES)
0 ——
18
IS
IB
I
18
18
18
II
ECOV
ERY
NCHES )
K—
18
16
16
/
1
12
I I
8
LUUlU.
3fa.UJa
5.06.5
8.O9.5
13.0145
"\
18.1uas
5575
28.029.5
33.0
BLOWS/6"
5-6-5
2-3-4
"5f*'>
\
~\ \
?7-3%-30'
24-23-24
52-32-50
80-100X4
LLING!,I6
STATIC WATER
LEVEL, FEET
<
>v
nATC 9/15/83
0
BORING-CASI
DIAMETER,
INCHES
4DRIVENCASING
'
COOF
ROCK SAMPLE
zcc
V<A.
\
RECO
VERY %
*t,
\^
OOa:
>
/
DINATFS
SCALE l"= 5' VERTICAL. , „, —— . _. ——————
WELL CONSTRUCTION DETAILS(NOT TO HORIZONTAL SCALE)
i• 31*' J«
"SCHD > UK "jV>P\K- i »«a ',
so i m *\ i?ivll';!
80- i"^ YH^i" i vigj* ia £OUTER -•.'.•SM.--X "iTUBING ;::;:;{ii:te: ;!;
l"*tV.V'' t% >*'IBS- iSvV- .5mi„,•!13Z'°..a R fa;
*
»-
i,
•v
H
|**
IffL / 4'
7 .' —— 1/2 POLYET3/16" NYLON
6R3001
" 6" PROTECTIVESTEEL CASINGW/ LOCKING CAP
- CEMENT/BEN-TON ITE GROUT
-BENTONITE
-SAND
-BENTONITE
-SAND
-BENTONITE
-SAND
-BENTONITE
-SAND
-BARCAD SAMPLER
fHYLENE TUBINGINNER TUBING
517
9REMARKS
HNU 150 ppIN CASING
HNU 150 PP-IN CASINGZppmlN Al-
•
mr

PROJECT NAMF DRAKE CHEMICAL PROJECT NSGEOLOGIST /FNKINFFH J.PRIEUR nHRII i ACKER AD n ntSURFACE ELEVATION 555,88
LITHOLOGY
SURFACE
IILUNG METI-
PROF
ILE
MEDIUM STIFF BROWN FINE SANDY SILT fijgglAND FILL (ML) K55
ISBSMEDIUM STIFF TO STIFE_BLACK FILL 8*§§AND CLAYEY SILT, SOME MEDIUTOANOjSSglAND FINE GRAVET(ML) iffMEDIUM STIFF BROWN CLAYEY SILT. E&t£TRACE MEDIUM GRAINED SAND, MOIST ESSK(ML) psa
mVERY DENSE BROWN SILTY FINE TOMEDIUM GRAINED SAND AND WEATHEREDSANDSTONE FRAGMENTS. MOIST (SW).
VERY DENSE BROWN AND GRAY WEATH-ERED COARSE GRAINED SANDSTONEFRAGMENTS, SUBROUNOED TO SUB-ANGULAR
•':"••£'•:••
%j!lv
B
DEPT
H, FEE
T
2,0
4 0
II 0
18.0
38.0
inn DRIV
0710.12 LOCATIONRILLING CONTRACTOREN CASING nn
STICK IIP ELEVATION
SOIL SAMPLE
NUMB
ER
<PENETRATION
( I
NCHE
S )
#*••
\
RECO
VERY
( INC
HES )
<V
UJtuu.l"d.a
X
\
BLOWS/6'
NOSAMPLESTAKEN
\v'*v
LOCK HAVEN, PA AC S CEMPIRE SOILS INVESTIGATION npLLINC2.16
" j"< S "•oss1- L_(/) _t
S
naTF 9/13/83
ORING-CASING
IAME
TER,
NCHE
S
u. uj —
4" DRIVENCASING
S
' • v-. *
\ ^
COORDINATES5
ROCKSAMPL
zcr
^
RECOVERY %
\\
5?
ocr
i
LLEB
CALE
PROPERTYBILL SKURA
l"= 5 VERTICAL
WELL CONSTRUCTION DETAILS(NOT TO HORIZONTAL SCALE)
~13,0 _|
1 " PVC '•PIPE — vSCH40 ;.
9.0 _ I'10.0 4
1" 0 - OUTER 'TUBING
I7.0_ i
18.0 -i
27.0_2ao
3TO_ ;.38.0- i
- i
•'i'.'-'C'im\: '-. i-'jy
II_^
£if
/ ;
II
*i
1p11!i
* <f"
'K'i'1'
[' t
;-':;.''
''*;v'-"
'*-•
i'$•
X;..'Ji
S
-
i
^
1:
1
x6"0PROTECTIVSTEEL CASING"/ OCKNG CAP
CEMENTs BENTONITEGROUT
-SAND
-BENTONITE
-SAND
-BENTONITE
-SAND
- BENTONITE
-SAND
_ BARCADSAMPLER
M/2" POLYETHYLENE TUBING3/16" NYLON INNER TUBING
4" 1
e
ftR3005l8
REMARKS

PROJECT NAME DRAKE CHEMICAL PROJECT N2 0710 12 LOCATION LOCK HAVEN, PA —— SflShAM PROPERTY ————————————————— .KFOI nniRT /FWKINFFR J PRIEUR
SURFACE Fl EVATION 554 90
LITHOLOGY
SURFACEVEPY DENSE BLACK FINE TO COARSESRAVE^ (GW)
LOOSE BROWN S.LTY SAND (SM)
VERY LOOSE BROWN SAND, SOME SILT(SW)
LOOSE BROWN SAND, LITTLE SILT,BLACK ZONES COMMON (SM)
DENSE BLACK SAND SOME GRAVEL(SW) ———
VERY DENSE LIGHT TO DARK GRAYSANDSTONE FRAGMENTS
SHALE. BLACK LOW TO MODERATEANGLE FRACTURES (SMOOTH) COMMONVERTICAL FRACTURES OCCASIONAL,CALCITE COMMON ON FRACTUREPLANES.SOFT, BROKEN
SHALE.. BLACK, HIGH ANGLE FRACTURES(NEARLX- RTICAL) FREQUENT ANDLOW A FRACTURES SPARSE
LtING IVETH
PROF
ILE
EBB*K£ftSSS
1
•A-'-'.-.f.
'•01.
•$;'%
Bill•
DEPT
H, FEE
T
5
.0
2.0
5.0
23.5
48.5
53.5
62.0
DRILLING CONTRACTOR £^r 4" DRIVEN CASING TRl
STICK UP ELEVATION'
SOI,- SAMPLE
NUMB
FR
5toElU
is
RECO
VERY
( INC
HES ) UJ
UJU-
l"c_u.
^
LOWS/6"
NO SAMPLESTAKEN
^
MPIRE SOILS INVESTIGATION_LING DATE 9/22 /8 3 r.nnR3.36
5 t-
y -jt/i -J
i
BORING-CASI
DIAM
ETER
,INCHES
4" DRIVENCASING
?
+
?OCK SAMPLE
zrr
**
RECO
VERY %
<
r"
V
ooQ:
>
DRILLERniWATFS
SCALE
BILL SKL RA
" = _§L VERTICAL (LITHOL(
WELL CONSTRUCTION DETAILS(NOT TO HORIZONTAL SCALE)
SCALE l"= 5' VERTICAL
"pvc — <SCHD. 40
"OUTERTUBING -
17.0 -
21,0
2SO
36.0
>!'* »'
'.':
; '; ;'
•
<$>i
•;.*
;S|
,". '"~ "'
•,'- 'X' • {'••/•.v*';«';'.*; • '. ;I •'*: : ,*T ;*
:- **•,"•"' •: ' V-" J .' ;'.
s.:'V-\'V*.»:?
8/•
.v.*.
|||
Hf-S K?
*
V(•i
f
;>i
f"
1
*•* .
WkiJi£
4 "
* 6 PRC^-CASINt"~-CEMEf
GROUT—— BENTC
—— SAND
—— BENTO
— i/z"ou
—— SAND
— BENTO
—— SAND
— BENTO
— SAND
Ul/2"POLYETHYLENE TUBING|_yi6"NYLON INNER TUBING
*>i/
mREMARKS
fECTIVEWITH LOCKT-BENTONITE
NITE
NITE
ER TUBING
NITE
NITE
D SAMPLER
^ B

«•"• TEST BORING Ng B - 5 -,_=»——i*..?.WWJECT NAME OIUKE g«MC*. -•..-.-•-.: ______ PROJECT N* O7IO.I2_____LOCATION LflanWEM m...«_t tT- <MI~'.:.flEOLOSIST/CNOINEER J. iBBBljiiit _'J_______ DRILUN8 CONTRACTOR EMOC IQg-S J*CST19ATKj»_____DRILLER _J_W_J(3BtDRILL -JBK£EL_4CJ1—————t«ru-W8 WCTHoo —CIWEH BBHg——— DRILLING DATE 9/B/M—COOBOINATES———' -^^ '«iYarA/.cr iri euA-rtnM tg .TT '_ ' ~'\ STICK UP ELEVATION 2 * «in»i r *•*« -* U*IJM«J»I
WELL CONSTKUCTION<NOT TO HOW20MTAL

TEST BORING N2 8"6 '«**«»* PATE tO/KVts CHK-D ___OAtt_ PROJECT H* 07K3.lt______ iBCATtftti" I,JOCK IjMMM.P* HAHmCHXILL R«OPEj»TY...... . .... ...»»•_. v.*... ruoivff «y\ll « MUWIlBjnDH ftAli , fm Ml T «VliaA_______________ ORILLINS CONTRACTOK EJ«f«£ «ftlL8 JMUBMnOM———.DRILLER Mil WUM .
SHILLJNS METHOD DKIVt CAaiMO ORILLINS DATE j£iQ£EL_COOIWIN*TE«,SCALE r=_5l,V£RT«ALSTICK UP ELEVATION
WELL CONSTRUCTION DETAILS1NOT TO HORIZONTAL SCALE) BEMARKS
LOOK TO UEHUM DSBSE. MOW FINES/mp. UTTLE »LT(SM)
:,- >-'i- -f*~- ?•!• *: .VC''-."",
glHKSai -W r *>fo3R*
OK Eia ^

TEST BORING N2 E~2 BY rih DATE JO/I9/83_CHK1D ___DATE*__PROJECT NAME DRAKE CHEMICAL_______________ PROJECT N2 0710.12________ LOCATION LOCK HAVEN.PA GORHAM PROPERTY_________" '..GEOLOGIST/ENGINEER J. KASPER______________ DRILLING CONTRACTOR EMPIRE SOILS INVESTIGATION_____DRILLER JOE JENS6N________^______DRILL CME 75 ACKER AOn nRMLlNG METHOD H.S.AUGER-NX CORING DRILLING DATE !/22/8_3_ COORDINATES________________________-SURFACE ELEVATION 554.24 = _^ STICK UP ELEVATION.__ 2.78 __ SCALE l"= 6' VERTICAL
LITHOLOGY
SURFACEVERY DENSE BLACK FINE TO COARSEGRAVEL (GW)
LOOSE BROWN SILTY SAND (SM)
VERY LOOSE BROWN SAND, SOME SILT(SM)
LOOSE BROWN SAND, LITTLE SILT,BLACK ZONES COMMON (SM)
DENSE BLACK SAND. SOME GRAVEL(SM)
VERY DENSE LIGHT TO DARK GRAYSANDSTONE FRAGMENTS
SHALE.BLACK, WEATHERED
5JJALE, BLACK LOW TO MODERATEAN6LE FRACTURES (SMOOTH) COMMON,VERTICAL FRACTURES OCCASIONAL,CALCITE COMMON ON FRACTUREPLANES, SOFT, BROKEN
tHftlg BLACK,HIQH ANGLE FRACTURESMUMLY vomcAU FREQUENT AND3 » *NOL£ 1-WCTUHE3 SBARSE
9.0
12.0
23.5
38.5
•535
SOIL SAMPLE
10
°5
TB
BLOWS/6'
50/5
, 3-S-S
I5-I7-ZI
9-16-13
IOO/5
O
S>
43.4-1
44.8
D O _
6 1/4" I.DHOLLOWSTEMAUGER0-48.8
NX COW*44Jj'-(
ROCKSAMPL
5?WELL CONSTRUCTION DETAILS(NOT TO HORIZONTAL SCALE)
no
no
6" PROTECTIVESTEEL CASINGW/LOCKING CAP
44.8-
4"PVCP*6SCHD. 40
62,0
REMARKS

GEOLOGIST/ENGINEER 0. KASPER - J. PRIEUR_________ DRILLING CONTRACTOR EMPIRE SOILS INVESTIGATION nRILI FR JOE JENSEN-BILL SKURADRILL CME 75-ACKER AD ]I_____DRILLING METHOD H.S. AUSER-NX CORING DRILLING DATE .l/]2/S3__ COORDINATES—————————.————————SURFACE ELEVATION 555.74________________ STICK UP ELEVATION 1-60_______________________SCALE l" = _jlVERTICAL
LITHOLOGY
SURFACEMEDIUM STIFF BROWN FINE SANDY SILT 1AND FILL (ML) |MEDIUM STIFF TO STIFF BLACK FILL
AND FINE GRAVEL (ML) A
MEDIUM STIFF BROWN CLAYEY SILT,TRACE MEDIUM GRAINED SAND,MOIST (ML)
VERY DENSE BROWN SILTY FINE TOMEDIUM GRAINED SAN.P AND WEATHER-
(SW)
VERY DENSE BROWN AND GRAY WEATHER-ED COARSE GRAINED SANDSTONE FRAG-MENTS. SUBROUNDED TO SUBAN6ULAR
SHALE. DARK GRAY, WEATHERED 'i
SHALE , BLACK, LOW TO MODERATEANGLE FRACTURES (SMOOTH)> COREDIAMETER VERY COMMON, CALCITEVEINS OCCASIONAL, LARGE IRONSTONENODULES OCCASIONAL, SOFT TOMODERATELY HARD, BROKEN
SHALE. BLACK. SMOOTH. LOW TO MODER-ATE ANGLE FRACTURES < ANO> OUMETEFOF CORE, SOFT, BROKEN
SAME AS ABOVE WITH A GRAY MUDBTDNEBED AT 54.20' TO 55.18'
t
*HALE. BLACK, LOW TO MODERATE ANOLEFRACTURES (SMOOTH) > CORE DIAMETERVERY COMMON, CALCITE VEINS OCCASBN-AL, LARQE IRONSTONE NODULES OCCA-SIONAL, SOFT TO MOOER. HARD, BROKEN8HALE. BLACK, VERTICAL FRACTUREUXS6'-7O.SO' WITH PYRITE SPECKS AND•HO CALCITE FILLJNG COMMON ON FRAC-TURE PLANE, SOFT TO MODERATELYHARD, BROKENJHALE. BLACK, VERTICAL FRACTURE LOW-*R 0.50', MODERATE ANOLE FRACTURES >CORE DIAMETER OCCASIONAL, CALCITE•OCCASIONAL ON FRACTURE PLANES, SOFTTO MODERATELY HARD. BROKEN SSHALE. BLACK, VERTICAL FRACTURESCOMMON WITH CALCITE FILUNG ON FRAC-TURE PLANES, MODERATE ANGLE FRAC-TURES SPARSE, MODERATELY HARD,
UJ
iZon.
i1£j.«£5>
lit
11iJk UV______J
' •
J____ —————
-X——
i==-'— _1 =TT™ "
PLL—i.' - '• ————mmm
^
=ae
DEPTH,
FEE
T
-4,0
-18.0
•40.0
•47.2
•53.6
•SI.2
•86.1
•71.1
•75.0
•BOA
SOIL SAMPLE
o:UJm
1
2
3
4
5
6
<7
8
9
10
r"
PENETRATION
( IN
CHES )
18
18
18
18
18
18^
<rj,l8\
\.,
5 1
18
I6J/4
4V4
RECO
VERY
( INCHES )
14
17
15
15
16
J7
16
\ •
I;*,,
W"
14
8
3
UJUJu.x"t-C.UJO
2.03.5
JL5.6.0
8.5Too
12.013.5
16.0
%fe'
235
JJJLQ.
30.031.5
35.036,4
4O.G46.4
BLOWS/6"
4-4-4
2-2-2
2-2-4
15-20-31
5-20-Jpf
*> X
4-3O-35
7-32 -22
'• >4C«H6-'9S
3-13-20
12-30- "X4
100 /. 4'
STATIC WATER
LEVE
L, FEE
T
(V783v
S
o
BORING
-CASI
DIAM
ETER
,IN
CHES
61/4" I.D.HOLLOWSTEMAUGER,0-45'
'. v'•x. v
NX CORING45.0'-80.0
ROCK SAMPLE
ztr
f
\
^
1
2
3
4
5
6
7
RECO
VERY %
SH
100
73
B2
100
100
100
no
3*0oa:
.>
\
0
0
28
25
25
30
70
WELL CONSTRUCTION DETAILS(NOT TO HORIZONTAL SCALE)
_n — nmiSff
\\4i5_ HI
80. 01
4"• Ii
It-
rNX
V
iKfl- 6" PROTECTIVE_M STEEL CASINGEjjq W/LOCKING
I
1
I•§
•jl— CEMENT/IBS BENTONITEflM GROUT
1-1H-4"PVC PIPEM SCHD. 40
1
-OPEN BOREHOLE
AB300523
VREMARKS
^ ^

TEST BORING N2 E - 3 B> JMS DATE 10/20/83 CHK'C .PROJECT NAME DRAKE CHEMICAL_______________ PROJECT NS 0710.12_________ LOCATION LOCK HAVEN, PA - EAST OF SITE_____GEOLOGIST/ENGINEER •>• KASPER__________________ DRILLING CONTRACTOR EMPIRE SOILS INVESTIGATION______DRILLER -)OE JENSENDRILL CME 75___________DRILLING METHOD HOLLOW STEM AUGER DRILLING DATE 9/14/83SURFACE ELEVATION 555.29______________ STICK UP.ELEVAT10N 195________________________SCALE l"= _§j_VERTICAL
LITHOLOGY
SURFACEMEDIUM DENSE BLACK SAND AND GRAVEL
LOOSE REDDISH BROWN SILTY SAND (SM)
LOOSE TO MEDIUM DENSE BROWN FINETO COARSE GRAINED SAND, LITTLE SILT(SM)
Q/7/SLOOSE BROWN FINE TO COARSE SAND, ''"'"''""'LOWER 0.2' BLACK (SW)
VERY DENSE BROWN FINE TO COARSESAND, BLACK ZONES COMMON (SW)
VERY DENSE BROWN COARSE SANDAND FINE TO COARSE GRAVEL. BLACKZONES COMMON (GW)
DENSE BROWN RNE TO MEDIUM SAND(SW)
VERY DENSE BROWN WEATHERED -viffi *_f" HB HI rpnilT"SANDSTONE FRAGMENTS fci.r,'.i.V.n WT M •! UKUUI
DENSE DARK GRAY WEATHEREDSANDSTONE FRAGMENTS
CLAYSTONE. GRAY, WEATHERED,AND PARTIALLY DECOMPOSED
MEDIUM DENSE TO VERY DENSELIGHT GRAY SANDSTONE FRAGMENTS.GREEN ZONE AT 45.8'
4,50
38.5
420
T8.5
SOIL SAMIX5
14.5
15.75
l|,0 , , , pA
FITS
BLOWS/6'
15-25-5O/J
18-15-36
30-31-50/2
50/.4
10-12-21
B.26-SO/3
80.0 ., -» .-SM. l5-25-»°
11-16-20
HOLLOWSTEMAUGER
ROCKSAMPLE
WELL CONSTRUCTION DETAILS(NOT TO HORIZONTAL SCALE)
-6 PROTECTIVESTEEL CASING »/LOCKING CAP
CEMENT-BENTONITE
?ji —SAND PACK
$ ^6845- :"'
750-"
76.5-
4"0 SCHEDULE40 PVC. SCREENSLOTTEb 0.01WITH BOTTOM CAP
REMARK;

TEST BORING N5 M~1 B> >oc DATE JO/20/83 CHK'L __ DATE .PROJECT NAME DRAKE CHEMICAL_______________PROJECT N9 .071 O.I2 ___ LOCATION LOCK HAVEN. PA ON SITEGEOLOGIST /ENGINEER •>• KASPER_______________ DRILLING CONTRACTOR EMPIRE SOILS INVESTIGATION____DRILLER _JQE JENSEN[-RILL CME 75___________ DRILLING WETH3L 3 3/4" I.D. H.S. AUGER [HILLING BATESURFACE ELEVATION _____557.46_______=______ STICK UP ELEVATION _____2.50__________________SCALE l"= _5j_VERTICAL
1
LITHOLOGY
SURFACELOOSE BLACK GRAVEL. FILL (GP)
MEDIUM STIFF TO STIFF BROWN SILTLITTLE CLAY, TRACE SAND (ML)
SOFT TO MEDIUM STIFF BROWN SILT,LITTLE CLAY (ML)
SOFT BROWN SILT, GRAY ANDSLACK STREAKS (ML)
SOFT BROWN SILTY SLUDGE, GRAYAND BLACK ZONES COMMON (ML)
LOOSE BROWN SAND. BLACK ZONESCOMMON (SW)
VERY LOOSE BROWN SAND (SW)
|
£i
Hife
m
'•'S-VS
UtPTH, FEE
T
mrt
-19.
SOlu SAMPLE
MBER
-1
I
3
.
t
6
PENE
TRATION
18
18
18
18
24
18RE
COVE
RY
1
1
f
i@
19
1
UJLL.
X*1-
lu
io4.5
6.07.5
TO5
12.013.5
.14,5
18.019.5
BLOWS/6'
4-4-4
2-3-5
?«**-.1/12*- 2 •
5-5-10
JJ?4-3-«-
1-2-2
1
o _
cn _
s$~?~
J*
t
BORI
NG-C
ASIN
GDI
AMET
ER,
INCH
ES
3 3/4" I.DHOLLOWSTEMAUGER
ROCKSAMPLE
cr
1
I
RFCO
VERY %
f*
«
oo:
t
_
I
i
WELL CONSTRUCTION DETAIL(NOT TO HORIZONTAL SCALE
I
',1' '•*'. CEMENT•'•'. '-4. -s- GROUT
3.0 ".. T'4
BENTONIT*~ "PELLET
6.0' ^ '
-o o' ^ 'h\;.:',:,: v'.V.'v:
• \ £i = P>>i 1 •V.'iS —— :.•$£• SAND PAC
^
## = :#K.
18.0' 17.85' gjj==i%|
il
2"0 SCH. 40 PVC PIPE — 9.65' SLOTTED SCREEN o.oi"W/BOTTOM CAP
31
IR300525
REMARKS
HNU = 5Opp-SURFACESAMPLE
HNUMBpprAT 12.0

TEST BORING Ns M ~ 2PROJECT NAMF DRAKE CHEMICAL______________ PROJECT N= _2I!flJl________ LOCATION LOCKHAVEN. PA GORHAM PROPERTYGEOLOGIST/ENGINEER •> KASPER________________ DRILLING CONTRACTOR EMPIRE SOILS INVESTIGATION nnil.i FR OOE OENSENDRILL CME 75______________DRILLING METHOD HOLLOW STEM AUSER DRILLING DATE 9-Z6/27-B3 nnngniMATFSSURFACE ELEVATION 554.50__________________ STICK UP ELEVATION 1-68______________________ SCALE l" = _5_VERTICAL
LITHOLOGY
SURFACEMEDIUM STIFF BROWN FINE SANDY SILT(ML) ——
LOOSE BROWN SILTY FINE SAND (SM)
VERY DENSE BROWN WEATHEREDSANDSTONE FRAGMENTS, IRON STAINED16.0' TO 16.5'
1
i
'
'
PROF
ILE
M•
"7 ^V:""''>'."
B:/;§;!;•m>-W ';K-::•-•;•>>:•:f-'-.-y-V,viv'vh"Vl-o'r"!; .••'•''.;/.','
$%§$$Itt? :Wv?
B•;;'j»g:.
BHi
DEPTH,
FEE
T16.0
SOIL SAMPLE
NUMB
ER
1
2
PENETRATION
( INCHES)
18
\
IB
6EC
OVER
YNC
HES
1
fr —
^
\
y '
€
UJUJu.i"
Q
10*T*e
cl5\g?5
•*-"2020.5
BLOWS/6"
'3-2-3
,.
•• I. 'V '-
J-4V-4 43' —— ***
50/5
S >-< UJ1 li-0 Jt- UJ< >t- UlV> _l
Kv.m^
\jjtfs-J
BORING-CASING
DIAM
ETER
,IN
CHES
6 1/4" I.DHOLLOWSTEMAUGER
<n t
j "
ROCKSAMPLE
2
o:
^
^-*
RECO
VERY %
=*J '
J>
QOC
r"
WELL CONSTRUCTION DETAILSI J(NOT TO HORIZONTAL SCALE) pHS-ARJ-
3$*. 'a.o'-
•*•\
,)2.0\
23.50'-
33.2O'
35.0' ———
•V.,* . 1
_"
, • *
s**
tt'-Y-:i "•:"'•
;&>'"•'•'.•'*
fe
$$Vv.;*;
X'j*;;j:
$.v.
•'•v'V'
*/*'*"••
iS
^: =z
1
|f
/•f
>j'.'.'
'•V,*.*
r•JA££?
||.;••'.*,'•'.>:/* -\;.&/•>;j!);1!C' -l"'*l'Ss?Its•!:.::';•;
»vs
II
—6 PROTECTIVESTEEL CASINGW/LOCKING CAPCEMENTGROUT
"SEAL
-SAND PACK
-4" PVC PIPESCHEDULE 40SLOTTEDSCREEN O.Ol"
-BOTTOM CAP
F
AR-300526.,
•
L

TEST BORING Na M ~ 3 BY kok DATE 10/13/83 CHK'DPROJECT NAME DRAKE CHEMICAL_______________ PROJECT NS 0710,12_______ LOCATION LOCK HAVEN, PA GORHAM PROPERTYGEOLOGIST/ENGINEER J. PRIEUR__________________DRILLING CONTRACTOR EMPIRE SOILS INVESTIGATION nRll I FR JOE JENSENDRILL CME 75__________DRILLING METHOD 6 'A'H.S. AUGER_____ DRILLING DATE 9/26/B3 nonRDINATES_________________SURFACE ELEVATION _____555.28___________________ STICK UP ELEVATION 1-57__________________________ SCALE l" = _SLvERTICAL .
LITHOLOGY
SURFACE
STIFF BROWN FINE SANDY SILT (ML)
VERY LOOSE LIGHT BROWN SILTYFINE SAND (SM)
DENSE BLACK COARSE SAND ANDFINE SRAVEL. SUBROUNDED.PETROLEUM ODOR (GP)
VERY DENSE BLACK AND BROWNCOARSE SAND AND FINE TO COARSEGRAVEL. SUBROUNDED (GW)
VERY DENSE BLACK SHALE
SHALE. BLACK WEATHERED /
PROFILE
1aiiiP
i11PP•wSRW'_Sfcc
___=
DEPTH, FEE
T
9.0
13.5
20.0
38.539.539.8
* SOIL SAMPLE
NUMB
ER
1
2
3
4
5
6
7
PENE
TRATION
( INC
HES )
18
18
18
18
5
2
4
ECOV
ERY
INCH
ES )
16
15
Ll12
5
o
4
u.
£UJQ
5.06.5
10.0MA,
15.016.5
-——
20.021.5
25.025.4
30.030.2
39.539.8
BLOWS/6"
3-4-6
\- c ^
6-15-16
""25-30-22
5OI.4
SOI. 2
501.3
STATIC WAT
ERLE
VEL,
FEE
T
DJ/7/8-
ORIN
G-CA
SING
IAME
TER,
NCHES
HOLLOWSTEMAUGER
." ' \
ROCKSAMPLE
ZD(E
f"
RECO
VERY %
pr«f3
3?0oQ:
i e=
WELL CONSTRUCTION DETAILS(NOT TO HORIZONTAL SCALE)
!ff*"'.. J
26.0-
31.0-
32.5-
< *
H • '
««!(•*•
1*£&Iijjij*,IPPii.n**.JSJP*
1j
<l~
=
- •— *
SE
H
*'*.
* I t
* 9
» »1
>*,*
/**I 41
•:v".-» fc- A
C4 4y,v•-»
^ r
*-..
:|'IS
'-'C-VwjU:
S
— 6"PROTECTIVESTEELCASINGW/ LOCKINGCAP
•4" PVCPIPESCHD. 40
CEMENT/BENTONITEGROUT
BENTONITE
SAND PACK
- 4" PVCSCREENSLOT SIZE
0.01
ftR3Q0527
REMARKS

TEST BORING N2 M~4 B> T M P DATE 10/13/83 CHK'C JPP DATE2-l7-fPROJECT NAME DRAKE CHEMICAL_________________ PRO.IFCT US 0710.12________ LOCATION EAST OF DRAKE CHEMICAL______________________"GEOLOGIST/ENGINEER J. PRIEUR_________________ DRILLING CONTRACTOR EMPIRE SOILS INVESTIGATION_____DRILLER JOE JENSEN__________________DRILL C^E 75________________ DRILLING METHOD 6^" H S AUGER_______ DRILLING DATE 9/9/83SURFACE ELEVATION 554.03_________________ STICK UP ELEVATION 312
LITHOLOGY
SURFACESTIFF BROWN FINE SANDY SILT, SOMECOBBLES (ML)STIFF BROWN FINE SANDY SILT (ML)
MEDIUM STIFF BROWN SILTY FINETO MEDIUM SAND. SUBANGULAR(SM)
HARD GRAY MEDIUM TO COARSE SAND,AND FINE TO COARSE GRAVEL, SOMEMEDIUM TO COARSE GRAINEDSANDSTONE FRAGMENTS (GW)
HARD SLACK SHALE FRAGMENTS ANDMEDIUM TO COARSE GRAINED __SANDSTONE FRAGMENTS ^^
PROF
ILE
" gS?e j
381mis•:£'.£.•.;Y...--'~:.'
i;7:x...)v:
;.;;.;,;):•;;
ipl
:;..3v:
IS-;".'.•£'•"••i£|— —
DEPTH,
FEE
T
30.0
SOIL SAMPLE
NUMB
ER
1
2
3
4
PENE
TRATION
( INC
HES)
18
RECOVERY
( IN
CHES
1
--
\\
13
i-UJ
Sx"c.UJQ
1 530
3.55.0
759.0
30.031.5
BLOWS/6"
3-5-4
2-4-5
4-3-2
* ""••
Jl.
V»
26-35-50
STATIC WAT
ERLE
VEL,
FEE
T
9Vr/t
BORING-CASING
DIAM
ETER
,INCHES
6iHOLLOWSTEMAUGER
-
V-
•
ROCKSAMPLE
z13EC
«
"__,
RECO
VERY %
^
<«*•
ii
sP(?
0oo:
r
WELL CONSTRUCTION DETAILS(NOT TO HORIZONTAL SCALE)
1 —— rr; —— LJ —————— '»*i>.vt * »J.
* * '
•Mtt " *
• 1N' 1 * "
:-'sS'
SiSi.!;Viji'-j;
28.0— ':>'.•).*
: ——
—»-
=——
=
=
h-,T »•
•I:1.-« *» » *
-VT*
•*» *
•***
_*_*
«•-
KS^:;£•/
If;:-\V,'.•l ;-;'"' . »'.V
PS :V
f :'/•'•'•'.•'.'••.'-." v-j.:Vr-
—6" PROTECTIVESTEEL CASINGW/LOCKINGCAP
— 4" PVC PIPESCHD 40
-CEMENT/BENTONITEGROUT
— BENTONITE
—SAND PACK
— 4" PVCSCREENSLOT SIZE0.01
— BOTTOM CAP
mREMARK:
^
B^ ^ F
0

TEST BORING Ns M-5 BY_I»L_DATE IO/20/83_CHK'D.PROJECT NAME DRAKE CHEMICAL____________ PROJECT N2 0710-12________ LOCATION LOCK HAVEN. PA ON-SITE_________GEOLOGIST/ENGINEER J. PRIEUR___________________ DRILLING CONTRACTOR EMPIRE SOILS INVESTIGATION______DRILLER BILL SKURADRILL ACKER ADg__________ DRILLING METHOD 6I/4"H.S. AUGER DRILLING DATE _9_ 1ZZ§2__ COORDINATES______________SURFACE ELEVATION 557.08____________________ STICK UP ELEVATION 2 36__________________________SCALE l"= _5l_VERTICA
LITHOLOGY
SURFACERED SLUDGE AND FILL
LOOSE BLACK FILL, WOOD
STIFF 8ROWN MEDIUM FINE SANDY SILT(ML) ——
LOOSE BLACK AND BROWN SILTY FINETO MEDIUM SAND (SM)
LOOSE BLACK REDDISH GRAY FINE TOMEDIUM GRAINED SAND, SUBANGULARTO SUBROUNDED (SW)
UJ
§
HI
litHH!v'.*v;//.;
ilvV&v'
DEPT
H, FEET
2.0
SOIL SAMPLE
NUMB
ER
1
2
3
4
PENETRATION
( INC
HES )
18
18
18
18
RECO
VERY
(INC
HES )
1
10
12
II
i-UJUJu.
aUJO
5,06 5
iS#"i l l 5
\15016.5
20.021.5
BLOWS/6'
1-2-3
f**"2% -4
1-3-2
5-3-7
STATIC WATE
LEVE
L, FEE
T
1S%&
S=
.. "
BORI
NG-C
ASIN
GDI
AMET
ER,
INCHES
6 1/4" 1.0.HOLLOWSTEMAUGER
f*
ROCKSAMPL
Ztr RE
COVE
RY %
r
s?a0IT
"
WELL CONSTRUCTION DETAILS(NOT TO HORIZONTAL SCALE)
. • -4 PROTECTIVE• . ' STEEL CASING', ; . W/LOCKING CAP
l ,— 2" PVC PIPEV SCHD 40
^ ** \ -CEMENT/v i**. BENTONITE/'•" *t GROUT
10.0- - —
„. ,- »•— BENTONITE
13.5- 7— 77
:;•••: ———— '...;"V *"— SAND PACK':;:'; ————— :?)
".• '. > —— ; — 2 PVC SCREEN
' I?'
REMARKS

TEST BORING N2PHOJFCT NAME DRAKE CHEMICAL PROJECT NS 0710.12
i
iiiRFarF Fi FvATinw 556 93
LITHOLOGY
SURFACE
FILL
SOFT TO MEDIUM STIFF BLACK FINESANDY SILT, SOME FINE GRAVEL.WET(ML)
MEDIUM STIFF BROWN FINE SANDYSILT. TRACE CLAY, MOIST (ML)
VERY LOOSE BROWN SILTY FINESAND, WET (SM)
LLING METH
UJ
U.
iQ.
11
Wm.nnt*£IBm;.
UJUJ
It-O_UJO
-21.5
nn HOLLCILLING COW STEM AU
M-6LOCATION
1
BYLOCK
'Ih DATE O/20/83 CHK'D DATEHAVEN. PA ON- SITE
jTpAi-TnH EMPIRE SOILS INVESTIGATION nRll i FR BILL SKURAGER nRI
STIHK IIP FI FVATIOM
SOIL SAMPLE
NUMB
ER
1
2
3
4
PENETRATION!
( INC
HES )
18
IB
18
18
RECO
VERY
( INCHES )
16
14
^
*
15
UJ
u.
0-UJQ
s_a65
100II 5X
16~S
20.021,5
BLOWS/6"
3-2-2
jt2-3 4 .
2-2-2
2-2-2
LLING DATE 9 /27/S3 rnnt1 59
STATIC WATER
LEVE
L, FEET
10/783
V** i
is
BORING-CASI
DIAMETER,
INCH
ES
6 1/4" I.DHOLLOWSTEMAUGER
Af
ROCKSAMPLE
zK
<
/•
RECOVERY %
^
0
5?o0K
0
mwiTFScr-«i r i"; 5' UCOTII-AI ^^_
WELL CONSTRUCTION DETAILS(NOT TO HORIZONTAL SCALE)
' ' '11—4" PROTECTIVE1 *« «' STEEL CASING,•• ; W/LOCKINGCAP
i ','• )A— CEMENT/,'• BENTONITE
iv * Jj' *." GROUT
II' f^ — 2" PVC PIPE>». r..' SCHO 40
»> — BENTONITE
130- n^r TT¥;•; >|ii — SAND PACK
'& ——— &'••/.. Z^E-rtt— 2"PVC SCREEN
^— BOTTOM CAP
REMARK;
^^
_^
VIOLENT BUBBLING IN BOREHOLE
^H
^B
FOR 10 MINUTES AFTER PLACEMENT
^^
^^V
OF SCREEN AND SAND NO READING
^^^
ON H
NII OR F
XPI OSIMFTFR

TEST BORING N2PROJECT NAME DRAKE CHEMICAL PROJECT N2 07IO.I2RCTII nnisT /FuniNFFR J. PRIEUR npn i iwn r.nwTRA^TnHnpn i ACKER AD tt ntSURFACE ELEVATION 557.42
LITHOLOGY
SURFACE
FILL AND BOULDERS
FILL .WOOD. BRICKS
SOFT BLACK CLAYEY SILT .TRACEFINE SAND (ML)
STIFF BLACK FINE SANDY SILT,IRON COLOR, MOTTLING(ML)
MEDIUM STIFF BROWN MOTTLEDFINE SANDY SILT (ML)
MEDIUM STIFF BLACK MOTTLEDFINE SANDY SILT (ML)
(ILLlNG METH
PROF
ILE
m8&;~- ^
Sil
1W|
MDE
PTH,
FEE
T
2.0
5.0
8.0
13.0
17.0
21.5
nn HOLLOW STEM AUGER P.BSTICK UP El FVATION
SOIL SAMPLE
NUMBER
1
2
3
4
ENE TRATION
NCHES)
o-_
18
18
18
18
RECO
VERY
1 IN
CHES
)
12
14
9
13
i-UJ
i"c.UJQ
5.06.5
10.011.5
15.016.5
20.021.5
BLOWS/6"
2-1-2
1-4-5
\6-6-7\
i
3-3-4
M-7LOCATION
BY KAK DATE 10/19/83 CHK'C DATELOCK HAVEN , PA ON- SITE
EMPIRE SOILS INVESTIGATION nRM i FH BILL SKURALLING DATE 9/27/83 pnn2.50
STATIC WAT
ERLE
VEL, FEET
10/7/8V
"»=*•*
r-~
DRIN
G-CA
SING
AMETER,
CHES
m a±
SIA"|.D.HOLLOWSTEMAUGER
ROCKSAMPLE
2cr
(*
RECO
VERY %
r
5?Qocr
f*$
1
SCALE l"= 5' VERTICAL
WELL CONSTRUCTION DETAILS(NOT TO HORIZONTAL SCALE)
4"PROTECT- " • V .'IVE CASING 1". '. .' .
CAP ——— - .. . * « CEMENTV.' !•• -GROUT*4 * i > '
ff^ V» -BENTONITE
'&!: ———— __| SAND':'.!& ———— SP;"PACK•m—±m
pjZ* ...•.'•-• :•"'-•-•i'w ——— S'K'S 2" PVC::•.;•;••. —— fat *r*- SCREEN
i.\V .«•••; SLOT
^-BOTTOM CAP
ll'•5
8300531
REMARK.

••i •• ••• •
TEST BORING N2PRn ,prr K)«MF DRAKE CHEMICAL PROJECT NS 0710.12
r-,iL CME 75 . DRSLRFACE ELEVATION 555.72 ———
LITHOLOGY
SURFACE
SOME FILL (GP)
WHITE SLUDGE. SOFT
LOOSE BROWN FINE SAND. SOME SILT,BLACK ZONES COMMON (SM)
L.JNG METH
PROFILE
^ Sm
1LITTLE SILT (SM) EMMwasVERY LOOSE BLACK FINE TO MEDIUMSAND (SW)
DENSE TO VERY DENSE LIGHT GRAYAND BROWN WEATHERED SANDSTONEFRAGMENTS
£•&'•>:;.
118?,.'.:v..:;
DEPTH, FEE!
5.0
8.0
nr H.S.ILLlNG C0!<AUGER
M-8
•
Br... LOCATION LOCK
KAK niTE 10/21/83 CHK'C DATEHAVEN, PA ON-S1TE
TRACTOR EMPIRE SOILS INVESTIGATION npn i FH J.JENSENr h i l l 1MB r.ATF 9/15/83 r-,ni:
STICK IIP El FVATIOK
SOIL SAMPLE
NUMB
ER
1
2
3
4
5
6
PENE
TRATION;
( INC
HES )
18
18
18
18
18
18RE
COVE
RY1 INCHES
1
18
12
14
*V
18
18
UJu.
x"
Q
3.04.5
6.07.5
9.0ToT
**=*Iz.o
15.016.5
•x
19.5
BLOWS/6"
1-2-2
1-3-2
,/ia11-r -
2-2-2
30-22-23
23-43-50
2.59
STATIC WATER
LEVE
L, FEE
T
O
BORI
NG-C
ASI
DIAM
ETER
,IN
CHES
33»" I.D,HOLJ-OWSTEMAUGER
ROCKSAMPLE
tr RFCO
VtRY %
^
' '*;
0
0oCE
^
£>.
niNiTFS
SCALE l": 5' VERTIC-.AI
WELL CONSTRUCTION DETAILS(NOT TO HORIZONTAL SCALE)
———— ,_ ———— -.1—1, ———————'. »- PROTECTIVESTEEL CASING.' '< TLOCK•W -CEMENT GROUT
4,0-'—— ——
^^ J«-- BENTONITEff^ ^ SEAL
7.0- -, T T
7.9- -S ———— V'ii1
'\M — if-'.' ———— .'•':"......" ' : ••;•.'.•. —— v.v...•'.';'• '..'. L
•:.•;.•'. ———— «S-f--2" PVC PIPE
•:•;.;.•• •:•:•:-• SCREEN
——— BOTTOM CAP
1/300532
•REMARK:
•

TEST BORING N*PROJFRT NAME DRAKE CHEMICAL . . . PROJECT N3 071012
SURFACE ELEVATION 559,08
LITHOLOGY
SURFACESOFT BROWN CLAYEY SILT, TRACE FINESAND (ML)
HARD BROWN CLAYEY SILT , SOMEFINE SAND (ML)
LOOSE BROWN SILTY FINE TOMEDIUM SAND TRACE CLAY (SM)
MEDIUM DENSE BROWN SILTY FINETO MEDIUM SAND (SM)
i
?II_L.ING VET^
PROF
ILE
ipSPS
B••S 12g & ;
DEPT
H, FEE
T
\«, •*
1>.\-
nr HOLLORILLING CONTRACTOR* STEM AUGER nR
STICK UP ELEVATION
SOIL SAMPLE
NUMB
ER
1
2
3
4
PENE
TRATION
( INC
HES )
18
Jj
IS
18
RECO
VERY
(INC
HES
I
12
Tf
\
\
14
t—
UJb.
_£
a
5.06.5
-SOiTs
15.0TT5f
m
BLOWS/6'
2-2-2
10-25-15
'-sV*
9-15-7
M-9LOCATION LOCK
BY JMS DAT=- 1 /23/B4 CHK'L DATEHAVEN . PA . CITY PARK - UP GRADIENT
EMPIRE SOILS INVESTIGATION nnn . CD BILL SKURALLING DATE 9/2B/83 rnn
212 :
STATIC WATE
LEVE
L, FEE
T
0/l7,flj
,*
ff*
-
BORI
NG-C
ASIN
GDI
AMET
ER,
INCH
ES
6'A" IDHOLLOWSTEMAUGER
+c\
>"*•
ROCKSAMPLE
ZIDcr
***"
'•j
RECO
VERY %
<•*'
^
o-°Q0tr
A:
SCALF l": 5' VERTICAL
WELL CONSTRUCTION DETAILS(NOT TO HORIZONTAL SCALE)
'' .' 1 6" PROTECTIVE' ' «", STEEL CASING V\> *• LOCKING CAP
£; >V CEMENT!-, & ~~ BENTONITEr' '•• GROUT
50_ .1 li
•' * *" ~BENTONITE
." 10 'O ;':-: '-'3* T' -=-.-;duffii:...'.; __ [."i'•iri —— ';* - SAND
•.:;•: ——— '••$ 4" PVC SCREEN•!?• __«*rT~SLOT SEE QOI "
•.••:••• [:•'•>?nn •:•:;. ==_,,--:i
^ — BOTTOM CAP
$i-it
?3ff0533
REMARKS

B .-' . nW Bsr ^••••••••••••••••MM
TEST BORING N2PRn.lFr-T NAME DRAKE CHEMICAL PROJECT N2 071012
SI RFACE ELEVATION 56009
LITHOLOGY
SURFACE
LOOSE TO MEDIUM DENSE BLACK 1j GRAVEL 8 FILL, SOME SAND (GP)i |
LLING METH
PROF
ILE
mSTIFF GRAY BROWN MOTTLED CLAYEYK? ,SILT, TRACE OF SAND (ML) feS;?—— p£MEDIUM DENSE BLACK GRAVEL aFILL (GP) j
MEDIUM STIFF GRAY BROWN MOTTLEDCLAYEY SILT, BLACK ZONES THROUGH-OUT (ML)
MEDIUM STIFF GRAY BROWN MOTTLEDSILTY CLAY (ML)
LOOSE GRAY SAND, LITTLE SILT(SM)
MEDIUM DENSE WHITE TO GRAYWEATHERED SANDSTONE FRAGMENTS,STAINED GREEN ZONES COMMON
CLAYSTONE , GRAY, WEATHERED
SHALE., BLACK, WEATHERED _/
lt
1
1
'jzf,
->>I
5S
• s
R»2C
s$
UJUJ
l"1-Q.
0
2 5
8 0
120
18 0
2 5
34.0
in HOLLOVILLlNG COhV STEM AU
M-IO BY JMS DATE IO/J6/83 CHK'C DATELOCATION LOCKHAVEN .PA AC 8 C PROPERTY
TRACTOR EMPIRE SOILS INVESTIGATION nt3ER riRi
STICK UP ELEVATION
SOIL SAMPLE
NUMB
ER
1
2
3
4
5
6
7
ENETRATION
INCH
ES )
18
18
18
18
18
18
18
5
RECO
VERY
( INCHES )
10
14
*f
\
6
10
9
9
5
UJUJ
3Lc.o
TT
Tff
V
%$'V"
M
30.0
35.0
4O.4
BLOWS/6"
2-6-6
10-7-9
T! ~
1-3-2
(> -4
2-2-3
17-17-9
4-9-16
5O/4
LLING DATE 9/I4/B3 r.nnpniKjaTF254
STATIC WAT
ERLE
VEL,
FEE
T
0-3-83V
'.• %
o
BORI
NG-C
ASI
DIAM
ETER
,IN
CHES
3 V4 1 0.HOLLOWSTEMAUGER
^\
*
ROCKSAMPLE
zcr
X
RECO
VERY %
^
t>>
ooK
S
>
U
ILL FH JOE JENSEN
SCALE I"=JL_ VERTICAL .^^
WELL CONSTRUCTION DETAILS(NOT TO HORIZONTAL SCALE)
', i1
\
200
225-
24 8-
347-
40,04O4
.3(
:* «1 9
v« 11*'* »*P
h *, 4* ¥f
y
'»
* «»*
ii.
i
«-
———
:=
———
==
* «r *
«c* *4 ,
1 •» <
. **
' T
t\
*
^
"o i— I?
)5
r-
3
4" PROTECTIVESTEEL CASING 'VLOCKING CAP
2"0 PVC RPE"SCHEDULE 40
CEMENT- BENTONITEGROUT
- BENTONITE
-SAND PACK
L2"0 PVC SCREENSCHEDULE 40SLOTTED o.oi
Ii
9REMARKS
L

TEST BORING N2PROJFCT NAME DRAKE CHEMICAL PROJECTNS 0710,12
SURFACE ELEVATION 549,05
LITHOLOGY
SURFACELOOSE BROWN SILTY FINE SAND,TRACE CLAY (SM)
STIFF BROWN STLTY CLAY, TRACEFINE SAND, DRY (CLl ———
VERY STIFF CLAYEY SILT. SOMEFINE SAND, MOIST (ML)
LOOSE BROWN SILTY FINE TOMEDIUM SAND. TRACE CLAY(SM)
MEDIUM DENSE BROWN AND GRAYMEDIUM TO COURSE SAND, SOMEGRAVEL, SUBANGULAR (SW)
VERY DENSE BROWN COARSE SANDAND FINE TO COARSE GRAVEL ( GW1
ILLlNG METH
PROF
ILE
-9.0
DEPTH, FEE
T
nn HOLLORILLING COW STEM AU
NTRACTORGER nR
mm mm •
M-IIALOCATION
m mm
RY BC DATE 10-25-83 CHK'D DATELOCKHAVEN.PA LEACHATE STREAM
EMPIRE SOILS INVEST GATION nRII I INK nATF 9-7-83
STICK IIP Fl FVATIOM 2,78
SOIL SAMPLE
NUMB
ER
1
2
3
4
5
'«
PENETRATION
( I
NCHE
S )
18
18
18
18
18
6
ECOV
ERY
NCHES )
ir—
16
14
16
\8
10
6
LUUJU.
x~0.UJQ
3 04 5
5.57.0
9.5II. 0
-——
?"•I5.O16,5
W20.021.5
30.0
BLOWS/6"
3-4-5
' 5-8-9
2-2_>
J<
5-6-7
^
11-13-14
50/.5
STATIC WATER
LEVE
L, FEET
"V10/7/8.^
r*>
ORIN
G-CA
SING
AMET
ER,
J.CHES
6 1/4" I DHOLLOWSTEMAUGER
r,.*•*
COORDINATESS
ROCKSAMPL
z3(T
r
fft
RECO
VERY %
^
i*
5?0ocr
«r
j»
fi
LLER JOE JENSEN
SALE "'- 5' VERTICAL
WELL CONSTRUCTION DETAILS(NOT TO HORIZONTAL SCALE)
:i
\V
14,0- B
16.0 r
18.0- T
'•,
;':'
28.O- j
30.0- "
*t
»f
»
(r* >*.
•I
'•', -. -n.-:l':£$;£
i f
»•'4 '
„-p »k »4 '
<?»J. .
* »
•1 *
•«
W-
'?'.•'
vi
v'/'•'•';'
i
-4" PROTECTIVESTEEL CASING W/LOCKING CAP
CEMENT/BENTONITEGROUT
• 2"PVC PIPE SCHD.4
—BENTONITE
— SAND PACK
_2"PVC SCREENSLOT SIZE O.Ol"
-BOTTOM CAP
||
R3&053S
REMARKS

TEST BORING Ns M - I I B BY TM.P. DATE n-23-83 CHK'CPROJECT NAME DRAKE CHEMICAL_________________PROJECT N2 0710.12_________ LOCATION LOCK HAVEN. PA LEACHATE STREAMGEOLOGIST/ENGINEER J. PRIEUR_______________ DRILLING CONTRACTOR EMPIRE SOILS INVESTIGATION n m i i F R JOE JENSENDRILL ______C M E 75________.DRILLING METHOD HOLLOW STEM AUGER DRILLING DATE 9-7-83 COORDINATES-
SURFACE ELEVATION ________549.22____________ STICK UP ELEVATION 1.51_______________________SCALE l"= _£_VERTICAL
LITHOLOGY
SURFACE
LOOSE BROWN SILTY FINE SANDTRACE CLAY (SM) ————
STIFF BROWN SILTY CLAY , TRACEFINE SAND, DRY (CD ————
VERY STIFF CLAYEY SILT, SOMEFINE SAND, MOIST (ML)
LOOSE BROWN SILTY FINE TO
MEDIUM DENSE BROWN AND GRAYMEDIUM TO COARSE SAND, SOMEGRAVEL, SUBANGULAR ( SW) /
L, ._
PROFILE
5.0
15.0
DEPTH,
FEE
T
SOlu SAMPLE
NUMB
ER
ENET
RATI
ONIN
CHES )
u. -*.
ECOV
ERY
INCH
ES )
r
t-
UJu.
r"h-
Q
*-**TC'
W-
BLOWS/6"
NOSAMPLESTAKEN
r
STATIC WAT
ERLE
VEL,
FEE
T
O
ORING-CASI
IAME
TER,
NCHES
61/4 1.0HOLLOWSTEMAUGER
ROCKSAMPLE
z13cr
f
^
RECO
VERY %
***
£
\
3?
0
\
WELL CONSTRUCTION DETAILS(NOT TO HORIZONTAL SCALE)
J 1ft* IV — 4"PROTECTIV•V •]• STEEL CASINGJ. '.,', WITH LOCKING>•• ... CAP
'«•' IV — CEMENT/4.0 -—— •—— • BENTONITE
GROUTH — BENTONITE
6.0-;—— T7—
__.-••• *"X' "&T- — 2" PVC PIPE"° J 7'-: SCHD 40
•V"1 ———— .'•;ji — SANDPACK
'<: '$fc\ ' j-' i- g" PVC SCREE
L m —— BOTTOM CAP
1
• c
9REMARK
N
•
•

TEST BORING N2 _ 12 A_ _ ;._BC .-- ji j-js.;-, _ ._..pan.,FCT'NAME ' DRAKE CHEMICAL _ _______ Ik-^El' N8 '0710 12 ____ ___ LOCATION' Lp"C».HAVEN, PA ..EACHATE STREAM ___ _GEOLOGIST /ENGINEER J "RIEUR_____._____________ CR.—.i'ilG CCA-IAl-CR EMPIRE SOILS INVESTIGATION ' nfc...FB JOE JENSEN 'TRILu CME 7B . _ . . _ . . rpi .>,-. VE.'-:. JHOLLpW STEMAUGER_ iht... .... vATg .9/8/83 - :C 3Of.^lN£"ESr" _ __________ _ _ „<!l CFAfTF Fi FiaTIOM 552 13 _____ __; _ _,_ STlCn L^ Ei.Ev4T10*. _£_;' _._______________i_________ SCi^i l'= 5 VERTiCAl
LITHOLOGY
SURFACEMEDIUM ST-PT BROWN r INE SANDYS.L.T, TRACE CLAY (MLJ
S'iFF BROWN CLAYEY SILT, SOME '
SILT. TRACE CLAY (ML)
LOOSE BROWN SILTY FINE TOMEDIUM SAND CSM)
VERY DENSE GRAY MEDIUM TO COARSESAND AND FINE TO COARSE GRAVEL,UNSORTED, SU8ROUNDED(GW)
Lu_J
o(EC_
-?> .-J
rzf- ,*=%3s_;
vSy?J:
••:•'.• .-'.;'i-v
': ...,'--.,..i
H
•.£;;•:;:•\;'.'.-.-':\'"'''.'•; .''.•'.'•''.-';•: f-f:i'-•:¥•$£">';
yjji&j.ig
S-S''**m
1 LHIH,
FtET
130
31.5
30'. CiVP. E..
MMUH1
:
2
4
5
PENE
TRAT
ION
( I
NCHF
S )
18
1
18
18
HICO
VEKY
\ li
KHCE
1
U-
— Bu DWS ""S"
,7
^
\V\
18
5 570
9 0
•""*
15.0
W-'
2 - 3 - 4
2. ^If 1* ^
^ '
15-20-32v>
^
30,031 5
!:-
BORI
NG-C
ASIN
GO'AMl
TtR;
INCH
ES
6-j-" IDHOLLOW
AUGER
IO/T/ C
^ ——
;
•
1
i
50-25-27J
t
?
RCCKSAVO_E
t
--
^. 4 1
-"
^
f*
^
a
Otc
WF^L CONSTRUCTION DETAILS(NOT TO HORIZONTAL SCALE1
1 —————— 1
1
1 ""J
_,
*oV\ ;"'
» » '
» _*
.»*•".* •\Jtv"
J
1
i
i
''•',•'• '-'•'.':!'••••:'=:'i->1.'.".'
=
« — Im3r——==
^^ n
/h*»\".
r t*
. r .
*,, fc.
*•——
;*;'
!fr;'
.REMARK!.
-4 PROTECTIVESTEEL CASING ,
CAP
- CEMENT/
GROUT
SCHD 40
-BENTONITE
-2" PVC SCREESLOT SIZE001"
-BOTTOM CAP
.»•R 30H537

TEST BORING N9 I2B DATE _Pf<0»ECT NAME DRAKE CHEMICAL__________________ PROJECT N2 071013_____ ^ LOCATION LOCKHAVEN. PA LEACHATE STREAM _«t?L3GIST /ENGINEER J PRIEUR___________________ DRILLING CONTRACTOR EMPIRE SOILS INVESTICiiTiCN______ORiLuER JOE JENSIMTR''L- CME 75 ______________PHIL-INS I/ETHCC HOLLOW STEV AUGER _ [.KILLING CAT£ _9/8,/83_ COORDINATES_________________Si_firiCE ELEVATION 552-37_________[_____STICK UP E.EVATION 09°__________;________ISCALE >"-- $'
LITHOLOGY
SURFACEMEDIUM STIFF BROWN FINE SANDYSILT, TRACE CLAY (ML)
s-r- BSCWN CLAYE» SILT. SOMEFINE SAND (ML)
MEDIUM STIFF BROWN FINE SANDYSILT, TRACE CLAY (ML)
LOOSE BROWN SILTY FINE TOMEDIUM SAND (SM)
VERY DENSE GRAY MEDIUM TOCOARSE SAND AND FINE TO COARSE
(GW)
PROF
ILE
*f$l
fft•~*04
•£-'&•--ff:
•'&yK•;S?SK;&$®?ffS/f;/••'/#;':::>•.'.;;:•'.•;•.;.vf..;.::.,:
%&&.'.':•..••'•"•;
,#*$•
HiB
1
DEPTH,
FEE
T
20
'
130
50.- SAVP..E
NUMB
ER
•
PEHF
TRA
TIOM
( INC
HFS )
WJ
RtCO
VlRY
1 INCHES
1
-"**
LU
,
^
PLDViS/6"
NOSAMPLESTAKE NSEESORINGI2A „.--••
k _
,.--•
STATIC WATER
LEVEL, FEET
'
JO/7/83
M=
BORI
NG-C
ASIN
GOl
AMf TE
R,IN
CHES
6J-" l DHOLLOW,.
"ZfUGER
t•
RGCK.SAMP-E
zZ! T!
!"COvrRY%
-•«*
1
Oo:
11
J
fl
iWELL CONSTRUCTION DETAILS(NOT TO HORIZONTAL SCALE)
j >'.j.1 ~r-, — 4 PROTECTIVEV» « • STEEL CASING»«? •*." W/LOCKINGS " « • * CAP•">' •'•* — CEMENT/t ! ! ".". BENTONITE• V V." GROUT
--—BENTONITE
=== -«-L — SAND PACK
•"'.•.. ' .''•
••• •'•':• =3E- -i — 2" PVC SCREEN:".-: ': —— '• •:•: SLOT SIZES'-.';;;' = :..-..•': 001"
15.6 :• ••••••< ——— - -' —————— BOTTOM
CAP
1
1
•-•;
8300538
9REMARK
»

TEST BORING N2 M- 13 B. TMP OA^ 11/3/33 ,-.»*-, ___„_•,_.PROJECT NAME ______DRAKE CHE'MICAL___________ PRO.IFCTNS 0710.12 ___ LOCATION LOCK HAVEN . PA_____LEACHATE STREAM_______GEOLOGIST/ENGINEER _^L_f-SiiiL5________________ DRILLING CONTRACTOR EMPIRE SOILS INVESTIGATION np.liFR JOE JENSEN___________CHILL C M E 75_________-ORI--INS METH3L HOLLOW STEM AUGER CftlLLINr. GATE _2/22/83_ COORDINATES-SLRFACE ELEVATION 551 19________________. STICK UP SLJTVA7ION ' 56________________._________SCALE l"=_£_VERT ~i.
LITHOLOGY
SURFACESTIFF BROWN CLAYEY SILT,TRACEFINE SAND (ML)
MEDIUM DENSE BROWN SILTY FINETO MEDIUM SAND (SM)
MEDIUM DENSE TO DENSE BROWNAND GRAY COARSE SAND AND GRAVEL(GW)
PROF
ILE
KHi
i«
i?ilKSSS
MEDIUM DENSE GRAY MEDIUM -GRAINED SANDSTONE FRAGMENTS,SOME COARSE SAND, TRACEFINE GRAVEL
; • V .';".'.' .
DEPTH, FEET
-23,5
SOI- SAMPLE
NUMB
ER
1
2
3
4
5
6
ENE TRAT10N
INCH
ES )
~~
18
18
18
18
IS
18
ECOV
ERY
INCH
ES 1
18
18
17
15
16
15
LjJ
U.
304 5
55To"
9.0105
15.3-1
\
20.0.21.5
~26~5
3-OWS/6"
4 -4- 7
4-6-9
12-15-26
f"
17-8-15
7-6-14
5-6-12
STATIC W
ATER
LEVEL,
FEET
10/7/83Jg_
^
_i»
1
ORIN
G-CA
SING
lAME
Tf R,
NCHE
S
—61/4 IDHOLLOASTEMAUGER
r*
-_. *******
POCKSAMP^E
Zc.
•
RFCOVTHT %
QOtE
,**
f
WELL CONSTRUCTION DE^A -;(NOT TO HORIZONTAL SCALE
9.0-
12,0-
25.0
1 ——— 1 ———I
*!<•Ju.
**"
vV-v
•~_£~——
;V&£ ••
|i* D^ftfJC
.f- —— -»"PROTECTIVrl. STEEL CASIN,*.' WITH LOCKIN
•\* — CEMENT-BE\"j. GROUT
•fr — 2" PVC OIPE. •_ SCHEDULE 4
f« —— SENTONITE
v:f» —— SAND PACK
i«£ — 2" PVC PIPE:.-,v SCHEDULE 4•:.;.•: SLOTTED scV:.. SLOT SIZE o
.'V'.'
———— BOTTOM CAP
*5Q
REMARK
>G CAP
TOMTE
0
HEN

TEST BORING N5 M -14 BY MS JATE »M/83 CHK'C ___DATE.PROJECT NAME DRAKE CHEMICAL______________ PROJECT N« 071012________ LOCATION LOCKHAVEN .PA LEACHATE STREAM _______GEOLOGIST/ENGINEER J PRIEUR__________________DRILLING CONTRACTOR EMPIRE SOI'-S INVESTIGATION_____DRILLER JOE JENSEN__________DRILL —CME 75___________DRILLING METHOD HOLLOW STEM AUGER DRILLING DATE .§/22/S3__ COORDINATES________________________SURFACE ELEVATION 551 28__________________ STICK UP ELEVATION 241_____________\_________ SCALE I" = _5j_VERTICAL
LITHOLOGY
SURFACESTIFF BROWN FINE SANDY SILT (ML)
LOOSE BROWN SLTY FINE SAND(SM)
VERY LOOSE GRAY MEDIUM TOCOARSE SAND , SOME SIT, SANDSUBROUNDEtT" (SM)
DENSE COARSE SAND AND FINE TOCOARSE GRAVEL (GW)
VERY DENSE COARSE SAND ANDFINE GRAVEL. PETROLEUMOOOR (GW)
•-
PROFILE
Sfis58S§j9*"i_*aipr®?:
iH
11gp?«
UJUJu.l"1-Q.UJO
5,0
80
ISO
200
240
SOIL SAMPLE
NUMB
ER
1
2
3
4
5
PENE
TRATION
( INCHES )
18
18
18
18
II
RECO
VERY
( INC
HES )
18
18
16
15
10
i-UJUJu.
x"u*Q
3 Q
•Vo-
M
<&5
20%\
•MH M
BLOWS/6"
4-5-6
2-3-3
1-2-1
20-20-24
24-5O/.4
^
y ST
ATIC WAT
ER-EVEl. , FEE
T
(0/7/83
o
BORI
NG-C
ASI
DIAM
ETER
,INCHES
6.fc" 1 DHOLLOWSTEWAUGER
OCK SAMPLE
Z(r
^MM
RECO
VFRY %
r-*
m^m
ao<£
WELL CONSTRUCTION DETAILS(NOT TO HORIZONTAL SCALE)
• 1 • '•'S-' *' PROTECTIVE»'» •/. STEEL CASING** ". .J ",'LOCKNG CAP
.*•! •!•* */ - • ', CEMENT« . 1*^ -BENTONITE.*, «J,' GROUT
1* -BENTONITE
-<r ': :J,4f.f*~^ ':VC T«_ •••' • -- _ 2 PVC PIPE
iivS H SCHEDULE 4O
?i v ' —— '.il£-SAND PACK
'$•?.'• —— iy i: 2" PVC SCREENf.ffl-;. —— )»i - -SLOT SIZEn;;j;v ;_;_; ;;;:;;;; OOl'
^- — BOTTOM CAP
• Q * tl ti *^ If fi; t\ %J y |j/ / *7< \J
9REMARKS
BACKGROUNDHNUREADINGS
•

TEST BORING Ns M~I5 BV 1.01. DATE 11/23/33 oVc __DATE.PROJECT NAME DRAKE CHEMICAL_________,_______ PROJ-ECT NS 07IO.I2_________ LOCATION LOCK HAVEN . PA____PHASE H_________________GEOLOGIST/ENGINEER J.PRIEUR________________'__ DRILLING CONTRACTOR EMPIRE SOILS INVESTIGATION npn , FH JOE JENSEN________________DRILL CME 75_______________DRILUNG METHOD HOLLOW STEM AUGER DRILLING DATE 9/2I/B3SURFACE ELEVATION 552.43____________________ STICK: UP ELEVATION 2,40'___________. _________SCALE l" = _§LvERTICAL
LITHOLOGY
SURFACESTIFF BROWN SILT. SOME FINE"SAND (ML)
VERY DENSE YELLOWISH BROWNCOARSE SAND AND FINE GRAVEL,SOME SILT (GP-GM)
VERY DENSE BROWN FINE TOCOARSE GRAVEL. SOME MEDIUMGRAINED SANDSTONE FRAGMENTS,LITTLE COARSE SAND (GW)
PROF
ILE
msitIFgg
jS& Bk
IP*
ft
Ht&6IP8P
DEPTH,
FEE
T
36.4
SOIL SAMPCE
NUMB
ER
1
2
3
4
5
6
PENE
TRATION
( I
NCHE
S )
18
6
18
12
18
17
RECO
VERY
( INC
HES )
18
4
r
10
16
15
ulu.
ujQ
5.06.5
10.010.5
JflfFieT
' 20.0
21.0
25.026.5
36.4
BLOWS/6
3-4-6
501.5
20-3O-43
75-501.5
35-30-30
I5-40-5OI
o _
Is
10/7/8.V
0=,
»«<*
BORI
NG-C
ASIN
GDI
AMET
ER,
INCH
ES
6 1/4" I.DHOLLOWSTEMAUGER
ROCKSAMPu
zo:
r
•_•
RECO
VERY %
«*•
i*
s?Oao;
\
\**
i*i
WELL CONSTRUCTION DETAILS(NOT TO HORIZONTAL SCALE)
8.0-
(*«*
21.5 -
»i «
f **
lr-r?ri
§1
(«-
———
Zfe
zzn———
=z—
ttt-s"* - '. PJO CTivV* CASING•JV W/LOCKIN
»VJ CEMENT/•".I BENTONIT;;': GROUT
1 BENTONIT
idi': !'.i/i;l 4" PVC..'"'•j PIPE•:;..;...',;] SCHD. 40
:''-. •;/.•! SAND;.;'..:j'; PACK
rr- 7 -4" PVCv'.\..;: SCREEN.•'VV: SLOT SIZ•;•'••.•••.••. o.oi
' — BOTTOM CAP
REMARK1

PRO.IFCT NAME DRAKE CHEMICAL PROJECT NS 071012 LOCATION
enurarr pi NATION 549.87
LITHOLOGY
SURFACEMIXED FILL , RAILROAD TIES , Be.
VERY LOOSE TO LOOSE BROWN , FINETO MEDIUM SAND, LITTLE SILT (SM)
MEDIUM DENSE TO DENSE LIGHT GRAY,MEDIUM TO COARSE GRAINED SAND-STONE FRAGMENTS , SUBANGULAR TOSUBROUNDED
SHALE. DARK GRAY. HIGHLY WEATH-
LulNG METH
PROFILE
8
fi
Hi
—
UJUJu.
0.
20
150
32.5
36.5
-in HOLLOWILLlNG COSTEM AU
LOCK HA/EN, PA OFF SITE PHASE!jTRCr.TnR EMPIRE SOILS INVESTIGATION nFGER OHM i nun" nsTF 9/27/83 rnnHniuATF
STICK IIP FI F.VATION
SOIL SAMPLE
NUMB
ER
1
2
3
4
PENETRATION
( INC
HES)
18
18
18
18
ECOV
ERY
INCHES )
6
0
9
5
UJUJu.3:"aua
5.06 5
100
rn-
n
35,036.5
BLOWS/6"
1-2 -2
2-3-2
-"-
8-12-20
^
4-11-15
LL FH JOE JENSEN
2.08 SCALE l"= 5' VEOTIOM ^j^
STATIC WAT
ERLE
VEL, FEET
IC/7/83
a
BORING-CASI
DIAM
ETER
,IN
CHES
f
ROCKSAMPLE
tr
>-*
_^
RECO
VERY %
1
f
QOcr
A
WELL CONSTRUCTION DETAILS(NOT TO HORIZONTAL SCALE)
9.0-
.120.
\*
17.5-
3,8-
35.0.
»-
«V",* **» 1
** 1
V
's
*•
itlb
* t
*
, '<
———,__.
— s..—— :.••—— ,'••-
~ i
-~x\6" PROTECTIVESTEEL CASING«CLOCKING CAP
CEMENT-BENTONITEGROUT
pBENTONITE
4 "PVC PIPESCHEDULE 40
-SAND PACK
4" PVC SCREEN"SLOT SIZE 0.01 "
-BOTTOM CAP
365 feiffj;!
Rl§Q5l*2
WREMARKS
•

TEST BORING N2 M"!? BY ><•>,..... DATE "/28/S3 cHK'r. ___DATE__.PROJECT NflMF DRAKE CHEMICAL_________________PROJECT NS 07IC.I2_________ LOCATION LOCK HAVEN, PA PHASE J_______________GEOLOGIST/ENGINEER J.KASPER DRILLING CONTRACTOR EMPIRE SOILS INVESTIGATION npii i FB _______________________nR|LL CME 75______________OR IL.-1NG METHOD HOLLOW STEM AUGER DRILLING DATE 9/22/8.3 rnngniMflTC;_________________________________
SURFACE/ELEVATION _________556 29____________ STICK, UP ELEVATION 2.29_________________________ SCALE l" = _§_VERTICAL
LITHOLOGY
SURFACEMEDIUM DENSE BROWN FINE SAND.SOME GRAVEL, TRACE SILT, TRACECLAY (SP-SM)
MEDIUM DENSE BROWN FINE TOMEDIUM SAND. TRACE SILT, TRACECLAY (SM)
MEDIUM DENSE TO DENSE LIGHTGREY MEDIUM TO COARSE GRAINEDSANDSTONE FRAGMENTS, SUBANGULARTO SUBROUNDED
VERY DENSE BROWN FINE TOCOARSE GRAVEL (GW1
VERY DENSE LIGHT GREY MEDIUMTO COARSE GRAINED SANDSTONEFRAGMENTS, WEATHERED
PROF
ILE
'.''.•'. *.•'•••.
Ii
Uf
jii&sSig?m
If
DEPTH, FEET
15.0
29.0
3I.S
36,5
SOlu SAMPLE'
NUMB
ER
1
2
3
4
5
6
7
PENE
rRATION
( INC
HES )
18
18
18
18
IB
12
18
RECO
VERY
( INC
HES )
16
14
13
6
1
6
8
Uju.
l"
Q
5 06.5
10.011.5
IS.piefa
20.021.5
25.026.5
30.0
35.036.5
BLOWS/6"
4-7-7
4-6-S-""
20-25-22
vX4-13-30
8-9-18
27-5O
13-27-45
STATIC WAT
ERLEVEL, FE
ET
KD/7/83V
v
BORI
NG-C
ASIN
GRI
AMET
bR,
INCH
ES
ROCKSAMPLE
zGL
r
&
RECO
VERY %
^
toacc
**
1 .\
\*
fl
WELL CONSTRUCTION DETAILS(NOT TO HORIZONTAL SCALE)
i 12.0-
35.0-
* * *
1 » *
1 « JJt
* *• *
*** t
* •
» 4
« »*
||
1
''"•''*•;'.'!;'•: .*'•'
H-
——
——
Zfc
——
——%'§•••
» » *(
» * *V*f * *•**v
•;,V •';.;/
ii
|l
PROTECTIVESTEELCASINGW/LOCKINGCAP
CEMENT/BENTONITEGROUT
BENTONITE
-4" PVC PIPESCHD. 40
SAND PACK
-4" PVCSCREENSLOT SIZE0.01
CAP
R300SU3
REMARK;

TEST BORING Ng M~I8 BY hat DATE 10/28/83 CHK'O ___DATE.PROJECT NAME DRAKE CHEMICAL______________ PROJECT N2 0710,12_________ LOCATION -OCK HAVEN, PA GORHAM PROPERTY_______GEOLOGIST/ENGINEER J.PRIEJR__________________ DRILLING CONTRACTOR EMPIRE SOILS INVESTIGATION npn I FP . SILL SKLRA___________DRILL ACKER AD g_________DRILLING METHOD H S. AUGER 6 1/4" DRILLING DATE l/21/83__ COORDINATES___________________________SURFACE ELEVATION 554,76________________ STICK UP ELEVATION 3.30______________________ SCALE I" = _5|_VERTICAL
LITHOLOGY
SURFACEVERY DENSE BLACK FINE TO COARSEGRAVEL (GW)
LOOSE BROWN SILTY SAND (SM)
SILT(SM)
LOOSE BROWN SAND. LITTLE SILT,BLACK ZONES COMMON (SM)
DENSE BLACK SAND. SOME GRAVEL(SW)
VERY DENSE LIGHT TO DARK GRAYSANDSTONE FRAGMENTS
C
PROF
ILE
^
8',.,;•,-••"..••,£* .',.'•."•>'.•;'.$?fc:;5*5«*t
]&%•,
i&h:$jj$.$$$.c/jii'j-;
88%i::-:'.-r.:.v.V!.-t S-iS..v.*..':;:;; f.':->>"
DEPTH,
FEE
T
23.5
SOIL SAMPLE
NUMB
ER
PENETRATION
( INCHES )
r\\RE
COVE
RY( INCHES )
-
\
UJu.
x"KQ.
^
BLOWS/6"
NOSAMPLESTAKENSEE E-2
r"~»•
STATIC WAT
ERLE
VEL, FEET
f*"
BORI
NG-C
ASIN
GDIAMETER,
INCH
ES
6 V," 1.0.HOLLOWSTEMAUGER
f
* *,_ V
^
ROCKSAMPLE
ztr
•"
RECO
VERY %
^
\J>
5?Ootr
^
ft
WELL CONSTRUCTION DETAILS(NOT TO HORIZONTAL SCALE)
*"*
Y\v^
21.0-
23.0-
M '•
* A
•&
,v.V
\
•* A
1 *
Jk *, V
'ff*.
• •
/;* -* »^ r'!•'. '.« v
—'Xr*
0&.'•'.';'•;•'.'.••'.
4 PROTECTINGSTEEL CASINGWITH LOCKINGCAP
-CEMENT/BENTONITEGROUT
- 2" PVC PIPESCHD. 40
-BENTONITE
-SAND PACK
9REMARK,'
^ *.
1
1 — BOTTOM CAP
'
RS&Q5W
9W
•

TEST BORING Ns M-1 9 BY ko: DATE 10/27/83 CHK'D ___DATE.PROJECT NAME DRAKE CHEMICAL______________ PROJECT NS 07IC.I2_______ LOCATION ^OCK. HAVEN. PA GORHAM PROPERTY___________GEOLOGIST/ENGINEER J. PRIEUR _____________ DRILLING CONTRACTOR EMF.RE" SOILS INVESTISAT iON npn I FP Sl|— SKURA________DRILL ACKEP AD II________DRILLING METHOD H. S. AUGER '_____ DRILLING DATE J/2J/B3__ COORDINATES-SURFACE ELEVATION 554. 98________-----_____ STICK UP ELEVATION ____3. 12_______________________SCALE I" = _5_VERTICAL
LITHOLOGY
SURFACEVERY DENSE 8-ACK FINE TO COAPSESRAVEL (GW)
LOOSE BROWN SILTY SAND (SM)
VERY LOOSE BROWN "SAND, SOME SILT(SM)
LOOSE BROWN SAND, LITTLE SILT,BuACK ZONES COMMON (SM)
DENSE BLACK SAND, SOME GRAVEL(SW)
•
*,..
PROF
ILE
ssym•'.•' •>.'."•&&•'•',-'.: '.•:.'••'.•':--.''/:'.'-,:^
feljfe'-
UJUJ
KCLUJ
SOIL SAMPLE
NUMB
ER
C\
PENETRATION
( INC
HES )
^
\
RECO
VERY
(INCHES )
if
^
u.l"Q.UlQ
s*r
s
BLOWS/6'
NCSAMPLESTAKENSEE E-2
jif—
^V^
STATIC WATER
LEVE
L, FEE
T
,
\j
10/7/8
-
'
BORI
NG-C
ASIN
GDI
AMET
ER,
INCHES
6 1/4" I.D.HOLLOW
JU<*R
•
v*
ROCKSAMPLE
cr
X
RECO
VERY %
N
0o(T
^
WELL CONSTRUCTION DETAILS(NOT TO HORIZONTAL SCALE)
1 ——— r
1 \— 4" ePROTECTIVESTEE- CASING"/..OCX INGCAP
''. f* ——— CEMENT/» . •'.! BENTONITE•.. '.'•
7.0 —— '- -
f*
100 ———— T r ———
W: !?*
13.0— f|==)';;VW. —— • '
.-r'.'rji.' ^ i .'.'•' :
GROUT
— BENTONITE
1 —— SAND PACK
r2"PVC PIPESCH. 40
SLOT SIZEO.Ol"
"-BOTTOM CAP
jMsoos^s
REMARK

TEST BORING N2 M-20PROJECT NAME DRAKE CHEMICAL_______________ PROJECT NS 0710-12_______ LOCATION LOCK HAVEN. PA OFF-SITE PHASE gGEOLOGIST/ENGINEER -I KASPER______________.DRILLING CONTRACTOR EMPIRE SOILS INVESTIGATION npn i FP JOE JENSEN
_.ORILLING METHOD H.S. AUGER__________ DRILLING DATE .9/27_ 8/B3. COORDINATES-SURFACE ELEVATION 547.25____________________ STICK UP ELEVATION 225_________________________ SCALE l" = _5_VERTICAL
LITHOLOGY
SURFACELOOSE BROWN SAND. LITTLE SILT (SM)
VERY STIFF BROWN SILT, SOME FINESAND, TRACE CLAY (ML)
MEDIUM DENSE BROWN SILTY FINESAND (SM)
MEDIUM DENSE LIGHT GRAY MEDIUM TOCOARSE-GRAINED SANDSTONE FRAG-MENTS, WEATHERED
MEDIUM DENSE GRAY SANDSTONEFRAGMENTS AND FINE TO COARSEGRAVEL
VERY DENSE BROWN FINE TO COARSEGRAVEL (GW)
MEDIUM DENSE BROWN SANDSTONEFRAGMENTS, WEATHERED, SOME FINETO COARSE GRAVEL, SOME COARSESAND
mmmmmmmmmmmmmmm
PROF
ILE
:.':A;.:':.
SIS
'•>., 'V...'
HI•.y.'-'.'Cv
•.}:;'•' "v.
S
I**' ;"'"*.•*£
BBI
DEPTH, FEE
T
31.5
BB
SOIL SAMPLE
NUMBER
1
2
3
J
5
6
•
PENETRATION
( INC
HES )
18
18
<?
18
18
18
18
IB
ECOVERY
INCH
ES 1
18
14
6
1
7
0
Bl
UJUl
0_UJ
-5-P6 5
iTT
15.016,5
^
20205
25.0
30.031.5
mm
BLOWS/6"
5-7-H
6-6-8
3- 5-8
50/. 5
14-11-12
7-8 -14
mmmm
STATIC WATER
LEVE
L, FEET
^
KVV8,
mm
a
iORING-CASI
1IAMETER,
NCHES
V^«**•
BBBi
OCKSAMPLE
cr
4#*
Bl
RECO
VERY %
^
•
oo<r
~*
ft
r
WELL(NOT
13.0
15.8
25.5
30.00
CONSTRUCTTO HORIZON
l
— *-
ft
31.50
=r——
=
=
TT—
m
rK
r»
:fS
niMifi \
ON DETAILS ^ FTAL SCALE) REMARKS
= 6 PROTECTIVESTEEL CASINCW'Th LOCKIN
— CEMENT-BENGROUT
— B6NTONITE S
— 4" PVC PIPESCHEDULE 4
— SAND PACK
4"PVC\ SCHEDULE 4O"-SLOTTED SCRSLOT SIZE 0
\^BOTTOM CAP
RTOOSW••••••••••••H
CAP
TONITE
AL
0
•
^ m

TEST BORING Ng M-21 BV JLM_£_DATE 10-13-83 CHK'D J.PP DATE 2-17-PROJECT NAME DRAKE CHEMICAL_______________ PROJECT NS 071012_______ LOCATION LOCKHAVEN,PA PHASES - TREATMENT PLANT________GEOLOGIST /ENGINEER •>• PRIEUR______________ DRILLING CONTRACTOR EMPIRE SOILS INVESTIGATION______DRILLER Bl--- SKURKA___________.DRILL ACKER ADD" . . nan i INS METHOC HOLLOW STEM AUGER n n n i i M r . DATE 9/26/83 rnnRniMATFS________________________SURFACE ELEVATION 556 51______________________ STICK UP. ELEVATION 2.10___________________________ SCALE l" s _5_VERTICAL
LITHOLOGY
SURFACEMETAL, WOOD, BRICKS. FILL
MEDIUM STIFF BROWN SI-T. SOMECLAY, SOME FINE SAND(ML)
METAL, WOOD, FILL
MEDIUM STIFF GRAY SILTY CLAY,SOME FINE SAND(CD
LOOSE GRAY MEDIUM TO COARSESAND, SOME GRAVEL, TRACE SILT—— (sw)STIFF GRAY FINE SANDY £ILT,TRACE GRAVEL (ML)
MEDIUM DENSE GRAY COARSE SANDAND FINE TO COARSE GRAVEL(GW)
VERY DENSE GRAY MEDIUM TOCOARSE GRAINED SANDSTONEFRAGMENTS, SOME COARSE SAND,TRACE GRAVEL
U)
u.0o:0.
•
1
siESS
-Irl- ~~
inM_;'•*.• '.'••>'•' .*
11;i£S§?
DEPT
H, FEE
T
40
12.0
14.5
19,0
21.0
245
29.O
31.5
SOIL SAMP"L£
NUMB
ER
1
2
3
4
5
PENETRATION
( INC
HES)
18
IS
18
18
18
RECO
VERY
( INC
HES )
18
u»-
14
12
16
u.zfa.
10.011.5
,
IS.O16 5
2O.O
N
25.026T
3O.O31.5
BLOWS/6"
2-3-2
•""4-3-5
2pf-6r
10-11-12
15-20-50
11
IO/7/«3V
^
30RING-CASING
)IAM
ETER
,NC
HES
HOLLOWSTEMAUGER
" 5
ROCX SAMPLE
zcr RE
COVE
RY %
S
>
aoa:
s
WELL(NOT
120-
17.0-
20.0-
. CONSTRUTO HORIZ
» * >
t* «'
> » »
4 V '
• *.* j
•+—
~~
__._ *"
=
=
———
$&
00
•
*
W
:TION DETAILS3NTAL SCALE)
C
^
«*—
.•',
:::'>S-''•'.'.';':•
5
-6" PROTECTIVESTEEL CASINGW/LOCKINGCAP
-CEMENT/BENTONITEGROUT
— 4" PVC PIPESCHD 40
-BENTONITE
-SAND PACK
-4"PVCSCREE^SLOT SIZE 0.0
— BOTTOM CAP
M
REMARK:
-

APPENDIX BX
AMERICAN COLOR AND CHEMICAL COMPANY BORING LOGS

MONITORING WELL LOGPROJECT American Color & Chemical. Lock Haven. PA WELL NO. Mtf 2BDRILLING METHOD SSADRILLER Geomechanics, Inc.
GROUND ELEVATION 557.96TOP OF WELL 559.66DEPTH OF WELL (ft) 36. 5
CASING MATERIAL 2" PVCSTRATADEPTH
5 ~
10 ~
15 ~
20 -
25
30 -
35
40 -
SAMPLEDEPTHXXXxXxx
X
X•
X•
XX
GEOLOGIST GillesTJieDATE 7/14/83
GROUND WATER DEPTH (ft): QR;AT COMPLETION BEhAFTER HOURS !?{£I.MI i, i , i , ^ur
SCFSCREEN 2" PVC, 0.010 slot
DESCRIPTION
~ Brown/black FILL
,Brown clayey SILT, tr f sand f- - „.
•M
— Brown SILT & CLAY, black mottling•" •
- Brown SILT, little f sand, tr clayey silt
- Brown f SAND, tr silt • •
Gray f SAND, tr silt & clay""* «
•V
•
" Gray /brown ROCK FRAGMENTS and f SAND
_ Brown f SAND, tr gravel, rock fragments
~ Black SHALE ' ._
__
WEL PACK I;*.'* :*..•.'.ITONITE IliSI:K FILICRETEIEEN
L
•__K__H;
CONSTRUCTION
»
-• i
•M
S1£
II1—— •
1
1$1
1*&'*$S1
•~
—
—
—
—
—
—
I —
B ^^^ ,
SHEET i OF i

MONITORING WELL LOGPROJECT American Color & Chemical, Lock Haven, PA WELL NO.MW 8DRILLING METHOD SSA GEOLOGISTDRILLER . Geomechanics , Inc. DATE 7/12/83 |
• GROUND ELEVATION 568. 20 GROUND WATER DEPTH (ft):TOP OF WELLDEPTH OF WEL
UIVSA
570.50 AT COMPLETION ' BENL (ft) 17.5 AFTER HOURS 5if
M, .,. ~™ ' ' ",..., LUr
VEL PACK Evr TITONITE E1BK FILLCRETE k-o/rf.-l
SCREEN KHHI-I-I-iCASING MATERIAL 2" PVC SCREEN 2" PVC, 0.010 slot
"STRATADEPTH
5 "
10 -
15 -
20 -
SAMPLEDEPTH~ ><x**""*"''*'.
X;xx*+ ^ ir*x
><xx
m
»
•w
DESCRIPTIONCINDER fill
Brown clayey SILT, tr f sand^ r* . *
'•-rlint'
: ' ;Brown & gray mottled f SAND, little silt
crown c« green f &AJNU, liccle silt_ Green-gray f SAND, tr me sand, tr sandstone fragments.— Brown fm SAND, tr silt, tr sandstone fragments,
•rounded sandstone boulders
-• * f .
Brown SHALE
• ~ W
CONSTRUCTION&\ S5!%H :t'
~ m ifflj _ 5 Ib* Z •_
*.» " Q %|v*o ' —— • ~'mmm
• j; r~ j/ff• J/o —— °."J ~
"•
• ^ ^ ^ la
SHEET 1 OF 1
8R3QG55Q

MONITORING WELL LOGPROJECT American Color & Chemical Corp., Lock Haven, PA WELL NO. MW 9DRILLING METHOD SSA GEOLOGISTDRILLER Geomechanics, Inc. DATE 7/13/83
GROUND ELEVATION 564.08 GROUND WATER DEPTH (ft):TOP OF WELL 566.08 AT COMPLETION BEhDEPTH OF WELL (ft) 14 AFTER HOURS ^
tVEL PACK I.V ::.'.'lITONITE HBB,K FILLCRETE >*?&
SCREEN nr wiCASING MATERIAL 2" PVC SCREEN 2" PVC. .010 slot
STRATADEPTH
5 -
10 -
15 -
SAMPLEDEPTHXXxxXx•-*
•
•
»
DESCRIPTION
,4-Mr •
CINDER-gravel fill ""... -
••» •
~ Brown clayey SILT, little small-large sandstone &siltstone fragments , • •
- Black SILTSTONE & SHALE fragments, clayey silt- odor . , ' •^ l
—» «
W «
— • I
IM " ' m
MM- M
CONSTRUCTION
M-
_ -*•" - . - *•* ~0'* . ___ a- -•• . __ .' ..*•* . —— - •« ""».o 9'. _• o ' ."O- »/ ——— o;| —
•' H-! — ^ *-°i ""« «j j __ ; —J _-** 1 mmi S_J
*
SHEET 1 OF 1
AR30055I

MONITORING WELL LOGPROJECT American Color & Chemical, Lock Haven, PA WELL NO.10* 10
DRILLING METHOD SSA GEOLOGIST GillespieDRILLER Geomechanics, Inc. DATE 7/12/83 _
GROUND ELEVATION 562.77 GROUND WATER DEPTH (ft):TOP OF WELLDEPTH
565.07 ' AT COMPLETION ' BENOF WELL (ft) 16.5 AFTER HOURS *Jjj
" • JQp
CASING MATERIAL 2" PVC SCREEN 2" PVC, .010 slot"STRATADEPTH
<•
5 ", •
10 -
15 -
20 -
SAMPLEDEPTHXXxxxxX
•urn
DESCRIPTION
f - -^. a *Hi ^^ yifc t js iFILL, clayey silt, tr f sand ' * ,*i'
Brown clayey SILT, tr mf sand
Brown f SAND, tr clayey silt
- Black/brown silty CLAY, tr f sand, odor
K» <
Brown/gray f SAND, tr silty clay, odor '
•M <
1
——— 1
•rVEL PACK 1523TONITE BB9K FILLCRETE K .a-EEN -Z-I-I-I-I-
CONSTRUCTION
U-:-
*• — r*
' V;.n:|>i-,: i — i ^^
- I". —— |Sf-
- . —
SHEET 1 OF 1
AR30Q552

tt
. MONITORING WELL LOGPROJECT American Color & Chemical, Lock Haven, PA WELL NO. MW 11DRILLING METHOD SSA GEOLOGIST GillespieDRILLER Geomechanics, Inc. DATE 7/13/83
GROUND ELEVATION 564.59 GROUND WATER DEPTH (ft):TOP OF WELL 567.09 AT COMPLETION BEh
tVEL PACK }:••!< :>.-')TONITE BSHi
DEPTH OF WELL (ft) 17-5 AFTER HOURS CONCRETE1SCREEN Ibs-I-I-il
CASING MATERIAL 2" PVC SCREEN 2" PVC, .010 slotSTRATADEPTH
5-
10-
15 -«•
20 ~
SAMPLEDEPTHXXXxXfXXmmf
m
m
K
f
•V
DESCRIPTION _. -
- Black' FILL ,-. . *f * '
- .Brown/gray CLAY & SILT, little black cinder fill,odor
- Brown/gray silty CLAY, odor
Black cmf SAND, some ash, tr f gravel, odor
- Gray/brown silty CLAY, odor
- Black/gray silty CLAY and cmf SAND, tr rocks- and wood, odor_ Brown CLAY & SILT, tr f sand— '
•• •
mmm* w
m m ~ * ' m m
CONSTRUCTION
Ii:r
- :»* r: -- e.o —— :v* -
. m * * *
** - J!*'
."" ~~ —• '* ""
• * • ^
« * • *™- >? —— •? —
• |j.o ' —— r iJ -
~" t
SHEET 1 OF iM300553

MONITORING WELL LOGPROJECT American Color & Chemical, Lock Haven. PA WELL NO. MW 12DRILLING METHOD SSA GEOLOGIST Gilles ieDRILLER . Geomechanics, Inc. DATE 7/13/83
GROUND ELEVATION 562.70 GROUND WATER DEPTH (ft): A-..TOP OF WELLDEPTH
... .. .. . \3i\r\564.70 AT COMPLETION ' BEN
OF WELL (ft) 13 AFTER HOURS KFSCF
CASING MATERIAL 2" PVC SCREEN 2" PVC, .010 slot .STRATADEPTH
5 ~. •
10 ~
15 -
SAMPLEDEPTHX~*x_ * **+*
XXX><
M
k
»
••
•
•
DESCRIPTION
"Black/brown FILL .-
.
Brown clayey SILT, tr fm sand, little rock fragments
-• i
Brown silty CLAY, tr f sand, odor
~ No recovery
mmtmf _
^ i
^ •
•H * •«
••» 1
m* -
mVEL PACK |?V MTONITE |B_5aK FILLCRETE *to_«j?f£EN 55-KrI-
CONSTRUCTION'•=!_•;O • ———— ?4
».<» ', ..'.' 0*. —* .• 0 — — . 0
» "»*
*** * — ~" '\*'° —— °*"n
^ H
•• ^ ^ ^ B oav
I
SHEET i OF i
ftR30055U

MONITORING WELL LOGPROJECT Amprlran Cninr f, rrn*DRILLING METHOD SSADRILLER Geomechanics, Inc.
GROUND ELEVATION SA&.QATOP OF WELLDEPTH OF WEL
566.74
1 (ft) 23
CASING MATERIAL 2" PVCSTRATADEPTH
•
5 -
10 -
15 -
20 -
25 -
SAMPLEDEPTHXXxX-TXT
X-X
b<m
mm
»
^
»mHrfl1 T.nflr Watren PA WELL NO. MW 13GEOLOGIST GillespieDATE 7/12/83
GROUND WATER DEPTH (ft):AT COMPLETIONAFTER HOURS
SCREEN -21' pvc» °-010 slot
DESCRIPTION
" FILL '^
GRAVEL PACK I/-.'. :'.*.-'lBENTONITE ^ B
CONCRETE t£?i&SCREEN -HHr=-.-
_.Brown silty CLAY, tr f sand . . - 'j5*
- **%
~ Red/brown SILT & CLAY, tr sandstone^ •
_ Brown fm SAND,_ sandstone
—
tr clay & silt, tr gravel, tr
•
•
CONSTRUCTION
' :M ^ ~' : ?*fu f
- n\ %
iftJb•%. . —— . «^_ ;> —— • ?."• _
* * * ,
" r» ~-l? -• • ':, ==: o> -
m «^
SHEET 1 OF 1
RR3Q0555

MONITORING WELL LOGPROJECT .American Color &
DRILLING METHOD SSADRILLER Geomechanics, Inc.
GROUND ELEVATION 565. 09TOP 0DEPTH
F WELL 567. 29OF WELL (ft) 24
CASING MATERIAL 2" PVCSTRATADEPTH
5 -. •
10 -
15 -
20 -
25 -
SAMPLEDEPTHXXC"Xxxx
XX«•
»
Chemical, Lock Haven, PA . WELL NO. MW 14
GEOLOGISTDATE 7/11/83
GROUND WATER DEPTH (ft): QRAAT COMPLETION • BENAFTER HOURS ?iS
III III • 'il-> wUll
VEL PACK f^HTONITE ES0K FILLCRETE ks rfH
SCREEN KS55S5ISCREEN2" PVC 0.010 slot
DESCRIPTION
_ CINDER & gravel fill ; *flV>fc• ' ""
- Brown clayey SILT, little f sand
Red/brown f SAND, tr silt, tr med. gravel
~ SANDSTONE boulder '_- Light red/brown silty CLAY, tr f sand
"Light gray silty CLAY, tr f sand
~ Light red-brown mottled light gray silty CLAY, ]tr f sand
- Brown SILT & CLAY, tr fc sand
Dark brown SILT & CLAY, tr f sand
~ . ,
i in mi if " •"<— -i'-.?-— T-S-— — - ——— .., ,,--.,... ... ——— ., .., ,-.,,..... ————— T«-*"— •
CONSTRUCTION
y* § "
1 I:& i^ 1 ~• *£ ?§ -i£ jfy
' *-JT' >; —— lliL~
•.« - —— . Q\ -
\*o — — • "%*p —
&.o —— °.'C
' 0;SHEET 1 OF 1
AR300556

MONITORING WELL LOGPROJECT American Color & Chemical, Lock Haven, PA WELL NO. MW 15
DRILLING METHOD/ SSADRILLER Geomechanics,
GROUND ELEVATION 561.28TOP OF WELL 563.38DEPTH OF WELL (ft) 19
CASING MATERIAL 2" PVCSTRATADEPTH
5 -
10 -
15 -
20 -
25 -
SAMPLEDEPTHXxxxx
"••^ "~"Shelby
X
XX
H
GEOLOGIST GillespieInc. DATE 7/12/83
GROUND WATER DEPTH (ft): cpj,AT COMPLETION BEhAFTER HOURS Kf———— ———— ~ — COr
SCFSCREEN 2" PVC, .010 slot
DESCRIPTION
- .FILL .
- Brown/gray /bLs- 'rock fragments
ick CLAY & SILT, tr f sand, tr! •
<•• •
_ Brown/red CLAY & SILT ' -tjVAf
~ Brown Silty CLAY, tr rock fragments•B •
~ Gray CLAY & S3LT, tr f sandi^* •
1 ', ' •
J.JL.I , oaor
Gray /brown f SAND, tr clayey silt
m* m . * "•
IVEL PACK I.'".'.".'.-'!ITQNITE fjSSm
IEEN -Hrl-I-I-l
CONSTRUCTIONL Jf: - • B .4 * -: 1 1 =- *y# at —l j mmm
: K ^ :• ;.- —— *.-. ~
* * »
•'« —— ' v- i> zn •;? -
^ • • A '
• mm
mm m**m*
SHEET i OF i
SR3QG557 _

MONITORING WELL LOGPROJECT American Color & Chemical, Lock Haven, PA WELL NO.MW 16
DRILLING METHOD SSA GEOLOGISTDRILLER Geomechanics, Inc. , DATE 7/12/83
GROUND ELEVATION 557.73 GROUND WATER DEPTH (ft): CRflTOP OF WELL 559. 83 AT COMPLETION • BENDEPTH OF WELL (ft) 12 AFTER HOURS S5F' " , uur
SCPCASING MATERIAL 2" PVC SCREEN 2" PVC, 0.010 slot
STRATADEPTH
5-
10-
15-
SAMPLEDEPTH
XXLxxx^
•
^
*
•
m
mm
DESCRIPTION
_ "CINDER & chip fill, odor
4>i— ' *•-H.X
Brown SILT & CLAY, tr fc sand, some gravel— *
•» •
~* •
•» •
•MX* ••
•* ' ~.
mm f mm
•«••• mmi
•• . *
VEL PACK I??IKTONITE Bg^K FILLCRETE k-W-rM£EN (-I-I-Z-I-I-1
CONSTRUCTION
PNi'F * * * §* *^ — - -- __ ". j
>. . — w?i
: •
' *SHEET l OF l
HR300558

MONITORING WELL LOGPROJECT American ColorDRILLING METHOD SSADRILLER Geomechanics ,
GROUND ELEVATION 554.17TOP OF WELLDEPTH OF WEL
556.87
L (ft) 17
CASING MATERIAL 2" PVCSTRATADEPTH
'
5-
10 -
15 -
20 -
25 "
30 '
. 35 -
40 -
SAMPLEDEPTH
XxxxShelby,xx._•
X
X
X
Core
_Cor_T
& Chemical, Lock Haven, PA WELL NO. MW 17
GEOLOGIST GillespieInc. DATE 7/18/83
GROUND WATER DEPTH (ft): GR;AT COMPLETION BEI^AFTER HOURS S5F, JU111J Cur
iVEL PACK i;y. ::.';'jITONITE J Sa,K FILLICRETE kK_-!_y
SCREEN 2" PVC, .010 slot r— ----- -i
DESCRIPTION
_ Brown SILT, tr clayey silt, tr f sand,Brown clayey SILT
-.'•MS'.
- rown SILT & CLAY
- Brown f SAND, tr silt
••» •
- Sandstone BOULDER, little sand, little silt
- Brown f SAND,
~ Rock FRAGMENT.
little- clayey silt
5, sand, gravel, tr clayey silt
~ Black SHALE
CONSTRUCTION
;| i:_ *S T*
\^f __ __ • <> —
•*. • —— • a!-
• m*mm~mm »
f.« —— «*. -
,•« — ~" ?/ _
—
—
-
—
SHEET l OF 2
§8300559

MONITORING WELL LOGPROJECT American Color & Chemical, Lock Haven, PA WELL NO. MW 17
DRILLING METHOD SSADRILLER Geomechanics,
GROUND ELEVATTnM "A 17TOP OF WELL f556.87DEPTH OF WELL (ft) 1?
CASING MATERSTRATADEPTH
45 -
50 -
55 -
SAMPLEDEPTH•Core
•Core •<c ">-ore
Jore
IB*
••
•
mm
m
mm
IAL 2" PVC
'GEOLOGISTInc. DATE
GROUND WATER DEPTH (ft): CRA — iumAT COMPLETION - BENAFTER HOURS £Jjj
• SCFSCREEN 2" PVC, .010 slot
DESCRIPTION
~ Black/gray SHALE
1 ' c ,,„, (>JV t.
!««•
•
<«
••
VEL PACK IX mTONITE BBBN r i Lu $&_£,t!i&jxyiCRETE ->.<'_Jr_7.-EEN -HHXHI-
CONSTRUCTION
_ —
^ •SHEET 2 OF 2
AR30QS60

. MONITORING WELL LOG -
PROJECT American Color & Chemical, Lock Haven, PA WELL NO. MW ISA
DRILLING METHOD SSA GEOLOGISTDRILLER Geomechanics, Inc. DATE
GROUND ELEVATION 556.92 GROUND WATER DEPTH (ft):TOP OF WELL 559.12 AT COMPLETION BENDEPTH OF WELL (ft) 15 AFTER HOURS *JJ
CASING MATEPSTRATADEPTH•
5 -
10 -
15 -
SAMPLEDEPTHXXxxxjXMB
H
»
••
SCFJAL 2" PVC SCREEN 2" PVC, .010 slot
DESCRIPTION
£/>> "- Brown clayey SILT & ROCK FRAGMENTS, fill ' -^N •'• v f'~ '»
*•• \
Dark brown SILT, tr f sand, black streaks,slieht odor
_ Dark brown f SAND, little silty clay, f sand seams, ._ black streaks
_ Brown f SAND, tr silt
kVEL PACK I.W.V1TONITE BBBK FILLCRETE •_«•_«!??IEEN S-KHSr
CONSTRUCTION
«{ ,. '.., >*•%. —— ••
" H — •'• ": v.-zn^ :0*» ——— o-
- -Vc zz: h if.« — . «*.
• *.; rzz o J -
mm •••v
• •••
SHEET i OF

-MONITORING WELL LOG
PROJECT American Color & Chemical, Lock Haven. PA WELL NCDRILLING METHOD SSADRILLER Geomechanics, Inc
GROUND ELEVATT™ "7 n7TOP OF WELL 33*. u..DEPTH OF WELL (ft) 40
CASING MATERIAL 2" PVCSTRATA'DEPTH
5 ~
10
15 -
20 -
25 -
30 -
35
40
SAMPLEDEPTH
XXx;xXxC
X
5X
X
X•
X
~ ><;
GEOLOGISTMW 18B*
DATE
GROUND WATER DEPTH (ft): CRA — Immmi
VEL PACK^^W__Jh. .-.__.- mmmmm^mmmmHtAT COMPLETION • BENiuixiit •UHKJI
AFTER HOURS ?ifii iii •••••-• ttUr
K FILLCRETE
' SCREENSCREEN 2" PVC, .010 slot
DESCRIPTION
'Brown clayey SILT & ROCK FRAGMENTS, fill
~ C f.lrg'
~~ Dark brown SILT, tr f sand, black streaks,~ slight odor__ Dark brown f_ black streaks
^ Brown f SAND,
_ Brown f SAND,
mm,
'
SAND, little silty clay, f sand seams, .
tr silt
little rock fragments, tr silt
- Brown fm .SANDSTONE fragments
_
—
—
-
_^— Black SHALE
i
•
/
•££?f.f?t•IHHHj-2
CONSTRUCTION
^
i•
1i5?•**_*•*•
i:{i-'Vi•**•*
»*>«.•
11*^
D** •
\"o• a
*
— '
- — •
mmm^mm
i
fvv£*"•c
mm
^
1X?• *•oe*.
.•
Ii
mmt
-
-
Wr-
—
—
-
—
SHEET x OF !
ftR300562

. MONITORING WELL LOGPROJECT American Color & Chemical, Lock Haven, PA WELL NO. MW-19 .
DRILLING METHOD SSA GEOLOGISTDRILLER Geomechanif-s - Tne. DATE 7/T3/8
GROUND ELEVATION 564.19 GROUND WATER DEPTH (ft):TOP OF WELL 565.79 AT COMPLETION BE-.NDEPTH OF WELL (ft) 16 AFTER HOURS **f
CASING MATEPSTRATA"DEPTH
5-
10-
15-
«••
«M
SAMPLEDEPTHXX\>< '***" *° ~
xXx-X
•M
•
•
•
•
SCFJAL 2" PVC SCREEN 2" PVC, .010 slot
DESCRIPTION
I TTCTT lCj* D f4 T 1 i * *
(
W •
vt-^^ •
mm m
Gray-brown mottled clayey SILT, tr f sand" .
•• •
•* <
,VEL PACK I.'-*.-. ::.'.-'lITONITE mSm
CRETE *£&&tEEN C-I-Z->Z-
CONSTRUCTION
jl i:• P 5 ~"1-*^ »*
4* mmmm*mmi ^ *.
* • _• >'? = ";? -*.•„ Lj_i «/
fe-° • ' ^i
•• ^ Bt
SHEET 1 OF
ftR300563

. MONITORING 'WELL LOGPROJECT American Color & Chemical, Lock Haven, PA BORING 'NO. B-l
DRILLING METHOD SSA GEOLOGIST GillespieDRILLER Geomechanics, Inc. DATE 7/13/83
GROUND ELEVATION GROUND WATER DEPTH (ft):TOP OF WELL AT COMPLETIONDEPTH OF WELL (ft) AFTER HOURS
CASING MATERSTRATADEPTH
5 -
10 -
15 -
20 -
25 ~
SAMPLEDEPTHX\<-<• X
xV-/\\«-• ^
X
X^
»m
•
•
•
•M
IAL SCREEN
DESCRIPTION
_ FILL
r-mGRAVEL PACK I' iBENTONITE }BH|BACK FILLCONSCR
•
..
„ FILL and black SLUDGE, odor
mm
m^mmt
i
~~ 'Brown CLAY & SILT & f SAND, odor
Black f SAND, odor
- Brown f SAND, tr silt
mmmm mm
CRETE -?_r.7.-£EN C-I-Z-I-C-
CONSTRUCTION
^ :
'- •
• •SHEET OF

MONITORING WELL LOGPROJECT American Color & Chemical, Lock Haven, PA BORING NO. B-2
DRILLING METHOD SSA GEOLOGIST GillespieDRILLER Geotnechanics, Inc. DATE 7/13/83
GROUND ELEVATION GROUND WATER DEPTH (ft):TOP OF WELL AT COMPLETION BEhDEPTH OF WELL (ft) AFTER HOURS J
iVEL PACK U :i.v"lITONITE JBBi,K FILLCRETE L rrJ
SCREEN Ic-I-Z-I-I-iCASING MATERIAL SCREEN ———
STRATA"DEPTH
5 -
10 -
15 -
20 -
SAMPLEDEPTHXXXxXX^ - ^
Xx
m
mm
mm
m
•
DESCRIPTION
_ Silt, clay, sand, and rock FILL
Shale FILL --
••• •/
black— purple SLUDGE . odorW •
_ Brown clayey SILT, tr fm sand, black mottling
Black fm SAND, odor
i» <
•• •
MH» «
M> •
mm m
mmmmr -v. mm
m» m
mm •
5k,
—— - ; -
CONSTRUCTION
. 1 _
^ :—
* *
» mim
m mm
m mmt
m mm
SHEET i OF i
HR300565

MONITOR ING "WELL LOGPROJECT American Color & Chemical, Lock Haven, PA BORING NO. B-3DRILLING METHOD SSA - GEOLOGISTDRILLER Geomechanics, Inc. DATE 7/14/83
GROUND ELEVATION GROUND WATER DEPTH (ft):TOP OF WELLDEPTH OF WEL
AT COMPLETION BENL (ft) AFTER HOURS !ifLUP
SCFCASING MATERIAL SCREEN
STRATA"DEPTH
5 -
10 -
15 -
20 .
mm
SAMPLEDEPTH
XXX,x.^ -_-f " ^ fc
XXX
•
^
»
^
•
m
DESCRIPTION '»
~ 'Brown-gray SOIL & GRAVEL fill!• - m
~ Brown-black grittly SLUDGE, faint odorg, ~-
— ' 0 . T]
: >_— i- yellow & brown fibrous material, rags, gloves
Brown-black-gray gritty SLUDGE, strong odor
"" Red-gray soupy SLUDGE, sweet odor, rags, gloves
~ Brown f SAND, some rock fragments, some black sludge '
~ Brown f SAND & SILT
nm m
M * ' •
••M* •_!
VEL PACK !TONITEK FILLCRETE£EN
~~w"M•>&.&
CONSTRUCTION
vy—
—
»
^
•••
•
•
•^
— *•
•;
-.__
SHEET 1 OF 1
A-R300S66

MONITORING WELL LOGPROJECT American Color & Chemical, Lock Haven, PA
DRILLING METHODDRILLER Geomechanics ,
GROUND ELEVATIONTOP OF WELLDEPTH OF BORING (ft.) 16 '5
CASING MATERIALSTRATADEPTH
5 -
10-
15 -
mm
SAMPLEDEPTHXXXxxxLX
•
m
mt
m
•mr
m
BORING NO. B-4SSA GEOLOGIST GillespieInc. DATE 7/15/83
GROUND WATER DEPTH (ft):AT COMPLETIONAFTER HOURS
SCREEN
DESCRIPTION
BENTONITE JE ESI
CONSCP
• ' •
~ Black/brown FILL
mm
~ Black silty CI
— Brown/gray si]
••
'•;; ;•oAY, some cmf sand
1 ,
S
Lty CLAY
,
^ *
•• i
mmmt mm
mm *
mm •
i^ -J™- •
CRETE •&&?;>EEN -I->Z-I-3
CONSTRUCTION
-
"i,
-.
—
• MB
> ' ^™
• ^BK
m m^
• tmm
•» ' HHB
• m^
••t «w
• • *M
• * ^
\ SHEET i OF i
IB300SS7

PROJECTMONITORING WELL LOG
American Color & Chemical, Lock Haven, PA BORING NO. B-5
DRILLING METHOD SSA GEOLOGIST GillespieDRILLER Geomechanics, Inc. DATE 7/15/83
GROUND ELEVATION GROUND WATER DEPTH (ft): ;,-.TOP OF WELLDEPTH
AT COMPLETION BENOF BORING (Ft) 36.5 AFTER HOURS £JJJ
VEL PACK I?* BTONITE EBBK FILLCRETE ««_•,-?,•
SCREEN C-I-I-I-I-CASING MATERIAL SCREEN
STRATADEPTH
«
«
5 ~
• "
10 -
15 -
20 -
2'5 -
30 _
35
40
SAMPLEDEPTHXxXxXxX
X
X.
JxC•
»
X•
DESCRIPTION
~ 'Cinder and gravel FILL^ "x. „
- _ •
— Brown/black SILT, some clay, roots
— Brown/gray silty CLAY
-^ Brown/gray silty SAND, tr f sand
- Sandstone BOULDERS & silty CLAY, tr fmc sand
- Brown f SAND, tr silt
.Gray mf SAND, gray sandstone pebbles -
_ ' _ •
_ Gray SILT, f sand, shale fragments & pebbles, gray
_ sandstone pebbles
CONSTRUCTION
^ —
: •:
> M
m * ^m
m mm
m mm
m f mm
'- •
SHEET x OF i
IR3005S8

MONITORING WELL LOGPROJECT American Color & Chemical, Lock Haven, PA BORING. NO. B-6DRILLING METHOD SSA GEOLOGIST AndersonDRILLER Geomechanics, Inc.
GROUND ELEVATIONTOP OF WELLDEPTH OF BORING (ft)1 53
CASING MATERIALITRATA"DEPTH
••
5 ~•
10 -
15 ~
25 -
30 -
35 -
40 -
SAMPLEDEPTH
XxxXxx5helby.
X• .
X
X^ ^'**'*+*~\y.Core/ \
DATE 7/17/83
GROUND WATER DEPTH (ft): crjAT COMPLETION 6.5 BEN
' AFTER HOURS *Jjjjv»r
SCREEN
DESCRIPTION
r- . Gravel FILL, some clay & silt QRfGritpt
•m* «
"~ Gravel FILL, brown silty ash, pebblesmm •
_ Brown/gray, mottled silty CLAYmmt •
_ Brown SILT & CLAY, tr f sand
- Gray silty CLAY w/brown laminations
M* •
mm
- Gray, blue-green af SANDSTONE PEBBLES,' some mf- gray & brown sand
•
Gray, triable' Gray SHALE, T_ thinly lamina"• Gray SHALE, f
Gray blccky S
SHALEloc in nature, concho-IHalT racturSig , ~tedissile. splintery, thinly laminated _ _JIALE, conchoidal edges, thinl'y Iaminate3
va PACK i;v.:>.''iTONITE nB|
CRETE &&&£EN 'jvuvir
CONSTRUCTION
-
t
• * ••*
» •••
• MM
• ^~"
• mrnrn
• mmm
m IVMK
mm mmmmf
SHEETJ;___OF 2
HR300569

. MONITORING WELL LOGPROJECT jAmerican Color & Chemical, Lock Haven, PA BORING NO.B-6DRILLING METHOD SSA GEOLOGISTDRILLER DATE
GROUND ELEVATION GROUND WATER DEPTH (ft): «-.„TOP OF WELL AT COMPLETION BENDEPTH OF BORING (Ft) k AFTER HOURS *J[j
CASING MATERsTRTiA"DEPTH
45 ~
50 J
55 -
SAMPLEDEPTH
7\\/Core/ \
N7tore/ \
•
mm
m»
•
••
m
mm
m
•SCRIAL SCREEN
DESCRIPTION
"Gray SHALE, very fissile, breaks into smallE tabular pieces -
Gray~SHSLETn "large "51<5cEsr~wifIi concHoUai edgesT" "I1 OC.Q__L3_LOQ3.1 GiG 1 J-T1 1 GITS ^—
" Gray SHALE, no evident fracture planes or cleavages.~ Blocky, with occasional splintered pieces.
••» •_;
•• * •
m m mm
VEL PACK l??mTONITE BIBK FILLCRETE «K*r??EEN C—HH:-
CONSTRUCTION
fc «i
SHEET 7 OF
fiR300570

MONITORING WELL LOGPROJECT American Color & Chemical, Lock Haven, PA "RnPTNC NO. B-7
DRILLING METHOD SSADRILLER Geomechanics, Inc.
GROUND ELEVATIONTOP OF WELLDEPTH OF BORING "(FT)
CASING MATERIALSTRATADEPTH
5 -
• •
10 -
15 -
20 -
25 -
SAMPLEDEPTHXXx_ ^ r " -1 ^
xC"* ^ ^ ^^ x
;~=xr
•
V
fm
»
»
•i*
GEOLOGIST AndersonDATE 7/17/83
GROUND WATER DEPTH (ft): crj]AT COMPLETION 5 BEh
' AFTER HOURS 5iCj_ kur•SCF
SCREEN
DESCRIPTION
_ • Gravel , cindei
- Mottled brown- sweet odor
Brown silty CI
C; -. -i•, asphalt FILL ., i
& gray SILT & CLAY & GRAVEL fill,
AT w/some "peat"
~ Gray f SAND, sweet odor
" Red/brown SILT, some clay
~ Black/gray SHALE, some siltstone; orange/yellow~ stain, thinly laminated, fissile; some silt
- Black fissile SHALE some silt stone
•• *
^ •
mmmm mm
MB *
MEL PACK I;* •. ;:•.••{ITONITE IBBSa;K FILLiCRETE -«rj?j?r(EEN -HI-I-I-I-
CONSTRUCTION
-
—
•
• ^M»
__
•• ••••V
!•• •M
• * «W»
• «•*
• ^^
"» B ^

MONITORING WELL LOGPROJECT American Color & Chemical, Lock Haven, PA BORING NO. B-8
DRILLING METHOD SSA GEOLOGIST AndersonDRILLER Geomechanics, Inc. DATE 7/18/83
GROUND ELEVATION GROUND WATER DEPTH (ft): -„. — mwmAT ffltJIFH ITTTnu r- n nfli
VEL PACK IflflffgTOP OF WELL "i uui-iruc. i ivn D.U Dc.ruuNiit WmmmKUDEPTH OF BORING (FT)1 21.5 AFTER HOURS *J{jK FILL
CRETE *fOj?&' SCREEN -HHHI-2
CASING MATERIAL SCREEN1tRATADEPTH
*
5 -
10 -
15 -
20 -
25 ~
SAMPLEDEPTHXXxxxXX
X
•
*
•»
mm
m
m
m
m
mm
DESCRIPTION
- TOPSOIL, gravel, cinder fill, mild odor
Cv t
•• m
Light brown silty CLAY,' tr vf sand
~ Light brown silty CLAY, tr vf sand, tr pebbles
- Light brown silty CLAY, tr vf sand, tr pebbles,- -occasional shale & siltstone fragments
^
Light brown weathered SILTSTONE, tr clay, siltstonePenol PS ,. „,„
— '
CONSTRUCTION
b mm
*
-
- •
—
mm * mmmm*
'- +
SHEET 1 OF 1
AR300572

MONITORING WELL LOGPROJECT American ColorDRILLING METHOD SSADRILLER Geatnechanics, Inc.
GROUND ELEVATIONTOP OF WELLDEPTH OF BORING (FT) 21.5
CASING MATEF"STRATADEPTH
•
• 5_
10 _
15 -
20 -
25 -
SAMPLEDEPTHX"•• •*> >N*>>
X" "**x >"v».
XXxi
X
m
m
mm
m
•
mm
,IAL
& Chemical, Lock Haven, PA BORING NO. B-9GEOLOGIST AndersonDATE 7/18/83
GROUND WATER DEPTH (ft): ^AT COMPLETION 16.5 BE^
' AFTER HOURS 5iC• _,_,,„,..,_, ,,_,.. mmm cor
iVEL PACK &•.$•:']ITONITE BSal,K FILLCRETE >&rlt
SCREEN r»Z-I-I-SCREEN
•
DESCRIPTION
- GRAVEL, cinder fill . .
- CONUKKTli..
Light brown S"mm
[LT, some f sand 9 some clay
V;'"- '*'•Brown fm SAND
_ Lt brown silt_ imbedded
. tr sandstone pebblesf CLAY with shale & silt stone pebbles
••M •
Lt .irown Clayey wtsauueteu QJUJ-JJ.OJ.WIIJEI, very j.a.ssj..Le wf~- silt stone pebbles imbedded
•• •
•» •
•B «
* "** ' , mM
mm f
mm •
•* . *
CONSTRUCTION
• «••
f
• mm
m , *•
• . mm
mm • mmmm
m mtm
m mm*;t
— !• «•»•imm, tmmimm
fmf •!••••
» • ^*>
» ^ff
mmt m ^
SHEET 1 OF. 1
SB3QQS73

PROJECTMONITORING WELL LOG
American Color & Chemical, Lock Haven, PA BORING NO. B-10
DRILLING METHOD SSA • GEOLOGIST AndersonDRILLER Geomechanics, Inc. DATE 7/17/83
GROUND ELEVATION GROUND WATER DEPTH (ft):TOP OF WELL AT COMPLETION 5.0DEPTH OF BORING (FT) 21.5 AFTER HOURS
CASING MATERIAL SCREENSTRATA"DEPTH
•
5 -
10 -
15 ~
20 -
25 -
mm
SAMPLEDEPTH><,
Xxxxxr><
CX
•
mm
•»
' DESCRIPTION
- "-1" rJBGRAVa PACK |.V.yjBENTONITE fiBBBACK FILLCONCRETE K-S-vrfr
• SCREEN \3S5S2
GRAVEL & CINDER fill, garbage odor
r
' ' ~' \ f
^ •
crown LO gray mottled clayey alLI- Gray to brown f SAND
— Brown and gray SILT & CLAY, tr f sandv»ray clayey ajj_i
—
CONSTRUCTION
^
- »
• MM
«"» ^mmmmi
m fmmi
m mmrn
» ^m*
• ^ ^ ^ HM«mm ^ ^ JKmmm
SHEET 1 OF 1
H-R30057.U

MONITORING WELL LOGPROJECT American Color & Chemical, Lock Haven, PA BORING NO. B-llDRILLING METHOD SSADRILLER Geomechanics, Inc.
GROUND ELEVATIONTOP OF WELLDEPTH OF BOR
CASING MATERSTRATADEPTH
5"
10 ~
15 '
20 J
25 ~
SAMPLEDEPTH
XXxXXXx
X
m
mm
»
•
ING (FT 21.0
JAL
GEOLOGIST AndersonDATE 7/18/83
GROUND WATER DEPTH (ft): mAT COMPLETION 5.0 BEN
' AFTER HOURS Si?LurSCF
SCREEN-
DESCRIPTION
GRAVEL & CINDER fill, some sand
° >.
Imm •
"™ Brown— erav mottled SILT & CLAY, tr f sand,_ grav si±tv t SAND— Gray siltv CLAY ____________ . ________________ =
- Brown SILT & fm SAND, tr clay•• •
CLAY & SILT, tr £ sand, brown & gray mottled silty- CTJVY
i
»
*
M
TONITE ipjlaUKc. i tm tisiiL i1EEN bs-d
CONSTRUCTION
. -^
f
™ ^~
• mm
-
mr mmmi
SHEET i OF i

PROJECT .MONITORING WELL LOG
American Color & Chemical, Lock Haven, PA BORING NO. B-12
DRILLING METHOD SSA GEOLOGIST AndersonDRILLER Geomechanics, Inc. DATE 7/18/83 . _
GROUND ELEVATION GROUND WATER DEPTH (ft):TOP OF WELL AT COMPLETION 4.5DEPTH OF30RING (Ft) 21.5 AFTER HOURS
CASING MATERIAL SCREEN
DEPTH
•
5 ~
•
10 -
15 -
20 -
SAMPLEDEPTHXXxX" •^_ ** *****
XX
Xmm
m
r
•
•
m
mm
DESCRIPTION
GRAVa PACK|7*2SBENTONITE KS9BACK FILL HH^CONCRETE Wrf?.-SCREEN -HKHH:-
" GRAVEL & CINDER fill
- Jr' W "
Fuel oil odor
_ Brown-gray SILTSTONE, some clay••
Brown SILT, tr clay, tr pebbles, tr f sand
"*
Brown clayey SILT, layered with gray clayey silt,H tT f sand
CONSTRUCTION
mm*
—_^_B
-
m ^ ^ ^ B**
mm ^ ^ ffmmm
SHEET 1 OF 1
HR30Q576

MONITORING WELL LOGPROJECT American Color & Chemical, Lock Haven, PA BORING NO. B-13DRILLING METHODDRILLER
SSA GEOLOGIST Gillespie.Geomechanics, Inc. DATE 7/19/83
GROUND ELEVATIONTOP OF WELLDEPTH OF BORING (FT)
CASING MATERSTRATADEPTH
5-
10 -
15-
20 -
25 -
SAMPLEDEPTHXxxx1i*...><_XX*" X*V-
XxXs
•
•
!_•
m
m
IAL
GROUND WATER DEPTH (ft): GWAT COMPLETION BENAFTER HOURS ?}£
inn ii inn ""' """ "" ' ' " ~" " . 'in, '1 mm *»"'
iVEL PACK IV. ::*.*'lTONITE jS mK FILLCRETE feCE/y.4
SCREEN KKHrl-ZHSCREEN
•
DESCRIPTION•
~ . Black/brown clayey SILT, tr f sand, slight fuel~ odor
- Brown/gray SILT & CLAY, fuel odor rg-~--..t. . ^-
_ Black ROCK fragments, cinders
mm m
_ Black/gray silty CLAY, slight odor
SANP & SANDSTONE
p Brown/tan SIL'r & CLAY, tr f sand
- Gray silty CLAY, tr f sand, tr gray shale
•m m
mmmm mm
mm ' *
mm, •
CONSTRUCTION
• . ^
•
.
m> mm
m mm
-
m mim
m f^
• & mmm
m • mm
m mmm
SHEET 1 OF l
AR300577

MONITORING WELL LOGPROJECT American Color & Chemical, Lock Haven, PA WELL NO.MW 19BDRILLING METHOD SSA GEOLOGISTDRILLER Geomechanics, Inc. DATE 7/13/83 ^
GROUND ELEVATION 563.88 GROUND WATER DEPTH (ft):TOP OF WELLDEPTH
565.58 AT COMPLETIONOF WELL (ft) 34 AFTER HOURS
CASING MATERSY'RATADEPTH
5 -
10 -
15 -
20 -
25 -
30 -
35 _
SAMPLEDEPTHXXXXxx
v>C'
X•
X•
^ ^_ * ** .
•
IAL 2" pvc SCREEN 2" PVC, .010 slot
DESCRIPTION
- • r- CINDER fill .OR/C
...,,.,____GRAVEL PACK |;*'*S*.'1BENTONITE E£3-3lBACK FILLCONCRETESCREEN
5rv«P\*
- l~ Gray-brown mottled clayey SILT, tr f sand
™» * •
~ Gray clayey SILT, tr f sandmm »
mm
- Brown f SAND, tr silt
\ ,
_
Light gray quartz SANDSTONE
-
•
•
•ic'-r',-
CONSTRUCTION
•
•
*
»
»
\_v
» *'
"i"if.f«.»• *
;:
i
——
S
-
Pil —
^
1 Iv:-«•:
f~
>.• ~
*• mQ •
*'• -
|j :
•SHEET i OF i
AR3QQ578

DRAFT
APPENDIX C
SCIENTIFIC AND COMMON NAMES OF FISH SPECIESCOLLECTED IN BALD EAGLE CREEK,
BETWEEN SPRING CREEK AND FISHING CREEK, oxLOCK HAVEN STATE COLLEGE, 1976 "
______ Scientific Name _______ _______ Common Name _
AnguillidaeAnguilla rostrata American Eel
SalmonidaeSalmo trutta Brown Trout
EsocidaeEsox lucius Northern PikeEsox masquinongy Muskellunge
niger Chain Pickerel
CyprinidaeCampostama anomalum StonerollerCyprinus carpio Common CarpExoqlossum maxillingua Cutlips MinnowHvbopsis micropogon River ChubNotemigonus crysoleucas Golden ShinerNotropis cornutus Common ShinerNotropis procne Swallowtail ShinerNotropis rubellus Rosyface ShinerNotropis spilopterus Spotfin ShinerPimephales notatus Bluntnose MinnowRhinichvthvs atratulus Blacknose DaceSemotilus corparalis Fall Fish
CatostomidaeCatostomus commersonl Common SuckerHypentellum nigricans Northern Hogsucker
IctaluridaeIctalurus natalis Yellow BullheadIctalurus nebulosus Brown BullheadNoturus flarus Stonecat
C-l

DRAFT
APPENDIX CSCIENTIFIC AND COMMON NAMES OF FISH SPECIESCOLLECTED IN BALD EAGLE CREEK,BETWEEN SPRING CREEK AND FISHING CREEK,LOCK HAVEN STATE COLLEGE, 1976PAGE TWO
_____' Scientific Name______ ____ Common Name_________
CentrachidaeAmbloplites rupestris Rock BassLepomis auritus Redbreast SunfishLepomis gibbosus Pumpkinseed ,Lepomis macrochirus Bluegill fLepomis megalotis Longear SunfishMicropterus dolomieui Smallmouth Bass vMicropterus salmoides Largemouth Bass
PercidaeEtheostoma nigrum Johnny DarterPercina peltata Shield DarterPerca flavescens Yellow Perch ' /Uf'-V/t,Stizostedion vitreum Walleye
C-2
R.R300580