Q nnn 1 - Records Collections
446
5 Q n n n 1 S U U J I 10098837 RECORD OF DECISION SUV1MARY OF REMEDIAL ALTERNATIVE SELECTION AQUA-TECH ENVIRONMENTAL INC. (GROCE LABS) SITE GREEK, SPARTANBURG COUNTY, SOUTH CAROLINA PREPARED BY: U.S. ENVIRONMENTAL PROTECTION AGENCY * REGION 4 ATLANTA, GEORGIA SEPTEMBER 2003
-
Upload
khangminh22 -
Category
Documents
-
view
0 -
download
0
Transcript of Q nnn 1 - Records Collections

5 Q n n n 1S U U J I
10098837
RECORD OF DECISIONSUV1MARY OF REMEDIAL ALTERNATIVE SELECTION
AQUA-TECH ENVIRONMENTAL INC.(GROCE LABS) SITE
GREEK, SPARTANBURG COUNTY, SOUTH CAROLINA
PREPARED BY:
U.S. ENVIRONMENTAL PROTECTION AGENCY* REGION 4
ATLANTA, GEORGIA
SEPTEMBER 2003
0 0 G 2
TABLE OF CONTENTS
LIST OF ACRONYMS and ABBREVIATIONS . . . . . . . . . . . . . . . . . . . . . . . . . . . . . . . . . . . . . . . . . . . . . . . . . . . . . . . . . . . . . . . . . . . . . . .v
PARTI; THE DECLARATION.... . . . . . . . . . . . . . . . . . . . . . . . . . . . . . . . . . . . . . . . . . . . . . . . . . . . . . . . . . . . . . . . . . . . . . . . . . . . . . . . . . . . . . . . . . . . . . .vi
A. Site Name a.id Location.............................................................................................................viiB. Statement of Basis andPurpose.................................................................................................viiC. Assessment of Site....................................................................................................................viiD. Description of Selected Remedy................................................................................................viiE. Statutory Determinations..........................................................................................................viiiF. Data Certification Checklist.....................................................................................................viiiG. Authorizing Signatures...............................................................................................................ix
PART II: THE DECISION SUMMARY . . . . . . . . . . . . . . . . . . . . . . . . . . . . . . . . . . . . . . . . . . . . . . . . . . . . . . . . . . . . . . . . . . . . . . . . . . . . . . . . . . . . 1
A. SITE NAME, SITE LOCATION, AND BRIEF DESCRIPTION . . . . . . . . . . . . . . . . . . . . . . . . . . . . . . . . 1A.I Site Identification and Location ...............................................................................1A.2 Lead and Support Agencies......................................................................................!A.3 Source of Cleanup Monies........................................................................................!A.4 Site Type and Brief Description................................................................................!
A..4.1 Areas of Operations.....................................................................................2
B. SITE HISTORY AND ENFORCEMENT ACTIVITIES . . . . . . . . . . . . . . . . . . . . . . . . . . . . . . . . . . . . . . . . . . . . . . 4B.I Activities that lead to the current problems..............................................................4.B.2 Previous Investigations.............................................................................................4B.3 Remedial Investigations............................................................................................6B.4 Enforcement Activities.............................................................................................?
C. COMMUNITY PARTICIPATION .. . . . . . . . . . . . . . . . . . . . . . . . . . . . . . . . . . . . . . . . . . . . . . . . . . . . . . . . . . . . . . . . . . . . . . . . . . . . . . . 8
D. SCOP!) AND ROLE OF OPERABLE UNIT OR RESPONSE ACTION....................9
E. SITE CHARACTERISTICS.............................................................................................9E.I Conceptual Site Model.............................................................................................9E.2 Site Features...........................................................................................................11E.3 Site Geology.......................................................'...................................................11
E.3.1 Landfill Cover and Waste Material...........................................................11E.3.2 Residuum/Saprolite Unit..............................;............................................12E.3.3 Bedrock Unit............................................................................................12
E.4 Site Hydrogeology .................................................................................................13E.4.1 Saprolite Unit........................................................................................... 13E.4.2 Shallow Bedrock Unit...............................................................................14

E.4.3 BedrockUnit...............................................................................................14E.5 3roundwater Flow System .....................................................................................15E.6 Surface Water Hydrology ......................................................................................15E.I Demography and Land Use ...................................................................................15E.8 Ecological Setting ..................................................................................................16E.9 Nature and Extent of Contamination......................................................................17
E.9.1 General Sampling Strategy......................................................................... 17E.9.2 Brief Overview of Know and/or Suspected Sources of Contamination.....17E.9.3 Types of Contamination and Affected Media............................................17E.9.4 Landfill Gas............................................................................................... 18E.9.5 Surface and Subsurface Soil.......................................................................18
E.9.5.1 Summary Results of the 1993 Soil Investigation and RIPhase I, II and m Soil Activities........................................19
E.9.5.2 Summary Results of the RI Phase IV Soil Activities...............20E.9.6 Groundwater..............................................................................................21
E.9.6.1 Summary of Groundwater Activities.........................................22E.9.6.2 Groundwater Characterization...................................................22E.9.6.3 Semi-volatile Compounds.........................................................23E.9.6.4 Pesticides...................................................................................24E.9.6.5 Volatile Organic Compounds....................................................25E.9.6.6 Metals........................................................................................27
E.9.7 Sediment....................................................................................................29E.9.8 Surface Water.............................................................................................31
E.10 Contaminant Fate and Transport.............................................................................33
F. CURRENT AND POTENTIAL FUTURE LAND AND WATER USES.........................34F.I LandUses........................................................................................:.......................34F.2 Groundwater Uses...................................................................................................34F.3 Surface Water Uses.................................................................................................34
G. SUMMARY OF SITE RISKS.. . . . . . . . . . . . . . . . . . . . . . . . . . . . . . . . . . . . . . . . . . . . . . . . . . . . . . . . . . . . . . . . . . . . . . . . . . . . . . . . . . . . . . . . .34G.I Summary of Human Health Risk Assessment......................................................... 34
G.I.I Conceptual Site Model..............................................................................36G.I.2 Identification of Chemicals of Concern....................................................37G.I.3 Exposure Assessment................................................................................38G.I.4 Toxicity Assessment................................................................................. 40G.1.5 Risk Characterization................................................................................42G.1.6 "HotSpots"................................................................................................46G.1.7 Uncertainties.............................................................................................50
G.2. Ecological Risk Assessment Summary..................................................................51.G.3 Basis for Action......................................................................................................52
H. REMEDIAL ACTION OBJECTIVES... . . . . . . . . . . . . . . . . . . . . . . . . . . . . . . . . . . . . . . . . . . . . . . . . . . . . . . . . . . . . . . . . . . . . . . . .52
9 0 0 0 4
I. DESCRIPTIONOFALTERNATIVES..........................................................................531.1 Description of Remedy Components.......................................................................53
1.1.1 Soil Alternatives and Groundwater Altematives........................................541.1.2 Soil Alternatives.........................................................................................551.1.3 Groundwater Alternatives...........................................................................59
1.2 Common Elements and Distinguishing Features of Each Alternative.................... 61
J. SUMNIARY OF COMPARATIVE ANALYSIS OF ALTERNATIVES.....................^ 1J.I Threshold Criteria..................................................................................................^!
J.I.I Overall Protection of Human Health and the Environment.......................61J.1.2 Compliance with ARARs...........................................................................62
J.2 Primary Balancing Criteria......................................................................................62J.2.1 Long-term Effectiveness and Permanence..................................................62J.2.2 Reduction of Toxicity, Mobility, or Volume through Treatment...............63J.2.3 Short-term Effectiveness...........................................................................64J.2.4 Implementability........................................................................................64J.2.5 Cost.............................................................................................................65
J.3 Modifying Criteria...................................................................................................65J.3.1 State/Support Agency Acceptance.;............................................................65J.3.2 Community Acceptance..............................................................................65
K. PRINCIPAL THREAT WASTE.. . . . . . . . . . . . . . . . . . . . : . . . . . . . . . . . . . . . . . . . . . . . . . . . . . . . . . . . . . . . . . . . . . . . . . . . . . . . . . . . . . . . .74
L. SUMMARY OFTHE PREFERRED ALTERNATIVE.................................................70L.I Description of the Remedy..........................................................:............................70L.2 Summary of the Rationale for the Selected Remedy................................................76L.3 Summary of Estimated Remedy Costs.....................................................................76L.4 Expected Outcomes of the Selected Remedy...........................................................80L.5 Final Clean-upLevels...............................................................................................80
M. STATUTORYDETERMINATIONS...............................................................................83M.I Protection of Human Health and the Environment..................................................83M.2 Compliance with Applicable or Relevant and Appropriate Requirements..............83M.3 CostEffectiveness........................................................................,...........................90M.4 Utilization of Permanent Solutions and Alternative Treatment (or Resource
Recovery) Technologies to the Maximum Extent Practicable (MEP).....................90M.5 Preference for Treatment as aPrincipal Element.....................................................90M.6 Five-Year Review Requirements.............................................................................90
N. DOCUMENTATIONOFSIGNIFICANT CHANGES...................................................90
in

PART III: THE RESPONSIVENESS SUMMARY...... . . . . . . . . . . . . . . . . . . . . . . . . . . . . . . . . . . . . . . . . . . . . . . . . . . . . . .........92
LIST OF FIGURES (All Figures except Figure 8 are located in Appendix A)Figure 8 - Conceptual Site Model Developed for the RI................................................... ............... 10
LIST OF TAIiLESTable 1 - Summary of Previous Investigations................................................................................^Table 2 - Summary of Exposure Pathways Evaluated Quantitatively.... ......................................... .35Table 3 - Conceptual Site Model for the BRA (Exposure Scenarios Evaluated Quantitatively).... .36Table 4- BRA GOCs for Surface Soil................ .................................................................. ............37Table 4a- BRA COCs for Subsurface Soil....... .......................................................................... .....37TableS -BRA COC for Air........................ ......................................................................... .............37Table6 -BRA GOCs for Groundwater..... ................................................................................... ....37Table 7 -Exposure Assumptions...................................................................................................... 39Table 8 - Non-Cancer Toxicity Data Summary for the Primary Chemicals of Concern.... ........... ...41Table 9 - Cancer Toxicity Data Summary for the Primary Chemicals of Concern................ ........ ..41Table 10 -Risk Characterization Summary -Carcinogens............................................................... 44Table 1 1 - Risk Characterization Summary - Non-Carcinogens................................... ...................45Table 12 - Remedial Goals for Commerical/Industrial Use COCs for Soils......... .............. .............47Table 13 -Remedial Goals for Residential Use COCs for Groundwater..... ............................. .......49Table 14 -Summary of Comparative Analysis................................................................................ 66Table 15 -Estimated Cost of the Remedy................. .................................................................. .....77Table 16 -Soil Clean-up Levels...... ............................................................................................ .....81Table 17 -Groundwater Clean-up Levels.........................................................................................81.Table 18 - Summary of Potential Applicable or Relevant and Appropriate Requirements.. ......... ..84
APPENDICESAPPENDIX A: FIGURES 1-7, 9-37 '.APPENDIX B: DATA TABLES (for all environmental media)APPENDIX C: RAGS PART D TABLES (obtained from the BRA - Dated August 2002)APPENDIX D: RECORD OF PUBLIC MEETING - 8/5/03APPENDIX E: PROPOSED PLAN FACT SHEETAPPENDIX F: INFORMATION REPOSITORIESAPPENDIX G: (DRAFT) ADMINISTRATIVE RECORD INDEX FOR THE AQUA-
TECPt ENVIRONMENTAL SITE (DATED JULY 2003)APPENDIX H: STATE CONCURRENCE LETTER
IV
5 9 0 0 0 6
LIST OF ACRONYMS and ABBREVIATIONS
AOC - Administrative Order by ConsentAMLS-Above Mean Sea LevelARAR- Applicable or Relevant and Appropriate RegulationsBGS or bgs - below ground surfaceBRA- Baseline Risk AssessmentCERCLA-Corrprehensive Environmental Response, Compensation, and Liability Act of 1980CFR - Code of Federal RegulationsCOC-Chemical of ConcernCOPC-Chemicals of Potential ConcernCRA-Conestoga Rovers and AssociatesEU-1 - Exposure Unit OneEU-2 - Exposure Unit TwoEPA - Environmental Protection AgencyEPC - Exposure Point ConcentrationEPS- Exposure Pathway ScenariosERA- Ecological Risk AssessmentESI - Expanded Site InspectionET- Exploratory TrenchingFML - Flexible Membrane LinerFS - Feasibility Studyft/day - foot per dayft/s-foot per secondft/yr - foot per yearftVyr- cubic feet per yearin/yr - inches per yearGLI - Groce Labs IncorporatedHRC - Hydrogen Release CompoundHEAST - Health Effects Assessment Summary TablesHi-Hazard IndexHQ-Hazard QuotientIRIS-Integrated Risk Information SystemLG - Landfill GasMCL- Maximum Contaminant LevelMEP- Maximum Extent Practicable/ig/L - Micrognms per litermg/kg- milligrams per kilogram or parts per million (ppm)mg/cm2 - milligrams per square centimetersmg3/kg - cubic meters per kilogramMNA - Monitored Natural AttenuationMSW - Municipal Solid WasteMSWL - Municipal Solid Waste Landfill

7/
NCEA - National Center for Environmental AssessmentNCP - National Contingency PlanNPL - National Priority ListO&M - Operation and MaintenancePCBs - Polych lorinated BiphenylsPID- photoionization detectorppb -parts per billionppm - parts per millionppmv - part per million per volumePRO - EPA Region 9 Preliminary Remediation GoalsPRPs - Potentially Responsible PartiesRAO - Remedial Action ObjectivesRCRA - Resource Conservation and Recovery ActRD/RA - Remedial Design/Remedial ActionRG - Remedial GoalRI - Remedial 'InvestigationRI/FS - Remedial Investigation/Feasibility StudyROD - Record of DecisionRPM- Remedial Project ManagerSARA- Superf jnd Amendments and Reauthorization Act of 1986SB - Soil Borir.gSCDHEC - South Carolina Department of Health & Environmental ControlSC MAACs - J.'outh Carolina Maximum Ambient Air ConcentrationsSDWA - Safe Drinking Water ActSMCLs - Secondary Maximum Contaminant LevelsSVOCs Semi -Volatile Organic CompoundsTAL - Target Analyte ListTCL - Target Compound ListTEQ- Toxicity Equivalence QuotientUAO - Unilateral Administrative Orderu.g/kg - micrograms per kilogramu.g/L - micrograms per LiterUS - United StatesUSGS - United States Geological ServiceVOCs - Volatile Organic Compoundsyd3 cubic yards< less than
VI

0 0 0 8
PART I: THE DECLARATION
A. Site Name and Location
Aqua-Tech Environmental Inc. (Groce Labs) SiteThe EPA Site Identification Number is SCD058754789Greer, Spartanburg County, South Carolina
B. Statement of Basis and Purpose
This decision document presents the Selected Remedy for the Aqua-Tech Environmental Inc. (GroceLabs) Site which was chosen in accordance with the Comprehensive Environmental Response,Compensation, and Liability Act of 1980 (CERCLA), as amended by the Superfund Amendments andReauthorizatio:i Act of 1986 (SARA), and, to the extent practicable, the National Contingency Plan(NCP). This decision is based on the Administrative Record for the Site.
The State of South Carolina concurs with the Selected Remedy.
C. Assessment of Site
The response action selected in this Record of Decision is necessary to protect the public health orwelfare and the environment from actual or threatened releases of hazardous substancesto the environment.
D. Description of Selected Remedy
The Selected Remedy employs the Presumptive Remedy for CERCLA municipal landfills(containment) as one of five (5) major components, which are briefly described below:
1) Site Capping using a combination of a RCRA Subtitle C Cover and RCRA Subtitle D soilcover for different portions of the municipal landfill to ensure all municipal waste is isolatedfrom exposure and provide an extra level of protection in areas where the greatestconceni rations of VOCs were reported;
2) In Situ Soil Treatment in the former Process Distillation Area to reduce the mass of VOCs inshallow soils throughout this area;
3) In Situ Groundwater Treatment by chemical injection to immediately reduce the contaminantmass and enhance the long term biodegradation of residual VOCs in groundwater. Once insitu treatment is complete, final remediation of groundwater will be achieved through naturalattenuation;
4) Routine groundwater monitoring and Site inspections to assess the effectiveness and integrityof the selected remedial alternative; and,
VI1

0 0 0 9
5) . Institutional Controls to restrict use and development of the Site to minimize public exposureto residual contaminants, and to ensure the long-term integrity of the remedy.
E. Statute ry Determinations
The Selected Remedy is protective of human health and the environment, complies with Federal andState requirements that are applicable or relevant and appropriate to the remedial action (unlessjustified by a waiver), is cost effective, and utilizes permanent solutions and alternative treatment (orresource recovery) technologies to the maximum extent practicable. For soil and groundwater, thisremedy satisfies the statutory preference for treatment as a principal element of the remedy (i.e.,itreduces the toxicity, mobility, or volume of hazardous substances as a principal element throughtreatment).
The Selected Pemedy includes a Presumptive Remedy for the landfill at the Site. Therefore, uponcompletion of this remedy, hazardous substances, pollutants, or contaminants wil l remain on-siteunder the landfill cap and will limit use of the property. Because this remedy will result in hazardoussubstances, pollutants, or contaminants remaining on-site above levels that allow for unlimited useand unrestricted exposure, a statutory review will be conducted within five years after commencementof remedial action to ensure that the remedy is, or will be, protective of human health and theenvironment.
F. Data Certification Checklist
The following nformation is included in the Decision Summary section of this Record ofDecision (Part 2). Additional information can be found in the Administrative Record file for thisSite.
• Chemicals of concern and their respective concentrations (pages 37, 38)• Baseline risk represented by the chemicals of concern (page 44, 45)• Clean-up levels established for chemicals of concern and the basis for these levels
(page 81,82)• How source .materials constituting principal threats are addressed (page 70)• Current and reasonably anticipated future land use assumptions and current and
potential future beneficial uses of groundwater used in the Baseline Risk Assessmentand ROD (page 34)
• Potential! land, groundwater and surface water use that will be available at the site asa result of the Selected Remedy (page 80)
• Estimated capital, annual operation and maintenance (O&M), and total present worth:osts, discount rate, and the number of years over which the remedy cost estimates areprojected (pages 77-79)
vm
Key factors that led to selecting the remedy (pages 61-69,76)
G. Authorizing Signature
3LWinston A. Sr.iith, Director DateWaste Management DivisionUnited States Environmental Protection Agency, Region 4
0

r; n .-. ^ iJ :> u u i
PART II: TH E DECISION SUMMARY
A. SITE NAME. LOCATION, AND BRIEF DESCRIPTION
A.I Site Identification and Location
The United States Environmental Protection Agency's (EPA) Identification Number for theAqua-Tech Environmental Inc. (Groce Labs) Site (the "Site") is SCD058754789. The Siteis localed on Robinson Road near its intersection with South Carolina Highway 290,approximately 3 miles east of the City of Greer, and approximately 1 mile west of the Cityof Duncan, South Carolina (Figure 1). The Site's coordinates are latitude 34° 56' 10.0" N andlongitude 82° 10' 15" W.
A.2 Lead and Support Agencies
The lead agency for the CERCLA regulatory response at the Site is EPA. The South CarolinaDepart!nent of Health and Environmental Control (SCDHEC), Office of EnvironmentalQuality Control, is the support agency.
A.3 Source of Cleanup Monies
The monies for the response actions at the Site have largely come from the Aqua-TechPotentially Responsible Party Group (PRP Group). Under a Unilateral Administrative Order(UAO): the PRP Group was obligated to pay for the cost of the Removal Action. Under anAdministrative Order on Consent (AOC) for the Remedial Investigation and FeasibilityStudy (RI/FS), the PRP Group is obligated to pay USEPA's oversight costs of the RI/FS aswell as i:he cost of the RI/FS. EPA intends to negotiate a consent decree for Remedial Designand Remedial Action (RD/RA) with the PRPs.
A.4 Site Description
The Siti; occupies 61.56 acres of land. A former Resource Conservation and Recovery Act(RCRA) hazardous waste treatment and storage facility previously occupied approximately20 acrc-s of the Site. A closed municipal solid waste landfill (MSWL) occupiesapproximately 10 acres of the Site. The RCRA treatment and storage facility overlappedwith portions of the closed MSWL. The primary operating areas of the RCRA facility aredescribed in Section A.4.1 and illustrated on Figure 2.
The Site is presently abandoned and the land surrounding the Site is generally wooded, withthe closest residences located approximately 650 feet to the east of the Site on RobinsonRoad. There are several small businesses and residences to the north of the Site on SCHighway 290. The area west of the Site is former farmland. The nearest surface water body
0c..
is Maple Creek, which is located on the southern boundary of the Site. There are severalresidential neighborhoods consisting of a few houses each within a 1-mile radius of the Site.The Sit; is zoned as commercial/industrial and is located within the "Airport Environs Area"as defii ted by the Greenville - Spartanburg Airport Environs Area zoning Ordinance, datedMarch 29,1996. This zoning ordinance precludes future residential development use of theSite.
A.4.1 Areas of Operations
The primary former areas of operation that were considered to be potential sources ofcontamination are as follows:
the 501-09 Area;502A, 502B, 503 Areas;
• 504 Area;505 Area;601/602 Area;PC 13 Area; and,
• Process Distillation Area including adjacent Incineration Area and Tank StorageArea.
501 Building and AreaThe 50.1 Building was used for storage of explosive materials and for the storage of lab packwaste. Additionally, flammable solvent materials were stored in this area. All materialsstored i i this building were reportedly mutually compatible; therefore, no internal separationswere present in the storage facility.
The 50i. Loading/Unloading Area is a concrete platform on the east side of the 501 Building.This area was used to load and unload non bulk shipments received by the facility duringoperation. The uncurbed, uncovered pad is approximately 100 feet by 25 feet. The loadingdock area was used throughout the removal by SCDHEC, USEPA, the PRP Group, andrespective contractors. Materials ranging from flammables, organics, reactives, acids, andbases h ive been shipped off-site from this location.
The 50:1 Building and area is located on the closed MSWL.
502A. flQ2B. 503 AreasThese areas were used for interim status outdoor drum storage during the operation of thefacility. In addition to storage of acids, the northern portions of these areas were used fordrummed product storage. Three portions of these areas are covered with 4 inch thickconcrete pads with sumps. All of the sumps were filled with sand and covered with concreteduring I he removal action.
0 0 1 3
504 AieaThe 504- Area was used for interim status outdoor storage of oxidizers, and a portion of thisarea is covered, with a 4 inch thick concrete pad. In addition to outdoor storage, someoxidizers were stored in a metal storage trailer during operation of the facility. Area 504 wasexcavated into a hillside and sloped to the southwest to keep water away from the oxidizers.
505 AreaThe 505 Area was used as a process and storage area for both cyanide and poison wastes,includi ng electroplating wastes and wastes containing arsenic and mercury. A portion of thearea is covered with a 4 inch thick concrete pad.
601/60 2 AreaThis area was used for interim status outdoor drum storage during the operation of thefacility. The two portions of this area include approximately 2 acres and contained poisonousand coiTOsive wastes in separate areas divided by a dirt roadway.
PCU AreaThe PC 13 Area was used to neutralize phosphorus trichloride production waste with a sodiumhydroxide solution. The area is located southwest of the Process Distillation Area. This areais cove ~ed with a thick concrete pad approximately 100 feet by 50 feet. The curbed pad wasused fcr staging 55 gallon drums containing acid and base waste materials.
Process Distillation Area (Including Incineration and Tank Storage Areas)The Process Distillation Area was the primary area for performing fuel blending andrecycling operations for the facility. It is located over the closed MSWL. The ProcessDistillation Area supported as many as 40 tanks during operation of the facility. The processand sto :age vessels in this area were not permanent during operation of the facility; and whennot in i.se, they were stored in the nearby equipment yard. The area is covered with a thickconcrete pad measuring approximately 100 feet by 80 feet. The concrete pad has a secondarycontainment structure consisting of concrete block walls approximately 2 feet high.
The Inc ineration Area was located in the northwest corner of the Site adjacent to the ProcessDistillation Area and contained a sodium reactor that was used to react sodium metal withwaste to produce sodium hydroxide solutions and an incinerator used to melt offspecification hand grenades, bullets, and blasting caps, A portion of the area is covered bya concrete pad \vith secondary containment structures.
Tank Storage Areas 1 and 2 contained approximately six to ten tanks during the operationof the facility. Hazardous materials were pumped into various tanks on-site until properdisposd was arranged. The area is covered with a 4 inch thick concrete pad with secondarycontainment. The area is located adjacent to the Process Distillation Area over the closedMSWL.

B. SITE HISTORY AND ENFORCEMENT ACTIVITIES
B.I Activities that led to the Current Problems
Prior to the 1940's, activities at the Site are unknown. The Site was used for wastemanagement activities as early as the 1940's when local residents used the property forgenera! dumping. It is unknown who owned the Site before the 1950's or 1960's when theCity of Greer purchased the 35-acre parcel of Site property. From 1963 until 1968, the Cityoperated a MSWL covering approximately 10 acres of the Site. The MSWL wassubsequently closed and capped with clay in the early 1970's.
In December 1974, Groce Laboratories, Incorporated (GLI) purchased the 35 acres from theCity of Greer and began operating an interim status hazardous waste treatment, storage, anddisposal facility under RCRA. From the mid-1970's until 1987, the facility acceptedexplosives, laboratory pack materials, cyanides, water reactives, oxidizers, acids and bases,fuels and gas cylinders. The facility also received some biomedical wastes and low-levelradioactive wastes.
The facility's primary processes consisted of the treatment of phosphorus trichloride, theprocessing and storage of lab pack materials, the recovery of metals (primarily off-specification ammunition), the recovery of solvents, the processing and storage ofcompressed gas cylinders, the management of containers containing hazardous materials,neutral: zation of acids and bases, and the blending of fuels. Aqua-Tech Environmental, Inc.(Aqua-Tech) purchased the operations in April 1987 and continued to accept, store, and treatmost hazardous wastes as well as a variety of other solid wastes. Both GLI and Aqua-Techwere regulated by RCRA.
B.2 Previous Investigations
Historic investigations conducted at the Site have included monitoring well installation,ground'vater sampling and analyses, and the sampling and analysis of residential watersupply veils, surface soil, subsurface soil, surface water, and sediment. A summary of theprevious investigations including the sampling program dates, sample analyses, and numbersof samples collected and analyzed is presented in Table 1.
GLI and Aqua-Tech conducted a total of four ground water assessments and hydrogeologicinvestigations on-site between 1985 and 1990. The assessments were required and approvedby SCE'REC to determine the potential effects of municipal waste and hazardous wasteoperaticms on groundwater beneath the Site. During the EPA Region 4 removal and post-removal activities, consultants for the Aqua-Tech PRP Group collected surface water andstream sediment samples from Maple Creek and sampled three residential wells east of the

Table 1
Media
Groundwater
SUMMARY OF PREVIOUS INVESTIGATIONSAQUA-TECH SITE REMEDIAL INVESTIGATION/FEASIBILITY STUDY
L,iu:tn, SUUTIl UAKUUNA
Date
Sep-SS
Oct-87
Number ofSample Points
6
6
12
/un-88 30
Residentialwells
Sediment
Surface water
Surface soil
Dec-89
Jul-92
' 1992/1993
1992/1993
1992/1993
Aug-93
30
11
3
3
3
18ro
Notes:01 Metals analyses for dissolved fraction only.^ Ninety-seven (97) samples were collected from 18 operational areas.PCBs Polychlorinated Biphenyls.PPL Priority Pollutant ListTAL Target Analyte ListTCL Target Compound ListTOC Total Organic Compound.TOX Total Organic Halides.VOCs Volatile Organic Compounds.
Sample Analyses
PPL0), barium
pH, specific conductance, temperature,TOC, TOX, PPL VOCs, phenols
pH, specific conductance, temperature,TOC, TOX, PPLn) except PCBs/pesHcides/herbicides, phenols
pri specific conductance, temperature,PPL VOCs, total phenols
pH, specific conductance, temperature, VOCs, phenols, total metals
TCL/TAL
TCL/TAL
TCL/TAL
TCL/TAL
TCL/TAL

5 9 0 0 1 6
Site on seven occasions between June 1992 and December 1993 when the Rremoval Actionwas undertaken by the PRP Group. The consultants for the PRP Group also collected surfacesoil sariples in August 1993 to assess the nature and extent of affected soils remaining afterthe Removal Action. The results of these investigations indicated that:
• soil remaining after the completion of the Removal Action exhibited the presence ofcontaminant, however, no further removal action was required;
• organic chemical compounds, primarily trichloroethene and tetrachloroethene, werepresent in groundwater beneath the Site;
• organic chemical compounds, primarily trichloroethene and 1,2-dichloroethene, werepresent in siirfaoe water in the .Site drainage ditch but not in surface water from MapleCreek; and,
• organic chemical compounds, primarily bis(2-ethylhexyl)phthalate, were present insed:ment in the drainage ditch but were not present in the sediments of Maple Creek.
B.3 Remedial Investigations
The fie. d work for the Remedial Investigation (RI) occurred in four phases. Implementationof Phase I began on May 26, 1998, and was concluded on July 2, 1998. The activitiesconducted during Phase I included sampling of surface and subsurface soil, groundwater,surface water, sediment, and landfill gas, installation of exploratory trenches, aquifer testing,water supply survey, and Site survey. Implementation of Phase II began on October 26,1998, and was concluded on November 19, 1998. Phase n activities included additionalground,vater sampling and Site survey, hydraulic conductivity testing, and installation ofexploratory borings. Phase HJ activities consisted of a supplemental sampling program,performed between May and July 2000. The Phase IJJ supplemental data collection activitiesconsisted of temporary well installation and sampling, residential well sampling, re-samplingof selected wells and test trenching. The Phase HI supplemental data collection activitieswere pe rformed to:
• further characterize and delineate groundwater contamination observed in MW- 20;• confirm groundwater data for MW-23 [primarily due to inconsistencies with
bis(2-ethylhexyl)phthalate in split sample data from the previous sample round]; updatenea:-by residential well data;
• confirm southern limits of landfill; and,• obtain additional groundwater data to facilitate a preliminary assessment of natural
attenuation processes occurring at the Site.
Phase IV of the RI investigation was performed in December 2001. Phase IV supplementalRI investigation activities consisted of new well installation and sampling, re-sampling ofthe existing monitoring well network, and performance of a focused sub-surface soilinvestigation in selected former operating areas described in sub-section A.4.1. The primaryobjectives of the Phase IV supplemental investigation activities were as follows:

r. O '1 <iu U ! /
• determine the degree of contamination (if present) beneath the former Aqua-TechEn vironmerital operating areas that represent potentially signi ficant contaminant sourcesbased on types and volume of materials handled and/or nature of operations;
• further define groundwater quality and/or hydraulics on the east boundary of the Site,southwest of the Site and south of Maple Creek; and,
• update the Site's groundwater quality database.
Figures. 3, 4, 5, 6 & 7, in Appendix A, display prior investigation and RI sample locations,including the delineation of the landfill. The results of RI investigation activities aresummarized in the sub-sections that follow.
B.4 Enforcement Activities
SCDHBC and EPA Region 4's RCRA compliance program inspected the facility onnumercius occasions during the 1980's and noted a number of violations of state and federallaws ar.d regulations. From 1982 through 1991,GLI, and its successor Aqua-Tech enteredinto six Administrative Orders on Consent with SCDHEC to address regulatory violationsat the Site. Deficiencies noted by SCDHEC and EPA during inspections included theunperrr.itted discharge of hazardous materials to the environment, the storage of hazardouswaste in unperrnitted areas, unmarked containers of hazardous waste, bulging containersholding; hazardous waste, hundreds of waste containers being stored in violation of applicableland disposal restrictions, and the accumulation of rain water in such a manner as to permitits contact with hazardous materials.
On March 4, 1990, a fifty-five gallon drum of hazardous waste caught fire at the Site. Afirefighter responding to the fire was overcome by the dense cloud of black smoke generatedby the lire and ninety people were evacuated. Another incident occurred when four drumsof off-specification igniter sustainer mixtures were sent to the facility. When they inspectedthe containers, SCDHEC officials discovered that the material was improperly packaged.While lepacking the material on April 19, 1990, two (2) drums of off-specification ignitersustainer mixtures detonated, severely injuring two (2) people and destroying a truck and atowmotor. On July 10,1990, Aqua-Tech held a controlled explosion to destroy two (2) moredrums of igniter sustainer mixtures, prior to which thirty two (32) nearby residents wereevacuated for safety.
On August 27, 1991, EPA Region 4's RCRA compliance program and SCDHEC jointlyinspected the facility and reported the following conditions: (1) the solvent recoverycontainment area held potentially contaminated water collected from several drum storageareas (t lis water was approximately two feet deep, which was at the level of the bottom ofseveral storage tanks and within several inches of overflowing the containment area); (2)numerous containers of hazardous waste were open; (3) hazardous waste containers wereleaking or were deteriorating; (4) hazardous waste containers were warmer than other metalcontainers on the compatible acid storage pad, indicating an exothermic reaction withcontaminated rainwater; and, (5) a container of phosphorus trichloride was reacting and

pQ
releasi ig a hazardous gas. The inspectors also observed approximately 430 gas cylinders,containing flammable materials, poisons and freon, in varying deteriorating conditions aboutthe Sits. During the inspection, Aqua-Tech personnel reported that an employee had justbeen overcome by fumes and seriously injured in the reactive area while unpackinglaboratory pack materials.
Following the inspection described above, SCDHEC issued an Emergency andAdministrative Order, Number 91-52-SW, to Aqua-Tech under which SCDHEC determinedthat Aq ua-Tech Environmental, Incorporated, had failed to operate the facility in compliancewith South Carolina laws and regulations and with the Orders which Aqua-Tech hadpreviously entered into with SCDHEC. SCDHEC concluded in the Order that the Aqua-Tech facility is an uncontrolled hazardous waste site. In the Order, SCDHEC revoked thefacility's interim status and ordered the facility immediately to cease its receiving, shipping,recycling, and treatment activities. Thereafter, SCDHEC denied the facility's Part Bapplication for an operating permit.
On September 12, 1991, SCDHEC requested assistance from EPA in order to address thecontamination at the Site. EPA Region 4 assumed responsibility for conducting the cleanupat the Site on January 20, 1992. In May 1992, EPA issued a UAO to ninety-eight PRPsrequiring them to perform cleanup activities. The PRP group provided Site security, removeddrummed waste cylinders, lab packs, and treatment residuals, and performed limited soilsampling at the Site. The Removal Action was conducted by the PRPs under the directoversight of EPA. The Removal Action was completed in early 1994. This Site was listedon the National Priorities List (NPL) as part of Final Rule #13 published in Federal Registeron December 16, 1994.
Although the removal of drums, cylinders and solid and liquid wastes reduced the potentialfor exposure to contaminated materials at the Site, additional investigation was required tofurther characterize the Site. On September 26, 1995, the Aqua-Tech PRP Group signed anAOC with EPA agreeing to fully fund and conduct a RI/FS at the Site. EPA obtained accessto the Site by court order in April 1998, and authorized the PRP Group to proceed with theRJ7FS v/ork.
C. COMMUNITY PARTICIPATION
The RI/FS Report and the Proposed Plan for the Site were made available to the public inJuly 2003. They can be found in the Administrative Record file and the informationrepository maintained at the EPA Docket Room in Region 4 and at the Middle Tyger BranchLibrary. The notice of the availability of these two documents was published in theGreenville News on July 27 and August 3, 2003. A public comment period was held fromJuly 27 to August 25, 2003. In addition, an availability session and a public meeting washeld on August 5,2003 to present the Proposed Plan to a broader community audience thanthose th at had already been involved at the Site. At this meeting, representatives from EPAand SCDHEC answered questions about problems at the Site and the remedial alternatives.
8

19
EPA also used this meeting to solicit a wider cross-section of community input on thereasonably anticipated future land use and potential beneficial ground-water uses at the Site.EPA's response to the comments received during this period is included in theResponsiveness Summary, which is part of this Record of Decision.
D. SCOPE AND ROLE OF ACTION
The selected remedy described in this ROD is the final Site remedy which takes intoconsideration prior remedial and removal responses, including the lengthy RI/FS. TheRemoval Action was completed in early 1994. This is the first and only operable unit for theSite. Tie Site remedy is intended to reduce future unacceptable risks to human health andthe environment by preventing or minimizing further exposure to contaminated air, soils andgroundwater impacted by the closed MSWL and the former Aqua-Tech operation. Insumm£ ry, the re medy provides for the construction of an engineered containment cover (cap)in accordance with the Presumptive Remedy combined with in situ treatment of soil toprimar ly prevent or mitigate direct human exposure to Site soils and/or the MS WLcontents.Furtheimore, the selected remedy will control migration of contaminants from the Site tosurface water by eliminating contact of storm water runoff with MSWL contents and Sitesoils. The remedy provides for the restoration of the contaminated groundwater byimplementing in situ treatment of groundwater to attain clean-up levels after 3 to 5 years.Institutional controls will be implemented to control Site use. Environmental monitoring willbe implemented to evaluate the effectiveness of the remedy.
This is the only ROD contemplated for this Site. This decision document was developed inaccordance with the Comprehensive Environmental Response, Compensation, and LiabilityAct of 1980 (CERCLA), as amended by the Superfund Amendments and ReauthorizationAct of 1986 (SARA), and, to the extent practicable, the National Contingency Plan (NCP).
E. SITE CHARACTERISTICS
E.I Conceptual Site Model
The conceptual Site model used to develop an understanding of the Site and to evaluatepotenti al risks to human health and the environment is presented in Figure 8 and summarizedbelow. The primary remaining known source at the Site is the closed MSWL. Affectedsurface soils remaining after the source removal may act as a secondary source.

r; n o n•-.J O <_ >J
Figure 8 - Conceptual Site Model Developed for the RI
RECEPTOR
"SOURCE SOURCE!—RELEASE ^PATHWAY• MECHANISM
HUMAN BIOTA
EXPOSUREROUTE Rttdeneal
(Sne Worien.—— *-
... :.
hot don
DtrrrulContact
©
®
©
©
©
Q
>
Derm*Conort
hQrtnbn
OarmiComaci
©®
©€>
©©
©$
©
The release mechanisms include:
• Infiltration/percolation of precipitation through the contaminated soils and landfillwaste to groundwater;
• Storm water runoff over contaminated soils that could transport contaminants tosurface water and sediments;
• Flow of contaminated groundwater to surface water and sediments; and,• Dust and/ or volatile emissions.
Site visitors and area residents are potentially exposed to contaminated surface water andsediments via ingestion and dermal contact, and to airborne constituents through inhalation.Area residents are also potentially exposed to contamination in groundwater through directcontac1: as well as ingestion and inhalation of volatilized contaminants. Site visitors arepotentially exposed to contaminated soil through ingestion and dermal contact, and toairborr.e constituents through inhalation.
10
Potent al environmental receptors at the Site include terrestrial biota which may be directlyexposed to contaminated soil through ingestion or dermal contact; and aquatic biota whichmay be. exposed to contaminated surface water and sediment through ingestion and dermalcontac:.
E.2 Site Features
The S te is characterized by low rolling hills composed of weathered bedrock. Thetopography slopes to the south, toward Maple Creek. The elevation ranges fromapproximately 752 feet above mean sea level (AMSL) at the southeast of the Site near MapleCreek, to approximately 872 feet AMSL in the vicinity of monitoring well MW-14 at thenorthwest corner of the Site.
The MSWL encompasses approximately 10 acres of the Site. The extent of the landfi l l isshown on Figure 7. There are no storm sewers located on or within 1000 feet of the Site. Aseptic lank and drain field for sanitary waste are located west of the former administrationarea.
E.3 Site Geology
The strati graphic units encountered on the Site include:
i) landfill cover and waste material;ii) residuurn/saprolite; and,iii) bedrock.
The characteristics of these geologic units were determined based upon the strati graphic logsof the t-2 monitoring wells and test borings installed at the Site. In general, the geology ofthe Site was found to be consistent with the regional setting. In order to aid in the discussionof the Site geology, four geologic cross sections were prepared based on the Site boreholelogs. The locations of the cross sections are shown on Figure 9 and are presented on Figures10 to O. Geologic Cross sections A A' and D D' run approximately parallel to the directionof groundwater flow and Cross sections B B' and C C run perpendicular to groundwaterflow.
E.3.1 Landfill Cover and Waste Material
The lar.dfill area was delineated as part of the RI activities based on a prior test trenchingprogram and was further refined during the Phase IV subsurface investigation. The extentof the l.mdfill is estimated to be 10.1 acres, as shown on Figure 7.
Data collected during the RI and previous investigations has shown that the landfill ispartially covered by a hard, dense clay cover of variable thickness. Boring logs for the
11

22
monitoring wells drilled within the limits of the former landfill (MW- 10, MW- 10A, MW-9, MW- 9A, MW- 9B, MW- 8, MW- 8A, MW- 8B, MW- 7, and MW- 7A) indicate that thethickness of the landfill ranges from 16.5 feet at MW- 8/8A to 40 feet at MW- 9B, with anaverage, depth of 24.8 feet. Based on the estimated area of the former landfill and the averagethickness of waste material, the estimated volume of waste in the former landfill area isapprox: mately 320,000 cubic yards. This calculation likely overestimates the volume ofmunicipal waste in the landfill since it is based on borings through deeper portions of thelandfill and does not account for volume losses from side slopes around the perimeter of thelandfill.
Based on the groundwater level measurements, it appears that the water table currentlyencroac hes upon the municipal solid waste material (see Cross section A A1, Figure 10).
E.3.2 Residuuim/Saprolite Unit
The uppermost geologic unit at the Site in the areas outside the landfill are residual soils andsaprolite. According to previous assessments, residual soils compose most of the landsurface, with decomposed bedrock exposed on the western portion of the Site.
According to the stratigraphic logs, the residual soils and former landfill are underlain bysaprolite, which is thickest in the eastern portion of the property. The saprolite layer rangesfrom a few feet thick near the southern and western boundaries to over 100 feet near thecenter of the Site in the vicinity of wells MW- 2A and MW- 9B. The saprolite located in theeastern part of the Site is the most typical and appears to be derived from a highly weatheredgneiss. It consists of fine to medium grained micaceous and dense sand with traces of clayand silt , and it has been naturally stained to yellow orange.
The thinner less abundant saprolite located in the southern and western part of the Siteappears to be decomposed granite. It consists of a black and white, fine to coarse grainedsand with traces of mica and orange red staining. The staining is a result of the movementof wate: and minerals, and is not related to Site activities.
Highly iiecomposed and fractured black rock was identified beneath the saprolite in two Siteborehobs (MW- 6A and MW-11A). These may indicate the presence of diabase dikesbeneath the Site.
E.3.3 Bedrock Unit
Bedrock at the Site consists of granitic gneiss. The depth to bedrock across the Site variesfrom a f sw feet below land surface near the southern and western boundaries to over 100 feetbelow land surface near the center of the Site in the vicinity of wells MW- 2A and MW- 9B.At exploratory boring EB-2, bedrock was encountered at 84 feet below land surface.Bedrock was not encountered at exploratory boring EB-1, which was drilled to 62 feet below
12

land surface. This boring could not be drilled deeper using the air rotary method due to thelarge volume of water being generated while advancing the borehole. However, during theinstallation of monitoring well MW- 6A, which is located approximately 25 feet northwestof exploratory boring EB-1, bedrock was encountered at approximately 65 feet below landsurface using mud rotary drilling techniques. Also, the interval from 70 to 90 feet below landsurface at MW- 6A was cored. These data, indicating that bedrock is at least 65 feet deep,were used for Site characterization.
The to p of bedrock contours indicate that the elevation of the bedrock ranges from 780 feetabove :nean sea level (amsl) in the northeast portion of the Site to 740 feet amsl in thesouthern portion of the Site. A top of bedrock depression is evident at monitoring wellsMW- 9 A, MW- 8A, and MW- 8B. The top of bedrock contour is depressed to approximately715 feet amsl and occurs at the central portion of the landfill, just north of the SedimentationBasin. The ground surface topography generally mimics the top of bedrock surface.
E.4 Site Hydrogeology
There c.re three principal hydrostratigraphic units at the Site based on the geologic unit andhydrau ic head. They are:
i) Saprolite Unit;ii) Shallow Bedrock Unit; and,iii) Bedrock Unit.
Grounclwater in the saprolite unit at the Site occurs under water table conditions. Theshallow bedrock and bedrock units appear to be semi-confined as demonstrated by thepresenc e of an upward gradient versus the saprolite over most of the Site. While there arethree p.'incipal hydrostratigraphic units at the Site, the distribution of contaminants in theground water indicates the units are interconnected and do not provide an effectiveimpediment to the downward migration of contaminants. The following discussions areseparated into saprolite, shallow bedrock, and bedrock for convenience.
E.4.1 Saprolite Unit
The saprolite unit consists of fine to medium grained, dense, micaceous sand with traces ofsilt and clay. The depth to groundwater at the Site ranges from 10 feet near Maple Creek to40 feet near the northern property boundary. The saturated thickness of the saprolite rangesfrom 0 :;o 72.6 feet. This unit was encountered in most of the Site wells except for TW-5 andMW-2!i, on the west side of the property. Data indicates that the seasonal fluctuations at theSite are small, generally less than 4 feet. The highest seasonal fluctuations were observedin the upland area of the Site (e.g., MW-1, MW-5, and MW-15); while the smallestfluctuations were measured adjacent to Maple Creek (e.g., MW- 4, MW-10, MW-19).Examination of the available data show that groundwater flow in the saprolite discharges to
13

0 G 2 4
Maple Creek over most of the Site. The horizontal hydraulic gradient in the saprolite rangesfrom C .050 feet per foot (ft/ft) in the upland area of the Site to 0.031 feet per foot (ft/ft) nearMaple Creek, with an overall gradient of 0.037 ft/ft. The average groundwater flow rate inthe saprolite unit at the Site ranges from approximately 131 feet per year (ft/yr) on thenorthern portion of the Site to 81 ft/yr on the southern portion of the Site.
E.4.2 Shallow Bedrock Unit
The shallow bedrock unit consists of the first-encountered groundwater within the upperweathered and/or competent granitic gneiss. Groundwater flow in the bedrock is primarilythrough secondary porosity (i.e., fractures, joints, and lineaments). The hydraulicconductivity ranges from 0.023 ft/day to 0.113 ft/day, with a geometric mean of 0.051 ft/day.Data indicates that the seasonal fluctuations at the Site are small, generally less than 4 feet.The highest seasonal fluctuations were observed in the upland area of the Site (e.g., MW- 8Aand MW- 9A); while the smallest fluctuations were measured adjacent to Maple Creek (e.g.,MW-10A). The horizontal hydraulic gradient in the shallow bedrock unit is fairly uniformacross the Site, at 0.025 feet per foot. The average groundwater flow velocity in the shallowbedrock uni t at the Site is approximately 4.7 ft/yr. The groundwater elevations in the shallowbedrock are, in general, slightly higher than those in the saprolite. Analysis of the June 1999water .'evel data shows that the mean difference between the saprolite and bedrock waterlevels kvas 1.61 feet. In June 1999, the maximum head differential was observed betweenMW- !> and MW-8B (5.33 feet) and the minimum was observed at MW- 4 and MW- 4A(0.66 f set). Examination of the data indicates that vertical gradients are generally upward,indicating flow from the bedrock unit to the saprolite unit. The only location on Site wherea consistent downward vertical hydraulic gradient was observed was at the monitoring wellMW-S1 nest where a depression in the top of bedrock was identified. In the vicinity of MapleCreek (e.g., MW- 4A, MW- 6A, MW-10A, MW- 23A and MW-24A), upward verticalhydraulic gradients were generally measured between the bedrock and the saprolite with theexception of MW-24A. This is consistent with Maple Creek being a local groundwaterdischarge zone.
E.4.3 Bedrock Unit
The bedrock unit consists primarily of granitic gneiss. Groundwater flow in the bedrock isprimar.ly through secondary porosity (i.e., fractures, joints, and lineaments). The hydraulicconductivity of the bedrock unit was determined by means of single well response testsconducted in previous investigations. A summary of the hydraulic conductivity valuesindicated the hydraulic conductivity ranged from 0.057 ft/day to 0.283 ft/day, with ageome :ric mean of .093 ft/day. Examination of the figures illustrating contours in the variousunits shows thai: groundwater flow direction in the saprolite and two bedrock units is similar.Except for a slight mounding effect seen in monitoring well MW-11A, groundwater flowbeneath the Site in the bedrock unit is in a southerly direction toward Maple Creek. Basedon wat^r levels measured on December 14, 2001, the horizontal hydraulic gradient in the
14

9 0 0 2 5
bedrock unit ranges from 0.056 feet per foot in the northern portion of the Site to 0.023 feetper foot, with an overall gradient of 0.035 feet per foot. The average groundwater flowvelocity in the bedrock unit at the Site ranges from approximately 19 feet per year (ft/yr) onthe norhern portion of the Site to 7.8 ft/yr on the southern portion of the Site.
E.5 Groundwater Flow System
Infiltraiion of .precipitation throughout Ihe Site recharges the groundwater; however, thepotential for recharge in the vicinity of the former landfill may be reduced due to the clay soilcover... Measured recharge rates from 12 .sites in regolith/fractured rock in Orange County,N.C., ringed from 4.15 to 6.40 inches/year(in/yr), with a mean value of 4.90 in/yr. TheUSGS«:ited these .values as representative values for a study site located in Greenville, S.C.
flows in a south southeast direction toward Maple Creek.The -dhectkm and -magnitude of the horizontal hydraulic gradients in the saprolite andbedrock units v/ere generally consistent over the five water level measurements. MapleCreek behaves as a local discharge zone for the saprolite. In addition, shallow bedrockgroundwater appears to discharge through the saprolite to Maple Creek as evidenced by theupward vertical hydraulic gradients between the saprolite and the bedrock units adjacent toMaple Creek.
E.6 Surface Water Hydrology
Natural surface drainage from the Site is to Maple Creek, which flows west to east across thesouthern edge of the Site. Maple Creek flows into the South Tyger River approximately3,000 feet downstream of the Site. The drainage area for Maple Creek is approximately 10.2square miles. The range in flow is from 5.5 ft3/s to 235 ftVs, with a daily average streamflowof 13.4 ft3/s. There are no designated 100-year flood plains within 1,000 ft of the Site.
Surface drainage from the Site is generally routed to Maple Creek via drainage ditches.Surface drainage was modified during the Removal Action. Surface water run-on controlswere ir stalled to divert surface water from upgradient western property away from thehazardous activity area. Surface water run-off from the hazardous waste area was divertedto a sedimentation basin, both to entrap sediments and to provide emergency containmentin the event of a spill during the removal activities. These controls were left intact at theconclusion of the Removal Action. The location of the sedimentation basin is illustrated onFigure 'I.
E.7 Demography and Land Use
A total of 171 households were identified and surveyed within a 1-mile radius of the Site(Figure 14). Of the 171 households identified, 53 households had water wells (many ofwhich <ilso had public water), and 63 households did not respond to the survey. The water
15

1 I • ' \ r
U oV_ 0
wells closest to the Site identified during the 1998 well survey are located east of the Site(cross-gradient) across Robinson Road. These wells were sampled six to seven times duringthe 1952/1993 Removal Action. The results of the analyses show that Site activities have notsignificantly impacted the water supply wells.
West of the Site, the nearest identified water well is located over 1/4 mile from the Site. Thepredominant groundwater flow direction at the Site is to the south towards Maple Creek.Maple Creek is a local discharge zone for the saprolite and bedrock groundwater. No nearbywater wells were identified south of the Site. The closest well in this direction is almost amile away on the south side of Maple Creek and is not used.
The results of the water well inventory and the residential well sampling program haveshown that there are no water supply wells immediately downgradient (south) of the Site.The closest residential wells are located to the east (cross gradient) of the Site. The wells
.have not been significantly impacted by Site activities.
Moreover, the Site is located within the "Airport Environs Area" as defined by the Greenville- Spartanbitrg Airport Environs Area zoning Ordinance, dated March 29,1996. This zoningordinance precludes future residential development use of the Site.
E.8 Ecological Setting
There are two primary terrestrial plant communities present on the Site. The area of thelandfill, process area, and administrative area is an old field dominated by goldenrod,ragweed, Queen Anne's lace, and clover. Shrubs, such as sumac and willow have started toinvade ind become established in the old field. Kudzu was also present throughout the entireSite. Areal coverage of herbaceous vegetation was close to 100 percent.
A second major plant community on the Site is mixed deciduous/coniferous forest whichincludes a variety of oak, maple, pine, tulip poplar, hickory, and sumac. The ground coverwithin :he forest is well developed. The mixed forest community occurs on those portionsof the Site that have not been disturbed during the past 20 years or more.
Maple Creek is a perennial stream that flows west to east near the southern border of thelandfill, Maple Creek is relatively shallow, generally less than 12 inches deep. The width ofthe creek varies from approximately 6 feet to 15 feet. Any wetlands on the Site are associatedwith Miple Creek. The area within 1/4 mile upstream of the Site has been altered as a resultof installation a sanitary sewer line. The sewer line crosses Maple Creek at several locationsupgradient of the Site and near the southern limit of the closed MSWL.
16

$ 9 0 0 2 7E.9 Nature and Extent of Contamination
E.9.1 General Sampling Strategy
As pre\ iously discussed in Section B .4, the Remedial Investigation field work was conductedintermittently from May 1998 to December 2001. During the Remedial Investigation over300 sanples (landfill gas, surface soil, subsurface soil, groundwater, sediment and surfacewater) were collected to characterize the Site. Approximately 70% of the samples wereanalyzed for volatile organic compounds (VOCs), semi-volatile organic compounds(SVOCs), Pesticides, polychlorinated biphenyls (PCBs) and metals.
E.9.2 Brief Overview of Known and/or Suspected Sources of Contamination
Based on the results of the Remedial Investigation, the two potential contaminant sourcescurrent'y on the Site are: the closed MSWL and impacted soils.
The area of the closed MSWL is approximately 10.1 acres and the estimated volume of wastedoes not exceed 320,000 cubic yards. Based on the landfill gas samples, not all of thisvolume contains putrescible waste. The water table beneath the Site appears to intersect thewaste. VOCs detected in landfill gas samples indicate the closed MSWL contains hazardousconstituents consistent with typical mixed waste municipal landfills.
The soi i data collected during the various phases of the RI and following the Removal Actionhave in iicated a limited number of areas with exceedances of Preliminary Remedial Goals(PRGs). Operations performed in the former operating areas used for staging of wastes,located outside the footprint of the landfill, did not have a significant impact on surficial orunderlying soils. The former operations appear to have impacted shallow soils only (i.e. 0to 4 feet below ground surface (bgs) in the 501-09, and 601-02 areas. Neither area appearsto represent a significant future source of contamination. Concentrations of VOCs observedin subsurface-soils beneath the Process Distillation Area, within the limits of the MSWL,appear :o represent a localized source of groundwater contamination.
E.9.3 Types of Contamination and Affected Media
As early as 1985, characterization activities occurred at the Site. Moreover, the facilityactivities that had the potential for causing soil contamination were identified during theRemoval Action. Surface soil contamination remaining after the Removal Action wascomplete was evaluated during a surface soil investigation conducted in 1993. During thesoil invsstigation, the Site was divided into 18 areas (100-ft by 100-ft sampling grid) fromwhich composite samples of soil, concrete, exposed waste, and soil beneath concrete werecollecte d and analyzed for TAL/TCL parameters (except VOCs). Discrete samples for VOCsanalyses were collected from a central sampling location in each grid section. The
17
results of the of the soil investigation indicated no further removal action was necessary andserved as a guide to focus remedial investigation activities described below.
E.9.4 Landfill Gas
Landfi II gas samples were collected at seven locations, LG-1 through LG-7. The landfill gassample locations are shown on Figure 6. Each landfill gas sample was analyzed for VOCs,hydrogen sulfide, methane, carbon dioxide, and oxygen. In addition to the sampling andanalyses described above, 21 exploratory trenches were initially excavated to define theextent of the closed municipal landfill. Additional test trenches were excavated on thesouthe;Ti portion of the landfill to confirm landfill presence and limits in this area. Thelocations of the exploratory trenches are illustrated on Figure 7. The landfill gas data fromlocations LG-3 and LG-7 demonstrate that no landfill gases are present and, therefore, thatthere may be areas within the estimated landfill boundary in which putrescible waste is notpreseni. VOCs we're detected in all landfill gas samples, however, concentrations weregenera! ly less than 1 part per million per volume (ppmv). At the sample locations within thelandfill limits, VOCs were detected at concentrations greater than 1 ppmv primarily atlocatiois LG-1 and LG-2. Benzene was detected at location LG-3 at a concentration of1.1846 ppmv. The low concentrations of VOCs detected in the landfill gas at the majorityof local ions maybe more reflective of residual concentrations of these chemicals in soil dueto past aboveground operations than of the presence of chemicals in the landfilled materials.
Locations LG-1 and LG-2 are situated at the northern limit of the landfill in the Incinerationand 501 Areas, respectively. Previous activities in these areas included the handling ofvarious solvents and organic chemicals. The VOCs present at the highest concentrations arevinyl chloride (298 ppmv at LG-1 and 66 ppmv at LG-2), benzene (258 ppmv at LG-1 and7.5 pprnv at LG-2), and toluene (87 ppmv at LG-1 and 4.5 mg/L at LG-2). Also present atconcentrations greater than 10 ppmv are chloroethane, methylene chloride,1,1-dicnloroethane, cis-l,2-dichloroethene, ethylbenzene, and dichlorodifluoromethane.
The laboratory results are summarized in Appendix B.
E.9.5 Surface and Subsurface Soil
As previously discussed, in 1993, the Site was divided into 18 areas from which compositesample> of soil, concrete, exposed waste, and soil beneath concrete were collected andanalyzed for TALVTCL parameters. During Phase I through HI of the RI, additional surfacesoil samples were collected from locations SS-1 through SS-7 along the east side of the Siteto complete the delineation of affected surface soils in this area and from location SS-8 inthe Sedimentation Basin Area. Eight soil borings (SB-01 through SB-08) were alsoadvanced and analytical samples were collected from the 0 to 1 and 4 to 5 foot bgs intervalsof each boring. Soil borings SB-01 through SB-06 were located outside the northernboundary of the Site to provide data regarding potential impacts to the Site attributable to
18
29upgrad ent sources such as the former junkyard to the north. Soil borings SB-07 and SB-08were Ideated in the drainage ditch along the east side of the Site to determine whethersediments/soils in or beneath the ditch were affected by Site activities. All samples wereanalyzed for TAL/TCL parameters.
Additional soil samples were-collected d«rmg the Phase IV RI Investigation to further assessareas where potentially significant contamination was identified during the 1993 samplingprogram and/or assess subsurface impacts beneath the former Aqua-Tech operating areas(within and outside the limits of the landfill) where hazardous materials were managed.
The soil and concrete sample locations and the 1993 sampling grid are shown on Figure 6and summarized in Appendix B.
A total of 55 soil borings were completed during the December 2001 subsurface soilinvestigation. The soil borings were advanced utilizing a DPT rig mounted on a four-wheeldrive truck. The DPT samples consisted of 4-ft continuous soil core samples from surfaceto refusal or maximum sampling depth, whichever occurred first. Each sample was loggedand screened with a photoionization detector (PID) meter. An on-site laboratory was usedto support the investigation. Twenty percent of the total samples analyzed by the on-sitelaboratory were delivered via overnight courier to an off-site laboratory, forconfirmation/validation of the on-site laboratory's results. The on-site and off-site laboratoryresults .ire summarized in Appendix B. The subsurface boring locations are illustrated onFigure :5.
E.9.5.1 Summary Results of the 1993 Soil Investigation and RI Phase I, II andIII Soil Activities
VOCs, SVOCs, Pesticides, and PCBs were present to a limited extent in Site soils atconcenl rations which exceeded the residential PRGs. If the concentrations of the compoundsdetected in Site soils are compared to the industrial PRGs, the exceedances are furtherlimited to:
• four VOCs in three of the 103 samples evaluated ((tetrachloroethene (PCE) and:richloroethene (TCE)) in the soil beneath the concrete pad of the Process Distillation^rea, PCE in a surface soil sample, and PCE, TCE, xylene and ethylbenzene in the501-09 waste sample);
• One SVOC in three of the 103 samples evaluated (Benzo(a)pyrene in Area 509-04.ind the '"soil under concrete" samples);
• one pesticide in one of the 103 samples evaluated (toxaphene in Area 509-05); and,
19

0 3 0
• three PCB Aroclors in four of the 103 samples evaluated (Aroclor 1242 in the soilbeneath the concrete Process Distillation Area, and Aroclor 1254 in Areas 509-01,509-03, and 501-06, and Aroclor 1248 in SB-07).
Alumi num, arsenic, cadmium, copper, iron, lead, and mercury were present in Site soils atconcentrations which exceeded the residential PRGs and were greater than two times theaverage concentration detected in background samples. If the concentrations of thecompcunds delectedjn Site soils are compared to the industrial PRGs and twice the averagebackgiound concentrations, the exceedances are limited to:
• arsenic in 14 of the 103 samples evaluated, 8 on-site and 7 off-site. Five of 8 on-sitesamples were samples of concrete. The two exposed on-site soil samples withexceedances of the arsenic criteria were from locations 505 and SS-8. The averageconcentration of arsenic in these samples was 11 mg/kg. The off-site samples whichex1«fejtoi:exceedances of the arsenic criteria were all from soil borings advanced onthe property to the north. The average concentration of arsenic in the surface soil (0to 1 foot bgs) at these locations was 89 mg/kg;
• copper in the exposed waste in Area 501-09;
• mercury in 3 of the 103 samples evaluated. The samples of exposed soil whichexhibited exceedances were from Areas ERC-01, 501-03, and 501-04. The averageconcentration of mercury in these exposed soils was 57.2 mg/kg; and,
• cyanide in all samples which exceeded the residential PRO.
Exceedances of the residential PRGs for arsenic and iron were detected in the samplescollected from the locations east of the landfill area. However, all on-site concentrations werewithin the estimated ranges of background concentrations. The concentrations that exceededPRGs ire shown on Figures 16 through 25.
E.9.5.:', Summary Results of the RI Phase IV Soil Activities
Soil samples collected adjacent to or beneath the former operating areas (502A and B, 503,504,505 and PCL3) situated outside the footprint of the MSWL showed no significant impactfrom former operations. All VOC analyses from these areas were reported as non-detect orat concentrations well below the PRGs.
Impacts to soils; in the 501-09 Area and 601-02 Area were observed to be relatively shallow.Concentrations of chemicals of concern exceeding the PRGs were limited to the upper 4 feetof the soil horizon. In the 501-09 Area, the exceedances of the VOC PRGs occurred in soilborings BH-4 and BH-8. PCE and TCE were the only VOCs detected in soil atconcertrations that exceeded the PRGs. Samples from boreholes BH-4 and BH-8 had
20

reported concentrations of PCE of 441 and 300 mg/kg, respectively. TCE was detected inboring BH-8 at a concentration of 14 mg/kg. In the 601-02 Area, samples from boringsBH-23; BH-26, BH-27, and BH-29 had no detectable VOCs. Borehole BH-28 was the onlyboreho .e in Area 601-02 that contained VOCs in exceedance of their respective PRGs. PCEand TCE were detected at concentrations of 17.1 mg/kg and 21.2 mg/kg, respectively. Theseconcentrations were limited to only the first one to two feet bgs. All other boring samplesfrom the 601-02 Area were either non-detect or well below PRGs.
The Piocess Distillation Area sits over the northwest portion of the closed MSWL.Soils/v\ aste with concentrations exceeding the PRGs were delineated within the limits of thelandfill. In the Process Distillation Area, the upper 8 feet of the borehole containedconcen:rations of PCE and TCE as high as 320 mg/kg and 1,020 mg/kg, respectively, inexceedance of PRGs. The concentrations increased with depth down to 8 feet bgs. Therefusal depth of BH-19 was 15 feet bgs. The results from the bottom-sample from BH-19indicated that all VOCs were either below PRGs or non-detect. Furthermore, PCE and TCEwere also detected in exceedance of their respective PRGs in BH-18, BH-20, BH-21, andBH-22. The results of bottom samples collected from these boreholes were all reported aseither non-detect or below PRG for VOCs, except for BH-18. The bottom-sample fromBH18 (9 feet bgs) had reported concentrations of PCE and TCE of 12.1 mg/kg and 15.3 mg/kg,respect .vely. The remaining boreholes within the Process Distillation Area provided samplesthat were either non-detect or contained concentrations well .below their respective PRGs.Concer trations of VOCs observed in subsurface-soils beneath the Process Distillation Area,within the limits of the MSWL, appear to represent a localized source of groundwatercontamination.
E.9.6 Groundwater
During Phase I and II of the RI, five new monitoring wells were installed and one round ofground *vater sampling was conducted of all new and existing monitoring wells to gatheranalytical data to complete the definition of the extent of groundwater affected by Siteactivities. An additional five temporary monitoring wells were installed in off-site locationswest of the Site and sampled in 2000 during the Phase III supplemental investigationperformed as part of the RI. Four additional groundwater monitoring wells were installedduring Phase IV of the supplemental RI investigation. The four wells were installed:
• to further delineate groundwater quality to the east, between the Site and adjacentresidences with access to existing groundwater wells (MW-26);
• to further delineate off-site groundwater quality to the southwest (MW-25); and,• to assess shallow bedrock groundwater quality immediately south of Maple Creek
(MW-23A, MW-24A).
During Phase IV of the Supplemental RI investigation, all new and existing monitoring wellswere sampled including the temporary monitoring wells installed during Phase in.
21

r O \ r • /!:> >' U U .:
A comp lete database containing groundwater analytical data generated between 1985 and thepresent is contained in Appendix B.
E.9.6.1 Summary of Groundwater Activities
During Phase IV of the RI, an attempt was made to re-sample 36 existing monitoring wellsand 5 temporary monitoring wells. Two of the existing monitoring wells (MW-18 andMW-lf A) were dry and could not be re-sampled. Samples from all wells sampled wereanalyzed for TCL VOCs. Groundwater samples collected from existing monitoring wellsMW-2A, MW-4A, MW-7A, MW-8A, MW-9A, MW-9B, MW-10A, MW-11A, MW-16A,and MW-23 were also analyzed for SVOCs. In addition, groundwater samples collectedfrom ex isting monitoring wells (MW-6A, MW 7, MW-9A, MW-16A, MW-23, and MW-24)were ar alyzed for metals. The newly installed wells, (MW-23A, MW-24A, MW-25 andMW-2C) were analyzed for TCL VOCs, TCL SVOCs, metals and PCBs. The samplelocations are illustrated on Figure 4.
To evaluate the impact of Site activities on groundwater quality, the concentrations of thecompounds detected have been compared to USEPA Maximum Contaminant Levels(MCLs\ Although not an ARAR, secondary MCLs (SMCLs) were used for comparativepurposes when MCLs were not available. These criteria represent concentrations ofconstituents that are acceptable for drinking water sources.
Monito:ing well MW-14 is a saprolite monitoring well located hydraulically upgradient ofthe Site. Shallow groundwater flow across the Site is from the northwest to the southeast,toward Maple Creek. The data from MW-14, which is located west of the west propertybounda:y of the Site, represent the background quality of shallow groundwater crossing theSite anc are used in the following discussions to evaluate the impact of the Site condition ongroundwater quality. Total phenols were reported in MW-14 at a concentration of 20 /ig/Lduring the Phase HI RI sampling event (04/19/00); the source of the phenols in the upgradient'well is not known.
E.9.6.2 Groundwater Characterization
The organic chemical compounds detected in both the RI and Phase IV supplementalgroundwater samples include SVOCs, and VOCs. Pesticides were detected in the initial RIgroundwater samples. The Phase IV supplemental groundwater samples were not screenedfor pest: tides. No PCBs were detected in any RI groundwater sample. The concentrationsthat exceeded the MCLs are shown on Figures 26 through 31. The locations of the crosssections are shown on Figure 9.
22

E.9.6.3 Semi-volatile Compounds
The only SVOC compound detected at a concentration that exceeded the MCL was bis(2-ethylhexy])phthalate. Bis(2-ethylhexyl)phthalate was previously detected in 6 of the 30saproliie groundwater samples analyzed, 5 of the 8 shallow bedrock monitoring wellsamples, and 5 of the 6 bedrock monitoring well samples. The Phase IV supplementalgroundwater sampling event detected bis(2-ethylhexyl)phthalate in only 1 of the 14 wellssampled for SVOCs.
Saprolite Interval
During prior sampling events, the presence of bis(2-ethylhexyl)phthalate at concentrationsthat exceeded the MCL in the saprolite was limited to the immediate vicinities of monitoringwells MW-20 west of the west property boundary and MW-15 in the northeast corner of theSite. The maximum concentrations of bis(2-ethylhexyl)phthalate previously reported atMW-20 and MW-15 are 9.6 micrograms per liter (p. g/L) and 8.6 jig/L, respectively. Theseconcen:rations only slightly exceed the MCL of 6 jUg/L. The concentrations of bis(2ethylhexyl)phthalate reported in duplicate samples collected from monitoring well MW- 23in 19951 were reported as 22/ig/L and 490 /xg/L. These duplicate data are not within anacceptable range for data validation purposes and the monitoring well was subsequently re-sampled on April 20, 2000. Duplicate samples collected on April 20, 2000 from monitoringwell MW- 23 were both reported as non-detect (with a detection limit of 10 Mg/L). In therecent (December 2001) groundwater sample from MW-23, bis(2-ethylhexyl)phthalate wasreported as non-detect. Consequently, the elevated concentration reported in 1998 (i.e. 490jUg/L) i s not considered valid based on duplicate data and recent sampling results.
Bis(2- i:thylhexyl)phthalate was not detected in the background monitoring well (MW-14),TW-2 or in TW-1, downgradient of well MW-20, during previous groundwaterinvestigations. Monitoring well MW- 20 is also hydraulically upgradient of the landfill areaand is ocated approximately 800 feet south of MW-14. Bis(2-ethylhexyl)phthalate waspreviously detected in the sample from MW- 20 at a concentration of 9.6 /xg/L that slightlyexceeded the MCL but not in the re-sample of MW-20 (at a detection limit of 10 jug/L).Bis(2-ethylhexyl)phthalate was not detected at elevated concentrations in the surface soilsamples collected from the vicinity of MW- 20. The presence of bis(2-ethylhexyl)phthalatein MW-20, while absent from MW-14 and from surface soils in the area, is not explained.
Shallow Bedrock Interval
Previous investigations reported that the concentrations of bis(2-ethylhexyl)phthalate in theshallow bedrock monitoring wells were generally higher than in the saprolite wells, withdetected concentrations ranging from 7.4 /zg/L at MW- 9A to 44 /xg/L at MW-10A. With
23
the exception of MW-8A and MW-13 in which it was not detected, bis(2ethylhcxyl)phthalate previously was reported in all shallow bedrock groundwater samplesat cone eritrations that exceeded the MCL.
The highest concentration of bis(2-ethylhexyl)phthalate (44^g/L) was detected at MW- 10A,downgradient of the landfill area. Bis(2-ethylhexyl)phthalate was not detected in thesaprolite monitoring well at this location and no elevated concentrations of bis(2-ethylhexyl)phthalate were detected in surface soils in the vicinity of this well.
For the shallow bedrock wells that were sampled and analyzed for S VOCs during the PhaseIV supplemental RI groundwater sampling event, all samples, including the newly installedwells MW- 23A and MW- 24A south of Maple Creek, reported bis(2- ethylhexyl)phthalateas non-detect (samples from shallow bedrock wells MW-13 and TW-5 were not analyzedfor SVDCs; shallow bedrock well MW-18A was dry).
Bedrock Interval
The concentrations of bis(2-ethylhexyl)phthalate in the bedrock interval monitoring wellsranged from 3 £tg/L to 25 /Lig/L, in previous investigations. Previously, the highestconcentration, 25 /ig/L, was detected in monitoring well MW- 9B, located hydraulicallydown gradient of the potential surface soil source areas. However, samples collected fromMW-9'3 during the Phase IV investigation were reported as non-detect for bis(2-ethylhexy)phthalate.
Bis(2- ethylhexyl)phthalate was previously detected at a concentration greater than the MCLin well MW-6A on one occasion. This well is south southwest of MW-9B and is, therefore,further down gradient from MW-9B. In addition, bis(2-ethylhexyl)phthalate was reportedabove the MCL in MW-4A, MW-11A and MW- 16A in prior investigations. Of the bedrockwells sampled during the Phase IV groundwater investigation, only one well (MW-16A)contair ed bis(2-ethylhexy)phthalate (1 l^g/L) in exceedance (marginally) of the compound'sMCL.
E.9.6.4 Pesticides
Groundwater samples were not analyzed for pesticides during the Phase IV groundwatersampling event.
In prev ous investigations, pesticides were detected in two saprolite monitoring wells, MW-8 and !VIW-24. No pesticides were detected in either the shallow bedrock or bedrockmonitoring intervals. The pesticides detected were alpha BHC, dieldrin, and heptachlorepoxide in MW-8 and aldrin, dieldrin, and endrin in MW-24. Only one compound,heptachlor epoxide in MW- 8, was present at a concentration that exceeded the MCL. Theconcen [ration of heptachlor epoxide in MW- 8 was 0.92 /xg/L versus the MCL of 0.2 ^g/L.
24

5 b
Dieldri n was the only pesticide detected in both MW- 8 and MW-24. EPA has not developedan MCL for dieldrin; both reported concentrations exceed the EPA Region 9 PRG's forresidential tap water (0.0042 /ig/L).
No pesticides were detected in the background saprolite monitoring well (MW-14). None ofthe pes icides detected in the groundwater sample from MW- 8 were detected in the surfacesoil sanples from the surrounding areas. Nonetheless, given the location of MW- 8 and theshallow nature of the pesticide presence, the presence of the pesticides in MW- 8 may be aresult cf Site activities. However, the concentrations detected are very low and the extentof pesticide presence is limited to the saprolite interval in the immediate vicinity of MW- 8.The defection of pesticides in MW-24, which is located on the south side of Maple Creekopposile the southwest quadrant of the Site, is unexplained. As stated previously, saprolitegroundwater discharges into Maple Creek upgradient of MW-24 and, therefore, Siteimpacted groundwater from this interval is not expected to be present on the south side ofMaple Z^reek. In addition, pesticides are not present in the saprolite monitoring well MW-10 or shallow bedrock monitoring well MW-]3, which are immediately upgradient of MW-24. Therefore, the presence of pesticides in this well does not appear to be related to Siteactivities.
E.9.6.5 Volatile Organic Compounds
In previous investigations, several VOCs were detected in the groundwater samples.Howev sr, the only VOCs present at concentrations that exceeded their respecti ve MCLs were1,1-dichloroethene, 1,2-dichloroethane, 1,2-dichloroethene (total), benzene,tetrachioroethene, trichloroethene, and vinyl chloride. The exceedance of the MCL for 1,2-dichlorDethane occurred only in saprolite monitoring well MW- 3. Exceedances of the MCL,for benzene occurred in MW- 3 and saprolite monitoring well MW- 7. No exceedances ofthe VOC MCLs; occurred in any monitoring well installed south of Maple Creek or in theDPT samples with the exception of tetrachioroethene in the groundwater sample fromDP-04, which marginally exceeded the MCL at a concentration of 5.4
PCE and TCE were detected the most frequently and in all monitored intervals. With theexception of benzene and 1,2-dichloroethane, the other compounds that exceeded their MCLsand occurred in more than one or two isolated samples are degradation products ofPCE/TCE. Therefore, the extent of the VOC groundwater plume is characterized in thefollowing discussion based upon the presence of PCE and TCE. This approach is intendedto simplify the definition of the groundwater contaminant plume and is not intended todiminish the importance of the presence of the other constituents. The locations at which theconcen [rations of the other VOCs exceeded their respective MCLs are all located within thelimits of the PCE/TCE plume(s). Therefore, the definition of the PCE/TCE plumes willencompass all groundwater impacted by VOCs.
25

•J -.J U
During the recent Phase IV supplemental RI groundwater sampling event, the followingVOCs were detected in exceedance of their respective MCLs: benzene; cis-1,2dichloroethene; 1,1-dichloroethene; 1,2-dichloroethane; tetrachloroethene; 1,1,1trichloroethane; trichloroethene; and vinyl chloride. Cis-l,2-dichloroethene,tetrach loroethene, and trichloroethene were detected the most frequently and in all monitoredintervals.
The an ilytical data for PCE and TCE in the various groundwater intervals have been plottedon Figures 26 through 31.
Saprollte Interval
All of the VOCs that were present in groundwater at concentrations that exceeded theirrespective MCLs were present in the saprolite interval. None of these compounds weredetected in background saprolite monitoring well MW-14. Isopleths for total VOCconcentrations in the saprolite interval are shown on Figure 28. Isopleths of PCE and TCEconcentrations in the saprolite are presented on Figures 26 and 27 respectively.
As shewn on Figure 26 and 27, the presence of PCE and TCE in Site groundwater atconcentrations that exceeded their MCLs of 5 /ig/L is in three areas: the Administrative Area(MW-.'); the 502/503 and 601 Areas; and, southwest of the 510 Area. The highest reportedconcentration of PCE in 2001 was 1,200 /ig/L from monitoring well MW-1 (the reportedconcentration in 2000 was 830 /ig/L). The concentrations of PCE in MW- 12 and MW- 19were 100 j^g/L and 140 /xg/L, respectively in 1998. The concentrations of PCE in MW-12and MW-19 were reported as 110 /xg/L and 290 /ig/L, respectively in 2001. Results fromthe Phase IV groundwater investigation also reported levels of PCE in MW-3 and MW-10at concentrations of 200 pig/L and 130 /xg/L, respectively. The highest concentration ofTCE (;!65 /xg/L) was detected at MW- 10 and the concentrations at MW- 1 and MW- 19were 140 /xg/L and 57 /xg/L, respectively in 1998. The highest concentration of TCE (640/xg/L) was detected in MW-12; the reported concentrations at MW-10, MW-1, and MW-19were 350 /ig/L, 46 /ig/L, and 33 /ig/L, respectively in 2001.
MW-1 is hydraulically cross gradient of the 501-09 and Process Distillation Areas in whichthe highest concentrations of PCE and TCE in soil were detected. MW- 9 is hydraulicallydowngradient from the potential source areas; however, except in sample DP-4, neither PCEnor TCE were detected in any of the soil samples collected from locations surrounding MW-19.
No VC Cs were detected in the saprolite monitoring wells or the direct push sample locatedsouth df Maple Creek.
26
Shallow Bedrock Interval
The VOCs present at concentrations that exceeded their respective MCLs in groundwaterinthe shallow bedrock interval were benzene, 1,2-dichloroethane, PCE, TCE, 1,1-DCE, vinylchloride, and 1,2-DCE. Isopleths illustrating total VOC concentrations in shallow bedrockground water are shown on Figure 31. Isopleths of the PCE and TCE concentrations in theshallow bedrock are presented on Figures 28 and 29, respectively. The decreases in theconcentrations of PCE and TCE with depth can be seen in the profile plot of theconcentration data presented on Figure 32.
Much of the PCE/TCE groundwater plume in the shallow bedrock interval centers aroundwells IklW-TA, MW-9 and MW-11A. This area is hydraulically downgradient of thepotential sources in the 509, 601, and Process Distillation Areas. Therefore, the most likelysource:; of PCE/TCE in the shallow bedrock interval include soils in these potential sourceareas and impacted groundwater in the overlying water table interval. MW- 13 is locatedalong the western boundary of the Site in the southwest quadrant. There are no identifiedpotential source areas of PCE located in the vicinity of MW- 13; however, groundwater flowfrom the Process Distillation Area may be reflected in MW-13.
Based on the presence of upward vertical hydraulic gradients between the bedrock andsaprolite over most of the Site, and the lack of VOC detections in the monitoring wells southof Map le Creek, it appears that the shallow bedrock groundwater discharges to Maple Creek.
Bedrock Interval
VOCs present at concentrations that exceeded their MCLs in groundwater in the deeperbedrock interval included benzene, 1,2-DCE, TCE, PCE, 1,1-DCE, and vinyl chloride. Theconcer tration of PCE in the bedrock interval ranged from non-detect to 180 jug/L at MW-9B. PCE was not detected in bedrock monitoring well MW- 6A. PCE, TCE 1,1-DCE,'benzer e and vinyl chloride were detected in MW-11 A. The concentrations of PCE and TCEin the bedrock interval have been plotted on Figures 29 and 30, respectively.
The presence of PCE at locations MW- 8B, MW-9B and MW-11A is consistent with itspresence in the upper intervals and the locations of the potential source areas. Therefore, thesource of PCE/TCE in bedrock interval groundwater is most likely the impacted groundwaterat the shallower depths.
E.9.6.1. Metals
New wells and a sub-set of existing monitoring wells were sampled for metals in December2001. Therefore, the assessment that follows combines recent and prior data to provide acomplete overview of metal concentrations in groundwater.
27
:: q f: f: "< Qv,' -•' W •-.< -.J U
During prior investigations, six of the TAL metals, aluminum, antimony, iron, lead,manganese, and thallium, were detected in groundwater from Site monitoring wells atconcertrations that exceeded the MCLs. In previous investigations, thallium exceeded itsMCL in only one sample from monitoring well MW-3; the only MCL exceedance forantimcny was reported in monitoring well MW-11A. The MCL exceedance for leadoccurred in background monitoring well MW-14 for one sampling event. During the PhaseIV sup elemental RI groundwater investigation, five of the TAL metals, aluminum, antimony,iron, manganese, and thallium, were detected in groundwater from Site monitoring wells atconcer.trations that exceeded the MCLs. The respective exceedances can be viewed inAppendix B.
Previous investigations suggest that the composition of the geologic units in which themonitoring wells are installed is essentially the same. Therefore, the backgroundconcentrations detected in saprolite monitoring well MW-14 are assumed to be alsorepresentative of background in the other monitored intervals. Based on that assumption andthe analytical data from previous investigations, the only metals that are present atconcentrations that exceed both the MCLs and background concentrations are iron,manganese, and thall ium.
The MCL and background concentrations of iron were exceeded in only one monitoring well,MW- 7 (95,400 jug/L), during Phase IV. Monitoring well MW-7 is a saprolite monitoringwell in a well nest that includes shallow bedrock and bedrock monitoring wells. Iron wasnot de :ected at concentrations that exceeded the standards in any of the other samples fromthis W'jl l nest. Elevated concentrations of iron were present in the majority of surface soilsamples. The concentration of iron in MW-7 may be attributable to landfill influences.
The MCL and background concentrations of thall ium were exceeded in only one monitoringwell, MW- 3 (14 /ig/L) during the prior investigations. It was, however, reported in two ofthe wells sampled for metals during the Phase IV RI investigation (MW- 7, MW-9A). MW-3 and MW-7 are saprolite monitoring wells. The source of thallium in the samples isunknown; however, the location of MW-3 is immediately adjacent to the landfill area andMW-7 is within the landfill area. The absence of thallium at similar concentrations in thebackground and other groundwater samples suggest that the presence of thal l ium in thesamphs from MW- 3 and MW-7 may be the result of a localized Site influence. MW-9Ais a shallow bedrock well situated beneath the landfill in the vicinity of MW-3. Thalliumwas not detected in the shallow saprolite well at this location (MW-9). The volume ofgrouaiwater with elevated concentrations of thallium is limited to the saprolite interval inthe irr. mediate vicinity of MW- 3 and MW-7.
The exceedances of the MCL and background concentrations of manganese occurredprimarily in the saprolite monitoring wells with limited exceedances occurring in the shallowbedro:k (MW-8A, MW-10A, and MW-13) and bedrock (MW-11A). Manganese was notpresent in the bedrock interval at any concentration that exceeded the-MCL and backgroundconcentrations.
28

The plumes of groundwater exhibiting elevated concentrations of manganese (>200 /xg/L) arecentered around wells MW-3 in the saprolite interval and MW-11A in the bedrock interval.These w^lls are located in the approximate center of the Site, west of the landfill area. The limitof the manganese plume in the saprolite interval extends across the area bounded by the landfilllimit on the north and east, and by the western limits of the operational areas on the west. Theplume narrows to the south and is generally within the landfil l limit. Elevated concentrationsof manganese were detected in monitoring well MW- 22, but not in any other monitoring welllocated ;;outh of Maple Creek. Manganese was non-detect in the recent groundwater samplecollected from monitoring well MW-23 by low flow purging/sampling techniques suggestingprevious detections may have been attributable to turbidity in the samples (Note: similarreductions were observed in MW-2, MW-14, MW-19, and MW-20). Therefore, due to thepattern of groundwater flow described previously which demonstrates that most of the saprolitegroundv/ater discharges into Maple Creek and the absence of elevated concentrations ofmanganese in the other wells south of Maple Creek, the presence of an elevated concentrationof manganese in MW-22 is not considered a result of Site related activities. In addition to themangansse plume, there is an elevated concentration in MW-1 east of the east drainage ditch.This detection appears to be localized as the monitoring wells in the immediate vicinity of MW-1 (MW- 8 and MW-5) do not exhibit elevated concentrations of manganese.
Groundwater with elevated concentrations of manganese in the shallow bedrock interval iswithin Ihe limit of the Site operation areas, outside the limit of the landfill. The manganeseplume h the shallow bedrock extends beyond the saprolite plume in the southwest direction atMW-1CA.
Manganese is readily released from soil and rock with acidic changes in the pH. Such changesin pH would be expected to be associated with the presence of the landfill and possibly thefacility operations. Therefore, with the exception of MW-22, the presence of elevatedconcentrations of manganese in saprolite, shallow bedrock and bedrock groundwater is mostlikely a result of Site activities.
E.9.7 Sediment
The characterization of sediment in the drainage ditch east of the landfill area and in MapleCreek is based upon the analytical data from samples collected at eight locations (SD- 01through SD-06, CRA-07, and CRA-08) which are located north, east, and south of the Site.Sediment sample location SD-02 is located in the ditch along the east side of the landfillarea. The drainage ditch located north of the Site, which drains the property north of the Siteas well as the northeast corner of the landfill area, drains into the east ditch along thenorthern edge of the property. Sediment sample locations SD-1, SD-3 through SD-6,CRA-07 and CRA-08 are located in Maple Creek. Sediment sample locations SD-3,CRA 07, and CRA-08 are located approximately 1,000 feet, 6,000 feet, and 1,000 feetupstream of the Site, respectively, and represent background conditions. To evaluate theimpact of Site surface water runoff and groundwater discharge on the quality of the
29

40
sediments in Maple Creek, the analytical data from the sample locations within the area ofinfluence of the Site have been compared to background. The concentrations of thecompounds detected in the sediment samples are presented in Appendix B and are illustratedon Figures 33 and 34. Potential impacts to the creek and sediments attributable to the recentinstallation of a sanitary sewer trunk main along, adjacent to, and across the creek in severallocatio ns are not known. The organic chemical compounds detected in the sediment sampleswere S VOCs arid VOCs. Various SVOC and VOC compounds were detected in the samplescollected from Maple Creek. However, none of the concentrations were higher than thecompounds' respective PRGs. Only two compounds detected at location SD-1 downstreamof the Site, benzo(b)fluoranthene and benzo(k)fluoranthene, were not detected at locationSD-3 v/hich is upstream of the Site and reflective of background. Benzo(b)fluoranthene andbenzo(k)fluoranthene were detected at SD-1 at estimated concentrations of 66 and 74 /xg/kg,respectively. These compounds were also detected at SD-5 at estimated concentrations of160 and 140 Mg/kg; however, each was detected in only one Site surface soil sample andneither was detected in any groundwater sample. There is no obvious on-site source of thesecompounds to the sediment of Maple Creek; however, similarly to Aroclor 1248 and 2-methy) naphthalene, the most likely source is Site surface soil. The concentrations of the othercompcunds detected at SD-1, benzo(a)anthracene, benzo(a)pyrene, chrysene, fluoranthene,phenanthrene, and pyrene, were approximately the same as the concentrations at backgroundlocaticn SD-3. Therefore, the presence of these compounds has not been influenced by theSite condition. All metals analytes were detected in the sediment samples. Chromium,mercu -y, and silver were detected in sediment samples at concentrations which exceededtheir respective PRGs. In the evaluation of the sediment metals data, the same conventionutilize d in the evaluation of the soil analytical data has been applied: detected concentrationsare first compared to the PRO and, if higher than the PRO, are then compared to theestimated maximum background concentration. The estimated maximum backgroundconcentrations are equal to two times the average concentration detected in the backgroundsamples.
Chromium was detected at concentrations which exceeded its PRO in all sediment samples,including the background samples. The comparison of the exceedances to the maximumestimated background concentration (two times background) of 17.4 mg/kg indicates thesamples collected at SD-1, SD-2, SD-5 (June 1990), and SD-6 exceeded both backgroundand ths PRO. The average concentration of chromium in the sediment sample from locationSD-5 located in Maple Creek was 20.9 mg/kg, only slightly higher than the estimatedmaximum background concentration and is most likely reflective of background conditionsand not of an influence from the Site. The concentrations of chromium in samples collectedfrom the other locations in Maple Creek ranged from 13.5 mg/kg at SD-6 to 23.7 mg/kg atSD-1 downstream of the Site. Chromium was detected in all surface soil samples. Theconcentrations of chromium in the Site - surface soil samples ranged from 4.6 mg/kg to 339mg/k£; with an average concentration of 78.4 mg/kg and the concentrations in the 0 to 1-footbgs samples from the off-Site borings ranged from 19 mg/kg to 34.9 mg/kg with an averageconcentration of 31.2 mg/kg. The highest concentrations of chromium were generally
30

detecte d in the surface soil samples from the 501,509, and Sedimentation Basin Areas. Areas501 an 1509 have potential to impact the sediments in the vicinity of SD-2 through transportof soil particles in surface water runoff. Therefore, the probable source of chromium at SD-2is surface water runoff from the 501 and 509 areas. Mercury was detected in the sample fromone lo:ation (SD-5) at concentrations which exceeded the PRO of 0.15 mg/kg. Thisconcertration was also higher than the estimated maximum background concentration of0.12 mg/kg. Mercury was detected in 51 of the 78 Site surface soil samples at concentrationswhich ranged from 0.12 mg/kg to 72.6 mg/kg and averaged 3.6 mg/kg. Mercury was notdetected in the off-Site borings at any concentration greater than 0.21 mg/kg. The highestconcertrations of mercury in Site surface soil were in the samples from Area 501,specifi:ally Areas 501-01, 501-03,Area 501-04, and 501-06. The concentrations in theseareas ringed from 15.1 mg/kg to 62.9 mg/kg.
Nickel was detected in the sample from one location at concentrations which exceeded thePRO o "20.9 mg/kg. The location at which the exceedance occurred is located in the drainageditch h one of the samples collected at SD-2 (25 mg/kg in June 1998). A confirmatorysample was collected at SD-2 in July 1999. The concentration of nickel in this sample was13 mg'kg, less than the PRO. Both these concentrations are higher than the estimatedbackground concentration of 4.8 mg/kg. Nickel was detected in 67 of the 78 Site surf ace soilsamples at concentrations which ranged from 2.5 mg/kg to 1,180 mg/kg. The averageconcentration in Site surface soils was 36.4 mg/kg.
E.9.8 Surface Water
The characterization of surface water in the drainage ditch east of the landfill area and inMaple Creek is based upon the analytical data from samples collected at six locations (SW-1throug i SW-6) which are located north, east, and south of the Site Surface water samplelocation SW-2 is located in the ditch along the east side of the landfill area. The drainageditch located upgradient (north) of the Site, which drains the off-site property north of theSite as well as the northeast corner of the landfill area, drains into the east ditch. The datafrom SW-2, therefore, represent potential contributions from the Site and from the off-siteproperies to the north. Surface water sample locations SW-1, SW-3 through SW-6, CRA-07,and CRA-08 are located in Maple Creek. Surface water locations SW-3, CRA-07, andCRA-08 are located approximately 1,000 feet, 6,000 feet, and 1,000 feet upstream of theSite, respectively and represent background surface water quality. To evaluate the impact ofSite surface water runoff and groundwater discharge to the quality of the surface water inMaple Creek, the analytical data from the sample locations within the area of influence ofthe Sito have been compared to background. The concentrations of the compounds detectedin the surface water samples are presented in Appendix B, and have been mapped on Figures33 and 34. The only organic chemical compounds detected in the surface water samples wereVOCS. Six VOCs, 1,1-dichloroethane, 1,2-dichloroethene (total), benzene,tetrachloroethene, trichloroethene, and vinyl chloride, were detected; however, noconcertration exceeded its PRO. No VOCs were detected in background sample SW-3.
31

Sample locations SW- 4 and SW-5 are located in Maple Creek along the south boundary ofthe landfill area. The influence of saprolite groundwater discharging from the landfill areainto Mc.ple Creek would be reflected in the analytical data from these locations. No VOCswere detected in the sample from location SW- 4. Two VOCs, 1,2-dichloroethene (total) andtrichlorDethene, were detected in the sample from SW-5; however, the concentrations of eachcompound were less than 1 /xg/L. These data demonstrate that groundwater discharge intoMaple Creek has had no significant effect on the quality of surface water in the creekadjacent to the Site.
All six of the VOCs noted above were detected at location SW-2 in the eastern drainageditch; however, none of the concentrations exceeded the PRO. The presence of thesecompounds in surface water at this location is most likely a result of the discharge ofsaprolile- groundwater into the ditch. Sample locations SW-6 and SW-1 are located in MapleCreek downstream of the discharge point of the east drainage ditch into the creek. ThreeVOCs, 1,2-dichloroethene (total), tetrachloroethene, and trichloroethene, were detected inthe samples from these locations. The concentrations of the VOCs detected in the samplesfrom locations SW-6 and SW-1 were low, ranging from 0.43 /ng/L to 2 /xg/L. All theseconcentrations are orders of magnitude below the PRGs. These data demonstrate that theVOCs detected in the samples from Maple Creek may be present as a result of Site influence,however, there has been no significant effect on the water quality of the creek. All metalsanalytes were detected in the surface water samples. The concentrations of aluminum, iron,and manganese in all samples exceeded the PRGs; however, only manganese in SW-2 ispresenl at concentrations which exceeded both the PRGs and two times the averagebackground concentrations. As described in the previous section, the influence of saprolitegroundwater discharging from the landfill area into Maple Creek would be reflected in theanalyti ;al data from sample locations SW-4 and SW-5. The concentrations of the metalswhich exceeded the PRGs at these locations were not higher than the maximum backgroundconcentrations. These data further demonstrate that groundwater discharge into Maple Creekhas had no significant effect on the quality of surface water in the creek adjacent to the Site.The concentrations of iron and manganese in the sample from the east ditch (SW-2) arehigher than in any other sample, averaging 1,;890 /xg/L and 4,150 /ig/L, respectively. Thepresence of these metals at these concentrations in the east ditch may be reflective ofsaprolite groundwater discharging into the ditch. The concentrations of these analytes in thesamples from Maple Creek downstream of the ditch discharge (SW-6 and SW-1) areappro* imately equal in both samples, iron is present at 835 jig/L at SW-6 and 876 /xg/L atSW-1, and manganese is present at 63 jiig/L at SW-6 and 62 /xg/L, at SW-1. Theseconcertrations exceed the PRGs but are not higher than two times the average backgroundconcentrations. If the presence of these compounds were a result of an influence from theeast drainage ditch, the concentrations would be expected to decrease with distance from theditch. This is not the pattern exhibited by these data. Additionally, the concentrations of ironand manganese at locations SW-6 and SW-1 are within the range of two times the averagebackground concentrations and are not indicative of impact from the east drainage ditch onthe Sile. Aluminum is present at an average concentration of 1,035 /ig/L at SW-6. This
32

t J
concentration exceeds the PRO; however, it is essentially equal to the average backgroundconcentration of 1,033 jig/L. Aluminum was not detected at a concentration which washigher than background in any surface water sample collected from locations adjacent to theSite. Tierefore, the presence of aluminum at SW-6 is reflective of the range of backgroundconcentrations and not an impact of the Site. The surface water and sediment analytical datademonstrate that the Site and adjacent properties to the north may have impacted the qualityof sediments and surface water in the east drainage ditch. However, there are noconcentrations of organic chemical compounds or metals in the sediment or surface waterof Maple Creek which exceeded the higher of background or screening criteria. Therefore,there has been no significant impact on the sediments or surface water of Maple Creek fromSite activities.
E.10 Contaminant Fate and Transport
The evaluation of all available Site data identified four potentially significant migrationpathways: landfill gas emissions to ambient air; leaching of contaminants from soil togrounc.water; migration of groundwater to surface water; and, vapor transport fromgrouno water to indoor air.
• A landfill gas assessment was conducted to estimate maximum landfill gas emissionrates and exposure point concentrations. Comparison of the predicted maximumemission rates to South Carolina's de minimis emission criteria showed that onlybenzene and vinyl chloride exceeded the criteria. Based on the results of the airdispersion model, the resulting 24 hour average concentrations are below SouthCarolina Maximum Ambient Air Concentrations (MAACs). Therefore, landfill gasemissions do not pose a significant risk to on-Site or off-site receptors.
• A qualitative assessment of the potential for leaching of contaminants from soil togroundwater identified a limited potential for groundwater impact. Residual soilprimarily contaminated with VOCs is generally limited to the upper 4 feet of the soilhorizon.
• The evaluation of groundwater migration to surface water has shown that the closureof the landfill, and the Removal Action has resulted in the general decline ofcontaminant concentrations in the groundwater across the Site. Groundwaterdischarges to Maple Creek over most of the Site. However, this discharge ofgroundwater to Maple Creek has not resulted in an unacceptable impact on thesurface water quality and is not expected to impact surface water quality.
• An evaluation of the potential migration of VOC vapors from the groundwater toindoor air was undertaken for the former Administration Area. This evaluation usedthe an air modeling program, and assumed conservatively future residentialdevelopment even though such development is currently prohibited at the Site. The
33
results of this evaluation indicated that the potential vapor migration fromgroundwater would not result in an unacceptable risk.
F. CURRENT AND POTENTIAL FUTURE LAND AND WATER USES
F.I Land Uses
The Sits is presently undeveloped and the land surrounding the Site is generally wooded,with the closest residences located approximately 650 feet to the east. Although no activitiesof a commercial nature are currently being conducted at the Site, the property is zoned ascommercial/industrial, consistent with planned future development in the area. Further, theSite is located within the "Airport Environs Area" as defined by the Greenville - SpartanburgAirport Environs Area zoning ordinance, dated March 29, 1996. This zoning ordinanceprecludes future residential development and use of the Site. Most likely, workers mayconduct occupational, construction or maintenance/installation activities at the Site in thefuture.
F.2 Groundwater Uses
Grounc water is not in use at the Site, but one nearby water well within 1/4-mile is in use fornon-po :able uses such as irrigating lawns and gardens, and washing cars. This resident is alsoconnec :ed to a municipal water system. Although, the vast majority of the nearby water useis supp led by a municipal water system, SCDHEC groundwater classifications for the areaindicate that groundwater from the aquifer system is considered a current and potential futuresource Df drinking water.
F.3 Surface Water Uses
Under South Carolina Code of Regulations, Water Classifications and Standards(Regulations 61-68) and Classified Waters (Regulation 61-69), Maple Creek is classified asa Fresh water water body. However, the area of Maple Creek immediately adjacent to the Sitedoes not appear to be used for recreational activities.
G. SUMMARY OF SITE RISKS
G.I Summary of Human Health Risk Assessment
The Hi man Health Baseline Risk Assessment (BRA) estimates what risks the Site poses ifno action were taken. It provides the basis for taking action and identifies the contaminantsand exposure pathways that need to be addressed by the remedial action. This section of theROD s jmmarizes the results of the BRA for this Site.
34

0 0 4 5
The BRA for the Aqua-Tech Site addressed two Exposure Units. Exposure Unit 1 (EU-1)is defined to include the area inside the existing security fence and extending to the drainageditch just beyond the southeast extent of the closed MSWL, as shown on Figure 35. ExposureUnit 2 (EU-2) is defined to include all other areas of the Site (i.e., outside the fence andbeyond the drainage ditch on the south and east of the Site). The data used to calculate risksfor each exposure unit are presented in Appendix B. Specifically, the BRA addressed thepotential for exposure to the various environmental media located at the Site, and at MapleCreek, or based upon off-site air emissions. These environmental media included surfacesoil, air, subsurface soil and groundwater in EU-1 and EU2 (because of the mobile nature ofgroundwater the exposure units were combined for this medium). Sediment and surfacewater were assessed in EU-2. For each environmental medium, Tables 1.1 - 1.6 (includedin Appendix C) provide the appropriate scenarios, exposure points, receptor populations andexposure routes, as well as the rationale for selection or exclusion of each exposure pathwayfor the Site. A summary of exposure pathways evaluated quantitatively is provided below.
Table 2 - Summary of Exposure Pathways Evaluated Qualitatively
Environmental Medium
Surface Soil
Surface Soil
Subsu face Soil
Subsu:face Soil
Sedim;nt
Sediment
Groundwater
Groundwater
Surface Water
Surface Water
Air
Air
ScenarioTimeframe
Current
Future
Current
Future
Current
Future
Current
Future
Current
Future
Current
Future
Receptor Population
Adolescent Trespasser/Visitor (EU-l/EU-2)
Resident (EU-l/EU-2)Commercial Worker (EU-l/EU-2)Construction Worker (EU-l/EU-2)
None
Construction Worker (EU-l/EU-2)
Adolescent Trespasser/Visitor (EU-2)
Construction Worker (EU-2)
None (qualitative only )
Irrigation/Maintenance Worker (EU-l/EU-2)Resident (EU-l/EU-2)
Adolescent Trespasser/Visitor (EU-2)
None (qualitative only , same as current)
Adolescent Trespasser/Visitor (EU-l/EU-2)
Resident (EU-l/EU-2)Commercial Worker (EU-l/EU-2)Construction Worker (EU-l/EU-2)Irrigation /Maintenance Worker (EU-l/EU-2)
35

J 0 4 6o
Although, the residential scenario was included for completeness of the BRA, future residential useof the Site and its environs is prohibited by the applicable zoning ordinance related to the proximityof the Site to the Orreenville-Spartanburg Airport. Furthermore, the clean-up levels for all mediaof concern at the Site excluding groundwater will be based on future commercial/industrial use(IxlO"6 for carcinogenic compounds and HQ of 1 for non-carcinogenic compounds). SinceSCDHEC classifies the shallow groundwater beneath the Site as a potential source of drinkingwater, the clean-up levels for groundwater will be based on future residential use.
While the EPA Presumptive Remedy Guidance allows for streamlining the BRA, the presenceof numerous environmental media (soil, groundwater, surface water, sediment and landfill gas)and several routes of exposure (dermal, ingestion and inhalation) led to the generation of a fullquantitative assessment.
G.I.I Conceptual Site Model
The Conceptual Site Model developed in the BRA is presented in Table 3.
Table 3 - Conceptual Site Model For the BRA (Exposure Scenarios Evaluated Quantitatively)
Scenario Receptor ExposurePathvvay(s)
Exposure Routes
EPS- 1CurrentUse
Adohscent Trespasser/Site Visitor (EU-l/EU-2) Surface SoilSediment1
Surface Water'Air
Incidental IngestionDermal ContactInhalation of Particulates2
Inhalation of Volatiles2
EPS-2Future Use
Chile and Adult Resident (EU-l/EU-2) Surface SoilGroundwaterAir
Incidental IngestionDermal ContactInhalation of Particulates2
Inhalation of Volatiles2
EPS-3Future Use
Cormiercial Worker (EU-l/EU-2) Surface SoilAir
Incidental IngestionDermal ContactInhalation of Particulates2
Inhalation of Volatiles2
EPS-4Future Use
Construction Worker (EU-l/EU-2) Surface SoilSubsurface SoilSediment1
Air
Incidental IngestionDermal ContactInhalation of Particulates2
Inhalation of Volatiles2
EPS-5Future Use
Irrigation Worker (EU-l/EU-2) GroundwaterAir
Incidental IngestionDermal ContactInhalation of Particulates2
Inhalation of Volatiles2
Notes:EPS = Exposure Pi.thway Scenario'Exposure Pathways Surface Water and Sediment are only located in EU-22The Exposure Roi tes for the Exposure Pathway Air are Inhalation of Particulates2 and Inhalation of Volatiles2
36

9 0 0 4 7
G.1.2 Identification of Chemicals of Concern
As described™ section G. 1, the BRA evaluated soil, surface water, sediment, groundwater andair. Onl) the surface soil, subsurface soil, groundwater and air media were found to haveChemicals of Concern (COCs). Those COCs, their frequency of detection, range ofconcentrations/and exposure point concentrations are found in Tables 4, 5 and 6.
Table 4 - BRA COCs - Surface Soil
Iron EU1EU2
Lead EU1EU2
Merciry EU1EU2
Frequencyof Detection
' 69/6911/11
69/6911/11
50/692/11
Range of DetectionConcentrations (mg/kg)
8,080 - 56,3009,700 - 40,000
14.3- 1,29017.3-55.3
0.13-730.12-.51
Exposure PointConcentration(mg/kg)
45,86627,800
98
7.3
Table 4a - BRA COCs - Subsurface Soil
Aroclor 124:: EU1FIT?
Iron EU1EU2
Thallium EU1EU2
Trichloroeth ;ne EU1FU2
Frequencyof Detection
3/16
21/21
10/211/21
23/85
Range of DetectionConcentrations (mg/kg)
0.07- 19
24,800 - 63,00027,300-41,000
0.84 - 3431.7
.0029-1,020
Exposure PointConcentration(mg/kg)
4.0
43,800
12Not Calculated
50
Table 5 - BRA COC - Air
Benzene
Frequency ofDetecition
Not Applicable
Range of DetectionConcentrations
(mg/kg)
Not Applicable
MaximumConcentration
(mg/m3)
.0007176
Exposure PointConcentration(mg/kg)
.0007176
37
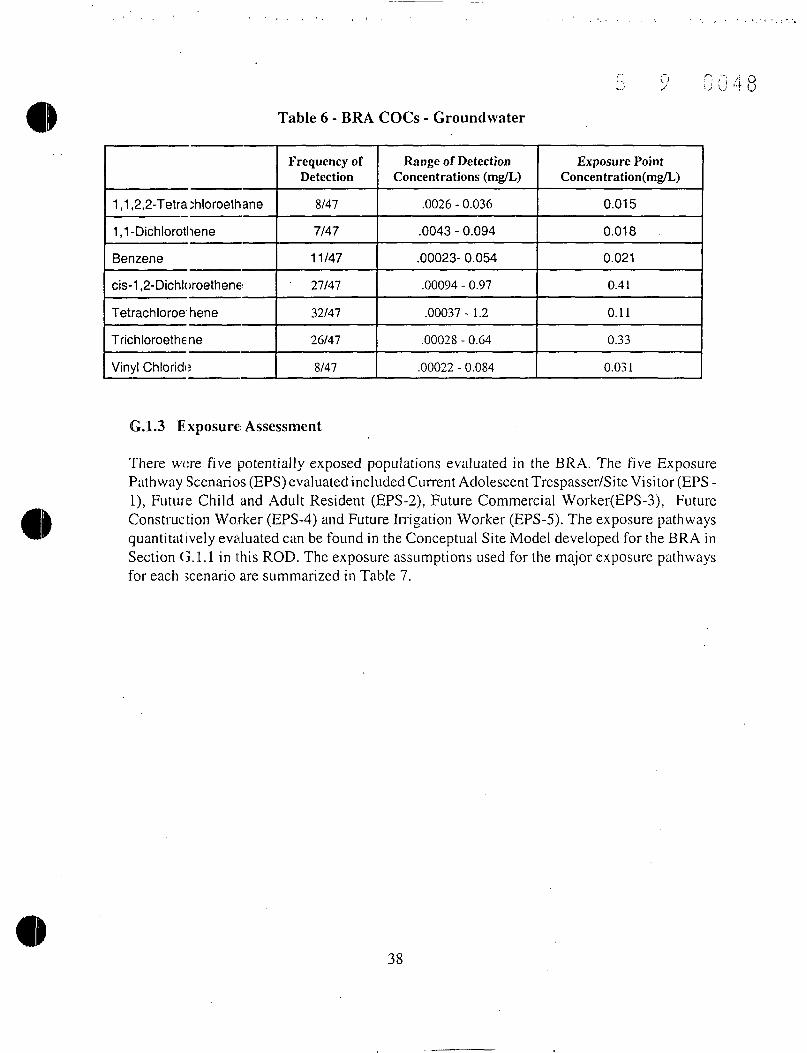
0 0 4 8Table 6 - BRA COCs - Groundvvater
1 ,1 ,2,2-Tetra:hloroethane
1,1-Dichlorothene
Benzene
cis-1 ,2-Dichloroethene
Tetrachloroe hene
Trichloroethene
Vinyl Chlorido
Frequency ofDetection
8/47
7/47
11/47
27/47
32/47
26/47
8/47
Range of DetectionConcentrations (mg/L)
.0026 - 0.036
.0043 - 0.094
.00023- 0.054
.00094 - 0.97
.00037 - 1.2
.00028 - 0.64
.00022 - 0.084
Exposure PointConcentration(mgAL)
0.015
0.018
0.021
0.41
0.11
0.33
0.031
G.1.3 Exposure Assessment
There w<;re five potentially exposed populations evaluated in the BRA. The five ExposurePathway Scenarios (EPS) evaluated included Current Adolescent Trespasser/Site Visitor (EPS -1), Future Child and Adult Resident (EPS-2), Future Commercial Worker(EPS-S), FutureConstruction Worker (EPS-4) and Future Irrigation Worker (EPS-5). The exposure pathwaysquantitatively evaluated can be found in the Conceptual Site Model developed for the BRA inSection G.I.I in this ROD. The exposure assumptions used for the major exposure pathwaysfor each scenario are summarized in Table 7.
38

0 0 4 9
Table 7 - Exposure Assumptions
Soil Ingestion Ratf
Water IngestionRate
Skin Surface Areaavailable forconta:t
Adherence Factor
ParticulateEmission Factor
Inhalation Rate
Exposure (EU-1)Frequency (EU-^)
Exposure Duration
Body Weight
Averaging (NC)Time " (C)
Dermal AbsorptionFactor
EPS - 1Current
AdolescentTrespasser/S
ite Visitor
lOOmg/day
3,293 cm2
.2mg/cm2/day
2.33 x 10"m'/kg
13 m3/day
50 days/yrlOOdays/yr
10 years
45kg
3,650 days25,550 days
EPS -2Future Child
200 mg/day
l.OL/dayl.SL/day1
1,720cm2
.2 mg/cm2/day
2.33 x 10"m3/kg
8.1 m3/day
350 days/yr
6 years
15kg
2, 190 days
EPS -2Future Adult
Resident
100 mg/day
2IJday
4,508 cm2
.2 mg/cnr/day
2.33 x 10"m3/kg
13. 25m 3 /day
350 days/yr
24 years
70kg
8,760 days
EPS -3Future
CommercialWorker
50 mg/day
2,503 cm2
.3 mg/crrr/day
2.33 x 10"m3/kg
12.8m3 /day
250 days/yr
25 years
70kg
9, 125 days25,550 days
EPS -4Future
ConstructionWorker
1 95 mg/day
5000 cm2
.5 mg/cm2/day
1.17x 10"m3/kg
20 m3 /day
250 days/yr
0.33 years
70kg
122 days25,550 days
EPS -5Future
IrrigationWorker
.02 IVday
5,000 cm2
2.33 x 10"m3/kg
20 m3 /day
32 days/yr
25 years
70kg
9, 1 25 days25,550 days
Chemical Specific. If not available, 0.01 for organic compounds, 0.001 for inorganic compounds.
EU - Exposure Unit ' Water Ingestion Rate for the Aggregate AdultNC - Non-cancer riskC - Cancer risk
39

Q
G.1.4 Toxicity Assessment
The BRA utilized information from the Integrated Risk Information System (IRIS),Health Effects Assessment Summary Tables (HEAST), National Center forEnvironmental Assessment (NCEA), Department of Energy (DOE), and thebenzo(a)pyrene Toxicity Equivalence Factor (TEF) methodology. The assessmentlooked al both carcinogenic and non-carcinogenic effects. Table 8 provides non-carcinogenic risk information which is relevant to the primary contaminants of concernin air, soi 1 and groundwater. Table 9 provides carcinogenic risk information which isrelevant to the primary contaminants of concern in air, soil and groundwater. The oraland derm.il toxicological values for noncarcinogenic COPCs (e.g., reference doses, orRfDs) are shown in Table 5.1 in Appendix C. The inhalation toxicological values fornoncarcinogenic COPCs are shown in Table 5.2 in Appendix C. The toxicologicalvalues for potentially carcinogenic COPCs (e.g., carcinogenic slope factors, CSFs) areshown in Table 6.1 in Appendix C. The inhalation toxicological values for potentiallycarcinogenic COPCs are shown in Table 6.2 in Appendix C.
40
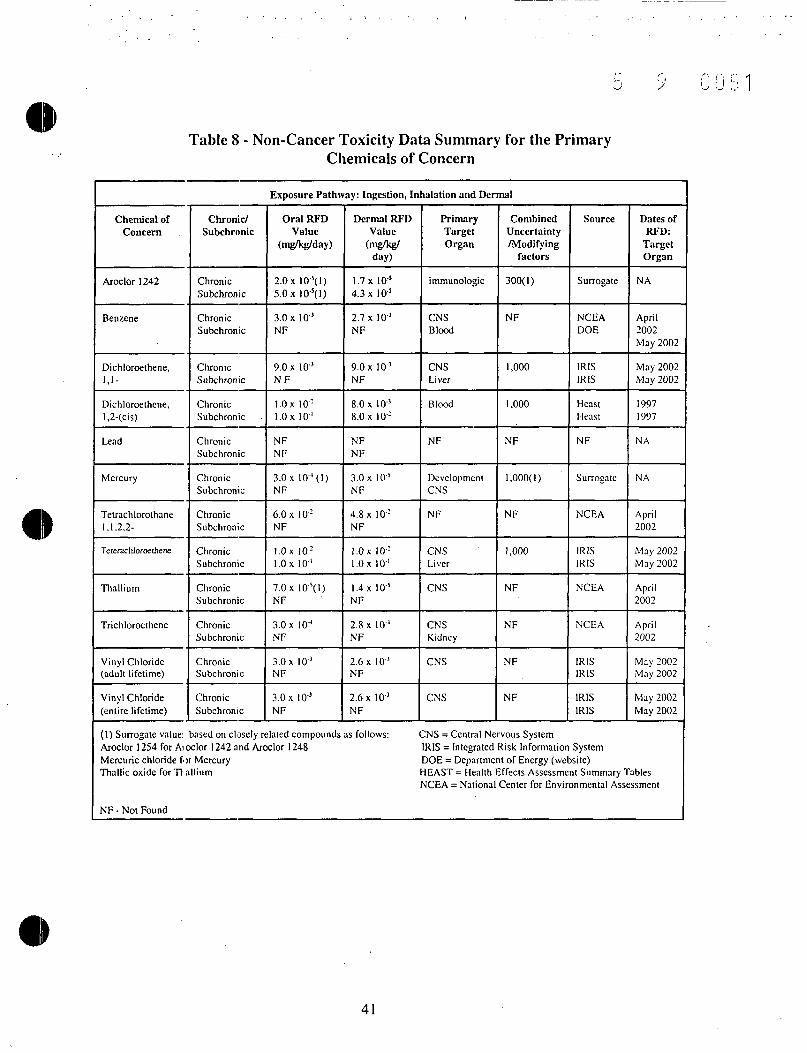
51
Table 8 - Non-Cancer Toxicity Data Summary for the PrimaryChemicals of Concern
Exposure Pathway: Ingestion, Inhalation and Dermal
Chemical ofConcern
Aroclor 1242
Benzene
Dichloroethene,U-
Dichloroethene,l,2-(cis)
Lead
Mercury
Tetrachlorothane1,1,2,2-
Teteracliloroethene
Thallium
Trichloroelhene
Vinyl Chloride(adult lifetime)
Vinyl Chloride(entire lifetime)
Chronic/Subchronic
ChronicSubchronic
ChronicSubchronic
ChronicSubchronic
ChronicSubchronic
ChronicSubchronic
ChronicSubchronic
ChronicSubchronic
ChronicSubchronic
ChronicSubchronic
ChronicSubchronic
ChronicSubchronic
ChronicSubchronic
Oral RFDValue
(mg/kg/day)
2.0 x 10'!(1)5.0x)0-s(!)
3.0 x 10'NF
9.0 x 10'3N F
l . O x 10-l . O x 10 '
NFNF
3.0 x 10J(1)NF
6.0 x 10 2
NF
l . O x IO'2l . O x 10"'
7.0 x 10⁵(1)NF
3.0 x 10J
NF
3.0 x 10°NF
3. Ox 10'3NF
Dermal RFDValue
(mg/kg/day)
1.7x 10s
4.3 x 10s
2.7 x 10 3
NF
9.0 x 10 3
NF
8.0 x 10'38.0 x 10'2
NFNF
3.0 x 10'sNF
4.8 x 10'2NF
l . O x 10'2l . O x IO'1
1.4 x 10'5NF
2.8 x 10J
NF
2.6 x 10°NF
2.6 x 10°NF
PrimaryTargetOrgan
immunologic
CNSBlood
CNSLiver
Blood
NF
DevelopmentCNS
NF
CNSLiver
CNS
CNSKidney
CNS
CNS
CombinedUncertainty/Modifying
factors
300(1)
NF
1,000
1,000
NF
1,000(1)
NF
1,000
NF
NF
NF
NF
Source
Surrogate
NCEADOE
IRISIRIS
HeastHeast
NF
Surrogate
NCEA
IRISIRIS
NCEA
NCEA
IRISIRIS
IRISIRIS
Dates ofRFD:
TargetOrgan
NA
April2002May 2002
May 2002May 2002
19971997
NA
NA
April2002
May 2002May 2002
April2002
April2002
May 2002May 2002
May 2002May 2002
(1) Surrogate value; based on closely related compounds as follows: CNS = Central Nervous SystemAroclor 1254 for Aioclor 1242 and Aroclor 1248 IRIS = Integrated Risk Information SystemMercuric chloride for Mercury DOE = Department of Energy (website)Thallic oxide for 7T all ium HEAST = Health Effects Assessment Summary Tables
NCEA = National Center for Environmental Assessment
NF - Not Found
41
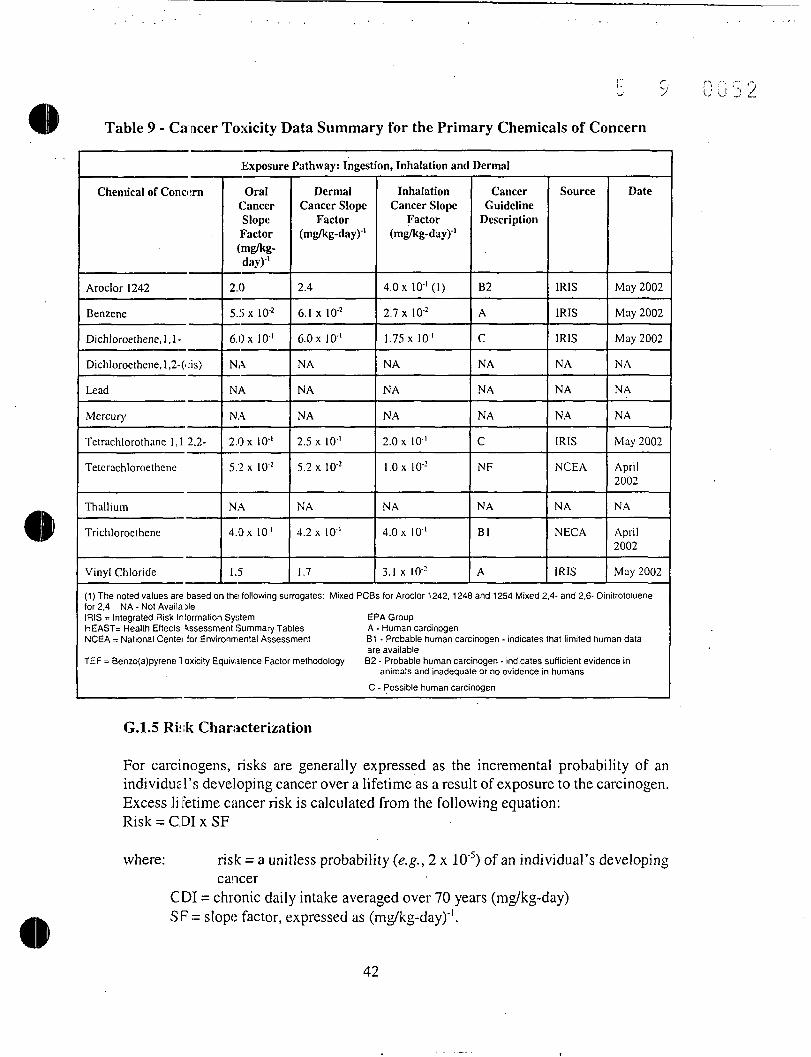
Table 9 - Cancer Toxicity Data Summary for the Primary Chemicals of Concern
Exposure Pathway: Ingestion, Inhalation and Dermal
Chemical of Conci :rn
Aroclor 1242
Benzene
Dichloroethene,!,!-
Dichloroethene, 1 ,2-0 :is)
Lead
Mercury
Teirachlorothane 1 , 1 2,2-
Tetcrachloroethene
Thallium
Trichloroethene
Vinyl Chloride
OralCancerSlopeFactor(:mg/kg-day)'1
2.0
5.5 x 10'2
6.0 xlO'1
NA
NA
NA
2.0 x ID'1
5.2 x 10⁻²
NA
4.0 x 10'1
1.5
DermalCancer Slope
Factor(mg/kg-day)-1
2.4
e. ix io-2
6.0 x 10''
NA
NA
NA
2.5 x 10''
5.2 xlO'2
NA
4.2 x 10''
1.7
InhalationCancer Slope
Factor(mg/kg-day)-1
4.0 x lO-'(l)
2.7 x 10⁻²
1.75 x 10-'
NA
NA
NA
2.0 x 10'1
l .Ox 10'2
NA
4.0 x 10''
3.1 x 10'2
CancerGuideline
Description
B2
A
C
NA
NA
NA
C
NF
NA
Bl
A
Source
IRIS
IRIS
IRIS
NA
NA
NA
IRIS
NCEA
NA
NEC A
IRIS
Date
May 2002
May 2002
May 2002
NA
NA
NA
May 2002
April2002
NA
April2002
May 2002
(1) The noted values are based on the following surrogates: Mixed PCBs for Aroclor 1242, 1248 and 1254 Mixed 2,4- and 2.6- Dinitrotoluenefor 2,4 NA - Not Availa DieIRIS = Integrated Risk Information System EPA GroupHEAST= Health Effects Assessment Summary Tables A - Human carcinogenNCEA = National Centei for Environmental Assessment B1 - Probable human carcinogen - indicates that limited human data
are availableTEF = Benzo(a)pyrene 1 oxicity Equivalence Factor methodology B2 - Probable human carcinogen - indicates sufficient evidence in
animals and inadequate or no evidence in humans
C - Possible human carcinogen
G.1.5 Risk Characterization
For carcinogens, risks are generally expressed as the incremental probability of anindividual's developing cancer over a lifetime as a result of exposure to the carcinogen.Excess li retime cancer risk is calculated from the following equation:Risk = GDI x SF
where: risk = a unitless probability (e.g., 2 x 10~5) of an individual's developingcancer
GDI = chronic daily intake averaged over 70 years (mg/kg-day)SF = slope factor, expressed as (mg/kg-day)"1.
42

C 0 5 3
These risks are probabilities that usually are expressed in scientific notation (e.g., IxlO"6). Anexcess lifetime cancer risk of IxlO'6 indicates that an individual experiencing the reasonablemaximurr exposure estimate has a 1 in 1,000,000 chance of developing cancer as a result ofsite-related exposure. This is referred to as an "excess lifetime cancer risk" because it wouldbe in addition to the risks of cancer individuals face from other causes such as smoking orexposure i.o too much sun. The chance of an individual developing cancer from all other causeshas been estimated to be as high as one in three. EPA's generally acceptable risk range for site-related exposures is 10"4 tolO"6.
The potential for noncarcinogenic effects is evaluated by comparing an exposure level over aspecified 1 ime period (e.g., life-time) with a reference dose (RfD) derived for a similar exposureperiod. An RfD represents a level that an individual may be exposed to that is not expected tocause any deleterious effect. The ratio of exposure to toxicity is called a hazard quotient (HQ).An HQ<1 indicates that a receptor's dose of a single contaminant is less than the RfD, and thattoxic nonoarcinogenic effects from that chemical are unlikely. The Hazard Index (HI) isgenerated by adding the HQs for all chemical(s) of concern that affect the same target organ(e.g., liver) or that act through the same mechanism of action within a medium or across allmedia to v/hich a given individual may reasonably be exposed. An HI<1 indicates that, basedon the sum of all HQ's from different contaminants and exposure routes, toxic noncarcinogeniceffects from all contaminants are unlikely. An HI> 1 indicates that site-related exposures maypresent a risk to human health.
The HQ i: calculated as follows:
Non-cancer HQ = CDI/RfD
where:GDI = Chronic daily intake (mg/kg-day)RfD = reference dose (mg/kg-day)
GDI and RfD are expressed in the same units and represent the same exposure period (i.e.,chronic, subchronic, or short-term).
Risks that exceed a Hazard Index of 1 or a carcinogenic risk of IxlO"6 are presented in Tables10 & 11. This table only includes a sum of the primary COCs for the Site. This does notinclude th; total risks for each receptor population or for all constituents contributing to therisks. The carcinogenic risks for the Future Aggregate Resident, Future Commercial Worker,and the Future Irrigation Worker are 4.7 xlO"3, 2.2 xlO"6 and 2.0 xlO"5, respectively. The non-carcinogenic risks for the Future Child Resident, Future Adult Resident, and the FutureConstruction Worker are 180/170 (EU-l/EU-2), 74/73 (EU-l/EU-2) and 3.2/1.0 (EU- l/EU-2),respectively. For a detail summary of the Total Risk Across All Media and All Routes' referto Appendix B- RAGs Part D Tables.
43

Table 10 - Risk Characterization Summary - Carcinogens
Scenario Time Frame: FutureReceptor Population: Construction WorkerReceptor Age: Adult
Medium
Surface Soil
ExposureMedium
Surface Soil
Air
ExposurePoint
EU- 1E U - 2
EU- 1
Chemical ofConcern
Iron
Mercury
Carcinogenic Risk
InonrCsxr.•••£>"••"•""
NCNC
—
Inhalation
NC
Dermal
NCNC
.....
Total Risk Across Surface Soil EU - 1EU-2
Subsurface Soil Subsurface Soil E U - 1 Aroclor 1242
Iron
Thallium
Trichloroethene
7.3xlO'8
NC
NC
1.8xlO'7
l . lxlO' 8
NC
NC
2.4x1 0'8
Total Risk Across Subsurface Soil
Landfill Gas Air EU-1EU-2
BenzeneBenzene ___
I.SxiO-7
i .Sxio-7....
Total Risk Across Landfill Gas EU - 1EU-2
Total Risk Across All Media and All Routes EU - 1E U - 2
"This table only includes a sum of the primary COCs for the Site. This docs not include the total risks for each receptor population or forall constituents contributing to the risks. In addition, the carcinogenic risks for the Future Aggregate Resident, Future CommercialWorker, and the Future Irrigation Worker are 4.7 xlO'3 , 2.2 xlO" 6 and 2.0 x l O 5 , respectively. For a detail summary of the 'Total RiskAcross All Media and All Routes' refer to Appendix B- RAGs Part D Tables. NC - Not Calculated
il>XpGSUr6 jxGUic i Oiui
NCNC
NC
NCNC
8.4X10'8
NC
NC
2.1X10'7
2.9x10'
I .Sx iO 7
l.SxlO'7
I.SxiO7
I.SxiO7
4.7xl07
LSxlO7
44

Table 11 • Risk Characterization Summary - Non-Carcinogens
Scenario Time Frame: FutureReceptor Population: ResidentReceptor Age: Adult
Medium
Surface Soil
ExposureMedium
Surface Soil
Air
ExposurePoint
EU- 1E U - 2
E U - 1
Chemical ofConcern
Iron
Mercury
Non-Carcinogenic Risk
Ingcstion
0.210.31
...
Inhalation
....
0.7
Dermal
0.0210.031
.....
Total Risk Across Surface Soil EU - 1E U - 2
Groundwaler Groundwatcr EU-1&EU-2 1,1,2,2-Tetrachloroethane
1,1-Dichlorothene
Benzene
cis-1 ,2-Dichloroethene
Tetrachloroethene
Trichloroethene
Vinyl Chloride
NC
.056
0.2
I . I
0.3
3.0
0.29
NC
.056
0.2
I . I
0.3
3.0
0.29
Total Risk Across Groimdwatcr
Landfill Gas Air E U - 1EU-2
BenzeneBenzene ....
0.760.76 _
Total Risk Across Landfill Gas EU - 1EU - 2
'Total Risk Across All Media and All Routes EU - 1E U - 2
'This table only includes a sum of the primary COCs for the Site. This docs not include Ihc total risks for each receptor population or for all constituentscontributing to the risks. In addition, the non-carcinogenic risks for the Future Child Resident, Future Adult Resident, and the Future ConstructionWorker arc 180/170 (EU-l/EU-2) , 74/73 (EU-l/EU-2) and 3.2/1.0 (EU-l/EU-2) respectively. For a detail summary of the Total Risk Across All Mediaand All Routes' refer to Appendix B- RAGs Part D Tables.
Exposure Route Total
0.230.41
0.7
0.930.41
NC
.11
.39
2.2
0.6
6.0
0.57
10.0
0.760.76
0.760.76
12.011.0
45
Q
G.1.6 "Hot-Spot >"
Potential rot spots for soil were identified as those locations with concentrations of the chemicalof potential concern (COPC) which exceeded ten times the exposure point concentration (EPC) forthat chemical and also exceeded the appropriate remedial goal (RG) for that chemical. The surfacesoil values were compared to residential RGs and the subsurface soil values were compared to theconstruction worker RGs. Potential hot spots for groundwater were identified as those locations withconcentrations of the chemical of potential concern which exceeded ten times the EPC for thatchemical and also exceeded the MCL or, if no MCL was established, exceeded the appropriate RGfor that chemical. Therefore, the potential hot spots include the following:
-five locations for surface soil:501-06;501-04;509-01;601-02 B-l; and,PCL-;SA.-two locations for subsurface soil:DIS-S:P;and,DISF-1.-and four groundwater wells:MW-l;MW-7;MW-l6A; and,MW- 24.
For grounc.water, it is important to note that because the EPC was calculated based on the four"plume" wells, these four wells have not been identified as hot spots. Three of the four hot spotsidentified for groundwater are based on aluminum (MW-16A and MW-24) and iron (MW-7). Thesemetals may be naturally occurring constituents of Site groundwater. Potential risks that do existwould be further reduced following implementation of a Presumptive Remedy that is directed at theclosed MSWL aspects of the Site. Table 12 identifies COCs and RGs applicable to soil forcommercial/industrial use and exposures.
46
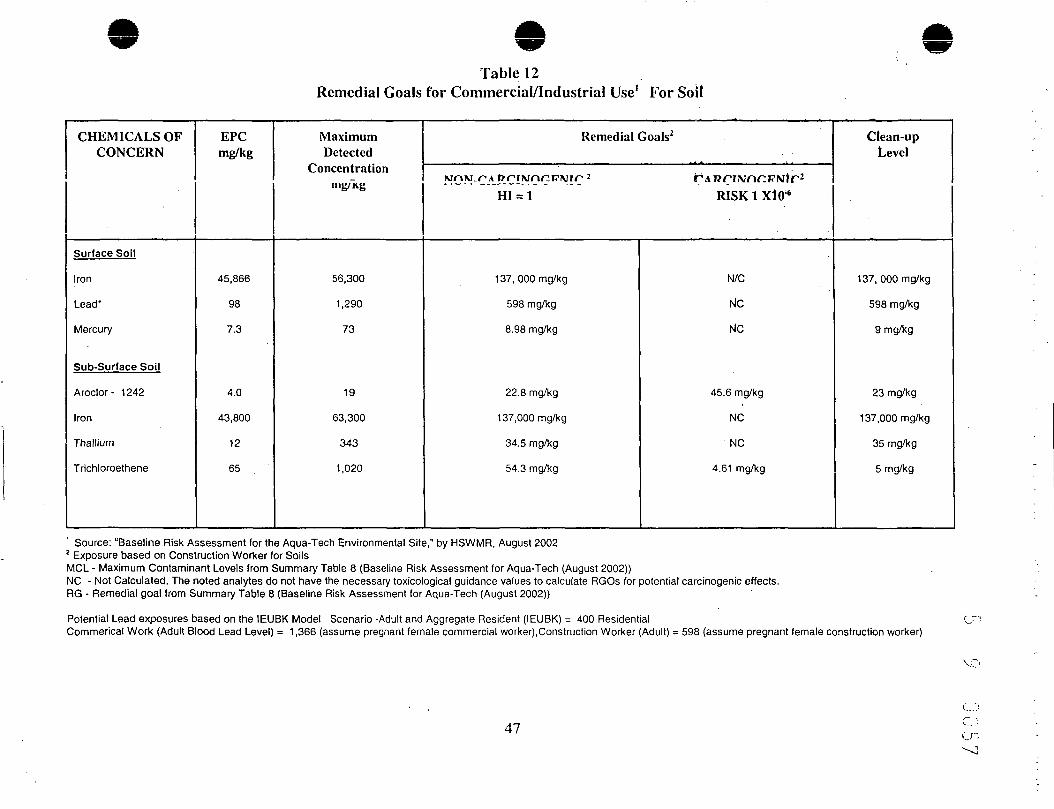
eTable 12
Remedial Goals for Commercial/Industrial Use1 For Soil
CHEMICALS OFCONCERN
Surface Soil
Iron
Lead-
Mercury
Sub-Surface Soil
Aroclor- 1242
Iron
Thallium
Trichloroethene
EPCmg/kg
45,866
98
7.3
4.0
43,800
12
65
MaximumDetected
Concentrationmg/Kg
56,300
1,290
73
19
63,300
343
1,020
Remedial Goals2
wnvLr'A urrwrir irNir1 2
HI = 1
137, 000 mg/kg
598 mg/kg
8.98 mg/kg
22.8 mg/kg
137,000 mg/kg
34.5 mg/kg
54.3 mg/kg
r A Rrwnr^Ntr2
RISK 1 XlO*
N/C
NC
NC
45.6 mg/kg
NC
NC
4.61 mg/kg
Clean-upLevel
137, 000 mg/kg
598 mg/kg
9 mg/kg
23 mg/kg
137,000 mg/kg
35 mg/kg
5 mg/kg
' Source: "Baseline Risk Assessment for the Aqua-Tech Environmental Site," by HSWMR, August 20022 Exposure based on Construction Worker for SoilsMCL - Maximum Contaminant Levels from Summary Table 8 (Baseline Risk Assessment for Aqua-Tech (August 2002))NC - Not Calculated. The noted analytes do not have the necessary lexicological guidance values to calculate RGOs for potential carcinogenic effects.RG - Remedial goal from Summary Table 8 (Baseline Risk Assessment for Aqua-Tech (August 2002))
Potential Lead exposures based on the IEUBK Model Scenario -Adult and Aggregate Resident (IEUBK) = 400 ResidentialCommerical Work (Adult Blood Lead Level) = 1,366 (assume pregnant female commercial worker),Construction Worker (Adult) = 598 (assume pregnant female construction worker)
47
o 0 0 5 8
COCs for groundwater will still include all parameters that exceed MCLs. However, if theexceedenct occurs in groundwater beneath the landfill cover, achievement of the MCL will notbe requirec. at that location. Table 13 identifies COCs and RGs applicable to groundwater forresidential use and exposures. COCs for groundwater identified in the BRA and whether theyremain a C DC are based on the following:
i) if the maximum concentrations detected for a specific analyte are less than MCLs andRGOj., the analyte will not be considered a COC for the purposes of the FS (Note: whereno detections were reported for an analyte but the detection limit exceeded the MCL or RG,the analyte shall be retained as a potential COC for monitoring);
ii) if the maximum concentration for an analyte exceeded the RG but is less than the MCL, theanalyle shall be retained as a potential COC for monitoring;
iii) if the only reported MCL exceedences occurred in monitoring wells within the footprint ofthe landfill (future cover), the analyte shall be retained as a COC for monitoring;
iv) if the MCL is exceeded in monitoring wells outside the footprint of the landfill, the analyteshall remain as a COC and be targeted for remediation (discrete, isolated or incidentalexceedences or exceedences consistent with naturally occurring background may not requireremeciation but will be retained as potential COCs for monitoring).
48
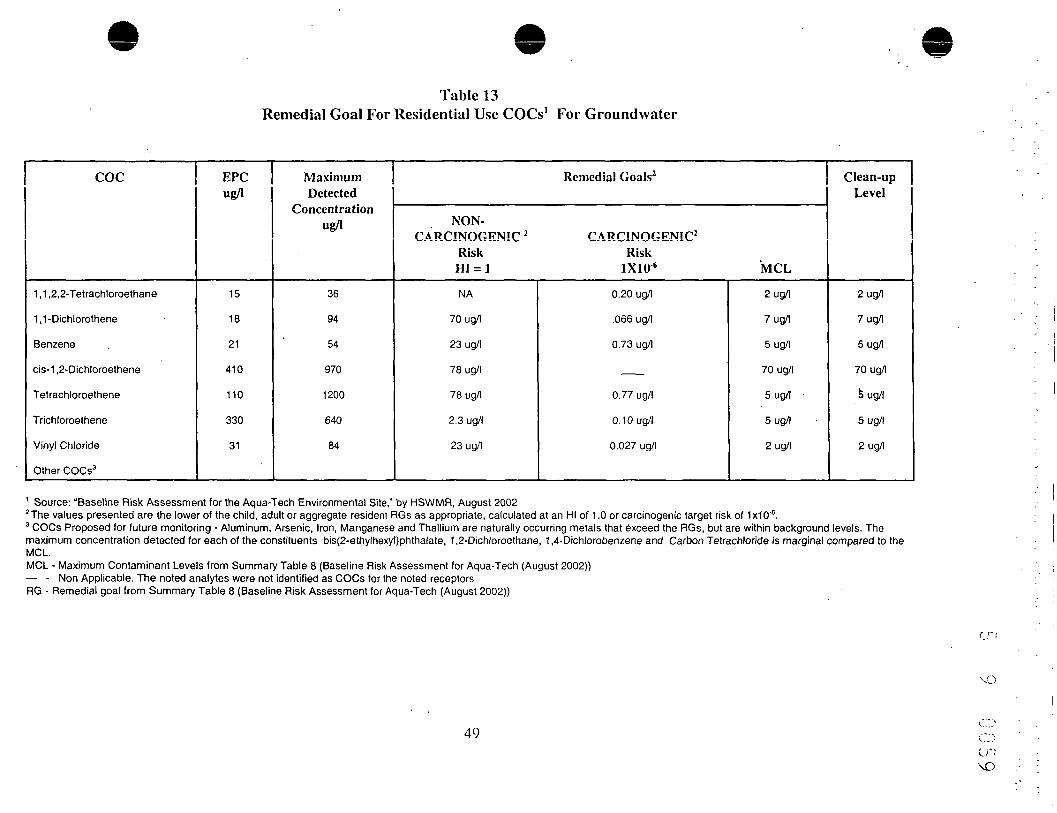
eTable 13
Remedial Goal For Residential Use COCs1 For Groundwater
coc
1,1 ,2,2-Tetrachloroethane
1,1-Dichlorothene
Benzene
cis-1 ,2-Dichloroethene
Tetrachloroethene
Trichloroethene
Vinyl Chloride
Other COCs3
EPCug/1
15
18
21
410
110
330
31
MaximumDetected
Concentrationug/1
36
94
54
970
1200
640
84
Remedial Goals2
NON-CARCINOGENIC 1 CARCINOGENIC2
Risk RiskHI = 1 1X10 6 MCL
NA
70 ug/1
23 ug/1
78 ug/1
78 ug/1
2.3 ug/1
23 ug/1
0.20 ug/1
.066 ug/1
0.73 ug/1
0.77 ug/1
0.10 ug/1
0.027 ug/1
2 ug/1
7 ug/1
5 ug/1
70 ug/1
5 ug/1
5 ug/1
2 ug/1
Clean-upLevel
2 ug/1
7 ug/1
5 ug/1
70 ug/1
6 ug/1
5 ug/1
2 ug/1
' Source: "Baseline Risk Assessment for the Aqua-Tech Environmental Site," by HSWMR, August 20022 The values presented are the lower of the child, adult or aggregate resident RGs as appropriate, calculated at an HI of 1.0 or carcinogenic target risk of 1x10'".3 COCs Proposed for future monitoring - Aluminum, Arsenic, Iron, Manganese and Thallium are naturally occurring metals that exceed the RGs, but are within background levels. Themaximum concentration detected for each of the constituents bis(2-ethylhexyl)phthalate, 1,2-Dichloroethane, 1,4-Dichlorobenzene and Carbon Tetrachloride is marginal compared to theMCL.MCL - Maximum Contaminant Levels from Summary Table 8 (Baseline Risk Assessment for Aqua-Tech (August 2002))— - Non Applicable. The noted analytes were not identified as COCs for the noted receptorsRG - Remedial goal from Summary Table 8 (Baseline Risk Assessment for Aqua-Tech (August 2002))
49

0 0 6 0
G.1.7 Uncertainties
There are uncertainties which are inherent in the risk assessment process. The factors which maylead to either an overestimation or an underestimation of the potential adverse human healtheffects and associated environmental risks posed by exposures to analytes at the Aqua-Tech Site,depending on the relationship of actual conditions to the assumptions employed in thecalculation!, include the following:
• the analytical data presented here may not reflect actual Site conditions for all analytes atthe prjsent time. Data have been collected during several years of the Aqua-Tech Siteinvest .gation. However, concentrations in other areas are not expected to be higher than thevalues presented here because activities have ceased, and no new sources have been added.It is expected that the concentrations may actually overestimate the true exposure conditionsnow and in the future due to processes such as biodegradation and dilution which haveoccuned since the most recent sampling;
• Based on the estimated area of the former landfill and the average thickness of wastemateri al, the estimated volume of waste in the former landfill area is approximately 320,000cubic yards. This calculation likely overestimates the volume of municipal waste in thelandfi.l since it is based on borings through deeper portions of the landfill and does notaccoint for volume losses from side slopes around the perimeter of the landfill;
• assumptions regarding, for example, body weight, average human lifetime, and other factorswere based on reasonable estimates from available sources and may not be accurate forspecific individuals whose characteristics may vary from the conservative general conditionswhich were assumed. However, standard assumptions were employed in those cases wherethey were available and professional judgment was applied elsewhere;
• uncertainties associated with the assumptions have been made regarding the future land useand groundwater use at the Aqua-Tech Site; This may under or overestimate the risks;
• factors which affect the disposition of absorbed Site contaminants, such as metabolism,distribution, bioconcentration and excretion, were not explicitly considered in detail in theintake and risk calculations. Rather, reasonable and conservative assumptions wereemployed which are unlikely to underestimate the true exposure conditions. Correctionsregarding route-of-exposure were made to reflect such conditions;
• the mechanism of action for toxicity of the Site contaminants is not taken into account, andis not known with certainty in many cases, particularly regarding their putative carcinogeniceffects. The rather specific nature of the carcinogenic effects in animal studies suggests thatany extrapolation to humans will be heavily dependent on the assumption of equivalentresponse in man, an assumption which often is not supported by the epidemiological data.Extrapolation of dose-response curves from high to low dose, from animals to humans andfrom one exposure route to another introduce uncertainty, albeit in ways which are intendedto be conservative, at each step in the calculated results. This uncertainty is reflected in therecen: reevaluation of U.S. EPA approaches to carcinogen assessment (U.S. EPA,1996b).The use in this; document of established Unit Cancer Risk values (i.e., Carcinogenic Slope
50

f>
5 9 00 ••Factors) which have been calculated by conservative methods (e.g., the linearized multistagemodel) is unlikely to underestimate the true risk and may overestimate it by a margin whichis not quantifiable at present; and,
• consi stent with standard risk assessment practice, the U.S. EPA Reference Doses (RfDs)and Carcinogenic Slope Factors (CSFs) were used to reflect toxicity endpoints of interest;and, the intake and risk calculations assume that the exposure conditions can be representedby a deterministic approach which views each variable separately and may result ininappropriate targets because conservative assumptions are "layered" on top of one another.Probe bilistic methods are available for such evaluations, but were not employed in this stageof the risk assessment activities.
The assumptions and scenarios used in the BRA are inherently conservative and are not likely tounderestirr ate any potential risk associated with this Site.
G.2 Ecological Risk Assessment Summary
The ecological risk assessment performed for the Site followed the process described in"Ecological Risk Assessment Guidance for Superfund: Process for Designing and ConductingEcological Risk Assessment," (USEPA, 1997). The guidance document describes an iterativescreening and assessment process. The results of the third iterative stage or "Step 3-ProblemFormulaticn" led to the following conclusions:
• available data are sufficient to conclude that Site-related compounds reported in soil,sediment and surface water do not pose significant ecological risk. A single compound,manganese, was detected in surface water at a maximum concentration (5,700 ug/L in1998; 2,600 ug/L in 1999) and mean concentration (1,093 ug/L), both of which exceededthe benchmark of 120 ug/L for manganese. However, this risk is largely due to theapplication of total manganese concentrations to an extremely conservative benchmark,wh.ch is based on the dissolved metal concentrations. The limited potential for risk toaquatic life is supported by the sediment data. Although the maximum concentration ofmanganese exceeded the sediment benchmark of 819 mg/kg in 1998, the maximumconcentration in 1999 (same location as the maximum in 1998) and overall meanconcentration were below this benchmark.
• several naturally occurring metals were found in sediments. However, analysesperibrmed provide strong evidence that the metal concentrations detected in sediments,as well as soils, reflect naturally-occurring concentrations. Accordingly, the potential forsignificant ecological risk due to Site-specific constituents is minimal.
The maximum concentrations of several metals in soils exceeded their conservative screeningbenchmarks, indicating the potential for unacceptable ecological risk. However, only copper andmanganese slightly exceeded the threshold for unacceptable risk. To verify that metals in soilsdid not pose risk, an alternative statistical evaluation of metals was conducted. The evaluation,which was based on statistical correlation methods, demonstrated that the concentrations ofmetals in cm-Site soils are indicative of naturally occurring concentrations and relationshipsamong metals. Furthermore, the relationships are similar for both on-Site and background soils,
51

9
indicating that the apparent elevation of metals (i.e., exceedance of screening benchmarks) cannotbe attributed to Site-related activities. Based on the weight-of-evidence from the two independentevaluation? (traditional screening assessment and correlation analysis), it can be concluded thatthe concen rations of metals in on-Site soils do not pose unacceptable ecological risk.
G.3 Basis for Action
The response action selected in this Record of Decision is necessary to protect public health orwelfare or tie environment from actual or threaten releases of pollutants or contaminants fromthe Site which may present and imminent and substantial endangerment to public health orwelfare.
H. REMEDIAL ACTION OBJECTIVES
Remedial Action Objectives (RAOs) for the Aqua-Tech Site were developed from a review ofthe results of the site sampling data, site-specific risk and fate, transport evaluations, and reviewof ARARs Operations conducted at the Site resulted in contamination of air, surface soils,subsurface >oils and groundwater. The key COCs at the site include VOCs and metals. The clean-up levels were derived predominantly from the human health baseline risk assessment, with somecoming fro:Ti ARARs. At the Site, the potential cancer and non-cancer risks to potential futurecommercia , construction and irrigation workers and potential future residents exceeded thelxlO"6and HQ=1 screening levels. The residential scenario was included for completeness of theBRA, although the future residential use of the Site and its environs is currently prohibited by azoning ord nance related to the proximity of the Site to the Greenville-Spartanburg Airport.Therefore, clean-up levels for all media of concern at the Site, excluding groundwater are basedon future commercial/industrial use. Clean-up levels for groundwater are based on futureresidential use since SCDHEC classifies the shallow groundwater beneath the Site as a potentialsource of drinking v/ater. Under the NCP, EPA's goal is to reduce the excess cancer risk to therange of 1> 10~4 to 1x10 "6. For this Site, EPA is choosing the clean-up levels of 1x10 "6 forcarcinogenic compounds and a HQ of 1 for most non-carcinogenic compounds based on thehuman health risk assessment and ARARs.
In summary, the RAOs for Site are to protect human health and the environment from exposureto contaminated air, soil, groundwater, and to restore the groundwater to a potential beneficial useas a drinkin g water source. The selected remedy meets these RAOs through treatment of soil andgroundwater contaminated with VOCs. The RAOs also serve to facilitate the five-year reviewdetermination of protectiveness of human health and the environment. The RAOs for Site arelisted below:
i) to prevent or mitigate to the maximum extent practicable, direct human exposure to Sitesoils and/or the contents of the closed MSWL containing contaminants in excess of thepotentially applicable ARARs (presented in Table 18) for the protection of human health;
ii) to prevent exposure of human receptors to contaminated groundwater containingcontaminant levels above State and Federal maximum contaminant levels (MCLs)established under the Safe Drinking Water Act;
iii) to restore contaminated groundwater located outside the closed MSWL to the maximum
52

0 0 6 3
extent practicable for future use consistent with the anticipated land use and potentiallyapplicable ARARs (presented in Table 18) within a reasonable time frame;
iv) to control migration of contaminants from the Site to surface water by eliminating contactof stormwater runoff with landfill contents and contaminated surface soil; and
v) to monitor the groundwater andsoiJ in a manner to verify the effectiveness of the remedialactions.
I. DESCRIPriON OF ALTERNATIVES
The objective of this section is to provide a brief explanation of the remedial alternativesdeveloped "or the Site. A description of each alternative is presented below.
I.I Description of Remedy Components
The following alternatives are grouped into three categories which include soil/groundwateralternatives, soil alternatives, and groundwater alternatives. Remedial alternatives for the Siteare presented in the following summary table. Routine groundwater monitoring wil l be acomponent of any remedy selected with the exception of the "No Action" alternative. Costs formonitoring required over and above the routine monitoring (such as would be required forMonitored Natural Attenuation or Chemical Injection) are included in the appropriate alternative.Alternatives G3 and G4 for groundwater treatment, are evaluated as independent alternatives.However, r: is anticipated that they would be combined with one of soil alternatives to addressall impacted media at the Site.
53

006 4Summary of Alternatives
Medium
Soil/Groundwater
Soil S3
Groundwater
FS Designation
S1/G1S2/G2
SiteS3AS3BS3CS4
G3G4
Description
No ActionInstitutional Controls
CappingRCRA Subtitle D CoverRCRA Subtitle C CoverMixed Cover/Cap
Site Capping and In-Situ Soil Treatment
Chemical InjectionMonitored Natural Attenuation
Cost
$ 62,000$ 810,000
$ 1,649,000$ 5,202,000$ 2,842,000$ 3,355,000
$ 508,000$ 340,000
1.1.1 Soil Alternatives and Groundwater Alternatives
Alternative S1/GI - No Action
Estimated Capital Cost:$0Estimated Annual Operation and Maintenance (O&M) Cost: $5,000Estimated Present Worth Cost:$62,000Estimated Time To Completion: NoneSatisfaction of Remedial Action Objectives: No
The No Act: on alternative is considered a baseline against which other alternatives are compared.With the No Action alternative, no remedial actions will be performed to actively reducemobility, to:ucity, or volume of the chemicals of concern found in the groundwater and associated-soil. Under this alternative, no changes would be made to existing site conditions or exposurescenarios. This alternative relies on natural attenuation and degradation and leaching for thereduction o::the chemicals of concern in the Site soils and groundwater.
Alternative S2/G2 - Institutional Controls and Monitoring
Estimated Capital Cost: $100,000Estimated Annual O&M Cost: $57,000Estimated Present Worth Cost:$810,000Estimated Time To Completion: s 2 yearsSatisfaction af Remedial Action Objectives: Some
Institutional controls would limit the exposure pathways to soils and groundwater potentiallycontaining contaminants of concern. Institutional controls may involve deed restrictions, wellpermitting requirements, zoning controls and access restrictions, and would mitigate the potential
54

0 0 6 5
risk to hurr.an health by restricting the potential exposure pathways. Use of the deed restrictioninvolves placing a notation on the property deed which makes the current and any prospectiveproperty owner aware of the property's history and restricted land uses. The deed restriction mayfurther place a limitation on future development and/or groundwater use. This would prevent ormitigate the potential of exposure to on-site contaminated soil or groundwater. Zoning controlscould be used to restrict land development or groundwater withdrawals by potential groundwaterusers. Currently, the Site is zoned commercial/industrial. In addition, the Site is located withinthe "Airpoit Environs Area" as defined by the Greenville- Spartanburg Airport Environs Areazoning ordinance, dated March 29, 1996. This zoning ordinance precludes residentialdevelopment and use of the Site. Access restrictions, such as the existing chain link fencesurroundin g the Site, can be used to limit human exposure to media at the Site which potentiallycontains contaminants of concern. However, it is anticipated that access restrictions may not berequired following implementation of final remedial actions.
Groundwaler monitoring would be performed using the existing well network supplemented bya minimum of two new wells. Results of the monitoring program will be used to evaluate themovement of Site related chemicals of concern in the groundwater. A monitoring plan would bedeveloped \o establish the procedures and protocols for groundwater sampling and analysis. Theanalytical c ata would be used to evaluate the migration of contaminants of concern from the Siteand also to monitor background groundwater quality. Although groundwater monitoring wouldnot reduce the present risk levels, it would provide the following:
• an early warning for the migration of contaminants from the Site; and,• a better understanding and evaluation of the natural attenuation mechanisms in effect.
1.1.2 Soil Alternatives
Alternative - S3 - Site Capping
Under this remedial alternative, a cover designed in accordance with Subpart F- Closure andPost-Closure Care, (258.60: Closure Criteria), Chapter 61 of the South Carolina Code (June 23,1995), and 40 CFR 264, would be constructed over the MSWL to isolate the waste and to reduceinfiltration and erosion. The Subpart F cover serves to prevent surface exposure to theenvironment, and to reduce or minimize infiltration. In developing these remedial alternativesfor covering soil and municipal solid waste (MSW) at the Site, the locations of MSW andchlorinated compounds were considered. This Alternative S3 considers the implementation ofa Subpart F, paragraph (a) RCRA soil cover and a multi-layer lined RCRA cover, and developsthe option of combining lined and unlined cover systems. The alternatives for covering the wasteare organized into three basic options: S3A RCRA Subtitle D Soil Cover; S3B-RCRA SubtitleC Cover, aid; S3C Combination Cover.
Typical crc ss-sections for RCRA Subtitle C and D covers are illustrated on Figure 36.
55

I—,'-.'
Alternative - S3A - RCRA Subtitle D Cover
Estimated Capital Cost: $1,319,000Estimated Annual O&M Cost: $22,000Estimated Present Worth Cost:$ 1,649,000Estimated Time To Completion: 18 monthsSatisfaction of Remedial Action Objectives: Moderate
Paragraph i a) of RCRA Subpart F defines Subtitle D cover requirements for closure of an inertpre-RCRA MSWL. The cover consists of an infiltration layer that reduces infiltration throughthe placement of a minimum 10"5 cm/second permeability layer of earthen fill material, and anerosion lajer that supports vegetative cover and protects the infiltration layer. In generalaccordance with Subpart F, the infiltration layer is a minimum of 18 inches earthen material, andthe erosion layer has a minimum thickness of one foot. There are no specific requirements fordrainage slopes, although cover design must account for long-term erosion potential, and facilitatelong-term maintenance.
Installation of a protective cover would consist of the following basic steps in sequence asidentified i i the Remedial Construction Plan:
• Establish entrance and egress points to maintain Site access control;• Set up Site construction trailer(s), including power hookups and phone lines;• Establish Site procedures in accordance with Site Health and Safety Plan;• Import local sources of suitable infiltration layer material and vegetation layer materials;
and,• Conduct log;ical sequence of cover construction, consisting of clearing, grubbing, minor
contouring, cover placement, compaction and testing, seeding and initial vegetation coverestablishment.
It is anticipated that between 20,000 and 30,000 cubic yards of infiltration material will berequired to cover the entire Site, and an additional 7,000 to 10,000 cubic yards of vegetative soilwill be needed to protect the infiltration layer. These volumes assume existing cover material isunsuitable for the final cover. The depth and adequacy of the existing cover will be confirmedduring the Remedial Design (RD) Stage. In areas of the cover where slopes are greater thenapproximately 1:4, a vegetation mat would be used to support initial vegetation cover.
Alternative - S3B - RCRA Subtitle C Cover
Estimated Capital Cost: $4,448,000Estimated Annual O&M Cost: $57,500Estimated Present Worth Cost:$5,202,000Estimated Time To Completion: 18 monthsSatisfaction of Remedial Action Objectives: Moderate
56
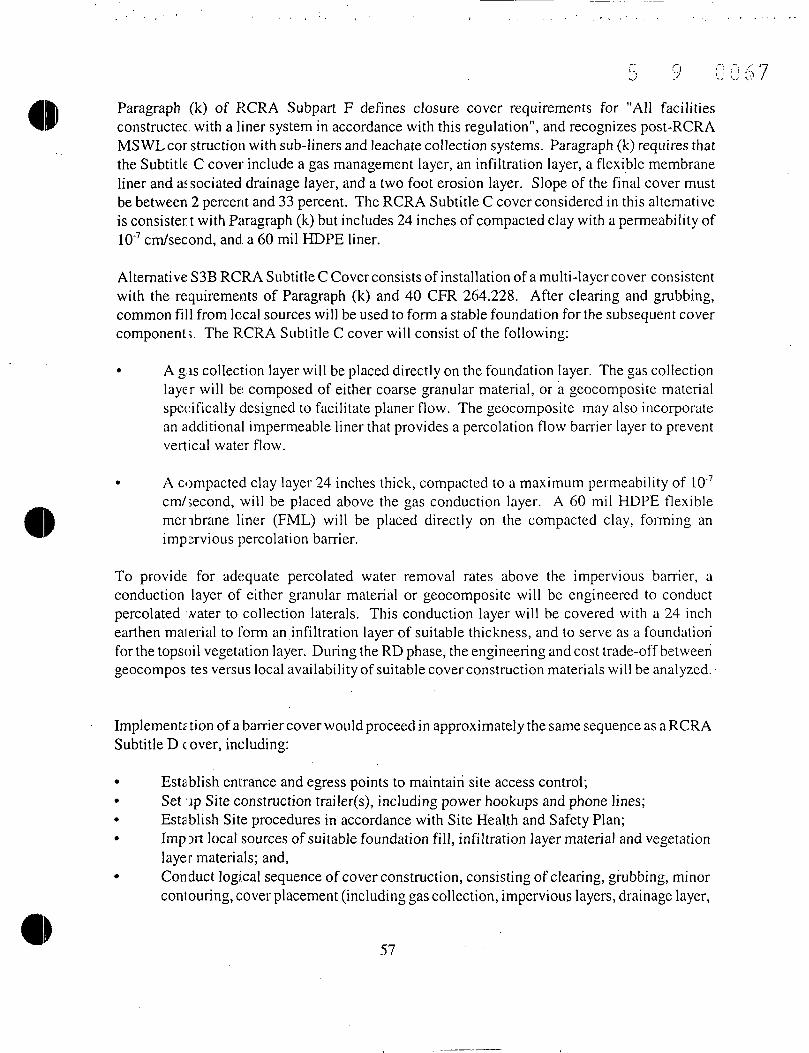
D 6 7
<t Paragraph (k) of RCRA Subpart F defines closure cover requirements for "All facilitiesconstructec. with a liner system in accordance with this regulation", and recognizes post-RCRAMSWLcor struction with sub-liners and leachate collection systems. Paragraph (k) requires thatthe Subtitle C cover include a gas management layer, an infiltration layer, a flexible membraneliner and as sociated drainage layer, and a two foot erosion layer. Slope of the final cover mustbe between 2 percent and 33 percent. The RCRA Subtitle C cover considered in this alternativeis consister t with Paragraph (k) but includes 24 inches of compacted clay with a permeability of10"7 cm/second, and. a 60 mil HDPE liner.
Alternative S3B RCRA Subtitle C Cover consists of installation of a multi-layer cover consistentwith the requirements of Paragraph (k) and 40 CFR 264.228. After clearing and grubbing,common fill from local sources will be used to form a stable foundation for the subsequent covercomponent;. The RCRA Subtitle C cover will consist of the following:
• A g is collection layer will be placed directly on the foundation layer. The gas collectionlayer will be composed of either coarse granular material, or a geocomposite materialspecifically designed to facilitate planer flow. The geocomposite may also incorporatean additional impermeable liner that provides a percolation flow barrier layer to preventvertical water flow.
• A compacted clay layer 24 inches thick, compacted to a maximum permeability of 10"7
cm/second, will be placed above the gas conduction layer. A 60 mil HDPE flexiblemembrane liner (FML) will be placed directly on the compacted clay, forming animpervious percolation barrier.
To provide for adequate percolated water removal rates above the impervious barrier, aconduction layer of either granular material or geocomposite will be engineered to conductpercolated water to collection laterals. This conduction layer will be covered with a 24 inchearthen malerial to form an infiltration layer of suitable thickness, and to serve as a foundationfor the topsoil vegetation layer. During the RD phase, the engineering and cost trade-off betweengeocomposites versus local availability of suitable cover construction materials will be analyzed.
Implementation of a barrier cover would proceed in approximately the same sequence as a RCRASubtitle D c over, including:
• Establish entrance and egress points to maintain site access control;• Set ip Site construction trailer(s), including power hookups and phone lines;• Establish Site procedures in accordance with Site Health and Safety Plan;• Import local sources of suitable foundation fill , infiltration layer material and vegetation
layer materials; and,• Conduct logical sequence of cover construction, consisting of clearing, grubbing, minor
contouring, cover placement (including gas collection, impervious layers, drainage layer,
57

68
and toe drain collection system), compaction and testing, seeding and initial vegetationcover establishment.
The integrity of the impermeable layers in the barrier cover will be monitored and controlledduring construction through implementation of a Construction Quality Assurance Plan, andproper technical documentation in accordance with specifications in the RD.
Alternative - S3C - Combination Cover
Estimated Capital Cost: $2,346,000Estimated Annual O&M Cost: $40,000Estimated Present Worth Cost:$2,842,000Estimated Time To Completion: 18 monthsSatisfaction of Remedial Action Objectives: Moderate
This alternz live consists of utilizing an impermeable liner with associated gas and drainage layersin areas of i he Site where halting all infiltration is desirable regardless of the impact on currentactive reductive dechlorination processes consistent with the approach described in AlternativeS3B. Othe:: areas of the Site would be covered in accordance with Paragraph (a) of Subpart F,consistent v / i th the approach described in Alternative S3A. Alternative S3C is designed to allowimpermeable capping of areas of the Site that have been shown to have elevated chlorinatedethenes in soil, MSW, or groundwater, while using soil cover for areas of the Site that presentlittle or no potential groundwater impact threat.
Alternative - 54 - Site Cover with In Situ Soil Treatment
Estimated Capital Cost: $2,736,000Estimated Annual O&M Cost:$40,000(landfill cap)+$30,000(In Situ Soil Treatment System)Estimated Present Worth Cost:$3,355,000Estimated Time To Completion: 18 months for cover, 5 years for Soil Vapor Extraction (SVE)Satisfaction of Remedial Action Objectives: High (Primarily soil)
This alternative combines isolation of soil and MSW through construction of a soil or RCRASubtitle C c over, with a mechanical Soil Vapor Extraction (SVE) system to aggressively pursuethe remova of chlorinated compounds in soils above the MSW in the former Process DistillationArea at the Site. It is anticipated that the SVE collection network would replace the layer forpassive ga:; collection. This alternative offers the advantage of physical removal of thechlorinated compounds and therefore is preferred over remedies that only isolate or cover volatilecontaminants in the soil. In areas of the Site where it is unlikely that short-circuiting of airflowwill occur, horizontal soil vapor collection lines would be trenched into the soil above the MSWdeposits using a vibratory trencher. No excavation or soil removal would be used in theinstallation of these laterals.
58

0 0 6 9
If SVE is combined with Alternative S3A - RCRA Subtitle D Soil Cover, then it may be desirableto install a lower permeability clay layer (i.e.: JO"6 or 10~7 cm/second) and also to install adrainage layer above the clay to prevent excess water accumulation in the treatment system. Ifa geocomposite drainage layer is used in the final RD, then a FML can be incorporated into thegeocomposite and ensure optimum SVE conditions.
Potential subsidence of waste as a result of composting of wood debris in the MSW could causeproblems ir cover integrity, particularly in the geosynthetics and flexible membrane liner. Twosolutions are 1) to measure small temperature increases resulting from the in situ oxidationprocess; and 2) to periodically survey inert points on the barrier cover placed throughout the wastecover that penetrate to the surface providing surface detection of interior layer movement.
1.1.3 Groundwater Alternatives
Alternative - G3 - Chemical Injection
Estimated Capital Cost: $508,000Estimated Annual O&M Cost: $0Estimated Present Worth Cost:$508,000Estimated Time to Completion: 3-5 yearsSatisfaction of Remedial Action Objectives: High (Primarily Groundwater)
Chemical injection involves thoroughly permeating contaminated zones with a chemical oxidantorreductan: (potassium permanganate, sodium lactate, hydrogen peroxide, ozone, etc.) to induceoxidation-rsduction (redox) reactions resulting in the complete destruction of COCs. Theinjectant can be placed as a slurry or as a reactive barrier wall.
Chemical oxidants such as potassium permanganate and sodium persulfate are rapid andaggressive, and insensitive to chemical contaminant characteristics and concentrations. Theydirectly oxidize petroleum products or chlorinated solvents, producing carbon dioxide as abyproduct. Many groundwater contaminants can also be treated through enhancement ofanaerobic biological reductive degradation (biodegradation). When natural degradation of thesecompounds is limited by an inadequate source of food (electron donors), introducing a foodsource into the subsurface can enhance the natural processes and keep the plume from starving.One of the most effective and environmentally benign food sources are volatile fatty acids. Ofthese, lactic acid or inorganic lactate salts are prevalent in the food and cosmetic industry and are,therefore, r;adily available and fairly inexpensive.
For effective treatment to take place, a sufficient mass of chemical must be injected to react withboth the contaminants and background sinks or interferences, and the injectant must reach themajority of the contaminant mass. The main limitation on treatment effectiveness at the Site willbe the low permeability of the soils. The chemical application method can be modified as neededto utilize hydraulic fracturing and liquid atomized injection to improve delivery to the subsurface.Hydraulic fracturing improves the rate of delivery, and liquid atomized injection improves the
59

5 9 Q C 7 0
uniformity of the injection. Hydraulic fracturing involves the injection of fluids at pressures thatexceed the combined lithostatic pressure (weight of soil column) and cohesive strength of the soil.With hydraulic fracturing, the formation is temporarily "lifted." This increases the permeabilitysubstantially and allows "soiids, liquidsor 'gases to be injected at a higher rate than withoutfracturing. If long term permeability enhancement is desired, coarse sand can also be co-injectedto leave the porespaces open after the fracturing is completed. Liquid atomized injection involvesthe injection of significant quantities of air along with a solid or liquid. The injected air atomizesthe Jiquid-fo create a mist, or-with soJids increases the velocity. Liquid atomized injectionpromotes uniform distribution of the injected materials, and is often used in combination withhydraulic fracturing so that the materials will be dispersed away from the hydraulic fractures. Theuse of hydraulic (or pneumatic) fracturing can be used for injection within the unsaturated zone.
Alternative -O4 -TflonilorEd Natural Attenuation
Estimated C apital Cost: $40,000Estimated Annual O&M Cost: $60,000 (for 5 years)Estimated Present Worth Cost:$340,000Estimated lime to Completion: 15 - 30 yearsSatisfaction of Remedial Action Objectives: Long-Term
Monitored Natural Attenuation is the monitored use of the natural processes of intrinsicbioremedietion, advection, dispersion, and sorption to remove contaminants from groundwater.It requires c. structured program of groundwater monitoring of biological and chemical parametersto determine that the transformation processes are taking place at a rate that is protective ofhuman health and the environment, and that the processes will continue at an acceptable rate foran extended period of time. Because engineering controls are not used to control plumemigration, it is necessary to ensure that natural attenuation is appropriate to address allcontaminants of concern in the groundwater.
The majori ty of source material for the detected VOCs was removed during the removal activitiesperformed in 1992, as evidenced by the Site-wide drop in total VOC concentrations ingroundwater. The landfill area does not appear to be a significant source of VOCs, and freeproduct do JS not appear to be present at the Site. The extent of the contaminant plume appearsto be stable and is not migrating. The use of natural attenuation does not rely upon cross-mediatransfer of contaminants (i.e., sorption), and would be protective of human health and theenvironmeit.
The rate of attenuation at each monitoring well location varies suggesting that bioattenuation ratesare not sufficient to utilize natural attenuation as the sole remedial action Site-wide. Historicalgroundwater sampling data suggests that the landfill serves as a significant carbon source fornatural attenuation. As a result, placement of a low-permeability cap over the old municipallandfill, effecting a reduction in leachate production, could potentially initiate renewed migrationof the contaminant plume after the rate of bioattenuation decreases due to reduction of the carbonsource. Us2 of natural attenuation will be a long-term application, because of the present inability
•60

0 0 7 1
to reduce concentrations (reduction rate lower than source contribution) of all contaminants inall areas.
1.2 Co mmon Elements and Distinguishing Features of Each Alternative
Alternative 1 for-each of the media (soil and groundwater) is the No Action alternative. Thisalternative includes the 5-year review which would be required if this alternative is chosen.
Alternative 2 for each of the media is Institutional Controls with monitoring for groundwater. Themonitoring would be conducted annually, in addition to a 5-Year Review.
Alternatives 3 A, 3B, 3Cand4 for soil include the common element of capping. The type of capvaries between the afternatives, but the clean-up levels are the same. All of the alternatives wouldrequire selecting the groundwater alternative G3 (Chemical Injection) in order to ful ly complywith ARAUs.
J. SUMMAFlY OF COMPARATIVE ANALYSIS OF ALTERNATIVES
In this sect: on, each alternative is evaluated using the nine evaluation criteria required in Section300.430(0,5)(i) of the NCP. Table 14 located at the end of section J.3.2, provides a summary ofthe information that follows.
J.I Th reshold Criteria
J.I.I Overall Protection of Human Health and the Environment
Overall protection of human health and the environment addresses whether each alternativeprovides adequate protection of human health and the environment and describes how risksposed through each exposure pathway are eliminated, reduced, or controlled, through treatment,engineering controls, and/or institutional controls.
Alternative S1/G1 - No Action does not change the current or potential future risks to humanhealth or the environment identified in the RI, BRA or ERA. All 4 remaining Alternativesprovide varying degrees of protection.
Alternative S2/G2 - Institutional Controls will provide protection for specific future humanexposure scenarios identified at the Site.
Alternativs S3 - Site capping will address various direct exposure risks identified in the RI, BRAand ERA. No individual Alternative is completely protective of human health and theenvironment relative to all media. Alternatives S2 and S4 collectively address risks representedby contaminated soil at the Site. Alternatives G2 and G3 address current and potential futurerisks associated with groundwater.
61
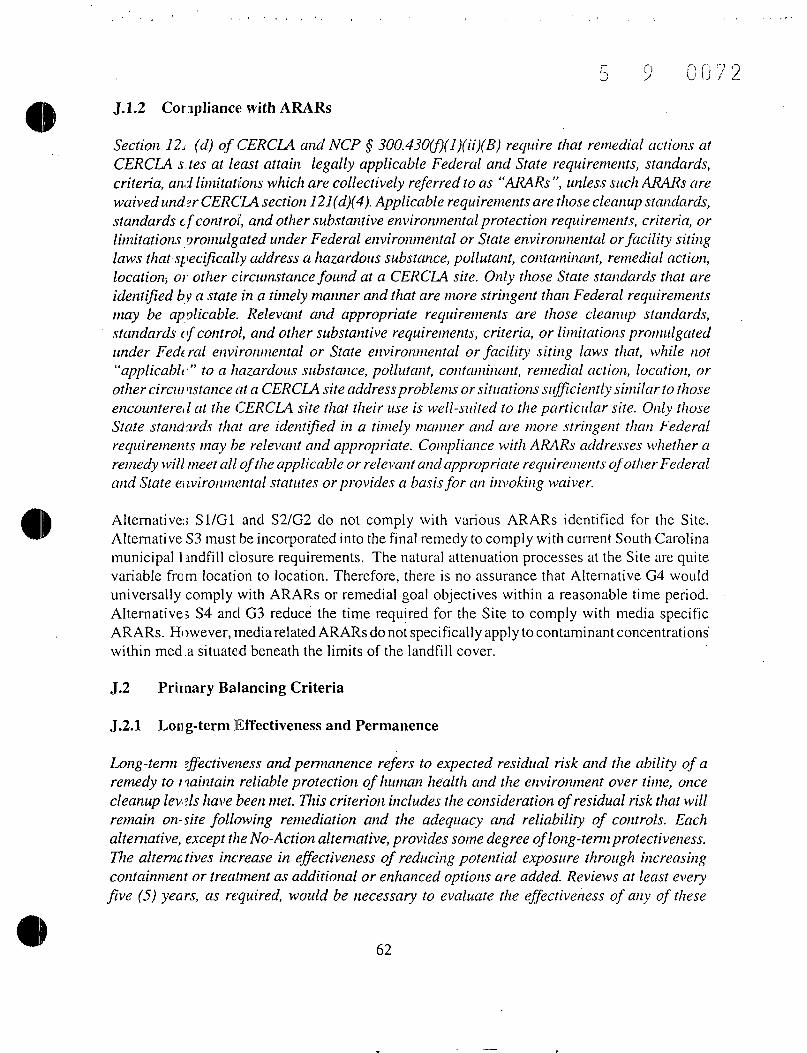
5 9 0 0 7 2J.1.2 Compliance with ARARs
Section 12/ (d) of CERCLA and NCP § 300.430(f)(l)(ii)(B) require that remedial actions atCERCLA s.tes at least attain legally applicable Federal and State requirements, standards,criteria, and limitations which are collectively referred to as "ARARs ", unless such ARARs arewaivedund?r CERCLA section 121(d)(4). Applicable requirements are those cleanup standards,standards cf control, and other substantive environmental protection requirements, criteria, orlimitations promulgated under Federal environmental or State environmental or facility sitinglaws that specifically address a hazardous substance, pollutant, contaminant, remedial action,location, or other circumstance found at a CERCLA site. Only those State standards that areidentified by a state in a timely manner and that are more stringent than Federal requirementsmay be applicable. Relevant and appropriate requirements are those cleanup standards,standards of control, and other substantive requirements, criteria, or limitations promulgatedunder Federal environmental or State environmental or facility siting laws that, while not"applicable" to a hazardous substance, pollutant, contaminant, remedial action, location, orother circumstance at a CERCLA site address problems or situations sufficiently similar to thoseencountered at the CERCLA site that their use is well-suited to the particular site. Only thoseState standards that are identified in a timely manner and are more stringent than Federalrequirements may be relevant and appropriate. Compliance with ARARs addresses whether aremedy will meet all of the applicable or relevant and appropriate requirements of other Federaland State environmental statutes or provides a basis for an invoking waiver.
Alternative:; S1/G1 and S2/G2 do not comply with various ARARs identified for the Site.Alternative S3 must be incorporated into the final remedy to comply with current South Carolinamunicipal 1 indfill closure requirements. The natural attenuation processes at the Site are quitevariable from location to location. Therefore, there is no assurance that Alternative G4 woulduniversally comply with ARARs or remedial goal objectives within a reasonable time period.Alternatives S4 and G3 reduce the time required for the Site to comply with media specificARARs. However, media related ARARs do not specifically apply to contaminant concentrationswithin med.a situated beneath the limits of the landfill cover.
J.2 Primary Balancing Criteria
J.2.1 Long-term Effectiveness and Permanence
Long-term effectiveness and pennanence refers to expected residual risk and the ability of aremedy to riaintain reliable protection of human health and the environment over time, oncecleanup levels have been met. Tliis criterion includes the consideration of residual risk that willremain on-site following remediation and the adequacy and reliability of controls. Eachalternative, except the No-Action alternative, provides some degree oflong-tertnprotectiveness.The alternc fives increase in effectiveness of reducing potential exposure through increasingcontainment or treatment as additional or enhanced options are added. Reviews at least everyfive (5) years, as required, would be necessary to evaluate the effectiveness of any of these
62

0 0 7 3jalternative.; because hazardous substances would remain on-site in concentrations above health-based levels.
Alternative S1/G1 does not provide a permanent remedy or actively reduce long-term risks.Institutional Controls provided in Alternative S2/G2 will be effective in mitigating specificlong-term exposure risks provided they are enforced. Failure to enforce Institutional Controlsmay impact the long-term effectiveness and permanence of any Alternative that is chosen.Long-term groundwater monitoring included in Alternative S2 will evaluate the effectiveness ofnatural attenuation mechanisms at the Site if implemented with no other action or will serve tomonitor the long-term effectiveness of any other remedy selected for implementation.
The various Site caps offered under Alternative S3 are equally effective for their intendedpurpose. Alternative S3B is considered the most permanent Alternative due to the thickness ofthe layers and redundancy inherent in the design (i.e. if the synthetic liner fails the clay barrier stillrestricts inl'iltration). The effectiveness and permanence of each Alternative is dependent onlong-term maintenance of the surface.
Combined Alternatives S4 and G3 provide the greatest level of permanence and long-termeffectiveness through the permanent reduction in contaminant mass in soil (Alternative S4) andgroundwater (Alternative G3). It is anticipated the implementation of both Alternatives wil l becomplete within 5 years. However, the short duration of the implementation results in apermanent and long-term reduction of risk at the Site.
J.2.2 Reduction of Toxicity, Mobility, or Volume through Treatment
Reduction i >f toxicity, mobility, or volume through treatment refers to the anticipated performanceof the treatment technologies that may be included as part of a remedy.
Alternatives S i/G 1, S2/G2 and G4 provide no reduction in toxicity, mobi lity or volume other than'what will :>e reduced by natural attenuation and degradation processes. Although naturalattenuation processes may be effective in reducing some contaminant concentrations, they areunlikely to achieve all chemical specific ARARs in a reasonable time frame.
Alternative S3 will reduce the mobility of certain contaminants by reducing or eliminatinginfiltration of precipitation and thereby reduce the leaching potential of leachable constituents.Alternative S3B provides the greatest level of protection from leaching and would therefore beappropriate for areas where residual contaminant sources remain a direct threat to groundwater.This alternative will not reduce the toxicity or volume of contaminants at the Site. AlternativesS4 and G3 will both reduce contaminant volumes and toxicity. Alternative S4 includes an SVEcomponent that will reduce the concentrations of VOCs in the soil. Alternative G3, ChemicalInjection will treat contaminants in soil and groundwater through chemical degradation and/orby enhancing natural biodegradation mechanisms.
63

0 0 7 4J.2.3 Short-term Effectiveness
Short-term effectiveness addresses the period of time needed to implement the remedy and anyadverse impacts that may be posed to workers, the community, and the environment duringconstruction and operation of the remedy until cleanup goals are achieved.
None of the Alternatives considered pose any substantive incremental increased risks to thecommunit). the workers or the environment in the short-term during implementation.
Alternativ£ S3 involves the risks inherent in moving substantial volumes of clean soil throughportions of the community. However, potential exposure to contaminated media will be limitedand can be controlled through proper design. Alternative S4 retains the risks of Alternative S3plus added potential exposure to VOCs during installation of the SVE system. The exposure toVOCs or potential releases of VOCs during system installation is readily managed throughmonitoring and-engrrieenrig controls.
t
Alternative G3, Chemical Injection, has some inherent incremental risks due to the need to handleand inject chemicals into the subsurface. Potential exposure risks are limited and would befurther mitigated through proper handling of the chemicals and monitoring during injection.
J.2.4 Implementability
Implementtibility addresses the technical and administrative feasibility of a remedy from designthrough construction and operation. Factors such as availability of services and materials,administrative feasibility, and coordination with other governmental entities are also considered.
All 5 Alternatives can be readily implemented and are based on demonstrated technologies.Alternative S3 provides various implementation challenges due to the volumes of materials to beimported to the Site and the presence of steep side slopes around the southeastern and southernlimits of th MSWL. The construction challenges will be addressed during the RD stage.
J.2.5 Cost
Includes estimated capital and annual operations and maintenance costs, as well as presentworth cost. Present worth cost is the total cost of an alternative over time in terms of today'sdollar valu?. Cost estimates are expected to be accurate within a range of+50 to -30percent.
The estimated costs for the remedial alternatives range from $62,000 (No Action) to $5,202,000(RCRA Subtitle C Cap).
Each Alternative is focused on a different target or media and therefore a direct comparison ofcosts between major Alternative groups is not appropriate.
64

0 7 5
Cost compj risons between capping options under Alternative S3 are appropriate with the cappingestimates ranging from $1,592,000 for a RCRA Subtitle D soil cover to $5,202,000 for a RCRASubtitle C cover. As noted, the RCRA Subtitle C cap costs over 3 times more than the standardsoil cover £.nd therefore should only be considered in areas that warrant the additional level ofprotection provided by the RCRA cap.
J.3 Mo iifying Criteria
J.3.1 Staue/Support Agency Acceptance
Considers whether the State agrees with EPA's analyses and recommendations, as described inthe Rl/FS and Proposed Plan.
SCDHEC \ as reviewed this ROD and concurs with the selected remedy.
J.3.2 Community Acceptance
Considers whether the local community agrees with EPA's analyses and preferred alternative.
Only one written comment was received on the Proposed Plan, and only a few comments wereprovided in the public meeting. Therefore, it is difficult to determine community acceptance ofthe altemaiives. One person recommended in writing to select Alternative G4 - NaturalAttenuatior for the entire Site. There were no vocalized objections to any of the alternatives. Ofthose comments expressed, most were related to costs and source of funding for the cleanup.
65

Table 14 - Summary of Comparative Analysis of Alternatives
Evaluation Criteria
Overall Protection of H u m a n-{ealth and Environment
deduction of Risks to Chemicals in
Groundwater
Soil
Use of Site After Remediation
Compliance with ARARs
Chemical-Specific ARARs
Grouudwater
Soil
Action-Specific ARARs
Location-Specific ARARs
and Permanence
Ma gnitude of Residual Risk
Chemicals tit Soil
Chemicals in Groundwater
Adequacy and Reliability of ControlsSatisfaction of RemedialAc lion Objectives
Alternative SlfClNo Action
No Risk Reduction
No Risk Reduction
RestrictedUse
NO
NO
YES
YES
No Risk Reduction
No Risk Reduction
ContaminantsRemain on Site
NO
i
Alternative S2/C2Institutional Controls
Risk Reduction throughconn-oiled use
Lintited Risk Reduction
RestrictedUse
LONG-TERM
NO
YES
YES
Reduces risk ifSite use Restricted
Reduces risk ifSite use Restricted
Contaminants KLMnain on Site andexposure potential reduced if ICsenforced.
NO
Alternative S3ARCRA Subtitle D I,. ,......_.... _..__...._„__. .....j..
Reduces Potential FutureContamination
Risk Red need
RestrictedUse
LONG-TERN!
NO
YES
YES
Eliminates exposure toSoil Contaminants
No ChangeSoils and Wastes in Landlillpermanently isolated under
CAP
MODERATE
Alternative S3BRCRA Subtitle C
Reduces Potential FutureCon lamina lion
Risk Reduced
RestrictedUse
LONG-TERM
NO
YES
YES
Eliminates exposure toSoil Contaminants
No ChangeSoils and Wastes in Landlillpermanently isolated under
CAP
MODERATE
66
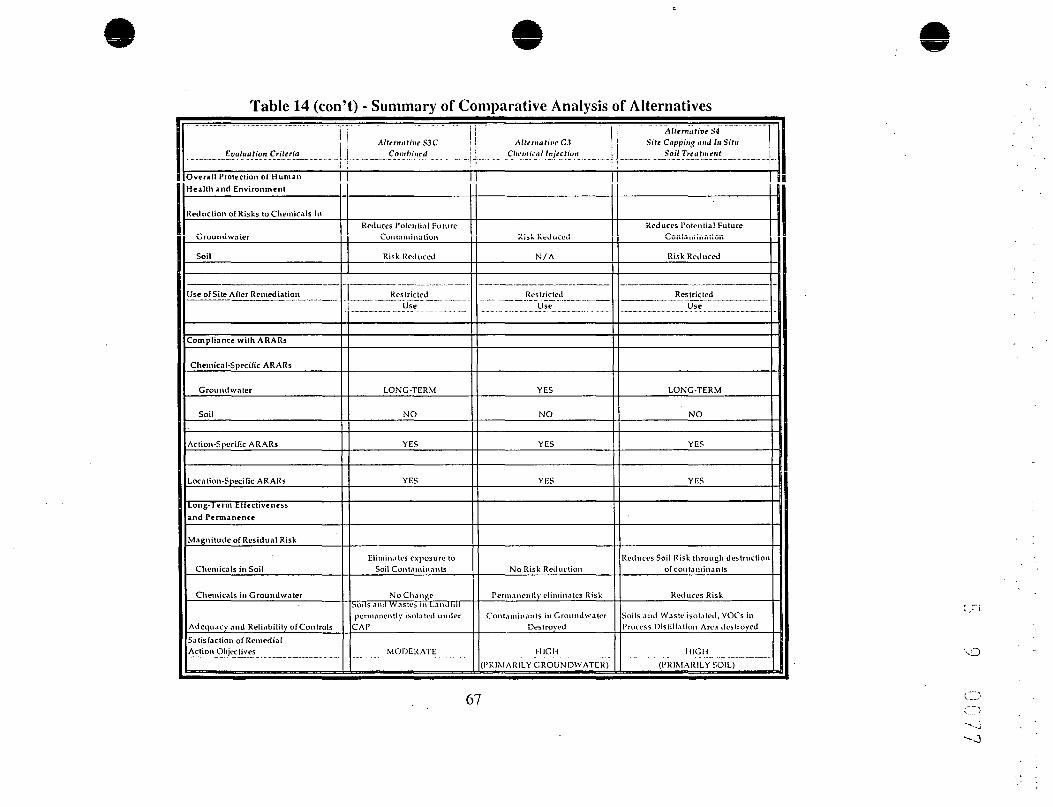
eTable 14 (con't) - Summary of Comparative Analysis of Alternatives
Evaluation Criteria
Overall Protection of H u m a nHealth and Environment
deduction of Risks to Chemicals in
Gruumiwaier
Soil
Jse of Site After Remediation
Compliance with ARARs
Chemical-Specific ARARs
Groundwnter
Soil
Action-Specific ARARs
Location-Specific ARARs
Long-1 enn Ef fec t ivenessand Permanence
Magnitude of Residual Risk
Chemicals in Soil
Chemicals in Groundwater
Adequacy and Reliability of ControlsSatisfaction of RemedialAction Objectives
[ AlttrnativtS3CCombined '•
Reduces Potential FutureContaminat ion
Risk Reduced
RestrictedUse
LONG-TERM
NO
YES
YES
Eliminates exposure toSoil Contaminants
No C!ianj>eSoils and Wastes in L a n d f i l lpermanently isolated under
CAP
MODERATE
Alternative G3Chemical Injection
Risk Kcuucoj
N / A
RestrictedUse
YES
NO
YES
YES
No Risk Reduction
Permanent ly el iminates R i sk
Contaminants in Ground waterDestroyed
HIGH
( P R I M A R I L Y CROUNDWATER)
Alternative S4Site Capping and In Situ
Soil Treatment j
Reduces Potential FutureConiriiiiinauGii
Risk Reduced
RestrictedUse
LONG-TERM
NO
YES
YES
Reduces Soil Risk through destructionof contaminants
Reduces Risk
Soils and Waste isolated, VOCs inProcess Dist i l la t ion Area destroyed
HIGH(PRIMARILY SOIL)
'•O
67
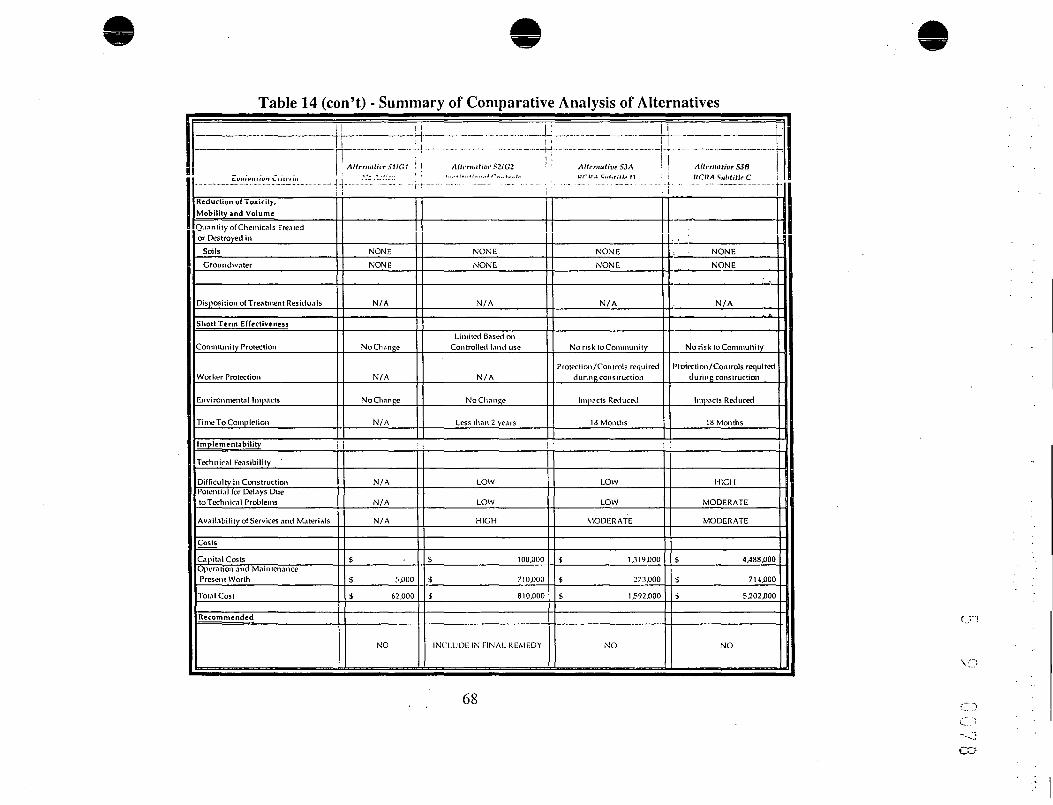
Table 14 (con't) - Summary of Comparative Analysis of Alternatives
. . . 1
Reduction of Toxicity,
Mobility and Volume
Quantity nf Chemicals Treatedor Destroyed in
Soils
Groundwater
Disposition of Treatment Residuals
Short Term Effectiveness
Community Protection
Worker Protection
Environmental Impacts
Time To Completion
Implementabitity
Technical Feasibility
Difficulty in ConstructionPotential for Delays Dueto Technical Problems
Availability of Services and Materials
Costs
Capital CostsOperation and MaintenancePresent Worth
Total Cost
Recommended
i
r~- ~-TAlternative Slid '.
r ——--'-'"- ~ ~ --;•
NONE
NONE
N/A
No Change
N/A
No Change
N/A
N/A
N/A
N/A
$
$ 5JOOO
$ 62,000
NO
_ __ .-__ - 1Alternative S2/C2 '
........ ...
NONE
NONE
N/A
Limited Based onControlled Kind use
N/A
No Change
Less than 2 years
i [
LOW
LOW
HIGH
$ 100,000
$ 7 1 0,000
$ 810,000
INCLUDE IN FINAL REMEDY
Alternative S3A
NONE
NONE
N/A
No risk to Community
Protection /Controls requiredduring construction
Impacts Reduced
18 Months
LOW
LOW
MODERATE
$ 1J19.000
$ 273,000
* l,592jOOO
NO
Alternative S3B
\ \
NONE
NONE
N/AA
Norisk to Community
Plohxtion/Controls requiredduring construction
Impacts Reduced
18 Months
i
HIGH
MODERATE
MODERATE
$ 4/488,000
$ 714X100
$ 5,202,000
NO
68
CO

Table 14 (con't) - Summary of Comparative Analysis of AlternativesJ!. . . . . . . . |
Evaluation Criteria \
Reduction of Toxicity,Mobility and Volume
Quantity of Giemicals Treatedor Destroyed ii\
Soils
Ground water
Disposition ofTre.itnient Residua Is
Short Tenn Effectiveness
Community Protection
Worker Protection
Ejiviroiinient.il Impacts
riineToConi|.iletion
Imptenirntabiliry
Technical Feasibility
Difficulty in ConstructionPotential for Delays Dueto Technical Problems
Availnbilitv of Services and Materials
Costs
Capital CostsO ier.Ttion and MaintenancePresent Wort/t
TotnlCost
Recommended
j
• Alternative S3Ci Combined
NONE
NONE
N/A
No risk toCommunity
Protection/Controls reijuiretlduring construction
Impacts Reilucei)
18Moiltl>s
;
LOW
LOW
MODERATE
$ 2,346,000
J -tWOOO
$ 2^42OTO
NO
_^.__________i
Alteniativr C3 'Clieinii-nt Injection .
NONE
HIGH
NONE
No risk toCommunilv
Protection/Controls ra quireddnrinj; injection
Mitigates prior CVV impacts
3 to 5 years
i
LOW
LOW
HIGH
S 508,000
$
$ 508,000
INCLUDE IN riNAl. REMEDY
..__ . - LAlternative S4
Sifc Cn;»;iiii£ unit In SituSoil Treatment
;
HIGH
LOW
SVE Dischargeto atmosphere
NorisktoCommunity
ProUxtion/Controls requiredduring construction
Reduced Impacts
18 Months for cover, 5 rears forSVE
I
MODERATE
MODERATE
MODERATE
$ 2.736,000
$ 619,000
$ 3,155,000
INCLUDE IN FINAL REMEDY
Alternative G4Monitored Natural
Attenuation
NONE
NONE
N/A
No Short-Temi Change
N/ANo Sliort-Tenn Qunge;In^arls Monitored
15 to 30 years
I
N/A
N/A
N/A
$ 40,000
j, 300,000
$ 340,000
May Iv included in laterstages wit}) reduced
monitoring frequaicy onceactive treatment is complete
69 C.".>
•---JMD

n n x n- o •-' <J
K. PRINCIPAL THREAT WASTE
The NCP establishes an expectation that the USEPA will use treatment to address principalthreats posed by a site wherever practicable (NCP §300.430(a)(l)(iii)(A)). The 'principal threat'concept is applied to the characterization of 'source materials' at a Superfund site. A sourcematerial is material that includes or contains hazardous substances, pollutants, or contaminantsthat act as z reservoir for migration of contamination to ground water, surface water or air, or actsas a source for direct exposure. Identifying principal threat wastes combines concepts of bothhazard and risk. In general, principal threat wastes are those source materials considered to behighly toxi: or highly mobile which generally cannot be contained in a reliable manner or wouldpresent a si gnificani: risk to human health or the environment should exposure occur. Conversely,non-principal threat wastes are those source materials that generally can be reliably contained andthat would present only low risk in the event of exposure. According to A Guide to PrincipalTJireat and Low Level Tlireat Wastes (OSWER 380.3-06FS, November 1991}, wastes thatgenerally do not constitute principal threats include, but are not limited to the following: (1) non-mobile contaminated source material of low to moderate toxicity (surface soil containing COCsthat generally are relatively immobile in air or ground water, i.e., non-liquid, low volatility, lowleachabilitv contaminants such as high molecular weight compounds) and (2) low toxicity sourcematerial (sDil and subsurface soil concentrations not greatly above reference dose levels or thatpresent an sxcess cancer risk near the acceptable risk range were exposure to occur).
Although treatment will be applied to the VOC contaminated soil and groundwater, there are noprincipal threats at the Aqua-Tech Site. The VOC soil contaminants are mobile and may act asa potential threat to groundwater but are low in concentration. The non-VOC soil contaminantspose a risk to human health but are not mobile and are characterized by relatively lowconcentrations within a confined area. Groundwater contamination at Site is at low concentrationsand not considered to be a source material. Furthermore, DNAPLs have not been detected in thegroundwatsr. Therefore, EPA does not consider any of the wastes at the Aqua-Tech Site to be"principal :hreat" wastes.
L. SUMMARY OF THE SELECTED REMEDY
L.I Description of the Remedy
The preferred remedial alternative will combine elements of Remedial Alternatives S2/G2, S4and G3. The primary remedial activities will consist of the following:
1) Site Capping using a combination of a RCRA Subtitle C Cover and RCRA Subtitle Dsoi 1 cover for different portions of the municipal landfill to ensure all municipal waste isiso lated from exposure and provide an extra level of protection in areas where the greatestconcentrations of VOCs were reported;
70
0 0 3 1
2) In Situ Soil Treatment in the former Process Distillation Area to reduce the mass of VOCsin shallow soils throughout this area;
3) In 5'itu Groundwater Treatment by chemical injection to immediately reduce thecontaminant mass and enhance the long term biodegradation of residual VOCs ingrot ndwater. Once in situ treatment is complete, final remediation of groundwater willbe a:hieved through natural attenuation;
4) Routine groundwater monitoring and Site inspections to assess the effectiveness andintegrity of the selected remedial alternative; and,
5) Institutional Controls to restrict use and development of the Site to minimize publicexposure to residual contaminants, and to ensure the long-term integrity of the remedy.
The primary elements of the selected remedy are illustrated on Figure 37. A detailed summaryof the components of the selected remedy provided below.
Site Cappirg
Construction of the RCRA Subtitle C cap and RCRA Subtitle D soil cover will involve thehandling of in excess of 66,000 cubic yards of soil and granular material. The approximate limitsof the RCRA cap and soil cover are illustrated on Figure 36. The limits will be confirmed duringthe RD phase.
During performance of the ERA, it was anticipated that certain historic sample locations situatedoutside the actual limits of the landfill would be incorporated beneath the presumptive remedycover. The specific sample location designations include: SB-08, 509-07, 510-01, 510-03,601-01, 60..-02, and 601-03. Of these locations:
SB-08, only manganese exceeded its screening value but the reported concentration wasconsistent with background levels; and,
509-07, 510-01 and 510-03 had concentrations of COCs that were well within the rangeof ether samples well outside the limits of the presumptive remedy that did not trigger acon:ern.
The remain ing locations were identified due to elevated concentrations of metals that representeda potential scological risk but no other concern. Consequently, soils in these areas are suitablefor common fill for rough grading beneath the landfill cover or may simply be covered (to beassessed during RD stage). In addition, soil in the PCL3 Area (specifically sample locationPCL-SA) was identified as a potential hot spot in the BRA. The soil contained slightly elevatedconcentrations of arsenic (65.6ppm) and Iron (24,800ppm) and does not represent a threat if used
71
0 0 8 2
as common fill beneath the proposed MSWL cover. All other potential soil hot spots identifiedin the BRA were within the limits of the landfill and will be isolated beneath the soil cover.
Pre-constriction activities will include procurement of nearby sources of earthen material,permitting, etc.
The RCRA Subtitle D soil cover to be placed over the MSWL will meet the closure coverrequirements of Chapter 61 of the South-Carolina Code (June 23, 1995) and consist of:
° a minimum of 18 inches of earthen fill with a maximum in-place permeability oflxlO~5cm/sec; and
• a minimum of 12 inches of soil suitable to support vegetation.
This cross ;ection may-be modified during the RD for portions of the Site with existing slopesthat exceec 1:4. In these areas, the slope of the land is sufficient to shed precipitation and theprimary objective will be to secure the slopes against erosion and protect adjacent streams, creeksand ravines. In these areas, a vegetation mat is proposed to support rapid development of a securevegetation cover. Existing Site soils and cover material may be incorporated into the designwhere such soils meet the desired physical characteristics and their use is not precluded due tothe presence of chemicals of concern.
The RCRA Subtitle C cover to be placed over the process distillation area will consist of:
• common fill for rough-grading;• a minimum of 24 inches of compacted clay with a maximum permeability of
IxlO"7 cm/sec;• a 60 mil HDP FML placed on top of the clay;• a drainage layer placed on top of the FML to convey precipitation that infiltrates
to the FML;the drainage layer may be a synthetic Geocomposite or granular layerwith lateral drainage; and,
• a 24 inch thick earthen infiltration layer to protect the infiltration barriers andsupport a cover of vegetation.
A RCRA Subtitle C cover typically incorporates a gas venting system-. The SVE system willreplace the gas venting system in the preferred remedy. The placement of the SVE system willgenerally coincide with the RCRA cover and will serve as an active venting system while inoperation and can remain in place to function as a passive venting system once the SVE is nolonger beneficial for soil treatment.
In Situ Soil Treatment
Implement ation of SVE in combination with the RCRA Subtitle C cover in the ProcessDistillation Area will entail careful planning and design of the placement, size and configuration
72
j 3 3
of collection laterals. Areas will be avoided where there is only a thin soil cover over MSWL,or where there is no evidence of removable volatile constituents. Where there are surfaceobstructions such-as concrete foundations, the surface obstruction will be either broken orpenetrated t:> allow proper and complete distribution of the S VE collection network or the pipemay be relocated to a more suitable location. Final layout for SVE equipment sizing,instrumentation and controls, and operation with maintenance will be defined during the RDstage.
In .Situ Groundwater Treatment
Based on thi; detailed evaluation of remedial alternatives, the single remedy that appears to havethe greatest potential to treat residual contamination in groundwater in a reasonable period of timeis chemical injection. Therefore, in situ chemical injection into affected areas to stimulatedegradation of chlorinated solvent contaminants in groundwater is proposed as the most efficientand cost-effective short-term remedial approach for groundwater treatment at the Aqua-Tech Site.
The immediate impacts from chemical injection will vary. To ensure the treatment is effective,it will be performed in an iterative manner, with interim monitoring performed between injectionevents, and the scope of subsequent injection events developed based on the results of priorevents.
Treatability Testing
Samples wil l be collected during the remedial design phase for treatability testing. Saturated soiland groundwater samples will be tested for the following:
total oxidant demand;• reactivity to oxidants (e.g., potassium permanganate and sodium persulfate);
reactivity to reductants (e.g., sodium lactate and HRC);• background metals; and,• physical and geochemical properties.
Injection Program
The chemical injection program for impacted groundwater will be conducted as an iterativeprocess, v/iere results of injection in a particular area or groundwater zone will determine thedirection £.nd focus of subsequent injections. Specifically, the type of injectant used for aparticular bcation, oxidant or reductant, will be determined based on the results of the treatabilitystudy, coniaminant concentrations, and level of natural attenuation taking place. Also, resultsfrom a paiticular round of injection will determine the necessity and degree of subsequentinjection to achieve preliminary remediation goals. Injection will be initiated first in upgradientareas, with downgradient areas monitored for possible contaminant reduction due to upgradient
73

0U
II
source rediction. Finally, injection will first take place within the saprolite zone, with theshallow bedrock zone concurrently monitored for potential attenuation effects, in order todetermine v/hether subsequent injection into the shallow bedrock will be necessary.
Oxidants vill be used for injection in the vicinity of the highest observed groundwaterconcentrations of tetrachloroethene and trichloroethene, where the ratio of PCE/TCE to daughterproducts is high. Based on existing data, it is expected, but not limited to, that this would bepredominantly in the vicinity of MW-1 (Administration Area).
Reductants will be injected downgradient, in the vicinity of the 601/602 Area, where there issignificant production of daughter products, indicating anaerobic biodegradation is ongoing.Injection of oxidants in these areas would disrupt the anaerobic bioactivity. Specifically,reductants would be introduced in the vicinity of wells MW-3, MW-11, and MW-20.
Application of chemical injection will be conducted in phases. The chemicals will be injectedat a sufficient number of points such that there is an adequate overlap of effective injection"cones". It is anticipated that each injection point will have an effective treatment radius of 20feet. Uncertainty in complete coverage is due to the effect of soil texture heterogeneities ontransport ol the injected material. This leads to using a phased injection approach, where resultscan be used to guide future adjustments in the application grid.
During the initial injection in the saprolite in each treatment area, soils above the water table willbe screened to ensure no residual source of VOCs remains in the overlying soils in the areas tobe treated. If pockets of significant VOC contamination are observed in the vadose zone soils,such soils will also be treated by chemical injection.
The downgradient monitoring wells TW-1, MW-4, MW-6, MW-10, and MW-19 wi l l bemonitored following injection at the upgradient points.
Concentration levels in downgradient wells will be monitored for response to the upgradientinjections to determine whether injection should be performed at downgradient points.
Performance Monitoring
Performance monitoring will be conducted after full-scale injection has taken place as a measureof the effec tiveness of the technology. Approximately three months after injection, groundwateranalytical data will be collected from selected monitoring wells for confirmation of applicationeffectiveness. The performance monitoring results will be used to guide adjustments in theapplication grid and determine the need for reapplications. It is anticipated that several additionalmonitoring wells will be added for baseline assessment and performance monitoring in the 505 and510 Areas. Once the primary aqueous contaminant plumes are addressed, if PreliminaryRemediation Objectives have still not been met, it may be possible to rely on natural attenuation,allowing I he natural bio-activity to address remaining low concentrations of COCs in a
74
cost-effeclive manner. However, EPA believes that substantial compliance can be met with thisfocused, iterative injection approach.
Injection
The State of South Carolina requirements for a Class 5 Injection Well Permit UndergroundInjection Control (UIC) Program will be complied with.
Site Monitoring
The Site monitoring program will include inspection/monitoring activities for specific componentsof the remedy (i.e.. cap inspections) and routine groundwater monitoring to assess the overalleffectiveness of the combined remedy.
Two addiiional monitoring wells will be installed to supplement the existing monitoring wellnetwork. Routine monitoring will consist of annual sampling of the entire monitoring wellnetwork for a period of at least 5 years. It is anticipated that the monitoring well network andanalyte lis: will be compressed after 5 years based on the annual sampling results.
Samples CDllected for annual monitoring in years 1 through 5 will be analyzed for:
TCL VOCsTCL SVOCsTAL Metals
The anal yte list for the subsequent events wil l be developed based on the results of the first 5 yearsof the annual monitoring program and interim events performed to support the in situ groundwatertreatment program..
Where possible, the annual sampling event will be scheduled to coincide with any focusedmonitoring to be performed relative to the chemical injection program (or vice-versa).
Institutional Controls
Institutional Controls proposed and currently in place at the Site include:
i) zoning ordinance to preclude residential development consistent with the Airport environszoning restrictions; and,
ii) deed restrictions to protect the integrity of implemented remedies and ensure MSW left inplace is not disturbed.
The current Airport Environs zoning ordinance precludes residential development of the Site butpermits commercial/industrial development. Potential future industrial development may beaccommodated on portions of the Site outside the limits of the MSWL and cap/cover.
75
:; o 8 6Deed restrictions will, as a minimum, be required to ensure covers, caps, and other remedialcomponent:; are protected and municipal waste left in place is not disturbed in the future.
Access Restrictions
Access Restrictions proposed and currently in place at the Site include:
i) Site fencing to restrict access during implementation of remedial measures;
Fencing will be required as an interim measure pending completion of the selected remedy. Thedesign of the final remedy for the Site should therefore not rely on fencing to ensure the integrityof the final remedy and mitigate potential exposure scenarios.
L.2 Summary of the Rationale for the Selected Remedy
Remedial Alternative Sl/Gl was omitted from consideration due to its inability to reduce thetoxicity, volume or mobility of Site contaminants in a reasonable time.
Remedial Alternati ve S2/G2 - Institutional Controls, will be incorporated into the preferred remedyto restrict a:cess to the Site during implementation of remedial action, restrict long-term use of theSite to protect remedial measures and provide long-term inspections and monitoring. Onceimplement;d, the preferred remedy will not rely on access restrictions (fencing) to maintainprotection Df public: health.
Remedial Alternative S3 effectively isolates residual soil contamination but does not reduce thetoxicity or mass of contaminants and does not fully address groundwater impacts from historicAqua-Tech operations if implemented on its own.
Remedial Alternative S4 incorporates the capping benefits of Alternative S3 and provides forfurther red jction of contaminant toxicity and mobility through focused soil treatment but does notspecifically impact groundwater quality in the short term. Alternative G3 provides acceleratedtreatment of groundwater through chemical oxidation. Alternative G4 will not provide acceleratedtreatment (if groundwater. However, Alternative G4, Monitored Natural Attenuation, may providelong-term remediation of residual groundwater contamination remaining after accelerated treatment(i.e. Alterr ative G3). A combination of focused soil and groundwater treatment actions providesthe greatest level of protection without redundancy.
L.3 Su mmary of Estimated Remedy Costs
The estimated capital costs of the selected remedy is $3,344,000. The estimated net present worthcost of the selected remedy is $4,673,000. The information in this cost estimate summary is basedon the bes: available information regarding the scope of the selected remedy. Cost variations arelikely to occur as new information and data are collected during the design phase. This is an order-
76

•J u 07
of-magnitucle engineering cost estimate that is expected to be within +50 to -30 percent of theactual proje:t cost. Table 15 contains a detailed breakdown of estimated costs.
Table 15 - Estimated Cost of the Remedy
Remedy Costing Component
Alternati/e S2/G2:: Institutional Controls
Alternati/e S4: SVE with Combined Cover
Alternative: Chemical Injection
Sub -TotalTotal Remedy Cost
Capital Cost(Years 1-3)
jj $100,000I[ $2,736,000i[_ $508,000
$3,344,000
O&M Costs(7% Discount)
$710,000
$619,000
N/A
$1,329,000$ 4,673,000 i
77

9 0 0 8 8
Table 15 (con't) - Estimated Cost of the Remedy«••••
ALTERNATIVE S2/G2, INSTITUTIONAL CONTROLS AND MONITORINGCOST ESTIMATE
Remedy Component. 1
Monitoring Plan DevelopmentDeed Restrictions
Component Cost|
r | i j 10,000
New Well Installation)and Well Maintenance! I
Annual Groundwater Monitoring(45 Wells for VOC, SVOCs, Metals) 45,000/yr
Maintenance/Inspections) 12,000/yr
I 50,00040,000
I 560,000*i 150,000*
ITota Remedy Cost (30 Year, PV) I | $ 810,000
| i | !'Assumes 30 years @ 7% discount rate
Key Assumptions:Well Network and Analyte list remainsconstant or 30 years; maximum of 3 newwells to bs installed.
|| )I
!i
. 1 . . . i . _ ^ _ _ .__ __ ._i
Table 15 (con't)- Estimated Cost of the Remedy
_ _. i ._ ._ L... .....1 ...._ __ALTERNATIVE S4 SVE WITH COMBINED COVER
COST ESTIMATE
Remedy Component
Site Prep (Demo, Trailer Removal etc.)RCRA Cover Cost @ 3 Acres
Soil Cover @ 8 Acres
Mechanical System + Installation
Total Construction Cost (TCC)Construction QC & Oversight
Remedial Design
Basis Unit No. Units|
i 1 1
27% Alt. 3B 27%
73% Alt 3A | 73%
Lump Sum ..
1 1 0 % TCC7% TCC
Annual O&M - Cover (30 yrjjAnnual O&M - SVE (5 yr)
Toial Remedy Cost (30 Year, PV)! j
Key Assumptions: j
1
11
305
Est. UnitCost
ComponentCost
150,000! 150,0003,836,000! 1,036,000
J, 099,000
u 350,000
40,00030,000
802,000
350,000
2,338,000234,000164,000496,000123,000
| j $ 3,355,000
SVEoperation for 5 years, then converts to landfil gas vents |No off gas treatment I
78

0 0 8 9
TabJe 15 (con't) - Estimated Cost of the Remedy
I I . ... .A.TERNATJVE G3 GROUNDWATER REMEDIATION CHEMICAL INJECTION
COST ESTIMATE
Remedy ComponentComponent
Costi
Treatability Study, Permitting, and Pilot Testj 75,000Soil Screening in Proposed Injection Areas 15,000
Cost per Injection EventMobilization Injection and Chemical
Costs 5 days @8,000=Oversight and Reporting
Cost per Event
3,000 !40,0007,000 I50,000 |
Injection Events 6 50,000 300,000Interim Monitoring Events 12
""otal Construction Cost (TCC)6,000 I ] 72,000
462,000Remedial Design 10% TCC 1 [ 46,000
and Interm AssessmentsTotal Remedy Cost i $ 508,000
I !Key As: sumptions: | jInjection into saprolite groundwater jInjection events occur at 6 month intervalsApproximately 4 to 6i injection events requiredRiot test i nay be combined with first injection event
|ii
79

0 0 9 0
L.3 Expected Outcomes of the Selected Remedy
The selected remedy will reduce future unacceptable risks to human health and the environmentby preventing or minimizing further exposure to contaminated soils and groundwater impacted bythe closed MSWL arid the former Aqua-Tech operation. In summary, the remedy provides for theconstruction of an engineered containment cover (cap) in accordance with the Presumptive Remedycombined with in-situ treatment of soil to primarily prevent or mitigate direct human exposure toSite soils and/or the MSWL contents. Furthermore, the selected remedy will control migration ofcontaminants from the Site to surface water by eliminating contact of stormwater runoff withMSWL contents and Site soils. In addition, the remedy provides for the restoration of thecontaminated groundwater by implementing in situ treatment of groundwater to attain clean-uplevels after 3 to 5 years. Institutional controls will be implemented to control Site use.Environmental monitoring will be implemented to evaluate the effectiveness of the remedy. Userestrictions on such groundwater are part of the selected remedy and will be in place until thegroundwater performance standards are attained. Use of the landfill property will be indefinitelylimited to ensure that the engineered containment cover remains intact and continues to preventmigration of contaminated soils and reduce infiltration of water that could be released into thesroundwater.o
L.4 Finnl Clean-up Levels
The BRA icentified specific clean-up levels for the surface and subsurface soils and groundwater.As previously stated, clean-up levels for air were not derived, since the air itself cannot reasonablybe remediatsd. The final Clean-up Levels for surface and subsurface soils and groundwater, basisfor the clean-up levels, and risk at clean-up level (if appropriate) are included in Tables 16 and 17.
80
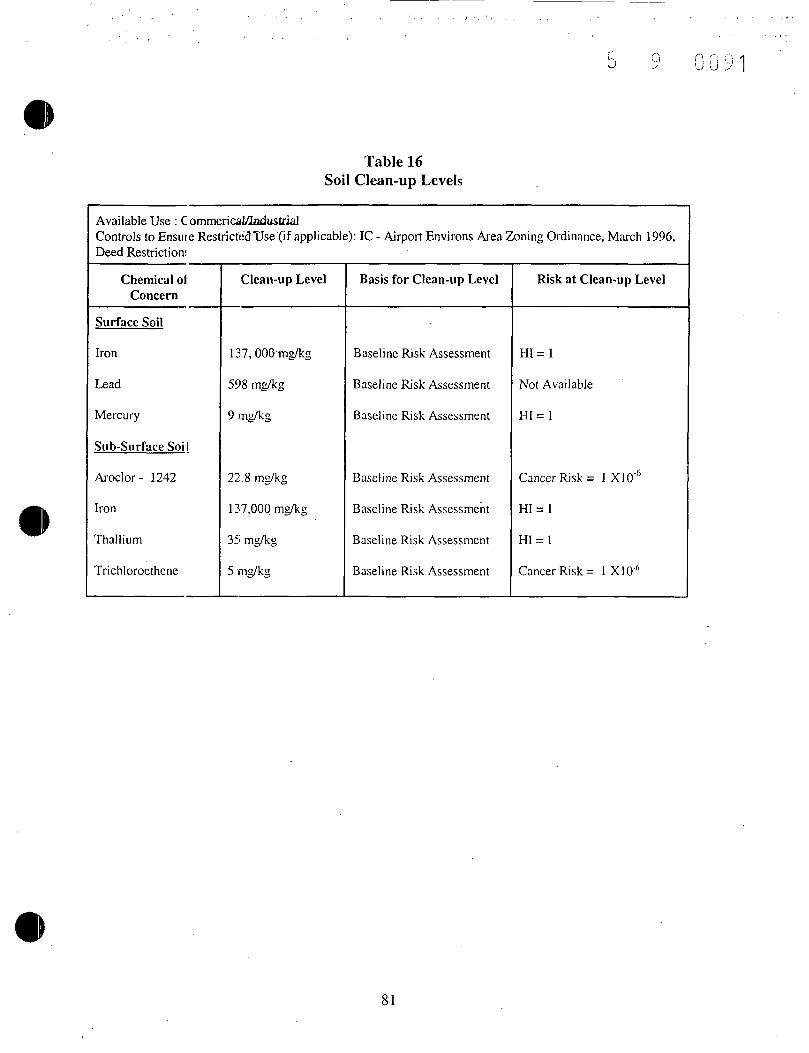
0 0 9 1
Table 16Soil Clean-up Levels
Available Use : C ommerical/IndustrialControls to Ensuie RestrictedTJse (if applicable): 1C - Airport Environs Area Zoning Ordinance, March 1996,Deed Restriction!
Chemical o\Concern
Surface Soil
Iron
Lead
Mercury
Sub-Surface Soil
Aroclor- 1242
Iron
Thallium
Trichloroethene
Clean-up Level
137, 000-mg/kg
598 mg/kg
9 mg/kg
22.8 mg/kg
137,000 mg/kg
35 mg/kg
5 mg/kg
Basis for Clean-up Level
Baseline Risk Assessment
Baseline Risk Assessment
Baseline Risk Assessment
Baseline Risk Assessment
Baseline Risk Assessment
Baseline Risk Assessment
Baseline Risk Assessment
Risk at Clean-up Level
H I = 1
Not Available
H I = 1
Cancer Risk = 1 X10"6
HI = 1
H I = 1
Cancer Risk = 1 X10'6
81

ift
Table 17Groundwater Clean-up Levels
Availabls Use : ResidentialControls to Ensure Restricted Use (if applicable): 1C - Airport Environs Area ZoningOrdinance, March 1996 , Deed Restrictions
Chenii :al of Concern
1,1,2,2-Tetrachl roethane
1,1 -Did lorothene
Benzene
cis-l,2-I)ichloroethene
Tetrachl Droethene
Trichlornethene
Vinyl Chloride
Clean-upLevel
2ug/l
7ug/l
5ug/l
70ug/l
5ug/l
5ug/l
2ug/l
Basis for Clean-upLevel
Federal MCL
Federal MCL
Federal MCL
Federal MCL
Federal MCL
Federal MCL
Federal MCL
Risk at Clean-upLevel
Not Available
Not Available
Not Available
Not Available
Not Available
Not Available
Not Available
82

..'•. ,". :••> -71j u y 5M. STATUTORY DETERMINATIONS
M.I Protection of Human Health and the Environment
The selected remedy will adequately protect human health and the environment through treatment,engineering; controls;, and/or institutional controls (NCP)§300.430(f)(5)(ii)). Soil and groundwatercontaminar ts concentrations posing cancer risks of greater than lxlO"6or Hazard Quotients greaterthan 1, will be contained and/or treated on-site. Notices will be placed on deeds warning potentialproperty purchasers of potentially contaminated groundwater. Environmental monitoring will beimplemented to evaluate the effectiveness of the remedy. All of these measures will reduce therisks to botn human and ecological receptors. They are not expected to cause unacceptable short-term risks or cross-media impacts.
M.2 Compliance with Applicable or Relevant and Appropriate Requirements
The Federd and State ARARs, potential ARARs and requirements which are ToBe Considered, thai: are relevant to the Site and the Selected Remedy are presented inTable 18. The selected remedy will comply with all ARARs in Table 18 that are listed aseither "Applicable" or "Relevant and Appropriate" under the "Status" column.
83
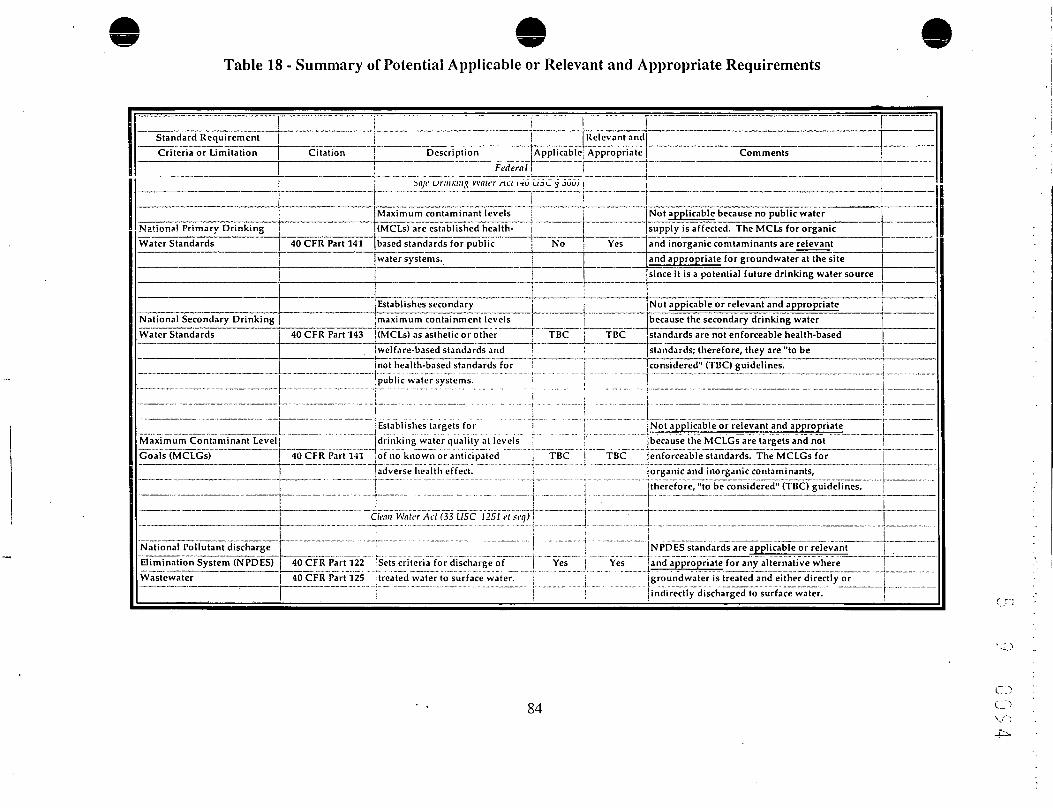
Table 18 - Summary of Potential Applicable or Relevant and Appropriate Requirements
————————————Standard RequirementCriteria or Limitation
Nation-?? Primary DrinkingWater Standards
National Secondary DrinkingWater Standards
Maximum Contaminant LevelGoals (MCLGs)
National Pollutant dischargeElimination System (NPDES)Wastewater
i i l l| { i Relevant and
Citation Description JAppl icable j AppropriateFederal \ \
', bnje urniKiiig vvnier net c*u uoi_ 5 ouuj i
i i >Maximum contaminant levels(MCLs) are established health- [ \
40 CFR Part 141 based standards for public ! No f~ Yeswater systems. i
1 1!
Establishes secondary jmax imum containment levels j
40 CFR Part 143 |(MCLs) asastheticor other 1 TBC TBC1 welfare-based standards and !i not health-based standards fori pub l i c water systems. i
! i' !Establishes targets for idrinking water qua l i t y at levels •
40 CFR Part 141 lof no known or anticipated j TBC TBC[adverse health effect. i
. _ ...... ..._.„._!...._.......„_._._._.......... ...„.___ ..!......._....... .................................[ 1'Clean Water Act (33 USC 1251 el sc-i;} !u________^_._...__._ _.._.__ .. _p._... __. . _.___._
1 ' '40 CFR Part 122 isets cri teria for discharge of | Yes Yes40 CFR Part 125 treated water to surface water. 1r i
Comments
Not applicable because no public watersupply is affected. The MCLs for organicand inorganic comtaminants are relevantand appropriate for groundwater at the sitesince it is a potential fu ture drinking water source
Not appicable or relevant and appropriatebecause the secondary drinking waterstandards are not enforceable health-basedstandards; therefore, they are "to beconsidered" (TBC) guidelines.. -
Not applicable or relevant and appropriatebecause the MCLGs are targets and notenforceable standards. The MCLGs fororganic and inorganic contaminants,therefore, "to be considered" (TBC) guidelines.
NPDES standards are applicable or relevantand appropriate for any alternative wheregroundwater is treated and either directly orindirectly discharged to surface water.
._. ................
r ~~iiP ............. ._
84
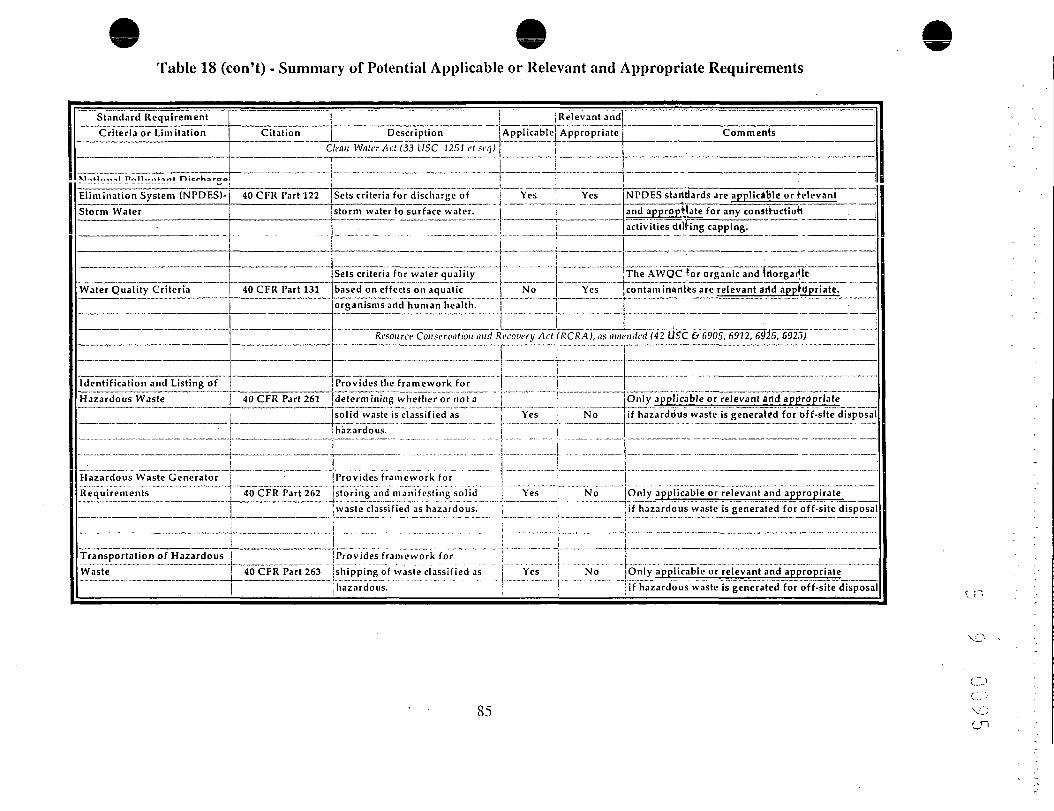
Table 18 (con't) - Summary of Potential Applicable or Relevant and Appropriate Requirements
Standard RequirementCriteria or Limitation
El imina t ion System (NPDES)-Storm Water
'
Water Quality Criteria
Ident i f ica t ion and Listing ofHazardous Waste
i {Relevant andCitation Description Applicable; Appropriate
Clean Water Act (33 USC 1257 cf sr^ | j
40 CFR Part 122
40 CFR Part 131
i! i
Sets cr i ter ia for discharge of Yes j Yesstorm water to surface water . | i
!.
Comments !!
1
NPDES standards are applicable or relevantand appropriate for any construction'act ivi t ies dicing capping.
I ' iJ ! 1 -
Sets cri teria for water qua l i ty jbased on effects on aquat ic | No Yesorganisms arid human health. j
!
The AWQC for organic and Irtorgarllccontaminantes are relevant arid appropriate.
Resource Conservation and Recovery Act (RCRA), ns amended (42 USC 6* 6905, 6912, 6$iS, 692,),) ;
j i! iProvides the f ramework for | j
40 CFR Part 261 {determining whether or not a j JOnly applicable or relevant and appropriate(solid waste is classified as Yes No jif hazardous waste is generated for off-si te disposal[hazardous. I l l
I i !i "• ———— •———— - I - - ' - p—— ————Hazardous Waste Generator ' (Provides f r amework for ! jRequirements 40 CFR Part 262 is tor ing and m a n i f e s t i n g solid i Yes | No Only applicable or relevant and appropirate
jwaste classified as hazardous. ', : ;if hazardous waste is generated for off-s i te disposa
i ; i i !
Transportation of HazardousWaste
...! ! „ __Provides framework for : ] j
40 CFR Part 263 {shipping of waste c lass i f ied as Yes j No jOnly applicable or relevant and appropriatehazardous. ! 'if hazardous waste is generated for off-s i te disposa
85

Table 18 (con't) - Summary of Potential Applicable or Relevant and Appropriate Requirements
Standard RequirementCriteria or Limitation
RCRA Subtitle D Regulations
National Primary andSecondary Ambient AirQuality Standards
National Emissions Standardsfor Hazardous Air Pollutants(NESHAPs)
Citation
.................. . . . . . . . .
••"""•"
40 CFR Part 258
40 CFR Part 50
40 CFR Part 61
...._..._._
j Relevant andDescription ! Applicable! Appropriate j Comments
i 1 iProvides standards f o r off-site - 1 1 'trcz.trr.C"1 "™ft •J-"«^*s-»i ^f i v*»c ! NJn iOnlv nnnlirahle or relevant and appropriate »
waste classif ied as hazardous. i if hazardous waste is generated for off-site disposal
~ i1 j !
Provides standards for 1 ' ! ;municipal solid waste landfills j No Yes j Closure requirements for municipal •
| landfills are relevant and appropriate for ithis site.
Clean Air Act 40CFR 50 \| j
Sets primary and secondary air 1standards at levels to protect | No No j May be relevant and appropriate if on-sitepublic health and public 1 treatment units are part of remedial actions. ;welfare. I
j :
•
Provides emissions standard ;for hazardous air pollutants for ; No No May be relevant or appropriate if on-sitewhich no ambient air quality j | treatment units are part of remedial actions.standards exists. !
1
86

Table 18 (con't) - Summary of Potential Applicable or Relevant and Appropriate Requirements
Standard Requirement 1 ^Relevan t and;Criteria or Limitation j Citation Description j Applicable! Appropriate I Comments
Department of Transportation (DOT) Hazardous Materials Trnnsporntion Act (49 USC ISO'1) j| |
Department of Transportation! Regulates off-s i te|.... .... ...r. ... ___ ________ _ —— _ _ _
(UU I) Hazardous Materials 4y i_Mt 1'arts IV 1-i/v transportation or specinc INO : les .nppncauie u n i y n r cmeu iuuu i i mvoivusTransporation Act hazardous chemicals and wastes.
South Carolina !
i 1 removal of waste from the site.
iI
ti i .
| South Carolina Air Pollution Control Rigulntions (R. 61-61) \i ; ; i
1IPermits and Establishes Air j
E ( . . . . . . . . . . . . .
Air Pol lu t ion Control Pol lut ion Control Standards i ]Standards j R61-61.5 j for hazardous pollutants and No ' No j Applicable or relevant and appropriate for
; particular matter.!
; [certain l a n d f i l l gas treatment methods, suchi |as flares.
!I •- ' -
I
! iStandards for emissions of ]
Ambient Air Quality Standard: R. 61-62.5 jparticulate matter, SOx, NOx, No No (May be applicable or relevant and appropriate for| and CO.
1
certain groundwater t reatment methods. i! ! '•i i
Emissions from Process R. 61-62.5 [Standards for emissions of 1Industries Standard No. 4 particulate matter and SOx. No ; No [May be applicable or relevant and appropriate for
. . _ ... f ___{ {certain l andf i l l gas treatment methods.
i i !Lowest Achievable Emission R. 61-62.5 'Standards for emissions of j ! :
Rate (LAER) for VOCs [ Standard No. 5.1 ;VOCs.
!
I
No No Unlikely to be applicable or relevant and appropriate j1 ,due to the threshold quanti t ies . 1
. - . . . . . . . . . . . . . ! : . ..... . \
87

Table 18 (con't) - Summary of Potential Applicable or Relevant and Appropriate Requirements
Standard RequirementCriteria or Limitation
Prevention of SignificantDeterioration
!
Toxic Air Pollutants
Good Engineering PracticeStack Height
Water Pollution ControlPermits
Standards for WastewaterFacility Construction
South Carolina HazardousWaste ManagementRegulations.
!CitationR.61-62.5 \
Standard No.7 j
R.61-62.5Standard Nu. 8
•
_ _ _._._:iR.61-62.7
R.61-9'
R.61-67
R.61-79
DescriptionStandards for emissions ofparticulate matter and SOx.
Standards for emissions forliaiaiuous air poiiuiauis.
Standards for establishingstack heights for air discharges.
Standards for NPDES permitsfor discharge of wastewater tosurface water or POTWs anddischarge of storm water.
Standards for construction offacilities to treat water subjectto NPDES requirements.
Permits and establishesregulations for locating,operating, inspecting, andclosing Hazardous Waste
j Relevant and;Applicable Appropriate Comments
1No 1 No Unlikely to be applicable or relevant and appropriat
[due to the threshold quantities.
No ! No Applicable or relevant and appropriate forI | certain groundwater treatment methods.
|
; |i { Applicable or relevant and appropriate for certain
No j No landfill gas or groundwater treatment methods.
jNo No ; Applicable or relevant and appropriate for
most groundwater treatment methods and| | possibly for storm water runoff.
!r l !i |
No 1 No j Applicable or relevant and appropriate fori most groundwater treatment methods.
ii| Similar to the Federal Resource
1 No | No j Conservation and Recovery Act (RCRA).j 1 'Only applicable or relevant and appropriatej \ I if waste is generated for off-site disposal.
—— - —— - -
el" ~~ ~
1i
i ,i
^ _.i!
.. i ....... .1
88
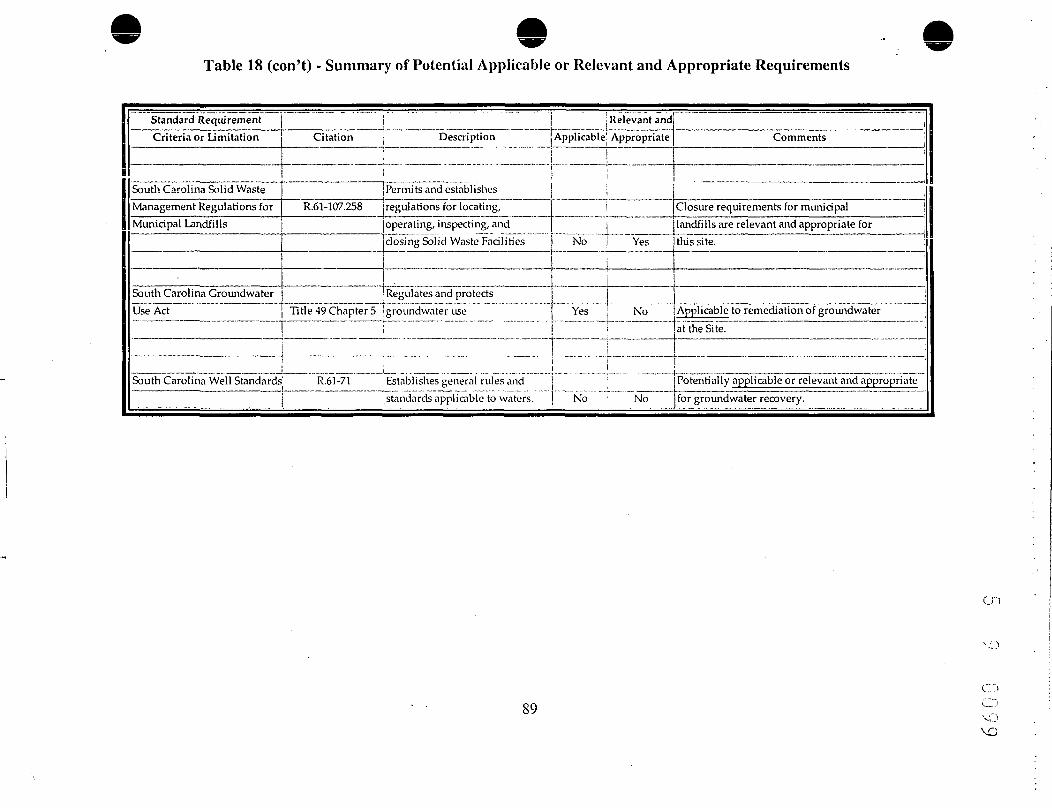
Table 18 (con't) - Summary of Potential Applicable or Relevant and Appropriate Requirements
Standard RequirementCriteria or Limitation
South Carolina Solid WasteManagement Regulations forMunicipal Landfills
South Carolina GroundwaterUse Act
South Carolina Well Standards
i i j Relevant andi . J i
Citation j Description ! Applicable Appropriatei
i i ,
| Permits and establishes j •R.61-107.258 jregulations for locating, j
operating, inspecting, and |iclosing Solid Waste Facilities | No Yes
Regulates and protectsTitle 49 Chapter 5 groundwater use Yes No
i|ii
R.61-71 Establishes general rules and j[standards applicable to waters. j No ; No
........ ———————————————————————— . ———————————————— =r=rr
Comments i
,
Closure requirements for municipal 1landfills are relevant and appropriate forthis site. i
. . . . . . . . . . . . . . . . . . . . . .
Applicable to remediation of groundwaterat the Site.
Potentially applicable or relevant and appropriatefor groundwater recovery.
89

M.3 Cost Effectiveness b 9 0 1 0 0
This section explains how the Selected Remedy meets the statutory requirement that all Superfundremedies be cost-effective. A cost-effective remedy in the Superfund program is one whose "costs areproportional to its overall effectiveness" (NCP)§300.430(f)(l)(ii)(D)). The "overall effectiveness" isdetermined by evaluating the following three of the five balancing criteria used in the detailed analysisof alternatives: (1) Long-term effectiveness and permanence; (2) Reduction in toxicity, mobility andvolume (TMV) through treatment; and, (3) Short-term effectiveness. "Overall effectiveness is thencompared to cost" to determine whether a remedy is cost-effective (NCP §300.430(f)(l)(ii)(D)). Theselected remedy is considered cost effective because it is a permanent solution that reduces humanhealth risks to acceptable levels at less expense than some of the other permanent, risk reducingalternatives evaluated.
M.4 Utilization of Permanent Solutions and Alternative Treatment (or ResourceRecovery) Technologies to the Maximum Extent Practicable (MEP)
The selected remedy provides permanent solutions for all media and treatment for soil andgroundwater. It does not provide for treatment of air, since the air itself cannot reasonably beremediated. However, all of the modeled air concentrations were less than the current SC DHECMaximum Ambient Air Concentrations. Furthermore, active remedial alternatives being consideredfor soil ami/or groundwater will further reduce chemical concentrations in the ambient air, if any,attributable to the Site. In addition, Institutional Controls with Monitoring is being selected to restrictuse and development of the Site to minimize public exposure to residual contaminants, ensure thelong-term integrity of the remedy and assess the effectiveness and integrity of the remedy. These arepermanent solutions.
M.5 Preference for Treatment as a Principal Element
Although there is no principal threat waste at this Site, the selected remedy for soil and groundwaterincludes treatment. In situ Soil treatment in the former Process Distillation Area to reduce the massof VOCs in shallow soils throughout this area and in situ groundwater treatment by chemical injectionto immediately reduce the contaminant mass and enhance the long term biodegradation of residualVOCs in groundwater.
M.6 Five-Year Review Requirements
The Selected Remedy includes a Presumptive Remedy for the landfill at the Site. Therefore, uponcompletion of this remedy, hazardous substances, pollutants, or contaminants will remain on-siteunder the 1 indfill cap and will limit use of the property. Because this remedy will result in hazardoussubstances, pollutants, or contaminants remaining on-site above levels that allow for unlimited useand unrestricted exposure, a statutory review will be conducted within five years after commencementof remedijil action to ensure that the remedy is, or will be, protective of human health and theenvironment.
N. DOCUMENTATION OF SIGNIFICANT CHANGES
The Propo >ed Plan for the Site was released for public comment on July 20,2003 The public commentperiod was from July 27, 2003, to August 25, 2002. The Proposed Plan identified, Soil and
90
Groundwattr Alternative S2/G2 (Institutional Controls with Monitoring), Soil Alternative S4 (SiteCover with In Situ Soil Treatment) and GroundwaterAlternativeGS (In Situ Groundwater Treatment).Only one written comment was received on the Proposed Plan, and only a few comments wereprovided in the public meeting. Therefore, it is difficult to determine community acceptance of thealternatives One person recommended in writing to select Alternative G4 - Natural Attenuation forthe entire Site. There were no vocalized objections to any of the alternatives. Of those commentsexpressed, most were related to costs and source of funding for the cleanup. EPA reviewed the verbalcomments submitted during the public meeting, which was transcribed by a court reporter. Based uponthis review, it was determined that no significant changes to the remedy, as originally identified in theProposed P;an, were necessary or appropriate.
However, lour changes are reflected in this Record of Decision that differ slightly from theinformation presented to the public in the Proposed Plan. The changes are as follows:
• Under the Section 'Summary of Human Health Risks From the Site' -an unacceptable cancerrisk exists for the future commercial worker scenario.
• Uncer the Section 'Summary of Human Health Risks From the Site'- an unacceptable cancerrisk exists for the future irrigation worker scenario.
• Uncer the Section 'Remedial Action Objectives - Soil'- The soil clean-up level (cleanup) forAro:lor 1242 is 23 mg/kg instead of 9 mg/kg.
• Unc er the Section 'Remedial Action Objectives - Soil'- The soil clean-up level (cleanup) forMeicury is 9 mg/kg instead of 73 mg/kg.
• Unc er the Section 'Remedial Action Objectives - Soil'- The soil clean-up level (cleanup) forTrichloroethene is 5 mg/kg instead of 54.3 mg/kg.
These changes do not affect the characterization of the Site presented in the RI, the characterizationof Site risks presented in the BRA or the remedy alternatives presented in the FS. Therefore, aspreviously ;;tated, it was determined that no significant changes to the remedy, as originally identifiedin the Proposed Plan, were necessary or appropriate.
91

PART III: RESPONSIVENESS SUMMARY
Only one written comment was received on the Proposed Plan, and only a few comments were receivedduring the public meeting that was held on August 5, 2003. A copy of the transcript will be placed in theAdministrative Record. A summary of the major comments are as follows:
Several people waited to know whether Maple Creek had been affected. RESPONSE: The surface waterand sediment analytical data demonstrate that the Site and adjacent properties to the north may have impactedthe quality of sediments and surface water in the east drainage ditch. However, there are no concentrationsof organic chemical compounds or metals in the sediment or surface water of Maple Creek which exceededthe higher of background or screening criteria. Therefore, there has been no significant impact on thesediments or surfac e water of Maple Creek from Site activities.
One person wanted to know who would make the decision about what alternative to use. The person was alsoconcern about the State of South Carolina's budgetary situation and who would fund the cleanup.RESPONSE: EPA, the lead agency for site activities, and the South Carolina Department of Health &Environmental Control (SCDHEC), will select a final remedy for the site after reviewing and considering allinformation submitted during the 30-day public comment period. EPA, in consultation with SCDHEC, maymodify the Preferred Alternative or select another response action presented in this Plan based on newinformation or public comments. Therefore, the public is encouraged to review and comment on all thealternatives presented in this Proposed Plan. Furthermore, EPA intends to negotiate a consent decree forRemedial Design 2nd Remedial Action (RD/RA) with the PRPs
One person asked questions regarding the source of the funding for the site response action. RESPONSE:The funding for the response actions at the Site have largely come from the Aqua-Tech PotentiallyResponsible Party Group (PRP Group). Under a Unilateral Administrative Order on Consent (UAO), the PRPGroup was obligated to pay for the cost of the Removal Action. Under an Administrative Order on Consent(AOC) for the remedial investigation and feasibility study (RI/FS), the PRP Group is obligated to payUSEPA's oversight costs of the RI/FS as well as the cost of the RI/FS. EPA intends to negotiate a ConsentDecree for Remed al Design and Remedial Action (RD/RA) with the PRPs.
One person was concern about the amount of time the project has taken and wanted to know the projectedproject schedule. PESPONSE: EPAintends to negotiate a consent decree for Remedial Design andRemedialAction with the FRPs. The Consent Decree will require the submittal of a work plan that includes anexpeditious schedule for completion of there remedial action activities. It is anticipated that design activitieswould be completed by Fall 2004. Actual construction activities may commence as early as Fall 2004.
One person wanted to know if there was a methane problem. RESPONSE: A landfill gas assessment wasconducted to estimate maximum landfill gas emission rates and exposure point concentrations. Comparisonof the predicted miximum emission rates to South Carolina's de minimis emission criteria showed that onlybenzene and viny chloride exceeded the criteria. Based on the results of the air dispersion model, theresulting 24 hour average concentrations are below South Carolina Maximum Ambient Air Concentrations(MAACs). Therefore, landfill gas emissions do not pose a significant risk to on-Site or off-Site receptors.
One person wanted to know about chemical injection. RESPONSE: Chemical injection will treat residualcontamination in :;roundwater in a reasonable period of time. There are different chemicals available, witheach effective for different contaminants and groundwater environments (i.e., pH, oxidation-reduction
92

€)
, , -b V U i U 5potential, organic content). For treatment of chlorinated solvents, it has been documented that using oxidants,such as potassium permanganate and/or sodium persulfate, and reductants, such as , such as lactates andvegetable oils, sodium lactate or Hydrogen Release Compound (HRC , a proprietary polylactate compound),enhance biological dechlorination and are particularly effective. Another similar process for enhancedbiological dechlorination include injection of a material similar to molasses. In addition, the chemicals maybe used to treat both groundv/ater and soils. The process is completed in the ground, with no process residualsformed requiring handling or disposal.
One person recommended in writing to.select Alternative G4 - Natural Attenuation for the entire Site sincethere is no current risks (although there are future.unacceptable risks) at the Site. RESPONSE: Based onthe RI, BRA and the ERA, the Aqua Tech Site poses future unacceptable risks to several receptor populations(future child/adult r< «idents,-eommercial, irrigation and construction workers). Therefore, the response actionselected in this Rec 3rd of Decision is necessary to protect public health or welfare or the environment fromactual or threaten re leases of pollutants or contaminants from the Site which may present and imminent andsubstantial endangerment to public health or welfare.
93

PART IV: REFERENCES
All documents reviewed are included in Appendix G of this ROD.
94

f, .-• r- r-'J ! 05
APPENDIX A
FIGURES 1-7, 9-37

5 9 . U b
h-,;-,;&*?; y-.^v
USGS GR iER. SOUTH CAROLINAQUADRA OLE. PROVISIONAL EDITION 1983. Figure 1
SITE LOCATIONAQUA-TECH, INC.
Greer, South Carolina13926-00<0(8)GN-AT001 MAY 28/2003
Figure 1

AQUA-TECH CORPORATIONSC7F
w -i-\ t caEBnrotraa' \ '• |NsJUr= „ - ? :^0aoa ARtM i [.' / !
-.-t'T'tftjij_____XI--M i«kJiL -=i • ITT^
ZT* O33TMO COWtDl PM
* "O PRDOUCTCM Hli
0 60 ISOft
p*___________________-imQQ^v^-ATtt»g ggfc oay^o fl.
SITE PLAN ANDOPERATING AREAS
AQUA-TECH INC.flnw/; 5a&M Carolina
un
vo
CD\
CD
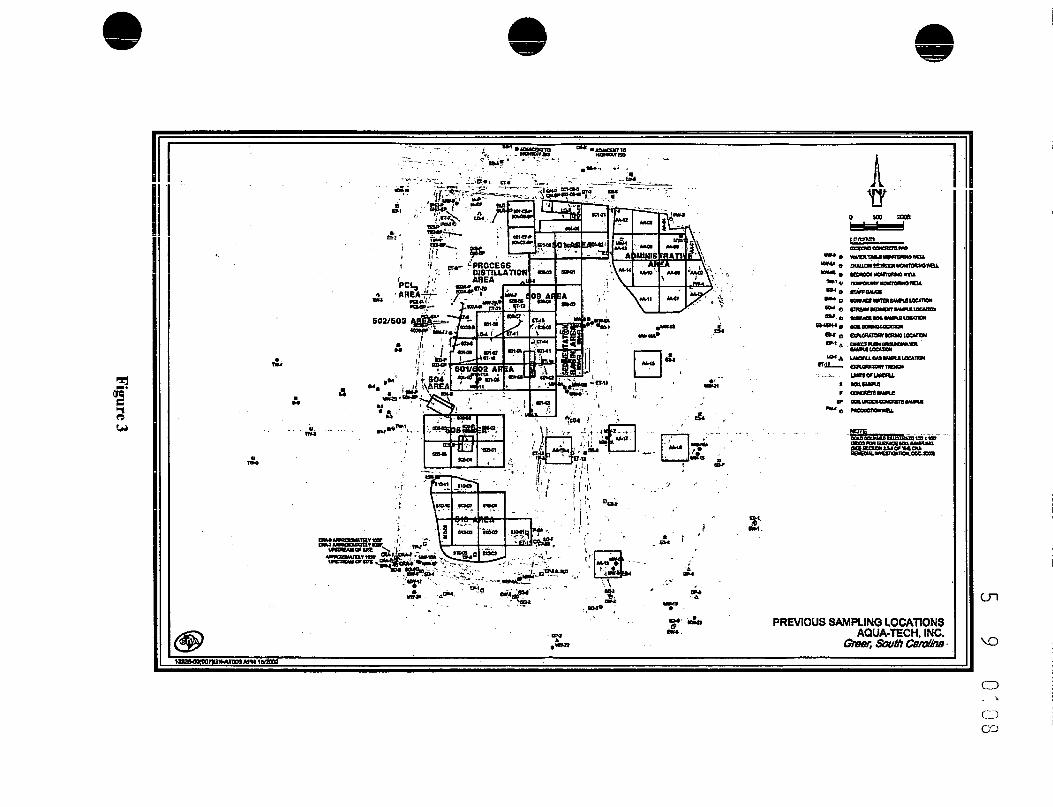
ff3u>
A
* r-. •'."• _____• «*•*•
* • ' f ; W v - ' •''< ,' • • i I „' .
**L, «M« "T
DAff
.-5.
1Tf
o un am
t Manama mil
cu eaaMsameaa
"iJ——
tuusataovpt'
PREVIOUS SAMPLING LOCATIONSAQUA-TECH. INC.
. South Carolina •
cn
CDCO

1*>.
/ V • l:'. ' .JSi -' l££g£::LfSup ~ ADiMSHpW^JM-sk'BSSSRioif'oK. *.» ^ i \V^« ??*,*, j«
• - 1 -TJ - — .** rf&M
MONITORING WELL LOCATIONSAQUA-TECH. INC.
Creer, South Carolina
vo
CD^
CD

ff
- -• .;. •;-.,_ • .Cliyjn** " ' IFiawiftFYXlrVKVWW!«lrtf«..*es,fr ' "''aft^.1 *"£•". — •- ' - . . ._ 1" ".x, J ^if^^^ai.
• "ViJii ' 11'yg-—i^gr ' ''''''''• ' —• M-'-g' tiS''' '-ay' 7——""^"T '.
j, £ ' / f 'M ' |:T^S^ -=*a
^^ l r^ ln0 G
1 i / i . »f«"*3?3! iSakiK=D •"^£" '"""• iJU^W'*" iniiitJ «, A .^PROC'fiSS
i*- i»M% ntsntUATIpM •*»<•• m°>i -i J,<?';«**. MSraUATIpM.'.'»~v i.1' ' \*9H<S _£&>">;f»cOj ,j.i w^fB.;i,piA--. »n«« frJ? g--.^e*-w%- !:.„, . _
602/603
I,jftBlpiM-/M, \*'«i*l
i Vl ^,*--" 3r&_——
.=«3^ >.«* • •"£--',! fp/^^^^;4iiBb^L^feH-fc M.HrU * VM .... . jutUv...^ C.— -i 1 •W>s i p«l
.w» : rai" «•'•" - i-l ' ' :i"*T -r J~ wi^f i raw •—•• IB I'.vi^'. 'D z lit
I (
(• * V «u •> . n V-ii . C ?" V Dl *& 'd* »**.W 1 '.
.! ui»l.v« .**'•
•«=,
'«* t$nfflfi,\ J'"1"---^' -i^•jf/A\ v'•' •/-a'^-e-.,->>;:•.'.rfi-'
••'•'*J!S*•A,,
••IK. ,
SS4WM ^ caLMtaKCttttKPCM
DECEMBER 2001SOIL SAM RLE LOCATIONS
AQUA-TECH, INC.(Steer, South Carolina VO

soKT
"•=. WAItH TABLE UOWTDRMO «U.'" "^C SHALLOW BEDROCK HCWTOWHQ HELLf"~^., esKCOE usHTcrau BELL
ei-i_« ___._.,._ - — - -
8*-4« SURFACE WATER SAMPLE LOCATION®>-** ratAy 6EMUENT 9AWPIE LOCATIONS9~7a SURFACC SOL SAMPLE LOCATION^^B SOL BO«W LOCATIOMCD-2Q (WLOftATORY OOHNO LOCATION
2*-'» CSECT FU3K _ _SAMPLE LOCATION
•1 j7 j tO-V LANDFOi CAS 9WPLE LOCATIONCXROfUTORY TRENCH
_— _ _ mar; or uworai'•maA-^ 8 60H SAMPLE
il & P CONCttTE UUPIELMOCft CDNCRCTE SAMPLE
-rf-i j f ui^u -• J \1
CKERADON•p** H £ r %Amc*K.l& »•\fifl?! SP SOLWO>W>/ / "»--•, FV.C-JCl.-u
"•'TJiU. f.
C$=—0 SO 150ft
CRA
SOIL SEDIMENT, SURFACE WATER ANDLANDFILL GAS SAMPLE LOCATIONS
AQUA-TECH INC.Greer, South Carolina
13926-10(002)CN-AT030 DEC 06/20OO
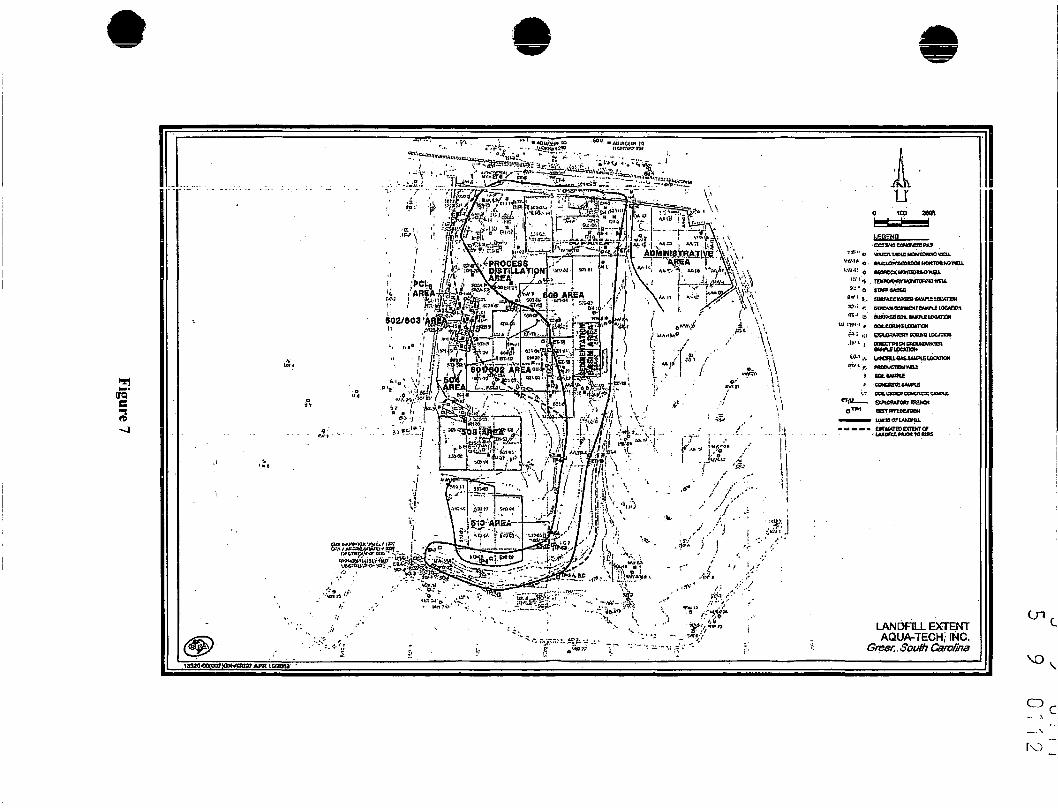
sTO"
LANDFILL E>CTENTAQUA-TECH; INC.; South Carolina
Cn
\o
CD— \
__.\
rv>

"'Saw1' •'•' '' '•'
5^O
teeeKO.KW4 * BMEftt«ieMWTOSt.OV.at
U^M'» pwuwotr*wiafJKbNTWJscwai.
GEOLOGICAL CROSS-SECTION LOCATIONSAQUA-TECH, INC.
. Greer, South Carolina

era1
cn
VOTER LEVEL OMA OCUECTEO ON AWE 2». IMS.
GEOLOGICAL CROSS SECTION A-A1
AQUA-TECH, INC./; South Carolina
CD

o
B'
WAIBILEVB. OATACOUECTEO ON AflE Zi. 1933.
i GEOLOGICAL CROSS-SECTION B-B1
I AQUA-TECH, INC.' Greer, South Carolina
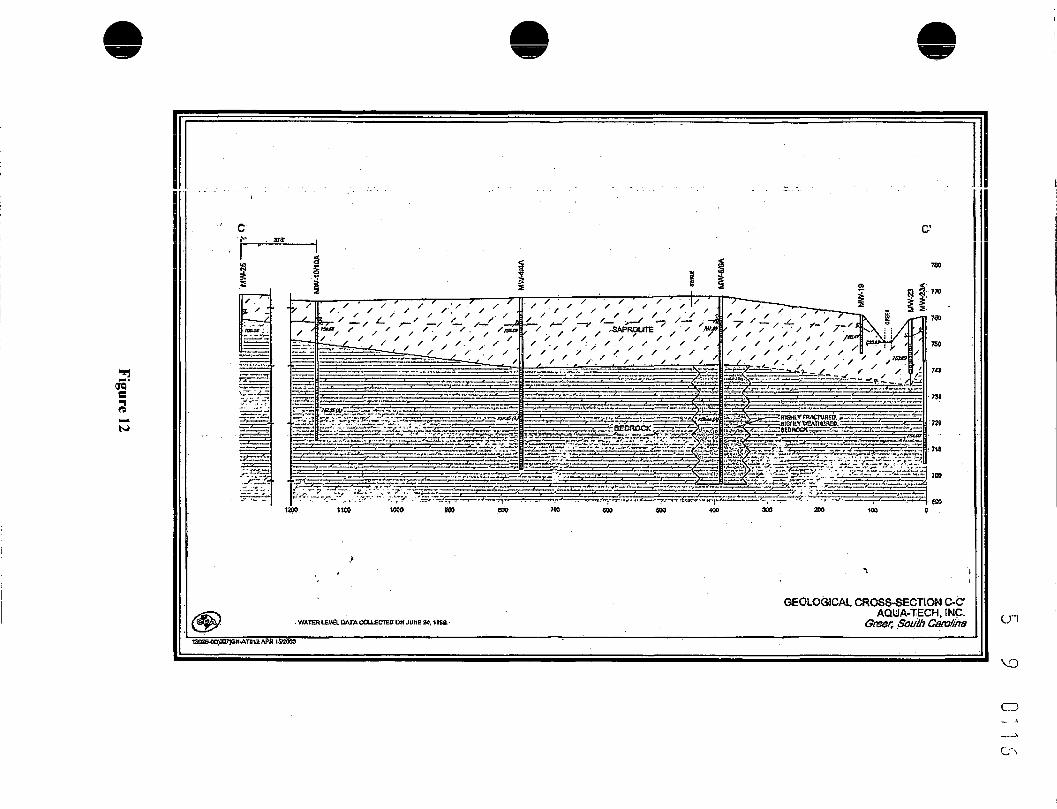
f
1200 ttCO
. WATER tEVei CWXFACOUHCTEn ON JUMC 34. lfifi& •
iSHUKpoiyan-ATniaAPK 192009
GEOLOGICAL CROSS-SECTION C-CAQUA-TECH, INC.
Greer, South Carolina

£1
MW-OTA
0 6

TO
3
0 400 1200ft
LEGEND31 B RESPONSE IDENTIFIED *ELL
89* NO RESPONSE
72 9 SAMPLED APRIL 11. 2000113-ROB1NSON RD. A: 471 R03NSON RO.72-ROBINSON RD. B: 487 ROBINSON RD./
489 ROBINSON RO.
SOURCEUSOS GREEK. SOUTH CAROLINAQUADRANGLE. PROVISIONALEDITION 1983.
WATER WELL LOCATIONSAQUA-TECH INC.
Grver, South Carolina1J926-IOt002;CN-AT002 DEC 06/2000
CD
_ _ ,\CO

fl'
0 100 2000
l=4siisaaio
74O———"
{74L4OJ
LBOTOFUKFtL
TOP OF BEDROCK CONTOURSAQUA-TECH, INC.
Greer, South Carolina13a2»40(a>7)SNvtTCI4 APR VOXB
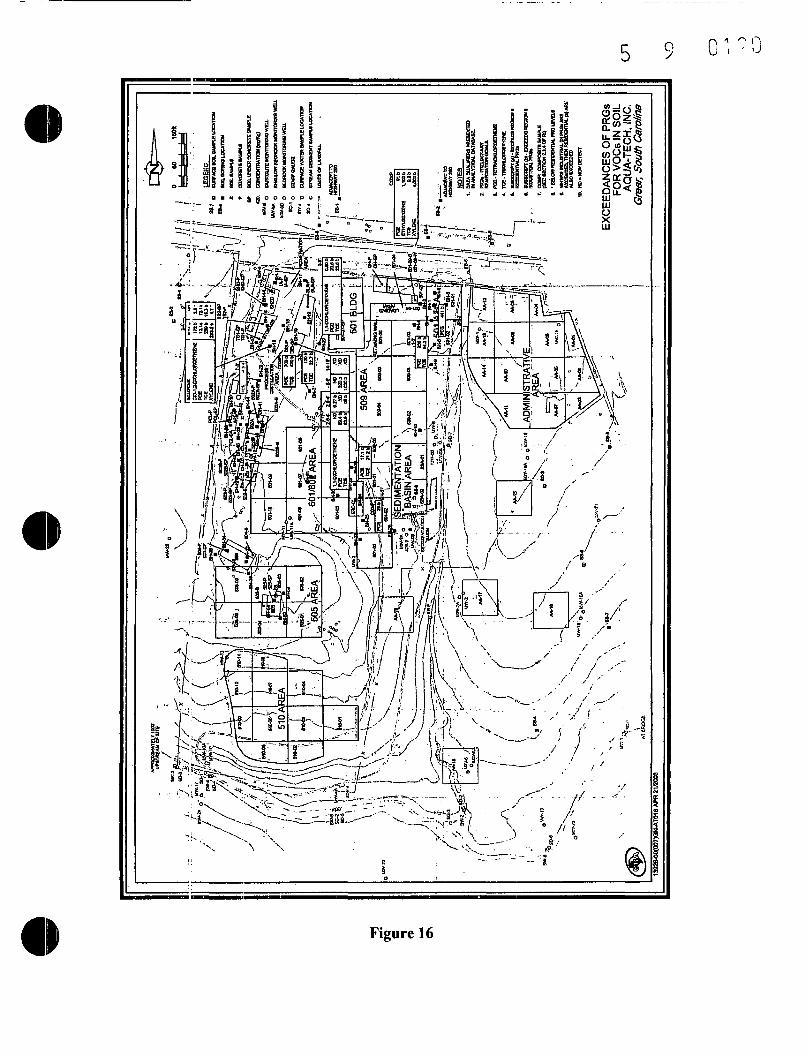
5 S 0 1 - 0
Figure 16

3TO"
EXCEEDANCES OF PRGsFOR SVOCc IN SOIL
AQUA-TECH, INC.Giver, South Carolina
13S2aoO(OQ7)Gf4-AT018 APR 15/2003

00
//7WiVf( (//.' ;/*////JL\A-V*law-w
O StMLQW BEDROCK MONCTORWOWEU.
H SURFACE WATER OttiSJELOCWDN
LOCATION
EXCEEDANCES OF PRGsFOR PESTICIDES/PCBs IN SOIL
AQUA-TECH, INC.Greer, South Carolina
CD
1010

LEGENDO 8UWACS 600. S«AfU LOCATION
• BCXL SORNO LOCMTKVt0 SOtCIMFU
EXCEEDANCES OF PRGsFOR ALUMINUM IN SOIL
AQUA-TECH, INC!Greer, South Carolina
CD
O-J

era
' Vifi^O « ^'B^^——.(T! r* It It B9-7 *i0a«>viam
^ SEDIMENTATION ^•«"«•- ' /»
EXCEEDANCES OF PRGsFOR ARSENIC IN SOIL
AQUA-TECH, INC.; South Carolina
13B2&00(C»7)GN-ATO32 APR 23J2O33
c_n
vo
CD
ro-L: .
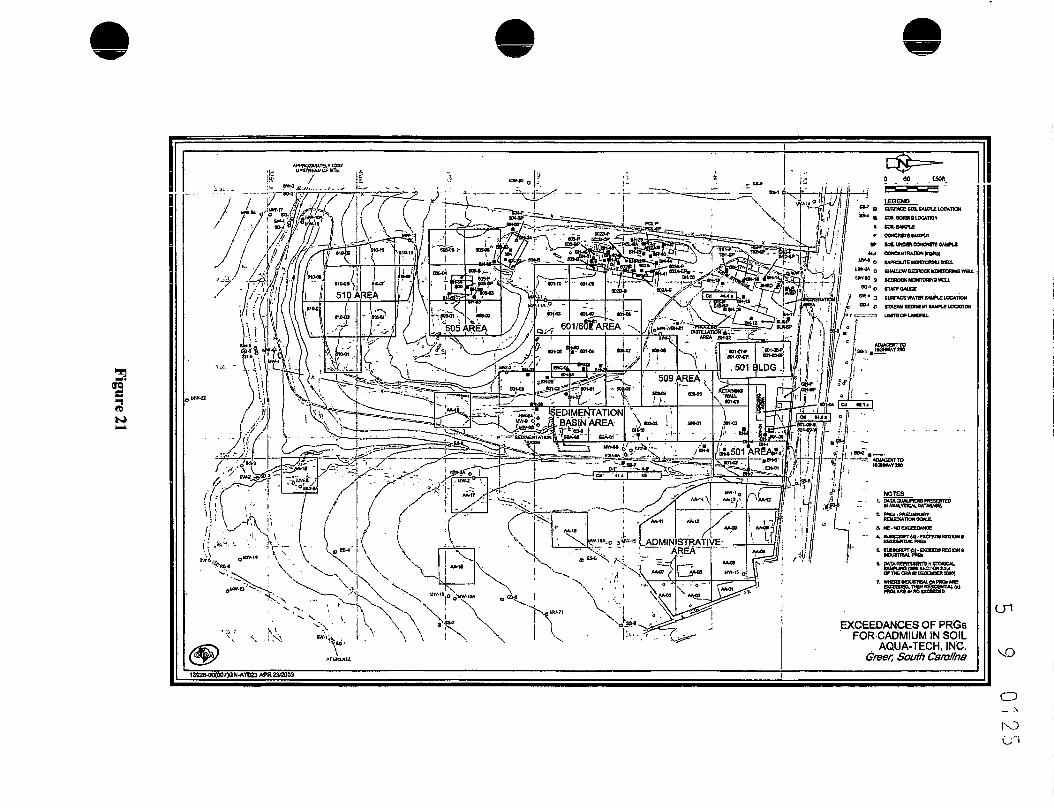
*3ff
iij UPSTREAt/OFttTE
IB /;._ «« 'LEGENDSURFACE COL MMrtB LOCATIONSOIL BORHO LOCATION
CONCRETE SAMPLE
•Ot WBGR OONCRETe 6M*1£
CONCEKTR«JON(BO*WaWHQUTC MOWTDWia WKt6MM1CW BEmOCK KOMTORHO WOEOROCK MOKTOHmi HELL
m awpic LOCATION9THEAU BEDIUENT UUPLB LOCATION
EXCEEDANCES OF PRGsFOR CADMIUM IN SOIL
AQUA-TECH, INC.?/; South Carolina
CD
cn
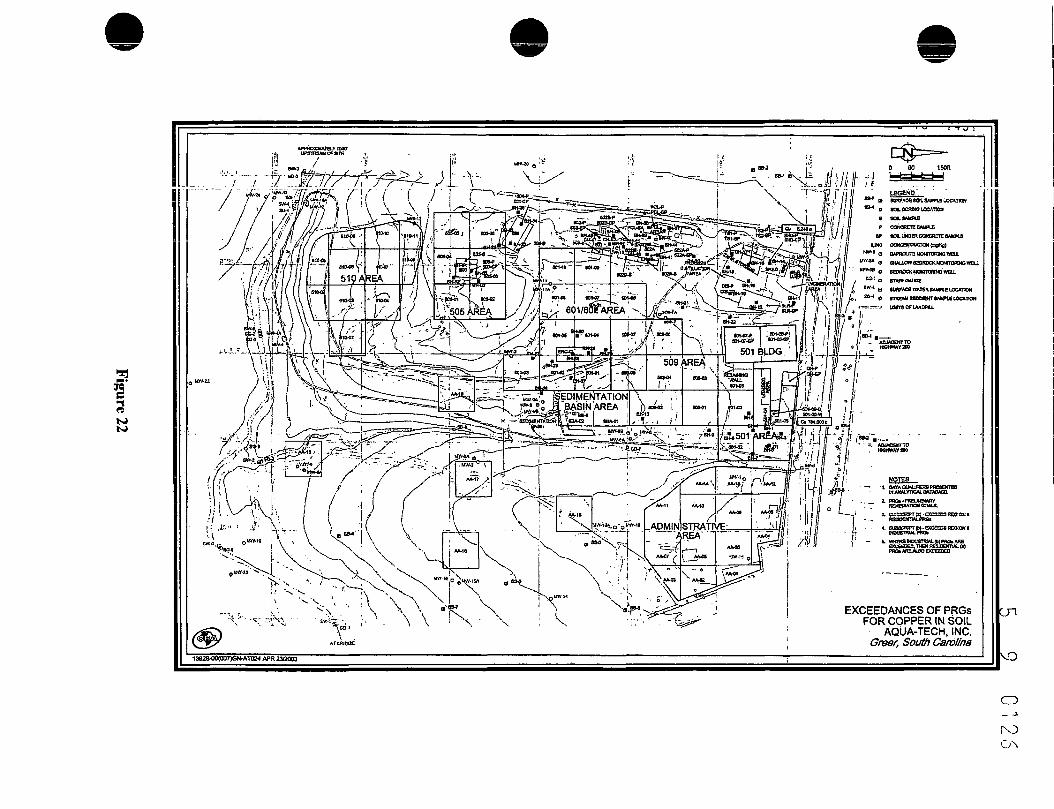
•"3
ff
6HAOOW BEDROCK UCNm»«NO WElt
EXCEEDANCES OF PRGsFOR COPPER IN SOIL
AQUA-TECH, INC.Greer, South Carolina
CD_ ^
ro
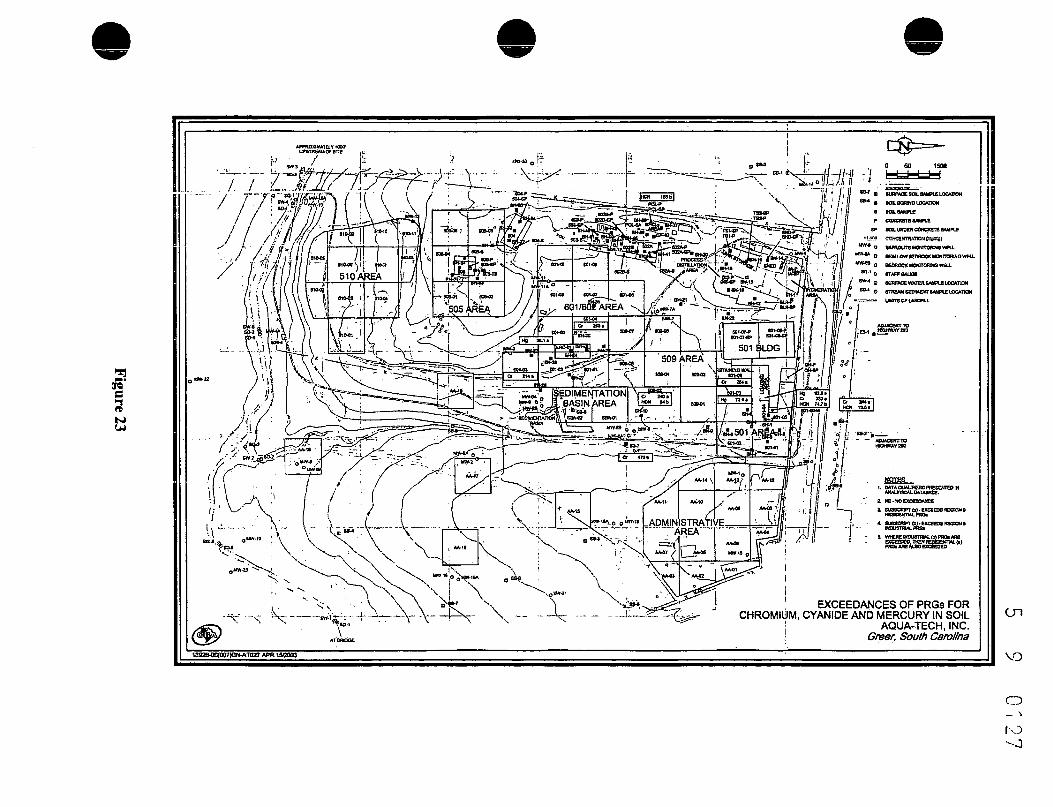
s3U»
O BAPfiOUTBMOMTWCWWU.MV*'ak O SHALLOW
*IW*° 0 BEDROCK ttQMTORMQ IVBi.30-1 O BTAFPQAUOC
SWM S SimRKCeWXTEfl&MIPLBLOCATtON
EXCEEDANCES OF PRGs FORCHROMIUM, CYANIDE AND MERCURY IN SOIL
AQUA-TECH, INC.Greer, South Carolina
«a»00(l»7)gN-ATIttT APR 1SZKO
CD__ \
ro

Q n * n o> U i /. o
Figure 24
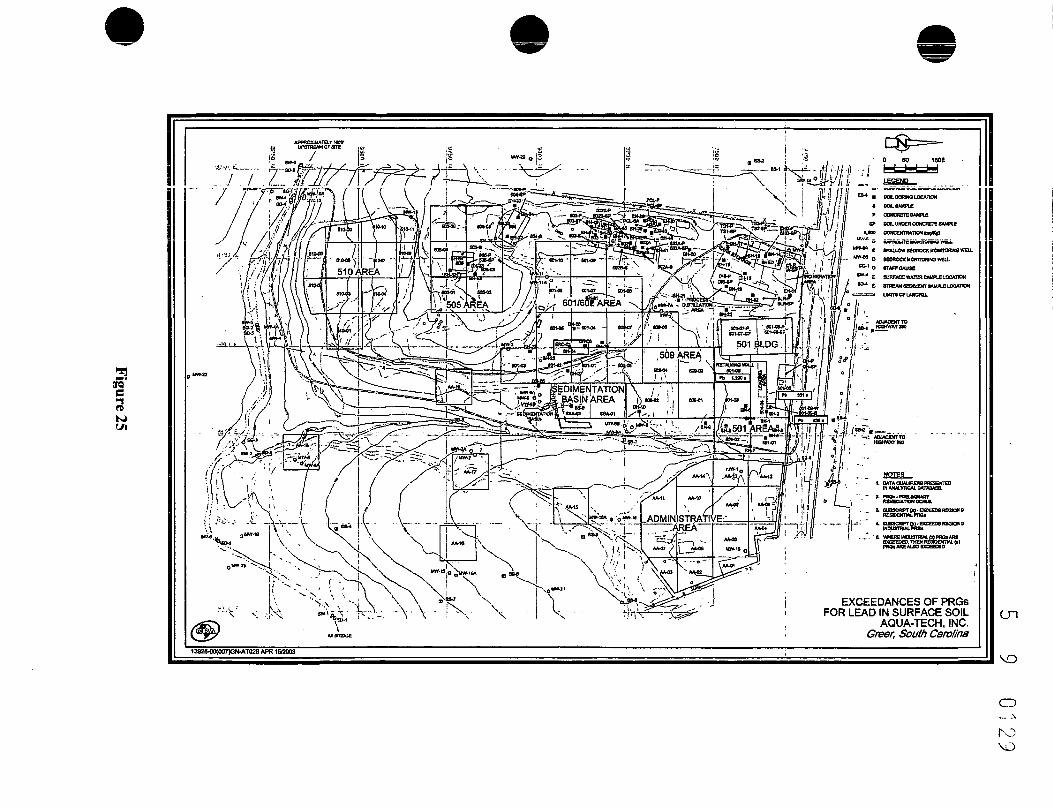
ISTO*1Ul
NOTES• Ot ANttynCAL DATAOASS.
" - I Pttfe-raBUKMARY^ " RSUEOUTIONCCMia
- * 6UW«?TW1eaCHD9REQ»»t«
EXCEEDANCES OF PRGsFOR LEAD IN SURFACE SOIL
AQUA-TECH, INC.Gree/; South Carolina
\o
CD

.; SSTiiu CONCRETE FAD* WXT0* TABLE tt»«TORN3WQi
BEDROCK KOWTWWG waxO BEDROCK MONrTDRHO OKU
J ESTIMATED VAU«S AIWIYTEOCTECTED W WHUOD BLANK
N9 fCTflAMPLED
MA f«3T««iVZSJ
TETRACHLOROETHENE ISOPLETH FORSAPROLITE GROUNDWATER-DECEMBER 2001
AQUA-TECH, INC.; South Carolina" " " ^^^^—^ '
00(<J07)G»lATa29 APR 23/2003
CD— .i

BUI/QJB3 Iff nog JBBJQ•ONI 'Hcai-vnov1.003 ysawaosa - i a //T-ainoHdvs «r/<4<«$&>/cS\m ^'\^•/S.sJ v ],.- ,
A ^ \>)(/"^ \\\- f /
""tES^ssSfes^S—j ^= -==^^4 jL]./r ^, "j ~ . ,OM*VMiroW , . O^WWSW1 *- :——l2f,' j, , tj l.-tuiMSavrmc,^, ,, eiiSSoBWn^ ~f
9

era
1ts>OO
B C BEDROCK KOHCTOKKQWai.
SURFACE WAinteWPLB LOCATION
ne LOCATION
s LOCATK«
SB-i Q etPLORXTOAVBORHOLOCAnOM
DP-1 i ORECTPU8NOROUNDWHEASAMPLE LOCATION
"*•'.-. LANOFtL«Afl SAMPLE UXADOH1'JZ ——— BQVJRATORYTPBCH
.-r=-=a LMfTBOFUIMOFU.
GP IOL UNDER CONCRETE BAMfU
U KOTOJ ESTBMIED VALUE6 ANN.YTE DETECTED 04 METHOD 8UMC
NA MOTAHV.Y7ED
TOTAL VOC ISOPLETH FORSAPROLITE GROUNDWATER - DECEMBER 2001
AQUA-TECH, INC.Greer, South Carolina
cn
1392<MO(a07)GN-ATD2fl APR 19/2003
CD_ A
OJto

o qe
CONCEKTKAnON«3gIl4tat cot(COflTunoj«cxcta»THEPEtoiu WTOETBCTED
VALUE-.
ft •/' TETRACHLOROETHENE1SOPLETH FOR BEDROCK
GROUNDWATER- DECEMBER 2001AQUA-TECH, INC.
Greer, South Carolina
CD

2orq'
a CONCRETE PAD
' o WATTS TAfliEMowroraowai* • SHALLOW BCOaOCKMONtTORMG WELL
t*'' O BTWVGAUGCw' s euwAcemTBFiBAM'Le LOCATION^ <5 STREAM SCDMEMTBAMU LOCATION
S"f D SURFACE SOIL OAMTLC LOCATDH
H*-? 5) GmOKATOKV 8ORMO LOCATIONOr>'> j. CHREETPUWQHOUflJWATER
SMffLB LOCATTONLG-; .
EXPLORATORY TREHCH* UMTOOFLAKQRU.
a soi.aA«PLEP CONCRSTESAKPLE
Cf> OOlUKDCROOHCRETEfiWOU
TSrJtt) OOKCEXTftMlON (ujAJ
ttO OONO£WTRATtONEXCCEIIBT>CPROs" U" MDTOEtBbTH)
J C9TUNATEO VALUEB MMLYTEDEIBnEDW METHOD BLANK
MS NOTBUCPLEO
*M NOTANALYZEO
' TRICHLOROETHENE ISOPLETH FORBEDROCK GROUNDWATER - DECEMBER 2001
! AQUA-TECH, INC.Greer, South Carolina
cn
13ffi840(007)GN-AT033 APR 23/2003

*• \1*
tfX NA *'X^"*\ I I • ' ; / '"'N,," "'" *, iiSi|~"' - • - — — - -'-^f{ -NX 111 -I ^
^v i|||5
\Jf _-——-^^^r*?:
III!
, , *? L Iff ! i l5 » B ^ t g i j a 9 •«. » jj I > ! - i 3 o u
0 6

5 9 nU
PCS TETRACHLOROETHB«ECONCENTRATION (ugt)
TCE TRICHLOtTOETHENE' CONCENnWTION (ugj.)
BIS BI8(2-E1VIYLHEXVL)PHTALMEi; CONCENTRATION (ug/L)
U COMPOUND NOT DETECIH) ATOR ABOVE SPECIFED VALUE
J VALUE IS ESTMMEO
ma CONCEmRATKM EXCEEDS PRQ»
PHOFC«PCE-SU(|*.PR8FQRTCE°5uglLPRSFORBIS-eiloA.
PROFILE VIEW OF ORGANICCHEMICAL INDICATORS IN GROUNDWATER
AQUA-TECH, INC.Greer, South Carolina
Figure 32

3era'1
LEoennSURFMt WA1W SAW UMATEOH
s>-»e msEAM oman UMPU UCAIKWSOL Bona LOCAIUR
ponxxiunw ocm» THS r\l MOT QE1ECTZD>: &APRQU7E UCNTCRMQ KLL0 sjuuoif ennwa uowroiora usu.
S3-? % aorta st*. siwu UXATOM
? OOKREIl SAKPUSOL IMffit CWOKIE UKUmm oruwna
- PREUUNMT meMTOu mus.
CRA
ORGANIC CHEMICALS DETECTED INSURFACE WATER AND SEDIMENT
AQUA-TECH INC., Swift Carolina
1392fl-10(002^»!-AT02S DEC 06/2000
CD
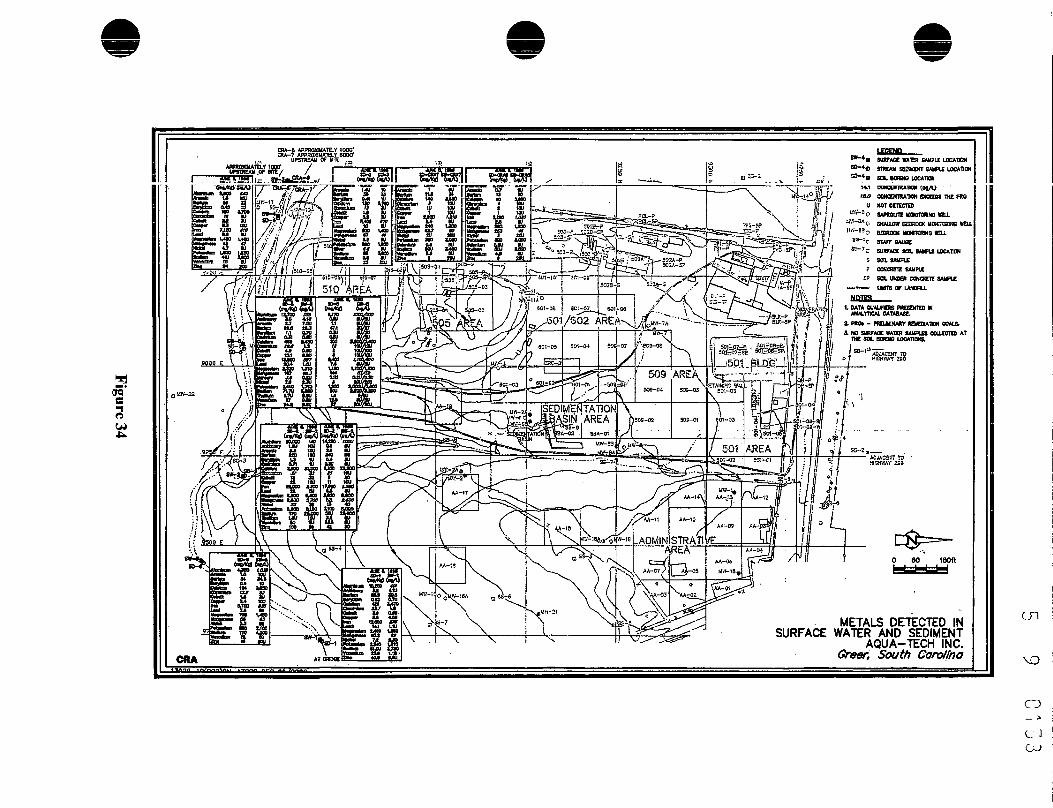
SURFACE WATER SAMPLE LOCADCM®-4e STREAM SEDUEMT 8AMU LOCATION
O EOL KBWO UJCATOHM ODMCanRAWJH ItJflA? " *1" COHCOfntATtON EXCEEDS THE fftOU NOT DETECTEDO SAPROUTE IIOBTOBMO WELLo auiifl* 6£DRoa< ycwmHwc veilO BEEROCK UatTORIMO KU
C SURFACE SOO. BAMPl£ UCAHON
? coiitsm CAUPUCP SOL UKO (XNCREn UKU
IHTBCT UUOHU.MOTg!
1. DATA OUAUFKRS ngSOfTCD M
NO SURFACE MMZR 1U0U3 COOfCIlD ATTHE SOL KXOU LOCAHCKJ.
CRA
METALS DETECTED INSURFACE WATER AND SEDIMENT
AQUA-TECH INC., South Carolina
C-JOJ

aera
C/l
.*•/
::!M:: .v...... ...:•....#-«' . ..,/
• : - - , A-: • - , f.-:. ' ' -t
Six if1. ::!': 1' .iM ;.'f: ::
; •:$. ;•;il3;..;V
D^:*r«i..
"•****** ——————— -
•»:.... .;-,:,,.
f
-:fe:-l.-.: ":: ;i!j
•"ri, .•„.••«
i n ^i- U o

aorsi
":.;l£J;:... i. tv i/.
RCRA C• MOTTO scaue
vi.l ,
D COVERNOTTOSCiWiE
tls}(;
.en
VQ
CD_ ,1

3w*
502/509TEND COVER OR CONSOUCMTC CM £TC ,1 SKri3»—<J* *TO BE OETB1UNED DURING RD STAGE)-2-f;—.'» "Wsj]Ml«l»* •'-Trrw^S
.?-•;' p^£*T~"l X^__-!».»• (- (ctigr-'f*«Wft,U«>ot -I
BaamjxivEH QRooigpigME ON arc
,(<.>-0«l*tr.)Ar.l*'t;.-t 'v<K•(>* / AtfRf.iv<w>nir tft.v*,Tvt?ari.«>I. -.^^wwwfcy-erf ^•T-j.-cj-AMr! rm .
TEST HT LOCATCK
UffTSWUMWU
PREFERREDREMEDIAL ALTERNATIVE
AQUA-TECH, INC.Greer, South Carolina
\302&OD<008)CM-ATCB6 OUN 002003
CD

ft>'
APPENDIX B
DATA TABLES (for all environmental media]

Appendix BData Tables

eTable B-l
Background Data for Various Environmental Media at theAqua-Tech Site
Analyte
AcetoneAldrinAluminumAnthraceneAntimonyAroclor-1242Aroclor-1248Aroclor-1254ArsenicBariumBenzeneBenzo(a)anthraceneBenzo(a)pyreneBenzofbjfluorantlieneBenzo(g.h,i)peryleneBenzo(k)fluorantheneBerylliumBHC. alpha-BHC. beta-BHC. dclta-BHC, gamma- (lindanc)Bis(2-chloroethyl)etherBis(2-ethylhexyl)phthalateBromodichloromethaneButanone, 2-ButylbenzylphthalateCadmium
Sample /Location DateSURFACE SOIL
SS-1G/2/98
n -37 ll0.0055 U0.0018 U17,0000.37 U1.1 U
0.037 U0.037 U0.037 U
3.132
0.0011 U0.37 U0.37 U0.37 U0.37 U0.37 U0.33
0.0018 U0.0018 U0.0018 U0.0018 U
0.37 U0.37 U
0.0011 U0.0055 U
0.37 U0.11 U
SS-2G/2/98
n an 1 10.0059 U0.002 U37,000
0.40 U1.2 U
0.04 U0.04 U0.04 U4.764
0.0012 U0.4 U0.4 U0.4 U0.4 U0.4 U
0.640.002 U0.002 U0.002 U0.002 U
0.4 U0.4 U
0.0012 U0.0059 U
0.4 U0.12 U
SEDIMENTSSD03
G/17/92NR
0.012 U0.0019 U1,620 *NR2.5 UNR
0.037 U0.037 U0.76 U12.7 U
0.012 U0.37 U0.37 U0.37 UNR0.37 U1.3 UNRNR
0.0019 UNRNR0.37 UNRNR0.37 U1.3 U
SD039/8/92
N R0.012 U
0.0022 U2,520 *NR5.6 UNR
0.043 U0.043 U0.35 NU
15 B0.012 U0.41 U0.41 U0.41 UNR0.41 U0.31 BNRNR
0.0022 UNRNR0.41 UNRNR0.41 U0.53 U
SD03 SD0312/8/92 4/G/93
NR NR0.012 U 0.013 UNA NA
1,370 E* 2,690 *NR NR5.3 U 3.2 UNR NR0.04 U 0.043 U0.04 U 0.043 U0.43 B 0.47 U11.3 B 20.1 B
0.012 U 0.013 U0.068 J 0.11 J0.082 J 0.077 J0.08 J 0.11 JNR NR
0.082 J 0.087 J0.23 U 0.19 BNR NRNR NRNA NANR NRNR NR0.4 U 0.43 UNR NRNR NR0.4 U 0.43 U
0.69 U 0.38 U
SD03G/23/93
NR0.008 BJ
0.0021 U1,640NR2.6 NUNR
0.041 U0.041 U0.77 U19.5 BN
0.003 J0.41 U0.41 U0.41 UNR0.41 U1.3 UNRNR
0.0021 UNRNR0.41 UNRNR0.41 U1.3 U
SD039/29/93
NR0.003 BJ
0.0026 U3,520NR3.2 NUNR0.05 U0.05 U0.96 U30.4 B
0.012 U0.5 U0.5 U0.5 UNR0.5 U1.6 UNRNR
0.0026 UNRNR0.36 JNRNR0.5 U1.6 U
SD0312/20/93
NR0.007 J
0.0022 U1,720NR2.7 NUNR
0.043 U0.043 U
0.8 U13.4 U
0.013 U0.43 U0.43 U0.43 UNR0.43 U1.3 UNRNR
0.0022 UNRNR0.43 UNRNR0.43 U1.3 U
SD-36/8/980.47 U0.007 U0.0023 U4,3000.47 U1.4 U
0.047 U0.047 U0.047 U
1.4 U35
0.0014 U0.085 J0.07 J0.47 U0.47 U0.47 U0.41
0.0023 U0.0023 U0.0023 U0.0023 U
0.47 U0.47 U
0.0014 U0.007 U0.47 U0.14 U
SD-0097/8/99
NANANA
1,840NA0.5NANANA
111.6NANANANANANA0.3NANANANANANANANANA0.5
SD-0117/8/99NANANA
2,220NA
U 0.5 UNANANA0.713
NANANANANANA
U 0.3 UNANANANANANANANANA
U 0.5 UFootnotes are presented on the last page.
Page 1 of 8

Table B-lBackground Data for Various Environmental Media at the
Aqua-Tech Site
Analytes.., -,.._.CarbazoleCarbon disulfideCarbon tetrachlorideChlordane, alpha-Chlordane. gamma-ChlorobenzeneChloroclliancChloroformChromiumChryseneCobaltCopperCyanide, totalODD. 4.4'-DDE, 4.4'-DDT. 4.4'-Di-n-butylphthalateDi-n-octyl phUialateDibenzofuranDichlorobenzene. 1,2-Dichlorobenzene, 1,4-Dichloroethane, 1,1-Dichloroethane, 1.2-Dichloroethene (total). 1,2-Dichloroethene, 1.1-Dichloropropane. 1.2-Dieldrin
Sample /Location Date3
SURFACE SOILSS-1
C/2/98icr>
0.37 U0.0022 U0.0011 U0.0018 U0.0018 U0.00110.0022 U0.0011 U
190.37 U1.112
0.55 U0.0037 U0.0037 U0.0037 U
0.37 U0.37 U0.37 U0.37 U0.37 U
0.0011 U0.0011 U0.0022 U0.0011 U0.0011 U0.0037 U
SS-2G/2/98
i on
0.4 U0.0024 U0.0012 U0.002 U0.002 U0.0012 U0.0024 U0.0012 U
280.4 U2.213
0.59 U0.004 U0.004 U0.004 U
0.4 U0.4 U0.4 U0.4 U0.4 U
0.0012 U0.0012 U0.0024 U0.0012 U0.0012 U0.004 U
SEDIMENTSSD03
G/17/921 97 M
NR0.001 JNRNRNR
0.012 UNR
0.0007 J11.5 *0.37 U12.7 U5.1 U3.2 U
0.0037 U0.0037 U0.0037 U
0.37 U0.37 UNRNR0.37 U
0.012 U0.012 U0.012 U0.012 UNR
0.0037 U
SD039/8/92
T> n o
NR0.012 UNRNRNR
0.012 UNR
0.012 U10.8 '0.41 U2.6 B3.9 B6.4 U
0.0043 U0.0043 U0.0043 U
0.41 U0.41 UNRNR0.41 U
0.012 U0.012 U0.012 U0.012 UNR
0.0043 U
SD0312/8/92
inc D
NR0.012 UNRNRNR
0.012 UNR
0.012 U6.8
0.083 J1.3 B2.1 U5.9 UNANANA
0.092 BJ0.4 UNRNR0.4 U
0.012 U0.012 U0.012 U0.012 UNRNA
SD034/G/9370 * D
NR0.013 UNRNRNR
0.013 UNR
0.013 U15.1 N0.13 J
2 B1.8 B3.2 UNANANA0.43 U0.43 UNRNR0.43 U
0.013 U0.013 U0.013 U0.013 UNRNA
SD03G/23/93
i ->n »! i
NR0.014 UNRNRNR
0.003 JNR
0.005 J8.4 *
0.41 U12.9 U5.1 N*U3.2 U
0.0041 U0.0041 U0.0041 U
0.41 U0.41 UNRNR0.41 U0.0220.003 J0.13
0.003 JNR
0.0041 U
SD039/29/93
IC* D
NR0.012 UNRNRNR
0.012 UNR
0.012 U11.6 *0.5 U15.9 U6.4 'U4 U
0.005 U0.005 U0.005 U
0.5 U0.5 UNRNR0.5 U
0.012 U0.012 U0.012 U0.012 UNR
0.005 U
SD03 SD-312/20/93 6/8/98
19^ II i rjn
NR 0.47 U0.013 U 0.0028 UNR 0.0014 UNR 0.0023 UNR 0.0023 U
0.013 U 0.0014 UNR 0.0028 U
0.013 U 0.0014 U6.3 13
0.43 U 0.089 J13.4 U 1.85.3 U 3.53.3 U 0.7 U
0.0043 U 0.0047 U0.0043 U 0.0047 U0.0043 U 0.0047 U
0.43 U 0.47 U0.43 U 0.47 UNR 0.47 UNR 0.47 U0.43 U 0.47 U0.013 U 0.0014 U0.013 U 0.0014 U0.013 U 0.0028 U0.013 U 0.0014 UNR 0.0014 U
0.0043 U 0.0047 U
SD-0097/8/99
1 Af\
NANANANANANANANA
9NA
1 U11 U
NANANANANANANANANANANANANANA
SD-0117/8/99
cn
NANANANANANANANA
4NA
211 U
NANANANANANANANANANANANANANA
Footnotes are presented on the last page.
C.'
Page 2 of 8

Table B-lBackground Data for Various Environmental Media at the
Aqua-Tech Site
AnalyteuicinyipmnaiaieDinilrotoluene. 2.4-Endosulfan IEndosulfan IIEndosulfan su!fa!eEndrinEndrin aldehydeEndrin keloneEthylbenzeneFluorantheneHeptachlorHeptachlor epoxideHcxanone, 2-Indeno(l ,2.3-c.d)pyreneIronLeadMagnesiumManganeseMercuryMethylene chlorideMethylnaphthalene, 2-Methylphenol, 4-NaphthaleneNickelNitrophenol, 2-Nitrosodiphenylamine. n-PentachlorophenolPhenanthrenePhenol
Sample /Location Date3
SURFACE SOILSS-1
6/2/98« „„ . ,U.OI W
0.37 U0.0018 U0.0037 U0.0037 U0.0037 U0.0037 U0.0037 U0.0011 U
0.37 U0.0018 U0.0018 U0.0055 U
0.37 U14,000
1855041
0.130.0011 U
0.37 U0.37 U0.37 U
40.37 U0.37 U0.91 U0.37 U0.37 U
SS-26/2/98
„ t , TU.I V
0.4 U0.002 U0.004 U0.004 U0.004 U0.004 U0.004 U
0.0012 U0.4 U
0.002 U0.002 U
0.0059 U0.4 U
22,00025
91061
0.12 U0.0012 U
0.4 U0.4 U0.4 U100.4 U0.4 U
0.99 U0.4 U0.4 U
SEDIMENTSSD03
6/17/92x >*-»i 1 1\
NRNR
0.0037 UNRNR
0.0037 UNRNR0.37 U
0.0019 UNRNR0.37 U
4,170 *3.7170 B31
0.13 U0.002 BJNRNRNR10.2 UNRNRNR
0.37 U0.37 U
SD039/8/92
xirt1 1 »V
NRNR
0.0043 UNRNR
0.0043 UNRNR0.41 U
0.0022 UNRNR
0.41 U6,620 *
48.7 '335 B57.5 N*0.11 U
0.031 BNRNRNR2.8 BNRNRNR0.41 U0.41 U
SD0312/8/92
MDi » »»
NRNRNANRNRNANRNR
0.12 JNANRNR0.4 U
1,6303.3321 B30.70.11 NU
0.012 UNRNRNR2.2 BNRNRNR
0.061 J0.4 U
SD03 SD034/6/93 6/23/93
NTO MD
NR NRNR NRNA 0.0041 UNR NRNR NRNA 0.0061 PNR NRNR NR0.22 J 0.41 UNA 0.0021 UNR NRNR NR
0.048 J 0.41 U3,500 2,620
4.7 N 4.2 *691 B 502 B59.5 * 61.2 N0.11 U 0.13 U
0.013 U 0.014 UNR NRNR NRNR NR1.4 B 10.3 *UNR NRNR NRNR NR0.15 J 0.41 U0.43 U 0.41 U
SD039/29/93
MD
NRNR
0.005 UNRNR
0.005 UNRNR0.5 U
0.0026 UNRNR0.5 U
3,920 *12.2542 B154
0.16 U0.012 UNRNRNR12.7 UNRNRNR0.5 U0.5 U
SD0312/20/93
MD
NRNR
0.0043 UNRNR
0.0043 UNRNR
0.43 U0.0022 U
NRNR0.43 U
2,1006 N
353 B53.70.13 U
0.013 UNRNRNR10.7 UNRNRNR
0.43 U0.43 U
SD-36/8/98n j? u0^47 U
0.0023 U0.0047 U0.0047 U0.0047 U0.0047 U0.0047 U0.0014 U
0.18 J0.0023 U0.0023 U0.007 U
0.47 U5,400
1080067
0.14 U0.0014 U
0.47 U0.47 U0.47 U3.2
0.47 U0.47 U1.2 U
0.13 J0.47 U
SD-0097/8/99
MANANANANANANANANANANANANANA
2,9202.4240
43.70.1NANANANA
2NANANANANA
SD-0117/8/99
MANANANANANANANANANANANANANA
2,1802.5260263
U 0.1 UNANANANA
U 3NANANANANA
Footnotes are presented on the last page.
VO
Page 3 of 8
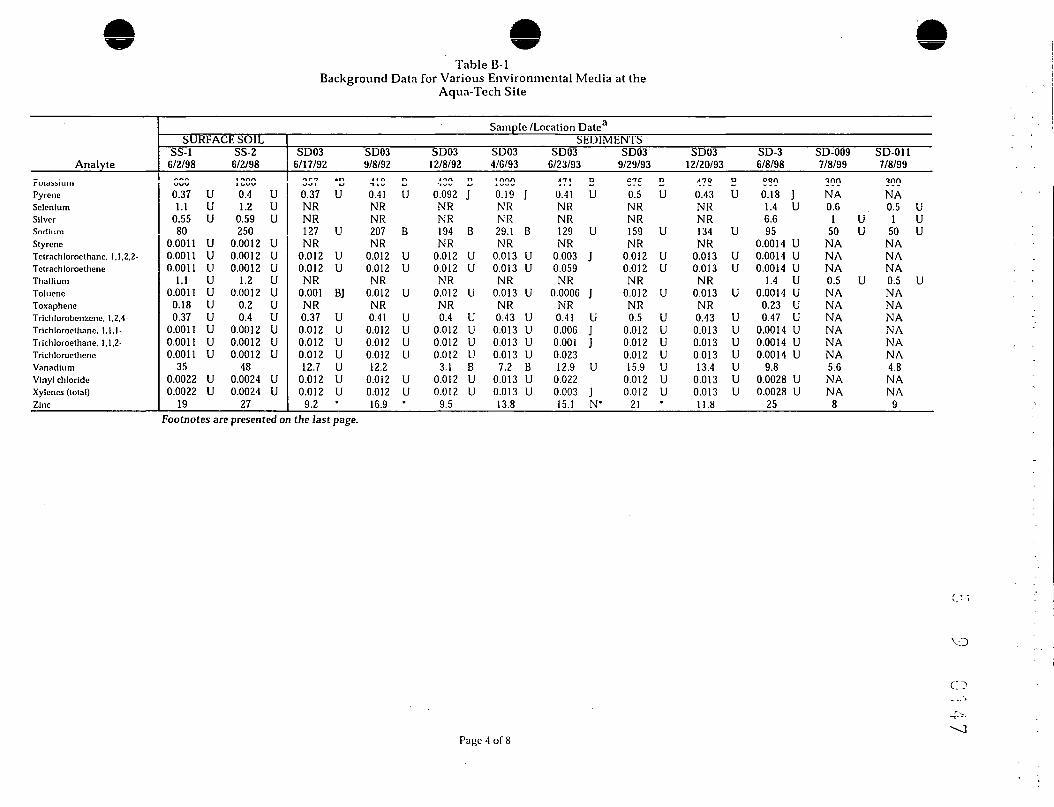
Table B-lBackground Data for Various Environmental Media at the
Aqua-Tech Site
AnalyterutuddiuiitPyreneSeleniumSilverSodiumStyreneTetrachlorocthane. 1,1,2,2-TetrachloroetheneThalliumTolueneToxapheneTrlchlorobenzenc. 1,2.4-Trichloroetliane. 1.1.1-Trichloroethane, 1,1.2-TrichloroetlieneVanadiumVinyl chlorideXylcnes (total)Zinc
Sample /Location DateSURFACE SOIL
SS-16/2/98
uuu
0.37 U1.1 U
0.55 U80
0.0011 U0.0011 U0.0011 U
1.1 U0.0011 U
0.18 U0.37 U
0.0011 U0.0011 U0.0011 U
350.0022 U0.0022 U
19
SS-26/2/98
• r*f\f\1 t, W
0.4 U1.2 U
0.59 U250
0.0012 U0.0012 U0.0012 U
1.2 U0.0012 U
0.2 U0.4 U
0.0012 U0.0012 U0.0012 U
480.0024 U0.0024 U
27
SEDIMENTSSD03
6/17/92i r*r an\JtJ 1 U
0.37 UNRNR127 UNR
0.012 U0.012 UNR
0.001 BJNR0.37 U
0.012 U0.012 U0.012 U12.7 U
0.012 U0.012 U
9.2 '
SD039/8/92
* 1 0 0
0.41 UNRNR207 BNR
0.012 U0.012 UNR
0.012 UNR0.41 U
0.012 U0.012 U0.012 U12.2
0.012 U0.012 U16.9 •
SD03 SD0312/8/92 4/G/93
tin n 1 nnn
0.092 J 0.19 JNR NRNR NR194 B 29.1 BNR NR
0.012 U 0.013 U0.012 U 0.013 UNR NR
0.012 U 0.013 UNR NR0.4 U 0.43 U
0.012 U 0.013 U0.012 U 0.013 U0.012 U 0.013 U
3.1 B 7.2 B0.012 U 0.013 U0.012 U 0.013 U
9.5 13.8
SD036/23/93
All 0
0.41 UNRNR129 UNR
0.003 J0.059NR
0.0006 JNR0.41 U
O.OOG J0.001 J0.02312.9 U
0.0220.003 J15.1 N'
SD039/29/93
C-7C D
0.5 UNRNR159 UNR
0.012 U0.012 UNR
0.012 UNR0.5 U
0.012 U0.012 U0.012 U15.9 U
0.012 U0.012 U
21
SD0312/20/93
/I70 D
0.43 UNRNR134 UNR
0.013 U0.013 UNR
0.013 UNR0.43 U
0.013 U0.013 U0.013 U13.4 U
0.013 U0.013 U11.8
SD-36/8/98
oon
0.18 J1.4 U6.695
0.0014 U0.0014 U0.0014 U
1.4 U0.0014 U
0.23 U0.47 U
0.0014 U0.0014 U0.0014 U
9.80.0028 U0.0028 U
25
SD-0097/8/99
•jnnNA0.61 U
50 UNANANA0.5 UNANANANANANA5.6NANA8
SD-0117/8/99
•jnnNA0.5 U1 U
50 UNANANA0.5 UNANANANANANA4.8NANA
9Footnotes are presented on the last page.
Page 4 of 8

Table B-lBackground Data for Various Environmental Media at the
Aqua-Tech Site
Analyte
AcetoneAldrlnAluminumAnthraceneAntimonyAroclor-1242Aroclor-1248Aroclor-1254ArsenicBariumBenzeneBenzo(a)anthraceneBenzo(a)pyreneBenzo(b) fluorantheneBenzo(g,h.i)peryleneBenzo(k)lluorantheneBerylliumBHC, alpha-BHC, bota-BHC. delta-BHC, gamma- (lindane)Bis(2-chlorocthyl)etherBis(2-ethylne.\yl)ptithalateBromodichloromethaneButanone, 2-ButylbenzylphthalateCadmium
Sample /Location Date a
SURFACE WATERSW036/17/92
MD
0.01 UNR
0.391NR0.01 UNRNRNR
0.003 U0.05 U0.01 UNRNRNRNRNRNRNRNRNRNRNR0.01 UNRNRNR
0.005 U
SW039/8/92
Ml?
0.01 UNR
0.792NR
0.032 UNRNRNR
0.002 U0.0307 B
0.01 UNRNRNRNRNRNRNRNRNRNRNR
0.002 BJNRNRNR
0.003 U
SW0312/8/92
NR0.01 UNR
0.499NR
0.023 UNR .NRNR
0.002 UW0.0337 B
0.01 UNRNRNRNRNRNRNRNRNRNRNR
0.002 BJNRNRNR
0.003 U
SW034/6/93
NR0.01 JNR
0.652NR
0.0333 BNRNRNR
0.002 U0.0332 B
0.01 UNRNRNRNRNRNRNRNRNRNRNR0.01 UNRNRNR
0.002 U
SW036/23/93
NR0.01 UNR
0.421NR0.01 UNRNRNR
0.003 U0.05 U0.01 UNRNRNRNRNRNRNRNRNRNRNR0.01 UNRNRNR
0.005 U
SW039/29/93
NR0.003 BJNR
0.202NR0.01 UNRNRNR
0.003 U0.05 U0.01 UNRNRNRNRNRNRNRNRNRNRNR0.01 UNRNRNR
0.005 U
SW0312/20/93
NR0.004 BJNR
0.256NR0.01 UNRNRNR
0.003 U0.05 U0.01 UNRNRNRNRNRNRNRNRNRNRNR
O.OOG JNRNRNR
0.005 U
SW-36/8/980.011 U0.005 U
0.000055 U0.8
0.011 U0.01 U
0.0011 U0.0011 U0.0011 U
0.010.0330.001 U0.011 U0.011 U0.011 U0.011 U0.011 U0.001 U0.001 U
0.000055 U0.000055 U0.000055 U
0.011 U0.011 U0.001 U0.005 U0.011 U0.001 U
SW-0107/8/99NANANA1.1NANANANANA
0.005 U0.031NANANANANANANANANANANANANANANANANA
SW-0127/8/99NANANA1.2NANANANANA
0.005 U0.03NANANANANANANANANANANANANANANANANA
Footnotes are presented on the last page.
Page 5 of 8
CO
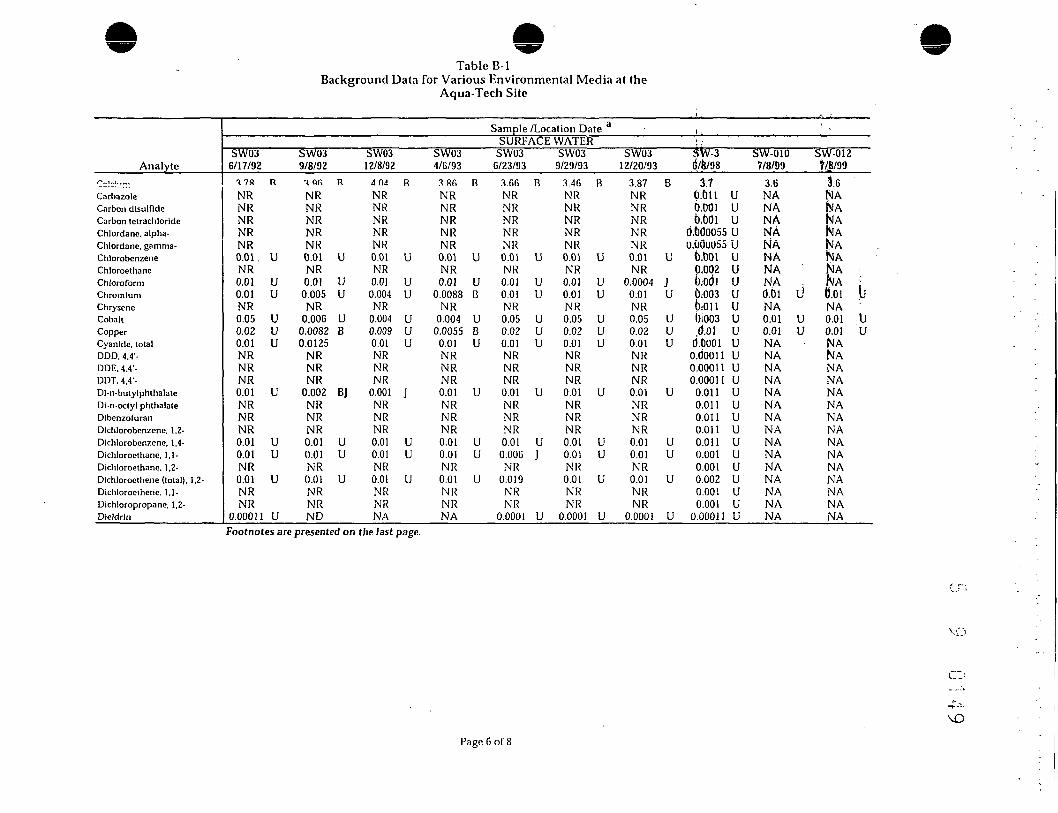
Table B-lBackground Data for Various Environmental Media at the
Aqua-Tech Site
Analytet~ ..i-i...,.CarbazoleCarbon disulfldeCarbon tetrachlorldeChlordanc, alpha-Chlordanc. gamma-ChlorobenzeneChloroethaneChloroformChromiumChryscneCobaltCopperCyanide, totalODD. 4.4'-DDE. 4.4'-DDT. 4.4'-Dl-n-butylphthalateDi-n-octyl phthalateDibenzofuranDichlorobenzene. 1,2-Dichlorobenzene. 1,4-Dichloroethane, 1.1-Dicnloroethane. 1,2-Dlchloroethene (total). 1.2-Dichioroethene, 1,1-Dichloropropane. 1,2-Dieldrin
Sample /Location Date a i ,
SW036/17/92
T 7 R
NRNRNRNRNR0.01.NR0.010.01NR0.050.020.01NRNRNR0.01NRNRNR0.010.01NR0.01NRNR
0.00011
R
uuuuuu
u
uuu
u
SW039/8/92
-< or.NRNRNRNRNR0.01NR0.010.005NR
0.0060.00820.0125
NRNRNR
0.002NRNRNR0.010.01NR0.01NRNRND
R
U
UU
UB
BJ
UU
u
SW0312/8/92
anaNRNRNRNRNR0.01NR0.01
0.004NR
0.0040.0090.01NRNRNR
0.001NRNRNR0.010.01NR0.01NRNRNA
R
U
uuuuu
J
uuu
SW034/6/93
.IRfiNRNRNRNRNR0.01NR0.01
0.0088NR
0.0040.0055
0.01NRNRNR0.01NRNRNR0.010.01NR0.01NRNRNA
R
U
uB
UBU
U
Uuu
SURFACESW03
G/23/933T.6 RNRNRNRNRNR0.01 UNR0.01 U0.01 UNR0.05 U0.02 U0.01 UNRNRNR0.01 UNRNRNR0.01 U0.006 JNR
0.019NRNR
0.0001 U
WATERSW03
9/29/933.46NRNRNRNRNR0.01NR0.010.01NR0.050.020.01NRNRNR0.01NRNRNR0.010.01NR0.01NRNR
0.0001
B
U
UU
UUU
U
UU
u
u
SW0312/20/93
3.87NRNRNRNRNR0.01NR
0.00040.01NR0.050.020.01NRNRNR0.01NRNRNR0.010.01NR0.01NRNR
0.0001
B
U
JU
uuu
u
uuu
u
: ;SW-3ri/b/98
3.70.611 u0.001 Ud.OOi u
d.600055 UU.000055 U
o.doi u0.002 Ui);0dl U6,003 U6.011 ui)i003 U.d.ol u
d.6ooi uo.doon u0.00011 U0.000 1 1 U
0.011 U0.011 U0.011 U0.011 U0.011 U0.001 U0.001 U0.002 U0.001 U0.001 U
0.00011 U
SW-0107/8/99
3.6NANANANANANANA :
NA ,o.bi t!NA0.01 U0.01 UNANANANANANANANANANANANANANANA
SW-012fr/l/99
16NANANANANANANANAC.oiNA0.010.01NANANANANANANANANANANANANANANA
b
UU
Footnotes are presented on the Jast page.
Page 6 of 8

Table B-lBackground Data for Various Environmental Media at the
Aqua-Tech Site
AnalyteDiethylphthalateDinitrololuene, 2,4-Endosulfan IEndosulfan 11Endosulfan suifateEndrlnEndrin aldehydeEndrin ketoncEthylbenzcncFluoranlhcneHeplachlorHeptachlor epoxldeHexanone, 2-Indeno(l,2.3-c.d)pyreneIronLeadMagnesiumManganeseMercuryMethylene chlorideMethylnaphthalene. 2-Methylphenol. 4-NaphthaleneNickelNilrophenol, 2-Nitrosodiphenylamine. n-PenlachlorophenolPhenanthrenePhenol
Sample /Location Date a
SW036/17/92
u.ui uNRNRNRMR
NRNRNRNRNRNRNRNRNR
0.5230.0034
1.5 B0.04110.0002 U
0.01 UNRNRNR0.04 U0.01 UNRNRNR0.01 U
SW039/8/92u.ui uNRNRNRNRNRNRNRNRNRNRNRNRNR
0.4940.0088 *
1.33 B0.0360.0002 U0.004 JNRNRNR0.01 U0.01 UNRNRNR0.01 U
SW0312/8/92
U.UI U
NRNRNRNRNRNRNRNRNRNRNRNRNR
0.3070.0032 N*
1.43 B0.05620.0002 U
0.01 UNRNRNR
0.0111 B0.01 UNRNRNR0.01 U
SW034/G/93
U.UI U
NRNRNRNRNRNRNRNRNRNRNRNRNR
0.5350.0058
1.38 B0.042
0.0002 U0.01 UNRNRNR
0.007 U0.01 UNRNRNR0.01 U
SURFACESW03G/23/93
\J.\J\JJ UJ
NRNRNRNRNRNRNRNRNRNRNRNRNR
0.5660.0041
1.54 B0.04730.0002 U
0.01 UNRNRNR0.04 U0.01 UNRNRNR0.01 U
WATERSW03
9/29/93U-W1 W
NRNRNRNRNRNRNRNRNRNRNRNRNR
0.3290.004
1.5 B0.03930.0002 U
0.01 UNRNRNR0.04 U0.01 UNRNRNR0.01 U
SW0312/20/93
V.Ul ^
NRNRNRNRNRNRNRNRNRNRNRNRNR
0.3570.0104
1.6 B0.06610.0002 U
0.01 UNRNRNR0.04 U0.01 UNRNRNR
0.01 U
SW-36/8/98u.o.. u
0.011 U0.000055 U0.00011 U0.00011 U0.00011 U0.00011 U0.00011 U
0.001 U0.011 U
0.000055 U0.000055 U
0.005 U0.011 U0.620.005 U
1.40.049
0.0002 U0.001 U0.011 U0.011 U0.011 U0.005 U0.011 U0.011 U0.027 U0.011 U0.011 U
SW-0107/8/99
NT A
NANANANANANANANANANANANANA1.21NA1.3
0.050.0002 U
NANANANA0.02 U
. NANANANANA
SW-0127/8/99
NT A
NANANANANANANANANANANANANA1.32NA1.2
0.0460.0002 U
NANANANA0.02 UNANANANANA
Footnotes are presented on the last page.
O
Page 7 of 8

Table B-lBackground Data for Various Environmental Media at the
Aqua-Tech Site
AnalytePnt^ciiim
PyreneSeleniumSilverSodiumStyreneTetrachloroethane. 1,1.2.2-TetrachloroetheneThalliumTolueneToxaplieneTrichlorobenzene, 1.2.4-Trichloroethane, 1.1.1-Trichloroethane. 1,1,2-TrichloroetheneVanadiumVinyl chlorideXylenes (total)Zinc
Sample /Location Date a
SW036/17/92
3 17NRNRNR22.9NRNR0.01NR
0.0007NRNR0.01NR0.010.050.01NR0.02
R
U
BJ
U
UUU
U
SW039/8/923.52NRNRNR24.6NRNR0.01NR0.01NRNR0.01NR0.01
0.0050.01NR
0.0121
R
U
U
U
UUU
B
SW0312/8/92
3.14NRNRNR27.5NRNR0.01NR
0.002NRNR0.01NR0.010.0040.01NR
0.0181
R
F
U
J
U
UUU
B
SW034/6/93
?. 35NRNRNR13.9NRNR0.01NR0.01NRNR0.01NR0.01
0.00360.01NR
0.0143
R
U
U
U
UBU
B
SURFACESW03
6/23/93308 RNRNRNR30.3NRNR
0.005 JNR0.01 UNRNR
0.0005 JNR
0.005 J0.05 U0.004 JNR
0.0234 *
WATERSW03
9/29/93?.Q7NRNR
' NR40.1NRNR0.01NR0.01NRNR0.01NR0.010.050.01NR0.02
R
U
U
U
UUU
U
SW0312/20/93
2.93NRNRNR26.5NRNR0.01NR0.01NRNR0.01NR0.010.050.01NR
0.0281
R
U
U
U
UUU
*
SW-36/8/98
1.90.0110.010.005
3.90.0010.0010.0010.010.001
0.00550.0110.0010.0010.0010.0050.0020.0020.02
UUU
UUUUUUUUUUUUUU
SW-0107/8/99
3NANANA3.4NANANA
0.005 UNANANANANANA
0.005 UNANA0.02 U
SW-0127/8/99
3NANANA3.5NANANA
0.005 UNANANANANANA
0.005 UNANA0.02 U
a -Concentrations are in mg/kg for surface soil and sediments and mg/L for surface water.NR -Not Reported.NA -Not Analyzed.ND -Not Detected.
U -Less than the detection limit.B (inorganic) -Less than the required detection limit but greater than the instrument detection limit.
B (organic) -Present in analytical method blank.J -Estimated concentration.* -Duplicated analysis not within control limits.
N (inorganic) -Spiked sample recovery not within control limits.E -Concentration exceeds instrument calibration range.
W -Post-digestion spike for Furnace AA analysis is out of control limits (85-115%), whilesample absorbancc is less than 50% of spike absorbance.
Page 8 of 8

Table B-2Surface Soil Data for Exposure Unit 1 (EU-1) at the Aqua-Tech Site
AnalyteAcetoneAldrinAluminumAntimonyAroclor-1242Aroclor-1248Aroclor-1254ArsenicBariumBcnzaldehydcJenzeneJcnzene, isopropyl3enzo(a)anl!iracene3enzo{a)pyrene3enzo(b)/luorantheneBenzo(g.li.i)perylene)enzo(k)fluorantlicneBeryllium3HC, gamma- (lindane)JjphenylBis(2-elliylllexyl)phthalatelutanone, 2-iutylbenzylphthalateCadmiumCalciumCarbon disulfideChlordane. alpha-Chlordane. gamma-ChlorobenzeneChlororormChloromelhaneChlorophenyl phenyl ether, 4-ChromiumChryseneCobaltCopperCyanide, totalCyclohexaneODD, 4.4'-DDE. 4.41-DDT. 4.4'-Di-n-butylphthala(eDi-n-octylphllialateDichloroelltane, 1.1-Dichloroethane. 1.2-Dichloroethene. cis-1,2-Dichloroethene. trans-1.2-Dichloroetheno (total), 1.2-Dichloropropane. 1.2-DicldrinDiclhylphthalaleDimcthylphthalateDinitrololuene. 2.4-Endosiilfan 1Endosulfan 11Endosulfan sulfate
SBA-OI8/26/93
0.008 UBJ0.0019 U55.800
NR0.037 UNR0.250.66 U932NR
0.011 UNR0.37 U0.37 U0.37 UNR0.37 U1.3
0.0019 UNR0.28 UJ
0.011 U0.19 J1.9
3.5800.01 1 U0.0019 U0.0019 U0.011 U0.011 U
NRNR83.90.37 U20.564.62.8 UNR
0.0037 U0.0037 U0.0037 U0.046 J0.37 U
0.011 UNRNRNR
0.011 U0.011 U0.0037 U
0.37 UNR0.37 U
0.0019 UNRNR
SBA-028/2C/93
0.004 UBJ0.0096 U54.200
NR0.19 UNR0.19 U2.8 NSJ
1.080NR
0.011 UNR0.74 U0.74 U0.74 UNR0.74 U1.1 U
0.0096 UNR1.7
0.011 U0.74 U7.1
2.1500.011 U0.0096 U0.0096 U0.011 U0.011 UNRNR143
0.74 U15
3344.5NR
0.019 U0.019 U0.027 P0.74 U0.74 U
0.011 UNRNRNR
0.011 U0.011 U0.019 U0.74 UNR '0.74 U
0.0096 UNRNR
501-018/11/93
0.012 U0.0018 U47,900
2.1 U0.035 UNR
0.035 U1 BNW
1.120NK
0.011 UNR
0.078 J0.35 U0.35 UNR0.35 U1.1 U
0.002 PNR1.7
0.01 1 U0.35 U4.9
5,5400.011 U0.0018 U0.0018 U0.011 U0.011 UNRNR105
0.092 J2450 •2.6 UNR
0.0035 U0.0035 U0.0088 P0.073 J0.35 U
0.011 UNRNRNR
0.011 U0.011 U0.0035 U
0.35 UNR0.35 U
0.0018 U0.0035 U0.0035 U
501-01 (Dup)8/11/93
0.011 U0.0018 U44.700
NR0.035 UNR
0.035 U1 BNWJ
1.010NR
0.011 UNR0.35 U0.35 U0.35 UNR0.35 U1.1 U
0.002 PJNR1.3
0.011 U0.35 U4.9
5.5400.011 U
0.0018 U0.0018 U0.011 U0.011 UNRNR1050.35 U20.561.4 '2.6 UNR
0.0035 U0.0035 U0.0088 P
0.35 U0.35 U
0.011 UNRNRNR
0.011 U0.011 U
0.0035 U0.35 UNR0.35 U
0.0018 UNRNR
501-028/11/93
0.009 UBJ0.0018 U27.900
2.1 U0.035 UNR
0.035 U0.92 BN360NR0.01 UNR0.35 U0.35 U0.35 UNR0.35 U1.1 U
0.0023 PNR0.12 J0.01 U0.35 U2.9
1.8200.01 U
0.0018 U0.0018 U
0.01 U0.01 UNRNR47.60.35 U10.7 U34.3 '2.7 UNR
0.0048 P0.0035 U0.0035 U
0.35 U0.35 U0.01 UNRNRNR0.01 U0.01 U
0.0035 U0.35 UNR0.35 U
0.0018 U'0.0035 U
0.0035 U
Loc501-038/12/93
0.008 UBJ0.0018 U55.300
2.2 U0.035 UNR
0.035 U0.65 U3.300NR
0.011 UNR1.8 U1.8 U1.8 UNR1.8 U2.7
0.0018 UNR1.9
0.011 U1.8 U7.2
3.8800.011 U0.0018 U0.0018 U0.011 U0.011 UNRNR1531.8 U
31.149.92.7 UNR
0.0035 U0.0035 U0.0035 U
1.8 U1.8 U
0.011 UNRNRNR
0.005 J0.011 U0.0035 U
1.8 UNRJ.8 U
0.0018 U0.0035 U0.0035 U
ation/Sample Dale a
501-04 501-058/12/93 8/12/93
0.011 UBJ 0.007 UBJ0.039 U 0.04 U46,700 46.400
15.3 N 2.3 UO./ti U U . / ( UNR NR0.76 U 0.5 J2.1 B 2.5 S
2.530 797NR NR
0.001 J 0.012 UNR NR7.6 U 3.8 U7.6 U 3.8 U7.6 U 3.8 UNR NR7.6 U 3.8 U1.1 U 1.2 U
0.039 U 0.04 UNR NR83 3.8 J
0.012 U 0.012 U2.1 J 3.8 U
68.1 13.52.700 1. 7600.012 U 0.012 U0.039 U 0.04 U0.039 U 0.04 U0.012 U 0.012 U0.002 J 0.012 UNR NRNR NR339 1107.6 U 3.8 U16.6 15.2240 15274.7 N 2.9 UNR NR
0.076 U 0.077 U0.076 U 0.077 U0.076 U 0.077 U
4.7 UBJ 3.8 U26 3.8 U
0.012 U 0.012 UNR NRNR NRNR NR0.04 0.012 U
0.012 U 0.012 U0.076 U 0.077 U
7.6 U 3.8 UNR NR7.6 U 3.8 U
0.039 U 0.04 U0.076 U 0.077 U0.076 U 0.077 U
501-068/12/93
0.013 U0.11 U
60,4002.6 Ui.\ UNR354
1.590NR
0.013 UNR8.5 U8.5 U8.5 UNR8.5 U1.6
0.11 UNR100
0.013 U2.4 J
36.82,6500.013 U0.11 U0.11 U
0.013 U0.013 UNRNR2548.5 U22.6986
7 NNR0.21 U0.21 U0.21 U1.9 UBJ2.5 J
0.024NRNRNR
0.0220.013 U0.21 U8.5 UNR8.5 U
0.11 U0.21 U0.21 U
501-09-S8/26/93
0.084 U0.0099 U52.500
2.3 UU.1U U
NR0.15 j0.7 U
2.940NR
0.057 UNR9.6 U9.6 U9.6 UNR9.6 U1.2 U
0.0099 UNR120
0.057 U9.6 U64.62.5000.057 U0.0099 U0.0099 U0.057 U0.057 UNRNR2449.6 U25.411912.5NR
0.019 U0.019 U0.019 U
3.9 J9.6 U
0.057 UNRNRNR
0.047 J0.015 J0.019 U
9.6 UNR9.6 U
0.0099 U0.019 U0.019 U
502A8/17/93
0.007 UBJ0.0018 U53.600
2.1 UU.UJD U
NR0.035 U0.64 U1.100NR
0.011 UNR0.35 U0.35 U0.35 UNR0.35 U1.1 U
0.0018 UNR0.35 U
0.011 U0.35 U1.1 U
1.260 '0.011 U0.0018 U0.0018 U0.011 U0.011 UNRNR75.20.35 U23.415.82.7 UNR
0.0038 P0.0035 U0.025
0.1 J0.35 U
0.011 UNRNRNR
0.011 U0.011 U0.0035 U
0.35 UNR0.35 U
0.0018 U0.0035 U0.0035 U
502B8/17/93
0.016 U0.018 U42.800
2.1 UU.Jt U
NR0.34 U
4 NS953NR
0.013 UNR0.34 U0.34 U0.34 UNR0.34 U1.1
0.018 UNR0.17 J0.013 U0.34 U6.1
3.000 '0.013 U0.018 U0.018 U0.013 U0.013 UNRNR72.10.34 U29.336.32.6 UNR
0.043 P0.034 U0.130.34 U0.34 U
0.013 UNRNRNR
0.013 U0.013 U0.034 U0.34 UNR0.34 U
0.018 U0.034 U0.034 U
5038/17/93
0.013 UBJ0.043 U57.700
2.5 UU.01 »_t
NR0.84 U0.9 BNW482NR
0.015 UNR0.42 U0.42 U0.42 UNR0.42 U1.5
0.043 UNR0.42 U0.015 U0.42 U13.3
6.000 •0.015 U0.043 U0.043 U0.015 U0.015 UNRNR111
0.42 U25.852.83.2 UNR
0.47 P0.084
1.40.42 U0.42 U
0.015 UNRNRNR
0,015 U0.015 U0.084 U0.42 UNR0.42 U
0.043 U0.084 U0.084 U ro
Footnotes arc presented on the last page. Page lof 13

Table B-2Surface Soil Data for Exposure Unit 1 (EU-1) at the Aqua-Tech Site
Location/Sample Date a
SBA-01Analytc 8/2C/93Endrin 0.0037 UEndrin aldehyde 0.0037 Uindrin ketone NR
Elhylbenzene 0.011 UFluoranlheiie 0.37 UHeplachlor 0.0019 UHeptachlor epoxlde 0.0019 UHexanone. 2- 0.011 UIron 52.200Lead 69.4Magnesium 16.100Manganese 707 J"Mercury 1.4vlethyl-2-pentanone. 4- NRMelhylene chloride 0.011 UMethylnaphthalenc. 2- 0.37 UMethylphenol, 4- 0.75 UNaphthalene 0.37 UNickel 38.1Pentachlorophenol 0.89 UPhenanlhrene 0.37 UPhenol 0.37 UPotassium 16.000Pyrene 0.37 USelenium 0.6C USilver 2.2 USodium 112 BStyrene 0.011 UTetrachloroethane. 1.1.2.2- 0.011 UTelrachloroelhene 0.001 JThallium 0.94 BToluene 0.001 JToxaphene 0.19 UTrichlorobenzene. 1.2.4- 0.37 UTrichloroethane, 1.1,1- 0.011 UTrichloroethane, 1.1,2- 0.011 UTrichloroethene 0.002 JVanadium 160Xylencs (total) 0.011 UXylene. m&p- NRXylene. o- NRZinc 171
SBA-028/20/93
0.019 U0.019 UNR
0.01 1 UU.74 U
0.0096 U0.0096 U0.011 U47,900
no9.640
524 J-2.8NR
0.011 U0.74 U1.2
0.74 U40.61.8 U
0.74 U0.74 U
9.8400.74 U0.67 U2.2 U112 U
0.011 U0.011 U0.001 J0.67 U
0.001 J0.96 U0.74 U
0.011 U0.011 U0.001 J
1300.0005 J
NRNR236
501-018/11/93
0.0035 U0.0035 U0.0035 U0.011 UU.12 J
0.0045 P0.0018 U0.011 U45,200
62.4 N15.400
64512.2 J'NR
0.002 U0.35 U0.35 U0.35 U11800.84 U
0.056 J0.35. U
14.8000.12 J0.63 U2.1 U352 B
0.01 1 U0.011 U0.011 U
1.2 B0.002 J
0.18 U0.35 U
0.011 U0.011 U0.011 U
1350.011 UNRNR215
501-01 (Dup)8/11/93
0.0035 U0.0035 U
NR0.011 Uu.uys j0.0045 P0.0018 U0.011 U
43.50062.4 N
14.50064517.9 J'NR
0.011 U0.35 U0.35 U0.35 U38.80.84 U0.35 U0.35 U
14,2000.093 J0.63 U2.1 U313 B
0.011 U0.011 U0.011 U
1.2 B0.001 J0.18 U0.35 U
0.011 U0.011 U0.011 U
1310.011 UNRNR171
501-028/11/93
0.0035 U0.0035 U0.0035 U
0.01 Uu.jn u
0.0018 U0.0018 U
0.01 U40.500
120 N6,1603670.85 'NR0.01 U0.35 U0.35 U0.35 U18.G0.86 U0.35 U0.35 U
6.0200.35 U0.64 U2.1 U113 B0.01 U0.01 U0.01 U0.64 U0.003 ]0.18 U0.35 U0.01 U0.01 U0.01 U80.1
0.0005 JNRNR156
501-038/12/93
0.0035 U0.0035 U0.0035 U0.011 U
1.0 U0.0018 U0.0018 U0.011 U54.800
65.4 •20.700
76472.6NR
0.011 U1.8 U1.8 U1.8 U
54.24.3 U1.8 U1.8 U
19.6001.8 U
0.05 U2.2 U549 B
0.011 U0.011 U0.012
1.6 B0.0006 J
0.18 U1.8 U
501-048/12/93
0.076 U0.070 U0.076 U0.003 ]
7.6 u0.0490.039 U0.012 U
45.500130 *
6,67046762.9NR
0.012 U7.6 U7.6 U7.6 U
37.318 U7.6 U2.0 J
6,6807.6 U
0.69 U2.3 U435 B
0.012 U0.012 U0.13 J0.7 B
0.0173.9 U7.6 U
0.003 UBJ 0.012 U0.011 U0.15175
0.011 UNRNR266
0.001 J2.4122
0.012 UNRNR352
501-058/12/93
0.077 U0.077 U0.077 U0.012 U
J.O u
0.04 U0.04 U
0.012 U52.300
55! •9.0306773.1NR
0.012 U2.7 J3.8 U22
34.59.3 U3.8 U3.S U
9,6303.8 U0.7 U2.3 U323 B
0.012 U0.012 U0.012 U
1 BW0.0009 J
4 U3.8 U
0.012 U0.012 U0.012 U
1400.012 UNRNR190
501-068/12/93
0.21 U0.21 U0.21 U
0.013 Ui.o j
0.11 U0.11 U
0.013 U55.8001.290 '15.4001.2401G.1NR
0.001 J8.5 U8.5 U8.5 U
58.421 U1.7 J8.5 U
13,5001.8 ]
0.77 U5.4257 B
0.013 U0.013 U0.013 J
1.2 B0.0005 J
11 U8.5 U
0.070.013 U0.004 J
1700.013 UNRNR527
301-09-S8/26/93
0.019 UO.dl9 UO.dl9 U0*.d22 J
b,OD99 Ub.0099 Ud.057 U44.000
4361 8,2005,4 'h.75MR
0.0*57 U9.6 U4J J9,6 U
34\923 U9.6 U9.6 U
11.9009.6 U0.7 U2.3 U375 B
0.057 U0.004 J0.850.75 B
0.005 J0.99 U9.6 U
0.002 J0.057 U0.022 J
1370.19NRNR336
502A8/17/93
0.0035 U0.0035 U0.0035 U0.011 U
0.0018 U0.0018* 00.01 1 It44.40(1
20 : 'I7,00(j
673. ,d.il uNrt
0.011 U0.35 J0.35 00.35 U35
0.85 U0.35 U0.35 U
16.4000.35 U0.64 U2.1 U117 B
0.011 U0.011 U0.011 U0.98 B
0.001 U0.18 U0.35 U
0.011 U0.011 U0.011 U
1450.011 UNRNR121
502B8/17/93
0.034 U0.034 U0.034 U0.013 U
D.blB U0.018 Uo.bli u
39j8dbAi
15,2dbfid0,381NR
0.013 00.34 U0.34 U0.341 U34.50.83 U0.34 U0.34 U
14,7000.34 U0.63 U2.1 U183 S
0.013 U0.013 U0.013 U0.76 B
0.002 U1.8 U
0.34 U0.013 U0.013 U0.013 U
1290.013 UNRNR141
5038/17/93
0.084 U0.084 U0.084 U0.015 U
0.043 U0.043 U0.015 U48.900
28.915,700
4650.27NR
0.015 U0.42 U0.42 U0.42 U35.6
1 U0.42 U0.42 U
13.6000.42 U0.76 U2.5 U145 B
0.015 U0.015 U0.015 U0.95 B
0.001 U4.3 U
0.42 U0.015 U0.015 U0.015 U
1310.015 UNRNR181
(..nCNi
Footnotes are presented on the last page. Page 2 of 13
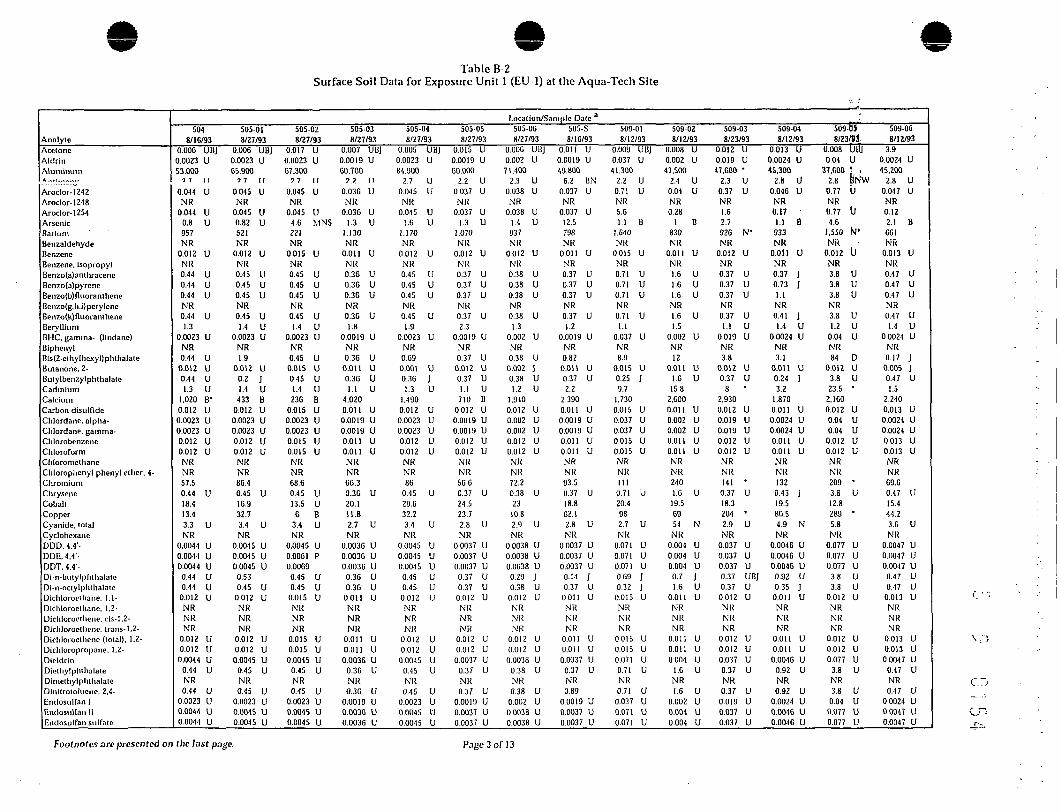
Table B-2Surface Soil Data for Exposure Unit 1 (EU-1) at the Aqua-Tech Site
AnalytcAcetoneAldrinAluminumA _ . , ———— ..
Aroclor-1242Aroclor-1248Aroclor-1254ArsenicBarium3cnzaldehyde3enzene3enzene. isopropyl3enzo(a)anthracene3enzo(a)pyrcne3enzo{b) nuorantheneBenzofg.h.Operylene3enzo(k) fluoranthene3eryllium3HC. gamma- (lindane)3iplienylBis(2-ethylhexyl)plithalate3utanone. 2-3utylbenzytphthalateCadmiumCalciumCarbon disulfidcChlordane. alpha--hlordane. gamma-ChlorobenzeneChloroformChloromethaneChlorophenyl phenyl etlier. 4-ChromiumChryscneCobaltCopperCyanide, totalCyclohexaneODD. 4.4'-DDE.4.4'-DDT. 4.4'-Di-n-butylplithalateDi-n-octylphlhalateDichlorocthane, 1.1-Dichlorocthane. 1.2-Dichloroethene. cis-1.2-Dichloroethcne, trans-1,2-Dichlorocthene (total), 1.2-Dichloropropane. 1.2-DicldrinDjethylplithalateDimethylpluhalaleDinitrotoluene. 2,4-Endosulfan IEndosulfan IIEndosulfai) sulfatc
Location/Sample Date a
5048/1G/93
0.000 UBJ0.0023 U53.000
7 7 I I
0.044 UNR
0.044 U0.8 U957NR
0.012 UNR0.44 U0.44 U0.44 UNR0.44 U1.3
0.0023 UNR
0.44 U0.012 U
0.44 U1.3 U
1,020 B'0.012 U0.0023 U0.0023 U0.012 U0.012 UNRNR57.50.44 U18.413.43.3 UNR
0.0044 U0.0044 U0.0044 U
0.44 U0.44 U
0.012 UNRNRNR
0.012 U0.012 U
0.0044 U0.44 UNR
0.44 U0.0023 U0.0044 U0.0044 U
505-018/27/93
0.006 UBJ0.0023 U05.900
7 7 I I
0.045 UNR
0.045 U0.82 U521NR
0.012 UNR0.45 U0.45 U0.45 UNR0.45 U1.4 U
0.0023 UNR1.9
0.012 U0.2 J1.4 U433 B
0.012 U0.0023 U0.0023 U0.012 U0.012 UNRNR80.40.45 U16.932.73.4 UNR
0.0045 U0.0045 U0.0045 U0.530.45 U
0.012 UNRNRNR
0.012 U0.012 U0.0045 U
0.45 UNR
0.45 U0.0023 U0.0045 U0.0045 U
505-028/27/93
0.017 U0.0023 U67.300
7 7 I I0.045 UNR
0.045 U4.0 MNS221NR
0.015 UNR0.45 U0.45 U0.45 UNR0.45 U1.4 U
0.0023 UNR0.45 U0.015 U0.45 U1.4 U236 B
0.015 U0.0023 U0.0023 U0.015 U0.015 UNRNRG8.60.45 U13.5 U6 B
3.4 UNR
0.0045 U0.0061 P0.00690.45 U0.45 U
0.015 UNRNRNR
0.015 U0.015 U0.0045 U
0.45 UNR
0.45 U0.0023 U0.0045 U0.0045 U
505-038/27/93
0.007 UBJ0.0019 U60,700
?..?. 110.036 UNR
0.036 U1.3 U
1,130NR
0.011 UNR0.36 U0.36 U0.36 UNR
0.3G U1.8
0.0019 UNR0.36 U
0.011 U0.36 U1.1 U
4.0200.011 U0.0019 U0.0019 U0.011 U0.01 1 UNRNR
OG.30.36 U20.111.82.7 UNR
0.003G U0.003G U0.0030 U0.36 U0.36 U
0.011 UNRNRNR
0.011 U0.011 U0.0036 U
0.36 UNR0.36 U
0.0019 U0.0030 U0.003G U
505-048/27/93
0.005 UBJ0.0023 U84,900
2.7 U0.045 UNR
0.045 U1.6 U
1.170NR
0.012 UNR0.45 U0.45 U0.45 UNR0.45 U1.9
0.0023 UNR
0.090.001 U0.30 J1.3 U
1,4900.012 U0.0023 U0.0023 U0.012 U0.012 UNRNR8G
0.45 U29.032.23.4 UNR
0.0045 U0.0045 U0.0045 U
0.45 U0.45 U
0.012 UNRNRNR
0.012 U0.012 U
0.0045 U0.45 UNR
0.45 U0.0023 U0.0045 U0.0045 U
505-058/27/93
0.015 U0.0019 U60,000
2.2 U0.037 UNR
0.037 U1.3 U
1.070NR
0.012 UNR0.37 U0.37 U0.37 UNR0.37 U2.3
0.0019 UNR
0.37 U0.012 U
0.37 U1.1 U710 B
0.012 U0.0019 U0.0019 U0.012 U0.012 UNRNR50.60.37 U24.523.72.8 UNR
0.0037 U0.0037 U0.0037 U0.37 U0.37 U
0.012 UNRNRNR
0.012 U0.012 U0.0037 U
0.37 UNR
0.37 U0.0019 U0.0037 U0.0037 U
505-068/27/93
0.006 UliJ0.002 U71.400
2.3 U0.038 UNR
0.038 U1.4 U937NR
0.012 UNR0.38 U0.38 U0.38 UNR0.38 U1.3
0.002 UNR0.38 U
0.002 J0.38 U1.2 U
1.9400.012 U0.002 U0.002 U0.012 U0.012 UNRNR72.20.38 U23
10.82.9 UNR
0.0038 U0.0038 U0.0038 U
0.29 J0.38 U
0.012 UNRNRNR
0.012 U0.012 U0.0038 U
0.38 UNR0.38 U
0.002 U0.0038 U0.0038 U
505-S8/ 10/93
0.011 U0.0019 U49.800
6.2 BN0.037 UNR
0.037 U12.5798NR
0.011 UNR0.37 U0.37 U0.37 UNR0.37 U1.2
0.0019 UNR
0.820.011 U0.37 U2.2
2.3900.011 U0.0019 U0.0019 U0.011 U0.011 UNRNR93.50.37 U18.862.12.8 UNR
0.0037 U0.0037 U0.0037 U
0.14 J0.37 U
0.011 UNRNRNR
0.011 U0.011 U0.0037 U
0.37 UNR0.89
0.0019 U0.0037 U0.0037 U
509-018/12/93
0.009 UBJ0.037 U41.300
2.2 U0.71 UNR5.61.1 B
1.640NR
0.015 UNR0.71 U0.71 U0.71 UNR0.71 U1.1
0.037 UNR8.9
0.015 U0.25 J9.7
1.7300.015 U0.037 U0.037 U0.015 U0.015 UNRNR111
0.71 U20.4982.7 UNR
0.071 U0.071 U0.071 U0.69 J0.32 J
0.015 UNRNRNR
0.015 U0.015 U0.071 U0.71 UNR
0.71 U0.037 U0.071 U0.071 U
509-028/12/93
0.008 U0.002 U47,500
2.4 U0.04 UNR
0.281 B
830NR
0.011 UNRI.G U1.6 U1.6 UNR1.6 U1.5
0.002 UNR12
0.01 1 UI.G U
15.82.6000.011 U0.002 U0.002 U0.011 U0.011 UNRNR2401.6 U
19.56954 NNR
0.004 U0.004 U0.004 U
0.7 J1.6 U
0.011 UNRNRNR
0.011 U0.011 U0.004 U
1.6 UNR1.6 U
0.002 UO.C04 U0.004 U
509-038/23/93
0.012 U0.019 U47,600 •
2.3 U0.37 UNR1.62.7926 N'NR
0.012 UNR0.37 U0.37 U0.37 UNR0.37 U1.1 U
0.019 UNR3.8
0.012 U0.37 U
82.9300.012 U0.019 U0.019 U0.012 U0.012 UNRNR141 •0.37 U18.3204 '2.9 UNR
0.037 U0.037 U0.037 U0.37 UBJ0.37 U
0.012 UNRNRNR
0.012 U0.012 U0.037 U
0.37 UNR0.37 U
0.019 U0.037 U0.037 U
509-048/12/93
0.013 U0.0024 U45.300
2.8 U0.046 UNR0.171.1 B933NK
O.Oll UNR0.37 J0.73 ]1.1NR0.41 J1.4 U
0.0024 UNR3.1
0.011 U0.24 J3.2
1.8700.011 U0.0024 U0.0024 U0.011 U0.011 UNRNR132
0.43 j19.580.54.9 NNR
0.0046 U0.0046 U0.0046 U
0.92 U0.35 J
0.011 UNRNRNR
0.011 U0.011 U0.0046 U
0.92 UNR0.92 U
0.0024 U0.0046 U0.0046 U
:509-1)38/23/91
0.008 UBJ0.04 U
37,000 J t2.8 iirvW
0.77 UNR
0.77 U4.6
1.550 Kl"NR
0.012 UNR3.8 U3.8 U3.8 UNR3.8 U1.2 U
0.04 UNR84 D
0.012 U3.8 U
23.5 •2.1600.012 U
0.04 U0.04 U
0.012 U0.012 UNRNR209 •3.8 U12.8289 '5.8NR
0.077 U0.077 U0.077 U
3.8 U3.8 U
0.012 UNRNRNR
0.012 U0.012 U0.077 U
3.8 UNR3.8 U
0.04 U0.077 U0.077 U
509-OG8/12/93
3.90.0024 U45,200
2.8 U0.047 UNR
0.122.1 B661NR
0.013 UNR0.47 U0.47 U0.47 UNR0.47 U1.4 U
0.0024 UNR0.17 J0.005 J
0.47 U1.5
2.2400.013 U0.0024 U0.0024 U0.013 U0.013 UNRNR69.60.47 U15.444.23.6 UNR
0.0047 U0.0047 U0.0047 U
0.47 U0.47 U
0.013 UNRNRNR
0.013 U0.013 U0.0047 U
0.47 UNR
0.47 U0.0024 U0.0047 U0.0047 U
Footnotes arc presented on the last page. Page 3 of 13
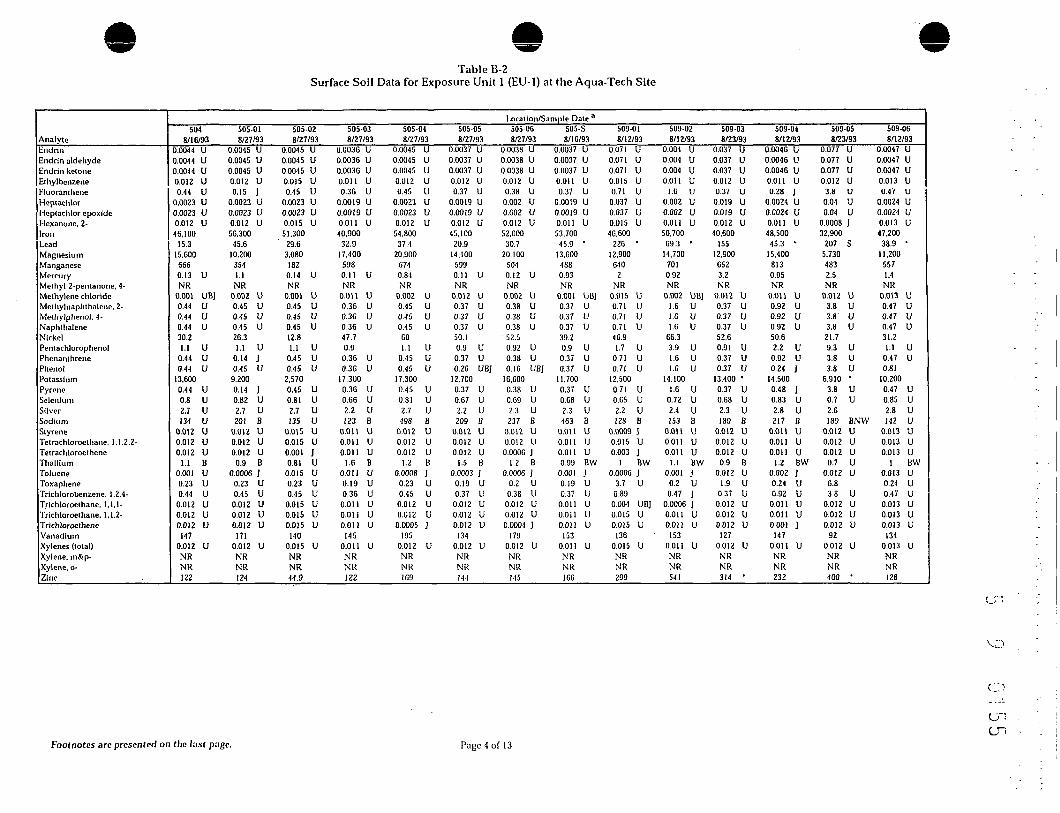
Table B-2Surface Soil Data for Exposure Unit 1 (EU-1) at the Aqua-Tech Site
AnalyteEndrinindrin aldehydeindrin kctoneEthylbcnzeneFluoranthene•leptachlor•feptachfor epoxide-lexanone. 2-IronLeadMagnesiumManganesevlercuryvlethyl-2-pentanone, 4-Methylene chlorideVlethylnaphthalene. 2-Methyjphenol. 4-^aphthalencNickelPentachlorophenolPhenanthrenePhenol^otassiumPyreneSeleniumSilverSodiumStyreneTetrachloroethane. 1.1.2,2-TetrachloroetheneThalliumTolueneToxapheneTrichlorobenzene. 1,2,4-Trichloroethane. 1,1.1-Trichloroethane. 1.1.2-TrichloroetheneVanadiumXylenes (total)Xylene, m&p-Xylene, o-Zinc
Location/Sample Date a
5048/16/93
0.0044 U0.0044 U0.0044 U0.012 U
0.44 U0.0023 U0.0023 U0.012 U46,100
15.315.6006660.13 UNR
0.001 UBJ0.44 U0.44 U0.44 U30.21.1 U
0.44 U0.44 U
13.6000.44 U0.8 U2.7 U134 U
0.012 U0.012 U0.012 U
1.1 B0.001 U0.23 U0.44 U
0.012 U0.012 U0.012 U
1470.012 UNRNR122
505-018/27/93
0.0045 U0.0045 U0.0045 U0.012 U0.15 J
0.0023 U0.0023 U0.012 U56.300
45.610,2003541.1NR
0.002 U0.45 U0.45 U0.45 U26.31.1 U
0.14 J0.45 U
9.2000.14 J0.82 U2.7 U201 B
0.012 U0.012 U0.012 U
0.9 B0.0006 J
0.23 U0.45 U
0.012 U0.012 U0.012 U
1710.012 UNRNR124
505-028/27/93
0.0045 U0.0045 U0.0045 U0.015 U0.15 U
0.0023 U0.0023 U0.015 U51.300
29.63,080182
0.14 UNR
0.001 U0.45 U0.45 U0.45 U12.81.1 U
0.45 U0.45 U2.570
0.45 U0.81 U2.7 U135 U
0.015 U0.015 U0.001 J0.81 U
0.015 U0.23 U0.45 U
0.015 U0.015 U0.015 U
1400.015 UNRNR44.9
505-038/27/93
0.0036 U0.0036 U0.0036 U0.01 1 U0.3G U
0.0019 U0.0019 U0.011 U40.900
32.917.4005980.11 UNR
0.011 U0.36 U0.3C U0.36 U47.70.90.36 U0.36 U
17,3000.36 U0.66 U2.2 U123 B
0.011 U0.011 U0.011 U
1.6 B0.011 U0.19 U0.36 U
0.011 U0.011 U0.011 U
1450.011 UNRNR122
505-048/27/93
0.0045 U0.0045 U0.0045 U0.012 U0.45 U
0.0023 U0.0023 U0.012 U54.800
37.420.900
6740.84NR
0.002 U0.45 U0.45 U0.45 U601.1 U
0.45 U0.45 U
17.3000.45 U0.81 U2.7 U
498 B0.012 U0.012 U0.012 U
1.2 B0.0008 J
0.23 U0.45 U
0.012 U0.012 U
0.0005 J195
0.012 UNRNR169
505-058/27/93
0.0037 U0.0037 U0.0037 U0.012 U0.37 U
0.0019 U0.0019 U0.012 U45,100
20.914.100599
0.11 UNR
0.012 U0.37 U0.37 U0.37 U50.10.9 U
0.37 U0.26 UBJ
12.7000.37 U0.67 U2.2 U209 B
0.012 U0.012 U0.012 U
1.5 B0.0003 J
0.19 U0.37 U
0.012 U0.012 U0.012 U
1340.012 UNRNR144
505-OG8/27/93
0.0038 U0.0038 U0.0038 U0.012 U0.38 U0.002 U0.002 U0.012 U52,000
30.720.100
5040.12 UNR
0.002 U0.38 U0.38 U0.38 U52.50.92 U0.38 U0.16 UBJ
16.6000.38 UO.G9 U2.3 U237 B
0.012 U0.012 U
O.OOOG J1.2 B
0.0006 J0.2 U
0.38 U0.012 U0.012 U
0.0004 J179
0.012 UNRNR145
505-S8/1C/93
0.0037 U0.0037 U0.0037 U0.011 U0.37 U
0.0019 U0.0019 U0.011 U53.700
45.9 •13.6004880.93NR
0.001 UBJ0.37 U0.37 U0.37 U39.20.9 U0.37 U0.37 U
11.7000.37 U0.68 U2.3 U463 B
0.011 U0.011 U0.011 U0.99 BW
0.001 J0.19 U0.37 U
0.011 U0.011 Uo.oi i u
1530.011 UNRNR166
509-018/12/93
0.071 U0.071 U0.071 U0.015 U0.71 U0.037 U0.037 U0.015 U46.600
226 '12,900
6402
NR0.015 U0.71 U0.71 U0.71 U46.91.7 U
0.71 U0.71 U
12.5000.71 U0.65 U2.2 U128 B
0.0009 J0.015 U0.003 J
1 BW0.0006 J
3.7 UO.S9
0.004 UBJ0.015. U0.015 U
1360.015 UNRNR299
509-028/12/93
0.004 U0.004 U0.004 U0.011 u
1.6 U0.002 U0.002 U0.011 U50.700
69.3 •14.700
7010.92NR
0.002 UBJ1.6 U1.6 U1.6 U
66.33.9 U1.6 U1.6 U
14.1001.6 U
0.72 U2.4 U153 B
0.011 U0.011 U0.011 U
1.1 BW0.001 J
0.2 U0.47 j
O.OOOG J0.011 U0.01 1 U
1530.011 UNRNR541
509-038/23/93
0.037 U0.037 U0.037 U0.012 U0.37 U0.019 U0.019 U0.012 U40,600
15512.9006523.2NR
0.012 U0.37 U0.37 U0.37 U52.60.91 U0.37 U0.37 U
13.400 •0.37 U0.68 U2.3 U180 B
0.012 U0.012 U0.012 U
0.9 B0.012 U
1.9 U0.37 U
0.012 U0.012 U0.012 U
1270.012 UNRNR314 •
509-048/12/93
0.0046 U0.0046 U0.0046 U0.011 U0.28 J
0.0024 U0.0024 U0.011 U48,500
45.3 •15.4008130.95NR
0.011 U0.92 U0.92 U0.92 U50.62.2 U
0.92 U0.24 J
14.5000.48 J0.83 U2.8 U217 B
0.011 U0.011 U0.011 U
1.2 BW0.002 J0.24 U0.92 U
0.011 U0.011 U0.001 J
1470.011 UNRNR232
509-058/23/93
0.077 U0.077 U0.077 U0.012 U
3.8 U0.04 U0.04 U
0.0008 J32.900
207 S5.7304832.5NR
0.012 U3.8 U3.8 U3.8 U
21.79.3 U3.8 U3.8 U
6.910 •3.8 U0.7 U2.6189 BNW
0.012 U0.012 U0.012 U
0.7 U0.012 U
6.83.8 U
0.012 U0.012 U0.012 U
920.012 UNRNR400 "
509-068/12/93
0.0047 U0.0047 U0.0047 U0.013 U
U.47 U0.0024 U0.0024 U0.013 U47.200
38.9 •11.200
5571.4NR
0.013 U0.47 U0.47 U0.47 U31.21.1 U
0.47 U0.81
10.2000.47 U0.85 U2.8 U142 U
0.013 U0.013 U0.013 U
1 BW0.013 U0.24 U0.47 U
0.013 U0.013 U0.013 U
1340.013 UNRNR128
Footnotes are presented on the last page. Page 4 of 13
O"LT

Table B-2Surface Soil Data for Exposure Unit 1 (EU-1) at the Aqua-Tech Site
Location/Sample Datea
AnalyteAcetoneAldrinAluminumAnlimntivAroclor-1242Aroclor-1248Aroclor-1254ArsenicBariumlenzaldelvyde •Jenzenelenzenc. isopropyl
lenzo(a)pyreneBenzo(b)fluoranthenelenzo(g.h.i)peryleneJenzo(k)(luorantheneiery IliumJHC. gamma- (lindane)iiphenylHs(2-elhylhexyl)phthalateJutanone. 2-JutylbcnzylptuhalateCadmiumCalciumCarbon disulfideChlordane. alpha*Chlordane. gamma-ChlorobenzeneChlororormChloromethaneChlorophenyl phenyl ether, 4-ChromiumChryseneCobalt2opperCyanide, total-yclohexaneODD, 4.4'-DDE. 4.4'-DDT. 4,4'-Dl-n-bulylplitlialateDi-n-octylphthalateDichloroethane. 1.1-Dichloroelhane. 1,2-Dichloroethene, cis-1.2-Dichloroethene, trans-1,2-Dichloroethenc (total). 1,2-Dicliloropropane, 1.2-DieldrlnDiethylphthalateDimelhylphthalaleDinltrotoluene. 2.4-Endosulfan IEndosulfan IIEndosulfan sulfote
509-078/23/93
0.005 UBJ0.0019 U57.200 '
2.2 U0.037 UNR
0.0694.4609 N'NR
0.012 UNR0.37 U0.37 U0.37 UNR0.37 U1.1 U
0.0019 UNR0.32 J
0.012 U0.37 U1.5 •
1.8100.012 U0.0019 U0.0019 U0.012 U0.012 UNRNR77 •
0.37 U17
52.2 •2.8 UNR
0.0037 U0.0037 U0.0037 U0.057 UBJ0.37 U
0.012 UNRNRNR
0.012 U0.012 U0.0037 U
0.37 UNR0.37 U
0.0019 U0.0037 U0.0037 U
510-018/25/93
0.007 UBJ0.0024 U61.000
2.8 U0.040 UNR
0.046 U0.83 U596NR
0.012 UNR0.46 U0.46 U0.46 UNR0.46 U1.4 U
0.0024 UNR11 D
0.012 U0.46 U1.4 U770 B
0.012 U0.0024 U0.0024 U0.012 U0.012 UNRNR54.50.46 U15.915.43.5 UNR
0.0046 U0.0046 U0.0046 U
0.46 U0.46 U
0.012 U• NR
NRNR
0.012 U0.012 U0.0046 U
0.4C UNR0.46 U
0.0024 U0.0046 U0.0046 U
510-02 510-038/25/93 8/24/93
0.012 U 0.004 UBJ0.0023 U 0.0022 U66.200 63,600 '
2.7 U 2.6 U0.045 U 0.042 UNR NR
0.045 U 0.042 U0.81 U 1.1 B922 984 N-NR NR
0.012 U 0.013 UNR NR0.45 U 0.42 U0.45 U 0.42 U0.45 U 0.42 UNR NR0.45 U 0.42 U1.7 1.3 U
0.0023 U 0.0022 UNR NR0.45 U 0.42 U
0.012 U 0.013 U0.45 U 0.42 U1.4 U 1.3 U
3.720 1.3800.012 U 0.013 U0.0023 U 0.0022 U0.0023 U 0.0022 U0.012 U 0.013 U0.012 U 0.013 UNR NRNR NR70.6 67.5 '0.45 U 0.42 U23.1 19.716.7 13.5 '3.4 U 3.2 UNR NR
0.0045 U 0.0042 U0.0045 U 0.0042 U0.0045 U 0.0042 U
0.15 J 0.59 U0.45 U 0.42 U
0.012 U 0.013 UNR NRNR NRNR NR
0.012 U 0.013 U0.012 U 0.013 U0.0045 U 0.0042 U
0.45 U 0.42 UNR NR0.45 U 0.42 U
0.0023 U 0.0022 U0.0045 U 0.0042 U0.0045 U 0.0042 U
510-048/24/93
0.005 UBJ0.002 U68.000 '
2.4 U0.04 UNR0.04 U1.5 B
1.360 N'NR
0.012 UNR0.4 U0.4 U0.4 UNR0.4 U1.2 U
0.002 UNR0.4 U
0.012 U0.4 U1.2 U
3.5200.012 U0.002 U0.002 U0.012 U0.012 UNRNR84.8 •0.4 U279.2 ' -3 U
NR0.004 U0.004 U0.004 U0.44 U0.4 U
0.012 UNRNRNR
0.012 U0.012 U0.004 U
0.4 UNR0.4 U
0.002 U0.004' U '0.004 U
510-04 (DUP)8/24/93
0.005 UBJ0.0021 U61,700
NR0.041 UNR
0.041 U1.5 B
1.270 NJ-NR
0.012 UNR0.41 U0.41 U0.41 UNR0.41 U1.3 U
0.0021 UNR0.41 U
0.012 U0.41 U1.3 U'
3.5200.012 U0.0021 U0.0021 U0.012 U0.012 UNRNR78.9 '0.41 U24.77.7 •3.1 UNR
0.0041 U0.0041 U0.0041 U
0.12 UBJ0.41 U
0.012 UNRNRNR
0.012 U0.012 U0.0041 U
0.41 UNR0.41 U
0.0021 UNRNR
510058/25/93
0.009 UBJ0.0024 U55.300
2.8 U0.046 UNR
0.04G U0.85 U807NR
0.014 UNR0.46 U0.46 U0.4C UNR0.46 U1.5
0.0024 UNR0.46 U
0.014 U0.46 U1.4 U
4,1000.014 U0.0024 U0.0024 U0.014 U0.014 UNRNR60.70.46 U30.717.G3.5 UNR
0.0046 U0.0046 U0.0046 U
0.46 U0.46 U
0.014 UNRNRNR
0.014 U0.014 U0.0046 U
0.4G UNR0.46 U
0.0024 U0.0046 U0.0046 U
510-UG8/24/93
0.01 UBJ0.0021 U58,600
2.4 U0.04 UNR0.04 U0.73 U1.000NR
0.017 UNR0.4 U0.4 U0.4 UNR0.4 U1.4
0.0021 UNR0.4 U
0.017 U0.4 U1.2 U
5.0000.017 U0.0021 U0.0021 U0.017 U0.017 UNRNR76.60.4 U25.215.5
3 UNR
0.004 U0.004 U0.004 U
0.4 U0.4 U
0.017 UNRNRNR
0.017 U0.017 U0.004 U
0.4 UNR0.4 U
0.0021 U0.004 U0.004 U
510-078/24/93
0.004 UBJ0.0018 U59.000 '
2.2 U0.036 UNR
0.036 U0.66 B1.040 N-NK
0.012 UNR1.4 U1.4 U1.4 UNR1.4 U1.3
0.0018 UNR1.4 U
0.012 U1.4 U1.1 U
3.9200.012 U0.0018 U0.0018 U0.012 U0012 UNRNR75.1 •1.4 U24
14.4 . •2.7 UNR
0.0036 U0.0036 U0.0036 U
0.41 UBJ1.4 U
0.012 UNRNRNR
0.012 U0.012 U0.0036 U
1.4 UNR1.4 U
0.0018 U0.0036 U0.0036 U
510-088/24/93
0.005 UBJ0.0021 U49,400 '
2.5 UO.U41 UNR
0.041 U0.75 U840 N-NR
0.014 UNR0.41 U0.41 U0.41 UNR0.41 U1.3 U
0.0021 UNR0.41 U
0.014 U0.41 U1.3 U
2.0600.014 U0.0021 U0.0021 U0.014 U0.014 UNRNR63.6 '0.41 U22.39.1 •3.1 UNR
0.0041 U0.0041 U0.0041 U
0.41 U0.41 U
0.014 UNRNRNR
0.014 U0.014 U0.0041 U
041 UNR0.41 U
0.0021 U0.0041 U0.0041 U
510-098/24/93
0.005 UBJ0.002 U47,900
2.4 UU.04 UNR0.04 U0.72 U951NR
0.011 UNR0.4 U0.4 U0.4 UNR0.4 U1.2 U
0.002 UNR0.4 U
0.011 U0.4 U1.2 U
1.8100.0004 J0.002 U0.002 U0.011 U0.011 UNRNR61.90.4 U19.313.83 U
NR0.004 U0.004 U0.004 U0.18 UBJ0.4 U
0.011 UNRNRNR
0.011 U0.011 U0.004 U
0.4 UNR0.4 U
0.002 U0.004 U0.004 U
510-108/24/93
0.006 UBJ0.0021 U52,600 •
2.4 UU.U4 UNR0.04 U0.73 U925 N'NR
0.012 UNR0.4 U0.4 U0.4 UNR0.4 U1.3
0.0021 UNR0.4 U
0.012 U0.4 U1.2 U
1.4400.012 U0.0021 U0.0021 U0.012 U0.012 UNRNR54.7 •0.4 U20.418.5 '3 U
NR0.004 U0.004 U0.004 U
0.4 U0.4 U
0.012 UNRNRNR
0.012 U0.012 U0.004 U
0.4 UNR0.4 U
0.0021 U0.004 U0.004 U
510-118/24/93
0.016 U0.002 U56.400 '
2.4 UU.U4 UNR0.04 U1.3 B
699 N'NR
0.014 UNR0.4 U0.4 U0.4 UNR0.4 U1.2 U
0.002 UNR0.4 U
0.014 U0.4 U1.2 U
1,5600.014 U0.002 U0.002 U0.014 U0.014 UNRNR53.3 '0.4 U20.812.9 '3 U
NR0.004 U0.004 U0.004 U
0.4 U0.4 U
0.014 UNRNRNR
0.014 U0.014 U0.004 U
0.4 UNR0.4 U
0.002 U0.004 U0.004 U
601-018/23/93
0.011 U0.021 U30.900 '
2.8 BNVVV.It UNR0.41 U2.7
1510 N'NR
0.011 UNR0.41 U0.41 U0.41 UNR0.41 U1.2 U
0.021 UNR1.4
0.011 U0.41 U13.9 •
2,6400.011 U0.021 U0.021 U0.011 U0.011 UNRNR115 '
0.41 U15.6185 '3.7NR
0.085 P0.0470.280.29 UBJ0.41 U
0.011 UNRNRNR
0.011 U0.011 U0.041 U0.41 UNR0.41 U0.021 U0.041 U0.041 U
cn
Footnotes arc presented on the last page. P a g e 5 o f l 3

Table B-2Surface Soil Data for Exposure Unit 1 (EU-1) at the Aqua-Tech Site
Location/Sample Datca
509-07Analytc 8/23/93Endrin 0.0037 UEndrin aldehyde 0.0037 UEndrin ketone 0.0037 UEthylbenzeiio 0.012 Unuoranineiie u.j/ uHeplachlor 0.0019 UHeptachlor cpoxide 0.0019 UHexanone, H- 0.012 UIron 41.900Lead 46.G SMagnesium 11.600Manganese 484Mercury 0.78Melhyl-2-pentanone, 4- NRMelhylene chloride 0.012 UMeihylnaphthalene, 2- 0.37 UMcthylphcnol. 4- ' 0.37 UNaphthalene 0.37 UNickel 32.5Pentachlorophenol 0.9 UPhenanthrene 0.37 UPhenol 0.37 UPolassium 12,200 •Pyrene 0.37 USelenium 0.67 USilver 2.2 USodium 143 BStyrenc 0.012 UTetrachloroethane. 1.1,2.2- 0.012 UTetrachloroethene 0.15Thallium 0.85 BToluene 0.001 JToxaphene 0.19 UTrichlorobenzene. 1.2.4- 0.37 UTrichloroethane, 1,1,1- 0.012 UTrichloroethane. 1,1.2- 0.012 UTrichloroethcne 0.002 JVanadium 130Xylenes (lotal) 0.012 UXylene. m&p- NRXylene. o- NRZinc 136 '
510-018/25/93
0.0046 U0.0046 U0.0046 U0.012 U
0.0024 U0.0024 U0.012 U44.900
14.310.500
410 '0.14 UNR
0.012 U0.46 U0.46 U0.46 U27.41.1 U
0.46 U0.46 U
10.9000.46 U0.83 U2.8 U150 B
0.012 U0.012 U0.012 U0.93 B
0.012 U0.24 U0.46 U
0.012 U0.012 U0.0005 J
1360.012 UNRNR89.9
510-028/25/93
0.0045 U0.0045 U0.0045 U0.012 U
0.0023 U0.0023 U0.012 U52.800
19.319.600679 '0.14 UNR
0.012 U0.45 U0.45 U0.45 U43.71.1 U
0.45 U0.45 U
16,8000.45 U0.81 U2.7 U136 B
0.012 U0.012 U0.0005 J
1 B0.012 U0.23 U0.45 U
0.012 U0.012 U0.0008 J
1610.012 UNRNR125
510-038/24/93
0.0042 U0.0042 U0.0042 U0.013 U
0.0022 U0.0022 U0.013 U50.300
22.316.5006100.13 UNR
0.013 U0.42 U0.42 U0.42 U33.1
1 U0.42 U0.42 U
16.800 '0.42 U0.77 U2.6 U154 B
0.013 U0.013 U0.013 U
1 B0.007 J0.22 U0.42 U
0.013 U0.013 U0.013 U
1650.013 UNRNR124 '
510-048/24/93
0.004 U0.004 U0.004 U0.012 U
0.002 U0.002 U0.012 U55.800
24.421.100
7980.12 UNR
0.012 U0.4 U0.4 U0.4 U46.30.9G U0.4 U0.4 U
22.100 '0.4 U
0.72 U2.4 U139 B
0.012 U0.012 U0.012 U
1 B0.012 U
0.2 U0.4 U
0.012 U0.012 U0.0009 J
1930.012 UNRNR149 '
510-04 (DUP)8/24/93
O.C041 U0.0041 U
NR0.012 U
0.0021 U0.0021 U0.012 U51.500
24.421.100
7980.13 UNR
0.012 U0.41 U0.41 U0.41 U45.5
1 U0.41 U0.41 U
22.100 '0.41 U0.75 U2.5 U139 B
0.012 U0.012 U0.012 U0.96 B
0.012 U0.21 U0.41 L!
0.012 U0.012 U0.0009
1870.012 UNRNR143 '
510-058/25/93
0.0040 U0.0046 UG.00'16 U0.014 U
0.0024 U0.0024 U0.014 U48.600
22.S17.900
811 '0.32NR
0.014 U0.46 U0.46 U0.46 U37.61.1 U
0.46 U0.46 U
15.8000.46 U0.85 U2.8 U141 U
0.014 U0.014 U0.014 U
1.1 B0.014 U0.24 U0.46 U
0.014 U0.014 U0.014 U
1500.014 UNRNR115
510-OG8/24/93
0.004 U0.004 U0.004 U0.017 U
0.0021 U0.0021 U0.017 U52.000
3321.700
718 '0.12 UNR
0.017 U0.4 U0.4 U0.4 U
47.80.98 U0.4 U0.4 U
18,7000.4 U
0.73 U2.4 U235 B
0.017 U0.017 U0.017 U0.81 B
0.017 U0.21 U0.4 U
0.017 U0.017 U0.017 U
1710.017 UNRNR143
510-078/24/93
0.0036 U0.0036 U0.0036 U0.012 U
0.0018 U0.0018 U0.012 U49,300
16.822.300
8250.31NR
0.012 U1.4 U1.4 U1.4 U
52.93.5 U1.4 U1.4 U
20.700 •1.4 U
O.G6 U2.2 U132 B
0.012 U0.012 U0.012 U
1.2 B0.012 U0.18 U1.4 U
0.012 U0.012 . U0.0007 ]
1660.012 UNRNR144 •
510-088/24/93
0.0041 U0.0041 U0.0041 U0.014 U
0.0021 U0.0021 U0.014 U36.500
1S.719.300
6770.13 UNR
0.001 J0.41 U0.41 U0.41 U40.8
1 U0.41 U0.41 U
18.000 '0.41 U0.75 U2.5 U126 U
0.014 U0.014 U0.001 U
1.3 B0.012 U0.21 U0.4! U
0.014 U0.014 U0.014 U
1380.014 UNRNR122 •
510-098/24/93
0.004 U0.004 U0.004 U0.002 J
0.002 U0.002 U0.011 U42.200
80.518.100798 •0.12 UNR
0.002 j0.4 U0.4 U0.4 U43
0.96 U0.4 U0.4 U
16.4000.4 U
0.72 U2.4 U132 B
0.011 U0.011 U0.011 U0.94 BW0.002 J
0.2 U0.4 U
0.011 U0.01 1 U0.0005 J
137O.Oi JNRNR115
510-108/24/93
0.004 U0.004 U0.004 U0.012 U
0.0021 U0.0021 U0.012 U39.600
18.S17.300
6150.12 UNR
0.001 J0.4 U0.4 U0.4 U33
0.98 U0.4 U0.4 U
16.100 '0.4 U
0.73 U2.4 U125 B
0.012 U0.012 U0.012 U
1.1 B0.012 U0.21 U0.4 U
0.012 U0.012 U0.0004 J
1310.012 UNRNR114 •
510-118/24/93
0.004 U0.004 U0.004 U0.014 U
0.002 U0.002 U0.014 U38.900
24.! S14.1001.0700.12 UNR
0.014 U0.4 U0.4 U0.4 U
34.40.96 U0.4 U0.4 U
14.500 '0.4 U
0.72 U2.4 U164 B
0.014 U0.014 U0.014 U
1.2 B0.014 U
0.2 U0.1 U
0.014 U0.014 U0.014 U
1260.014 UNRNR119 •
GOI-018/23/93
0.041 U0.041 U0.041 U0.011 U
0.021 U0.021 U0.011 U32.300
13610.400
6272.7NR
0.011 U0.41 U0.41 U0.41 U30.1
1 U0.41 U0.41 U
12.000 •0.41 U0.75 U2.5 U133 B
0.011 U0.011 U0.011 U0.75 U0.011 U
2.1 U0.41 U
0.011 U0.011 U0.011 U107
o.on uNRNR302 •
cv;c_r:
Footnotes arc presented on the last page. Page 6 of 13

eTable B-2
Surface Soil Data for Exposure Unit 1 (EU-1) at the Aqua-Tech Site
Locnl ion/Sample Date _ .e001-02
Analyle 8/23/93Acetone 0.014 UAldrill 0.04 PAluminum 27,700 'Anlimonv 8.2 BNWAroclor-1242 0.36 UAroclor-1248 NKArocIor-1254 0.36 UArsenic 3.5Barium 2600 N'Bcnzaldehyde NRBenzene 0.0008 Jlenzene, isopropyl NR3cnzo(a)anthraccnc 7.3 UJenzo(a)pyrene 7.3 Uienzo(b)fluoranthene 7.3 U
Benzo{g,h.i)perylene NRBenzo(k)nuoranthcnc 7.3 UBeryllium 1.1 UBHC. gamma- (lindane) 0.019 UBiphcnyl NRBis(2-cthythexyl)phlhalate 25Bulanone. 2- 0.32 JButylbenzylphlhalalc 7.3 UCadmium 11.4 'Calcium 6.750Carbon disulfide 0.011 UChlordane. alpha- 0.019 U^hlordane. gamma- 0.019 U
Chlorobenzene 0.001 JChloroform 0.0007 JChloromelhane NRChloropheny! phcnyl ether, 4- NRChromium 123 "Chrysene 7.3 UCobalt 30.8Copper 513 "Cyanide, total 6.1Cyclohexane NRODD. 4,4'- 0.036 UDDE, 4.4'- 0.036 UDDT, 4.4'- 0.036 UDi-n-butylphthalate 7.3 UDi-n-oclylphthalale 7.3 UDichloroethane, 1.1- O.ONDichloroethane. 1.2- NRDicliloroethenc. cis-1.2- NRDichloroethene. Irans- 1.2- NRDicliloroethenc (total), 1.2- 0.008 JDichloropropane. 1.2- 0.011 UDieldrln 0.036 UDiethylphthalate 7.3 UDimctliylphthalale NRDlnitrotoluene. 2.4- 7.3 UEndosulfanI 0.019 UEndosulfan 11 0.036 UEndosulfan sulfate 0.036 U
601-0310/8/93
0.009 UBJ0.047 U49.400
5,2 BN0.92 UNR0.92 U0.84 U1490 NNR
0.013 UNR0.46 U0.46 U0.46 UNR0.46 U1.4 U
0.047 UNR0.29 J
0.013 U0.46 U1.4 U
6.7200.013 U0.047 U0.047 U0.013 U0.013 UNRNR2140.46 U22.6241 N3.5 UNR
0.092 U0.092 U0.092 U0.46 U0.46 U
0.013 UNRNRNR
0.013 U0.013 U0.092 U0.46 UNR0.46 U
0.047 U0.092 U0.092 U
601-048/23/93
0.009 UBJ0.022 U34.600 '
8.5 BNW0.36 UNR0.36 U3.7 S
2240 N'NR
0.012 UNR4.3 U4.3 U4.3 UNR4.3 U1.3 U
0.022 UNR79 D
0.012 U4.3 U
30.6 '2.9700.012 U0.022 U0.022 U0.012 U0.012 U
. NRNR260 •4.3 U19.8803 '9.4NR
0.043 U0.043 U0.043 U
4.3 U4.3 U
0.012 UNRNRNR
0.012 U0.012 U0.043 U
4.3 UNR4.3 U
0.022 U0.043 U0.043 U
GO 1-058/23/93
0.008 UBJ0.02 U
34,500 •8.5 BNW0.4 UNR0.4 U3.4
2440 N-NR
O.OII UNR1.6 Ul.G Ul.G UNRl.G U1.2 U
0.02 UNR4.3
0.011 U1.6 U7 •
3.7000.011 U0.02 U0.02 U
0.011 U0.011 UNRNR130 •1.6 U
19.9311 •3
NR0.04 U0.04 U0.04 U
l.G Ul.G U
0.011 UNRNRNR
0.011 UO.OII U0.04 Ul.G UNR1.6 U
0.02 U0.04 U0.04 U
CO 1-068/2C/93
0.005 UBJ0.0023 U49.100
2.7 U0.044 UNR
0.044 U1.5 BN957NR
0.013 UNR2.2 U2.2 U2.2 UNR2.2 U1.3 U
0.0023 UNR8.9
0.013 U2.2 U13.4745 B
0.013 U0.0023 U0.0023 U0.013 U0.013 UNRNR
G8.22.2 U13.3 U73.34.GNR
0.0044 U0.0044 U0.0086 P
2.2 U2.2 U
0.013 UNRNRNR
0.013 U0.013 U0.0044 U
2.2 UNR2.2 U
0.0023 U0.0044 U-0.0044 U
601-078/26/93
0.006 UBJ0.002 U50.400
2.4 U0.039 UNR
0.039 U0.72 U1320Nk
0.012 UNR0.39 U0.39 U0.39 UNR0.39 U1.2 U
0.002 UNRO.G
0.012 U0.39 U10.5775 B
0.012 U0.002 U0.002 U0.012 U0.012 UNRNR101
0.39 U23.762.8
3NR
0.0039 U0.0039 UO.OOG7 P0.074 J0.39 U
0.012 UNRNRNR
0.012 U0.012 U0.0039 U
0.39 UNR0.39 U
0.002 U0.0039 U0.0039 U
601-088/26/93
0.011 U0.0018 U46,000
2.2 UO.U31) UNR
0.03G U0.65 U1370NR
O.OII UNR0.3G U0.36 U0.36 UNR0.36 U2.1
0.0018 UNR0.36 U
0.011 U0.3G U1.1 U
4.5100.011 U0.0018 U0.0018 U0.011 U0.011 UNRNR74.30,36 U27.228.62.7 UNR
0.0036 U0.0036 U0.003G U
0.36 U0.36 U
O.OII UNRNRNR
0.011 UO.OII U
0.003G U0.36 UNR0.36 U
0.0018 U0.0036 U0.0036 U
601-098/2G/93
0.009 UBJ0.0022 U53.500
2.6 UU.U4J UNR
0.043 U0.79 U444NR
0.015 UNR0.43 U0.43 U0.43 UNR0.43 U2.6
0.0022 UNR0.43 U
0.015 U0.43 U11.4499 B
0.015 U0.0022 U0.0022 U0.015 U0.015 UNRNR06.90.43 U47.220.43.3 UNR
0.0043 U0.0043 U0.0043 U
0.780.43 U
0.015 UNRNRNR
0.003 J0.015 U0.0043 U
0.43 UNR0.43 U
0.0022 U0.0043 U0.0043 U
601-108/20/93
0.003 UBJ0,0019 U54.100
2.2 UU.IMO UNR
0.036 U0.66 U620NR
0.011 UNR0.30 U0.36 U0.36 UNR0.36 U2.1
0.0019 UNR0.36 U
0.011 U0.36 U1.9626 B
0.011 U0.0019 U0.0019 U0.011 U0.011 UNRNR71
0.36 U21.762.42.8 UNR
0.0036 U0.0036 U0.0110.11 J0.36 U
0.01 1 UNRNRNR
0.011 UO.OII U0.0036 U
0.36 UNR0.36 U
0.0019 U0.0036 U0.003G U
AA-018$'93
0.014: UO.OOlS U19,20!)
2.1, Uu.uj: uNR.
0..03!' Ui.7 BN152NR0.0 1 UNR0.35 U0.35 U0.35 UNR0.35 U1.1 U
0.0018 UNR0.35 U0.01 U0.35 U1.1 U550 B0.01 U
0.0018 U0.0018 U
0.01 Uo.oi uNRNR21.80.35 U10.G U10.3 '2.6 UNR
0.0035 UO.OOG70.0058 P
0.35 U0.35 U0.01 UNRNRNR0.01 U0.01 U
0.0035 U0.35 UNR0.35 U
0.0018 U0.0035 U0.0035 U
AA-028/10/93
0.01 UBJ0.0018 U14.300
2.2 UU.UJU U
NR0.036 U
2.8 N81.6NR
0.011 UNR0.36 U0.36 U0.36 UNR0.36 U1.1 U
0.0018 UNR0.14 J
0.011 U0.631.1 U
1.2100.011 U0.0018 U0.0018 U0.011 U0.011 UNRNR25.90.36 U10.8 U32.9 '2.7 UNR
0.0036 U0.0160.0140.36 U0.36 U
0.011 UNRNRNR
0.011 U0.011 U0.0036 U
0.36 UNR0.36 U
0.0018 U0.0036 U0.0036 U
AA-fa8/10/83
0.011 TJ0.0018 U12.500
2.1 U. --- ItU.UJJ 'J
NR .0.035 U
3.4 N81.9NR
O.OII UNR0.35 U0,35 U0.35 UNR0.35 U1.1 U
0.0018 UNR0.35 U
0.011 U0.35 U1.1 U
1.2600.01 1 U0.0018 U0.0018 U0.011 U0.011 U
NRNR20.10.35 U10.7 U28.9 '2.7 UNR
0.0035 U0.0280.0390.35 U0.35 U
0.01 1 UNRNRNR
0.011 U0.011 U0.0035 U
0.35 UNR0.35 U
0.0018 U0.0035 U0.0035 U
AA-048/lt/93
0.007' UBJ0.001$ ll41,600 .
H.2 . UUiUJU .1
NR j0.036 U
1.8 fiN372NR
o.on uNR0.36 U0.36 U0.36 UNR0.36 U1.1 U
0.0019 UNR0.36 U
0.011 U0.3G U1.1 U775 B
0.011 U0.0019 U0.0052 P0.011 U0.01 1 UNRNR43
0.36 U11 U20 •2.7 UNR
0.0036 U0.0036 U0.0036 U
0.36 U0.36 U
0.011 UNRNRNR
0.011 U0.011 U0.0036 U
0.36 UNR0.36 U
0.0019 U0.0036 U0.0036 U
AA-058/9/93
0.009 UBJ0.02 U
14.7002.3 U
U.JO w
NR0.38 U2.9 N
38.2 BNR
0.012 UNR0.38 U0.38 U0.38 UNR0.38 U1.2 U
0.02 UNR0.38 U
0.012 U0.38 U1.2 U704 B
0.012 U0.02 U0.02 U
0.012 U0.012 UNRNR13.30.38 U11.5 U20.1 '2.9 UNR
0.038 U0.120.110.38 U0.38 U
0.012 UNRNRNR
0.012 U0.012 U0.038 U0.11 JNR0.38 U0.02 U0.038 U0.038 U
Footnotes arc presented on the last page. Page TotlS

Table B-2Surface Soil Data for Exposure Unit 1 (EU-1) at the Aqua-Tech Site
AnalyteEndrinEndrin aldehydeEndrin ketone
FluoranthcneHeptachlorHeplachlor epoxideHexanone, 2-!ronLeadMagnesiumManganeseMercuryMethyl-2-penlanone. 4-Methylene chlorideMethylnaphthalene, 2-Melhylphenol. 4-NaplithaleneNickelPentachlorophenolPhenanlhrenePhenolPotassiumPyreneSeleniumSilverSodiumStyreneTetrachlorocthane, 1.1.2.2-Te t rac h loroet he neThalliumTolueneToxapheneTrichlorobenzene, 1.2,4-Trichloroethane, 1,1,1-Trichloroelhane. 1.1,2-TrichloroelheneVanadiumXylenes (total)Xylene, m&p-Xylene. o-Zinc
601-028/23/93
0.036 U0.036 U0.036 Un 71 I
1.2 i0.05 P
0.019 U0.01 1 U35.300
20713.2001,00019.1NR
0.005 J7.3 U7.3 U1.5 J
35.618 U1.5 J7.3 U
14.700 '1.8 J
0.88 B2.2 U510 B
0.011 U0.011 U
250.79 B0.39 J1.9 U2.4 J
0.001 J0.011 U
1.1 J1071.5
NRNR541 '
CO 1-0310/8/93
0.092 U0.092 U0.092 Unmt u0.46 U0.047 U0.047 U0.013 U52.400
49.319.2008050.56NR
0.013 U0.46 U0.46 U0.46 U46.61.1 U
0.46 U0.46 U
20.0000.46 U0.84 U2.8 U209 B
0.013 U0.013 U0.013 U
1.2 B0.011 J
4.7 U0.46 U
0.013 U0.013 U0.0007 J
1670.013 UNRNR248
GO 1-048/23/93
0.043 U0.043 U0.043 Unn\7. I I4.3 U
0.022 U0.022 U0.012 U
35.100379
12.00094013.6NR
0.012 U4.3 U4.3 U4.3 U60.6
10 U4.3 U4.3 U
13,500 '4.3 U0.78 U2.6 U249 B
0.012 U0.006 J0.004 J0.78 U0.001 J
2.2 U4.3 U
0.012 U0.012 U0.005 J
1140.012 UNRNR577 '
601-058/23/93
0.04 U0.04 U0.04 Uo.noz I
1.6 U0.02 U0.02 U
0.011 U42,600
15015,700
7223.5NR
0.011 U1.6 U1.6 U1.6 U
32.13.9 U1.6 U1.6 U
17.600 '1.6 U
0.72 U2.4 U220 B
0.011 U0.0250.0350.89 B0.002 J
2 U1.6 U
0.002 J0.001 J0.013133
0.016NRNR957 '
G01-OG8/2C/93
0.0044 U0.0044 U0.0044 U0.013 U
2.2 U0.0023 U0.0023 U0.013 U39.300
47.63.830268 •1.4NR
0.013 U2.2 U2.2 U
0.44 J11.55.3 U2.2 U2.2 U
4.2602.2 U0.8 U2.7 U212 B
0.013 U0.008 J0.006 J
0.8 U0.013 U
0.23 U2.2 U
0.002 J0.013 U0.01 J99.8
0.013 UNRNR127
601-078/2C/93
0.0039 U0.0039 U0.0039 U0.012 U0.39 U
0.002 U0.002 U0.012 U55.200
44.820.900
838 '2.1NR
0.012 U0.39 U0.39 U0.39 U50.70.95 U0.39 U0.39 U
21.5000.39 U0.72 U2.4 U219 B
0.012 U0.004 J0.012 U
1.1 B0.0004 J
0.2 U0.39 U
0.012 U0.012 U0.0005 J
1650.012 UNRNR231
Location/Sa601-088/26/93
0.0036 U0.0036 U0.003G U0.011 U0.36 U
0.0018 U0.0018 U0.011 U50.500
19.821.400
924 '0.3NR
0.01! U0.30 U0.36 U0.36 U39.10.87 U0.36 U0.36 U
23.6000.36 U0.65 U2.2 U210 B
0.011 U0.011 U0.011 U
1.1 B0.011 U
0.18 U0.36 U
0.011 Uo.on uo.on u
1680.011 uNRNR177
nplc Dale a
601-098/26/93
0.0043 U0.0043 U0.0043 U0.015 U0.43 U
0.0022 U0.0022 U0.015 U44,200
14.413.500
532 '0.13 UNR
0.015 U0.43 U0.43 U0.43 U22.71.1 U
0.43 U0.43 U
11.8000.43 U0.79 U2.6 U196 B
0.015 U0.015 U0.004 J
1.2 B0.008 J
0.22 U0.43 U
0.015 U0.015 U0.015 U
1210.015 UNRNR163
601-108/26/93
0.0036 U0.0036 U0.0036 U0.011 U0.36 U
0.0019 U0.0019 U0.011 U43.900
27.415.800
544 '0.24NR
0.011 U0.36 U0.36 U0.36 U35.90.88 U0.30 U0.36 U
14.2000.36 U0.66 U2.2 U213 B
0.011 U0.011 U0.011 U
1.1 B0.011 U
0.19 U0.36 U
0.011 U0.011 Uo.on u136
o.on uNRNR162
AA-018/9/93
0.0035 U0.0035 U0.0035 U
0.01 U0.35 U
0.0018 U0.0018 U
0.01 U19.000
32.8 N2.880
1270.17 'NR
0.001 UBJ0.35 U0.35 U0.35 U8.5 U
0.85 U0.35 U0.35 U
2.9100.35 U0.64 U2.1 U106 U
0.01 U0.01 U0.01 U0.64 U0.003 J
0.18 U0.35 U0.01 U0.01 U0.01 U50.20.01 UNRNR
46.6
AA-028/10/93
0.0036 U0.0036 U0.0036 U0.011 U0.36 U
0.0018 U0.0018 U0.011 U22.00078.3 N
1,540112
0.29 'NR
0.001 UBJ0.36 U0.36 U0.36 U10.80.87 U0.36 U0.36 U
2.0100.36 U0.65 U2.2 U108 U
0.011 U0.011 U0.011 U0.65 U
0.0007 J0.18 U0.36 U
0.011 U0.011 U0.011 U
490.011 UNRNR95.1
AA-038/10/93
0.0035 U0.0035 U0.0035 U0.011 U0.35 U
0.0018 U0.0018 U0.011 U19,100
57.7 N1.610144
0.21 'NR
0.001 UBJ0.35 U0.35 U0.35 U10.30.85 U0.35 U0.35 U2.0200.35 U0.64 U2.1 U107 U
0.011 U0.011 U0.011 U0.64 U
0.0009 J0.18 U0.35 U
0.011 U0.011 U0.011 U41.4
0.011 UNRNR161
AA-048/11/93
0.0036 U0.0036 U0.0036 U0.011 U
0.36 U0.0019 U0.0019 U0.011 U33.100
28 N5.940239
0.53 'NR
0.011 U0.36 U0.36 U0.36 U23.40.88 U0.36 U0.36 U5.6500.36 U0.66 U2.2 U110 U
0.011 U0.011 U0.011 U0.66 U
0.001 J0.19 U0.36 U
0.011 U0.011 Uo.on u
88.30.011 UNRNR62
AA-058/9/93
0.038 U0.038 U0.038 U0.012 U0.38 U0.02 U0.02 U
0.012 U27,300
35.1 N486 B73.30.22 *NR
0.012 U0.38 U0.38 U0.38 U9.6
0.92 U0.38 U0.38 U604 B0.38 U0.69 U2.3 U115 U
0.012 U0.012 U0.012 U0.69 U
0.0006 J2 U
0.38 U0.012 U0.012 U0.012 U
28.10.012 UNRNR100
o_..1
01Footnotes arc presented on the last page. P a g e 8 o f l 3

Table B-2Surface Soil Data for Exposure Unit 1 (EU-1) at the Aqua-Tech Site
AnalytcAcetoneAldrinAluminumAnllmonvAroclor-1242Aroclor-1248Aroclor-1254ArsenicBariumBenzaldehydeienzeneJenzene. isopropylJenzo(a)anthraceneJenzo{a)pyreneJenzo(b) fluorantheneJenzo(g.li.i)peryleneJenzo(k) fluoranthene
Beryllium1HC, gamma- (Hndane)liphenyl
B/s(2-etnyl)iexyl)plithalateButanone. 2-iutylbenzylphthalateCadmiumCalciumCarbon disulfideChlordane. alpha-Chlordane. gamma-ChlorobenzeneChloroformChloromethaneChlorophenyJ plienyl ether. 4-ChromiumChryscneCobaltCopperCyanide, totalCyclohexaneODD. 4.4'-DDE. 4.4'-DDT. 4.4'-Di-n-butylphthalatcDi-n-octylphtho!ateDichlorocthane. 1.1-Dichloroetliane. 1,2-Dichloroelliene. cis-1.2-Dichloroethene. lrans-1.2-Dichloroethene (total). 1,2-Dichloropropane, 1,2-OicldrinDlelliylphthalaleDimethylphthalateDinitrololuene. 2,4-Endosulfan IEndosulfan 11Endosulfan sulFate
Location/Sample DateAA-OG8/9/93
0.009 UBJ0.0019 U8.760
2.2 U0.037 UNR
0.037 U1.7 BN
49.1NR
0.011 UNR0.37 U0.37 U0.37 UNR0.37 U1.1 U
0.0019 UNR0.37 U
0.011 U0.37 U1.1 U512 B
0.011 U0.0019 U0.0019 U0.011 U0.011 UNRNR14
0.37 U11.2 U6.7 •2.8 UNR
0.0037 U0.0130.010.37 U0.37 U
0.011 UNRNRNR
0.011 U0.011 U
0.0037 U0.37 UNR0.37 U
0.0019 U0.0037 U0.0037 U
AA-078/10/93
0.011 U0.0018 U12.900
2.1 U0.035 UNR
0.035 U2.8 N
70.2NR
0.011 UNR0.35 U0.35 U0.35 UNR0.35 U1.1 U
0.0018 UNR0.35 U
0.011 U0.35 U1.1 U
1.1100.011 U
0.0018 U0.0018 U0.011 U0.011 UNRNR14.30.35 U10.7 U18.4 '2.7 UNR
0.0035 U0.0590.0550.35 U0.35 U
0.011 UNRNRNR
0.011 U0.01 1 U0.0035 U
0.35 UNR0.35 U
0.0018 U0.0035 U0.0035 U
AA-088/10/93
0.009 UBJ0.00188.140
2.2 U0.036 UNR
0.036 U2.6 N
52.2NR
0.011 UNR0.36 U0.36 U0.36 UNR0.36 U1.1 U
0.0018 UNR0.36 U
0.011 U0.36 U1.1 U723 B
0.01 1 U0.0018 U0.00240.011 U0.011 UNRNR11.10.36 U10.9 U11.2 '2.7 UNR
0.0036 U0.0140.007 P0.36 U0.36 U
0.011 UNRNRNR
0.011 U0.01 1 U0.0036
0.21 JNR0.36 U
0.00180.00360.0036
AA-098/10/93
0.01 UBJ0.0018 U26.700
2.1 U0.035 UNR
0.035 U2.2 N
94.7NR
0.01 1 UNR0.35 U0.35 U0.35 UNR0.35 U1.1 U
0.0018 UNR0.35 U
0.011 U0.35 U
1.1 U1.4300.011 U0.0018 U0.0018 U0.011 Uo.on uNRNR14.30.35 U10.6 U32.9 •2.7 UNR
0.0035 U0.0035 U0.0035 U
0.35 U0.35 U
0.011 UNRNRNR
0.011 U0.01 1 U0.0035 U
0.35 UNR0.35 U
0.0018 U0.0035 U0.0035 U
A A- 108/10/93
0.012 U0.0018 U22.800
2.2 U0.036 UNR
0.036 U1.3 BN
53.3NR
0.011 UNR0.36 U0.36 U0.36 UNR0.3G U1.1 U
0.0018 UNR0.36 U
0.011 U0.30 U
1.1 U759 B
0.011 U0.0018 U0.0018 U0.011 U0.011 UNRNR38.10.3C U10.9 U25.9 •2.7 UNR
0.0036 U0.0036 U0.0036 U
0.36 U0.36 U
0.011 UNRNRNR
0.011 U0.01 1 U
0.003C U0.3G UNR
0.3G U0.0018 U0.003G U •0.0036 U
A A- 118/10/93
0.006 UBJ0.0018 U12.300
2.2 U0.035 UNR
0.035 U2.1 BN
43.3NR
0.011 UNR0.35 U0.35 U0.35 UNR0.35 U1.1 U
0.0018 UNR0.35 U
0.011 U0.35 U
1.1 U983 B
0.011 U0.0018 U0.0018 U0.011 U0.011 UNRNR10.50.35 U10.8 U11 '2.7 UNR
0.0035 U0.01
0.00920.35 U0.35 U
0.011 UNRNRNR
0.011 U0.01 1 U0.0035 U
0.35 UNR0.35 U
0.0018 U0.0035 U0.0035 U
AA-128/1 1/93
0.009 UliJ0.0022 U19.500
2.6 U0.042 UNR
0.042 U3.1 N56.5NR
0.012 UNR0.42 U0.42 U0.42 UNR0.42 U1.3 U
0.0022 UNR0.42 U
0.012 U0.42 U1.3 U
464 B0.012 U
0.0038 P0.00570.012 U0.012 UNRNR27.20.42 U12.8 U22.G3.2 UNR
0.0042 U0.0042 U0.00.12 U
0.42 U0.42 U
0.012 UNRNRNR
0.012 U0.012 U
0,0042 U0.42 UNR
0.42 U0.0022 U0.0042 U0.0042 U
AA-138/10/93
0.006 UBJ0.0019 U43.000
2.3 U0.34 PNR
0.037 U1.1 BNW533NR
0.011 UNR0.37 U0.37 U0.37 UNR0.37 U1.1 U
0.0019 UNR0.18 J
0.011 U0.37 U1.1 U
1.3700.01 1 U
0.0019 U0.0019 U0.011 U0.011 UNRNR81.20.37 U13.450.3 '2.8 UNR
0.0037 U0.0037 U0.0037 U
0.37 U0.37 U
0.011 UNRNRNR
0.011 U0.011 U0.0037 U
0.37 UNR0.37 U
0.0019 U0.0037 U0.0037 U
A A- 13028/10/93
NR0.002 U54,200
2.3 U0.2 PNR
0.038 U2.4 NSG02NRNRNR0.38 U0.38 U0.38 UNR0.38 U1.1 U
0,002 UNR0.38 UNR0.38 U1.1 U
1,090 BNR
0.002 U0.002 UNRNRNRNR82.10.38 U17.944.32.9 UNR
0.0038 U0.0038 U0.0038 U
0.38 U0.38 UNRNRNRNRNRNR
0.0038 U0.38 UNR0.38 U
0.002 U0.0038 U0.0038 U
AA-148/11/93
0.012 U0.002 U11.300
2.3 U0.038 UNR
0.038 U1.9 BN
56.7NR0.01 UNR0.38 U0.38 U0.38 UNR0.38 U1.2 U
0.002 UNR0.38 U0.01 U0.38 U1.2 U
1.080 B0.01 U
0.002 U0.002 U0.01 Uo.oi uNRNR17
0.38 U11.6 U14.9 •2.9 UNR
0.0038 U0.0038 U0.0038 U
0.38 U0.38 U0.01 UNRNRNR0.01 U0.01 U
0.0038 U0.38 UNR0.38 U
0.002 U0.0038 U0.0038 U
AA-198/27/93
0.01 UBJ0.0018 U47,100
2.1 U0.035 UNR
0.035 U0.63 U693NR0.01 UNR0.35 U0.35 U0.35 UNR
0.35 U1.1 U
0.0018 UNR
0.35 U0.01 U0.35 U1.1 U
3.3400.01 U
0.0018 U0.0018 U
0.01 Uo.oi uNRNR56.80.35 U17.620.22.6 UNR
0.0035 U0.0035 U0.0035 U0.074 J0.35 U0.01 UNRNRNR
0.01 U0.01 U
0.0035 U0.35 UNR0.35 U
0.0018 U0.0035 U0.0035 U
ERC-0110/8/93
0.0160.0558.G40
130.39NR0.397.5
1.560NK
0.012NR0.780.780.78NR0.781.2
0.14NR12
0.012O.G813.7
4.6400.0120.020.02
0.0120.012NRNR47.70.7811.81893.8NR
0.0390.0390.039
8.62
0.012NRNRNR
0.00050.0120.0390.78NR0.780.020.0390.039
U
BNU
UNSN
U
UUU
UUP
UJ
uuuuu
uuN
Uuu
u
Juuuuuuu
PCL-SA8/20/93
0.013 U0.0022 U40,600 '
2.8 BN0.042 UNR
0.042 U65.6 S123 N-
MR0.012 UNR0.42 U0.42 U0.42 UNR0.42 U1.3 U
0.0022 UNR0.42 U
0.012 U0.42 U1.3 U286 B
0.012 U0.0022 U0.0022 U0.012 U0.012 UNRNR39
0.42 U12.9 U35 '3.2 UNR
0.0042 U0.0042 U0.0042 U
0.42 U0.42 U
0.012 UNRNRNR
0.012 U0.012 U0.0042 U
0.42 UNR0.42 U
0.0022 U0.0042 U0.0042 U
CDFootnotes are presented on t/ic last page. Page 9 of 13

Table B-2Surface Soil Data for Exposure Unit 1 (EU-1) at the Aqua-Tech Site
AnalyteEndrinBndrin aldehydeEndrin ketoneEthylbenzeneriuoranineneHcptachlorHeptachJor epoxideHcxanone, 2-IronLeadMagnesiumManganeseMercuryMethyl-Z-pentanone, 4-Methylene chlorideMethylnaphthalene, 2-Methylphenol. 4-NaphthateneNickelPenlachlorophenolPhenanthrenePhenolPotassiumPyreneSeleniumSilverSodiumStyreneTetrachloroethane. 1.1,2.2-TetrachloroetheneThalliumTolueneToxapheneTrichlorobenzene. 1,2.4-Trichloroelhane. 1.1.1-Trichloroelhanc. 1.1,2-TrichloroetheneVanadiumXylenes (lolal)Xylene. m&p-Xyiene, o-Zinc
Location/Sample DaleAA-OC8/9/93
0.0037 U0.0037 U0.0037 U0.011 U
U.J/ U0.0019 U0.0019 U0.011 U8.08034.3 N810 B36.50.13 •NR
0.011 U0.37 U0.37 U0.37 U
9 U0.9 U
0.37 U0.37 U791 B0.37 U0.67 U2.2 U112 U
0.011 U0.011 U0.011 U0.67 U
0.0006 J0.19 U0.37 U
0.011 U0.011 U0.011 U
18.90.011 UNRNR22
AA-078/10/93
0.0035 U0.0035 U0.0035 U0.011 UU.JJ U
0.0018 U0.0018 U0.011 U15.000
70.7 N720 B72.80.35 'NR
0.011 U0.35 U0.35 U0.35 U8.6 U
0.85 U0.35 U0.35 U734 B0.35 U0.64 U2.1 U107 U
0.011 U0.011 U0.011 U0.64 U
0.0009 J0.18 U0.35 U
0.011 U0.011 U0.01 1 U
18.90.011 UNRNR145
AA-088/10/93
0.00360.00670.00360.011 U
U.OO U
0.00180.00180.011 U8.51025.2 N767 B47.60.48 *NR
0.001 UBJ0.36 U0.36 U0.36 U8.7 U
0.87 U0.36 U0.36 U948 B0.36 U0.65 U2.2 U109 U
0.011 U0.011 U0.01 1 U '0.65 U
0.011 U0.18 U0.36 U
0.011 U0.011 U0.011 U21.1
0.011 UNRNR29.8
AA-098/10/93
0.0035 U0.0035 U0.0035 U0.01 1 UU.OJ \J
0.0018 U0.0018 U0.01 1 U23.600
28.3 N2.870162
0.54 'NR
0.011 U0.35 U0.35 U0.35 U9.9
0.85 U0.35 U0.35 U3.9300.35 U0.64 U2.1 U106 U
0.011 U0.011 U0.011 U0.64 U
0.0005 J0.18 U0.35 U
0.011 U0.011 U0.011 U58.4
0.011 UNRNR56
AA-108/10/93
0.0036 U0.0036 U0.0036 U0.011 UU.JU VJ
0.0018 U0.0018 Uo.oii u29.100
28.2 N2.36088.60.14 'NR
0.011 U0.36 U0.36 U0.36 U8.7 U
0.87 U0.36 U0.36 U3.0900.36 U0.65 U2.2 U109 U
0.011 U0.011 U0.011 U0.65 U
0.002 J0.18 U0.36 U
0.0004 J0.011 U0.001 J
1540.011 UNRNR61.9
AA-118/10/93
0.0035 U0.0035 U0.0035 U0.011 UU.JJ W
0.0018 U0.0018 U0.011 U9.700
30 N695 B56.10.15 'NR
0.011 U0.35 U0.35 U0.35 U8.6 U
0.86 U0.35 U0.35 U840 B0.35 U0.65 U2.2 U108 U
0.011 U0.011 U0.011 U0.65 U
0.001 J0.18 U0.35 U
0.011 U0.011 U0.011 U
180.011 UNRNR52.7
AA-128/11/93
0.00420.00420.00420.012u.tfc
0.00220.00220.01222.700
38.277378
0.44NR
0.0120.420.420.4210.2
10.420.428250.420.772.6128
0.012. 0.012
0.0120.770.0020.220.42
0.0120.0120.01252.5
0.012NRNR30
UUUU*jUUuNB
•
UUUuuuuuBUUUuuuuuJuuuuuu
AA-138/10/93
0.0037 U0.0037 U0.0037 U0.011 UC.oT «J
0.0019 U0.0019 U0.011 U48.200
56.3 N10.600
4521.5NR
0.011 U0.37 U0.37 U0.37 U34.30.9 U
0.37 U0.37 U
9.7800.37 U0.68 U2.3 U113 U
0.011 U0.011 U0.011 U0.76 BNW
0.001 J0.19 U0.37 U
0.011 U0.011 U0.011 U
1340.011 UNRNR111
A A- 13028/10/93
0.0038 U0.0038 U0.0038 U
NRC.33 'J
0.002 U0.002 UNR
53.80089.5 N9,3604261.2NRNR0.38 U0.38 U0.38 U46
0.92 U0.38 U0.38 U
8,4500.38 U0.69 U2.3 U115 UNRNRNR0.69 UNR0.2 U
0.38 UNRNRNR139NRNRNR106
A A- 1 48/11/93
0.0038 U0.0038 U0.0038 U
0.01 UC.3C w
0.002 U0.002 U0.01 U
14.00029.9 N1.150 B87.10.3NR
0.001 UB]0.38 U0.38 U0.38 U9.3 U
0.93 U0.38 U0.38 U1,6400.38 U0.69 U2.3 0116 U
0.01 U0.01 U0.01 U0.69 U
0.002 J0.2 U
0.38 U0.01 U0.01 U0.01 U39.20.01 UNRNR33.2
AA-198/27/93
0.0035 U0.0035 U0.0035 U
0.01 UC.3C ~'
0.0018 U0.0018 U
0.01 U41.700
47.513.800
5600.11 UNR
0.01 U0.35 U0.35 U0.35 U25.30.84 U0.35 U0.1 UBJ
14,1000.35 U0.63 U2.1 U105 U
0.01 U0.01 U
0.0006 J0.91 B
0.001 J0.18 U0.35 U0.01 U0.01 U
0.0007 J145
0.01 UNRNR116
ERC-0110/8/93
0.0390.0390.0390.012C.2C0.020.02
0.01214.700
67.65,23022936.1NR
0.0120.780.780.7846.71.9
0.420.324.5500.380.712.4
34400.0120.0120.0030.710.006
20.78
0.0120.0120.00145.8
0.001NRNR343
UUUUJ
Uuu
uuuuuJJJuuuuJuJuuuuJ
PCL-SA8/20/93
0.0042 U0.0042 U0.0042 U0.012 UC.'2 U
0.0022 U0.0022 U0.012 U33.100
33.53.280137
0.13 UNR
0.012 U0.42 U0.42 U0.42 U10.9
1 U0.42 U0.42 U3.290 •0.42 U0.77 U2.6 U129 U
0.012 U0.012 U0.001 J0.77 U
0.0009 J0.22 U0.42 U
0.012 U0.012 U0.006 J79.5
0.012 UNRNR70.3 '
f '1
CD_.. J
ON
Footnotes arc presented o/i the last page. Page 10 of 13

Table B-2Surface Soil Data for Exposure Unit 1 (EU-1) at the Aqua-Tech Site
AnalyteAcetoneAldrinAluminumAntimony
Aroclor-1248Aroclor-1254ArsenicBariumBenzaSdehydeBenzeneBenzene, isopropylBe nzo (a) an t brace neBenzo(a)pyreneBeiizo(b)fluoramheneBe nzo (g . h , i) pery lene3enzo(k)fluorantheneBerylliumBHC, gamma- (Hndane)BiphenylBis(2-elhylhexyl)phthalateButanone. 2-ButylbenzylphthalateCadmiumCalciumCarbon disulfideChlordanc, alpha-Chtordane, gamma-ChlorobcnzeneChloroformChlorotnethaneChlorophenyl phenyl ether, 4-ChromiumChryseneCobaltCopperCyanide, totalCyclohexaneODD. 4.4'-DDE.4.4'-DDT. 4.4'-Di-n-butylphthalateDi-n-octylphlhalateDichloroethane, 1.1-Dichloroetbane, 1,2-Dichtoroothene. cis-1,2-Dichloroetbene. trans-1.2-Dichloroelhene (total). 1.2-Dichioropropane, 1.2-DieldrinDicthylphthalateDimethylphthalatoDinilrotoluene, 2.4-Endosulfan 1Endosulfan IIEndosulfan stilfate
Local iun/Salnple Date a ^GO 1-02 B-2
12/7/01NRNRNRNRnirt
NRNRNRNRNR '
0.005 UNRNRNRNRNRNRNRNRNRNR0.1 UNRNRNRNRNRNR
0.005 UNR
0.005 UNRNRNRNRNRNRNRNRNRNRNRNR
0.005 UNR
0.005 U0.005 UNRNRNRNRNRNRNRNRNR
GDI 02 B 112/7/01NRNRNRNR
NRNRNRNRNR
0.005 UNRNRNRNRNRNRNRNRNRNR0.1 UNRNRNRNRNRNR
0.005 UNR
0.005 UNRNRNRNRNRNRNRNRNRNRNRNR
0.005 UNR3.140.04NRNRNRNRNRNRNRNR 'NR
601-02 B-412/7/01NRNRNRNR
NRNRNRNRNR
0.005 UNRNRNRNRNRNRNRNRNRNR0.1 UNRNRNRNRNRNR
0.005 UNR
0.005 UNRNRNRNRNRNRNRNRNRNRNRNR
0.005 UNR
0.005 U0.005 UNRNRNRNRNRNRNRNRNR
601-02 B-G12/11/01NRNRNRNR
NRNRNRNRNR
0.005 UNRNRNRNRNRNRNRNRNRNR0.1 UNRNRNRNRNRNR
0.005 UNR0.27NRNRNRNRNRNRNRNRNRNRNRNR
0.005 UNR1.9
0.005 UNRNRNRNRNRNRNRNRNR
PCL3 B-312/4/01NRNRNRNR
NRNRNRNRNR
0.005 UNRNRNRNRNRNRNRNRNRNRO.I UNRNRNRNRNRNR
0.005 UNR
0.005 UNRNRNRNRNRNRNRNRNRNRNRNR
0.005 UNR
0.005 U0.005 UNRNRNRNRNRNRNRNRNR
PCL3 B-412/4/01NRNRNRNR
NRNRNRNRNR
0.005 UNRNRNRNRNRNRNRNRNRNR0.1 UNRNRNRNRNRNR
0.005 UNR
0.005 UNRNRNRNRNRNRNRNRNRNRNRNR
0.005 UNR
0.005 U0.005 UNRNRNRNRNRNRNRNRNR
303 B-312/6/01NkNRNRNR
NRNRNRNRNR
0.005 UNRNRNRNRNRNRNRNRNRNR10.5NRNRNRNRNRNR
0.005 UNR
0.005 ' UNRNRNRNRNRNRNRNRNRNRNRNR
0.005 UNR
0.005 U0.005 UNRNRNRNRNRNRNRNRNR
601-02 B-12/ll/OJ0.2NR
21.8003.4
0.30.037
5.1969!.S
0.260.15NR0.490.580.4NR0.56NR1.29.1
11.73.7
4.3100.26NRNR0.260.260.021.6
39.51.5
19.1118
0.25O.Z8NRNRNR1.5
0.810.030.0150.7NRNRNRNRNR4.3NRNRNRNR
1
riD
bjujjjjuJu
u
uuJB
U
BJ
JJB
Footnotes arc presented on tlie last page. Page 11 of 13

Table B-2Surface Soil Data for Exposure Unit 1 (EU-1) at the Aqua-Tech Site
AnalyteEndrinindrin aldehydeindrin ketoneithylbenzeneriLiui'ui'it'iCrtCHeptachlorr-leptachlor epoxideHexanone. 2-[ronLeadMagnesiumManganeseMercuryMelhyl-2-penlanone, 4-Mcthylene chlorideMethylnaphlhalenc. 2-Methylplienol, 4-NaphthaleneNickelPentachlorophenolPhenanthrenePhenolPotassiumPyreneSeleniumSilverSodiumStyreneTelrachlorocthane. 1,1.2,2-TetrachloroetiieneThalliumTolueneToxaphencTrichlorobenzene, 1.2.4-Trichloroclliane. 1.1.1-Trichloroelhane. 1.1.2-TricliloroetheneVanadiumXylenes (total)Xylene, m&p-Xylene. o-Zinc
Local ion/Snniple Date a
COI-02B-212/7/01NRNRNR
0.005NP.NRNRNRNRNRNRNRNRNR0.01NRNR
0.005NRNRNRNRNRNRNRNRNR
0.0050.0050.005NR
0.005NR
0.0050.005NR
0.005NRNR0.010.005NR
U
U
U
UUU
U
UU
U
UU
G O i - O Z B - l12/7/01NRNRNR0.15NT*.NRNRNRNRNRNRNRNRNR0.01 UNRNR .
0.005 UNRNRNRNRNRNRNRNRNR
0.005 U0.005 UO.C7NR
0.005 UNR
0.005 U0.005 UNR0.95 UNRNR0.490.18NR
COI-02B-412/7/01NRNRNR
0.005MO
NRNRNRNRNRNRNRNRNR0.01NRNR
0.005NRNRNRNRNRNRNRNRNR
0.0050.0050.005NR
0.005NR
0.0050.005NR
0.005NRNR0.010.005NR
U
U
U
UUU
U
UU
U
UU
G01-02B-G12/11/01NRNRNR0.3MO
NRNRNRNRNRNRNRNRNR0.01 UNRNR
0.005 UNRNRNRNRNRNRNRNRNR
0.005 U0.005 U17.1NR
0.005 UNR
0.005 U0.005 UNR21.2NRNR0.940.74NR
PCL3 B-312/4/01NRNRNR
0.005MD
NRNRNRNRNRNRNRNRNR0.01NRNR
0.005NRNRNRNRNRNRNRNRNR
0.0050.0050.005
NR0.005NR
0.0050.005NR
0.005NRNR0.010.005NR
U
U
U
UUU
U
UU
U
UU
PCL3 B-412/4/01NRNRNR
0.005 UMP
NRNRNRNRNRNRNRNRNR0.01 UNRNR
0.005 UNRNRNRNRNRNRNRNRNR
0.005 U0.005 U0.005 UNR
0.005 UNR
0.005 U0.005 UNR
0.005 UNRNR0.01 U0.005 UNR
503 B-312/6/01NRNRNR
0.005 UMD
NRNRNRNRNRNRNRNRNR
0.01 UNRNR
0.005 UNRNRNRNRNRNRNRNRNR
0.005 U0.005 U0.005 UNR
0.005 UNR
0.005 U0.005 UNR0.85NRNR0.350.005 UNR
G01-02B-112/11/01NRNRNR0.67n r.i 1NRNR
1 U31.300
42.99.7704491.3
0.19 J0.26 UNR1.5 U
0.99 J25.2NR0.55 J0.42 J
10.8000.57 J0.56 UNR557 U0.26 U0.26 U0.094 J
1.80.37NR
0.042 J0.26 UNR1.3613.6NRNR161
Footnotes are presented on the last page. Page 12 of 13

Table B-2Surface Soil Data for Exposure Unit 1 (EU-1) at the Aqua-Tech Site
a - All concentrations are in units of mg/kg.NR - Not Reported.B - (inorganic) - Less than the required detection limit but greater than the Instrument Detection Limit.B - (organic) - Present in analytical method blank.D - Analyte value from diluted analysis.
M - Elevated detection limit due to matrix effects.N - (inorganic) - Spiked sample recovery not within control limits.P - Concentration difference between the two GC columns is greater than 25 percent.S - Value was determined by the Method of Standard Additions (MSA).U - Less than the detection limit.W - Post-digestion spike for Furnace AA analysis is out of control (85-115%), while sample absorbance is less than
50% of spike absorbance.* - Duplicated analysis not within control limits.
C?N
Page 13 of 13

Table B-3Surface Soil Data for Exposure Unit 2 (EU-2) at the Aqua-Tech Site
AnalyteAcetoneAluminum.AntimonyArsenicBariumBerylliumBHC, beta-CalciumChromiumCobaltCopperODD, 4,4'-DDE, 4,4'-DDT, 4,4'-IronLeadMagnesiumManganeseMercuryNickelPotassiumSodiumThalliumTolueneVanadiumZinc
Location/Sample Date a
33.o oo-t J*j-*i oo-u6/1/98 6/2/98 6/1/98 6/2/98
0.005922,000
1.25.3461.8
0.0022210202.911
0.00570.0180.04
40,00021
34066
0.124.4340511.2
0.001211014
aBBJU*
N
U 0.0057 U 0.011 U 0.0136,000 11,300 J 20,000
U 1.1 U 1.2 JB 1,2 U5.5 2.1 B 3.196 23.5 JB 251 0.34 B 0.41
0.0019 U 0.0018 U 0.0019 U680 117 JB 5924 10.5 J 103.9 1.1 B 1.210 6.3 4.5
0.0038 U 0.0035 U 0.0039 U0.0038 U 0.0035 U 0.0039 U0.0038 U 0.0035 U 0.0039 U25,000 10,400 J 14,000
33 25 27850 497 JB 360180 55.3 J 23
U 0.11 U 0.11 U 0.12 U9.9 2.5 B 2.9
1,000 752 B 480180 116 UB 35 U1.1 U 1.8 U 1.2 U
U 0.0011 U 0.011 U 0.0012 U58 18.8 J 2727 28.2 J 15
- All concentrations are in mg/kg.
(DU-01)
6/2/980.0058 U25,000
1.2 U3.731
0.520.0019 U
76121.73.8
0.0038 U0.0038 U0.0038 U15,000
3344027
0.12 U4.56401101.2 U
0.0012 U3019
- (inorganic) - Less than the required detection limit but greater than- (organic) - Present in analytical method blank.- Estimated concentration.- Less than the detection limit.- Duplicated analysis not within control limits.
33-6/2/98
0.005720.000
1.1326
0.440.0019
778.21.45.4
0.00380.00380.00389,700
2656024
0.113.98402201.1
0.00111919
U
U
U
UUU
U
UU
3D-G/C-1
G/4/980.01429,700
2.83.61961.9
0.0019137022.65.19.7
0.00370.00370.003730,400
23.32,6802010.1110.6
2.10042.71.9
0.01170.331.8
the Instrument Detection
UJJB
J
UJJ
UUUJ
JU
UUU
JLimit.
AA; -08/11/93
0.01419,600
2.22.6
39.31.1
0.001993110.211.18.2
0.00370.0170.01226,500
24.246380.70.128.9448111
0.670.00669.925.3
U
U
BUUB
U
U
*B
UBUUJ
AA1 />
08/11/930.089
20,4002.22.4
30.81.1
0.001821510.510.84.5
0.00350.00350.003524.100
26.276753.30.118.6718108
0.650.02372.320.4
B
U
BUUB
UBUUU*
B
UUBUU
A A 4 -,08/11/93
0.00430,000
2.42.51211.2
0.00253028.812.122.6
0.0040.0040.004
32,40055.3
2,150138
0.5111.6
1,990121
0.720.0008
11241.2
UBJ
UN
UUB
U*
UUU
N
*
UUJ
AA:S08/11/93
0.008 UBJ20,600
2.2 U2 B
1491.1 U
0.0018 U679 B23.410.9 U6.9
0.0036 U0.0036 U0.0036 U19.600
17.3 '1,3603280.11 U8.7 U
1,030 B109 U
0.65 U0.0008 j
52.727
- (Inorganic) - Spiked sample recovery not within control limits.
cn
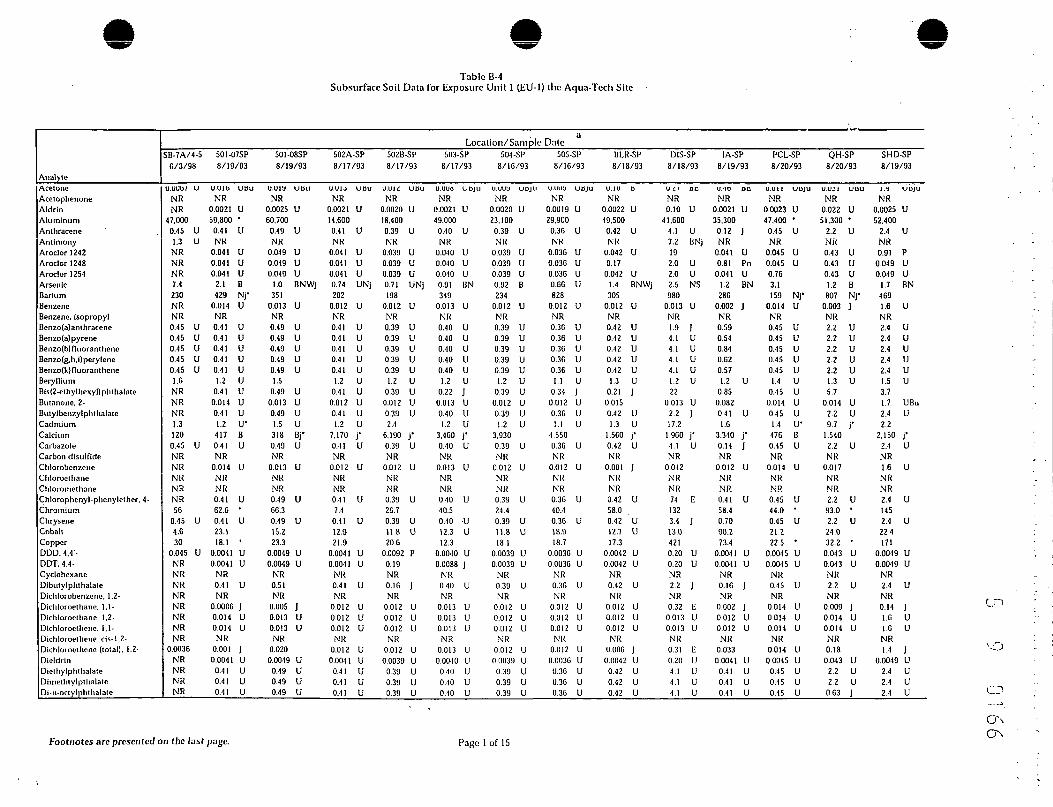
Table B--ISubsurface Soil Data for Exposure Unit 1 (EU-1) the Aqua-Tech Site
AnalyleAcetoneAcctophenoneAldrinAluminumAnthraceneAntimonyAroclor 1243Aroclor 1248Aroclor 1254ArsenicBariumBenzene3enzene, isopropyl3enzo(a)anthracene3enzo(a}pyrene3enzo(b)fluoranthene3enzo(g.h.i)perylene3enzo(k)fluorantheneberylliumBis(2-ethylhexyl)phthala(e3utanone. 2-Butylbcnzylphthalate"admiumCalciumCarbazoleCarbon disulfide-hlorobenzeneClitorocthane"hloromethaneChlorophenyl-phenylether. 4-ChromiumChryseneCobaltCopperDDD.4.41-DDT. 4.4-CyclohexaneDibutylphthalateDichlorobenzene. 1.2-Dichloroetiiane. 1.1-Dichloroethane. 1,2-Dichlorocthene. 1,1-Dichloroethene. cis-1.2-Dichlorocthenc (total). 1.2-DieldrinDiethylphthalaleDimethlylpthalalcDi-n-octylphthalate
aLocation/Sample Date
SB-7A/4-5 501-07SP6/3/98 8/19/93
U.UUU/ U U.UIl) UBUNR NRNR 0.0021 U
47.000 59.800 •0.45 U 0.41 U1.3 U NKNR 0.041 UNR 0.041 UNR 0.041 U7.4 2.1 B230 429 Nj'NR 0.014 UNR NR0.45 U 0.41 U0.45 U 0.41 U0.45 U 0.41 U0.45 U 0.41 U0.45 U 0.41 U1.6 1.2 UNR 0.41 UNR 0.014 UNR 0.41 U1.3 1.2 U'120 417 B
0.45 U 0.41 UNR NRNR 0.014 UNR NRNR NRNR 0.41 U56 62.6 '
0.45 U 0.41 U4.6 23.130 18.1 '
0.045 U 0.0041 UNR 0.0041 UNR NRNR 0.41 UNR NRNR 0.0006 JNR 0.014 UNR 0.014 UNR NR
0.0036 0.001 JNR 0.0041 UNR 0.41 UNR 0.41 UNR 0.41 U
501-08SP8/19/93
u.urj UBUNR
0.0025 U60.700
0.49 UNK
0.049 U0.049 U0.049 U
1.0 BNWj351
0.013 UNR0.49 U0.49 U0.49 U0.49 U0.49 U1.5
0.49 U0.013 U0.49 U1.5 U318 Bj'0.49 UNR
0.013 UNRNR0.49 UGG.30.49 U15.223.3
0.0049 U0.0049 U
NR0.51NR
0.005 J0.013 U0.013 UNR
0.0200.0049 U
0.49 U0.49 U0.49 U
502A-SP8/17/93
u.uu UBUNR
0.0021 U14.6000.41 UNK
0.041 U0.041 U0.041 U0.74 UNj202
0.012 UNR0.41 U0.41 U0.41 U0.41 U0.41 U1.2 U
0.41 U0.012 U0.41 U1.2 U
7.170 j'0.41 UNR
0.012 UNRNR0.41 U7.4
0.41 U12.921.9
0.0041 U0.0041 U
NR0.41 UNR
0.012 U0.012 U0.012 UNR
0.012 U0.0041 U
0.41 U0.41 U0.41 U
502B-SI'8/17/93
U.Uli UBUNR
0.0020 U18.4000.39 UNR
0.039 U0.039 U0.039 U0.71 UNj198
0.012 UNR0.39 U0.39 U0.39 U0.39 U0.39 U1.2 U
0.39 U0.012 U0.39 U2.4
6.190 j'0.39 UNR
0.012 UNRNR0.39 U26.70.39 U11.8 U20.6
0.0092 P0.19NR0.16 JNR
0.012 U0.012 U0.012 UNR
0.012 U0.0039 U
0.39 U0.39 U0.39 U
503-SP8/17/93
U.UUO UBJU
NR0.0021 U49.000
0.40 UNR
0.040 U0.040 U0.040 U0.91 BN349
0.013 UNR0.40 U0.40 U0.40 U0.40 U0.40 U1.2 U
0.22 J0.013 U0.40 U1.2 U
3.460 j'0.40 UNR
0.013 UNRNR0.40 U40.50.40 -U12.3 U12.3
0.0040 U0.0088 j
NR0.10 UNR
0.013 U0.013 U0.013 UNR
0.013 U0.0040 U
0.40 U0.40 U0.40 U
504 -SP8/1G/93
u.uua UBJUNR
0.0020 U23.100
0.39 UNR
0.039 U0.039 U0.039 U0.92 B234
0.012 UNR0.39 U0.39 U0.39 U0.39 U0.39 U1.2 U
0.39 U0.012 U0.39 U1.2 U
3,9300.39 UNR
0.012 UNRNR0.39 U24.40.39 U11.8 U18.1
0.0039 U0.0039 U
NR0.39 UNR
0.012 U0.012 U0.012 UNR
0.012 U0.0039 U
0.39 U0.39 U0.39 U
505-SP8/1G/93
u.uuy UBJUNR
0.0019 U29.900
0.36 UNK
0.036 U0.03G U0.03G UO.GG U828
0.012 UNR0.36 U0.36 U0.3G U0.36 U0.36 U1.1 U
0.34 J0.012 U0.36 U1.1 U
4,5500.3G UNR
0.012 UNRNR0.36 U40.40.3G U18.918.7
0.0036 U0.0036 U
NR0.36 UNR
0.012 U0.012 U0.012 UNR
0.012 U0.0036 U
0.3G U0.3G U0.36 U
liLR-SP8/18/93
u. tu aNR
0.0022 U49.500
0.42 UNK
0.042 U0.17
0.042 U1.4 BNWj305
0.012 UNR0.42 U0.42 U0.42 U0.42 U0.42 U1.3 U
0.21 J0.0150.42 U1.3 U
1.5GO j'0.42 UNR
0.001 JNRNR0.42 U58.00.42 U12.7 U17.3
0.0042 U0.0042 U
NR0.42 UNR
0.012 U0.012 U0.012 UNR
0.006 J0.0042 U
0.42 U0.42 U0.42 U
DIS-SP8/18/93
U.4/ BC
NR0.10 U
41.6004.1 U7.2 iiNj192.0 U2.0 U2.5 NS980
0.013 UNR1.9 ]4.1 U4.1 U4.1 U4.1 U1.2 U22
0.013 U2.2 ]17.2
1.900 j-4.1 UNR
0.042NRNR74 E1323.4 J13.04210.20 U0.20 UNR2.2 JNR0.32 E
0.013 U0.013 UNR0.31 E0.20 U4.1 U4.1 U4.1 U
IA-SP8/19/93
u.io onNR
0.0021 U35.300
0.12 JNR
0.041 U0.81 Pn
0.041 U1.2 BN286
0.002 JNR0.590.540.84O.G20.571.2 U
0.850.0820.41 U1.6
3.340 j'0.14 JNR
0.012 UNRNR0.41 U58.40.7090.273.4
0.0041 U0.0041 U
NR0.1G JNR
0.002 J0.012 U0.012 UNR
0.0330.0041 U
0.41 U0.41 U0.41 U
PCL-SP8/20/93
U . U I l UUJU
NR0.0023 U47.400 '
0.45 UNR
0.045 U0.045 U0.763.1159 Nj'
0.014 UNR0.45 U0.45 U0.45 U0.45 U0.45 U1.4 U
0.45 U0.014 U0.45 U1.4 IT
476 B0.45 UNR
0.014 UNRNR0.45 U44.0 '0.45 U21.222.5 •
0.0045 U0.0045 U
NR0.45 UNR
0.014 U0.014 U0.014 UNR
0.014 U0.0045 U
0.45 U0.45 U0.45 U
QH-SP8/20/93
U.UJl UBU
NR0.022 U51.300 •
2.2 UNR0.43 U0.43 U0.43 U1.2 B807 Nj"
0.003 JNR2.2 U2.2 U2.2 U2.2 U2.2 U1.3 U5.7
0.014 U2.2 U9.7 j'
1.5402.2 UNR
0.017NRNR2.2 U
93.0 •2.2 U
24.032.2 '
0.043 U0.043 UNR2.2 UNR
0.009 J0.014 U0.014 UNR0.180.043 U
2.2 U2.2 U
0.63 ]
SHD-SP8/19/93
1.1 UBJU
NR0.0025 U52,400
2.4 UNR0.91 P
0.049 U0.049 U
1.7 BN4691.6 UNR2.4 U2.4 U2.4 U2.4 U2.4 U1.5 U3.71.7 UBu2.4 U2.2
2.150 j'2.4 UNR1.6 UNRNR2.4 U1452.4 U
22.4171
0.0049 U0.0049 U
NR2.4 UNR0.14 J1.6 Ul.G UNR1.4 J
0.0049 U2.4 U2.4 U2.4 U
-D
Footnotes are presented on the last page. Page 1 of 15

Table B-4Subsurface Soil Data for Exposure Unit 1 (EU-1) the Aqua-Tech Site
Analyte
£thylbenzeneFluorantheneGamma BUG (Lindane)HeptachlorInueno(i.2.3-cd)pyreneironLeadMagnesiumManganeseMercuryMelhyl acetateMethyl cyclohexaneMethyl-2-pentanone. 4-Methylene chlorideMethylphenol. 2-Mcthylphenol. 4-NaphthaleneNickelPemachlorophenolPhenanthrenePhenolPotassiumPyrcneSeleniumSilverSodiumStyreneTetrachloroethane. 1.1.2.2-TetrachloroetheneThalliumTolueneTrichlorobenzene. 1.2,4-Trlchloroethane, 1,1,1-TrichloroethcneTrinuorotrlchloroethaneVanadiumVinyl ChlorideXylcne (total)Xylene. m&p-Xylene, o-ZincCyanide, total
aLocation/Sample Date
SB-7A/4-5 501-07SPG/3/98 8/19/93
NR 0.014 U0.45 U 0.41 UNR 0.0021 UNR 0.0021 U0.45 U 0.4 i u
63.000 39.10032 23.4
1.200 9.860280 3GO0.77 0.12 UNR NRNR NRNR NRNR 0.0008 UBJuNR NR0.45 U 0.41 UNR 0.41 U16 23.7
NR 1.0 U0.45 U 0.41 UNR 0.41 U
1.200 8.510 '0.45 U 0.41 UNR NRNR 2.5 U300 125 UNR NRNR 0.014 UNR 0.0322.3 0.75 U
0.0013 U 0.014 UNR NRNR 0.002 JNR 0.016NR NR110 115NR 0.014 UNR 0.014 UNR NRNR NR35 92.2 •NR 3.1 U
501-08SP8/19/93
0.013 U0.49 U
0.0025 U0.0025 U
0.49 U40.100
21.09.5106080.15 UNRNRNR
0.013 UNR0.49 U0.49 U18.71.2 U
0.49 U0.49 U
8.3900.49 UNR3.0 U149 UNR '
0.013 U0.003 UJu0.90 U0.002 JNR
0.013 U0.001 UJuNR115
0.013 U0.013 UNRNR1043.7 U
502A-SP8/17/93
0.012 U0.41 U
0.0021 U0.0021 U
0.41 u2G.600
4.0 j9.0204880.12 UNRNRNR
0.012 UNR0.41 U0.41 U9.8 U
0.99 U0.41 U0.41 U
11.0000.41 UNR2.5 U161 BNR
0.012 U0.012 U0.74 U
0.0007 UjuNR
0.012 U0.002 UJuNR83.1
0.012 U0.012 UNRNR60.23.1 U
502B-SP 503-S1'8/17/93 8/17/93
0.012 U 0.013 U0.39 U 0.40 U
0.0020 U 0.0021 U0.0020 U 0.0021 U
0.39 u 0.40 U24.800 37.400
26.8 8.1 j7.2GO 9.530390 4340.12 0.12 UNR NRNR NRNR NR
0.012 U 0.013 UNR NR0.39 U 0.40 U0.39 U 0.40 U9.4 15.0
0.94 U 0.98 U0.39 U 0.40 U0.39 U 0.40 U8,540 9.9300.39 U 0.40 UNR NR2.4 U 2.5 U136 B 151 BNR NR
0.012 U 0.013 U0.0009 UJu 0.013 U
0.71 UW 0.74 UW0.0005 UJu 0.013 U
NR NR0.012 U 0.013 U0.001 UJu 0.013 UNR NR73.7 109
0.012 U 0.013 U0.012 U 0.013 UNR NRNR NR63.5 77.02.9 U 3.1 U
504-SP.8/16/93
0.012 U0.39 U
0.0020 U0.0020 U
0.39 u30.900
8.4 j-6.8503510.12 UNRNRNR
0.012 UNR0.39 U0.39 U12.00.94 U0.39 U0.39 U
8.2300.39 UNR2.4 U123 BNR
0.0200.012 U0.71 UW
0.012 UNR
0.012 .U0.012 UNR86.8
0.012 U0.012 UNRNR55.03.0 UN
505-SP8/16/93
0.012 U0.36 U
0.0019 U0.0019 U
0.36 U42.800
13.5 j-13.600
5800.11 UNRNRNR
0.012 UNR0.36 U0.36 U22.20.88 U0.36 U0.36 U
14.8000.30 UNR2.2 U153 BNR
0.012 U0.012 U0.88 B
0.0004 JNR
0.012 U0.012 UNR133
0.012 U0.012 UNRNR96 .02.7 UN
BLR-SP8/18/93
0.005 J0.42 U
0.0022 U0.0022 U
0.42 U38.300
26.27.2302670.45NRNRNR
0.002 UBJuNR0.42 U0.42 U17.41.0 U
0.42 U0.42 U
6.8000.42 UNR2.5 U136 BNR
0.012 U0.002 UJu0.7G UW
0.004 'jNR
0.0007 J0.002 UJuNR98.2
0.012 U0.009 JNRNR80.23.2 U
DIS-SP8/18/93
3.7 E4.1 U
0.10 U0.10 U4.i U
36.700127
7.0803365.8NRNRNR
0.013 UNR4.1 U
0.9G J1419.9 U0.79 J2.3 J
6.7502.7 JNR83.3372 BNR
0.013 U7.1 E3433.8 ENR8.7 E9.1 ENR3.8
0.013 U14 E
NRNR2553.1
IA-SP8/19/93
0.010 J1.1
0.0021 U0.0021 U
0.6434.100
2356,7907781.7NRNRNR
0.002 JNR0.41 U0.41 U21.50.99 U0.690.11 J6.230
1.2NR2.5 U575 BNR
0.012 U0.110.74 U0.18NR
0.012 U0.052NR113
0.012 U0.038NRNR2473.1 U
PCL-SP8/20/93
0.014 U0.45 U
0.0023 U0.0023 U
0.45 U37.500
37.04.900
1760.14 UNRNRNR
0.014 UNR0.45 U0.45 U10.8 U1.1 U
0.45 U0.45 U4.940 '0.45 UNR2.7 U136 UNR
0.014 U0.014 U0.81 U
0.003 JNR
0.014 U0.014 UNR94.2
0.014 U0.014 UNRNR71.2 '3.4 U
QH-SP8/20/93
0.0007 J2.2 U
0.022 U0.022 U
2.2 u39,200
48.913,900
4944.3NRNRNR
0.014 UNR2.2 U2.2 U
29.65.3 U2.2 U2.2 U
12.300 '2.2 UNR2.6 U218 BNR
0.006 J0.0310.88 B
0.004 JNR
0.0580.005 JNR136
0.014 U0.004 JNRNR144 '3.3 U
SHD-SP8/19/93
0.82 J2.4 U
0.0025 U0.0025 U
2.4 U62.500
1399.8701.53015.6NRNRNR1.6 UNR2.4 U2.4 U
24.45.9 U2.4 U
0.86 J9.180
2.4 UNR3.0 U359 BNR1.6 U
0.19 UJu0.96 B0.97 JNR0.20 J0.31 UJuNR1461.6 U4.3NRNR2173.7 U
Footnotes are presented on t/ie last page. Page 2 of 15

Table B-4Subsurface Soil Data for Exposure Unit 1 (EU-1) (lie Aqua-Tech Silo
Location/Sample Dale
AnalyteAcetoneAcetophenoneAldrinAluminumAnthraceneAntimonyAroclor 1242Aroclor 1248Aroclor 1254ArsenicbariumJenzeneJenzene. isopropylBenzo(a)anthracene3enzo(a)pyreneienzofbjnuoranlhendJenzo(g.h.i)peryleneienzo(k)fluoranlheneJerylliumBis(2-etliylhcxyl)phthalatcSutanone. 2-3utylbenzylphthalateCadmiumCalciumCarbazoleCarbon disulfide3hlorobenzcnc~hloroethaneChloromethaneChlorophenyl-phenylether. 4 -ChromiumCliryseneCobaltCopperODD. 4,4'-DDT. 4,4-CyclohexaneDibutylphthalateDichlorobenzene. 1.2-Dichloroethane, 1,1-Dichloroethanc. 1,2-Dichlorocthene. 1.1-Dichloroethene. cis-1.2-Dichloroethene (total), 1.2-DieldrinDiethylphthalateDfmethtylpthalateDi-n-octylphthalate
TS01-SP8/18/93
U.82 titNR
0.0022 U37.400
0.42 UNR
0.070 P0.042 U0.042 U
1.3 BN205
0.013 UNR0.460.34 J0.600.42 U0.37 J1.3 U3.91.3 E
0.42 U1.3 U
1.850 f0.42 UNR
0.013 UNRNR0.42 U40.90.39 J14.352.7
0.0042 U0.0042 U
NR1.1NR0.18
0.002 J0.013 UNR3.2 E
0.0042 U0.26 J0.42 U0.10 J
TSOZ-SP8/18/93
U.UOl UBUNR
0.0078 P36.100
1.6 UNK
0.040 U0.040 U0.040 U
1.0 BN249
0.003 JNR1.6 U1.6 U1.6 U1.6 U1.6 U1.2 U1.3 J
0.026 U1.6 U1.2 U
1.290 j'1.6 UNR
0.02G UNRNR1.6 U
50.51.6 U
13.022.3
0.0110.004 UNR1.6 UNR
0.0720.026 U0.003 JNR0.30
0.0057 P1.6 U
0.45 J1.6 U
DUP02 (TS02-SP)8/18/93
u.it. oNR
0.040 U35.600
1.6 UNR0.79 U0.79 U0.79 U1.1 BN124
0.012 UNR0.73 J0.55 J0.64 J1.6 U
0.73 J1.2 U4.4
0.0371.6 U1.2 U
2.320 j'1.6 UNR
0.012 UNRNR1.6 U
50.70.80 J12.577.00.120.079 UNR1.6 UNR
0.004 J0.012 U0.012 UNR
0.0250.079 U
1.6 U1.6 U1.6 U
DIS-SI'UE8/18/93
10 uNRNRNRNRNRNRNRNRNRNR16 U
NRNRNRNRNRNRNRNR16 U
NRNRNRNRNR16 U
NRNRNRNRNRNRNRNRNRNRNRNR16 U16 U16 U
NR16 U
NRNRNRNR
DIS-SPREUL8/18/93
31 U
NRNRNRNRNRNRNRNRNRNR54 UNRNRNRNRNRNRNRNR54 UNRNRNRNRNR54 U
NRNRNRNRNRNRNRNRNRNRNRNR54 U54 U54 UNR54 U
NRNRNRNR
lA-SPRIi8/19/93
C.i 1 £NRNRNRNRNRNRNRNRNRNR
0.031 UNRNRNRNRNRNRNRNR
0.075NRNRNRNRNR
0.031 UNRNRNRNRNRNRNRNRNRNRNRNR
0.031 U0.031 U0.031 UNR
0.015 JNRNRNRNR
TSOI-SPRU8/18/93
•i.O u
NRNRNRNRNRNRNRNRNRNR1.6 UNRNRNRNRNRNRNRNR4.4NRNRNRNRNR1.6 UNRNRNRNRNRNRNRNRNRNRNRNR0.34 J1.6 U1.6 UNR7.1NRNRNRNR
DIS-SPDL8/18/93
;«'i;NRNRNR8.1 UNRNRNRNRNRNRNRNR1.9 DJ8.1 U8.1 V8.1 U8.1 UNR22 DNR2.2 DJNRNR8.1 UNRNRNRNR82 DNR3.4 DJNRNRNRNRNR2.0 DJNRNRNRNRNRNRNR8.1 U8.1 U8.1 U
501-09 B-l '2001/12/11
(Mobile)r-'ivNRNRNRNRNRNRNRNRNRNR
0.005NRNRNRNRNRNRNRNR0.1NRNRNRNRNR
0.005NR
0.005NRNRNRNRNRNRNRNRNRNR
0.005NRNR
0.005NRNRNRNRNR
501-09 B-22001/12/11
(Fixed)^.sc:0.41NRNR0.41NRNRNRNRNRNR
U 0.260.38NR0.410.410.41NRNR
0.41U 1
0.41NRNRNR
0.26U 0.26
0.26U 0.018
0.41NR0.41NRNRNRNR
0.0480.410.26
U 0.210.260.26
U 0.74NRNRNR
0.410.41
501-09 B-22001/12/1!
(Mobile)j .""•"U NR
NRNR
U NRNRNRNRNRNRNR
U 0.005NRNR
U NRU NRU NR
NRNR
U NRU 0.1U NR
NRNRNR
U NRU 0.005U NRJB 0.005U NR
NRU NR
NRNRNRNR '
J NRU NRU NRJ 0.005U NRU NR
0.005NRNRNR
U NRU NR
501-09 B-32001/12/11
(Mobile)N"NRNRNRNRNRNRNRNRNRNR
U 0.005NRNRNRNRNRNRNRNR
U 0.1NRNRNRNRNR
U 0.005NR
U 0.005NRNRNRNRNRNRNRNRNRNR
U 0.005NRNR
U 0.005NRNRNRNRNR
501-09B-42001/12/11
(Mobile)NRNRNRNRNRNRNRNRNRNRNR
U 0.005NRNRNRNRNRNRNRNR
U 0.1NRNRNRNRNR
U 0.005NR
U 0,005NRNRNRNRNRNRNRNRNRNR
U 0.005NRNR
U 0.005NRNRNRNRNR
501-09 B-52001/12/11
(Fixed)
0.42 UNRNR0.42 UNRNRNRNRNRNR
U 0.0054 U0.0054 U
NR0.42 U0.42 U0.42 UNRNR
0.42 UU 0.022 U
0.42 UNRNRNR
0.0054 UU 0.0054 U
0.0054 UU 0.0054 U
0.42 UNR0.42 UNRNRNRNR
0.011 U0.42 U
0.0054 UU 0.0054 U
0.0054 U0.0054 U
U 0.0027 UNRNRNR0.42 U0.42 U
CACO
Footnotes are presented on the last page. Page3of l5

Table B-4Subsurface Soil Data for Exposure Unit 1 (EU-1) the Aqua-Tech Site
Analyte£IlC]OSUllai! 1
EthylbenzeneFluorantheneGamma BHC (Llndane)Heptachlorindeno(1.2,3-cdjpyreneIronLeadMagnesiumManganeseMercuryMethyl acetateMethyl cyclohexaneMelhyl-2-penlanone, 4-Methylene chlorideMelhylphenol. 2-Mcthylphenol. 4-MaphthaleneNickelPenlachlorophenolPhenanthrenePhenolPotassiumPyreneSeleniumSilverSodiumStyreneTetrachloroethane, 1.1.2,2-TetrachloroetheneThalliumTolueneTrichlorobenzene, 1.2.4-Trichloroethane, 1.1.1-TrichloroetheneTrifluorolrichloroethaneVanadiumVinyl ChlorideXylcne (total)Xylene, m&p-Xylene, o-ZincCyanide, total
Location/Sample DateTSOl-SP8/18/93
U.UUd£ U
0.260.62
0.0022 U0.0022 U
0.42 U38.000
31.74,960
1831.3NRNRNR
0.029NR0.800.42 U16.11.0 U
0.29 J0.50
4.7500.61NR2.5 U326 BNR
0.013 U0.0460.76 UW0.70 ENR
0.013 U0.015NR91.8
0.013 U1.4 ENRNR1963.2 U
TS02-SP8/18/93
u.uut i r0.004 J0.46 J
0.0052 j0.0044 P
i.6 U33.900
15.4 j8.7602400.12 UNRNRNR
0.016 JNR1.6 U1.6 U19.52.5 J
0.37 J1.6 U
8.2500.35 JNR2.4 U334 BNR
0.026 U0.006 UJu0.84 B0.008 JNR
0.026 U0.013 JNR99.3
0.0930.034NRNR1113.0 U
DUP02 fl'S02-SP) DIS-SPRE8/18/93 8/18/93
U.UHU
0.0011.7
0.0400.040
i.634.700
24.54.4302690.57NRNRNR
0.006NR1.61.69.5111.41.6
4.4801.2NR2.4245NR
0.0120.0040.72
0.002NR
0.0120.005NR90.7
0.0120.010NRNR1253.0
\j i\r\J 35
NRU NRU NRU NR
NRNRNRNRNRNRNRNR
J 16 UNR
U NRU NRU NR
NRJ NRU NR
NRJ NR
NRU NRB NR
NRU 16 UUJu 680 EU NRUJu 40
NRU 72UJu 430 E
NRNR
U 16 UJ 200
NRNRNR
U NR
D1S-SPRKDL8/18/93
ni\35 DJNRNRNRNRNRNRNRNRNRNRNRNR54 UNRNRNRNRNRNRNRNRNRNRNRNRNR54 U700 DNR41 DJNR12 D
420 DNRNR54 U200 DNRNRNRNR
1A-SPRE8/19/93
I'm0.010 JNRNRNRNRNRNRNRNRNRNRNRNR
0.003 JNRNRNRNRNRNRNRNRNRNRNRNRNR
0.031 U0.083NR0.14NR
0.031 U0.032NRNR
0.031 U0.034NRNRNRNR
TS01-SPRE8/18/93
INI\1.6NRNRNRNRNRNRNRNRNRNRNRNR1.6 UNRNRNRNRNRNRNRNRNRNRNRNRNR1.6 U
0.29 UJuNR2.5NR1.6 U
0.049 UJuNRNRI.C U9.3NRNRNRNR
D1S-SPDL8/18/93
i\i\NR8.1 UNRNRB.i UNRNRNRNRNRNRNRNRNRNR8.1 U8.1 UNR20 U8.1 U8.1 UNR2.6 DJNRNRNRNRNRNRNRNRNRNRNRNRNRNRNRNRNRNRNR
501-00 B-l •2001/12/11
(Mobile)i>i\
O.OG5NRNRNRNRNRNRNRNRNRNRNRNR0.01NRNR
0.005NRNRNRNRNRNRNRNRNR
0.0050.0050.11NR.
0.0050.0050.0050.005NRNRNRNROA0.21NRNR
501-09B-22001/12/11
(Fixed)1 Vl\
2.50.41NRNRNRNRNRNRNRNR0.520.12
1U 0.26
0.410.41
U 0.41NRNR0.410.41NR0.41NRNRNR
U 0.26U 0.26
3.1NR
U 0.072U 0.26U 0.32U 0.21
0.26NR
0.04621NRNRNRNR
U
UJUUUUU
UU
U
UU
JU
JU
J
501-09 B-22001/12/11
(Mobile);-'K
0.005NRNRNRNRNRNRNRNRNRNRNRNR0.01NRNR
0.005NRNRNRNRNRNRNRNRNR
0.0050.0050.005NR
0.0050.0050.0050.005NRNRNRNR0.010.005NRNR
501-09 B-32001/12/11
(Mobile)Iv'Iv
U 0.005NRNRNRNRNRNRNRNRNRNRNRNR
U 0.01NRNR
U 0.005NRNRNRNRNRNRNRNRNR
U 0.005U 0.005U 0.2
NRU 0.005U 0.005U 0.005U 0.005
NRNRNRNR
U 0.01U 0.005
NRNR
501-09 B-42001/12/11
(Mobile)I'm
U 0.005NRNRNRNRNRNRNRNRNRNRNRNR
U 0.01NRNR
U 0.005NRNRNRNRNRNRNRNRNR
U 0.005U 0.005
441NR
U 0.005U 0.005U 0.005U 0.85
NRNRNRNR
U 0.66U 0.29
NRNR
501-09 B-52001/12/11
(Fixed);•.';;
U 0.0054 U0.42 UNRNRNRNRNRNRNRNR
0.011 U0.011 U0.022 U
U 0.0054 U0.42 U0.42 U
U 0.42 UNRNR0.42 U0.42 UNR0.42 UNRNRNR
U 0.0054 UU 0.0054 U
0.0054 UNR
U 0.0054 UU 0.0054 UU 0.0054 U
0.0054 U0.0054 U
NR0.0054 U0.011 UNRNRNRNR
Footnotes are presented on tlic last page. Pago 4 of 15

Table B-4Subsurface Soil Data for Exposure Unit I (EU-1) the Aqua-Tech Site
AnalvtfiAcetoneAcetoplienoneAldrlnAluminumAnthraceneAntimonyAroclor 1242Aroclor 1248Aroclor 1254Arseniclariumlenzeneienzene. isopropy]3enzo{a) anthraceneJenzo(a)pyrenelenzo(b)fluoranthenelenzo{g,h.i)peryleneJenzo(k)fluorantheneierylliumBis(2-ethylhexyl)phthalate3utanone. 2-JulylbenzylphmalareCadmiumCalcium^arbazoleCarbon disulfideChloro benzeneChloroethaneChloromethane3hloropheny[-phenylether. 4-ChromiumChryseneCobaltCopperODD. 4.4'-DDT. 4.4-CyclohexaneDibutylphthalaleDichlorobenzene. 1.2-Dichloroethane. 1.1-Dichloroethane. 1.2-Dichlorocthene. 1.1-Dichloroethenc, cis-1.2-Dichloroelhene (total). 1,2-DieldrinDiethylphthalatcDimethtylpthalateDi-n-octylphthalatc
Location/Sample Date
2001/12/11(Mobile)
NRNRNRNRNRNRNRNRNRNRNR
0.005NRNRNRNRNRNRNRNR0.1NRNRNRNRNR
0.005NR
0.005NRNRNRNRNRNR
. NRNRNRNR
0.005NRNR
0.005NRNRNRNRNR
501-09 B62001/12/12
(Mobile)NRNRNRNRNRNRNRNRNRNRNR
U 0.005NRNRNRNRNRNRNRNR
U 0.1NRNRNRNRNR
U 0.005NR
U 0.005NRNRNRNRNRNRNRNRNRNR
U 0.005NRNR
U 0.005NRNRNRNRNR
501-09B-072001/12/12
(Fixed)0.0610.36NRNR0.36NRNRNRNRNRNR
U 0.00530.0053
NR0.360.360.30NRNR0.36
U 0.0110.36NRNRNR
0.0053U 0.0053
0.0053U 0.0053
0.36NR0.36NRNRNRNR
0.0110.3C
0.00081U 0.0053
0.00530.0053
U 0.0026NRNRNR0.360.36
U
U
UU
UUU
UJU
UUUUU
U
UUJUUUU
UU
501-09 B-72001/12/12
(Mobile)NRNRNRNRNRNRNRNRNRNRNR
0.005NRNRNRNRNRNRNRNR0.1NRNRNRNRNR
0.005NR
0.005NRNRNRNRNRNRNRNRNRNR
0.005NRNR
0.005NRNRNRNRNR
501-09 B-82001/12/12
(Mobile)NKNRNRNRNRNRNRNRNRNRNR
U 0.005NRNRNRNRNRNRNRNR
U 0.1NRNRNRNRNR
U 7NR
U 0.005NRNRNRNRNRNRNRNRNRNR
U O.C9NRNR
U 11.2NRNRNRNRNR
50I-09B-092001/12/13
(Fixed)U.U220.42NR
72.1000.423.2NR
0.0420.042
8.5933
U 0.00540.0054
NR0.420.420.42NR0.640.42
U 0.0220.420.261.990NR
0.00540.00540.0054
U 0.00540.4264
0.422212.6NRNR
0.0110.42
0.00540.00540.00540.00540.0027
NRNRNR0.420.42
501-09B-92001/12/13
(Mobile)U 1\'KU NR
NRNR
U NRB NK
NRU NRU NR
NRNR
U 0.005 UU NR
NRU NRU NRU NR
NRU NRU NRU 0.1 UU NRB NR
NRNR
U NRU 0.005 UU NRU 0.005 UU NR
NRU NR
NRNRNRNR
U NRU NRU NRU 0.005 UU NRU NRU 0.005 U
NRNRNR
U NRU NR
501-09 B-102001/12/13
(Mobile)INK
NRNRNRNRNRNRNRNRNRNR
0.005NRNRNRNRNRNRNRNR0.1NRNRNRNRNR
0.005NR
0.005NRNRNRNRNRNRNRNRNRNR
0.005NRNR
0.005NRNRNRNRNR
DARB-12001/12/05
(Mobile)I'mMNriNriNriNRNRNRNRNRNR
U 0.005NRNRNRNRNRNRNRNR
U 0.1NRNRNRNRNR
U 0.005NR
U 0.005NRNRNRNRNRNRNRNRNRNR
U 0.005NRNR
U 0.005NRNRNRNRNR
BLRB-12001/12/05
(Mobile)i^i\
NRNRNRNRt\RNRNRNRNRNR
U 0.005NRNRNRNRNRNRNRNR
U 0.1NRNRNRNRNR
U 0.005NR
U 0.005NRNRNRNRNRNRNRNRNRNR
U 0.005NRNR
U 0.005NRNRNRNRNR
1AB-12001/12/05
(Fixed)U Jt
4NRKlR
4NRNRNRNRNRNR
U 0.760.12NR444
NRNR2.4
U 0.24
NRNRNR
0.0014U 0.0058
0.0068U 0.0027
4NR
4NRNRNRNR
0.0124
0.052U 0.0058
0.0180.0058
U 0.0061NRNRNR
44
utl
U
0
u
Uuu
Ju
JuJuu
uuuu
uu
IAB-12001/12/05
(Mobile)!".'"NRNRNRNRNhMi*NRNRNRNR
0.005 UNRNRNRNRNRNRNRNR7.8NRNRNRNRNR
0.005 UNR
0.005 UNRNRNRNRNRNRNRNRNRNR
0.005 UNRNR
0.005 UNRNRNRNRNR
CD
Footnotes arc presented on the last page. Page 5 of 15

Table B-4Subsurface Soil Data for Exposure Unit 1 (EU-1) the Aqua-Tech Site
Annlvlo
Zndosulfan 1Ilhylbenzene"luorantheneGamma BHC (Llndane)Heptarhlor!ndeno(l,2.3-cd)pyreneronLeadMagnesiumManganeseMercuryMelliyl acetateMethyl cyclohexaneVlethyl-2-pentanone, 4-Methylene chlorideMelhylplienol. 2-Methylphenol. 4-^aphthalcneNickel^entachlorophenolrMienanthrenePlienolPotassium?yreneSeleniumSilverSodiumStyreneTetrachloroethane. 1,1,2.2-TetrachloroetheneThalliumTolueneTrichlorobenzene. 1,2.4-Trichloroelhane, 1.1.1-TrichloroctheneTrifluorotrichloroelhaneVanadiumVinyl ChlorideXylene (to(al)Xylene. m&p-Xylene. o-ZincCyanide, total
501-09 B-52001/12/11
(Mobile)NR
0.005NRNRNRNRNRNRNRNRNRNRNRNR
0.01NRNR
0.005NRNRNRNRNRNRNRNRNR
0.0050.0050.005NR
0.0050.0050.0050.005NRNRNRNR
0.010.005NRNR
U
U
U
UUU
UUUU
UU
501-09 BG2001/12/12
(Mobile)NR
0.041NRNRNRNRNRNRNRNRNRNRNRNR
0.01NRNR
0.005NRNRNRNRNRNRNRNRNR
0.0050.0050.005NR
0.0710.0050.0050.005NRNRNRNR0.090.055NRNR
501-09B-072001/12/12
(Fixed)NR
0.00530.36NRNRNRNRNRNRNRNR
0.0110.0110.021
U 0.00530.360.36
U 0.36NRNR0.360.36NR0.36NRNRNR
U 0.0053U 0.0053U 0.0053
NR0.0053
U 0.0053U 0.0053U 0.0053
0.0053NR
0.00530.011NRNRNRNR
UU
UUUUUUU
UU
U
UUU
UUUUU
UU
501-09B-72001/12/12
(Mobile)NR
0.005NRNRNRNRNRNRNRNRNRNRNRNR0.01NRNR
0.005NRNRNRNRNRNRNRNRNR
0.0050.0050.005NR
0.0050.0050.0050.005NRNRNRNR0.010.005NRNR
U
U
U
UUU
UUUU
UU
501-09 B-82001/12/1Z
(Mobile)NR6
NRNRNRNRNRNRNRNRNRNRNRNR
0.01NRNR
0.005NRNRNRNRNRNRNRNRNR
0.0050.005300NR25
5300.005
14NRNRNRNR196
NRNR
Location/Sample Date501-09 B-09 501-09 B-92001/12/13 2001/12/13
(Fixed) (Mobile)NR NR
0.0054 U 0.0050.42 U NRNR NRNR NRNR NR
46.300 NR31.4 NR
15.000 NR543 NR
0.044 BJ NR0.011 U NR0.011 U NR0.022 U NR
U 0.0054 U 0.010.42 U NR0.42 U NR
U 0.42 U 0.00548.1 NRNR NR0.42 U NR0.42 U NR
12.100 NR0.42 U NR0.51 BJC NRNR NRC41 U NR
U 0.0054 U 0.005U 0.0054 U 0.005
0.0054 U 0.0051.7 BC NR
0.0054 U 0.0050.0013 JB 0.005
U 0.0054 U 0.0050.0054 U 0.0050.0054 U NR
117 NR0.0054 U NR0.011 U NRNR 0.01NR 0.005107 NR
0.64 U NR
a
U
U
U
UUU
UUUU
UU
501-09 B-102001/12/13
(Mobile)NR
0.005NRNRNRNRNRNRNRNRNRNRNRNR0.01NRNR
0.005NRNRNRNRNRNRNRNRNR
0.0050.0050.005NR
0.0050.0050.0050.005NRNRNRNR0.01
0.005NRNR
U
U
U
UUU
UUUU
UU
DARB-12001/12/05
(Mobile)NK
0.005NRNRNRNRNRNRNRNRNRNRNRNR
0.01NRNR
0.005NRNRNRNRNRNRNRNRNR
0.0050.0050.005NR
0.050.0050.0050.005NRNRNRNR
0.0370.032NRNR
BLRB-12001/12/05
(Mobile)NK
U 0.005NRNRNRNRNRNRNRNRNRNRNRNR
U 0.01NRNR
U 0.005NRNRNRNRNRNRNRNRNR
U 0.005U 0.005U 0.005
NR0.005
U 0.005U 0.005U 0.005
NRNRNRNR
0.010.005NRNR
U
U
U
UUU
UUUU
UU
IAB-12001/12/05
(Fixed)NK
0.154
NRNRNRNRNRNRNRNR
0.0120.0330.023
0.00874
6.54
NRNR
41.1NR
4NRNRNR
0.00580.00580.049NR0.1
0.00580.00580.00490.0058
NR0.0023
0.61NRNRNRNR
JU
U
U
U
U
UJU
UU
JUUJU
JJ
IAB-12001/12/05
(Mobile)INK
0.005NRNRNRNKNRNRNRNRNRNRNRNR
0.01NRNR
0.005NRNRNRNRNRNRNRNRNR
0.0050.0050.005NR
0.590.0050.0050.005NRNRNRNR0.770.005NRNR
U
U
U
UUU
UUU
U
cr>
Footnotes arc presented on tlie last page. Page 6 of 15

Table B-4Subsurface Soil Data for Exposure Unit 1 (EU-1) the Aqua-Tech Site
Analylc
AcetophenoneAldrinAluminumAnthraceneAntimonyAroclor 124 2Aroclor 1248Aroclor 1254Arsenic3arium3enzeneJcnzene, isopropyllenzo(a)antbracene3enzo(a)pyrene3enzo(b)fluorantheneJenzo(g.h.i)peryleneienzo(k)nuorantheneSerylliumBis(2-eihyl!iexyl)pbthalate3utanone. 2-ButylbenzylphthalateCadmiumCalciumZarbazolcCarbon disulfldeChlorobenzeneChloroethaneChloromethaneChlorophenyl-phenylether, 4-ChromiumChryseneCobaltCopperODD. 4.4'-DDT.4.4-CyclohexaneDibutylphthalatcDichlorobenzene, 1.2-Dichlorocthane. 1,1-Dichloroethanc. 1.2-Dichloroethene. 1.1-Dichloroetbene. cis-1,2-Dichloroethene (total). 1,2-DicldrinDielhylphthalateDimetlitylptbalateDi-n-octylphthalate
Localion/Sample DateSHED B-l
2001/12/05(Mobile)
Mr>
NRNRNRNRNRNRNRNRNRNR
0.005NRNRNRNRNRNRNRNR9.3NRNRNRNRNR
0.005NR
0.005NRNRNRNRNRNRNRNRNRNR
0.005NRNR
0.005NRNRNRNRNR
SUMP B-l2001/12/05
(Mobile)run
NRNRNRNRNRNRNRNRNRNR
U 0.005NRNRNRNRNRNRNRNR0.1NRNRNRNRNR
U 0.005NR
U 0.005NRNRNRNRNRNRNRNRNRNR
U 0.005NRNR
U 0.005NRNRNRNRNR
TS1 B-l2001/12/06
(Fixed)
0.39NRNR0.39NRNRNRNRNRNR
U 0.0310.25NR0.390.390.39NRNR0.39
U 100.39NRNRNR0.25
U 0.250.25
U 0.0220.39NR0.39NRNRNRNR0.510.390.25
U 0.0860.0170.25
U 1.8NRNRNR0.390.39
i)U
U
JU
UUU
U
U
UUUJBU
U
UUUJBU
UU
TS1 B-l2001/12/05
(Mobile)MO
NRNRNRNRNRNRNRNRNRNR
0.005NRNRNRNRNRNRNRNR21.8NRNRNRNRNR
0.005NR
0.005NRNRNRNRNRNRNRNRNRNR
0.005NRNR
0.005NRNRNRNRNR
TS2B-12001/12/05
(Mobile)
NRNRNRNRNRNRNRNRNRNR
U 0.005NRNRNRNRNRNRNRNR9.5NRNRNRNRNR
U 0.005NR
U 0.005NRNRNRNRNRNRNRNRNRNR
U 0.005NRNR
U 0.005NRNRNRNRNR
DARB-2 DISB-12001/12/00 2001/12/06
(Mobile) (Fixed)
NRNRNRNRNRNRNRNRNRNR
U 0.74NRNRNRNRNRNRNRNR12.3NRNRNRNRNR
U 0.005NR
U 0.005NRNRNRNRNRNRNRNRNRNR
U 16.8NRNR
U 172NRNRNRNRNR
O.INRNR0.41NRNRNRNRNRNR2.62.6NR0.410.410.41NRNR0.68
110.099NRNRNR2.6
U 2.62.6
U 0.210.41NR0.41NRNRNRNR5.3
0.412.6
0.972.G
0.272.2NRNRNR
0.410.41
DIS B-l2001/12/06
(Mobile)
J NRNRNR
U NRNRNRNRNRNRNR
U 0.005U NR
NRU NRU NRU NR
NRNRNR
U 0.005J NR
NRNRNR
U NRU 0.005U NRJB 0.005U NR
NRU NR
NRNRNRNR
U NRU NRU NR1 0.005U NRJ NR
0.005NRNRNR
U NRU NR
DIS B-l2001/12/06
(Mobile)
NRNRNRNRNRNRNRNRNRNR
U 0.005NRNRNRNRNRNRNRNR
U 11NRNRNRNRNR
U 0.005NR
U 0.005NRNRNRNRNRNRNRNRNRNR
U 0.005NRNR
U 0.005NRNRNRNRNR
DIS B-32001/12/11
(Mobile)
NRNRNRNRNRNRNRNRNRNR
U 0.005NRNRNRNRNRNRNRNR
0.005NRNRNRNRNR
U 0.005NR
U 0.005NRNRNRNRNRNRNRNRNRNR
U 0.005NRNR
U 0.005NRNRNRNRNR
DIS B-22001/12/11
(Mobile)
NRNRNRNRNRNRNRNRNRNR
U 0.005NRNRNRNRNRNRNRNR
U 0.005NRNRNRNRNR
U 0.005NR
U 0.005NRNRNRNRNRNRNRNRNRNR
U 1.85NRNR
U 17.5NRNRNRNRNR
DIS B-42001/12/11
(Mobile)
NRNRNRNRNRNRNRNRNRNR
U 0.005NRNRNRNRNRNRNRNR
U 0.005NRNRNRNRNR
U 0.005NR
U 0.005NRNRNRNRNRNRNRNRNRNR0.8NRNR
0.005NRNRNRNRNR
601-02B-52001/12/11
(Fixed)
0.39 UNR
32.700 J0.064 J
7.5NR
0.039 U0.1910.41490 J
U 0.0069 U0.0069 U
NR0.39 U0.39 U0.39 UNR0.59 U1.2
U 0.028 U0.39 U
47.700NR
0.0069 UU 0.0069 U
0.0069 UU 0.0069 U
0.39 U73.90.11 J20.6209NRNR
0.014 U0.39 U
0.0069 UO.OOG9 U0.0069 U0.0069 U
U 0.0014 JNRNRNR
0.23 J0.39 U
(J-.
•o
Footnotes are presented on tlie last page. Page 7 of 15

Table 13-4Subsurface Soil Data for Exposure Unit 1 (EU-1) the Aqua-Tech Site
Location/Sample Date
Annlytennuubuaan iithylbenzenerluoranthene
Gamma BHC (Lindane)-leptachlor
lndeno( i ,2,3-cd)pyreneron.cadMagnesiumManganeseMercuryMethyl acetateMethyl cyclohexane^lethyl-2-penianone. 4-vlelhylene chloridevlethylphenol, 2-vlethylphenol. 4-^JaphthaleneNickel'entachlorophenol'henanthrenePhenol'otassium'yreneSeleniumSilverSodiumStyreneTetrachloroethane. 1,1.2,2-TetrachloroctheneThalliumTolueneTrichlorobenzene. 1,2,4-Trichlorocthanc. 1.1.1-TrichloroetheneTrilluorotrichloroethaneVanadiumVinyl ChlorideXylene (total)Xylene. m&p-Xylene. o-ZincCyanide, total
SHED B-l2001/12/05
(Mobile)J\r\
0.005NRNRNRNRNRNRNRNRNRNRNRNR0.01NRNR
0.005NRNRNRNRNRNRNRNRNR
0.0050.0050.005NR0.720.0050.0050.005NRNRNRNR1.6
0.52NRNR
SUMP B-l2001/12/05
(Mobile);»s
U 0.021NRNRNRNRNRNRNRNRNRNRNRNR
U 0.01NRNR
U 2NRNRNRNRNRNRNRNRNR
U 0.05U 0.005U 0.005
NR0.51
U 0.005U 0.005U 0.005
NRNRNRNR
0.0970.066NRNR
TS1B-12001/12/06
(Fixed)Nix
0.190.39NRNRNRNRNRNRNRNR0.20.511.2
U 0.250.060.490.39NRNR0.390.086NR0.39NRNRNR
U 0.25U 0.25U 0.32
NR3.6
U 0.25U 0.25U 0.25
0.25NR
0.0530.77NRNRNRNR
1U
iU
UJU
U]U
UU
UUUU
JB
TS1 B-l2001/12/05
(Mobile)N;»
0.005NRNRNRNRNRNRNRNRNRNRNRNR
0.01NRNR
0.005NRNRNRNRNRNRNRNRNR
0.0050.0050.005NR
0.0050.0050.0051.37NRNRNRNR0.010.005NRNR
TS2B-12001/12/05
(Mobile)r*u
U 0.005NRNRNRNRNRNRNRNRNRNRNRNR
U 0.01NRNR
U 0.005NRNRNRNRNRNRNRNRNR
U 0.005U 0.005U 0.005
NRU 0.005U 0.005U 0.002
0.005NRNRNRNR
U 0.01U 0.005
NRNR
DAR B-2 D1S B-)2001/12/06 2001/12/06
(Mobile) (Fixed)
U
U
U
UUU
UUUU
UU
r.'iv52.3NRNRNRNRNRNRNRNRNRNRNRNR6.2NRNR2.4'NRNRNRNRNRNRNRNRNR
0.0050.00513.1NR412
0.0050.005289NRNRNRNR20875.2NRNR
.\'!»0.9
0.41NRNRNRNRNRNRNRNR5.35.311
0.440.410.0940.41NRNR0.410.33NR
O.'llNRNRNR
U 2.6U 2.6
5.3NR
2U 2.6U 10
591.5NR2.63.6NRNRNRNR
D1SB-12001/12/00
(Mobile)N!'
J 7.3U NR
NRNRNRNRNRNRNRNR
U NRU NRU NRJ 0.01U NRJ NRU 0.005
NRNR
U NRJ NR
NRU NR
NRNRNR
U 0.005U 0.005
29.4NR
] 0.005U 0.005
0.00560.9
J NRNR
U NRJB NR
23.57.6NRNR
DISB-12001/12/OG
(Mohile)Ml";30.5NRNRNRNRNRNRNRNRNRNRNRNR
U 0.01NRNR
U 0.005NRNRNRNRNRNRNRNRNR
U 0.005U 0.005
320NR
U 0.005U 0.005U 0.005
1020NRNRNRNR97.230.4NRNR
D1S B-32001/12/11
(Mohile)M"
0.005NRNRNRNRNRNRNRNRNRNRNRNR
U 0.01NRNR
U 0.005NRNRNRNRNRNRNRNRNR
U 0.005U 0.005
0.005NR
U 0.005U 0.005U 0.005
0.005NRNRNRNR0.010.005NRNR
bis B-22001/12/11
(Mobile)?!?.
U 3.3NRNRNRNRNRNRNRNRNRNRNRNR
U 0.01NRNR
U 2.6NRNRNRNRNRNRNRNRNR
U 3.85U 0.005U 120
NRU 50U 0.005U 7.1U 22.7
NRNRNRNR
U 9.7U 6.4
NRNR
D1S B-4 ;2001/12/H
(Mobile!
2.6NRNRNRNRNRNRNRNRNRNRNRNR
U 0.01NRNR3.7NRNRNRNRNRNRNRNRNR
0.005U 0.005
20.8NR4
U 0.0054.4
28.5NRNRNRNR6.32.8NRNR
601-02 B-52001/12/11
(Fixed)NfiS "
0.00690.39NRNRNR
39.00081.9
15.4005921.8
0.0140.00110.0051
U O.OOG90.220.390.3940.9NR0.390.14
15.1000.390.59NR588
U 0.0069U 0.0069
0.00462.9
0.02U 0.0069
0.00690.00690.0069
92.20.00690.014NRNR4200.93
UU
UJJUJUU
UJUU
UUUJ
UUUU
UU
Footnotes arc presented on tfic last page. P a g e 8 o f l 5

Table B-4Subsurface Soil Data for Exposure Unit 1 (EU-1) the Aqua-Tech Site
Location/Sample
AnalvteAcetoneAcetophenoneAldrinAluminumAnthraceneAntimonyAroclor 1242Aroclor 1248Aroclor 1254ArsenicBariumBenzeneBenzene, isopropylBenzo(a)anl ItraccncBenzo{a)pyreneBenzo{b)fluora"ntheneBenzotg.h.OperyleneBenzo(k)fiuorantheneBerylliumBis(2-ethylhexyl)phthalateButanone, 2-ButylbenzylphthalateCadmiumCalciumCarbazoleCarbon disulfideChlorobenzeneChloroethaneChloromethaneChlorophenyl-phenylether. 4-ChromiumChryseneCobaltCopperDDD. 4.4'.DOT. 4.4-CyclohexaneDibutylphtlialaleDichlorobenzene. 1,2-Dicliloroethane. 1.1-Dichloroethane. 1,2-Dichloroethcnc. 1.1-Dichloroethene. cis-1,2-Dichloroctbene (total). 1,2-DieldrinDielhylphthalateDiinethtytpthalateDi-n-octylphthalate
001-02 B-52001/12/07
(Mobile)NRNRNRNRNRNRNRNRNRNRNR
0.005NRNRNRNRNRNRNRNR0.1NRNRNRNRNR
0.005NR
0.005NRNRNRNRNRNRNRNRNRNR
0.005NRNR
0.005NRNRNRNRNR
601-02 B-52001/12/07
(Mobile)NRNRNRNRNRNRNRNRNRNRNR
U 0.005NRNRNRNRNRNRNRNR
U 0.1NRNRNRNRNR
U 0.005NR
U 0.005NRNRNRNRNRNRNRNRNRNR
U 0.005NRNR
U 0.005NRNRNRNRNR
601-02 B-32001/12/07
(Mobile)NRNRNRNRNRNRNRNRNRNRNR
U 0.005NRNRNRNRNRNRNRNR
U 0.1NRNRNRNRNR
U 0.005NR
U 0.005NRNRNRNRNRNRNRNRNRNR
U 0.005NRNR
U 0.005NRNRNRNRNR
601-02 B-72001/12/11
(Mobile)IS'KNRNRNRNRNRNRNRNRNRNR
U 0.005NRNRNRNRNRNRNRNR
U 0.1NRNRNRNRNR
U 0.005NR
U 0.005NRNRNRNRNRNRNRNRNRNR
U 0.005NRNR
U 0.005NRNRNRNRNR
001-02 B-82001/12/11
(Mobile)INK
NRNRNRNRNRNRNRNRNRNR
U 0.005NRNRNRNRNRNRNRNR
U 0.1NRNRNRNRNR
U 0.005NR
U 0.005NRNRNRNRNRNRNRNRNRNR
U 0.005NRNR
U 0.005NRNRNRNRNR
601-02 B-92001/12/12
(Mobile)INK
NRNRNRNRNRNRNRNRNRNR
U 0.005NRNRNRNRNRNRNRNR
U 0.1NRNRNRNRNR
U 0.005NR
U 0.005NRNRNRNRNRNRNRNRNRNR
U 0.005NRNR
U 0.005NRNRNRNRNR
504 B-l2001/12/04
(Mobile)!\l\
NRNRNRNRNRNRNRNRNRNR
U 0.005 UNRNRNRNRNRNRNRNR
U 0.1 UNRNRNRNRNR
U 0.005 UNR
U 0.005 UNRNRNRNRNRNRNRNRNRNR
U 0.005 UNRNR
U 0.005 UNRNRNRNRNR
Date"504 B-2
2001/12/04(Mobile)
I>1\
NRNRNRNRNRNRNRNRNRNR
0.005NRNRNRNRNRNRNRNR0.1NRNRNRNRNR
0.005NR
0.005NRNRNRNRNRNRNRNRNRNR
0.005NRNR
0.005NRNRNRNRNR
504 B-32001/12/04
(Mobile)1 11 V
NRNRNRNRNRNRNRNRNRNR
U 0.005NRNRNRNRNRNRNRNR
U 0.1NRNRNRNRNR
U 0.005NR
U 0.005NRNRNRNRNRNRNRNRNRNR
U 0.005NRNR
U 0.005NRNRNRNRNR
504 B-42001/12/04
(Mobile)K M>
NRNRNRNRNRNRNRNRNRNR
U 0.005NRNRNRNRNRNRNRNR
U 0.1NRNRNRNRNR
U 0.005NR
U 0.005NRNRNRNRNRNRNRNRNRNR
U 0.005NRNR
U 0.005NRNRNRNRNR
504 B-52001/12/04
(Fixed)n nit
0.37NR
45.5000.37
c
NR0.0370.037
2.9971
U 0.00550.0055
NR0.370.370.37NR0.550.14
U 0.0220.370.3274NR
0.0055U 0.0055
0.0055U 0.0055
0.3777.30.3729.52.8NRNR
0.0110.37
0.0055U 0.0055
0.00550.0055
U 0.0027NRNRNR0.37
0.001
504 B-52001/12/04
(Mobile)1 1 MD
U NRNRNR
U NRB NR
NRU NRU NR
NRJ NRU 0.005U NR
NRU NRU NRU NR
NRU NRJ NRU 0.1U NRB NRB NR
NRU NRU 0.005U NRU 0.005U NR
NRU NR
NRNRNRNR
U NRU NRU NRU 0.005U NRU NRU 0.005
NRNRNR
U NRJ NR
PCL3B-12001/12/04
(Mobile)MP
NRNRNRNRNRNRNRNRNRNR
U 0.005NRNRNRNRNRNRNRNR
U 0.1NRNRNRNRNR
U 0.005NR
U 0.005NRNRNRNRNRNRNRNRNRNR
U 0.005NRNR
U 0.005NRNRNRNRNR
U
U
U
U
U
U
Footnotes are presented on the last page. Page 9 of 15
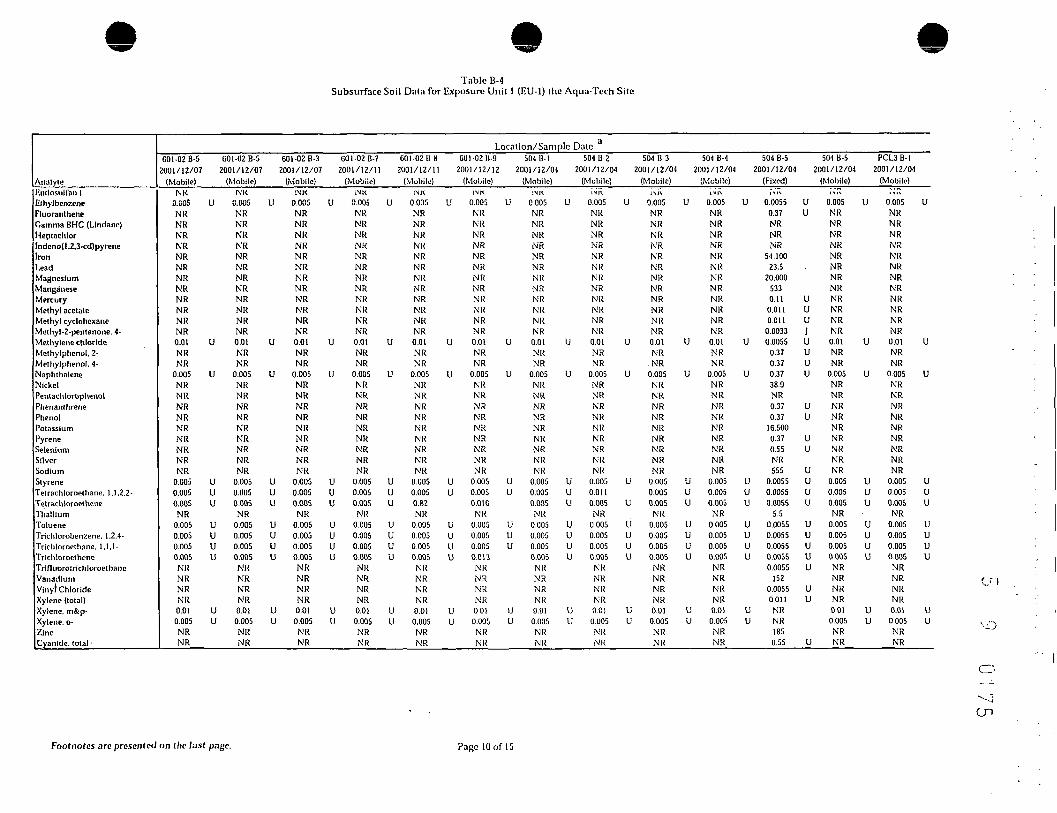
Table B-4Subsurface Soil Data for Exposure Unit 1 (EU-1) the Aqua-Tech Site
AnaiyteEndosulfan IElhylbenzeneFluoranlheheGamma BHC (Llndanc)HeptachlorIndeno(f ,2,3-cd)pyreneIronLeadMagnesiumManganeseMercuryMethyl acetateMethyl cyclohexancMethyl-2-pentanone. 4-Methylene chlorideMethylphenol. 2-Melliylphenol. 4-NaphthaleneNickelPenlacblorophenolPhenanthrenePhenolPotassiumPyreneSeleniumSilverSodiumSlyreneTetrachloroethane, 1.1.2,2-TelrachloroelheneThalliumTolueneTrichlorobenzene. 1,2,4-Trlchloroethane, 1,1,1-TrichloroetheneTrinuorotricliJoroethaneVanadiumVinyl ChlorideXylene (total)Xylene, m&p-Xylene. o-ZincCyanide, total •
Location/Sample Dale
2001/12/07(Mobile)
NK0.005NRNRNRNRNRNRNRNRNRNRNRNR0.01NRNR
0.005NRNRNRNRNRNRNRNRNR
0.0050.0050.005NR
0.0050.0050.0050.005NRNRNRNR0.010.005NRNR
U
U
U
UUU
UUUU
UU
601-02 B-52001/12/07
(Mobile)NK
0.005NRNRNRNRNRNRNRNRNRNRNRNR0.01NRNR
0.005NRNRNRNRNRNRNRNRNR
0.0050.0050.005NR
0.0050.0050.0050.005NRNRNRNR0.0!0.005NRNR
U
U
U
UUU
UUUU
UU
601-02 B-32001/12/07
(Mobile)INK
0.005NRNRNRNRNRNRNRNRNRNRNRNR0.01NRNR
0.005NRNRNRNRNRNRNRNRNR
0.0050.0050.005NR
0.0050.0050.0050.005NRNRNRNR
0.010.005NRNR
U
U
U
UUU
UUUU
UU
601-02 B-72001/12/11
(Mobile)INK
0.005NRNRNRNKNRNRNRNRNRNRNRNR0.01NRNR
0.005NRNRNRNRNRNRNRNRNR
0.0050.0050.005NR
0.0050.0050.0050.005NRNRNRNR
0.010.005NRNR
601-02 B-82001/12/11
(Mobile)INK
U 0.005NRNRNRNKNRNRNRNRNRNRNRNR
U 0.01NRNR
U 0.005NRNRNRNRNRNRNRNRNR
U 0.005U 0.005U 0.82
NRU 0.005U 0.005U 0.005U 0.005
NRNRNRNR
U 0.01U 0.005
NRNR
U
U
U
UU
UUUU
UU
60I-02B-92001/12/12
(Mobile)INK
0.005NRNRNRNRNRNRNRNRNRNRNRNR0.01NRNR
0.005NRNRNRNRNRNRNRNRNR
0.0050.0050.0 1G
NR0.0050.0050.0050.013NRNRNRNR
0.010.005NRNR
504 B-l2001/12/01
(Mobile)INK
U 0.005NRNRNRNKNRNRNRNRNRNRNRNR
U 0.01NRNR
U 0.005NRNRNRNRNRNRNRNRNR
U 0.005U 0.005
0.005NR
U 0.005U 0.005U 0.005
0.005NRNRNRNR
U 0.01U 0.005
NRNR
504 B-22001/12/04
(Mobile)i\i\
U 0.005NRNRNRNRNRNRNRNRNRNRNRNR
U 0.01NRNR
U 0.005NRNRNRNRNRNRNRNRNR
U 0.005U 0.011U 0.005
NRU 0.005U 0.005U 0.005U 0.005
NRNRNRNR
U 0.01U 0.005
NRNR
U
U
U
U
U
UUUU
UU
504 B-32001/12/04
(Mobile)i\i\
0.005NRNRNRNRNRNRNRNRNRNRNRNR0.01NR
. N R0.005NRNRNRNRNRNRNRNRNR
0.0050.0050.005NR
0.0050.0050.0050.005
NRNRNRNR0.010.005NRNR
U
U
U
UUU
UUUU
UU
504 B-42001/12/04
(Mobile)i>-i\
0.005NRNRNRNRNRNRNRNRNRNRNRNR0.01NRNR
0.005NRNRNRNRNRNRNRNRNR
0.0050.0050.005
NR0.0050.0050.0050.005NRNRNRNR
0.010.005NRNR
504 B-52001/12/04
(Fixed)N«
U 0.00550.37NRNRNR
54,10023.5
20.0005330.11
0.0110.011
0.0033U 0.0055
0.370.37
U 0.3738.9NR0.370.37
16,5000.370.55NR555
U 0.0055U 0.0055U 0.0055
5.5U 0.0055U 0.0055U 0.0055U 0.0055
0.0055152
0.00550.011
U NRU NR
1850,55
UU
UUUJUUUU
UU
UU
UUUU
UUUUU
UU
U
504 B-52001/12/04
(Mobile)NH
0.005NRNRNRNRNRNRNRNRNRNRNRNR0.01NRNR
0.005NRNRNRNRNRNRNRNRNR
0.0050.0050.005NR
0.0050.0050.0050.005NRNRNRNR
0.010.005NRNR
U
U
U
UUU
UUUU
UU
PCL3B-12001/12/04
(Mobile)r,\"
0.005 UNRNRNRi\'RNRNRNRNRNRNRNRNR0.01 UNRNR
0.005 UNRNRNRNRNRNRNRNRNR
0.005 U0.005 U0.005 UNR
0.005 U0.005 U0.005 U0.005 UNRNRNRNR0.01 U0.005 UNRNR
Footnotes are presented on the last page. Page 10 of 15
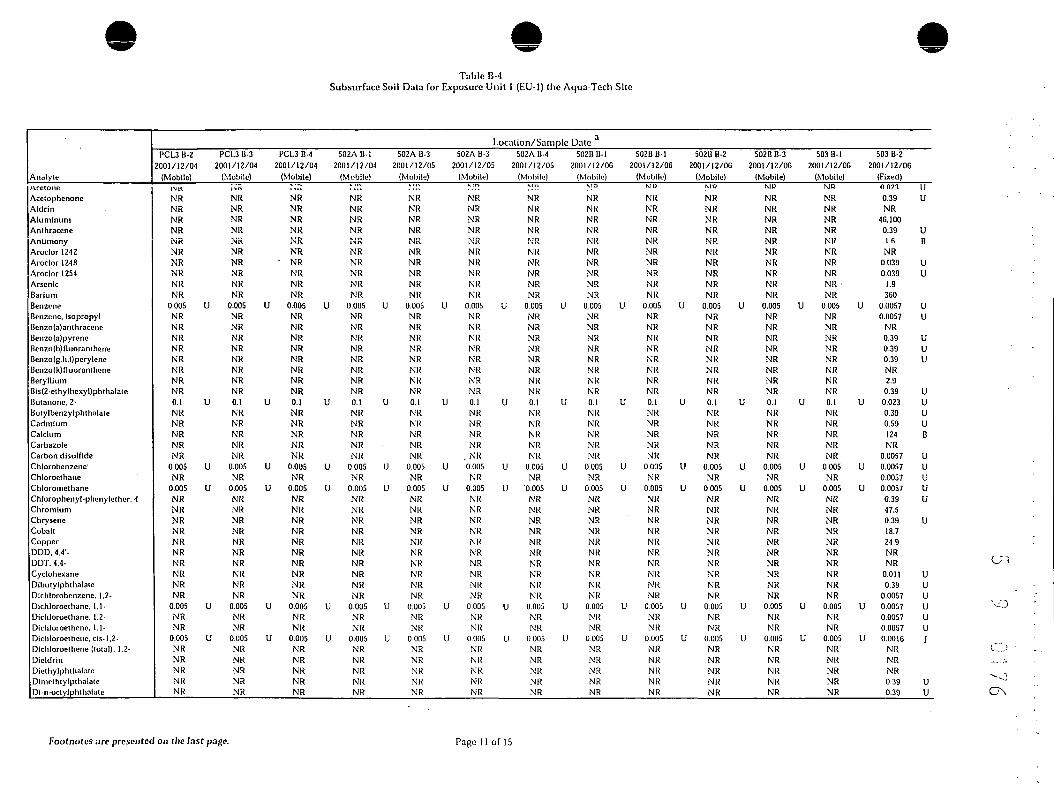
Table B-4Subsurface Soil Data for Exposure Unit 1 (EU-1) the Aqua-Tech Site
AnalyteMceioneAcctophcnoneAldrinAluminumAnthraceneAntimonyAroclor 1242Aroclor 1248Aroclor 1254ArsenicBariumBenzeneBenzene, isopropyl3enzo (a) anthracene3enzo(a)pyrene3enzo(b)nuoranther«i3enzo(g.h,i)peryleno3cnzo(k)fluoranth<;neBerylliumBis(2-ethylhexyl)phthalale3utanonc. 2-3utylbenzytphthalateCadmiumCalciumCarbazoleCarbon disulfideChlorobenzene1
ChloroethaneChloromethaneChlorophenyl-phcnylether. 4-ChromiumChryseneCobaltCopperODD, 4.4'-DDT. 4.4-CyclohexaneDibutylphthalaleDichlorobenzcne. 1,2-Dichloroetliane. 1.1-Dichloroethane. 1,2-Dichloroethene. 1,1-Dichloroethene, cis-1.2-Dichloroelhene (total). 1.2-DieldrinDiethylphthalaleDlmethtylpthalateDi-n-octylphlhalate
PCU B-22001/12/04
(Mobile)INK
NRNRNRNRNRNRNRNRNRNR
0.005NRNRNRNRNRNRNRNRO.INRNRNRNRNR
0.005NR
0.005NRNRNRNRNRNRNRNRNRNR
0.005NRNR
0.005NRNRNRNRNR
PCL3 B-32001/12/04
(Mobile)i.'ix
NRNRNRNRNRNRNRNRNRNR
U 0.005NRNRNRNRNRNRNRNR
U 0.1NRNRNRNRNR
U 0.005NR
U 0.005NRNRNRNRNRNRNRNRNRNR
U 0.005NRNR
U 0.005NRNRNRNRNR
PCL3 B-42001/12/04
(Mobile);.'."NRNRNRNRNRNR
- NRNRNRNR
U 0.005NRNRNRNRNRNRNRNR
U 0.1NRNRNRNRNR
U 0.005NR
U 0.005NRNRNRNRNRNRNRNRNRNR
U 0.005NRNR
U 0.005NRNRNRNRNR
502A B-l2001/12/04
(Mobile)r."*NRNRNRNRNRNRNRNRNRNR
U 0.005NRNRNRNRNRNRNRNR
U 0.1NRNRNRNRNR
U 0.005NR
U 0.005NRNRNRNRNRNRNRNRNRNR
U 0.005NRNR
U 0.005NRNRNRNRNR
502A B-32001/12/05
(Mobile)r j i iNRNRNRNRMO
NRNRNRNRNR
U 0.005NRNRNRNRNRNRNRNR
U 0.1NRNRNRNRNR
U 0.005NR
U 0.005NRNRNRNRNRNRNRNRNRNR
U 0.005NRNR
U 0.005NRNRNRNRNR
Location/Sample502A B-3 502A B-4
2001/12/05 2001/12/05(Mobile) (Mobile)
.".'"NRNRNRNRNRNRNRNRNRNR
U 0.005NRNRNRNRNRNRNRNR
U 0.1NRNRNRNR
. NRU 0.005
NRU 0.005
NRNRNRNRNRNRNRNRNRNR
U 0.005NRNR
U 0.005NRNRNRNRNR
.".'!'.NRNRNRNRNRNRNRNRNRNR
U 0.005 UNRNRNRNRNRNRNRNR
U 0.1 UNRNRNRNRNR
U 0.005 UNR
U '0.005 UNRNRNRNRNRNRNRNRNRNR
U 0.005 UNRNR
U 0.005 UNRNRNRNRNR
Date3
502BB-12001/12/06
(Mobile)N!5.NRNRNRNRNRNRNRNRNRNR
0.005NRNRNRNRNRNRNRNR0.1NRNRNRNRNR
0.005NR
0.005NRNRNRNRNRNRNRNRNRNR
0.005NRNR
0.005NRNRNRNRNR
502BB-12001/12/06
(Mobile)MO
NRNRNRNRNRNRNRNRNRNR
U 0.005NRNRNRNRNRNRNRNR
U 0.1NRNRNRNRNR
U 0.005NR
U 0.005NRNRNRNRNRNRNRNRNRNR
U 0.005NRNR
U 0.005NRNRNRNRNR
502B B-22001/12/06
(Mobile)MD
NRNRNRNRNRNRNRNRNRNR
U 0.005NRNRNRNRNRNRNRNR
U 0.1NRNRNRNRNR
U 0.005NR
U 0.005NRNRNRNRNRNRNRNRNRNR
U 0.005NRNR
U 0.005NRNRNRNRNR
502B B-32001/12/06
(Mobile)MP
NRNRNRNRNRNRNRNRNRNR
U 0.005NRNRNRNRNRNRNRNR
U 0.1NRNRNRNRNR
U 0.005NR
U 0.005NRNRNRNRNRNRNRNRNRNR
U 0.005NRNR
U 0.005NRNRNRNRNR
503 B-l2001/12/06
(Mobile)NO
NRNRNRNRNRNRNRNRNR •NR
U 0.005NRNRNRNRNRNRNRNR
U 0.1NRNRNRNRNR
U 0.005NR
U 0.005NRNRNRNRNRNRNRNRNRNR
U 0.005NRNR
U 0.005NR'NRNRNRNR
503 B-22001/12/06
(Fixed)nnn0.39NR
46.1000.39l.fiNR
0.0390.039
1.9360
U 0.00570.0057
NR0.390.390.39NR2.9
0.39U 0.023
0.390.59124NR
0.0057U 0.0057
0.0057U 0.0057
0.3947.50.3918.724.9NRNR
0.0110.39
0.0057U 0.0057
O.OOS70.0057
U 0.0016NRNRNR0.390.39
I IU
U1!
UU
UU
UUU
UUUUB
UUUUU
U
UUUUUUJ
UU
Footnotes arc presented on the last page. Page 11 of 15
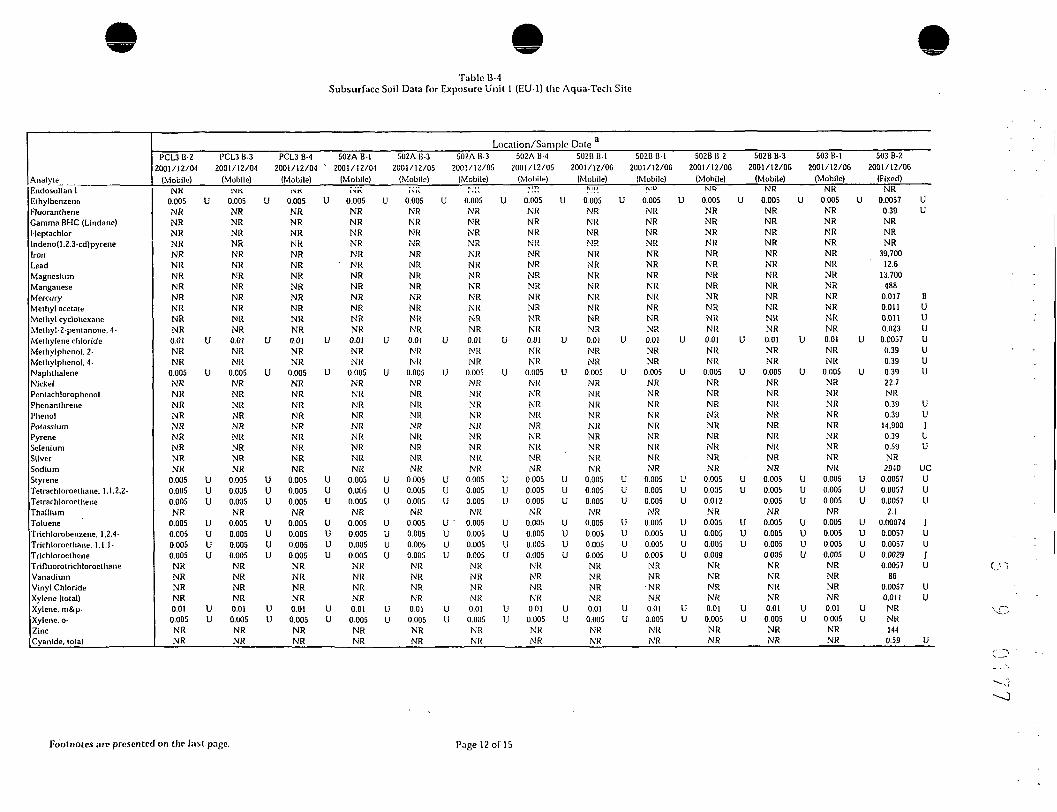
Table B-4Subsurface Soil Data for Exposure Unit 1 (EU-I) the Aqua-Tech Site
Location/Sam
Anaiyteindosullan IIthylbenzene"luorantheneGamma BHC (LJndane)HeptachlorIndeno(1.2.3-cd)pyrene!ronLeadMagnesiumManganeseMercuryMethyl acetateMethyl cyclohexaneMelhyl-2-pentanone, 4-Melhylene chlorideMelhylphenol. 2-Methylphenol, 4-NaphthaleneNickelPentachlorophenolPhenanthrenePhenolPotassiumPyreneSeleniumSilverSodiumStyreneTetrachloroethane. 1.1.2.2-TetrachloroetheneThalliumTolueneTrichlorobenzene. 1,2.4-Trichloroethane. 1.1,1-TrichloroetheneTrinuorolrichloroethaneVanadiumVinyl ChlorideXylene (total)Xylene. m&p-Xylene. o-ZincCyanide, total
PCL3 B-22001/12/04
(Mobile)NK
0.005NRNRNRNRNRNRNRNRNRNRNRNR0.01NRNR
0.005NRNRNRNRNRNRNRNRNR
0.0050.0050.005NR
0.0050.0050.0050.005NRNRNRNR0.010.005NRNR
U
U
U
UUU
UUUU
UU
PCL3 B-32001/12/04
(Mobile)INK
0.005NRNRNRNRNRNRNRNRNRNRNRNR0.01NRNR
0.005NRNRNRNRNRNRNRNRNR
0.0050.0050.005NR
0.0050.0050.0050.005NRNRNRNR0.010.005NRNR
U
U
U
UUU
UUUU
UU
PCL3 B-42001/12/04
(Mobile)!\K
0.005NRNRNRNRNRNRNRNRNRNRNRNR0.01NRNR
0.005NRNRNRNRNRNRNRNRNR
0.0050.0050.005NR
0.0050.0050.0050.005NRNRNRNR0.010.005NRNR
U
U
U
UUU
UUUU
UU
502AB-12001/12/04
(Mobile)i^i\
0.005NRNRNRNRNR
' NRNRNRNRNRNRNR0.01NRNR
0.005NRNRNRNRNRNRNRNRNR
0.0050.0050.005NR
0.0050.0050.0050.005NRNRNRNR0.010.005NRNR
U
U
U
UUU
UUUU
UU
502A B-32001/12/05
(Mobile)N'U
0.005NRNRNRNRNRNRNRNRNRNRNRNR0.01NRNR
0.005NRNRNRNRNRNRNRNRNR
0.0050.0050.005NR
0.0050.0050.0050.005NRNRNRNR0.010.005NRNR
502A li-32001/12/05
(Mobile)
U
U
U
UUU
UUUU
UU
r.'u0.005NRNRNRNRNRNRNRNRNRNRNRNR0.01NRNR
0.005NRNRNRNRNRNRNRNRNR
0.0050.0050.005NR
' 0.0050.0050.0050.005NRNRNRNR0.010.005NRNR
U
U
U
UUU
UUUU
UU
502A B-42001/12/05
(Mobile)NP.
0.005NRNRNRNRNRNRNRNRNRNRNRNR0.01NRNR
0.005NRNRNRNRNRNRNRNRNR
0.0050.0050.005NR
0.0050.0050.0050.005NRNRNRNR0.010.005NRNR
pie Date a
502BB-12001/12/00
(Mobile)
U 0.005NRNRNRNRNRNRNRNRNRNRNRNR
U 0.01NRNR
U 0.005NRNRNRNRNRNRNRNRNR
U 0.005U 0.005U 0.005
NRU 0.005U 0.005U 0.005U 0.005
NRNRNRNR
U 0.01U 0.005
NRNR
U
U
U
UUU
UUUU
UU
502BB-12001/12/00
(Mobile)
0.005NRNRNRNRNRNRNRNRNRNRNRNR0.01NRNR
0.005NRNRNRNRNRNRNRNRNR
0.0050.0050.005NR
0.0050.0050.0050.005NRNR
• N RNR0.010.005NRNR
U
U
U
UUU
UUUU
UU
502B B-22001/12/06
(Mobile)Ml}
0.005NRNRNRNRNRNRNRNRNRNRNRNR0.01NRNR
0.005NRNRNRNRNRNRNRNRNR
0.0050.0050.012NR
0.0050.0050.0050.009NRNRNRNR0.010.005NRNR
U
U
U
UU
UUU
UU
502B B-32001/12/06
(Mobile)NR
0.005NRNRNRNRNRNRNRNRNRNRNRNR0.01NRNR
0.005NRNRNRNRNRNRNRNRNR
0.0050.0050.005NR
0.0050.0050.0050.005NRNRNRNR0.010.005NRNR
U
U
U
UUU
UUUU
UU
503 B-l2001/12/06
(Mobile)NR
0.005NRNRNRNRNRNRNRNRNRNRNRNR0.01NRNR
0.005NRNRNRNRNRNRNRNRNR
0.0050.0050.005NR
0.0050.0050.0050.005NRNRNRNR0.010.005NRNR
U
U
U
UUU
UUUU
UU
503 B-22001/12/06
(Fixed)NR
0.00570.39NRNRNR
39.70012.6
13.700488
0.0170.0110.0110.0230.00570.390.390.3922.7NR0.390.39
14.9000.390.59NR
29-100.00570.00570.0057
2.10.000740.00570.00570.00290.0057
860.00570.011NRNR144
0.59
UU
BUUUUUUU
UUJUU
ucUUU
JUU1U
UU
U
( v-,
Footnotes are presented on the last page. Page 12 of 15

Table B-4Subsurface Soil Data for Exposure Unit 1 (EU-1) tiic Aqua-Tech Site
AnalyteAcetoneAcetophenoneAldrinAluminumAnthraceneAntimonyAroclor 1242Aroclor 1248Aroclor 1254Arsenic3ariumJenzeneienzene. isopropyl3enzo(a)anthraceneienzo(a)pyrene3enzo(b)nuoranthene3enzo(g.li.i)perylene3enzo(k)fluoranthene^eryllium3is(2-cthylhexy!}phthalateiutanone, 2-3utylbenzylphthalateCadmiumCalciumCarba^oleCarbon disulfideChlorobcnzeneChloroethaneChloromellianeChlorophenyl-phenylether. 4-ChromiumChrysencCobaltCopperODD, 4.4'-DDT. 4.4-CyclohcxaneDibutylphllialateDichlorobenzcnc. 1.2-Dichloroethane. 1,1-Oichloroethane, 1.2-Dichloroethcne, 1.1-Dlchlorocthcne. cis-1.2-Dichloroethene (total). 1,2-DieldrinDiclhyfplilhalateDimelhtylpthalaleDi-n-octylphthalate
Location/Sample Date503 B-2
2001/12/00(Mobile)
!\K
NRNRNRNRNRNRNRNRNRNR
0.005NRNRNRNRNRNRNRNR0.1NRNRNRNRNR
0.005NR
0.005NRNRNRNRNRNRNRNRNRNR
0.005NRNR
0.005NRNRNRNRNR
503 B-22001/12/OG
(Mobile)i\i\NRNRNRNRNRNRNRNRNRNR
U 0.005NRNRNRNRNRNRNRNR
U O.INRNRNRNRNR
U 0.005NR
U 0.005NRNRNRNRNRNRNRNRNRNR
U 0.005NRNR
U 0.005NRNRNRNRNR
503 B-32001/12/00
(Mobile)Ni\NRNRNRNRNRNRNRNRNRNR
U 0.005NRNRNRNRNRNRNRNR
U O.INRNRNRNRNR
U 0.005NR
U 0.005NRNRNRNRNRNRNRNRNRNR
U 0.005NRNR
U 0.005NRNRNRNRNR
503 B-42001/12/00
(Mobile);;;;NRNRNRNRNRNRNRNRNRNR
U 0.005NRNRNRNRNRNRNRNR
U O.INRNRNRNRNR
U 0.005NR
U 0.005NRNRNRNRNRNRNRNRNRNR
U 0.005NRNR
U 0.005NRNRNRNRNR
505 B-l2001/12/OG
(Mobile)
NRNRNRNRNRNRNRNRNRNR
U 0.005NRNRNRNRNRNRNRNR
U O.INRNRNRNRNR
U 0.005NR
U 0.005NRNRNRNRNRNRNRNRNRNR
U 0.005NRNR
U 0.005NRNRNRNRNR
a
505 B-22001/12/06
(Mobile)N"NRNRNRNRNRNRNRNRNRNR
U 0.005NRNRNRNRNRNRNRNR
U O.INRNRNRNRNR
U 0.005NR
U 0.005NRNRNRNRNRNRNRNRNRNR
U 0.005NRNR
U 0.005NRNRNRNRNR
505 B-32001/12/12
(Mobile)NT.NRNRNRNRNRNRNRNRNRNR
U 0.005NRNRNRNRNRNRNRNR
U O.INRNRNRNRNR
U 0.005NR
U 0.005NRNRNRNRNRNRNRNRNRNR
U 0.005NRNR
U 0.005NRNRNRNRNR
505 B-42001/12/12
(Mobile)MO
NRNRNRNRNRNRNRNRNRNR
U 0.005NRNRNRNRNRNRNRNR
U 0.1NRNRNRNRNR
U 0.005NR
U 0.005 •NRNRNRNRNRNRNRNRNRNR
U 0.005NRNR
U 0.005NRNRNRNRNR
U
U
U
U
U
U
CO
Footnotes are presented on tlic last page. Page 13 of 15
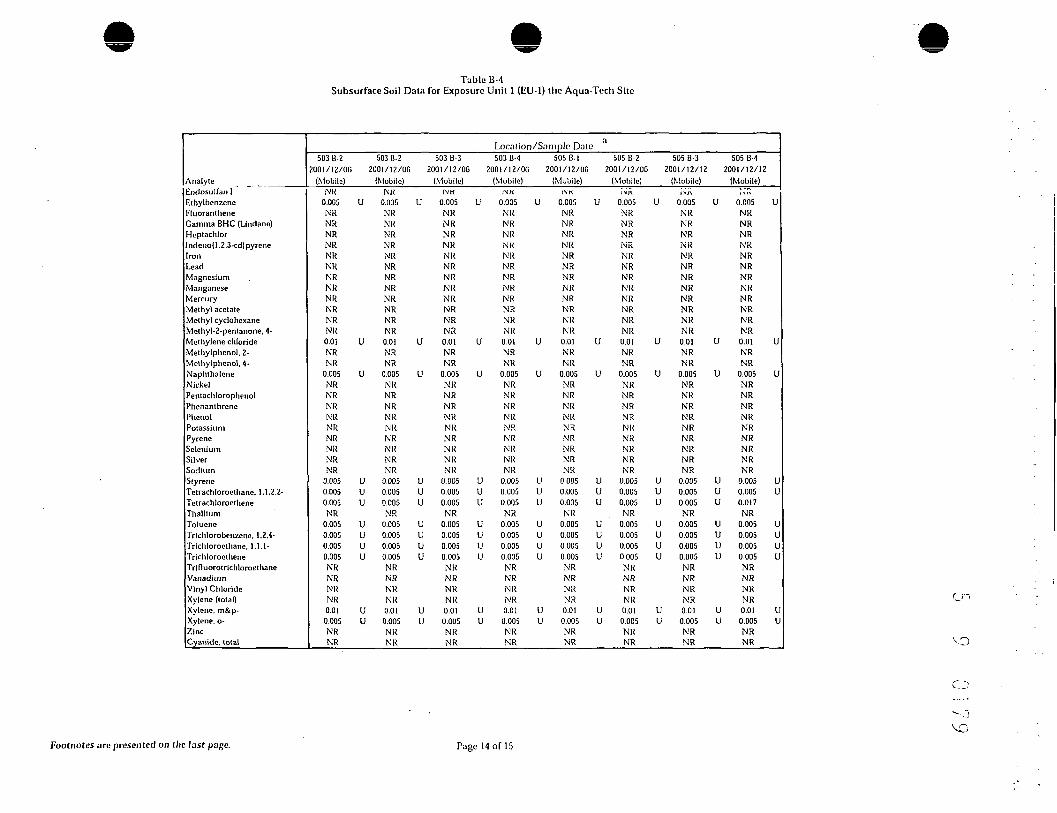
Table B-4Subsurface Soil Data for Exposure Unit 1 (EU-1) the Aqua-Tech Site
Analyte•ndosulfiiji ]ithylbenzene'tuorantheneGamma BHC (Lindane)HcptachlorIndeno(1.2,3-cd)pyreneron-cadMagnesiumManganesevlercuryMethyl acetateMethyl cyclohexaneMe(hyl-2-pentanone. 4-^lethylene chlorideMethylphenol, 2-4ethylphcnol, 4-NaphthaleneNickel•"entachlorophenol•"henanthrenePhenolPotassium3yreneSeleniumSilverSodiumStyreneTetrachloroethane, 1.1.2,2-TetrachloroetheneThalliumTolueneTrichlorobenzene. 1.2.4-Trichloroethane. 1,1.1-TrichloroetheneTrinuorotrichloroethaneVanadiumVinyl ChlorideXylene (total)Xylene. rn&p-Xylene. o-ZincCyanide, total
Localion/Samplc Date503 B-2
2001/12/06(Mobile)
NR0.005NRNRNRNRNRNRNRNRNRNRNRNR
0.01NRNR
0.005NRNRNRNRNRNRNRNRNR
0.0050.0050.005NR
0.0050.0050.0050.005NRNRNRNR0.010.005NRNR
U
U
U
UUU
UUUU
UU
503 B-22001/12/06
(Mobile)Nli
0.005NRNRNRNRNRNRNRNRNRNRNRNR0.01NRNR
0.005NRNRNRNRNRNRNRNRNR
0.0050.0050.005NR
0.0050.0050.0050.005NRNRNRNR0.010.005NRNR
U
U
U
UUU
UUUU
UU
503 B-32001/12/06
(Mobile)INK
0.005NRNRNRNRNRNRNRNRNRNRNRNR0.01NRNR
0.005NRNRNRNRNRNRNRNRNR
0.0050.0050.005NR
0.0050.0050.0050.005NRNRNRNR0.010.005NRNR
503 B-42001/12/00
(Mobile)1\'K
U 0.005NRNRNRNRNRNRNRNRNRNRNRNR
U 0.01NRNR
U 0.005NRNRNRNRNRNRNRNRNR
U 0.005U 0.005U 0.005
NRU 0.005U 0.005U 0.005U 0.005
NRNRNRNR
U 0.01U 0.005
NRNR
505 B-l2001/12/06
(Mobile)j\n
U 0.005NRNRNRNRNRNRNRNRNRNRNRNR
U 0.01NRNR
U 0.005NRNRNRNRNRNRNRNRNR
U 0.005U 0.005U 0.005
NRU 0.005U 0.005U 0.005U 0.005
NRNRNRNR
U 0.01U 0.005
NRNR
a
U
U
U
UUU
UUUU
UU
505 B-22001/12/00
(Mobile)i\j\
0.005NRNRNRNRNRNRNRNRNRNRNRNR0.01NRNR
0.005NRNRNRNRNRNRNRNRNR
0.0050.0050.005NR
0.0050.0050.0050.005NRNRNRNR0.010.005NRNR
U
U
U
UUU
UUUU
UU
505 B-32001/12/12
(Mobile)i-*j\
0.005NRNRNRNRNRNRNRNRNRNRNRNR0.01NRNR
0.005NRNRNRNRNRNRNRNRNR
0.0050.0050.005NR
0.0050.0050.0050.005NRNRNRNR0.01
0.005NRNR
U
U
U
UUU
UUUU
UU
505 B-42001/12/12
(Mobile)i--'j~
0.005NRNRNRNRNRNRNRNRNRNRNRNR0.01NRNR
0.005NRNRNRNRNRNRNRNRNR
0.0050.0050.017NR
0.0050.0050.0050.005NRNRNRNR0.01
0.005NRNR
U
U
U
UU
UUUU
UU
c~
Footnotes arc presented on (lie last page. Page 14 of 15
Table B-4Subsurface Soil Data for Exposure Unit 1 (EU-1) the Aqua-Tech Site
a - Analytical results are reported in parts per million unless otherwise noted.B - Present in analytical method blank.
D. DL - Results from diluted sample.E - Concentration exceeds instrument calibration range.J - Estimated concentration.U - Concentration less than the Contact Required Quantitation Limit or not validated is accompanied by "u" qualifer.
RE - Reanalysis of the sample.NR - Not Reported.u - Laboratory reported detection not validated during data validation process.* - Duplicated analysis not with in control limits,j - Concentration considered an estimate based on data validation,n - Multi-component target compound exhibits marginal pattern-matching quality.
DUP - Duplicate sample.N - Spiked sample recovery not within control limits.W - Post-digestion spike for Furnace AA analysis is out of control limits (85-115%).
Number followed by "S" - Denotes soil in front of pad.Number followed by "P" - Denotes concrete pad.Number followed by "SP" - Denotes soils below pads.Matrix "C" - Denotes concrete.Matrix "S" - Denotes soil.Matrix "W" - Denotes wastes.Chromium in this sample was identified as Chromium VI.
COCD
Page 15 of 15

Table B-5Subsurface Soil Data for Exposure Unit 2 (EU-2) the Aqua-Tech Site
AnalyteAcenaphthencAcetoneAluminumAnthraceneAntimonyArsenicBariumBenzo(a)anthraceneBcnzo(a)pyreneBenzo(b)fluorantheneBenzo(g.h,i)peryleneBenzo(k)fluorantheneBerylliumCadmiumCalciumCarbazoleChromiumChryseneCobaltCopperODD, 4,4'-DibenzofuranDichloroethene (total), 1,2-FluorantheneIndcno(l,2,3-cd)pyrencIronLoadMagnesiumManganeseMercuryMethylnaphthalcne, 2-Methylphenol, 4-NickclPhcnanthrenePotassiumPyrcncSodiumThalliumTolueneVanadiumZinc
Location/Sample Date3
SB-6A/4-3G/4/98
O.OG J0.02536,000
0.1 J1.2 U6.52400.19 J0.17 J0.12 J
0.092 J0.1G J1.1
0.12 U14000.11 J45
0.19 J2.618
0.00510.053 J0.0025 U
0.4 J0.095 J41,000
371,7001GO
0.140.047 J0.26 J13
0.35 J1,9000.33 J711.7
0.0012 U83140
SB-8A/4-5G/4/98
0.42 U0.3li
38,700 J0.42 U
3 JG.G584 J0.42 U0.42 U0.42 U0.42 _U0.42 U2.30.2 U
1310 J0.42 U38 J
0.42 U8
12.50.004! U
0.42 U0.012 U0.42 U0.42 U
27,300 J20.5
5,930549 J0.13 U0.13 J0.42 U26.4
0.072 J3,6200.42 U17.G U2.1 U
0.012 J68.148.5 J
a - All concentrations arc in ing/kg.J - Estimated concentration.U - Less than the detection limit.
U"i
•..'

Table B-6Sediment Data for Exposure Unit 2 (EU-2) at the Aqua-Tech Site
AnalyteA fntf^rta
AldrinAluminumAnthraceneAntimonyAroclor-1248Aroclor-1254ArsenicBariumBenzo(a) anthraceneBenzo(a)pyreneBenzo(b)fluorantheneBenzo(k)fluroantheneBerylliumBis(2-ethylhexyl)phthalateButylbenzylphthalateCadmiumCalciumChloroformChromiumChryseneCobaltCopperCyanideODD, 4,4'-DDE. 4,4'-DDT, 4.4'-delta-BHCDi-n-butylphthalateDi-n-octyl phthalateDichlorobenzene, 1,4-Dichloroethane, 1,1-Dichloroethane, 1,2-Dichloroethene (total), 1,2-DieldrinEndosulfan 11
Location/Sample DateSD01
G/17/92n nno
0.00218,100NR2.6
0.0410.0410.8142.8
0.0550.410.410.411.3
0.410.411.3249
0.000812.5
0.05913.26.23.3
0.00410.00410.00410.0021
0.410.410.41
0.0130.0130.013
0.00410.0074
I"u*B
NUUUuBJUUUUuuuBJ*
JU*BUUUUUUUuuuuup
SD019/8/92
n.nn0.00234,380NR7.7
0.0460.0460.5548.70.440.440.440.440.390.070.440.72267
0.01311.40.442.84.17
0.00460.00460.00460.0023
0.440.440.44
0.0130.0130.013
0.00140.0046
UU*
uuuNU
UUUUBBJUUBU*UBBUUUUUUUUUUUJPXu
SD0112/8/92
0.012NA
1,810NR5.2
0.170.0410.4715.70.410.410.410.410.220.410.410.67185
0.0124
0.410.92
5.8NANANANA0.090.410.41
0.0120.0120.012NANA
U
E*
U
UUBUUUuuuuuBU
UUuu
BJUuuuu
SD014/6/93
0.013NA
4,240NR3.7
0.0430.0430.3640.40.440.440.440.440.270.440.440.43216
0.01310.70.443.13.73
NANANANA
0.0460.440.44
0.0130.0130.013NANA
a
SD01G/23/93
U
»
UuuBBUUuuBUUUBUNUBB
JBUUUUU
0.0090.00222.830NR2.7
0.0430.043
0.821.70.430.430.430.431.3
0.430.431.3143
0.01310.90.4313.46.23.3
0.00430.00430.00430.0022
0.430.430.43
0.0130.0130.013
0.00430.0043
BJU
NUUUUBNUUUUUUUUB*U*
UuBN*UUUUUUUuuuuuu
SD019/29/93
0.0040.00235,570NR
30.0440.0440.9149.30.440.440.440.441.5
0.440.441.5280
0.01416.50.44
1515.83.7
0.00440.00440.00440.0023
0.180.440.44
0.0140.0140.014
0.00440.0044
HJU
UUUBBUUuuuuuuBU»
Uu*
uuuuuBJUUuuuuu
SD0112/20/93
0.020.0022 U5,040NR
3 NU0.042 U0.042 U0.89 WU41.5 B0.42 U0.42 U0.42 U0.42 U1.5 U
0.42 U0.42 U1.5 U195 B
0.014 U14.40.42 U14.8 U5.9 U3.7 U
0.0042 U0.0042 U0.0042 U0.0022 U
0.42 U0.42 U0.42 U
0.014 U0.014 U0.014 U
0.0042 U0.0042 U
Footnotes are presented on the last page.
Page I o f 6
Coro

Table B-GSediment Data for Exposure Unit 2 (EU-2) at the Aqua-Tech Site
AnalyteF.nririn alriehvdeFluorantheneHeptachlorIronLeadMagnesiumManganeseMercuryMethylene chlorideMethylphenol, 4-NickelPhenanthrenePhenolPotassiumPyreneSodiumTetrachloroetheneThalliumTolueneTrichlorobenzene, 1,2,4-Trichloroethane, 1,1,1-TrichloroetheneVanadiumZinc
SD016/17/92
0.00410.1
0.00218,370
101,04089.30.13
0.002NR10.50.410.411,2000.084132
0.001NR
0.0010.41
0.0130.01320.823.7
UJU*
B
UBJ
UUU*BJUJ
BJUUU*
*
SD019/8/92
0.00460.44
0.00235,22033.2
1,09064.40.120.038NR3.1
0.440.441,1600.44310
0.013NR
0.0130.440.0130.01311.623.1
UUU*
s*BN*UB
BUUBUBU
UUUUB*
SD0112/8/92
NA0.41NA
2,0103.432938.60.12
0.012NR
20.410.413140.41235
0.012NR
0.0120.41
0.0120.012
4.111
U
B
Location/Sample DateSD014/G/93
NA0.44 UNA
5,1107.3 WN878 B60.8
NU 0.11 UU
UUUBUBU
UUUUB
0.013 UNR4.4 B
0.44 U0.44 U998 B0.44 U30 B
0.013 UNR
0.013 U0.44 U
0.013 U0.013 U10.5 B16.8
a
SD01G/23/93
0.00430.43
0.00223,290
7.6527101
0.130.013NR10.70.430.434900.43134
0.013NR
0.0130.43
0.0130.01313.419.5
UUU
*
BN
U
*UUUBUUU
UUUU*uN'
SD019/29/93
0.00440.44
0.00236,88013.1
1,22096.30.15
0.014NR12
0.440.441,2400.44150
0.0009NR
0.0140.44
0.0140.01416.830.2
SD0112/20/93
UUU*
B
UU
UUUBUUJ
UUUU*
0.00420.42
0.00226,000
101,080102
0.150.014NR11.90.420.421,1500.42148
0.001NR
0.0140.42
0.0140.0007
14.824.9
UUU
NB
UU
UUUBUUJUUUJU
Footnotes are presented on the last page.
Page 2 of 6
COOJ
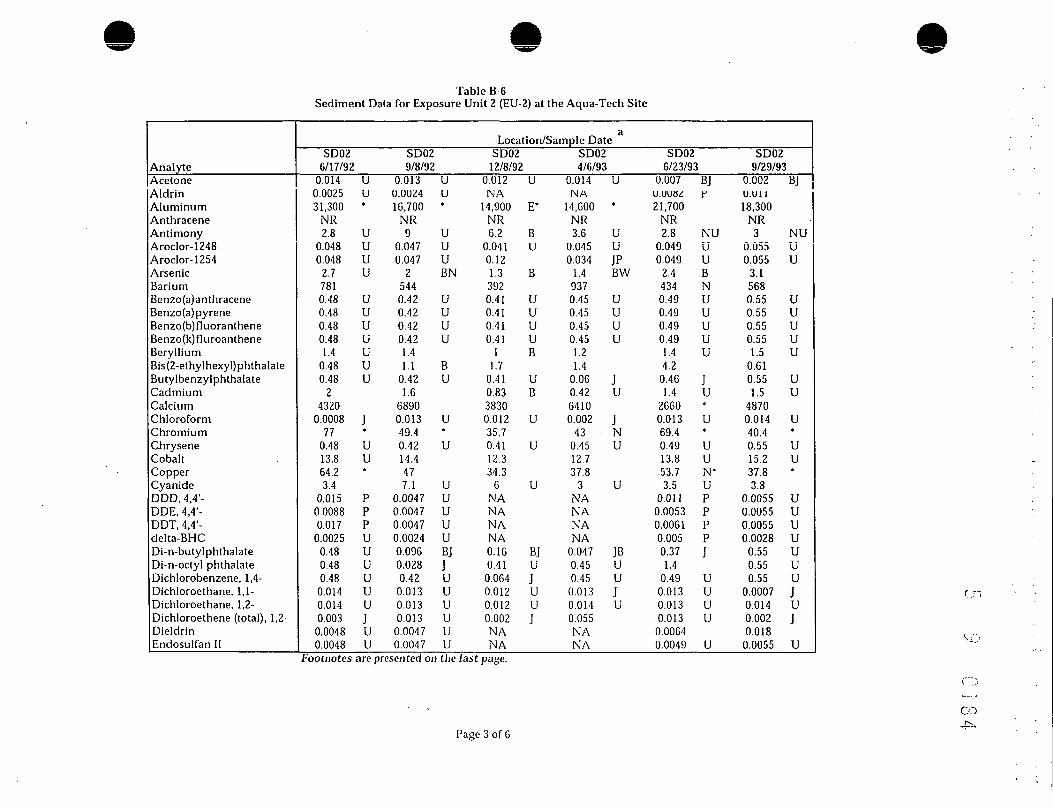
Table B-6Sediment Data for Exposure Unit 2 (EU-2) at the Aqua-Tech Site
AnalyteAcetoneAldrinAluminumAnthraceneAntimonyAroclor-1248Aroclor-1254ArsenicBariumBenzo(a) anthraceneBenzo(a)pyreneBenzo(b)fiuorantheneBenzo(k)fluroantheneBerylliumBis(2-ethylhexyl)phthalateButylbenzylphthalateCadmiumCalciumChloroformChromiumChryseneCobaltCopperCyanideODD, 4,4'-DDE, 4.4'-DDT, 4,4'-delta-BHCDi-n-butylphthalateDi-n-octyl phthalateDichlorobenzene, 1,4-Dichloroethane, 1,1-Dichloroethane, 1,2-Dichloroethene (total), 1,2-DieldrinEndosulfan II
aLocation/Sample Date
SD02G/17/92
0.0140.002531,300
NR2.8
0.0480.048
2.77810.480.480.480.481.4
0.480.48
24320
0.000877
0.4813.864.23.4
0.0150.00880.017
0.00250.480.480.48
0.0140.0140.003
0.00480.0048
UU*
UUUU
UUUUUUU
J*
UU*
pppUUUUUUJUU
SD029/8/92
0.0130.002416,700
NR9
0.0470.047
25440.420.420.420.421.41.1
0.421.6
68900.01349.40.4214.4477.1
0.00470.00470.00470.00240.0960.0280.42
0.0130.0130.013
0.00470.0047
UU«
UUUBN
UUUU
BU
U*U
UUUUUBJJUUUUUU
SD0212/8/92
0.012 UIN A
14,900 E*NR6.2 B
0.041 U0.121.3 B3920.41 U0.41 U0.41 U0.41 U
1 B1.7
0.41 U0.83 B38300.012 U35.70.41 U12.334.3
6 UNANANANA0.16 BJ0.41 U0.064 J0.012 U0.012 U0.002 JNANA
SD024/C/93
0.014INI A
14,600NR3.6
0.0450.034
1.49370.450.450.450.451.21.4
0.060.4264100.002
430.4512.737.8
3NANANANA
0.0470.450.45
0.0130.0140.055NANA
U
*
UUJPBW
UUUU
JU
JNU
U
JBUUJU
SD026/23/93
0.007U.UU8221,700
NR2.8
0.0490.049
2.44340.490.490.490.491.44.2
0.461.4
26600.01369.40.4913.853.73.5
0.0110.00530.00610.0050.371.4
0.490.0130.0130.0130.00640.0049
BJr
NUUUBNUUUUU
JU41
U*
UUN'UppppJUUUU
U
SD029/29/93
0.002U.Ull18,300
NR3
0.0550.055
3.15680.550.550.550.551.5
0.610.551.5
48700.01440.40.5515.237.83.8
0.00550.00550.00550.0028
0.550.550.55
0.00070.0140.0020.018
0.0055
BJ
NUUU
UUUUU
UU
U*
UU*
UUUUUUUJUJU
Footnotes are presented on the last page.
CO
Page 3 ofG

Table B-6Sediment Data for Exposure Unit 2 (EU-2) at the Aqua-Tech Site
AnalyteEndrin aldehydeFluorantheneHeptachlorIronLeadMagnesiumManganeseMercuryMethylene chlorideMethylphenol, 4-NickelPhenanthrenePhenolPotassiumPyreneSodiumTetrachloroetheneThalliumTolueneTrichlorobenzene, 1,2.4-Trichloroethane, 1,1,1-TrichloroetheneVanadiumZinc
aLocation/Sample Date
SD026/17/92
0.00480.48
0.002837,100
57.912,300
8620.43
0.002NR48.60.480.48
10,3000.48165
0.002NR
0.0010.480.0140.002105157
UUP*
BJ
UU*
UBJ
BJUUJ*
X
SD029/8/92
0.00470.42
0.002422,10076.87,2505390.360.03NR21.50.420.42
6,7700.42402
0.013NR
0.0130.42
0.0130.01353.5105
UUU*
*
N*
B
UU
UBU
UUUU
*
SD0212/8/92NAU.liNA
18,20034.56.5605280.39
0.012NR23.40.410.41
6,1000.41307
0.012NR
0.0120.0480.0120.01243.481.8
u
NU
UU
uBU
uJuu
SD024/6/93
NAU.43 UNA
19,70029.7 N5,1902710.12 U
0.014 UNR20.90.45 U0.45 U
4,8500.45 U
8 B0.017NR
0.014 U0.45 U
0.003 J0.01 J41.266.9
SD026/23/93
0.00490.49
0.002532,400
27.59,6204230.27
0.013NR34.80.490.11
8,4600.49151
0.013NR
0.0130.490.0130.01398.8146
UuU
S"
N
U*
UJuBU
Uuuu%
N*
SD029/29/93
0.0071U.JU
0.002831,200
52.97,3707050.25
0.014NR26
0.550.556,5900.55186
0.001NR
0.0140.550.0140.00168.197.2
UU*
u
uuuBJ
UuuJ*
Footnotes are presented on the Jastpage.
Page 4 of 6
COcn

Table B-6Sediment Data for Exposure Unit 2 (EU-2) at the Aqua-Tech Site
AnalyteAcetoneAldrinAluminumAnthraceneAntimonyAroclor-1248Aroclor-1254ArsenicBariumBenzo(a)anthraceneBenzo(a)pyreneBenzo(b)fluorantheneBenzo (k) fluroantheneBerylliumBis(2-ethylhexyl)phthalateButylbenzylphthalateCadmiumCalciumChloroformChromiumChryseneCobaltCopperCyanideDDD, 4,4'-DDE, 4,4'-DDT, 4,4'-delta-BHCDi-n-butylphthalateDi-n-octyl phthalateDichlorobenzene, 1,4-Dichloroethane, 1,1-Dichloroethane, 1,2-Dichloroethene (total), 1,2-DieldrinEndosulfan II
Location/Sample DateSD02
12/20/930.007
0.002323,300
NR3
0.450.451.25370.450.450.450.451.5
0.0980.451.6
42300.01459.60.4516.579.33.7
0.00450.00450.00450.0023
0.450.450.45
0.0140.0010.0050.00450.0045
jU
NUUUB
UUUUU
U
U
U
UUUUUUUUUJJUU
SD-1G/8/98
0.0140.002410,200
0.473.2
0.0460.046
2.189.9
0.0680.0640.0660.0740.920.470.470.23426
0.01423.7
0.0893.68.9
0.240.00460.00460.00460.0024
0.470.470.47
0.0140.0140.0140.00460.0046
UU
UJUUU
JJJJUUU
U
JJUUUUUUUUUUUUU
SD-26/8/98
0.0078 U0.0026 U20,000
0.52 U1.6 U
0.052 U0.052 U
5.35200.52 U0.52 U0.52 U0.52 U1.3
0.750.52 U0.713800
0.0016 U37
0.52 U1822
0.78 U0.0052 U0.0052 U0.0052 U0.0026 U
0.52 U0.52 U0.52 U
0.00220.0016 U0.00960.0052 U0.0052 U
SD-46/8/98
0.0069 U0.0023 U5,9000.46 U1.4 U
0.046 U0.046 U
1.558
0.46 U0.46 U0.46 U0.46 U0.460.46 U0.46 U0.14 U160
0.0014 U16
0.46 U2.25.3
0.69 U0.0046 U0.0046 U0.0046 U0.0023 U
0.46 U0.46 U0.46 U
0.0014 U0.0014 U0.0027 U0.0046 U0.0046 U
SD-5G/8/98
0.025 U0.0027 U12,7000.042 J
3 J0.052 U0.052 U
2.796.80.15 J0.16 J0.16 J0.14 J1.1
0.52 U0.52 U0.31469
0.016 U29.80.17 J4.910.1 J0.27 U
0.0052 U0.0052 U0.0052 U0.0027 U
0.52 U0.52 U0.52 U
0.016 U0.016 U0.016 U0.0052 U0.0052 U
a
SD-GG/8/98
0.0065 U0.0022 U3,7000.44 U1.3 U
0.044 U0.044 U
1.428
0.44 U0.44 U0.44 U0.44 U0.290.44 U0.44 U0.13 U88
0.0013 U7.9
0.44 U1.22.8
0.65 U0.0044 U0.0044 U0.0044 U0.0022 U
0.44 U0.44 U0.44 U
0.0013 U0.0013 U0.0026 U0.0044 U0.0044 U
SD-6 (DU-04)G/8/98
0.00640.00215,0000.431.3
0.0430.043
1.340
0.430.430.430.430.5
0.430.430.13160
0.001319
0.432
3.90.64
0.00430.00430.00430.0021
0.430.430.43
0.00130.00130.00260.00430.0043
UU
UUUUU
UUUU
UUU
U
U
UUUUUUUUUUUUU
SD-0027/8/99NRNR
14,200NR0.6NRNR2.6240NRNRNRNR0.4NRNR0.5 U
2100NR25NR611
NRNRNRNRNRNRNRNRNRNRNRNRNR
SD-0077/8/99NRNR
6,170NR0.5 UNRNR1.1
47.1NRNRNRNR0.3 UNRNR0.5 U300NR12
NR28
NRNRNRNRNRNRNRNRNRNRNRNRNR
Footnotes are presented on the last page.
Page 5 of 6

Table B-6Sediment Data for Exposure Unit 2 (EU-2) at the Aqua-Tech Site
AnalyteEndrin aldehydeFluorantheneHeptachlorIronLeadMagnesiumManganeseMercuryMethylene chlorideMethylphenol, 4-NickelPhenanthrenePhenolPotassiumPyreneSodiumTetrachloroetheneThalliumTolueneTrichlorobenzene, 1,2,4-Trichloroethane, 1,1,1-TrichloroetheneVanadiumZinc
Location/Sample DateSD02
12/20/930.0045
0.450.002330,600
29.59,3506110.33
0.014NR32.20.450.45
8,2600.45149
0.006NR
0.0140.45
0.0140.00388.5118
UuU
N
U
uuuuJuuuJ
SD-16/8/98
0.00460.17
0.002412,000
14.12,41093.20.14
0.0140.477.2
0.130.472,5400.1381
0.0142.4
0.0140.47
0.0140.01425.640.8
UJU
J
UUuJuJuuuuuuu
SD-26/8/98
0.00520.52
0.002629,000
226,8002,6000.16
0.00160.5225
0.520.525,9000.52170
0.0121.6
0.00160.52
0.00160.0062
50100
UUu
uuuuuu
uuuu
SD-4C/8/98
0.0046 UU.UK J
0.0023 U7,1008.9
1,40043
0.14 U0.0014 U
0.46 U4.7
0.46 U0.46 U1,5000.055 J
41 U0.0014 U
1.4 U0.0014 U
0.46 U0.0014 U0.0014 U
1524
SD-56/8/98
0.0052 UU.32 j
0.0027 U13,800
20.4 J2,3201873.6
0.016 U0.037 J
7.90.14 J0.52 U
2,4100.27 J71.7 U
0.016 U2.7 U
0.009 J0.52 U
0.016 U0.016 U
2754.2
a
SD-66/8/98
0.0044 JJU.44 Li
0.0022 U3,800
6.267042
0.13 U0.0013 U
0.44 U3
0.44 U0.44 U7600.44 U200
0.0013 U1.3 U
0.0013 U0.44 U
0.0013 U0.0013 U
7.813
SD-6 (DU-04)C/8/98
0.0043U.1J
0.00217,6008.992067
0.130.0013
0.433.6
0.430.431,0000.43140
0.00131.3
0.00130.43
0.00130.0013
1625
ULiU
UUU
uuuuuuuuu
SD-0027/8/99NkNRNR
17,9006.6
3,90u5210.1 UNRNR13
NRNR
3,100NR50 UNR3.2NRNRNRNR33.842
"lSD-0077/8/99NRINK
NR6,400
7.6J,i301440.1 UNRNR5
NRNR
1,200NR50 UNR1.9NRNRNRNR12.627
a - All concentrations are in nig/kg.NA - Not Analyzed.NR - Not Reported.
B - (inorganic) - Less than the required detection limit but greater than the Instrument Detection Limit.B - (organic) - Present in analytical method blank.E - Concentration exceeds instrument calibration range.* - Duplicated analysis not within control limits.J - Estimated concentration.N - (inorganic) - Spiked sample recovery not within control limits.P - Concentration difference between the two GC columns is greater than 25 percent.S - Value was determined by the Method of Standard Additions (MSA).U - Less than the detection limit.W - Post-digestion spike for Furnace AA analysis is out of control (85-115%), while sample absorbance is
less than 50% of spike absorbance.X - Data has been manually entered into the report-generating software.
Page 6 of 6
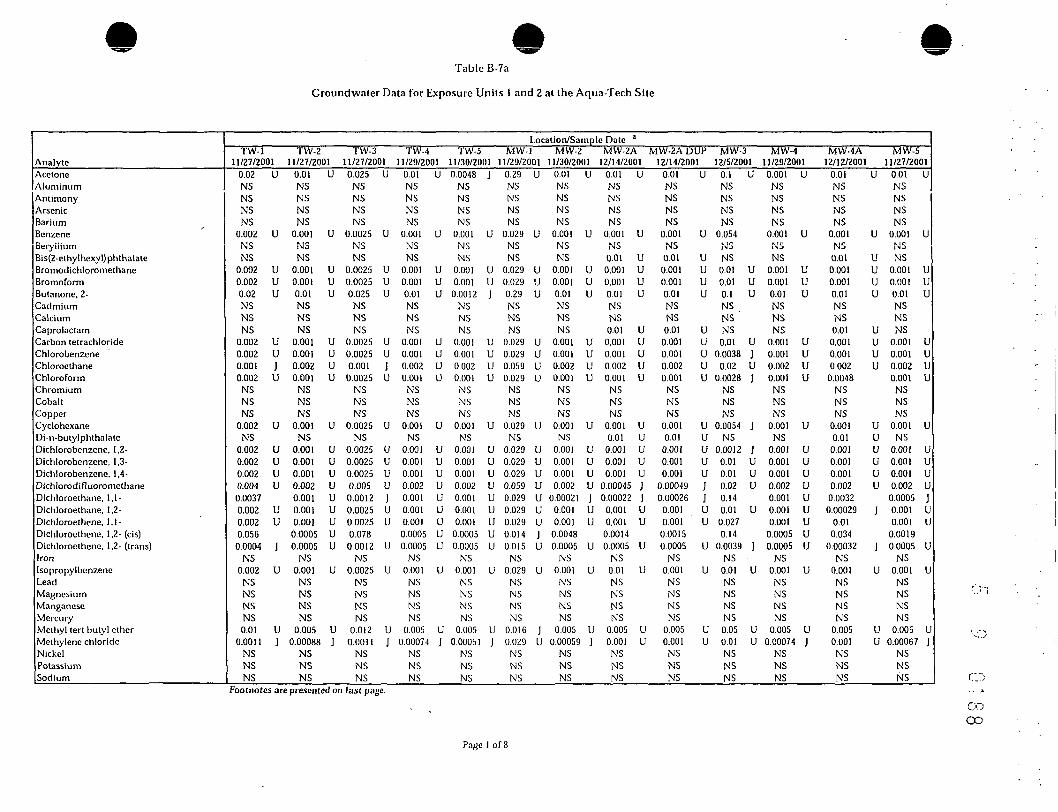
Table B-7a
Groundwater Data for Exposure Units 1 and 2 at the Aqua-Tech Site
AnalytcAcetoneAluminumAntimonyArsenic3arium3enzeneBerylliumBis(2-ethylhexyl)phthalateJromodichloro methaneJromoformJutanone, 2-CadmiumCalciumCaprolactamCarbon tetrachloride~hloro benzeneChloroethaneChloroformChromiumCobaltCopperCyclohexaneDi-n-butylphthalate3ichlorobenzene, 1,2-Dichlorobenzene, 1,3-Dichlorobenzcne, 1.4-3ichlorodifluoromethaneDichloroelhane. 1,1-Dichloroethane, 1,2-Dichloroethene, 1,1-Dichlorocthene, 1.2- (cis)Dichloroethene, 1.2- (trans)IronIsopropylbenzeneLeadMagnesiumManganeseMercuryMethyl tert butyl etherMethylene chlorideNickelPotassiumSodium
Location/Sample Date a
TW-111/27/2001
0.02NSNSNSNS
0.002NSNS
0.0020.002
0.02NSNSNS
0.0020.0020.0010.002NSNSNS
0.002NS
0.0020.0020.0020.0040.00370.0020.0020.0560.0004
NS0.002
NSNSNSNS
0.010.0011
NSNSNS
U
U
UUU
UUJU
U
UUUU
UU
JU
UJ
TW-211/27/2001
0.01NSNSNSNS
0.001NSNS
0.0010.001
0.01NSNSNS
0.0010.0010.0020.001
NSNSNS
0.001NS
0.0010.0010.0010.0020.0010.0010.0010.00050.0005
NS0.001
NSNSNSNS
0.0050.00088
NSNSNS
U
U
UUU
UUUU
U
UUUUUUUUU
U
UJ
TVV-311/27/20010.025
NSNSNSNS
0.0025NSNS
0.00250.00250.025
NSNSNS
0.00250.0025
0.0010.0025
NSNSNS
0.0025NS
0.00250.00250.00250.0050.00120.00250.00250.0780.0012
NS0.0025
NSNSNSNS
0.0120.0011
NSNSNS
U
U
UUU
UUJU
U
UUUUJUU
U
U
UJ
TW-411/29/2001
0.01NSNSNSNS
0.001NSNS
0.0010.001
0.01NSNSNS
0.0010.0010.0020.00 1
NSNSNS
0.001NS
0.0010.0010.0010.0020.0010.0010.0010.00050.0005
NS0.001
NSNSNSNS
0.0050.00074
NSNSNS
U
U
UUU
UUUU
U
UUUUUUUUU
U
UJ
TW-511/30/20010.0048
NSNSNSNS
O.U01NSNS
0.0010.001
0.0012NSNSNS
0.0010.0010.0020.001
NSNSNS
0.001NS
0.0010.0010.0010,0020.0010.0010.001
0.00050.0005
NS0.001
NSNSNSNS
0.0050.00051
NSNSNS
J
U
UUJ
UUUU
U
UUUUUUUUU
U
UJ
MW-111/29/2001
0.29NSNSNSNS
0.029NSNS
0.0290.029
0.29NSNSNS
0.0290.0290.0590.029
NSNSNS
0.029NS
0.0290.0290.0290.0590.0290.0290.0290.0140.015
NS0.029
NSNSNSNS
0.01C0.029
NSNSNS
U
U
UUU
UUUU
U
UUUUUUUJU
U
JU
MW-211/30/2001
0.01 UNSNSNSNS
0.001 UNSNS
0.001 U0.001 U
0.01 UNSNSNS
0.001 U0.001 U0.002 U0.001 U
NSNSNS
0.001 UNS
0.001 U0.001 U0.001 U0.002 U
0.00021 J0.001 U0.001 U
0.00480.0005 U
NS0.001 UNSNSNSNS
0.005 U0.00059 J
NSNSNS
MW-2 A12/14/2001
0.01 UNSNSNSNS
0.001 UNS0.01 U
0.001 U0.001 U0.01 UNSNS
0.01 U0.001 U0.001 U0.002 U0.001 U
NSNSNS
0.001 U0.01 U
0.001 U0.001 U0.001 U
0.00045 J0.00022 J0.001 U0.001 U
0.00140.0005 U
NS0.01 UNSNSNSNS
0.005 U0.001 UNSNSNS
MW-2A DUP MW-312/14/2001 12/5/2001
0.01NSNSNSNS
0.001NS0.01
0.0010.001
0.01NSNS0.01
0.0010.0010.0020.001
NSNSNS
0.0010.01
0.0010.0010.001
0.000490.00026
0.0010.001
0.00150.0005
NS0.001
NSNSNSNS
0.0050.001
NSNSNS
U 0.1 UNSNSNSNS
U 0.054NS
U NSU 0.01 UU 0.01 UU 0.1 U
NSNS
U NSU 0.01 UU 0.0038 JU 0.02 UU 0.0028 J
NSNSNS
U 0.0054 JU NSU 0.0012 JU 0.01 UU 0.01 UJ 0.02 UJ 0.14U 0.01 UU 0.027
0.14U 0.0039 J
NSU 0.01 U
NSNSNSNS
U 0.05 UU 0.01 U
NSNSNS
MW-411/29/20010.001NSNSNSNS
0.001NSNS
0.0010.001
0.01NSNSNS
0.0010.0010.0020.001
NSNSNS
0.001NS
0.0010.0010.0010.0020.0010.0010.001
0.00050.0005
NS0.001NSNSNSNS
0.0050.00074
NSNSNS
U
U
UUU
UUUU
U
UUUUUUUUU
U
UJ
MW-4A12/12/2001
0.01NSNSNSNS
0.001NS0.01
0.0010.001
0.01NSNS
0.010.0010.0010.002
0.0048NSNSNS
0.0010.010.0010.0010.0010.0020.00320.00029
0.010.034
0.00032NS
0.001NSNSNSNS
0.0050.001NSNSNS
U
U
UUUU
UUUU
UUUUUU
J
JU
UU
MW-511/27/2001
0.01 UNSNSNSNS
0.001 UNSNS
0.001 U0.001 U0.01 UNSNSNS
0.001 U0.001 U0.002 U0.001 UNSNSNS
0.001 UNS
0.001 U0.001 U0.001 U0.002 U
0.0005 J0.001 U0.001 U
0.00190.0005 U
NS0.001 UNSNSNSNS
0.005 U0.00067 J
NSNSNS
Footnotes are presented on last page.COCO
Page 1 of 8

Table B-7a
Groundwater Data for Exposure Units 1 and 2 at the Aqua-Tech Site
AnalytcTetrachloroelhane, 1.1,2.2-TetrachloroetheneThalliumTolueneTrichloroelhane, 1.1,1-TrichloroetheneTrichioi'onuoruiuelhaiiuTrifluorotrichloroethancVanadiumVinyl chlorideXylene (total)Zinc
Location/Sample Date a
TW-111/27/20010.002 U0.01NS
0.002 U0.00033 J0.0340.004 U0.002 UNS
0.004 U0.002 U
NS
TW-211/27/20010.001 U0.001 U
NS0.00032 J
0.001 U0.001 U0.002 U0.001 UNS
0.002 U0.001 UNS
TW-311/27/20010.0025 U0.0038
NS0.0025 U
0.00039 J0.0410.005 U
0.0025 UNS
0.005 U0.0025 U
NS
TW-411/29/20010.001 U0.001 U
NS0.001 U0.001 U0.001 U0.002 u0.001 UNS
0.002 U0.001 UNS
TW-511/30/20010.001 U0.001 UNS
0.001 U0.001 U0.001 U0.002 U0.001 UNS
0.002 U0.001 UNS
MVV-111/29/20010.029 U
1.2NS
0.029 U0.0048 J0.0460.059 U0.029 UNS
0.059 U0.029 U
NS
MW-211/30/20010.001 U
0.00039 JNS
0.001 U0.001 U
O.OOOG7 J0.002 U0.001 UNS
0.002 U0.001 UNS
MW-2A12/14/20010.001 U
0.00091 JNS
0.00045 J0.01 U0.001 U0.002 o0.001 UNS
0.002 U0.001 UNS
MW-2A DUP12/14/20010.001 U
0.00092 JNS
0.00047 J0.001 U0.001 U0.002 u0.001 U
NS'0.002 U0.001 UNS
MW-312/5/20010.0026 J
0.2NS0.01 U0.26
0.0650.02 U0.01 UNS
0.0460.0052 J
NS
MW-411/29/20010.001 U0.001 UNS
0.001 U0.001 U0.001 U0.002 u0.001 UNS
0.002 U0.001 UNS
MW-4A12/12/20010.0029
0.02NS
0.001 U0.00310.0240.002 U
•0.0019NS
0.00022 - J0.001 UNS
MW-511/27/20010.001 U
0.0036NS
0.001 U0.001 U
0.00140.002 u
0.00065 JNS
0.002 U0.001 UNS
Footnotes arc presented on last page.
Page 2 of 8

Table B-7a
Groundwater Data for Exposure Units 1 and 2 at the Aqua-Tech Site
AnalytcAcetoneAluminumAntimonyArsenicBariumBenzeneBerylliumBis(2-cthylhexyl)phthalateJromodichloromelhaneSromoformSutanone, 2-CadmiumCalcium^aprolactamCarbon tetrachlorideChlorobenzeneChloroethaneChloroformChromiumCobaltCopperCyclohexaneDi-n-butylphthalateDichlorobenzene. 1.2-Dichlorobenzenc, 1,3-Dichlorobenzene, 1.4-DichlorodifluoromcthaneDichloroethane, .1-Dichloroethane. .2-Dichloroethene, ,1-Dichloroethene, ,2- (cis)Dichloroethene, ,2- (trans)IronIsopropylbenzeneLeadMagnesiumManganeseMercuryMethyl tert butyl elherMethylene chlorideNickelPotassiumSodium
Location/Sample DateMW-6
11/28/20010.01 UNSNSNSNS
0.001 UNSNS
0.001 U0.001 U0.01 UNSNSNS
0.001 U0.001 U0.002 U0.001 UNSNSNS
0.001 UNS
0.001 U0.001 U0.001 U0.002 U0.00180.001 U0.001 U0.016
0.0005 UNS
0.001 UNSNSNSNS
0.005 U0.00062 J
NSNSNS
MW-6A MW-711/28/2001 11/30/2001
0.01n.?.
0.00620.10.15
0.0010.005NS
0.0010.0010.010.005
7.7NS
0.0010.0010.0020.0010.010.050.0250.01NS
0.0010.0010.0010.0020.0010.0010.001
0.00050.0005
0.180.0010.0033.4 B0.0120.00020.005
0.000650.044.37
U 0.056 U1 1 4.5B 0.0043 BU 0.0287B 0.52U 0.0033 JU 0.005 U
NSU 0.0056 UU 0.0056 UU 0.056 UU 0.005 UJ 17.6 J
NSU 0.0056 UU 0.013U 0.17U 0.0056 UU 0.004 BU 0.14U 0.011 BU 0.0056 U
NSU 0.0071U 0.0056 UU 0.01 BU 0.011 UU 0.008U 0.0056 UU 0.0056 UU 0.0028 UU 0.0028 U
95.4U 0.0056 UU 0.0058J 7.5 JB 2.9U 0.00028U 0.028 UJ 0.0056 UU 0.059B 12.3J 3C.9 J
MW-7 DUP MW-7A11/30/2001 11/30/20010.056
NSNSNSNS
0.0033NSNS
0.00560.00560.056
NSNSNS
0.00560.0130.18
0.0056NSNSNS
0.0056NS
0.00680.00560.01
0.0110.00840.00560.00560.00280.0028
NS0.0056
NSNSNSNS
0.0280.0021
NSNSNS
U 0.0017 JNSNSNSNS
J 0.00023 JNSNS
U 0.0013 UU 0.0013 UU 0.013 U
NSNSNS
U 0.0013 U0.0013 U0.0027 U
U 0.0013 UNSNSNS
U 0.0013 UNS
0.0013 UU 0.0013 U
0.0013 UU 0.0027 U
0.0022U 0.00071 JU 0.0013 UU 0.04U O.OOOG6 U
NSU 0.0013 U
NSNSNSNS
U O.OOGG UJ 0.0013 U
NSNSNS
MW-7A12/7/2001
0.1 UNSNSNSNS
0.018NS
0.01 U0.01 U0.01 U0.1 UNSNS
0.01 U0.01 U0.01 U
0.0290.01 UNSNSNS
0.01 U0.0014 J
0.01 U0.01 U0.01 U0.02 U
0.0330.0073 J
0.01 U0.29
0.005 UNS
0.01 UNSNSNSNS0.05 U0.01 UNSNSNS
MVV-812/6/2001
0.01 UNSNSNSNS
0.0035NSNS
0.001 U0.00042 J
0.01 UNSNSNS
0.001 U0.00150.002 U0.001 U.NSNSNS
0.001 UNS
0.001 U0.001 U
0.00035 J0.002 U
0.00094 J0.001 U0.001 U
O.OOG10.0005 U
NS0.0003 J
NSNSNSNS
0.00015 J0.001 U
NSNSNS
MW-8A12/6/20010.0025 J
NSNSNSNS
0.00032 JNS0.01 U
0.001 U0.001 U0.01 UNSNS
0.01 U0.001 U
0.00027 J0.002 U0.001 U
NSNSNS
0.001 U0.01 U
0.001 U0.001 U0.001 U0.002 U
0.00130.001 U0.001 U0.02
0.0005 UNS
0.001 UNSNSNSNS
0.005 U0.001 U
NSNSNS
a
MW-8A DUP12/6/2001
NSMSNSNSNSNSNS
0.0044 JNSNSNSNSNS
0.01 UNSNSNSNSNSNSNSNS
0.01 UNSNSNSNSNSNSNSNSNSNSNSNSNSNSNSNSNSNSNSNS
MW-8B MVV-912/13/2001 12/5/20010.0013
NSNSNSNS
0.001NSNS
0.0010.0010.01NSNSNS
0.0010.0010.0020.001
NSNSNS
0.001NS
0.0010.0010.0010.002
0.000230.0010.0010.00320.0005
NS0.001NSNSNSNS
0.0050.001NSNSNS
J 0.01 UNSNSNSNS
U 0.0026NSNS
U 0.001 UU 0.001 UU 0.01 U
NSNSNS
U 0.001 UU 0.023U 0.002 UU 0.001 U
NSNSNS
U 0.001 UNS
U 0.00078 JU 0.00025 JU 0.0053U 0.002 UJ 0.001 UU 0.001 UU 0.001 U
0.0005 UU 0.0005 U
NSU 0.00046 J
NSNSNSNS
U 0.005 UU 0.001 U
NSNSNS
MW-9A12/6/2001
0.1 Un n.« R
0.0029 B0.01 U0.07 B0.01 U
0.005 U0.01 U0.01 U0.01 U0.1 U
0.0003 BJ76 J
0.01 U0.01 U
0.0031 J0.02 U0.01 U
0.0014 B0.230.025 U0.0016 J0.0023 B
0.01 U0.01 U
0.0021 J0.02 U0.01 U0.01 U0.01 U
0.0240.005 U0.33 J0.01 U
0.003 U2.3 BJ
0.14 J0.0002 U
0.05 U0.01 U0.04 U3.6 BJ
23.5 J
MW-9B12/14/2001
0.071 UNSNSNSNS
0.0071 UNS
0.01 U0.0071 U0.0071 U0.071 U
NS.NS0.01 U
0.0071 U0.0071 U0.014 U0.0071 U
NSNSNS
0.0071 U0.01 U
0.0071 U0.0071 U0.0071 U0.014 U0.0014 J0.0071 U0.0071 U0.0110.0036 U
NS0.0071 U
NSNSNSNS
0.036 U0.0071 U
NSNSNS
MW-1012/6/2001
0.1 UNS
NSNSNS
0.01 UNSNS
0.01 U0.01 U0.1 UNSNSNS
0.002 J0.01 U0.02 U
0.079NSNSNS
0.01 UNS
0.01 U0.01 U0.01 U0.02 U
0.0290.0029 J0.0940.35
0.0021 JNS0.01 UNSNSNSNS0.05 U0.01 UNSNSNS
Footnotes arc presented on last page.
CD
Page 3 of 8

Table B-7a
Groundwater Data for Exposure Units 1 and 2 at the Aqua-Tech Site
AnalyteTelrachloroethanc. 1,1.2.2-T,....~-UI ———— n.U~~«
ThalliumTolueneTrichloroethane. 1,1,1-TrichloroetheneTrichlorofluoromelhaneTrifluorotrichloroe thaneVanadiumVinyl chlorideXylene (total)Zinc
Location/Sample DateMW-6
11/28/20010.001 Un n i o
NS0.001 U0.001 U
0.00390.002 U0.001 UNS
0.002 U0.001 UNS
MW-6A11/28/20010.001 Un nnr 1 10.01 U0.001 U0.001 U0.001 U0.002 U0.001 U0.05 U0.002 U0.001 U0.02 U
MW-711/30/20010.0056 Un nnsfi i 10.00620.0056 U0.0056 B0.0056 U0.01 1 U
0.0056 U0.028 B0.011 U0.0260.024
MW-7 DUP11/30/20010.0056 Un.nnsfi u
NS0.0056 U0.0056 U0.0056 UU.011 U
0.0056 UNS
0.011 U0.023NS
MW-7A11/30/20010.0013 Un.no4«
NS0.0013 U0.0013 U0.0082O.OU27 U0.0013 U
NS0.0027 U0.0013 U
NS
MW-7A12/7/20010.01 U
0.074NS
0.01 U0.01 U0.0540.02 U0.01 UNS
0.08-10.01 UNS
MW-812/6/20010.001 U0.018
NS0.00! (J0.001 U0.0070.002 u0.001 UNS
0.00093 J0.001 UNS
MW-8A12/6/20010.001 U0.025
NS0.001 U0.001 U
0.00520.002 u0.001 UNS
0.002 U0.001 U
NS
a
MW-8A DUP12/6/2001
NSNSNSNSNSNSNSNSNSNSNSNS
MW-8B12/13/20010.001 U0.018
NS0.0004 J0.001 U0.00160.002 b'0.001 UNS
O.OOZ U0.001 U
NS
MW-912/5/20010.001 U0.001 UNS
0.00 1 U0.001 U0.001 U0.002 U0.001 UNS
0.002 U0.001 UNS
MW-9A MW-9B12/6/2001 12/14/20010.01 U 0.0071 U0.27 0.18
0.0074 Bj NSO.Oi U 0.0071 U0.01 U 0.0071 U0.12 0.00920.02 U 0.014 U0.01 U 0.0071 U
0.0063 B NS0.02 U 0.014 U0.01 U 0.0071 U0.02 U NS
MW-1012/6/20010.0360.13NS
0.01 U0.0380.360.02 U0.01 UNS0.02 U0.01 UNS
Footnotes are presented on Jast page.
O
vo
Page 4 of 8

Table B-7a
Groundwater Data for Exposure Units 1 and 2 at tiie Aqua-Tech Site
AnalytcAcetoneAluminumAntimonyArsenicBariumBenzene8cry!!i"~.Bis(2-ethylhexyl)phthalateBromodichloromethaneBromoformButanone, 2-CadmiumCalciumCaprolactamCarbon telrachloridcChlorobenzeneChloroethaneChloroformChromiumCobaltCopperCyclohexaneDi-n-bulylphthalateDichlorobcnzene, 1,2-Dichlorobenzene, 1,3-Dichlorobenzene, 1,4-DichlorodilluoromethaneDichloroethane, 1,1-Dichloroelhane. 1,2-Dichloroethene, 1,1-Dichlorocthene, 1.2- (cis)Dichloroelhene, 1.2- (trans)IronIsopropylbenzeneLeadMagnesiumManganeseMercuryMethyl lert butyl etherMethylenc chlorideNickelPotassiumSodium
Location/Sample Date a
MW-10A MW-11 MW-HA12/12/2001 12/5/2001 12/5/2001
0.01NSNSNSNS
0.001NS0.010.0010.0010.01NSNS0.010.0010.0010.0020.001NSNSNS
0.0010.010.0010.0010.0010.0020.0010.0010.001
0.000940.0005
NS0.001NSNSNSNS
0.0050.001NSNSNS
U 0.067NSNSNSNS
U 0.0091NS
U NSU 0.0067U 0.0067U 0.067
NSNS
U NSU 0.0067U 0.0067U 0.0059U 0.0033
NSNSNS
U 0.0067U NSU 0.0054U 0.0067U 0.0035U 0.013U 0.014U 0.0027U 0.0077
0.05U 0.0033
NSU 0.0067
NSNSNSNS
U 0.033U 0.0067
NSNSNS
U 0.1 UNSNSNSNS0.01NS0.01 U
U 0.01 UU 0.01 UU 0.1 U
NSNS0.01 U
U 0.01 UU 0.01 UJ 0.015 JJ 0.0026 J
NSNSNS
U 0.01 U0.0023 B
J 0.0073 JU 0.01 UJ 0.0066 JU 0.02 U
0.025J 0.0043 J
0.0043 J0.2
U 0.005 UNS
U 0.01 UNSNSNSNS
U 0.05 UU 0.01 U
NSNSNS
MW-11ADUP MW-12 MW-1312/5/2001 11/29/2001 12/12/2001
0.1NSNSNSNS0.01NS0.010.010.010.1NSNS
0.010.010.010.0150.0023
NSNSNS0.01
0.00220.00690.01
0.00650.02
0.0240.00430.0045
0.20.005NS0.01NSNSNSNS0.050.01NSNSNS
U 0.33NSNSNSNS
0.033NS
U NSU 0.033U 0.033U 0.33
NSNS
U NSU 0.033U 0.033J 0.067J 0.033
NSNSNS
U 0.033BJ NSJ 0.033U 0.033J 0.033U 0.067
0.018J 0.033J 0.033
0.97U 0.017
NSU 0.033
NSNSNSNS
U 0.17U 0.033
NSNSNS
U 0.0099 JBNSNSNSNS
U 0.01 UNSNS
U 0.01 UU 0.01 UU 0.1 U
NSNSNS
U 0.01 UU 0.01 UU 0.0026 JU 0.027
NSNSNS
U 0.01 UNS
U 0.01 UU 0.01 UU 0.01 UU 0.02 UJ 0.029U 0.028 JU 0.025
0.32U 0.0028 J
NSU 0.01 U
NSNSNSNS
U 0.05 UU 0.01 U
NSNSNS
MW-1511/27/2001
0.01 UNSNSNSNS
0.001 UNSNS
0.001 U0.001 U0.01 UNSNSNS
0.001 U0.001 U0.002 U0.001 UNSNSNS
0.001 UNS
0.001 U0.001 U0.001 U0.002 U0.001 U0.001 U0.001 U
0.0005 U0.0005 U
NS0.001 UNSNSNSNS
0.005 UO.OOOG6 J
NSNSNS
MW-15 DUP11/27/2001
0.01NSNSNSNS
0.001Nc
NS0.0010.0010.01NSNSNS
0.0010.0010.0020.001
NSNSNS
0.001NS
0.0010.0010.0010.0020.0010.0010.001
0.00050.0005
NS0.001
NSNSNSNS
0.0050.00084
NSNSNS
U
U
UUU
UUUU
U
UUUUUUUUU
U
UJ
MW-1611/28/2001
0.01 UNSNSNSNS
0.001 UNSNS
0.001 U0.001 U0.01 UNSNSNS
0.001 U0.001 U0.002 U0.001 UNSNSNS
0.001 UNS
0.001 U0.001 U0.001 U0.002 U0.001 U0.001 U0.001 U0.0005 U0.0005 U
NS0.001 U
NSNSNSNS
0.005 U0.00084 J
NSNSNS
MW-16A11/28/2001
0.01 U43.10.06 U0.01 U0.028 B0.001 U0.005 U0.0110.001 U0.001 U0.01 U
0.00033 B21 J
0.008 J0.001 U0.001 U0.002 U0.001 U0.0023 B
0.05 U0.0082 B0.001 U0.01 U
0.001 U0.001 U0.001 U0.002 U0.001 U0.001 U0.001 U
0.0005 U0.0005 U
17.70.001 U
0.00620.86 BJ0.028
0.000075 B0.005 U
0.00073 J0.0023 B
2.9 B5.4 J
MW-19 MW-2012/5/2001 11/29/2001
0.1NSNSNSNS0.01NSNS
0.010.010.1NSNSNS0.010.010.020.01NSNSNS0.01NS
0.010.010.010.02
0.00230.010.01
0.0340.005
NS0.01NSNSNSNS0.050.01NSNSNS
U 0.077 UNSNSNSNS
U 0.0077 UNSNS
U 0.0077 UU 0.0077 UU 0.077 U
NSNSNS
U 0.0077 UU 0.0077 UU 0.015 UU 0.0077 U
NSNSNS
U 0.0077 UNS
U 0.0077 UU 0.0077 UU 0.0077 UU 0.015 UJ 0.0087U 0.0077 UU 0.0077 U
0.22U 0.0038 U
NSU 0.0077 U
NSNSNSNS
U 0.038 UU 0.0077 U
NSNSNS
MW-2111/28/2001
0.01 UNSNSNSNS
0.001 UNSNS
0.001 U0.001 U0.01 UNSNSNS
0.001 U0.001 U0.002 U0.001 U
NSNSNS
0.001 UNS
0.001 U0.001 U0.001 U0.002 U0.001 U0.001 U0.001 U
0.0005 U0.0005 U
NS0.001 UNSNSNSNS
0.005 U0.00089 J
NSNSNS
Footnotes arc presented on Jast page.
Page 5 of 8

Table B-7a
Groundwater Data for Exposure Units 1 and 2 at the Aqua-Tech Site
AnalytcTetrachloroethane. 1.1.2,2-Tntrarhlnrnpthnnp.ThalliumTolueneTrichloroethane. 1,1,1-TrichloroelhencTrichlorolluoromethaneTrifluorolrichloroethaneVanadiumVinyl chlorideXylene (total)Zinc
Location/Sample Date a
MW-10A MW-11 MW-11A12/12/2001 12/5/2001 12/5/2001
0.001 U 0.012 0.020.00037 1 0.026 0.029
NS NS NS0.001 U 0.0067 U 0.01 U0.001 U 0.0054 J 0.0035 J0.0006 J 0.17 0.30.002 U 0.013 U 0.02 U0.001 U 0.0067 U 0.01 UNS NS NS
0.002 U 0.0086 J 0.0420.001 U 0.0067 U 0.01 UNS NS NS
MW-11ADUP12/5/20010.0210.029
NS0.01
0.00380.310.020.01NS
0.0440.01NS
UU
UU
U
MW-1211/29/20010.033 U0.11NS
0.033 U0.008 J0.640.067 U0.033 UNS
0.067 U0.033 U
NS
MW-1312/12/2001
0.020.097
NS0.01 U
0.0150.290.02 U
0.0)2NS
0.0024 J0.01 UNS
MW-1511/27/2001
0.001 U0.0027
NS0.001 U0.001 U0.001 U0.002 U0.001 UNS
0.002 U0.001 UNS
MW-15 DUP11/27/20010.001 U0.003
NS0.001 U0.001 U0.001 U0.002 U0.001 UNS
0.002 U0.00 1 UNS
MW-1611/28/20010.001 U
0.00098 jNS
0.001 U0.001 U0.001 U0.0014 j0.0021
NS0.002 U0.001 UNS
MW-16A11/28/20010.001 U0.0016
0.01 U0.001 U0.001 U
0.00028 J0.002 U0.001 U
0.0093 B0.002 U0.001 U0.032
MW-19 MW-2012/5/2001 11/29/20010.0031 J 0.0077 U
0.29 0.028NS NS
0.01 U 0.0077 U0.01 U 0.0012 J0.033 0.120.02 U 0.015 U0.01 U 0.0077 UNS NS0.02 U 0.015 U0.01 U 0.0077 UNS NS
MW-2111/28/20010.001 U0.001 UNS
0.001 U0.001 U0.001 Un nm 1 1
0.00065 JNS
0.002 U0.00 1 UNS
Footnotes are presented on last page.
Page 6 of 8
OJ

Table B-7a
Groundwater Data for Exposure Units 1 and 2 at the Aqua-Tech Site
AnalyteAcetoneAluminumAntimonyArsenic3ariumSenzeneBerylliumBis(2-ethylhcxyl)phthalate3romodichloro methane3romoformJutanone, 2-CadmiumCalciumCaprolactamCarbon tetrachlorideChlorobenzeneChloroethaneChloroformChromiumCobaltCopperCyclohexaneDi-n-butylphthalateDichlorobenzene, 1,2-3ichlorobenzcne, 1,3-Dichlorobenzene, 1,4-DichlorodinuoromethaneDichloroelhane, 1,1-Dichloroethane, 1,2-Dichloroethene, 1,1-Dichloroethene, 1,2- (cis)Dichloroethcne, 1,2- (trans)IronIsopropylbenzeneLeadMagnesiumManganeseMercuryMethyl tert butyl etherMethylenc chlorideNickelPotassiumSodium
Location/Sample Date a
MW-2211/29/2001
0.01NSNSNSNS
0.001NSNS
0.0010.0010.01NSNSNS
0.0010.0010.0020.001NSNSNS
0.001NS
0.0010.0010.0010.0020.0010.0010.0010.00050.0005
NS0.001NSNSNSNS
0.0050.00053
NSNSNS
U
U
UUU
UUUU
U
UUUUUUUUU
U
UJ
MW-2312/11/2001
0.01 U0.2 U0.06 U0.01 U
0.018 B0.001 U0.005 U0.01 U
0.001 U0.001 U0.01 U
0.005 U1 B
0.01 U0.001 U0.001 U0.002 U0.001 U0.01 U0.05 U
0.025 U0.001 U0.01 U
0.001 U0.001 U0.001 U0.002 U0.001 U0.001 U0.001 U0.0005 U0.0005 U
0.1 U0.001 U0.003 U0.42 B
0.005C B0.0002 U0.005 U0.001 U0.04 U
l.G B2.5 B
MW-23A12/12/2001
0.0 1 U0.9 1
0.06 U0.01 U0.025 B0.001 U0.005 U0.001 U0.001 U0.001 U0.01 U0.005 U
8.30.01 U
0.00! U0.001 U0.002 U
0.00076 J0.01 U0.05 U0.025 U0.001 U0.01 U0.001 U0.001 U0.001 U0.002 U0.001 U0.001 U0.001 U0.0005 U0.0005 U
1.40.001 U0.003 U
1.8 B0.18
0.0002 U0.005 U0.001 U0.04 U5.5 J
10.7
MW-2411/29/2001
0.01 U29.2
0.0028 B0.007 B0.18 B
0.001 U0.0025 B
NS0.001 U0.001 U0.01 U0.005 U
4.7 BJNS
0.001 U0.001 U0.002 U0.001 U0.026
0.003G B0.014 B0.001 UNS
0.001 U0.001 U0.001 U0.002 U0.001 U0.001 U0.001 U0.0005 U0.0005 U
9.50.001 U
0.00681.9 BJ
0.150.000072 B
0.005 U0.00062 J0.0096 B
3.1 BG.2 J
MW-24A MW-2512/13/2001 12/13/20010.00052
30.060.010.11
0.0010.0050.01
0.000250.0010.01
0.00523
0.010.0010.0010.002
0.000970.00320.05
0.00780.0010.01
0.0010.0010.0010.0020.0010.0010.0010.00050.0005
2.10.0010.003
1.10.0420.00020.0050.0010.003
3.413.7
J 0.00140.49
U O.OGU 0.01B 0.038U 0.001U 0.005U 0.01J 0.001U 0.001U 0.01U 0.005J 27.6U 0.01U 0.001U 0.001U 0.002J 0.00042B 0.01U 0.0042B 0.025U 0.001U 0.01U 0.001U 0.001U 0.001U 0.002U 0.0002U 0.001U 0.001U 0.0012U 0.0005
0.37U 0.001U 0.003BJ 3J 2.2U 0.0002U 0.005U 0.001B 0.019BJ 3.3J 8.4
J
UUBUUUUUUUJUUUUJUBUUUUUUUJUU
U
UUBJJUUUBBJ
1
MW-2612/12/2001
0.01 U3
0.0031 B0.01 U0.075 B0.001 U0.005 U0.01 U0.001 U0.001 U0.01 U0.005 U
3.9 B0.01 U0.001 U0.001 U0.002 U
O.OOOG1 J0.01
0.0033 B0.025 U0.001 U0.01 U0.001 U0.001 U0.001 U0.002 U0.001 U0.001 U0.001 U
0.0005 U0.0005 U
2.60.001 U0.003 U
1.5 BO.G6
0.0002 U0.005 U0.001 U0.01 B5.34.9 B
MW-26 DUP12/12/2001
0.011.5
O.OG0.0043
0.070.0010.0050.010.0010.0010.010.005
3.60.010.0010.0010.002
0.000540.00390.00330.0250.0010.010.0010.0010.0010.0020.0010.0010.001
0.00050.0005
1.70.0010.003
1.30.67
0.00020.0050.0010.0045
4.35.9
UiUBBUUUUUUUBUUUUJBBUUUUUUUUUUUU
UUB
UUUBBJ
Footnotes arc presented on last page.
Page 7 of8
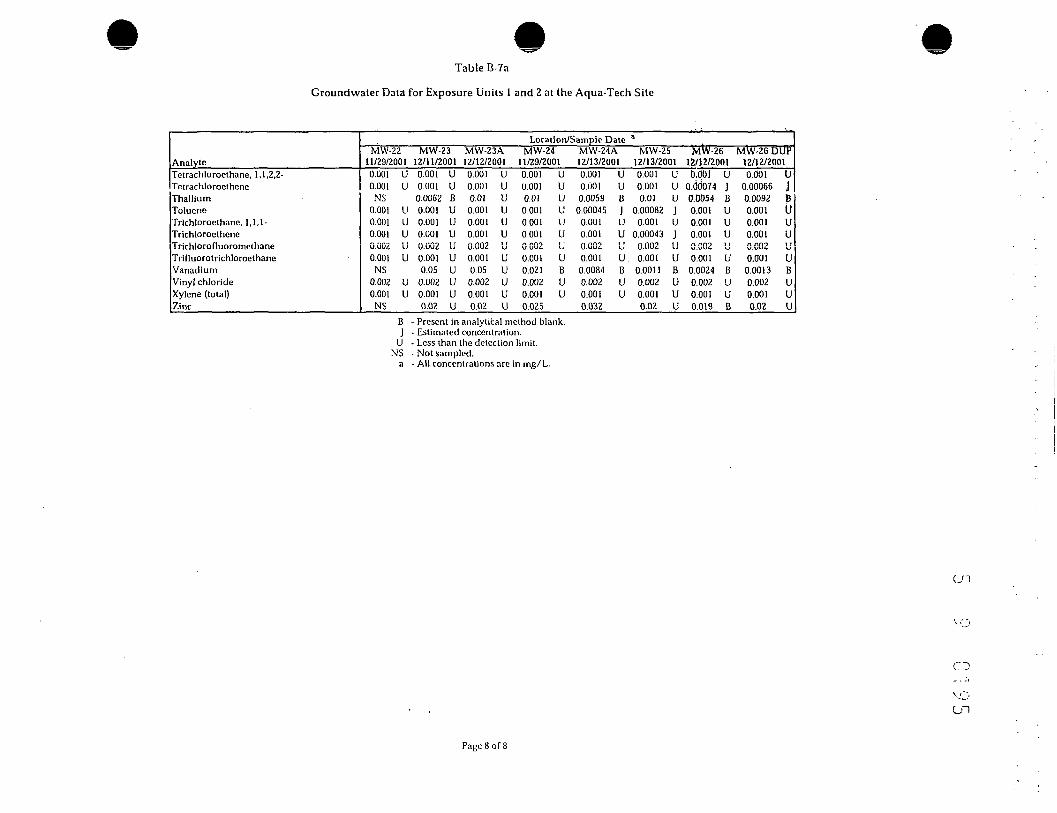
Table B-7a
Groundwater Data for Exposure Units 1 and 2 at the Aqua-Tech Site
AnalyteTetrachloroethane, 1,1,2,2-TRtrachloroetheneThalliumTolueneTrichloroethane, 1,1,1-TrichlorocthcneTrichiororiuoromcihaneTrlfluorotrichloroethaneVanadiumVinyl chlorideXylene (total)Zinc
Location/Sample Date a
MW-2211/29/20010.001 U0.001 UNS
0.001 U0.001 U0.001 U0.002 U0.001 UNS
0.002 U0.001 UNS
MW-2312/11/2001
0.0010.0010.00620.0010.0010.0010.0020.0010.05
0.0020.0010.02
UUBUUUUUUUUU
MW-23A12/12/2001
0.0010.0010.010.0010.0010.0010.0020.0010.050.0020.0010.02
UUUUUUUUUUUU
MW-2411/29/20010.001 U0.001 U0.01 U0.001 U0.001 U0.001 U0.002 U0.001 U0.021 B0.002 U0.001 U0.025
MW-24A12/13/20010.001 U0.001 U0.0059 B
0.00045 J0.001 U0.001 U0.002 U0.001 U0.0084 B0.002 U0.001 U0.032
MW-2512/13/20010.001 U0.001 U0.01 U
0.00082 J0.001 U
0.00043 J0.002 U0.001 U
0.0011 B0.002 U0.001 U0.02 U
MW-2612/12/20010.00 1 U
o:ddo74 j0.0054 B0.001 U0.001 U0.00 1 U0.002 U0.001 U
0.0024 B0.002 U0.001 U0.019 B
MW-26 DUP12/12/20010.001
0.000660.00920.0010.0010.0010.0020.0010.00130.0020.0010.02
UjBUuUT I
UBUUU
B - Present in analytical method blank.J - Estimated concentration.
U - Less than the detection limit.NS - Not sampled,
a - All concentrations are in mg/L.
Page 8 of 8

Table B-7b
Groundwater Data Used lo Develop Exposure PointConcentrations for "Plume" Wells at the Aqua-Tech Site
Analyte
AluminumAntimonyArsenicBariumBenzeneBis(2-ethylhexyl)phthalateBromodichloromethaneCarbon tetrachlorideChlorobenzeneChloroethaneChloroformChromiumCobaltDichlorobenzene, 1,4-Dichloroethane, 1,1-Dichloroethane, 1,2-Dichloroethene, 1,1-Dichloroethene, 1,2- (cis)Dichloroethene, 1,2- (trans)IronManganeseMethyl tert butyl etherTetrachloroethane, 1,1,2,2-TetrachloroetheneThalliumTrichloroethane, 1,1,1-TrichloroetheneVanadiumVinyl chloride
MW-312/5/2001
(mg/L)
0.13 a
0.005 a
0.005 a
0.5 a
0.0540.005 a
0.0050.0050.0038
0.010.00280.0071 a
0.048 a
0.0050.140.0050.0270.14
0.003913 a
35 a
0.0250.0026
0.20.014 a
0.260.065
0.0083 a
0.046
UU
UUuJuJ
uu
JpuJ
MW-11A12/5/2001(mg/L)
0.025 a
0.011a
0.005 a
0.3 a
0.010.0050.0050.0050.0050.0150.00260.0015 a
0.06 a
0.00660.0250.00430.0045
0.20.0025
4.9 a
9.7 a
0.0250.0210.0290.005 a
0.00380.31
0.0025 a
0.044
U
U
UUUUJJU
JJJuppu
uJu
MW-1211/29/2001
(mg/L)
7.1 a
0.005 a
0.005 a
0.2 a
0.01650.0055 a
0.01650.01650.01650.03350.01650.021 a
0.018 a
0.01650.018
0.01650.0165
0.970.0085
2.6 a
1.4 a
0.170.01G5
0.110.005 a
0.0080.64
0.0025 a
0.0335
UU
UUUUUUU
UJUuu
uuuJuu
MW-1312/12/2001
(mg/L)
0.36 a
0.005 a
0.005 a
0.087 a
0.0050.005 a
0.0050.0050.0050.00260.027
0.0015 a
0.0015 a
0.0050.0290.0280.0250.32
0.00280.065 a
0.19 a
0.0250.02
0.0970.005 a
0.0150.29
0.0025 a
0.0024
UU
UUUUUJ
UuuJ
J
u
u
uJ
a - Analytical result was brought forward from 1998 data, because no data were available from 2002 analyses for this well.J - Estimated value.U - Noted value is one-half the reported detection limit for calculation of Exposure Point Concentrations (see Table 3-4).

Table B-8Surface Water Data for Exposure Unit 2 (EU-2) at the Aqua-Tech Site
AnalyteAcetoneAluminumArsenicBariumBenzeneBis(2-ethylhexyl)phthalateCadmiumCalciumChlorobenzeneChloroformChromiumCobaltCopperDi-n-butylphthalateDichlorobenzene, 1,4-Dichloroethane, 1,1-Dichloroethene (total), 1,2-DieldrinDiethylphthalateIronLeadMagnesiumManganeseMercuryNickelNitrophenol, 2-PhenolPotassiumSodiumTetrachloroetheneThalliumTolueneTrichloroethane, 1,1,1-TrichloroetheneVanadiumVinyl ChlorideZinc
Location/Sample Date
SW016/17/92
0.010.420.003
0.050.01 -0.010.005
3.620.010.010.010.050.020.010.010.010.002
0.000110.010.5790.003
1.470.05850.0002
0.040.010.012.9320.40.01NR
0.00060.01
0.0010.050.010.02
U
UUUUUBUUUUUUUUJUU
B
UUUUB
U
BJUJUUU
SW019/8/92
0.010.7930.0020.0319
0.010.0010.003
3.620.010.010.0050.0060.0070.001
0.010.010.01
0.0000370.01
0.5810.007
1.280.04960.0002
0.010.010.012.9713.50.01NR
0.010.010.010.005
0.010.0081
SW0112/8/92
U
UBUBJUBUUUUUBJUUUJPU*
B
UUUUB
U
UUUUUB
0.010.4830.002
0.03240.010.0020.003
3.820.010.01
0.0040.0040.0090.001
0.010.010.002NA0.010.358
0.00851.43
0.06460.00020.0090.010.012.6217.70.01NR
0.010.010.010.004
0.010.0453
U
UWBUBJUBUUUUUJUUJU
UN*B
UUUUB
U
UUUUU
SW014/6/93
0.01 U0.4630.002 U0.034 B
0.01 U0.01 U
0.002 U3.74 B0.01 U0.01 U
0.0064 B0.004 U0.004 U
0.01 U0.01 U0.01 U
0.001 JNA0.01 U
0.5140.0045
1.4 B0.05840.0002 U0.007 U0.01 U0.01 U1.96 B10.50.01 UNR
0.01 U0.01 U0.01 U0.003 U
0.01 U0.0133 B
a
SW016/23/93
0.0030.3790.0030.050.010.0110.005
3.160.01
0.00070.010.050.02
0.0110.011
0.010.002
0.000110.0020.6470.003
1.420.05790.0002
0.040.0110.011
2.3516.9
0.0009NR
0.010.01
0.0010.050.01
0.0202
BJ
UUUUUBUJUUUUUUJUBJ
UB
UUUUB
J
UUJUU*
SW019/29/93
0.0030.1570.003
0.050.010.01
0.0053.650.01
0.0010.010.050.020.010.01
0.00070.0040.0001
0.010.296
0.00391.4
0.05180.0002
0.040.010.013.0338.90.002NR
0.010.00070.002
0.050.010.02
BJBUUUUUBUJUUUUUJJUU
B
UUUUB
J
UJJUUU
SWU112/20/93
0.0030.1560.003
0.050.010.01
0.0053.520.01
0.0010.010.050.020.010.01
0.00050.0030.00010.0020.322
0.00531.37
0.07190.0002
0.040.010.012.6619.1
0.001NR
0.010.0004
0.0010.050.01
0.0233
BJBUUUUUBUJUUUUUJJUJ
B
UUUUB
J
UJJUU*
bW-16/8/98
NR0.4910.0075 U0.03050.01 UNR3.47
0.0018NRNR
0.0009 U0.0045 U
NRNRNR
0.01 U0.002 JNRNR
0.876NR1.38
0.062 JNR
0.0023 UNRNR1.813.73 J
0.001 JNRNRNR
0.0007 J0.0011
0.01 U0.0095 U
Footnotes are presented on the Jast page!.
Page 1 of 4
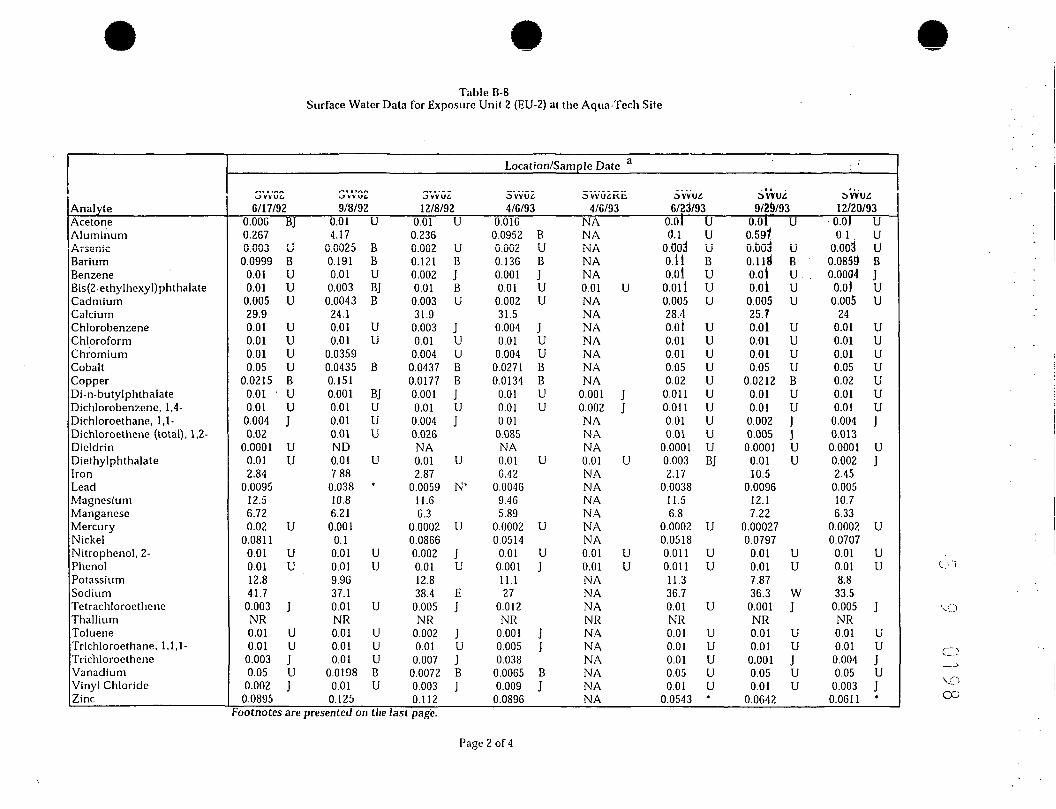
Table B-8Surface Water Data for Exposure Unit 2 (EU-2) at the Aqua-Tech Site
AnalyteAcetoneAluminumArsenicBariumBenzeneBis(2-ethylhexyl)phthalateCadmiumCalciumChlorobenzeneChloroformChromiumCobaltCopperDi-n-butylphthalateDichlorobenzene, 1,4-Dichloroethane, 1,1-Dichloroethene (total), 1,2-DieldrinDiethylphthalateIronLeadMagnesiumManganeseMercuryNickelNitrophenol, 2-PhenolPotassiumSodiumTetrachloroetheneThalliumTolueneTrichloroethane, 1,1,1-TrichloroetheneVanadiumVinyl ChlorideZinc
Location/Sample Date a : '
0 VVUC.
G/17/920.006 BJ0.2670.003 U0.0999 B
0.01 U0.01 U
0.005 U29.90.01 U0.01 U0.01 U0.05 U
0.0215 B0.01 U0.01 U
0.004 J0.02
0.0001 U0.01 U2.84
0.009512.56.720.02 U
0.08110.01 U0.01 U12.841.7
0.003 JNR0.01 U0.01 U0.003 J0.05 U
0.002 J0.0895
O VV \JC
9/8/920.014.17
0.00250.1910.010.003
0.004324.10.010.01
0.03590.04350.1510.0010.010.010.01ND0.017.88
0.03810.86.21
0.0010.10.010.019.9637.10.01NR0.010.010.01
0.01980.01
0.125
3VVGZ12/8/92
U
D
BUBJB
UU
B
BJUUU
U
*
Uu
uuuuBU
0.010.2360.0020.1210.0020.010.00331.9
0.0030.010.004
0.04370.01770.0010.01
0.0040.026NA0.012.87
0.005911.66.3
0.00020.08660.0020.0112.838.4
0.005NR
0.0020.01
0.0070.00720.0030.112
U
UBJBU
JUuBBJUJ
U
N*
U
JU
EJ
JUJBJ
SvvuZ4/6/93
0.0160.0952 B0.002 U0.136 B0.001 J0.01 U
0.002 U31.5
0.004 J0.01 U0.004 U
0.0271 B0.0134 B
0.01 U0.01 U0.010.085NA0.01 U6.42
0.00469.465.89
0.0002 U0.0514
0.01 U0.001 J
11.127
0.012NR
0.001 J0.005 J0.038
0.0065 B0.009 J
0.0896
OVVUiKE.
4/6/93NANANANANA0.01 UNANANANANANANA
0.001 J0.002 JNANANA0.01 UNANANANANANA0.01 U0.01 UNANANANRNANANANANANA
6/23/93o.ol u0.1 U
O.OOJ u0.11 Bo.ol u
O.Oll U0.005 U28.-Io.oi u0.01 U0.01 U0.05 U0.02 U
0.011 U0.011 U0.01 U0.01 U
0.0001 U0.003 BJ2.17
0.003811.56.8
0.0002 U0.05180.011 U0.011 U11.336.70.01 UNR0.01 U0.01 U0.01 U0.05 U0.01 U
0.0543 *
9/29/930.0 f0.591O.uOd0.118"o.oio.ol
0.00525.7o.ol0.010.010.05
0.02120.010.010.0020.0050.0001
0.0110.5
0.009612.17.22
0.000270.0797
0.010.017.8736.3
0.001NR0.010.01
0.0010.050.01
0.0642
U
UBU .UuuuuuBUuJJuu
uuwJuuJuu
12/20/93o.ol u0.1 . U
0.003 U0.0859 B0.0004 J
o.oi u0.005 U
240.01 U0.01 U0.01 U0.05 U0.02 U0.01 U0.01 U
0.004 J0.0130.0001 U0.002 J2.45
0.00510.76.33
0.0002 U0.0707
0.01 U0.01 U8.833.5
0.005 JNR0.01 U0.01 U0.004 J0.05 U
0.003 J0.0611 * CO
Footnotes are presented on the last page.
Page 2 of 4

Table B-8Surface Water Data for Exposure Unit 2 (EU-2) at the Aqua-Tech Site
AnalyteAcetoneAluminumArsenicBariumBenzeneBis(2-ethylhexyl) phthalateCadmiumCalciumChlorobenzeneChloroformChromiumCobaltCopperDi-n-butylphthalateDichlorobenzene, 1,4-Dichloroethane, 1,1-Dichloroethene (total), 1,2-DieldrinDiethylphthalateIronLeadMagnesiumManganeseMercuryNickelNitrophenol, 2-PhenolPotassiumSodiumTetrachloroetheneThalliumTolueneTrichloroethane, 1,1,1-TrichloroetheneVanadiumVinyl ChlorideZinc
Location/Sample Date a
J>W-i;6/8/98
0.14 J0.01 U0.19
0.00079 JNRNR31NRNR
0.003 U0.0320.01 UNRNR
0.00550.028NRNR2.2NR9.45.7 JNR
0.038NRNR8.125
0.00790.01 UNRNR
0.00870.005 U0.00470.036
SW-46/8/98
0.640.010.0320.001NRNR3.7NRNR
0.0030.0030.01NRNR
0.0010.002NRNR0.61NR1.4
0.047NR
0.005NRNR1.93.9
0.0010.01NRNR
0.0010.0050.0020.02
U
U
UUU
UU
U
UU
UUUU
sw-s6/8/98
0.3580.0075 U0.0283
0.01 UNRNR3.45NRNR
0.00120.0009 U0.0089 U
NRNR0.01 U
0.0007 JNRNR
0.597NR1.31
0.0483 JNR
0.0023 UNRNR1.713.56 J0.01 U8.5 UNRNR
0.0005 J0.005 U0.01 U
0.0089 U
SW-t)6/8/98
1.20.01 U
0.0350.001 UNRNR3.8NRNR
0.003 U0.003 U0.01 UNRNR
0.001 U0.0017 J
NRNR0.86NR1.5
0.063NR
0.005 UNRNR2.1
40.00041 J
0.01 UNRNR
0.00051 J0.005 U0.002 U0.02 U
(DU-03)SW-t)6/8/98
0.870.01 U
0.0340.001 UNRNR3.5NRNR
0.003 U0.003 U0.01 UNRNR
0.001 U0.0016 J
NRNR0.81NR1.4
0.062NR
0.005 UNRNR2.14
0.00044 J0.01 UNRNR
0.00053 J0.005 U0.002 U0.02 U
(Dup, SW-004)5W-UU17/8/99
0.1 U0.005 U0.088NRNRNR23.5NRNR0.01 U0.020.01 UNRNRNRNRNRNR1.58NR8.62.6
0.0002 U0.04NRNR6
23.9NR
0.005 UNRNRNR
0.005 UNR0.03
OW-UU47/8/99
10.0050.03NRNRNR3.5NRNR0.010.010.01NRNRNRNRNRNR1.1NR1.1
0.0530.0002
0.02NRNR
22.9NR
0.006NRNRNR
0.005NR0.02
U
UUU
UU
U
U
U
OW-UUD7/8/99
0.50.0050.027NRNRNR3.4NRNR0.010.010.01NRNRNRNRNRNR0.81NR1.1
0.0520.0002
0.02NRNR
23.2NR
0.005NRNRNR
0.005NR0.02
U
UUU
UU
U
U
U vOVDFootnotes are presented on the last page.
Page 3 of 4

Table B-8Surface Water Data for Exposure Unit 2 (EU-2) at the Aqua-Tech Site
a - All concentrations are reported in mg/L.B - (inorganic) - Less than the required detection limit but greater than the Instrument Detection Limit.B - (organic) - Present in analytical method blank.E - Concentration exceeds instrument calibration range.I - Estimated concentration.
N - (inorganic) - Spiked sample recovery not within control limits.U - Less than the detection limit.W - Post-digestion spike for Furnance AA analysis is out of control (85-115%), while sample absorbance is less than 50% of
spike absorbance.X - Data has been manually entered into the report-generating software.* - Duplicated analysis not within control limits.P - Concentration difference between the two GC columns is greater than 25 percent.
NR - Not reported.NA - Not analyzed.
Page 4 of 4

Table B-9Landfill Gas Emissions at Exposure Unit 1 (EU-1) at the Aqua-Tech Site
Analyte
BenzeneBromomethaneCarbon dioxideCarbon tetrachlorideChlorobenzeneChloroethaneChloroformChloromethaneDibromoethane, 1,2-Dichloro-1 , 1 ,2,2-tetrafluoroethane, 1 ,2-Dichlorobenzene, 1,2-Dichlorobenzene, 1,2-Dichlorobenzene, 1,4-DichlorodifluoromethaneDichloroethane, 1,1-Dichloroethane, 1,2-Dichloroethene, cis-1,2-Dichloroethene, 1,1-Dichloropropane, 1,2-Dichloropropene, cis-1,3-Dichloropropene, trans-1,3-EthylbenzeneHexachlorobutadieneHydrogen sulfideMethaneMethylene chlorideOxygenStyreneTetrachloroethane, 1,1,2,2-TctrachlorooetheneTolueneTrichloro- 1 ,2,2-trifluoroethane, 1,1,2-Trichlorobenzene, 1,2,4-Trichloroethane, 1,1,1-Trichloroethane, 1,1,2-TrichloroetheneTrichlorofluoromethaneTrimcthylbenzene, 1,2,4-Trimcthylbcnzene, 1,3,5-Vinyl chlorideXylene, m,p-Xylene, o-
Units
ppmvppmv
%ppmvppmvppmvppmvppmvppmvppmvppmvppmvppmvppmvppmvppmvppmvppmvppmvppmvppmvppmvppmvppmv
%ppmv
%ppmvppmvppmvppmvppmvppmvppmvppmvppmvppmvppmvppmvppmvppmvppmv
Location/Sample DateLG-OI LG-02 LG-03 LG-04 LG-05 LG-06 LG-076/3/98 6/2/98 6/2/98 6/2/98 6/3/98 6/3/98 6/3/98
257.7015 7.4866 1.1846 0.095 U 0.019 U 0.001 U 00095 U0.095 U 0.095 U 0.001 U 0.095 U 0.019 U 0.001 U 0.0095 U
iy.8 'l-'l 0.1 U 0.1 U 7.5 17.1 0.1 U0.095 U 0.095 U 0.001 U 0.4358 0.019 U 0.001 U 0.0095 U
0.9421 0.4652 0.0011 0.095 U 0.0681 0.001 U 0.0095 U0.1838 16.4313 0.0455 0.2401 0.1885 0.0006 0.0056
0.095 U 0.095 U 0.001 U 0.0478 0.019 u 0.001 U 0.0095 U0.5978 0.1188 0.001 U 0.0769 0.0105 0.001 0.0095 U0.095 U 0.095 U 0.001 U 0.095 U 0.019 U 0.001 U 0.0095 U1.914 0.5199 0.0017 0.095 U 0.0182 0.001 U 0.0095 U0.095 U 0.095 U 0.0026 0.095 U 0.0121 0.001 U 0.0095 U
2.0703 0.1122 0.001 U 0.095 U 0.0103 0.0029 0.0095 U2.17 0.1176 0.0009 0.095 U 0.0156 0.003 0.0095 U
15.5073 0.0996 0.0012 0.0851 0.0238 0.0149 0.0135 U34.4528 4.6827 0.0026 0.095 U 0.0133 0.001 U 0.0095 U
0.095 U 0.095 U 0.001 U 0.2858 0.019 U 0.001 U 0.009530.3692 0.2205 0.0027 0.095 U 0.019 U 0.001 U 0.0095 U
0.5953 0.095 U 0.001 U 4.9393 0.019 U 0.001 U 0.0095 U0.095 U 0.0857 0.001 U 0.095 U 0.019 U 0.001 U 0.0095 U0.095 U 0.095 U 0.001 U 0.095 U 0.019 U 0.001 U 0.0095 U0.095 U 0.0965 0.001 U 0.095 U 0.019 U 0.001 U 0.0095 U
5.2947 17.6742 0.0256 0.095 U 0.019 U 0.0008 0.0095 U0.095 U 0.095 U 0.001 U 0.095 U 0.019 U 0.001 U 00095 U
1.9 2.1 1 U 1 U 12.5 1 U 1 U51.1 52.7 0.1 U 0.1 U 49.3 0.1 U 0.1 U
33.2596 0.7831 0.0019 0.0601 0.019 U 0.0008 0.0095 U0-3 0.4 19.4 20.2 0.3 3.1 19.9
0.0708 0.2067 0.0005 0.095 U 0.019 U 0.001 U 00095 U0.095 U 0.095 U 0.001 U 0.095 U 0.0224 0.001 U 00095 U
3.3658 0.1842 0.001 U 3.3961 0.019 U 0.0108 0.005486.7623 4.5529 0.0169 0.395 0.0607 0.004 0.0198
8.9935 0.0479 0.001 U 6.0292 0.019 U 0.001 U 0.0095 U0.095 U 0.095 U 0.001 U 0.095 U 0.019 U 0.001 U 0.0095 U0.095 U 0.3113 0.001 U 3.5953 0.019 U 0.0006 0.0095 U
0.1001 0.095 U 0.001 U 0.095 U 0.019 U 0.0006 0.0095 U3.0664 0.095 U 0.001 U 3.0408 0.019 U 0.001 U 0.0095 U
0.095 U 0.095 U 0.001 U 1.1639 0.019 U 0.0012 0.0095 U2.361 1.334 0.0047 0.095 U 0.0106 0.001 U 0.0095 U
1.7383 0.60G8 0.0018 0.095 U 0.019 U 0.001 U 0.0095 U298.5382 66.3878 0.0332 0.3417 0.0278 0.001 U 0.0095 U
4.9537 5.6117 0.0088 0.095 U 0.0143 0.001 U 0.0095 U3.4837 3.8077 0.0053 0.095 U 0.0104 0.001 U 00095 U
ppmv - Parts per million per volume.U - Compound not detected at or above level specified.
Source: CRA, 1999a.
K)o

Table B-10Landfill Gas (LFG) Parameter Concentrations and Maximum Exposure Point Concentrations
Aqua-Tech Site
AnalyteUC1I/~CI1C
BromomethancCarbon tetrachlorideChlorobenzeneChloroethaneChloroformChloromethaneDibromomethane, 1,2-Dichloro-l,l,2,2-tctrafluoroethane, 1,2-Dichlorobenzene, 1,2-Dichlorobcnzene, 1,3-Dlchlorobenzene, 1,4-DichlorodinuoromethaneDichloroethane, 1,1-Dichloroethanc, 1,2-Dichloroethcne, 1,1-Dichloroethene, cls-1,2-Dichloropropane, 1,2-Dichloropropcne, cis-1,3-Dichloropropcne, trans-1,3-EthylbenzeneHexachlorobutadieneMethylene chlorideStyrcneTetrachlorocthane, 1,1,2,2-TetrachloroetheneTolueneTrichlorobenzene, 1,2,4-Trichloroethane, 1,1,1-Trichlorocthane, 1,1,2-TrlchloroetheneTrichlorofluoromcthaneTrifluorocthane, l,l,2-trichloro-l,2,2-Trimelhylbcnzenc, 1,2,4-Trimethylbcnzenc, 1,3,5-Vinyl chlorideXylene, m,p-Xylene, o-
ArithmeticMean
Concentration(ppmv)
in f\i 1 rt
0.0451 (2)0.09380.22602.44220.03830.11650.0451 (2)0.36560.04430.32870.34452.24935.60810.07230.80864.38810.04370.0451 (2)0.04533.30270.0451 (2)4.87630.05750.04560.997513.11590.0451 (2)0.57600.04570.89040.19782.15730.54510.353159.19131.52771.0589
ParameterMolecular
Weight
TO 1
95.0153.8112.6
64.5119.4
50.5187.9170.9147.0147.0147.0120.9
99.099.096.796.9
113.0111.0111.0106.2260.8
85.0104.2168.0165.8
92.4181.5133.4133.4131.4137.4187.4120.2120.2
62.5106.0106.2
AverageDetected
Concentration(mg/m3)
0.1784 (2)0.60111.06036.56440.19050.24510.3531 (2)2.60370.27132.01332.110111.332723.12410.29823.257017.72430.20570.20860.209514.61440.4901 (2)17.27020.24960.31926.892350.49620.3411 (2)3.20160.25404.87491.132216.84312.73001.7684
135.91486.74734.6856
AverageParameter
Emission Rate(s/s) (1)
i o A r? n ')
1.94E-066.52E-061.15E-057.13E-052.07E-062.66E-063.83E-062.83E-052.95E-062.19E-052.29E-051.23E-042.51E-043.24E-063.54E-051.92E-042.23E-06Z.26E-062.27E-061.59E-045.32E-061.87E-042.71 E-063.46E-067.48E-055.48E-043.70E-063.48E-052.76E-065.29E-051.23E-051.83E-042.90E-051.92E-051.48E-037.32E-055.09E-05
Maximum 1-HourExposure PointConcentration
(ug/m3) (3)i 7 n A n
0.00260.00870.01540.09510.00280.00350.00510.03770.00390.02920.03060.16410.33480.00430.04720.25670.00300.00300.00300.21160.00710.25010.00360.00460.09980.73120.00490.04640.00370.07060.01640.24390.03950.02561.96810.09770.0678
Maximum 8-HourExposure PointConcentration
(ug/m3)1 1CCO
0.00180.00610.01070.06650.00190.00250.00360.02640.00280.02040.02140.11490.23440.00300.03300.17970.00210.00210.00210.14810.00500.17510.00250.00320.06990.51180.00350.03250.00260.04940.01150.17070.02770.01791.37770.06840.0475
Maximum 24-HouiExposure P'otrltConcentration
.(Im/m3) „n h t 'JK
6.00106,00350,0061
b.380(hOOll0.00140.00200.01510.00160.01170.01220.06560.13390.00170.01890.10270.00120.00120.00120.08460.00280.10000.00140.00180.03990.29250.00200.01850.00150.02820.00660.09760.01580.01020.78720.03910.0271
MSXimum AnnualExposure PointConcentration'_. (ug/m3)
0.0002. 0.0007
0.00120.00760.00020.00030.00040.00300.00030.00230.00240.01310.02680.00030.00380.02050.00020.00020.00020.01690.00060.02000.00030.00040.00800.05850.00040.00370.00030.00560.00130.01950.00320.00200.15740.00780.0054
(1) Based on estimated average LFG How rale (cfm) from 2001 to 2030 of 23.(2) No detections of this compound. Arithmetic mean and maximum concentrations based on detection limits.(3) Based on SCREENS unit distribution factor (ug'g/s-m3) of 1334.
Source: CRA, 1999b. • • rOCZ:ro
APPENDIX C
RAGS ]3ART D TABLES (obtained from the BRA - Dated August 2002)

Table 1 Series
Table 2 Series
Table 3 Series
Table 4 Series
Table 5 Series
Table 6 Series
Ta ble 7 Series
Table 8 Series
T? ble 9 Series
Appendix CRAGS Part D Tables
Selection of Exposure Pathways
Occurrence, Distribution, and Selection ofChemicals of Potential Concern
Medium-Specific Exposure Point ConcentrationSummary
Values Used for Daily Intake Calculations
Non-Cancer Toxicity Data
Cancer Toxicity Data
Calculation of Non-Cancer Hazards andCalculation of Cancer Risks
Summary of Receptor Risks and Hazards forCOPCs
Risk Assessment Summary

0 2 0 5
Table 1 Series
Selection of Exposure Pathways

TABLE 1.1SELECTION OF EXPOSURE PATHWAYS FOR SURFACE SOIL
AQUA-TECHSITE
ScenarioTimeframe
Current
Future
Medium
Surface Sol J
Surface Soli
ExposureMedium
Surface Soil
Air
Surface Soil
Air
ExposurePoint
Any Exposure Unit I orExposure Unit 1 location
Any Exposure Unit 1 orExposure Unit 2 location
Any Exposure Unit I orExposure Unit 2 location
Any Exposure Unit 1 orExposure Unit 2 location
ReceptorPopulation
Commercial Worker
Trespasser/Visitor
Resident
Commercial Worker
Construction Worker
Trespasser/ Visitor
Resident
Commercial Worker
Construction Worker
Trespasser/Visitor
Resident
Commercial Worker
Construction Worker-
Trespasser /Visit or
Resident
ReceptorAge
Adult
Adolescent
Child /Adult/Aggregate
Adult
Adult
Adolescent
Child/Adult/Aggregate
Adult
Adult
Adolescent
Child/Adult/Aggregate
Adult
Adult
Adolescent
Child/Adult/Aggregate
ExposureRoute
Combined (Ingest Ion/Dermal)
Combined (Ingest ion/Dermal)
Combined (ingest ion/Dermai)
Inhalation
Inhalation
Inhalation
Inhalation
Combined (Ingestion/Dcrmai)
Combined (Ingest ion/Dermal)
Combined (Ingest lun/Dermat)
Combined (Ingest Ion/Dermal)
Inhalation
Inhalation
Inhalation
Inhalation
Exposure Unit I/Exposure Unit 2
Exposure Unit I/Exposure Unit 2
Fvnnciiro Unit I/
Exposure Unit 2
Exposure Unit I/Exposure Unit 2
Exposure Unit !/Exposure Unit 2
Exposure Unit I/Exposure Unit 2
Exposure Unit I/Exposure Unit 2
Exposure Unit I/Exposure Unit 2
Exposure Unit ]/Exposure Unit 2
Exposure Unit )/Exposure Unit 2
Exposure Unit I/Exposure Unit 2
Exposure Unit I/Exposure Unit 2
Exposure Unit I/Exposure Unit 2
Exposure Unit !/Exposure Unit 2
Exposure Unit I/Exposure Unit 2
Exposure Unit I/Exposure Unit 2
Exposure Unit I/Exposure Unit 2
Type ofAnalysis
None
Quant
None
None
None
Quant
None
Quant
Quant
Qual
Quant
Quant
Quant
Qual
Quant
Rationale for Selection or Exclusionof Exposure Pathway
•Jo current commercial actlvltes In Exposure Unit I orExposure Unit 2.
Anecdotal evidence suggests that adolescent trespassernay visit the Site.
*Jo residential exposures currently In Exposure Unit 1 orexposure Unit 2, site Is zoned commercial/Industrial.
•Jo current commercial activites in Exposure Unit 1 orexposure Unit 2.
^o current construction actlvltes.
Anecdotal evidence suggests that adolescent trespassermay visit the Site.
Mo residential exposures currently In Exposure Unit I orexposure Unit 2. site Is zoned commercial/industrial.
^otential exists for future commercial acllvltes In ExposureUnit 1 or Exposure Unit 2.
Potential exists for short-term construction acllvltcs,presumptive remedy.
Exposure assumed to be same as current, presumptiveremedy.
U.S. EPA Region 4 requirement a.
Potential exists for future commercial activites in ExposureUnit 1 or Exposure Unit 2.
Potential exists for short-term construction activites,presumptive remedy.
Exposure assumed to be same as current, presumptiveremedy.
U.S. EPA Region 4 requirement a.
U.S. EPA Region 4 requires that residential development be considered during the Baseline Risk Assessment,property for residential use.
However, the Site is located within the "Airport Environs Area" and the zoning ordinance precludes future development of the Aqua-Tech C.n
CDON

TABLE 1.ZSELECTION OF EXPOSURE PATHWAYS FOR SUBSURFACE SOIL
AQUA-TECH SITE
ScenarioTlnieCrame
Current
Future
Medium
iuDsurtace son
Subsurface Soil
ExposureMedium
duosuriace DOU
Air
Subsurface Soil
Air
ExposurePoint
Any Exposure Unit 1 orexposure Unu c. iocauoii
(e.g.. utility trench)
Any Exposure Unit 1 orExposure Unit 2 location
(e.g.. utility trench)
Any Exposure Unit 1 orExposure Unit 2 location
(e.g.. utility trench)
Any Exposure Unit 1 orExposure Unit 2 location
(e.g.. utility trench)
ReceptorPopulation
Co,,,..,,,i;u..v;u.k.,
Construction Worker
Construction Worker
Construction Worker
ReceptorAge
,\J..::
Adult
Adult
Adult
ExposureRoute
Cc-:::- ;-:——:/——::-
Inhalation
Combined (Ingestion/Dcrma!)
Inhalation
Exposure Unit I/Exposure Unit 2
Exposure Unit I/Exposure Unit 'L
Exposure Unit 1 /Exposure Unit 2
Exposure Unit I/Exposure Unit 2
Exposure Unit I/Exposure Unit 2
Type ofAnalysis
Mrt,,o
None
Quant
Quant
Rationale for Selection or Exclusionof Exposure Pathway
Me curr—™-—'*"" -'>•'>'-<
No current construction activites.
Potential exists for short-term construction activites.presumptive remedy.
Potential exists for short-term construction activites,presumptive remedy.
f.n

TABLE 1.3SELECTION OF EXPOSURE PATHWAYS FOR SEDIMENTS
AQUA-TECH SITE
1 ScenarioTimeframe
Future
Medium
C A-
Sediment
ExposureMedium
.... .-.1
Air
Sediment
Air
ExposurePoint
Any Exposure Unit 2location
Any Exposure Unit 2location
Any Exposure Unit 2location
Any Exposure Unit 2location
ReceptorPopulation
r!nmmf»rriaj Wnrknr
Construction Worker
Trespasser/Visitor
Resident
Commercial Worker
Construction Worker
Trespasser/ Visi tor
Resident
Commercial Worker
Construction Worker
Trespasser/Visitor
Resident
Commercial Worker
Construction Worker
Trespasser/Visitor
Resident
ReceptorAge
Arlull
Adult
Adolescent
Child/Adult/Aggregate
Adult
Adult
Adolescent
Child/Adult/Aggregate
Adult
Adult
Adolescent
Child/Adult/Aggregate
Adult
Adult
Adolescent
Child/Adult/Aggregate
ExposureRoute
Combined (Ineeslion/Dermal)
Combined (Ingeslion/Dcrmai)
Combined (Ingeslion/Dcrmai)
Combined (Ingeslion/Dcrmai)
Inhalation
Inhalation
Inhalation
Inhalation
Combined (Ingcstion/Dcrmal)
Combined (Ingcstion/Dermal)
Combined (Ingcstion/Dcrmal)
Combined (Ingestion/Dermal)
Inhalation
Inhalation
Inhalation
Inhalation
Exposure Unit I/Exposure Unit 2
Exposure Unil 2
Exposure Unit 2
Exposure Unit 2
Exposure Unit 2
Exposure Unit 2
Exposure Unit 2
Exposure Unit 2
Exposure Unit 2
Exposure Unit 2
Exposure Unit 2
Exposure Unit 2
Exposure Unit 2
Exposure Unit 2
Exposure Unit 2
Exposure Unit 2
Exposure Unit 2
Type ofAnalysis
None
None
Quani
None
None
None
Quant
None
None
Quant
Qual
None
None
Quant
Qual
None
Rationale for Selection or Exclusionof Exposure Pathway
Typical commercial exposure not expected in areas.„....„ — ......... ....r —— .
vlo current construction activites.
Access restrictions are not in olace in all areas of ExposureUnit 2.
<o current residential exposures; trespasser/visitor isntended to be protective of nearby residents.
Typical commercial exposure not expected in areaslaving sediment impacts.
No current construction activites.
Access restrictions are not in place In all areas.of ExposureUnit 2.
Mo current residential exposures; trespasser /visitor isintended to be protective of nearby residents.
Typical commercial exposure not expected in areaslaving sediment impacts.
Potential exists for short-term construction activites.
Exposure assumed to be same as current.
No residential exposures are expected; trespasser/visitoris intended to be protective of nearby residents.
Typical commercial exposure not expected in areashaving sediment impacts.
Potential exists for short-term construction activites.
Exposure assumed to be same as current.
No residential exposures are expected; trespasser/visitoris intended to be protective of nearby residents.
VO
CO
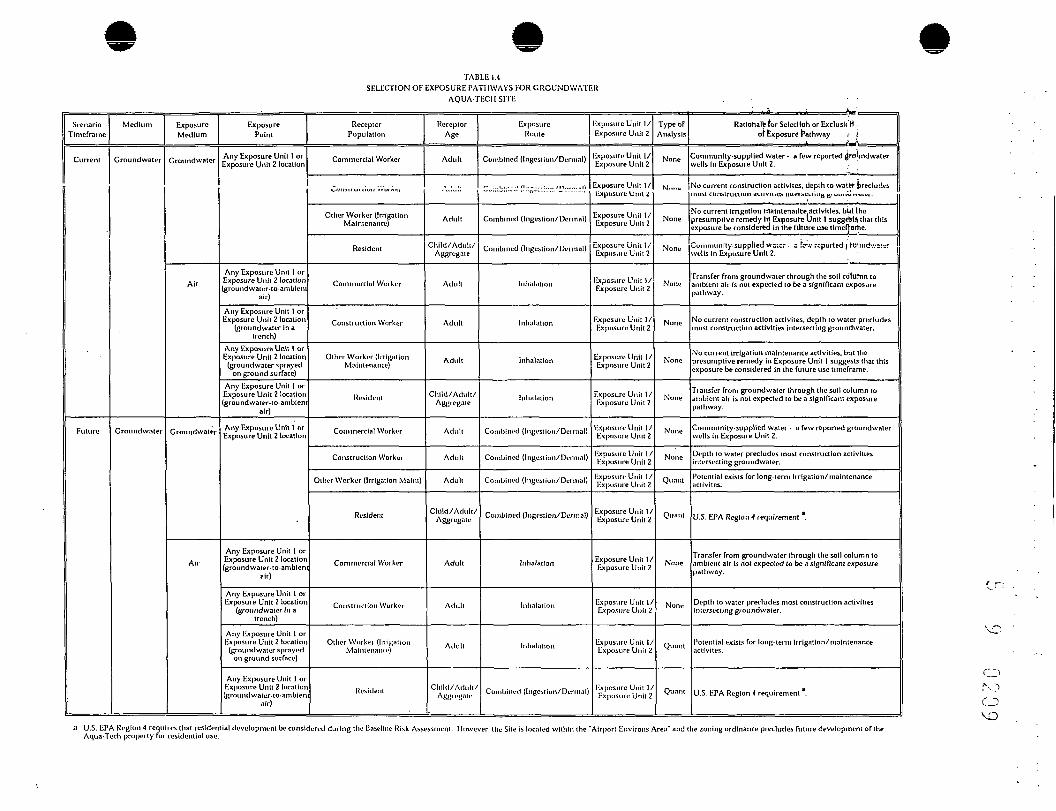
TABLE 1.4SELECTION OF EXPOSURE PATHWAYS FOR CROUNDWATF.R
AQUA-TECMSITE
ScenarioTlmeframe
Current
Future
Medium
Croundwater
Groundwater
ExposureMedium
Croundwater
Air
Ground water
Air
ExposurePoint
Any Exposure Unit 1 orexposure Unit 2 location
Any Exposure Unit 1 orExposure Unit 2 locationground watcr-to-ambient
air)
Any Exposure Unit 1 orExposure Unit 2 location
(groundwaierinatrench)
Any Exposure Unit 1 orExposure Unit 2 location(groundwater sprayed
on ground surface)
Any Exposure Unit t orExposure Unit 2 locationgroundwater-to-ambient
air)
Any Exposure Unit I orExposure Unit 2 location
Any Exposure Unit 1 orExposure Unit 2 location^ground water-to-ambien
air)
Any Exposure Unit 1 orExposure Unit 2 location
(ground water in atrench)
Any Exposure Unit 1 orExposure Unit 2 locatlor(ground water sprayed
on ground surface)
Any Exposure Unit 1 orExposure Unit 2 localioi(ground water-to-ambien
air)
ReceptorPopulation
Commercial Worker
. . . . .
Other Worker (IrrigationMaintenance)
Resident
Commercial Worker
Construction Worker
Other Worker (IrrigationMaintenance)
Resident
Commercial Worker
Construction Worker
Other Worker (Irrigation Malm)
Reside!!!
Commercial Worker
Construction Worker
Other Worker (IrrigationMaintenance)
Resident
ReceptorAge
Adult
Adult
Child/Adult/Aggregate
Aduft
Adult
Adult
Child/Adult/Aggregate
Adult
Adult
Adult
Child/Adult/Aggregate
Adult
Adult
Adull
Child/Adult/A ggregn it-
ExposureRoute
Combined (Ingest ion/Dermal)
„ , , , , , / n n
Combined (Ingeslion/Dennal)
Combined (Ingest ion/Dermal)
Inhalation
Inhalation
Inhalation
Inhalation
Combined (Ingest ion/Dermal)
Combined (Ingestion/ Dermal)
Combined (IngeMiuM/Dermal)
Combined (Ingrstion/ Dermal)
Inhalation
Inhalation
Inhalation
Combined (Ingestiun/Durmal)
ixposure Unit I/Exposure Unit 2
ixposure Unit I/Exposure Unit 2
exposure Unit I/Exposure Unit 2
Ixposure Unit I/Exposure Unit 2
Exposure unii i/Exposure Unit 2
Exposure Unit J/Exposure Unit 2
Exposure Unit I/Exposure Unit 2
Exposure Unit I/Exposure Unit 2
Exposure Unit I/Exposure Unit 2
Exposure Unit I/Exposure Unit 2
Exposure Unit I/Exposure Unit 2
Exposure Unit I/Exposure Unit 2
Exposure Unit I/Exposure Unit 2
Exposure Unit I/Exposure Unit 2
Exposure Unit /Exposure Unit 2
Exposure Unit /Exposure Unit 2
Exposure Unit I/Exposure Unit Z
Type ofAnalysis
None
N1..MO
None
None
None
None
None
None
None
None
Quant
Quant
None
None
Quant
Quant
: a ^ V .
Rational^ for Selection or ExclusU'H .of Exposure Pathway •- i
Community-supplied water - a few reported (jrayndwaierwells in Exposure Unit 2.
No current construction actlvites. depth to water precludesmost construction acu vino imvi:>ciuiig giuui>u>*Uiv, .
•Jo cut rent irrigation hialnlenailce activities, but theresumptive remedy Irt Exposure Unit 1 sugge'st that thisxposure be considered in the filture use thnefVarhe.
Community-supplied water • s !cvv reported j rO'jrid'.vaiarveils in Exposure Unit 2.
'ransfer from groundwater through the soil column toambient air is not expected to be a significant exposure>athway.
>Jo current construction activites, depth to water precludesnost construction activities intersecting ground water.
"Jo current irrigation maintenance activities, but theiresumptive remedy In Exposure Unit 1 suggests that thisexposure be considered in the future use timcframe.
Transfer from groundwater through the soil column toambient air is not expected to be a significant exposurepathway.
Community-supplied water - a few reported groundwaterwells in Exposure Unit 2.
Depth to water precludes most construction activitiesintersecting groundwater.
Potential exists for long-term irrigation/maintenanceactivites.
L/.S. EPA Region 4 requirement .
Transfer from groundwater through the soil column toambient air is not expected to be a significant exposurepathway.
Depth to water precludes most construction activitiesintersecting groundwaler.
Potential exists for long-term irrigation/maintenanceactivites.
U.S. EPA Region 4 requirement .
a U.S. EPA Region A requires that residential development be considered during the Baseline Rij>k Ass<Aqua-Tech property for residential use.
'ssment. However, the Site is located within the "Airport Environs Area" and the zoning ordinance precludes future development of the

TABLE 1.5SELECTION OF EXPOSURE PATHWAYS FOR SURFACE WATER
AQUA-TECH SITE
ScenarioTimeframe
/^, .„..„„,
Future
Medium
SurfaceWater
SurfaceWater
ExposureMedium
SurfaceWater
Air
-
SurfaceWater
-
Air
ExposurePoint
Any Exposure Unit 2location
Any Exposure Unit 2location
Any Exposure Unit 2location
Any Exposure Unit 2location
ReceptorPopulation
Commercial Worker
Construction Worker
Trespasser/ Visi tor
Resident
Commercial Worker
Construction Worker
Trespasser/Visitor
Resident
Commercial Worker
Construction Worker
Trespasser/ Visitor
Resident
Commercial Worker
Construction Worker
Trespasser/ Visitor
Resident
ReceptorAge
Adult
Adult
Adolescent
Child/Adult/Aggregate
Adult
Adult
Adolescent
Child/Adult/Aggregate
Adult
Adult
Adolescent
Child/Adult/Aggregate
Adult
Adult
Adolescent
Child/Adult /Aggregate
ExposureRoute
Combined (Ingestion/Dcrmal)
Combined (Ingcs!ion/DermaI)
Combined (Ingestion/Dcrmal)
Inhalation
Inhalation
Inhalation
Inhalation
Combined (Ingestion/Dcrmal)
Combined (Ingestion/Dcrmnl)
Combined (Ingeslion/Dcrmal)
Combined (Ingestion/Dermal)
Inhalation
Inhalation
Inhalation
Inhalation
Exposure Unit I/Exposure Unit 2
Exposure Unit 2
Exposure Unit 2
Exposure Unit 2
Exposure Unit 2
Exposure Unit 2
Exposure Unit 2
Exposure Unit 2
Exposure Unit 2
Exposure Unit 2
Exposure Unit 2
Exposure Unit 2
Exposure Unit 2
Exposure Unit 2
Exposure Unit 2
Exposure Unit 2
Type ofAnalysis
None
None
Quant
None
None
None
Quant
None
None
None
Qual
None
None
None
Qual
None
Rationale for Selection or Exclusionof Exposure Pathway
Typical commercial exposure not expected in areas havingf't-f^fn nn»nf tmr*acte
^Jo current construction activites.
Access restrictions are not in place in a!! areas of ExposureUnit 2.
Mo residential exposures currently in Exposure Unit 1 orexposure Unit 2. site Is zoned commercial/industrial.
Typical commercial exposure not expected in areas havingsurface water impacts.
Mo current construction activites.
Access restrictions are not in place in all areas of ExposureUnit 2.
Mo residential exposures currently in Exposure Unit 1 orExposure Unit 2, site is zoned commercial/industrial.
Typical commercial exposure not expected in areas havingsurface water impacts.
Assumed that construction activities in areas havingsurface water would involve diverting the surface wateraway from the construction site.
Exposure assumed to be same as current.
No residential exposures currently in Exposure Unit 1 orExposure Unit 2, site is zoned commercial/industrial.
Typical commercial exposure not expected In areas havingsurface water impacts.
Assumed that construction activities in areas havingsurface water would involve diverting the surface wateraway from the construction site.
Exposure assumed to be same as current.
No residential exposures currently in Exposure Unit I orExposure Unit 2. site is zoned commercial/industrial.
CD

TABLE 1.6SELECTION OF EXPOSURE PATHWAYS FOR LANDFILL GAS
AQUA-TECH SITE
ScenarioTime frame
Current
Future
Medium
Landfill Gas
Landfill Gas
ExposureMedium
Air
Air
ExposurePoint
Any Exposure Unit I orExposure Unit 2 location
Any Exposure Unit 1 orExposure Unit 2 location
ReceptorPopulation
Commercial Worker
Construction Worker
Trespasser/ Visitor
Resident
Other Worker (IrrigationMaintenance)
Commercial Worker
Construction Worker
Trespasser/ Visitor
Resident
Other Worker (IrrigationMaintenance)
ReceptorAge
Adult
Adult
Adolescent
Child/Adult/Aggregate
Adult
Adult
Adull
Adolescent
Child/Adult/Aggregate
Adult
ExposureRoute
Inhalation
Inhalation
Inhalation
Inhalation
Inhalation
Inhalation
Inhalation
Inhalation
Inhalation
Inhalation
Exposure Unit I/Exposure Unit 2
Exposure Unit I/Exposure Unit 2
Exposure Unit I/Exposure Unit 2
Exposure Unit I/Exposure Unit 2
Exposure Unit I/Exposure Unit 2
Exposure Unit I/Exposure Unit 2
Exposure Unit I/Exposure Unit 2
Exposure Unit I/Exposure Unit 2
Exposure Unit I/Exposure Unit 2
Exposure Unit I/Exposure Unit 2
Exposure Unit I/Exposure Unit 2
Type ofAnalysis
None
None
Quant
None
None
Quant
Quant
Qual
Quant
Quant
Rationale For Selection or Exclusionof Exposure Pathway
Mo current commercial actlvltes.
No current construction activites.
Anecdotal evidence suggests that adolescent trespassersmay visit the Site.
No residential exposures currently In Exposure Unit 1 orExposure Unit 2, site is zoned commercial/industrial.
No current irrigation activities.
Workers could potentially be in Exposure Unit 1 orExposure Unit 2 five days/week.
Potential exists for short-term construction activites,presumptive remedy.
Exposure assumed to be same as current, presumptiveremedy.
U.S. EPA Region 4 requirement .
Potential exists for long-term irrigation/maintenanceaclivites.
a U.S. EPA Region 4 requires that residential development be considered during the Baseline Risk Assessment. However, the Site Is located within the "Airport Environs Area" and the zoning ordinance precludesfuture development of the Aqua-Tech property for residential use.
CDro

r\ o •'• ou ± \ 2
Table 2 Series
Occurrence, Distribution, and Selection of Chemicals of Potential Concern

TABLE 2.laOCCURRENCE, DISTRIBUTION AND SELECTION OF SURFACE SOIL CHEMICALS OF POTENTIAL CONCERN. EXPOSURE UNIT 1
AQUA-TECH SITE
Scenario Tlmeframe:Medium:Exposure Medium;Exposure Point:___
Currenl/FutureSurface SoilSurface SoilExposure Unit 1
1
CASNumber
07-C-M309.00-27429-90-57440-36-053469-21-912672-29-G11097-69-17440-38-27440-39-3100-52-771-43-256-55-350-32-8205-99-2191-24-2207-08-97440-41-758-89-992-52-4117-81-778-93-38568-77440-43-97440-70-275-15-0NFNF108-90-7C7-66-374-87-37005-72-316065-83-121801-97440-48-47440-50-87490-8110-82-772-54-872-55-950-29-384-74-2117-84-075-34-3
Chemical
AcetoneAldrln ' 'AluminumAntimonyAroclor-1242Aroclor-1248Aroclor-1254Arseniclarlum
BenzaldehydeBenzeneienzo(a)anthracene
Benzo{a)pyrenelenzo(b)nuoramheneienzo(g.h.i)perylenelenzo(k)fluoranthene
BerylliumBHC. gamma- (lindane)Blphenyl. 1.1-Bls(2-ethylhexyl)phthalateButanone. 2-ButylbenzylphthalateCadmiumCalciumCarbon disulflde-hlordane, atpha-Chlordane, gamma-ChlorobenzeneChloroformChlorotnethaneChlorophenyl phenyl ether, 4-ChromiumChryseneCobaltCopperCyanideCyclohexaneDUD, 4.4'-DDE. 4.4'.DDT. 4.4'-Di-n-uutylphthalaleDl-n-octylphthalateDichlorocthane. l . l -
MinlmumConcentration
(mg/kg)
0.20.0018
8.1402.80.20.3
0.069O.G638.2
1.80.0008
0.0780.490.58
0.40.41
1.10.002
1.20.12
0.0020.19
. 1.523G
0.00040.00380.0024
0.0010.0007
0.021.6
10.50.092
12.86
0.250.28
0.00380.00610.0058
0.04G0.32
0.014
MinimumQualifier
j
BMWP
B. B
JJJJJ
"j
P]JJJ
BJP
JJ
JB
J
BBJPPPJJ
'•:MaximumConcentration(nig/kg)
3.90.055
84.90015.30.340.30
3565.6
3.3001.8
0.0010.370.73
1.10.400.41
2.70.14
1.212010.52.4
68.16.750
0.00040.00380.0057
0.0010.0020.27
1.6339
0.4347.298G74.70.280.470.12
1.48.G26
0.03
MaximumQualifier
NP
S
J)
. J
Jj
PJ
J
JP
JJ
J
NJP
J
Locationof Maximum
Concentration
509-(ir,ERC-01505-04501-04A A- 13
G01-02B-1501-06
PCL-SA501-03
G01-02B-1501-04509-04509-04509-04
G01-02B-1509-04501-03
ERC-01G01-02B 1501-09-S503 B-3501-06501-04601-02510-09AA-12AA-12601-02501 04
GOI-02B-6601-02 B-l
501-04509-04601-09501-OG501-04
601-02 B-l503
AA-05503
ERC-01501-04
G O I - 0 2 B - I
Detection•retjuency
2/683/68
G9/G911/052/G81/1
10/G946/6969/69
I / I2/75
• 2/082/692/69I / I1/68
21/694/63I / I
32/694/7510/6930/G969/091/G81/683/681/752/G82/8I / I
69/692/6951/6969/6915/69
1/15/0811/6819/C810/696/693/75
IRange ofDetection
Limits(iitR/M
0.003 - 0.0840.0018- 0.11
2.1 -2.80.035-2.1
0.035 - 0.920.63-1.6
0.005 - 0.260.34-9.00.34 - 9.60.34 - 9.6
0.34 - 9.60.50- 1.4
0.0018-0.11
0.28 • 1.40.001 - 10.34 - 9.61.1-1.4
0.01 -0.260.0018.0.11O.OOIS-0 .110.005 - 0.200.01 - 0.20
0.005 - 0.005
0.34 - 9.G10.6- 13.5
2.6 - 3.6
0.0035-0.210.0035-0.210.0035-0.21
0.057-7.30.3.1 - 9.0
0.005 - 0.057
ConcentrationUsed for
Screening
3.90.05584.900
15.30.340.335
65.63.300
1.80.0010.370.731.10.4
0.412.7
0.141.212010.52.4
68.16.750
0.00040.00380.00570.0010.0020.271.63390.4347.298074.70.280.470.12
1.48.620
003
121Background
Value(mg/kg)
N/AN/A
54.0000.575N/AN/AN/A
7.890
N/AN/AN/AN/AN/AN/AN/A0.97N/AN/AN/AN/AN/AN/A340
N/A. N/A
N/AN/AN/AN/AN/A
47N/A3325
N/AN/AN/AN/AN/AN/AN/AN/A
0,1Screening
Toxicily Value(nig/kg)
ICO NC0.029 C7.000 NC3.1 NC
0.22 C0.22 C0.22 C0.39 C510 NC610 NC0.05 C0.62 C
0.062 CO.G2 C
5.6 (5) NC6.2 C15 NC
0.44 C300 NC35 C730 NC
1.200 NC3.7 NCNF NF3G NC
2 (5) C2 (5) C
15 NC0.24 C
1 (5) C12 NC
23 (5) NC62 C
470 NC290 NC1.1 NC950 NC2.4 C1.7 C1.7 C
CIO NC120 NC59 NC
ARAR/TBCValue
(mg/kg]
ARAR/TBCSource
COPCFlag
NOYESYESYESYESYESYESYESYESNONOYESYESYESNOYESNONONOYESNONOYESNONONONONONONONOYESYESNOYESYESNONONONONONONO
(4) 1Rationale for
ContaminantDeletion
or SelectionBSLASLASLASLASLASLASLASLASLBSLBSL
"MCCASLASLBSL
MCCBSLBSLBSLASLBSLBSLASL .NUTBSLBSLBSLBSLBSLBSLBSLASLMCCBSLASLASLBSLBSLBSLBSLBSLBSLBSL
Page 1 of 3

TABLE Z.laOCCURRENCE. DISTRIBUTION AND SELECTION OF SURFACE SOIL CHEMICALS OF POTENTIAL CONCERN. EXPOSURE UNIT 1
AQUA-TECH SITE
Scenario Timeframe:Medium:Exposure Medium:Exposure Point:
Current/FutureSurface SoilSurface Soil 'Exposure Unit 1
CASNumber
107-06-2156-59-2156-60-5540-59-078-87-560-57-184-66-2131-11-3121-14-2NFNF1031-07-872-20-87421-93-4NF100-41-4206-44 076-44-81024 57-3591-78-67439-89-698-82-87439-92-17439-95-4
• 7439-96-57439-97-6108-10-175-09-291-57-6106-44-591-20-37440-02-087-86-585-01 8108-95-27440-09-7129-00-07782-49-27440-22-47440-23-5100-42-579-34 5127-18-4
Chemical
Dlchloroethane. 1.2-)ichloroethene, cis-1,2-
Dichloroethene. lrans-1.2-Dlchloroethenc (total). 1,2-[lichloropropane, 1.2-
DleldrlnDiethylpluhalateDlmethylphthalateDinitrololuene. 2.4-indosulfan I
Endosulfan 11Indosulfan sulfateindrinindrln aldehydeindrln kcloneEthylbenzeneHuoranthene•leptachlorleptachlor epoxlde
Hexanone. 2-Ironsopropylbenzene.cadvlagncsiumManganeseMercury^ethyl-2-pentanone. 4-Mcthylene chlorideMethylnaphthalene. 2-Methylphenol, 4-VaphthaleneNickel ' "-',PentachlorophenolPhenanthrenePhenolPotassiumPyreneSeleniumSilverSodiumStyreneTetrachloroethane. 1.1.2.2-Tctrachloroclhcne
\>lMinimumConcentration
(mg/kg)
0.0150.7
0.040.0005
0.0150.0036
0.114.3
0.890.00180.00360.003G0.00360.00570.0036
0.0020.098
0.00180.00180.0008
8.0800.1514.348636.50.13 ,0.19
0.0012.71.2
0.44• 9.6
0.90.056
0.24604
0.0930.88
2.6112
0.00090.004
0.0005
MinimumQualifier
B
11
1
1i
]
J
B
•JJJ
- 1
11B1B
B111
MaximumConcentration(mg/kg)
0.0153.140.04
O.OJ70.015
0.00360.21
4.30.89
0.00180.00360.00360.00300.00670.0036
0.671.3
0.050.00180.0008
' 56.3000.15
1.29022.300
1,24073
0.190.005
2.74.722
1.1800.91.72.6
23.6001.8
0.885.4
3.4400.0009
0.02525
MaximumQualifier
B
11
J
JP
)
I•
JJJJ
JJ
JB
1
Locationof Maximum
Concentration
651-02B-I001-02 B 1601-02B-1501-09-S501-09-SAA-08AA-08
601 -02 B 1505-S
AA-08AA-08AA-OSAA-08AA-OSAA-08
001-02 B-l501-06601-02AA-08509-05505-01
601-02 B-l501-06510-07501-06501-03
60 1-02 B-l601-02501 05
501-09-S501-05501-01505-03501-00501-04001-08501-06001-02501 06ERC-01509-01001-05601-02
DetectionFrequency
I / I3/81/7
7/671/671/682/681/1
1/681/681/641/611/68I/OS1/648/758/695/081/681/08
69/691/1
69/6969/6969/6950/691/1
5/75I /OS2/694/76
61/691/686/095/6909/098/091/692/6845/091/755/70
22/75
Range ofDetection
Limits(niB/kg)
0.005 - 0.0050.005 - 0.0050.01 -0.0170.01-0.0170.0035-0.21
0.34 - 9.6
0.34 - S.C0.0018-0.110.0035-0.210.0035-0.210.0035-0.210.0035-0.210.0035 - 0.210.005-0.017
0.34 - 9.60.0018-0.110.0018-0.11
0.01 • 1
0.11-0.14
0.001 -0.260.34 - 9.60.34-8.50.005 - 9.68.5 - 10.20.83 - 230.34-9.60.1 -9.6
0.34-9.00.56 0.852.1 -2.8105-557
0.005 - 0.200.005 - 0.200.001 -0.017
ConcentrationUsed for
Screening
0.0153.140.040.0470.0150.00300.214.3
0.890.00180.00300.00360.00300.00670.0030
0.071.3
0.050.00180.000856.3000.151.290
22.3001.24072.60.190.005
2.74.722
1.1800.91.72.6
23,0001.8
0.885.4
3.1400.00090.025
25
(2)Background
Value(mg/kg)
N/AN/AN/AN/AN/AN/AN/AN/AN/AN/AN/AN/AN/AN/AN/AN/AN/AN/AN/AN/A
36.000N/A
431,460102
. 0.19.N/AN/AN/AN/AN/A
14N/AN/AN/A1.880N/A0.575N/A330
N/AN/AN/A
JScreening
Toxlcily Value(mg/kg)
0.35 C4.3 NC6.3 NC
4.3 (5) NC0.35 C0.03 C
4.900 NC01.100 NC
12 NC37 (5) NC37 (5) NC37 (5) NC
1.8 NC1.8 (5) NC1.8 (5) NC
150 NC230 NC0.1! C
0.053 C79 NC
2.300 NC1C NCNF NCNF NF180 NC2.3 NC79 NC8.9 C
5.0 (5) NC31 NC5.6 NC160 NC3 C
5.6 (5) NC3.700 NCNF NF230 NC39 NC39 NCNF NF460 NC0.38 C0.38 C
ARAR/TBCValue
(mg/kg)
ARAR/TBCSource
curuFlag
NONONONONONONONONONONONONONONONONONONONOYESNOYESNOYESYESNONONONOYESYESNONONONONONONONONONOYES
(4)rationale [or
ContaminantDeletion
or SelectionBSLBSLBSLBSLBSLBSLBSLBSLBSLBSLBSLBSLBSLBSLBSLBSLBSLBSLBSLBSLASL.BSLNTXNUTASLASLBSLBSLBSLBSLASLASLBSLBSLBSLNUTBSLBSLBSLNUTBSLBSLASL
( ;;
N.)
Page 2 of 3

TABLE 2.laOCCURRENCE. DISTRIBUTION AND SELECTION OF SURFACE SOIL CHEMICALS OF POTENTIAL CONCERN, EXPOSURE UNIT 1
AQUA-TECH SITE
Scenario Time frame:Medium:Exposure Medium:Exposure Point:
Current/FutureSurface SoilSurface SoilExposure Unit 1
1CAS
Nu tuber
. T-iW-18-C108-88-38001-35-2120-82-171-55-679-00-579-01-67440-62-21330-20-7NF95-47-07440-CG-6
Chemical
ThalliumTolueneToxapheneTrichlorobcnzene. 1.2.4-Trfchloroethanc, 1,1.1-Trlchloroethane. 1.1.2-TrichloroetheneVanadiumXylenesXylene. tn&p-Xylene. o-Zinc
(«MinimumConcentration
(mg/kg)
0.7.0.0003
6.80.042
0.00040.001
0.000418
0.00050.350.18
22
MinimumQualifier
BJ
JJJ
"j
J
«,MaximumConcentration(mg/kg)
1.80.39
6.82.4
0.0700.0010
21.21953.6
0.940.74957
MaximumQualifier
J
J
J
Locationof Maximum
Concentration
601-02 B-l601-02509-05601-02501-06501-04
C01-02B-6
505-04601-02 B-lC01-02B-0601-02 B-6
601-05
DetectionFrequency
46/6944/751/684/767/752/6730/7569/698/683/72/7
69/69
Range olDetection
Limits(mR/M
0.64-0.810.001-0.017
0.18-110.005 • 9.60.003 - 0.260.01 - 0.0570.005 • 0.95
0.01 -0.0170.01 -0.01
0.005 - 0.005
ConcentrationUsed for
Screening
1.80.396.82.4
o.or0.00121.21953.0
0.940.74957
(2)tlacKgroutul
Value(ing/kg)
0.575N/AN/AN/AN/AN/AN/A
83N/AN/AN/A
46
- i . <3>•~"-'.;""e
TOKlclly Value
(mg/kg)i.
O.Ji NC39 NC
O.M C0!'' NCUS' NC
O.Bi C0.8^ Cit NCIJO NC
140 (5) NCHO (5) NC2.300 NC
Potential
ARAR/T6CValue
(mR/kg)
Potential
ARAR/+BI:Source
Flag
YESNOYESNONONOYESYESNONONONo
(4)
ContaminantDeletion
. or Selection
*SLBSLASL'BSLBSL
' BSLASL.ASL
. BSL•' BSL
BSLBSL
(1)Minlmuni/maximum detected concentration.(2) Background value is two times the mean concentration or one-half of the Practical Quant it at ion Limit (PQL)
for analytes ihat were below detection limits (BDL)(3)November 22, 2000. Region IX PRO Table. Lower of the residential values at HI ofO.l for noncarcinogenic effects (NC) and
1E-OG risk for carcinogenic effects (C). Lead screening value based on 1EUBK model.Not appropriate to adjust to HI of 0.1.
M)Rationale Codes Selection Reason: Toxlcity Information Available (TX)
Above Screening Levels (ASL)NoToxicity Information (NTX)
-Supplemental Culture lu RAGS fur Mcnilxis <>f a Chemical Clus-i (MCC)
Deletion Reason: Background Levels (BKC)Essential Nutrient (NUT)Below Screening Level {BSL)
(5}The noted screening values are based on closely related surrogates as follows:
Phenanthrene based on NaphthaleneBenzo(g,h.i)perylenc based on NaphthaleneChromium based on chromium VI4-Chlorophenyl phenyl ether based on pentabromodiphenyl etherl.Z-Dichloroethene (total) based on cis-l.Z-Dichloroethene2-Hexanone based on Methyl isobutyl ketone2-Methylnaphthalene based on NaphthaleneEndosulfan ] based on Endosulfan
Endosulfan II based on EndosulfanEndosulfan sulfatc based on EndosutfanEndrin aldehyde based on EndrinEndrin ketone based on Endrino. rn, p-Xylene based on Xylc-neChlordane, alpha- based on ChlordaneChlordane. gamma- based on Chlordane
N/A - Not ApplicableCOPC - Chemical of Potential Concern
ARAR/TBC = Applicable or Relevant and Appropriate Requirement/To Be Consideredj - Estimated ValueB = Analyte detected in associated method blankP - Concentration difference between CC columns >25%N = Spiked sample recovery not within control limitsW = Post digestion spike for Furnace AA analysis out of control limitsS •> Value was determined by method of standard additions' = Duplicated analysis not within control limitC " Carcinogenic effectsNC » Noncarcinogenic effectsNF - Not Found
en
Page 3 of 3
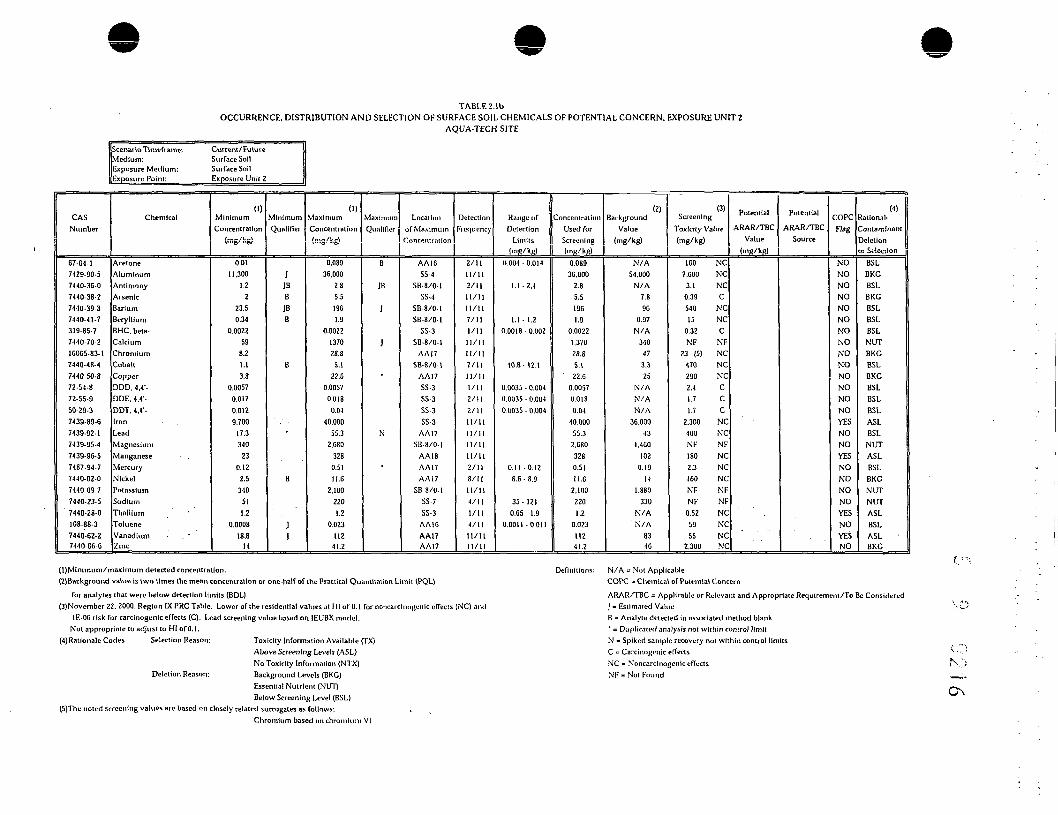
TABLE 2.1bOCCURRENCE, DISTRIBUTION AND SELECTION OF SURFACE SOIL CHEMICALS OF POTENTIAL CONCERN. EXPOSURE UNIT 2
AQUA-TECH SITE
Scenario Tirneframe;Medium:Exposure Medium:Exposure Point:____
Current/FutureSurface SoilSurface SoilExposure Unit 2
CASNumber
67-04-17429-90-57440-36-07440-38-27440-39-37440-41-7319-85-77440-70-2IGOG5-83-I7440-48-47440-50-872-54-872-55-950-29-37439-89-67439-92-17439-95-47439-96-57487-94-77440-02-07440-09-77440-23-5
' 7440-28-0108-88-37440-62-27440-6C-6
Chemical
AcetoneAluminumAntimonyArsenicBariumBerylliumBHC. beta-CalciumChromiumCobaltCopperODD. 4.4'-DDE, 4.4'-DDT. 4.41-[ron_eadMagnesiumManganeseMercuryNickelPotassiumSodiumThalliumTolueneVanadium - . 'Zinc
(1)MinimumConcentration
(mg/kg!
0.0111.300
1.22
23.50.34
0.002259
8.21.13.8
0.00570.0170.0129.700
17.3340
230.122.5
340511.2
0.000818.8
14
MinimumQualifier
JJBB
JBB
B
B
JJ
(1)MaximumConcentration(mg/kg!
0.08936.000
2.85.51961.9
0.0022137028.8
5.122.5
0.00570.018
0.0440,000
55.32.680
3280.5111.6
2,1002201.2
0.023112
41.2
MaximumQualifier
B
JB
J
J
N
•
Locationof Maximum
Concentration
AAI6SS-4
SB-8/0-1SS-4
SB.8/0-1SB-8/0-1
SS-3SB-8/0-1
AAI7SB-8/0-1
AA17SS-3SS-3SS3SS-3
AA17SB-8/0.1
AA18AA17AAI7
SB-8/0-1SS-7SS-3
AAI6AA17AA17
Detection"requency
2/1111/112/1111/1111/117/111/11
11/1111/117/1111/111/112/112/1111/1111/1111/1111/112/118/1111/114/111/114/1111/1111/11
Range ofDetection
Limits(mg/kg)
0.004-0.014
1.1-2.4
1.1- 1.20.0018-0.002
10.8- 12.1
0.0035 - 0.0040.0035 - 0.0040.0035 - 0.004
0.11 -0.128.6-8.3
35 - 1210.65-1.9
0.0011 -0.011
ConcentrationUsed forScreening(mg/kg)
0.08936.000
2.85.51961.9
0.00221.37028.85.1
' 22.00.00570.0180.04
40.00055.32.6803280.51l i e
2.1002201.2
0.023112
41.2
(2)Background
Value(mg/kg)
N/A54.000N/A
7.896
0.97N/A
340473.325
N/AN/AN/A
36,00043
1.460102
0.1914
1.880330
N/AN/A
8346
(3)Screening
Toxicity Value(mg/kg)
160 NC7.600 NC
3.1 NC0.39 C540 NC15 NC
0.32 CNF NF
23 (5) NC470 NC290 NC2.4 C1.7 C1.7 C
2.300 NC400 NCNF NF180 NC2.3 NC160 NCNF NFNF NF
0.52 . NC59 NC55 NC
2.300 NC
Potential
ARAR/TBCValue
(mg/kg)
Potential
ARAR/TBCSource
COPCFlag
NONONONONONONONONONONONONONOYESNONOYESNONONONOYESNOYESNO
(4)iatlonaliContaminant}cletion
or SelectionBSLBKCBSLBKCBSLBSLBSLNUTBKCBSLBKCBSLBSLBSLASLBSLNUTASLBSLBKCNUTNUTASLBSLASLBKC
(l)Minlmum/niaximum detected concentration.(Z)Background value is two times the mean concentration or one-half of the Practical Quanlitation Limit (PQL)
for analyies that were below detection limits (BDL)(3)November 22, 2000. Region IX PRO Table. Lower of the residential values at HI of 0.1 for noncarcinogL-nic effects (NC) and
1E-OG risk for carcinogenic effects (C). Lead screening value based on 1EUBK model.Not appropriate to adjust to HI of 0,1.
(4JRatlonale Codes Selection Reason: Toxicity Information Available (TX)Above Screening Levels (ASL)No Toxicity Information (NTX)
Deletion Reason: Background Levels (BKC)Essential Nutrient (NUT)Below Screening Level (BSL)
(5)The noted screening values are based on closely related surrogates as follows:Chromium based on chromium VI
Definitions: N/A =* Not ApplicableCOPC = Chemical of Potential Concern
ARAR/TBC = Applicable or Relevant and Appropriate Requirement/To Be ConsideredJ = Estimated ValueB = Analyte detected in associated method blank" = Duplicated analysis not within control limitN = Spiked sample recovery not within control limitsC = Carcinogenic effectsNC = Noncarcinogenic effectsNF-Not Found

TABLE 2.3aOCCURRENCE. DISTRIBUTION AND SELECTION OF SUBSURFACE SOIL CHEMICALS OF POTENTIAL CONCERN. EXPOSURE UNIT 1
AQUA TECH SITE
CAS
67-64-1
98.8G-2
309-00-2
7429-90-5
120 ii-77440-36-0534G9-Z1-9
- 12672-29-611097-69-1
7440-38-27440-39-3
71-43-2
56-55-350-32-8205-99-2191-24-2207-08-97440-41-7
5889-9
117-81-7
78-93-3
85-68-7
7440-43-9
7440-70-2
86-74-8
7S-1S-0
108-90-7
75-00-3
. 74-87-3
7005-72-3
1 GOGS-83- 1
218-01-9 •
7440-48-47440-508
74-90-8
110-82-7
72-54-8
5029-3
84-74-2 .
117-844
95-50-1
75-34-3
107 OG-2
SJO-SSO
75-35-4
156-59-2
GO- 57-1
84-6G-Z
131-11-3
NF
100-41-4
206-440
7C-44-8
193-39-5
7439-89-698 82-8
7439 92 I
Scfttiirlu Tlmi-fr.mw:
Medium:Exposure Medium;
ExpuMircr Polni:
CIK...ka1
Acetone
AcctupltciMwc
Aklrln
Atumlniim
Amhruc™?
Antimony
Arockir-1242 ' -Arodor-1248Aroclor-1254Ars«»icBarium
Bcn/rncBcnzo(i))anthrocenc
Benzo(a)pyreneBciuo(b) HiurantlicncBen/ n (fj , li . 0 prry It ne
Ic i \zo (k) fit tarun it itttcBeryllium
BHC.K->iriiiM-(tlndu(K-)
BK(2-<-tl.ylhc-xyI)plnhal;ilcBuUiiionc. 2-
Biiiylt»n/ylp1il!>aUc
Cadmium
CakimnC;irl>a/«|c
CarlwndlMiimk-Cliliirolx-iv/i-rw:
Clilurcx'thanc
ChUiruiHotlwnr
Clilur«phrnyl phwiyl ctlicr. 4-
Chrumlum - 'CKryjcnc . - .Colu.liCopppf
Cyanide
CytloU-xanc
ODD, 4.4'-DDT. 4.4'-Dl-n-Imlylplulialalf!
Dl-n-ottylplithabtc
DkMiwobmwiic, 1,2-
Dklilimicllvuiw. 1.1-
DlclilorocDuiiw:. 1,2-
DhlilaroctlKOC (intuf}. t.2-
Dkhlorucllionc. I.I-Dkliloroelhcnc. cis-1.2-Dh-ldrinDlrtliylptitluilulc
DliiM-lliylplitlubiiL-
EmlmtiHiin 1
ElliyltM-n/citc
RtinninllMiw
1 (cpuiclitor
lr>oU-no(1.2,3-cd)pyrcnc
IronIwiprnpYllx-n/n^
Until
Fulnrc-
SiUwuiTacc Soil
SuJwiirfcicc Suit
Exposure Unll 1
Minimum W
CnrK'mtratJtNi
(ini/kg)
0.0220.1
0.007814.6002.0S!
It0.07
-- 0.170.190.91124
0.002
0.48 J0.34
. 0.60.62
. 0.371.2
0.00520.14
0.01 10.099
0.2673.80.14
0.00140.001
0.006800027
747.4
. 0.114.62.8
0.930.048
0.00920.0088
0.16O.OCI
0.000810.00060.0020.0010.003
000140.0057
0.260.23
0.00210.0007
0.460.0044
0.64. 24.800
0.124
12110
Minimum
)P
JBP
BN
J
]
JU
JJ/1BB
11J
JE
J
1JJ
: J- J
PJ1PJ
IP
I
Mu,,m,M,, ID
4.7O.I
0.007872.100
0.127.519 •
0.810.7610.4
1.4900.74
1-90.5S0840.620.73
2.90.0052
222-t.S
2.217.2
7.70(10.14
0.00147
O.OOG80.24
8214S3.4
90.2
4213.1
0.048
0.12
0.192-2
0.630.052
16.8
0.018
7.1
0.27172
0.00570.260.45
00021
52.31.7
0.0044
0.6463.000
038235
Maximum
B
JP
I
Pn
1
JJ
)
1
J
1I
IBD
I
J
11
|
P1IP
P
L,«»,,,,,,
Com mini! Ion
TSIB-I
D1SB-1
TS02SP
501 09B49
IA-SP601 02 B-S
DIS-SPIA-SP
PCL-SP601-02 B-S601-02 B-S
DAR B-2
DIS-SPDUPU2 fTSOZ-Sn
IA-SPIA-SP
DUP02 fTS02-SP)503 B-2
TS02-SP
DISSP
TSI B-l
D1S-SP
DIS-SP
DOU12B-5
IA-SPIAB-1
501-09 B-8
IAB-1
D1SB 1
D1SSPDLSHD-SPDIS-SP1ASPDIS-SPDISSP
501-09 B-2
DUKJ2 fTS02'SP)
502B-SP
DIS-SP
QH SP
IAB-1
DAR B-2
IAB-1
TS01-SPRE
DISB-I
DAR B-2TS02SP
TS01-SP
TSOZ-SP
TS02-SP
DARB 2
DUP02 (TS02-SP)TSdZ-SP
IA-SP
S8-7A/4-55111 -09 B-2
IA-SP
5(M 6-5
Di-U-Ulon
14/31
1/10
1/16
21/212/28
5/6
3/16
2/202/2018/2121/ZI5/85S/183/283/28
l/ZB
3/18
4/21
1/16
15/27
15/85
3/27
9/21
21/21
I/IB
I/IO
4/HS
1/10
4/65
2/27
21/216/2817/2121/212/2(1
I/IU3/17
2/16
G/27
3/27
2/10
17/853/30
13/21
2/30
9/CS
1/161/17
2/27
1/16
25/85
4/28
1/16
1/18
21/21
Z/IO
21/21
P.ig"/ifuf2
*,«,.*
Limi,
O.LXJ67 - 54
0.36 - 4
0,01)19-0.1
0.36 • 8.1
1.3- 1.3
0.036 - 0.79
0.036 • 2
0.036 - 2
0.66-0.74
0.005 - S4
0.36 - 2.4
036 - 8.1
0 36 - 8.1
0.36 - 8.1
0.36 • 8.1
0.55- 1.5
0.0019-0.1
0.36 - 0.49
0.005 - 5-1
0.36 - 4
0 5 9 - 1.5
036 -B.I
0.01153 - 2.6
0.005 - 54
11,0053 • 2.6
0 005 • O.OOC9
0.36 - 4
0.36 - 4
11.8- 12.7
0.55 - 37
O.U1 1 - 5.3
0.0036 - 0.2lUJOlG • 0.2
0 36 • 4
(1.3G-8.100054 - 2.6
0 005 - 54
0.0053 - 54
01)12 - 54
0 UOS3 - 54
0.0026 - 0.005
0.01)36 - 0.2
I). If, .8.1
0.3G -8.1
00019-0.1
0005-0014
0.36-8.1
(J.OOI9-0.1
0.36-8.1
00053 - 2.6
CoiKTiilr.iili.1
SmrniMK
4.7O.I
0.0073
72.100
0.12
7.S
19
0.81
0.76
10.4
1.430
0.74
1.9
0.550.840.620.732.9
0.0052
22
2J.S
2.2
17.2
7.700
0.14CiOOH
7
O.OUGB
0.2482
145
3.4
90.242|
3.1
0,048
0.12
0.19
2.2
0.63
0052
16.8
0.018
7.1
0.27
172
0.01)57
0.26
0.4S
0.0021
52,3
1.7
0.0044
0.64
63.000
0.38
23520.<KIJ
B,,,kB,.,, (21
"———
Srnvnliw (3)
,,,,,/M
620 NC0.16 NC0.15 C
167.700 NC39,000 NC
82 NC1 C1 C1 C
2.7 C12.500 NC
1.5 C2.9 C
0.29 C2.9 C
19 (5) NC29 C370 NC2.9 CISO C
2.800 NC17.600 NC
61 NCNH NF120 C12(1 NC54 NC6.5 C2.7 C
ISO (5) NC64 (5) C
290 C12.300 NC7.600 NC
3.5 NC3.2011 NC
17 C12 C
8.800 NC
1.800 NC
330 NC
210 NC
0.76 C15 NC
0.12 C15 NC
O.IS C70.500 NC
efHJ.900 NC53(1 (51 NC
600 NC3.000 NC0.55 C2.9 C
61.200 . NC52 NC
1.001 NCNF NF
Poumllal
Vuliip
PotentialARAR/TBC
COPCFtig
NONONONONONOYESYESYESYESNONOYES 'YESYESNOYES 'NONONONONONONONONONONONONOYESYESNONONONONONONONONONONONOYESYESNONONONONONONOYESYESNONONO
Rationale for W
Contaminant
Deletion
BSLBSLBSLBSLBSLBSLASL
'MCCMCCASLBSLBSL
'MCC .ASLMCC •BSL
MCC -BSLBSLBSLBSLBSLBSLNUTBSLBSLBSLBSLBSLBSLASLMCCBSLBSLBSLBSLBSLBSLBSLBSLBSLBSLBSLBSLASLASLBSLBSLBSLBSLBSLBSLBSL
MCCASLBSLBSLNUT
-o
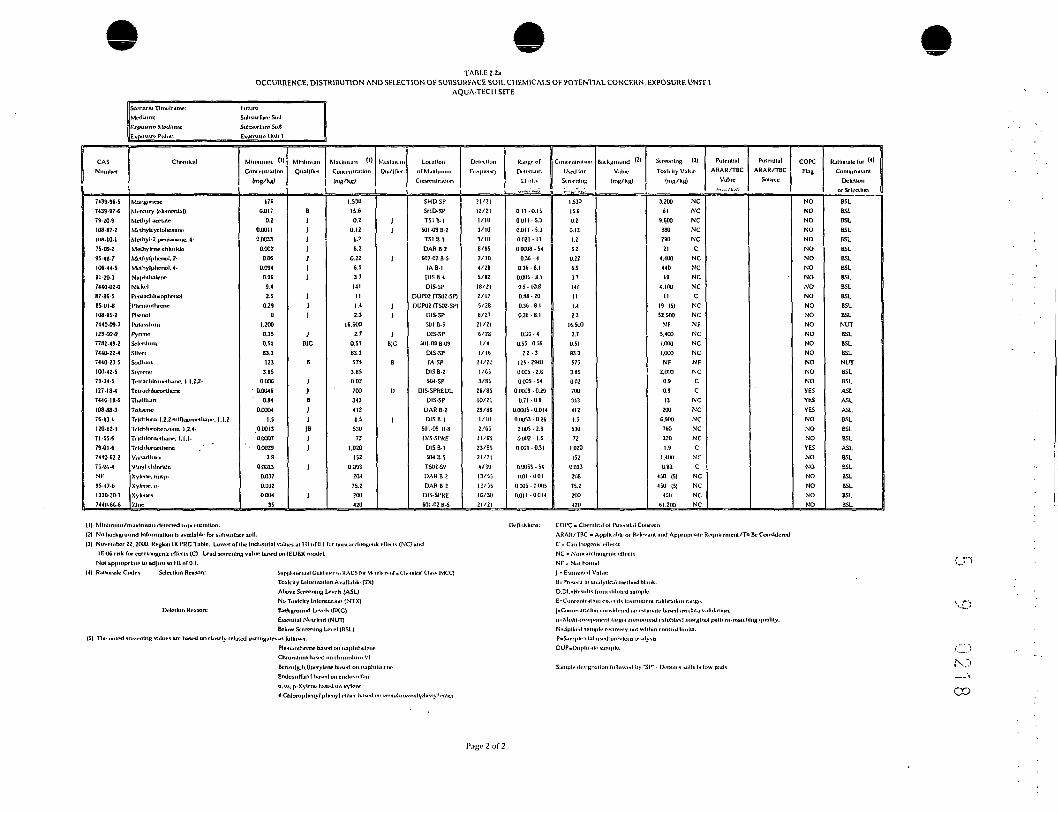
TABLE 2.2aOCCURRENCE. DISTRIBUTION AND SELECTION OF SUBSURFACE SOIL Cl IEM1CAI.S OK POTENTIAL CONCERN. EXPOSURE UNIT 1
AQUA-TECIISITE
CASNlHlJxf
7439.96-57439.57.679-209108-87-2lUd-iO.i75.09.!95-48-7106-44-591-20-37440-02-087-86-S8501-8108.95.2744009-7I29-00-07782-49-27440-22-47440-23-5100-42-579-34-5127.13-47416 166108.88-376-13-112082-17I-S5.6794)1.6744062-275-01-4NF95-47-6
1330.20-77440-6C-6
Scrnarlo Tlnitfranic:Mtdinni:•Kpmurp Mrdlirm:iitpoMiri! Pnhil:
Chemical
MunHimcAcMi-rcuty (rkinrraal)Mc-lliyl aceialeMrthykyclolwManeMclhyi-Z-|Miiu>JiuIH;. 4-
Mulhylmc chlurklc
Mfthylptirnol. 2-
Mi1hylplicni)l.4-NaplilluilcncNickelPcitfadiluinphcnol
PlwnantlirenePlienolPolawlimiPyt'iv-SeleniumSilverSodiumSlyreiie
TelMidilnrnelliane. I.I.2.2-
TclrachluruttlicraThalliumToluene
Trkliloro-l,2.2-lrinuor<x-lliar«--. I.1.2-
Trl*ttti»rohen/ene. I.2.4-
Trlchloruethane, l.I.I-
TrlchloroelhcncVanadiumVinyl dilnrldcXylenr. nt&p-Xyleuc. |>-
XyleneiZliic
FutureSnhsnrrace SoilSulMiirftiie S»IJExposure Unit 1
Contenlrallun
Img/kjj)
1760.017
0.20.00110.00330.002
O.OG0.094
0.969.42.5
0.290
1.2000.350.5183.3123
3.85O.OOC
0.00460.84
0.00041.5
0.00130.00070.0029
3.80.0023
0.0370.0320.004
35
Quallller
BJJ>111>
1JJ
Jesc
B
jjDJ1
JB
t J1
J
1
ContentralUm
dug/kg}
1.53015.60.2
0.12!.?6.2
0.226.53.7141II1.42.3
IG.SOO
2.70.5183.3575
3.850.027003434121.5
53072
1.020152
0.093208
75.2200420
MaximumQ'UilllVr
I
1
]
1
1
1BIG
e
D
I
UHatlnn
CiHMftUfuiion
SHDSPSHD-SPTS1 B-l
501.09 B 2TS1 B-lDAR B-2
601-02 B.5IAB.1
D1S 8-4DIS-SP
Dill'02 fTSOZ-SP)DUP02 (TS02-SP)
DISSP504 B 5DIS-SP
501-09 B 09DISSPIA-SP
DIS B.Z504-SP
DIS-SPREULDISSP
DAR B-ZD1SBI
501-09 B BDIS.SPKEDISB.I504 B-5
TS02-SPOAR B-2DAR B 2
DIS-SPRE601-02 n 5
21/211Z/2I1/103/103/108/B52/104/Z8S/B2
18/212/175/28B/Z7
ZI/216/281/4
1/16H/ZI1/C53/85
26/8510/2129 /BC
I/IO2/65II /8SZ3/8S21/214/3U13/5512/55IG/31J
21/21
ft,iiBrc.r
LtalK
;...R."~w
O.ll -0.1$
0,011 -5.30.01 1 -5.30021 • 110.01X18 • 54
0.3E - 40.36 8.1
O.OU5 - 8.19.5 - 10.80.88-20
0.36 -B.IO J O - 8 1
0.3G - 40.55-0.59
2 . 2 - 3I2S-29W0005 - 2.G
0005- 54
0.0009 • 0.290.71 -0.9
O.OCXJS - 0.0140,1X153 • 0.26
0.005 - 2.60«>2 I.S
0001 -0.31
00053 - 54
1101 -001
0.005 - 0 1X15
0011 -0014
mK111lr.ll Kin
StTITIlllItt
;...„.':.„:1.53015.60.201!1.2G.2
0.226.53.7141II1.42.3
16.500Z.7
O.SIB3.3575
3.850027003134121.553072
1.020152
0.09320875.2200420
Baike,,,,,,Kl Bl
Ill's/I'll)
Sunning ID
(I,,g/l8)
3.200 NC61 NC
9.600 NCB80 NC290 NC21 C
4.400 NC440 NC19 NC
4.100 NCII C
19 |5) NC52.900 NC
NF NF5.400 NC1.000 NC1,000 NCNF NF
2.01X1 NC0.9 C0.9 C13 NC
200 NC6.900 NC760 NC320 NC1.9 C
1.400 NC
0.83 C450 (5) NC450 (5) NC
450 NC61.200 NC
PulnmblARAR/TBC
Value
I..... /wi
Polrmlal
ARAR/TBCSource
COPCFI.1B
NONONONONONONONONONONONONONONONONONONONOresYESYESNONONOYESNONONONONONO
RalliMuh! for Conlainlivint
Delationor Si-loclNm
BSLBSlBSLBSLBSLUSLBSLBSLBSLBSLBSLBSLBSLNUTBSLBSLBSLNUTBSLBSLASLASLASL .BSLBSLBSLASLBSLBSLBSLBSLBSLBSL
(1) Minimum/maximum detected im*ri.lration.
(2) No background information Is available for subsurface soli.
(3) November 22, ZOUO, Region IX PRO Table. Lower of Uic Industrial values ai HI ol 0.1 fur nuitcurirlittwii
I E-(W risk for carclnogtnlc eflecu (C). Uad sciwnlng value luwd on IEUBK nxidcl.
Niri appropriate to rtdjuit to HI ofO.I.
(4) Rattniwle Cwlcs Selection Reason: Sup)iliii.ptii.il CuttUid- in MACS IW M.-
Tonklty Inriinivillnn Avallahk (TX)
Ahovr Strrrnlng Lrvch (ASL)
No ToK.clty tnldrnialkHi (NTX)Deletion Ri-awirt BackKron.Kl Levels (BKC)
Essrmfal Nuir lent (NUT)
Botuw Scn-rnliiH Level (BSL)(5) Tin- iKdc'd irtvrnlitg valui-J arr huu-d on closely related itirrunatn as fulkiwi:
PU-ruinllirerv hasi-d on iui|>liiUili-ni'
Clironilimi based nn clinmiliini VI
BiTv»iO{,M.I)j«-ryUfU' board onEndosnlfan I IKIMK! on cndnsn
llul Cmr R<'lev aix) A|>[iroprUile Ri^jnlrcnifill/TQ Be Considered
Mlhlatik.
ample.
COPC = ClH-niinil ol Pul
ARAR/TBC - A|)plhal>li- or
C = CurdiKiKi-nk f««fts
NC E NoticiircliKiKi-iiif i-tliT
NF = Nui FoundJ - E\liinaU'd Value
BcPrrsi-iit Inanalylkalint-l
D.DL,=Ri-Milis front diliiu-d
E=C<>iKciiinillnii ruLii'ds InJ=C(HHfntraUuii coi»ldcii-d
( i-= Mi j|( (.(()(»(« iiKVil l;ir)fi'i
N-Splki-d sanipli- ritovcry
P=S.nnpli- vl;il uwtl previou
S;.ni))le di».lg'wlion fnlUiwiil l>y 'SP* - Dt-n.ni s Mills U'h.w pads.
C-1
ro
CO

eTABLE 2.2b
OCCURRENCE, DISTRIBUTION AND SELECTION OF SUBSURFACE SOIL CHEMICALS OF POTENTIAL CONCERN, EXPOSURE UNIT 2AQUA-TECH SITE
Scenario Tlmefranie:Medium:Exposure Medium:Exposure Puini;
FutureSubsurface SoilSubsurface SoilDrainage Dllcli.EU 3
CASNumber
83-32-967-64-17423-30-5120-12-77440-3C-07440-38-27440-39-356-55-350-32-8205-99-2191-24-2207-0897440-41-77440-70-285-74-816065-83-1218-01-97440-48-47440-50-872-54-8132-64-920G-44-0193-39-57439-89-07439-92-17439-95-47439-9C-5748794-791-5761 0 G 4 4 - 57440-02-085-01-87440-09-7129-00-07440-23-5744028-0
Chemical
AcenaphtheneAcetoneAluminumAnthraceneAntimonyArsenicJarium
Benzo(a)anthraceneBenzo(a)pyrene!enzo(b)nuorantheneJenzo(g.h.i)perylene
Benzofkjfluorantheneleryllium
CalciumCarbazoleChromium-hrysene
CobaltCopperODD. 4.4'-Dibenzofuran•luoranthenendeno(!.2.3-c.d}pyreneIron_eadMagnesiumManganeseMercuryMethylnaphihalene, 2-Methylphenol. 4-NickelPhenanthrenePotassiumPyreneSodiumThallium
(1)MinimumConcentration
(mg/kg)
O.OC0.025
36,0000.1
36.5
2400.190.170.12
0.092O.J6
1.11.310
0.1133
0.192.6
12.50.0051
0.0530.4
0.09527.300
20.51,700
1600.14
0.0470.26
130.0721.9000.33
711.7
MinimumQualifier
J
JJ
)JJJJ
JJJ)
JJJJ
JJ
J
1
(1)vlaxfmumConcentration(mg/kfi)
O.OC0.36
38.700O.I
3G.6
5840.190.170.12
0.092016
2.31.400
0.1145
0.198
180.0051
0.0530.4
0.09541,000
375.930
5490.140.130.2C2C.40.3536200.33
711.7
MaximumQualifier
J
JJJ
JJJJJJ
J
J
1JJ
J
IJ
J
J
Locationof MaximumConcentration
SB-GA/4-5SB-8A/4-5SB-SA/4-5SB-CA/4-5SB-8A/4-5SB-8A/4-5SB-8A/4-5SB-6A/4-5SB-6A/4.5SB-6A/4-5SB-CA/4-5SB-OA/4-5SB.SA/4-5SB-OA/4-5SB.6A/4-5SB-CA/4-5SB OA/4-5SB-8A/4-5SB-6A/4-5SB-CA/4-5SB-CA/1-5SB-OA/4 5SB-CA/4-5Sll-CA/4-5SB-CA/4-5SB-8A/4-5SB-8A/4-5SB-CA/4-5SB-8A/4-5SB-OA/4-5SB-8A/4-5SB-CA/4-5SB-8A/4-5SB 6A/-I-5SB-CA/4-5SB-CA/4-5
DetectionFrenuency
1/22/22/21/21/22/22/21/2I/21/2I/21/2I I I2/21/22/21/22/22/21/21/21/21/22/22/22/22/21/22/21/22/22/22/21/21/21/2
Range ofDetection
Limits(nig/kg)
0.42 - 0.42
0.42 - 0.421.2-1.2
0.42-0.420.42 - 0.420.42 - 0.420 .42-0 .420.42-0.42
0.42-0.42
0.42-0 .42
0.0041 -0.00110.42 - 0.420.42 - 0.420.42-0.42
0.13-0.13
0.42-0.42
0.42 - 0.4217.6- 17. C2.1 - 2 . 1
ConcentrationUsed for
Screening(me/kg)
O.OC0.36
38.7000.13
6.6584
0.190.170.12
0.092O.IC2.3
1.4000.1145
0.19818
0.00510.053
0.40.09541.000
375.930
5490.140.130.2626.40.353.6200.33711.7
(2)Background
Value(ing/kg)
i
(3)Screening
Toxicity Value(mg/kg)
2.800 NC020 NC
1C7.700 NC39.000 NC
82 NC2.7 C
12.500 NC2.9 C
0.29 C2.9 C
19 (5) NC29 C370 NCNF NF120 C
64 (5) C290 C
12.300 NC7.000 NC
17 C510 NC
3.000 NC3 C
C1.200 NC1.000 NCNF NF
3.200 NC61 NC19 NC
410 NC4.100 NC19 (5) NCNF NF
5.400 NCNF Nl13.5 NC
Potential
ARAR^TBCValue
(mg/kg)
Potential
ARAR/TBCSource
COPCFlag
NONONONONOYESNONONONONONONONONONONONONONONONONONONONONONONONONONONONONONO
(4)Rationale for
ContaminantDeletion
or SeJeetlGriBSLBSLBSLBSLBSLASL.BSLBSLBSLBSLBSLBSLBSL
NUTBSLBSLBSLBSLBSLBSLBSLBSLBSLBSLBSLNUTBSLBSLBSLBSLBSLBSL
NUTBSL
NUTBSL ro
Page 1 of 2
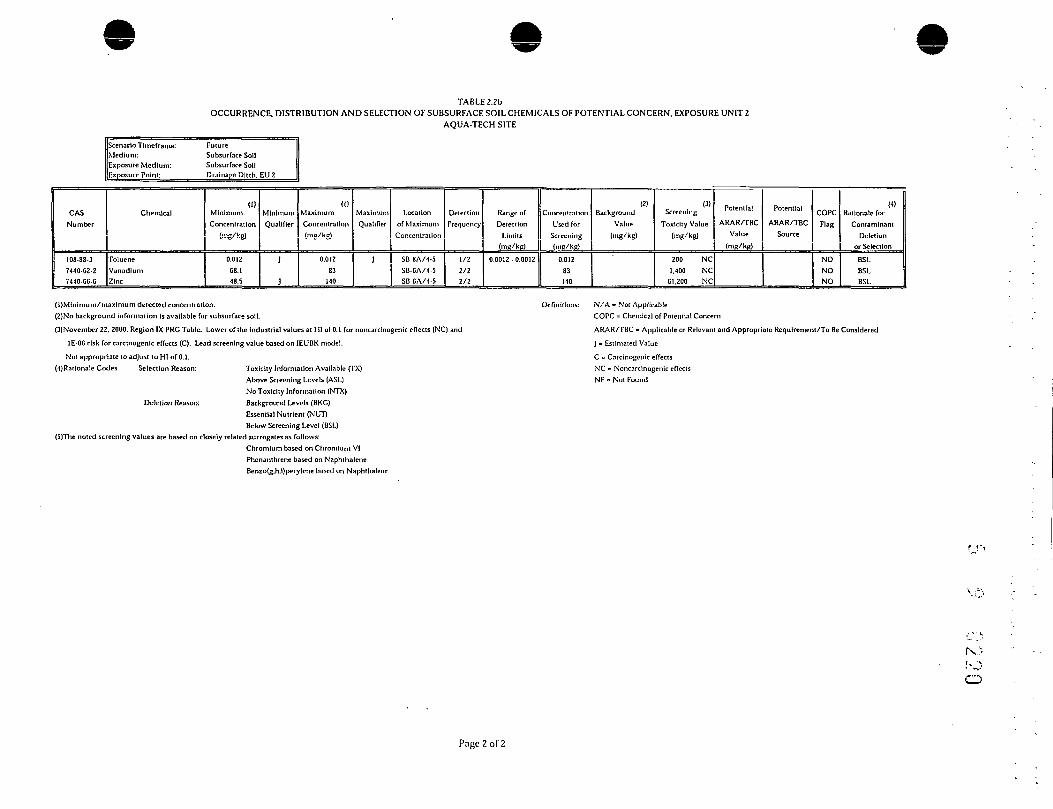
TABLE 2.2bOCCURRENCE, DISTRIBUTION AND SELECTION OF SUBSURFACE SOIL CHEMICALS OF POTENTIAL CONCERN. EXPOSURE UNIT 2
AQUA-TECH SITE
Scenario Tlmefranie: FutureMedium: Subsurface SoilExposure Medium: Subsurface SoilExposure Point: Drainage Ditch, EU 2
CASNumber
108-88-37440-G2-27440-GG-G
Chemical
TolueneVanadiumZinc
(1)MinimumConcentration
(nig/kg)
0.01208.148.5
MinimumQualifier
J
J
(I)MaximumConcentration(mo/kg)
0.012
83140
MaximumQualifier
J
Location
of Maximum
Concentration
SB-8A/4-5SB-CA/4-5SB-GA/4-5
DetectionFrequency
1/2
2/22/2
Range ofDetection
Limits(mR/ks)
0.0012-0.0012
Concentration
Used forScreening(niR/kB)
0.012
83140
(2)Background
Value
(ing/kg)
(3)Screening
Toxicity Value
(mg/kg)
200 NC1.400 NC
61,200 NC
Potential
ARAR/TBCValue
(mB/kR)
Potential
ARAR/TBCSource
COPCFlag
NONONO
(4)Rationale for
Contaminant
Deletionor Selection
BSLBSLBSL
(1)Minlmum/tnaxlmum detected concentration.(2)No background information is available for subsurface soil.
(3)November 22, 2000. Region IX PRG Table. Lower of the industrial values at HI of 0.1 for noncardnogcnic effects (NC) and
1E-OG risk for carcinogenic effects (C). Lead screening value based on 1EUBK model.
Not appropriate to adjust to HI ofO.I.
(-l)Ratlonale Codes Selection Reason: Toxicity Information Available (TX)Above Screening Levels (ASL)
No Toxicity Information (NTX)
Deletion Reason: Background Levels (BKCJEssential Nutrient (NUT)
Below Screening Level (BSL)(5)The noted screening values are based on closely related surrogates as follows:
Chromium based on Chromium VIPhenanthrene based on Naphthalene
Benzo(g,h,l)perylene based on Naphthalene
N/A - Not ApplicableCOPC = Chemical of Poteniial Concern
ARAR/TBC = Applicable or Relevant and Appropriate Requirement/To Be Considered
J - Estimated Value
C = Carcinogenic effects
NC = Noncarcinogenic effectsNF - Not Found
CD
Page 2 of 2

TABLE 2.3OCCURRENCE, DISTRIBUTION AND SELECTION OF SEDIMENT CHEMICALS OF POTENTIAL CONCERN. EXPOSURE UNIT 2
AQUA-TECH SITE
Scenario Tiniefranie:Medium:Exposure Medium:Ex posu rg j plr it:___
Current/FutureSedimentSedimentExposure Unit 2
CASNumber
07-64-1309-00-27429-90-5120-12-77440-30-012672-29-6I1097-C9-17440-38.27440-39-356-55-350-32-8205-99-2207-08-97440-41-7319-8C-S117-81-785-68-77440-43-97440-70-267-66-3
, 16065-83-1218-01-97440-48-47440-50-857-12-572-54-872-55-950-28-384-74-2117-84-0106-46-775-34-3107-06-2540-59 0CO-57-133213-65-97421-93-4200-44-076-44 87439-89-67439-92-17439-95-47439-96-5
Chemical
AcetoneAldrinAluminumAnthraceneAntimonyAroclor 1248Aroclor 1254ArseniclariumBenzo(a)anthraceneBenzo(a)pyreneienzofb) fluorantheneJenzo(k)Ruoranthene
BerylliumBHC. della-Bls(2-cthylhexyl)phlhalaleButylbenzylphthalateCadmium^atciurn-hloroformChromium . . .ZhryseneCobaltCopper"yanlde (free)
ODD. 4.4'-DDE. 4.4'-DDT. 4.4'-[)i-n-butylphthalateDi-n-oclylphthalateDirhlorobenzene. 1.4-Dlchloroethane. 1,1-Dichloroelhane. 1.2-Dichloroethene (total). 1.2-DlcldilnEndosulfan 11Endi in aldehydeFlunrantheneIteptachlorIronLeadMagnesiumManganese
(1)MinimumConcentration
(ing/kg)
0.0020.0082
1.8100.042
0.60.17
0.0340.3615.7
0.0550.0640.066 .0.074,
0.270.005
0.070.060.31
880.0008
40.059 :
1.22.8
30.011
0.00530.0061
0.0460.0280.064
0.00070.0010.002
0.00140.00740.0071
0.0620.0028
2,0103.4329
38.6
MinimumQualifier
BJP
FCJ
JPBBJJJ
'. . JBPBJJ
J
)
PPP
JBJJJJJ
JPXP
JP
B
(1)MaximumConcentration(mg/kg)
0.020.0 II
31,3000.042
6.20.170.12
5.3937
0.150.160.160.14
1.40.005
4.20.46
26.S900.002
770.17
1879.3
3.80.015
0.00880.017
0.371.4
0.0640.0130.0010.0550.018
0.00740.0071
0.320.002837.100
76.812.300
2.600
MaximumQualifier
CJB
11JJ
P
J
JCJ
PPPJ
JJJ
P
JPCC
1
Locationof Maximum
Concentration
SD01SD02SD02SD-5SD02SD01SD02SD-2SD02SD-5SD-5SD-5SD-5SD02SD02SD02SU02SD02SD02SD02SD02SD-5SD2SD02SD02SD02SD02SD02SD02SD02SD02SD02SD02SD02SD02SDOISD02SD-5SD02SD02
. SD02SD02SD-2 '
Detection•refjuency
7/202/1622/22
1/64/221/202/20
15/2222/223/202/202/202/2012/221/108/202/206/2222/223/2022/223/20
14/2220/223/202/162/162/167/202/201/203/201/206/203/1G1/161/104/20I/1C
22/2222/2222/2222/22
II
Range of I ConcentrationDetection Used for
Limits I! Screening(nic/ke) II (mK/ke)
0.0064 - 0.0250.0021-0.0027
0.43 - 0.520.5-9
0.041-0.450.041 -0.45
0.47 - 2.7
0.41-0.550.41-0.550.41-0.550.41-0.550.22-1.5
0.0021 -0.00280.41 -0.520.41 -0.550.13-1.5
0.0013-0.016
0.41-0.550.9- 15.2
2-5.90 .24-7 .1
0.004 1 - 0.00550.0041 -0.00550.0041 -0.0055
0.41-0.550.41 -0.550.41 -0.55
0.0013 - 0.0 160.0013-0.0160.0026-0.0160.0011 -0.00520.0012 - 0.00550.004 1 • 0.0052
0.41 0.550.0021 -0.0028
0.020.01131.3000.042
6.20.170.125.39370.150.160.160.141.4
0.0054.2
0.462
6.8900.002
770.1718
79.33.8
0.0150.00880.0170.37
1.40.0610.0130.0010.0550.0180.00740.0071
0.320.002837.100
76.812.3002.600
(2)Background
Value(mg/kg)
N/AN/A4.688N/A
2.75N/AN/A0.97733.79N/AN/AN/AN/A0.815N/AN/AN/A0.824205.6N/A
19.3N/A
7.534.643.73
N/AN/AN/AN/AN/AN/AN/AN/AN/AN/AN/AN/AN/AN/A7.01219.54842.8
164.26
(3)Screening
Toxlcity Value(mg/kg)
160 NC0,029 C7,600 NC2.200 NC
3.1 NC0.22 C0.11 NC0.39 C540 NC0.62 C
0,062 C0.62 C6.2 C15 NC
0.09 (5) C35 C
1200 NC3.7 NCNF NF
0.039 NC23 (5) NC
62 C470 NC290 NC120 NC2.4 C1.7 C1.7 C
610 NC120 NC3.1 C59 NC
0.35 C4.3 NC
0.03 C37.0 (5) NCI.I (5) NC
230 NC0.11 C
2,300 NC400 NCNF NF180 NC
Potential
ARAR/TBCValue
(mg/kfi)
1
Potential
ARAR/TBCSource
1copeFlag
NONOYESNOYESYESYESYESYESYESYESYESYESNONONONONONONOYESYESNONONONONONONONONONONONONONONONONOYESNONOYES
(4)Rationale for
ContaminantDeletion
or SelectionliSL.BSLASLBSLASLMCCASL
.ASLASLMCCASLMCCMCCBSLBSLBSLBSLBSLNUTBSL
";' ASLMCCBSLBSLBSLBSLBSLBSLBSLBSLBSLBSLBSLBSLBSLBSLBSLBSLBSLASLBSL
NUTASL
Page 1 of 2

TABLE 2.3OCCURRENCE, DISTRIBUTION AND SELECTION OF SEDIMENT CHEMICALS OF POTENTIAL CONCERN, EXPOSURE UNIT 2
AQUA-TECH SITE
CASNumber
7487-94-775-09-2106-44-5
7440-02-085-01-8108-95-27440-09-7129-00-07440-23-5
127-18-47440-28-0108-88-3120-82-171-55-C79-01-G
7440-62-2_.7440-06-G
Scenario Timefrarne: Current/FutureMedium: SedimentExposure Medium: SedimentExposure Point: Exposure Unit 2
Chemical
Mercury ' .;'Methylene chlorideMethylphenol, 4-NickelPhenanthrenePhenolPotassiumPyrene
SodiumTetrachloroethene
ThalliumTolueneTrichlorobenzene, 1.2,4-Trichloroethane, 1,1.1-
Trichloroethene
Vanadium^Zinc
(1)MinimumConcentration
(mg/kg)
0.130.0020.037
30.130.11314
0.0558
0.0009
1.90.001
0.0480.003
0.0007
411
MinimumQualifier
BJJ
JJB
JBJ
BJJJJB
(1)MaximumConcentration(mg/kg)
3.60.0380.037
48.60.140.11
10.300
0.27402
0.017
3.20.0090.048
0.003
0.01
105157
MaximumQualifier
BJ
JJC
JB
JJJJCC
Location
of Maximum
Concentration
SD-5SDOISD-5SD02SD-5SD02SD02SD-5SD02SD02
SD-002SD-5SD02SD02SD02SD02SD02
Detection
Frequency
8/224/20I/C
17/222/201/20
22/224/20
12/228/202/83/20
1/201/20
C/20
20/2222/22
Range of
Detection
Limits(mg/'Kfs)
0.1-0.160.0013-0.016
0.43-0.52
2 - 1 2
0.41 0.550.41 -0.55
0.41-0.55
41- 1500.0013 -0.01G
1.3-2.70.0013-0.014
0.41 -0.55
0.0013 -0.016
0.0013 -0.01G
13.4-14.8
ConcentrationUsed for
Screening(nig/kg)
3.60.0380.03748.60.14
0.1110.300
0.27
4020.017
3.20.0090.048
0.003
0.01
105157
(2)Background
Value
(mg/kg)
0.1220.0164N/A
7.11N/AN/A
1.079.8N/A
169.92N/A
0.8N/AN/AN/AN/A14.0327.86
(3)Screening
Toxicity Value(mg/kg)
. 2.3 NC8.9 C31 NC160 NC
5.6 (5) NC3,700 NCNF NF230 NCNF NF5.7 C
0.52 NC59 NC65 NC77 NC2.3 NC55 NC
2.300 NC
Potential
ARAR/TBCValue
(niR/M
1 1 II
Potential
ARAR/TBCSource
COPCFlag
YESNONONONONONONONONOYESNONONONOYESNO
(4)Rationale for
ContaminantDeletion
or Selection
• A S L .BSLBSLBSLBSLBSLNUTBSLNUTBSLASLBSLBSLBSLBSLASLBSL
(1)Minlmum/rnaxlmum detected concentration.
(2)Background value is two times the mean concentration or one-hair of the Practical Quanlilallon Limit (PQL)
Tor analytes that were below detection limits (BDL)
(3}November 22, 2000. Region IX PRO Table. Lower of the residential values at Hi of 0.1 for none arc Inogcnic effects (NC) and1E-OG risk for carcinogenic effects (C). Lead screening value based on IEUBK model.
Not appropriate to adjust to HI of 0.1.
(^Rationale Codes Selection Reason: Supplemental Guidance to RAGS fur Member* of a Chemical Class (MCC)
Toxicity Information Available (TX)Above Screening Levels (ASL)
No Toxicity Information (NTX)Deletion Reason: Background Levels (BKC)
Essential Nutrient (NL/T)Below Screening Level (BSL)
(5)The noted screening values are based on closely related surrogates as follows:
Chromium based on chromium VIdelia-BHC based on alpha-BHCEndosulfan II based on endosulfan
Endrin aldehyde based on endrin
Phenanthrene based on naphthalene
Definitions: N/A » Not Applicable
COPC - Chemical of Potential Concern
ARAR/TBC - Applicable or Relevant and Appropriate Requirement/To Be Considered
B = Analyte detected in associated method blank
P " Concentration difference get ween the two CC columns is >25%J = Estimated ValueC - Duplicated analysis not within control limits
F = Concentration exceeds Instrument calibration rangeX - Data entered manually into report-generating softwareC " Carcinogenic effects
NC = Noncarcinogenic effectsNF - Not Found
ro
Page 2 of 2
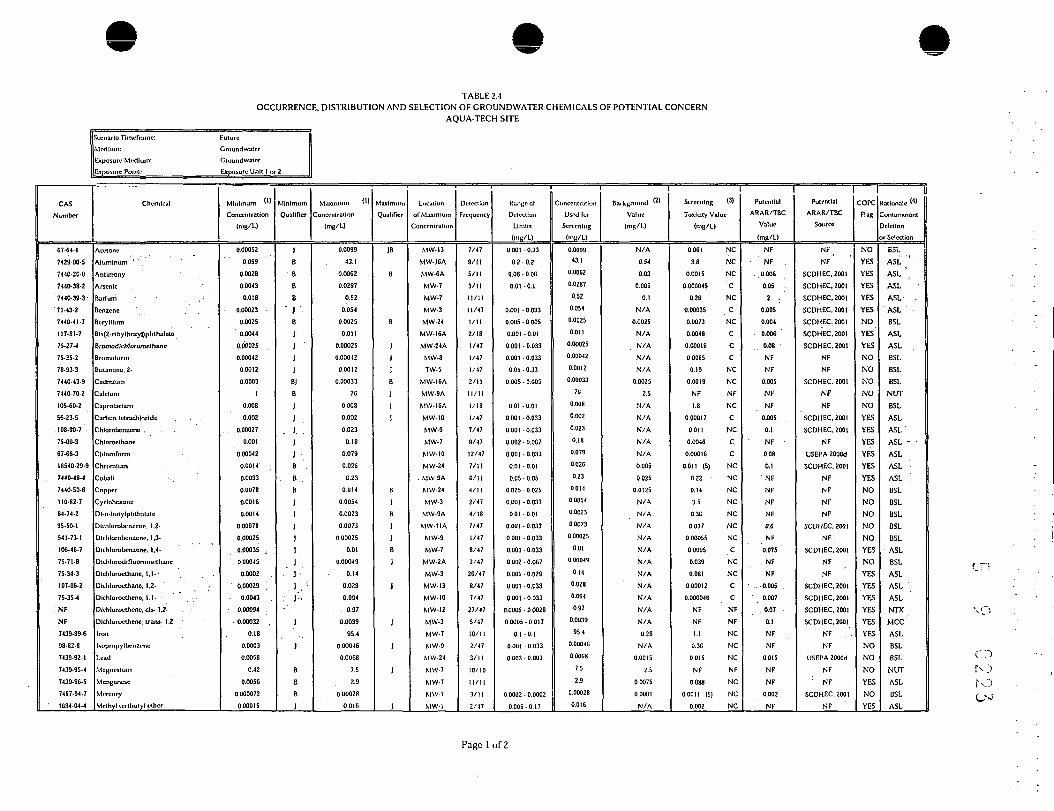
TABLE 2.4OCCURRENCE. DISTRIBUTION AND SELECTION OF CROUNDWATER CHEMICALS OF POTENTIAL CONCERN
AQUA-TECH SITE
Scenario Time-frame:
Medium:Exposure Medium:
Exposure Poinl;
Future
Cruund water
Ground water
Exposure Unit 1 or!
CASNumber
67-64-1
7(29.30.5
7440.36-0
74(0-38-2
7440-39-3
71-43-2
7440-41. 7
M7-8I-7
75.27-4
75-25-2
78.93-3
7440-439
7440-70-2
105-CO-2
56-23-5
.108.90-7
75-00-3
67-66-3
1854029-9
. 7440-48-4
7440-50-8
110-82-7
84-74-2
95-50-1
541-73-1
106-46-7
7S-71-B
75-34-3
107-06-2
75-35-4
.'NF
NF
7439-89-6
98-82-8
7439-92-1
7439-95-4
7439-90-5
7487-94-71 1634-04-4
Chemical
Acetone
Aluminum
Antimony
Arsenic
Barium • , :
Benzene ^
Beryllium
Bis(2.cthylhcxyl)phthalale
homodlchloromclhane
Bromulorm
lutanunc-. 2-
Cadmlum
Calcium
Caprulactam
Carbon tctrccrtloride
Chlorobcnzcnc .
Chloroethanc
Clilorororm
Chromium
Cobalt
Copper
Cyclohcxane
Dl-n-butylphtlialatc
DkhlorolH-nzcne. 1,2-
3lch!orol>enzcnc. 1 .3-
3lchlorubenzcne. 1.4-
Dichlorndllluoromethanc
Dichlorocthano, 1.1--
Dkhlorocthane, 1,2-
Dichloroctheno. I.I- .
Dtchlorocthcne. els- 1,2-
Dlchloroelhcne. traits- 1.2-
Iron
Kopropylucnzene
Lead
Magnesium
Manganese
Mercury
Methyl Icrtbutyl ether
Minimum <»
Concentration(mg/L)
0.00052
0.059
0.0028
0.0043
0.018
0.00023
0.0025
0.0044
0.00025
0.00042
0.0012
0.0003
1
0.008
0.002
. . 0.00027
0.001
0.00042
0.0014
0.0033
0.0078
0.0016
0.0014
0.00078
0.00025
.0.00035 ..
0.00045
0.0002 .
0.00029
- 0.0043
. 0.00094 .
0.00032
0.18
0.0003
0.0058
0.42
0.0056
0.000072
0.00015
Minimum
Qualifier
J
B8B
B
' JB
J '111BJ
B
J
J
_ ).J
JB .
. B.
B
1
J
1
J
J .
J
J .'••'
J '-
, J"
J
J
B
B
B
J
Maximum W
Concentration
(mg/L)
0.0099
43.1
O.OOG2
0.0287
0.52
0.054
00025
0.011
0.00025
0.00042
0.0012
0.00033
7G
0.008
0.002
0.023
0.18
0.079
0.026
0.23
0.014
0.0054
0.0023
0-0073
0.00025
0.01
0.00049
0.14
0.028
0.094
. 0.97
0.0039
95.4
0.00046
0.0068
7.5
2.9
0.00028
0.016
Maximum
Qualifier
JB
B
B
J
1
JB
J
J
I
B
J
B
J
JB
)
J
J
J
J
J
of Maximum
Concentration
MW-13
MW-16A
MW-6A
MW-7
MW-7
MW-3
MW-24
MW-16A
MW-24A
MW-8
TW-5
MVV-16A
MW-9A
MW-16A
MW-IO
MW-9
MW-7
MW-IO
MW-24
. MW-9A
MW-24
MW-3
MVV-9A
MW-IIA
MW-9
MW-7
MW-2A
MW-3
MW-13
MW-IO
MW-12
MW-3
MW-7
MW-9
MW-24
MW-7
MW-7
MW-7
MW-1
Detection
Frequency
7/47
9/11
S/ll
3/11
11/11
11/47
I/I!
2/18
1/47
1/47
1/47
2/11
ll/ll
1/18
1/47
7/47
9/47
12/47
7/11
6/11
4/11
2/47
4/18
7/47
1/47
8/47
2/47
26/47
8/47
7/47
27/47
5/47
10/11
2/47
3/11
10/10
11/11
3/11
2/47
Range of
Detection
Limits
(mg/L)
0.001-0.33
0.2 • 0.2
0.06 • 0.06
0.01 -O.I
0.001 - 0.033
0.005 - 0.005
0.001 - 0.01
0.001 • 0.033
0.001 -0.033
0.01 -0.33
0.005 - 0.005
0.01 -0.01
0.001-0.033
0.001 -0.033
0.002 • 0.067
0001 -0.033
0.01 -0.01
0.05 - 0.05
0.025 - 0.025
0.001 - 0.033
0.01 -0.01
O.uOI-0.033
0.001 - 0.033
0.001 -0.033
0.002 - 0.067
0.001 -0.029
0.001 -0.033
0.001 • 0.033
0.0005.0.0028
0.0005-0.017
0.1-0.1
0.001 -0.033
0003 • 0.003
0.0002 • 0.0002
0.005-0.17
Concentration
Used for
Screening
(m(!/L)
0.009943.1
0.0062
0.0287
0.52
0.054
0.0025
0.0 II
0.00025
0.00042
0.0012
0.00033
76
0.008
0.002
0.023
0.18
0.079
0.026
0.23
0.014
0.0054
0.0023
0.0073
0.00025
0.01
0.00049
0.14
0.028
0.094
0.97
0.0039
95.4
0.00046
0.0068
7.5
2.9
0.00028
0.016
Background I2'
Value
(mg/L)
N/A
0.54
0.03
0.005
0.1
N/A
0.0025
N/A
N/A
N/A
N/A
0.0025
2.5
N/A
N/AN/AN/AN/A0.0050.025
00125
N/A
N/A
N/A
N/A
N/A.
N/A
N/A
N/A
N/A
N/A
N/A0.26
N/A
0.0015
2.5
0.0075
0.0001
N/A
1
Screening 01
Toxkity Value
(mg/L)
0.061 NC
3.6 NC
0.0015 NC
0.000045 C
0.26 NC
0.00035 C
0.0073 NC
0.0048 C
0.00018 C
0.0085 C
0.19 NC
0.0018 NC
NF NF
1.8 NC
0.00017 C
0.011 NC
0.0046 C
0.00016 C
0.011 (5) NC
0.22 NC
0.14 NC
3.5 NC
0.36 NC
0.037 NC
0.00055 NC
0.0005 C
0.039 NC
0.081 NC
0.00012 C
0.000046 C
NF NF
NF NF
I.I NC
0.36 NC
0.015 NC
NF NF
0.088 NC
0.00 II (5) NC
0.002 NC
I
Potential
ARAR/TBCValue
(mg/L)
NF
• NF
- 0.006
0.05
2 -
0.005
0.004
0.006
0.08 •
NF
NF
0.005
NF
NF
0.005
0.1
'. NF -
0.08
O.I
NF
NF
NF
NF
0.6
NF
0.075
NF
NF
- ... 0.005
0.007
, 0.07
0.1
NF
NF
0.015
NF
NF
0.002
NF
Potential
ARAR/TBC
Source
NF
NF
SCDHEC. 2001SCDHEC. 2001
SCDHEC. 2001
SCDHEC. 2001SCDHEC. 2001
SCDHEC, 2001.
SCDHEC. 2001
NF
NF
SCDHEC. 2001
NF
NF
SCDHEC. 2001SCDHEC. 2001
NF
USEPA 2000d
SCDHEC. 2001
NF
NF
NF
NF
SCDHEC. 2001
NF
SCDHEC. 2001
NF
NF
SCDHEC. 2001
SCDHEC. 2001
"SCDHEC. 2001SCDHEC. 2001
NF .NF
USEPA 2000d
NF
' NF
SCDHEC, 2001
NF
I
COPCFlag
NOYESYESYESYESYESNOYESYESNONONONONOYESYESYESYESYES
YESNONONONONOYESNOYESYESYESYESYESYESNONO
NOYESNOYES
Rationale «>
Contaminant
Deletion
or Selection
BSLASL 'ASL \ASLASL -ASL 'BSLASLASLBSLBSLBSL
NUTBSLASLASL 'ASL -ASLASLASLBSLBSLBSLBSLBSLASLBSLASLASLASLNTXMCCASLBSLBSLNUT
ASLBSLASL
Page lof 2

TABLE 2.4OCCURRENCE, DISTRIBUTION AND SELECTION OF GROUNDWATER CHEMICALS OF POTENTIAL CONCERN
AQUA-TECH SITE
Scenario Time-frame:
Medium:
Exposure Medium:
exposure Point:
FutureGround waterGround water
Exposure Unit 1 c r Z
CASNumber
75-09-2
7440-02.0
2023-C9.5
7440-23-5
70-34-5
127-18-4
7446-18-C
108-88-3
76-13-1
7I-5S-0
79-01-6
75-69-4
7440-62-2
75-01-4
1330-20-7
7440-66.6
Chemical
Metlvylene chloride
Nickel
Potassium
Sodium
Telrachloroclhanc. 1.1.2.2- :
Tclraclilorocthcnc
Thallium
Toluene
Trlchloro-1.2.2.trinuoroMhanc. 1.1.2-
TlHMaiaalane. I.I.I-Trlchlorocthenc
Trichlurolluoromelhane
Vanadium
Vinyl chloride
Xylene.
Zli.c
Minimum <"
Concentration(ing/L)
0.00051
0.0023
1.6
2.5
0.0026
. 0.00037
. 0.0054
0.00032
0.00065
0.00033
0.00028
0.0014
0.0011
0.00022
0.00520.019
Minimum
QuallDer
JB
8
B
J . -
JB
1
1
)
J. .
JB
J
JB
Maximum ">Concentration
(mg/U
0.0021
0.059
12.3
36.9
0.036
1.2
• 0.0092
0.00082
0.012
0.26
0.64
0.0014
0.02S
0.084
0.026
0.032
Maximum
Qualifier
J
I
B
1
1
B
Locution
or Maximum
Concentration
MW-7
MW-7
MW-7
MW-7
MW.10
MW-I
MW-26
MW-S5
MW-13
MW-3
MW-12
MW-16
MW-7
MW-7A
MW-7
MW-IGA
Detection
Frequency
18/47
7/11
11/11
11/11
8/47
32/47
6/11
C/47
5/17
12/47
2G/47
1/47
8/11
8/47
3/47
5/11
RanBeof
Detection
Limits
(mB/L)
0.001-0.033
0.04 - 0.04
0.001-0.033
0.001 - 0.0056
0.01 - 0.01
0.001 - 0.033
0.001 -0.033
0.001 • 0.01
0.001 .0.0056
0.002 - 0.067
0.05 • 0.05
0.002- O.OC7
0.001 .0.033
0.02 . 0.02
Concentration
Used Tor
ScrecnlnR
(mn/U
0.0021
0.059
U.3
3C.9
0.036
1.2
0.0092
0.00082
0.012
0.26
0.64
0.0014
0.028
0.084
0.026
0.032
Background <2>
Value
(n.B/L)
N/A
0.02
2.5
2.5
N/A
N/A
0.005
N/A
N/A
N/A
N/A
N/A
0.025
N/A
N/A0.01
1
ScrecnlnR (3)
Tuxidty Value
(mB/U
0.0043 C
0.073 NC
NF NF
NF NF
0.000055 C
0.001 1 C
0.00024 NC
0.072 NC
5.9 NC
0.054 NC
0.0016 C
0.13 NC
0.026 NC
0.000041 C
0.14 NC
I.I NC
Potential
ARAR/TBC
Value
(ms/L)
0.005
NF
NF
NF
NF
0.005
0.002
1
NF
0.2
0.005
NF
NF
0.002
10
NF
Potential
ARAR/TBC
Source
SCDHEC. 200]
NF
NF
NF
NF '
SCDHEC, 2001
. SCDHEC. 2001
SCDHEC. 2001
NF
SCDHEC. 2001
SCDHEC, 2001
NF
NF
SCDHEC. 2001
SCDHEC. 2001
NF
COPC
Flag
NONONONOYESYESYESNONOYESYESNO
YESYESNONO
li
Rationale Contaminant
Deletion
or Selection
BSL
BSLNUTNUTASLASLASLBSLBSLASLASLBSLASL
ASLBSLBSL
(1) Minimum/maximum detected concentration.
(2) Background value Js two times the mean concentration or one-half of the Practical Quanlllalion Limit (PQL)for analytes that were below detection limits (BDL)
(3) November 22. 2000. Region IX PRO Table. Tapwater values at HI of 0.1 for noncarcinogeiiic effects (NC) and
1E-OG risk for carcinogenic effects (C).
(4) Rationale Codes Selection Reason: Toxlcity Information Available (TX)
Above Screening Levels (ASL)
No Toxldiy Information (NTX)
Supplemental Guidance to RAGS for Mrnibrrs of a ChcniiniJ Claw {MCC)
Deletion Reason: Background Levels (BKC)
Essential Nutrient (NUT)
Below Screening Level (BSL)
(5) The noted screening values are based on closely related surrogates as follows:
Chromium based on Chromium VIMercury based on mercury compounds
N/A - Not Applicable
COPC = Chemical ufPulemiai Concern
ARAR/TBC = Applicable or Relevant and Appropriate Requirement/To Bo Considered
J = Estimated X'alup
B = Analyie detected in associated method blankD = Analyte value from diluted analysts
P = Sample vial used In previous analysisC » Carcinogenic effects
N = Nuncurtiriogenk effects
NF - Not Found
SCDHEC. 2001 - South Carolina Drinking Water StandardsUSEPA 2000d = EPA Drinking Water Regulations - EPA 822-B-00-001
C")roro
Page 2 of 2

TABLE 2.5OCCURRENCE, DISTRIBUTION AND SELECTION OF SURFACE WATER CHEMICALS OF POTENTIAL CONCERN, EXPOSURE UNIT 2
AQUA-TECH SITE
Scenario Timcframe:
Mcdlu
Expos
Expo*
m:
ore Medium:
ire Point:
Current/Future
Surface Water
Surface Water
Exposure Unit 2
CASNumber
67-64-1
7429-90-5
7440-38-2
7440-39-3
71-43-2
117-81-7
85-68-7
7440-70-2
108-90-7
67GG-3
18540-29.9
7440-48-4
7440-50-8
84-74-2
IOG-4G-7
75-34-3
540-59-0
.60-57-1
84-662
7439-89-6
7439-92-1
7439-95-4
7439-96-5
7439-97-6
7440-02-0
55-G3-0
108-95-27440-09-7
7440-23-5
127-18-4
7440-28-0
108-88-3
71-55-6
79-01-6
Chemical
Acetone
Aluminum
Arsenic
larium
Icnzcnc
8ls(2-elhylhexyl)pntha!ate
*adn)luin
Calcium
^hluralwnzenc
Chloroform
Chromium
Cobalt
Copper
)l-n-butylphthalatc
Dlchlorobcnzcne. 1.4-
3JcnIorocthanc, 1.1-
Dlchloroethene. 1.2- (total)
Dleldrln
Dlcthylphthalatc
ron
Lead
Magnesium
Manganese
Mercury
NickelNitrophcno). 2- .
PhenolPotassium
Sodium
Tclrachloroethcnc
Thallium
Toluene
Trithlorocthane. l.l.l-
Trichloroctheno
Minimum <">
Concentration
(mg/L)
0.003
0.0952
0.0025
0.027
0.0004
0.001
0.0043
0.0018
0.003
0.0007
0.00 12
0.02
0.0134
0.001
0.002
0.0005
0.000?
0.000037
0.002
0.296
0.003
I.I0.047
0.00027
0.0380.002
0.0011.71
2.9
0.00041 .
O.OOC
O.OOOG
0.0004
0.0005
Qualifier
B'B
B
J
BJB
J
J
eBJ
J11J*.BJ
J
J
' J '
BJ
J
J
Maximum '"
Concentration
(ms/L)
• . 0.016
. ; 4.17
0.0025
0.191
0.002
0.01
3.47
31.9
0.004
0.001
0.0359
0.0437
0.151
0.001
0.002
0.01
0.085
0.000037
0.003
10.5
0.038
12.5
7.22
0.001
O.I0.002
0.00112.8
41.7
0.012
O.OOG
0.002
0.005
0.038
MaximumQualifier
B
B
J
B
J
J
B
BJ
J
JX
BJ
J
J
J
/
Locationof Maximum
Concentration
SW02
SW02
SW02
SW02
SW02
SW02
SW-I
SW02
SW02
SWOI
SW02
SW02
SVV02
SWOI
SVV02RE
SW02
SVV02
SWOI
SW02
SW02
SW02
SVV02
SW02
SVV02
SW02
SW02
SW02
SW02
SW02
SW02
SW 004
SW02
SU'02
SW02
Detection
Fre<|ui-'nty
5/14
20/23
I/I?
19/23
4/7
4/15
2/15
23/23
2/2
3/3
3/23
5/23
5/22
5/5
I/I
8/20
10/20
I/I
4/4
23/23
12/14
23/23
23/23
2/16
9/231/1
I/I22/23
23/23
12/20
1/3
3/3
3/14
14/20
Range of
Detection
Limits
(n-,K/L)
0.01 -0.01
0.1-0.1
0.002 - 0.005
0.05 • 0.05
0.001 • 0.001
0 0 1 - 0 0 1 1
0.002 • 0.005
0.0009-0.01
0.0009 - 0.05
0.004 - 0.02
0.001 - 0.01
0.002-0.01
0.00] - 0.0085
0.0002 • 0.0002
0.0023 . 0.04
2 2
0.00 1 -0.01
0.005 - 0.005
001 -0.01
0.001 .0.01
Concentration
Used forScreening
(ntR/U
0.0164.17
0.0025
0.191
0.002
0.01
3.47
31.9
0.004
0.001
0.0359
0.0437
0.151
0.001
0.002
0.01
0.085
0.000037
0.003
10.5
0.038
12.5
7.22
0.001
O.I
0.002
0.001
12.8
41.7
0.012
O.OOG
0.002
0.005
0.038
Background |2)
Value
(mg/L)
0.0107
I.2G26
0.005
0.0583
N/A
0.0086
N/A
7.50G
N/A
0.0008
0.0092
N/A
0.0121
0.003
N/A
0.0104
0.0 15G
N/A
0.006
1.2522
0.0113
2. 836
0.0946
N/A
O.OIGI
N/A
N/A5.812
39.32
0.01
N/A
0.0027
0.001
0.01
Screening (3)
Toxkity Value
(mg/L)
NF NC
NF NC
0.000018 C
NF NC
0.0012 C
0.0018 C
0.005 NC
NF
0.68 NC
0.0057 C
0.1 (5) NC
NF NC
1.3 NC
2.7 NC
0.4 C
NF NC
0.7 NC
0.00000014 C
23 NC
NF NC
NF
NF
NF NC
0.00005 NC
O.G1 NC
NF C
21 NCNF
NF
0.0008 C
0.0017 (5) NC
6.8 NC
0.2 NC
0.0027 C
PotentialARAR/TBC
Value
(mo/LI
0
0
0.0014
0
0.005
0.006
0.005
0
O.I
0.1
O.I
0
NF
12
0.075
0
O.I
0.0000014
120
0
NF
0
0
0.00015
O.I0
4.GOO0
0
0.005
0.002
1
0.2
0.005
Potential
ARAR/TBC
Source
0
0
SCDHECR. 61-68
0
SCDHECR. 61-68
SCDHEC R. 61.68
SCDHECR. 61 68
0
SCDHECR. 61.68
SCDHECR. 61-68
SCDHECR. 61-68
0
NF
' 0
SCDHECR. 61-68
0
0
SCDHECR. 61-68
SCDHECR. GLG8
0
SCDHEC R. 61-68
0
0
SCDHECR. G1.68
SCDHECR. 6I-G80
SCDHECR. GI-680
0
SCDHECR. 6LG8
SCDHECR. 61-68
SCDHECR. GI.68
SCDHECR. 61-68
SCDHECR. 61-68
COPCFlag
YESYESNOYESYESYESYESNONONONOYESNONONOYESNOYESNOYESYESNOYESYESNOYESNONONOYESYESNONOYES
Rationale for ^'
Contaminant
Deletion
or Selection
NTXNTXBKCNTXASL
ASLASLNUTBSLBSLBSLNTXBSLBKGBSL
'. NTX 'BSLASLBSLNTXNTXNUTNTXASLBSLNTXBSLNUTNUTASL 'ASLBSLBSLASL
CDroroen
Page 1 of 2
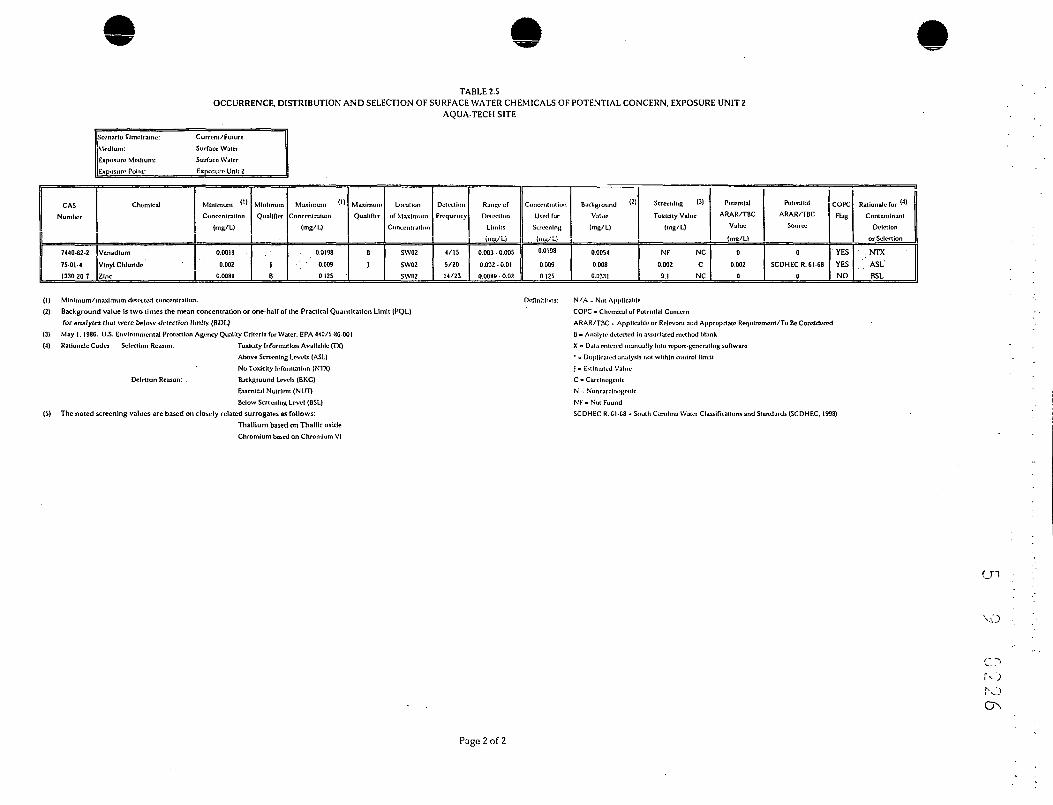
TABLE 2.5OCCURRENCE, DISTRIBUTION AND SELECTION OF SURFACE WATER CHEMICALS OF POTENTIAL CONCERN. EXPOSURE UNIT Z
AQUA-TECH SITE
Scenario Titncframo:
Medium:
Exposure Medium:Exposure point:
Current/Future
Surface Water
Surface Water
Exposure Ur.lt 2
CAS
Number
7440-62.2
75-01-4
1330-20-7
Chemical
Vanadium
Vinyl Chloride
Zinc
Minimum «>
Concentration
(mg/L)
0.001 1
0.002
0.0081
Minimum
Qualifier
Maximum ("
Concentration
(mg/L)
1
JB
0.0198
' 0.009
0.125
Maximum
Qualifier
B
J
Location
of Maximum
Concenlrallmi
SW02
SW02
SVV02
Detection
Frequency
4/15
5/20
14/23
RanBeuf
Detection
Limits
imB/U
0.003 • 0.005
0.002-0.01
O.OOS9 - 0.02
Concentration
Used fur
Screening
(iilB/L!
0.0193
0.009
0.125
Background (2)
Value
(mrj/L)
0.0054
0.008
0.0331
Screening (3)
Toxlcity Value
(mg/L)
NF NC
0.002 C
9.1 NC
Potential
ARAR/TBC
Value
(mu/LI
0
0.002
0
Potential
ARAR/TBC
Source
0
SCDHEC R.61-68
0
COPC
Flag
YES
YESNO
Rationale Tor (4)
Contaminant
Deletion
or Selection
NTX
ASL'BSL
(1) Minimum/maximum detected concentration.
(2) Background value is two times the mean concentration or one-half of the Practical Quantltation Limit (PQL)
for anafytes (hat were below defection limits (BDL)
(3) May I. I98G. U.S. Environmental Protection Agency Quality Criteria Tor Water. EPA 440/5-8G-001
(4) Rationale Codes Selection Reason: Toxlcity Information Available (TX)
Above Screening Levels (ASL)
No Toxicity Information (NTX)
Deletion Reason: . Background Levels (BKC)
Esscnlful Nutrient (NUT)
Below Screening Level (BSL)
(5) The noted screening values are based on closely related surrogates as follows:
Thallium based on Thalllc oxideChromium based on Chromium VI
N/A = Not Applicable
COPC = Chemical of Potential Concern
ARAR/TBC = Applicable or Relevant and Appropriate Requirement/To Be Considered
B = Analyte detected in associated method blank
X " Data entered manually Into report-generating software
* a Duplicated analysis not within control limilt
j - EMlniiiivd ValueC - Carcinogenic
N = Noncaiclnogonic
NF = Not Found
SCDHEC R. CI-C8 = South Carolina Water Classifications and Standards (SCDHEC. 1998)
Page 2 of 2

TABLE Z.G .OCCURRENCE. DISTRIBUTION AND SELECTION OF AIR CHEMICALS OF POTENTIAL CONCERN. EXPOSURE UNIT 1 \Nti EXPOSURE UNIT t
AQUA-TECH SITE
CASNumber
71-43-274-83-956-23 5108-30-7
75-00-3G7-C6-3
74-87-3
10C-93-47C-I4-295-50-1
541-73-110G-46-7
75-71-8
75-34-3
107-OC-275-35-4156-59-278-87-5
10061-01-510061-02-6100-41-4
87-68-3
. 75-09-2
100-42-5
79-34-5127-18-4108-88-3
7C-13-1
120-82-1
71-55-679-00-5
79-01-675 69-495-03-6
Scenario Timefrarne: Current/FutureMedium: Airixposure Medium: AirExposure Point: Exposure Unit 1 or 2
' ' - •'• • l '
Chemical
UenzeneBroinoniethaneCarbon tetrachlorklc
Chlorobenzene
Chloroclhane
ChloroformChloromeihaneDibromoethane, 1.2-
Dichloro-1.1.2.2 letrafluoroethane. 1.2*Dichlorobenzeiie. 1,2-DJchlorobenzene. J.3-
Dichlorobenzene, 1,4-)ichlorodiriuoromethane
Dichloroethane, 1.1-
Dichloroeihane. 1.2-Dichloroethene, 1.1-Dlchloroethene. 1.2- (els)Dichloropropane. 1.2-
Dlchloropropene, 1,3- (els)
Dlchloropropene, 1,3- (trans)
Ethyl benzeneHexachlorobutadiene
Methylene chlorideStyrene
Telrachloroethane. 1.1,2,2-TetrachloroetheneToluene
Trlchloro-l,2.2"lrinuoroethane. 1.1.2-Trichlorobenzene. 1.2.4-Trichloroelhane. 1.1.1-Trichlorocthanc. 1.1.2-
Trichloroethene
TrichtoroflvioroinelhaneTrimethylbenzcno. 1,2.4-
(1)MinimumConcentration
(mg/ml
N/AN/AN/AN/AN/AN/AN/AN/AN/AN/AN/AN/AN/AN/AN/AN/AN/AN/AN/AN/AN/AN/AN/AN/AN/AN/AN/AN/AN/AN/AN/AN/AN/AN/A
MinimumQualifier
N/A
N/AN/AN/AN/AN/AN/AN/AN/AN/AN/AN/AN/AN/AN/AN/AN/AN/AN/AN/AN/AN/AN/AN/AN/AN/AN/AN/AN/AN/AN/AN/AN/AN/A
(1)Maximum
Concentration
(mg/ml
7.I76E-04l.OOOE-OG
3.500E-06C.IOOE-OC
3.800E-OS1.100E-06
I.400E-OG2.000E-OG
I.510E-05l.COOE-OC
U70E-05I.220E-05C.560E-05
1.339E-01
1.700E-001.S90E-05
1.027E-041.200E-061.200E-001.200E-068.460E-05
2.800E-OGl.OOOE-04I.400E-OG1.800E-OG
3.990E-05
2.925E-0-!9.7COE-05
2.000E-OG
I.850E-05I.500E-OG
2.820E-050.600E-06I.580E-05
MaximumQualifier
N/AN/AN/AN/AN/AN/AN/AN/AN/AN/AN/AN/AN/AN/AN/AN/AN/AN/AN/AN/AN/AN/AN/AN/AN/AN/AN/AN/AN/AN/AN/AN/AN/AN/A
Locationof Maximum
Concentration
Fenceline
Fenceline
FencclincFenceline
FencclineFenceline
Fenceline
FencelineFenceline
Fenceline
FencelineFencelineFenceline
FencelineFenceline
FencelineFencelineFenceline
Fenceline
FencclineFencelineFenceline
Fenceline
Fenceltne
Fenccline
Fenceline
Fencelim1
Fenceline
FencelineFencelineFenceline
FencclineFencelineFenceline
Detection
Frequency
N/AN/A
N/AN/AN/AN/AN/AN/AN/AN/AN/AN/AN/AN/AN/AN/AN/AN/AN/AN/AN/AN/AN/AN/AN/AN/AN/AN/AN/AN/AN/AN/AN/AN/A
1 ' ' II
Range or
DetectionLimits
(mg/!!^
N/AN/AN/AN/AN/AN/AN/AN/AN/AN/AN/AN/AN/AN/AN/AN/AN/AN/AN/AN/AN/AN/AN/AN/AN/AN/AN/AN/AN/AN/AN/AN/AN/AN/A
Concentration
Used for
Screening(nig/nfl
7.18E-04l.OOE-06
3.50E-OG6.IOE-06
3.80E-05
1.10E-OG1.40E-OG
2.00E-06
1.51E-05l.GOE-OG
1.17E-05
1.22E-05G.5GE-05
1.34E-041.70E-001.89E-05
1.03E-041.20E-OG
1.20E-OGI.20E-OG
8.4CE-052.80E-OG
l.OOE-041.40E-OG
1.80E-OG
3.99E-05
2.93E-04
9.7GE-052.00E-OG
I.8SE05
1.50E-OC2.82E-05G.GOE-06
1.58E-05
(2)Jackground
Value
(mg/inl
(3)Screening
Toxlcity Value(tng/m1)
2.50E-04 C5.20E-01 NC1.30E-04 C6.20E»00 NCZ.30E-03 C3.10E-02 NC1.10E-03 C9.00E-06 C
3.10E1-03 (5) NC2.10Et01 NC3.30E-01 NC3.10E-04 C2.10E»01 NC5.20E»01 NC7.40E-05 C3.80E-05 C3.70E»00 NC9.90E-05 C
5.20E-05 (5) C5.20E-05 (5) C
1.10E*02 NC7.30E-02 NC4.10E-03 Cl.lOEi-02 NC3.30E-05 C3.30E-03 C4.00E»01 NC3.10E«03 NC2.10E<01 NC1.00E»02 NC1.20E-04 C1.10E-03 C
7.30E»OI NCG.20E-01 NC
Potential
ARAR/TBCValue
(nig/m1)
1.50E-01l.OOE-011.50E-011.73EtOO2.64E-t012.50E-OI5.15E-017.70E-01
NF4.50E»004.50E»004.50E*00
NF2.03E»002.00E-OI9.90E-02
NF1.75E»00
NFNF
4.35E+001.20E-038.75EtOO5.33EtOO3.50E-023.35E»002.00E-01
NF4.00E-019.55E>00
2.73E-016.75E»00
NFNF
Potential
ARAR/TBCSource
SCDHEC. 1992SC DHEC. 1992SC DHEC. 1992SC DHEC. 1992SCDHEC. 1992SCDHEC. 1992SC DHEC. 1992SCDHEC. 1992
SC DHEC. 1992SC DHEC. 1992SC DHEC. 1992
SC DHEC. 1992SCDHEC. 1992SC DHEC, 1992
SC DHEC. 1992
SC DHEC. 1992SCDHEC. 1992SC DHEC. 1992SC DHEC, 1992SC DHEC. 1992SC DHEC. 1992SC DHEC. 1992
SC DHEC. 1992SC DHEC. 1992SC DHEC. 1992SC DHEC. 1992
COPCFlag
YESNONONONONONONONONONONONONONONONONONONONONONONONONONONONONONONONONO
(4)Rationale forContaminant
Deletionor Selection
ASLBSLBSLBSLBSLBSLBSLBSLBSLBSLBSLBSLBSLBSLBSLBSLBSLBSLBSLBSLBSLBSLBSLBSLBSLBSLBSLBSLBSLBSLBSLBSLBSLBSL
C..,'
ro
--0
Page 1 of 2
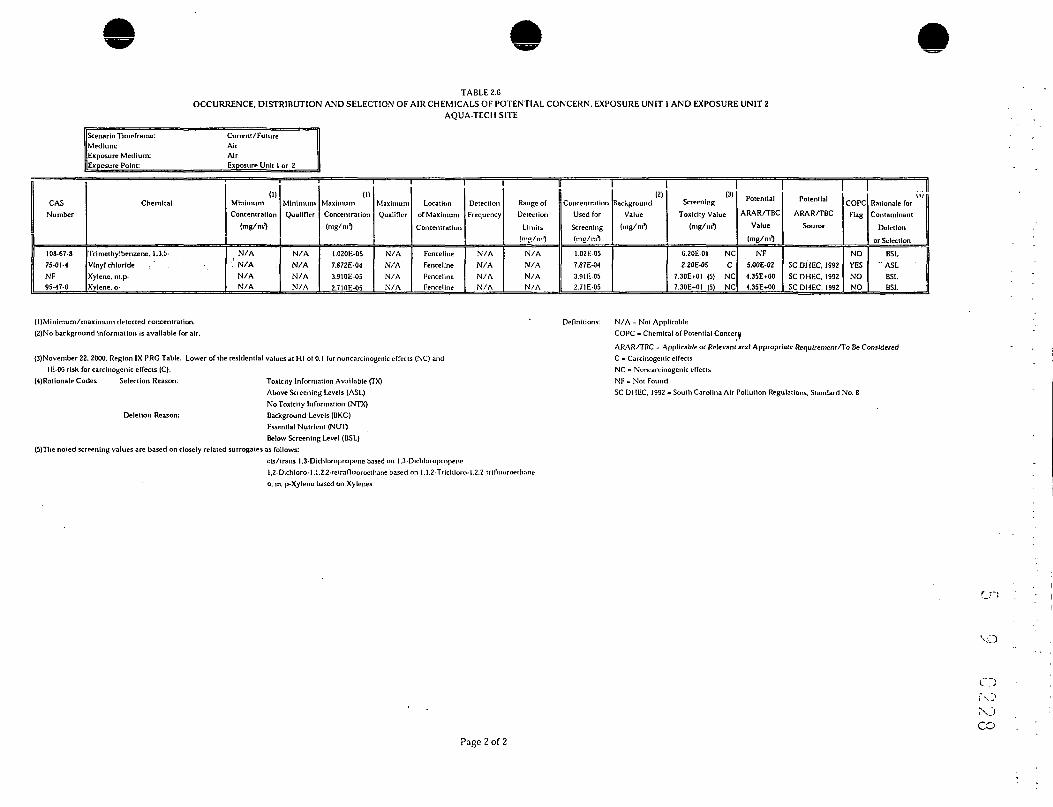
TABLE 2.6OCCURRENCE, DISTRIBUTION AND SELECTION OF AIR CHEMICALS OF POTENTIAL CONCERN, EXPOSURE UNIT 1 AND EXPOSURE UNIT 2
AQUA-TECH SITE
CASNumber
108-67-8
75-01-4
NF95-47-6
Scenario Tinieframe: Current/FutureMedium: AirExposure Medium: AirExposure Point: Exposure Unit 1 or 2
Chemical
Trlmelhylbenzene, 1.3.5-
Vinyl chlorideXylene. m.p-Xylene. o-
IDMinimumConcentration
(mg/m1)
N/A''. N/A
N/AN/A
MinimumQualifier
N/AN/AN/AN/A
(1)MaximumConcentration
(mg/m1)
1.020E-057.872E-043.910E-052.710E-05
MaximumQualifier
N/A
N/AN/AN/A
Locationof Maximum
Concentration
Fenceline
FencelineFencelineFenceline
Detection
Frequency
N/AN/AN/AN/A
II
Range of
Detection
Limits(niR/m1)
N/AN/AN/AN/A
Concentration
Used for
Screening(mg/ml
1.02E-OS
7.87E-043.9 IE-052.7 IE-05
1(2)
backgroundValue
(mg/ml
(3)Screening
Toxicity Value(mg/nr1)
6.20E-OI NC2.20E-05 C
7.30E»01 (5) NC7.30E*01 (5) NC
Potential
ARAR/TBC
Value
(mg/ml
NF5.00E-024.35E»004.35E+00
Potential
ARAR/TBCSource
SC DHEC. 1992SC DHEC. 1992SC DHEC. 1992
COPCFlag
NOYESNONO
...ilI*1/
Rationale forContaminant
Deletion
or Selection
BSL" ASL
BSLBSL
(IJMinimum/maximum detected concentration.(2)No background information is available for air.
(3)November 22. 2000. Region IX PRO Table. Lower of the residential values at HI of 0.1 for noncarcinogcnic effects (NC) andIE-06 risk for carcinogenic effects (C).
(4)Rationale Codes Selection Reason: Toxlcity Information Available (TX)
Above Screening Levels (ASL)
NoToxicity Information (NTX)
Deletion Reason: Background Levels (BKC)
Essential Nutrient (NUT)Below Screening Level (BSL)
(5)The noted screening values are based on closely related surrogates as follows:
cls/trans 1,3-Dichloropropcne based on 1.3-Dichloropiopeni1,2-Dlchloro-1,1.2.2-tetrafluoroetharie based on 1.1.2-Trichloi
o, m, p-Xylene based on Xylcnes
Definitions: N/A = Not Applicable
COPC - Chemical of Potential Concer^
ARAR/TBC " Applicable or Relevant and Appropriate Requirement /To Be ConsideredC = Carcinogenic effects
NC - Noncarcinogenic effects
NF = Not Found
SC DHEC. 1992 - Suuih Carolina Air Pollution Regulations. Standard No. 8
;>-l.2.2-trifiuoroelh;ine
Page 2 of 2
roCO

9 0 2 2 9r Q r. ^ ovj
Table 3 Series
Medium-Specific Exposure Point Concentration Summary
ft

TABLE 3.1aEXPOSURE POINT CONCENTRATION SUMMARY. SURFACE SOIL , EXPOSURE UNIT 1
AQUA-TECH SITE
1 ExoosurePoint
Exposure Unit 1Exposure Unit 1Exposure Unil 1Exposure Unit 1Exposure Unit 1Exposure Unit 1Exposure Unit 1Exposure Unit 1Exposure Unit 1Exposure Unit 1Exposure Unit 1Exposure Unit 1Exposure Unit 1Exposure Unit 1Exposure Unit 1Exposure Unit 1Exposure Unit 1Exposure Unit IExposure Unit 1Exposure Unit tExposure Unit 1Exposure Unit IExposure Unit 1Exposure Unit 1Exposure Unit 1Exposure Unit 1Exposure Unit 1Exposure Unit 1Exposure Unit 1
Scenario I'imefrainc: CurrentMedium: Surface SoilExposure Medium: Surface Soil
Chemicalof
PotentialConcern
AldrinAluminumAntimonyAroclor-1242Aroclor-1248Aroclor-1254ArsenicBariumBenzo(a)antdraceneBenzo(a)pyreneBenzo(b)fluoranthcneBenzo(k)fluoranthencBis(2-ethylhcxyl)phthalateCadmiumChromiumChryseneCopperCyanide, totalIronLeadManganeseMercuryNaphthaleneNickelTetrachloroelheneThalliumToxapheneTrichloroetheneVanadium
ArithmeticMean-T
Concentration(mg/kg)
0.004444.211 (N)
1.90.081N/A0.162.3
1.1810.450.450.400.454.95.691
0.45812.8
41.44477
528 (N)3.4
0.8142
0.0400.81 (N)
0.400.044
128
95% UCL-TConcentration
(mg/kg)
0.006547.785 (N)
2,3o.nN/A0.283.1
1.C680.570.580.590.57
119.11110.581103.5
45.86698
584 (N)7.31.553
0.0800.91 (N)
0.580.098
147
MaximumDetected
Concentration(mg/kg)
0.05584.900
15.30.340.3035
65.63.3000.370.731.1
0.4112068.13390.4398674.7
56.3001.2901.24072.622
1,180251.86.821.2195
Maximumyualilicr
NP
S
JJJJ
•
J
N
•
Reasonable Maximum ExposureMedium
EPCValue
(mg/ks)
0.006547.785
2.30.120.300.283.1
1.6G80.370.580.590.41
119.1111
0.431163.5
45,86698
. 5847.31.553
0.0800.90.580.10147
ivieuiumEPC
Statistic
95% UCL-T95% UCL-N95% UCL-T95% UCL-TMaximum95% UCL-T95% UCL-T95% UCL-TMaximum
95% UCL-T95% UCL-TMaximum
95% UCL-T95% UCL-T95% UCL-TMaximum95% UCL-T95% UCL-T95% UCL-T95% UCL-T95% UCL-N95% UCL-T95% UCL-T95% UCL-T95% UCL-T95% UCL-N95% UCL-T95% UCL-T95% UCL-T
IV1L-UIUIII
EPCRationale
<10 samples
UCL>Max
UCL>Max
UCL>Max
Statistics: Mean-T (log-transformed arithmetic mean); 95% UCL-T (lug-transformed 95% UCL); 95% UCL-N (95% UCL of normal data).N/A: Not applicable - statistical analysis is not recommended for data sets having less than 10 samples.(N) indicates that the arithmetic mean and 95% UCL concentrations were calculated based on a normal distribution of data.J = Estimated Value.N = Spiked sample recovery not within control limitsP = Concentration difference between CC cojumns >25%S = Value was determined by method of standard additions* = Duplicated analysis not within control limit
••-o
CD

TABLE 3.1bEXPOSURE POINT CONCENTRATION SUMMARY, SURFACE SOIL , EXPOSURE UNIT 2
AQUA-TECH SITE
Scenario Timeframc:Medium:Exposure Medium:
CurrentSurface SoilSurface Soil
ExposurePoint
Exposure Unit 2Exposure Unit 2Exposure Unit 2Exposure Unit 2
Chemicalof
PotentialConcern
IronManganeseThalliumVanadium
ArithmeticMean-T
Concentration(mg/kg)
22,500 (N)74
0.61 (N)58 (N)
95% UCL-TConcentration
(mg/kg)
27,800 (N)254
0.77 (N)76 (N)
MaximumDetected
Concentration(mg/kg)
40,0003281.2112
MaximumQualifier
Reasonable Maximum ExposureMedium
EPCValue
(mg/kg)
27,8002540.7776
MediumEPC
Statistic
95% UCL-N95% UCL-T95% UCL-N95% UCL-N
MediumEPC
Rationale
Statistics: Mean-T (log-transformed arithmetic mean): 95% UCL-T (log-transformed 95% UCL); 95% UCL-N (95% UCL of normal data).N/A: Not applicable - statistical analysis is not recommended for data sets having less than 10 samples.(N) indicates that the arithmetic mean and 95% UCL concentrations were calculated based on a normal distribution of data.

TABLE 3.2aEXPOSURE POINT CONCENTRATION SUMMARY, SUBSURFACE SOIL, EXPOSURE UNIT 1
AQUA-TECH SITE
((Scenario Timeframe:1 Medium:[(Exposure Medium:
Future |]Subsurface Soil I!Subsurface Soil ||
ExposurePoint
Exposure Unit 1Exposure Unit 1Exposure Unit 1Exposure Unit 1Exposure UnitExposure UnitExposure UnitExposure UnitExposure UnitExposure UnitExposure UnitExposure UnitExposure UnitExposure UnitExposure UnitExposure UnitExposure UnitExposure Unit 2
Chemicalof
PotentialConcern
Aroclor 1242Aroclor 1248Aroclor 1254ArsenicBenzo(a)anthraceneBenzo(a)pyrencBenzo(b)fluoranthcneBenzo(k)fluoranthcneChromiumChryseneDichloroethene, 1,1-Dichloroethene, cis-1,2-Indcno(l,2,3-cd)pyreneIronTetrachloroetheneThalliumTolueneTrichloroethene
ArithmeticMean-T
Concentration(mg/kg)
0.420.110.112.4
0.590.520.550.67G2.50.560.36
0.0870.67
39,957143.41.56.5
95% UCL-TConcentration
(mg/kg)
4.00.310.314.1
0.980.780.841.284
0.872.9
0.291.2
43,820124127.650
MaximumDetected
Concentration(mg/kg)
190.810.76
101.9
0.550.840.731453.4
0.271720.64
63,000700343412
1,020
MaximumQualifier
Pn
JJ
J
JJ
D
Reasonable Maximum ExposureMedium
EPCValue
(mg/kg)
4.00.310.314.1
0.980.550.840.7384
0.870.270.290.64
43,820124127.650
MediumEPC
Statistic
95% UCL-T95% UCL-T95% UCL-T95% UCL-T95% UCL-TMaximum95% UCL-TMaximum95% UCL-T95% UCL-TMaximum
95% UCL-TMaximum
95% UCL-T95% UCL-T95% UCL-T95% UCL-T95% UCL-T
MediumEPC
Rationale
UCL > Max
UCL > Max
UCL > Max
UCL > Max
Statistics: 95% UCL-T (log-transformed 95% UCL)D=Rcsults from diluted sample.J=Estlmated valueP=Sample vial used in previous analysisn=Multi-component target compound exhibited marginal pattern-matching quality

TABLE 3.2bEXPOSURE POINT CONCENTRATION SUMMARY, SUBSURFACE SOIL, EXPOSURE UNIT 2
AQUA-TECH SITE
Scenario Timeframe:Medium:Exposure Medium:
FutureSubsurface SoilSubsurface Soil
ExposurePoint
Exposure Unit 2
Chemicalof
PotentialConcern
Arsenic
ArithmeticMean-T
Concentration(mg/kg)
N/A
95% UCL-TConcentration
(mg/kg)
N/A
MaximumDetected
Concentration(mg/kg)
6.6
MaximumQualifier
Reasonable Maximum ExposureMedium
EPCValue
(mg/kg)
6.6
MediumEPC
Statistic
Maximum
MediumEPC
Rationale
<10 samples
N/A: Not applicable - statistical analysis is not recommended for data sets having less than 10 samples.
O--JOJ

TABLE 3.3EXPOSURE POINT CONCENTRATION SUMMARY, SEDIMENT, EXPOSURE UNIT 2
AQUA-TECH SITE
Scenario Timeframe:Medium:Exposure Medium:
CurrentSedimentSediment
ExposurePoint
Exposure Unit 2Exposure Unit 2Exposure Unit 2Exposure Unit 2Exposure Unit 2Exposure Unit 2Exposure Unit 2Exposure Unit 2Exposure Unit 2Exposure Unit 2Exposure Unit 2Exposure Unit 2Exposure Unit 2Exposure Unit 2Exposure Unit 2Exposure Unit 2Exposure Unit 2
. Chemicalof
PotentialConcern
AluminumAntimonyAroclor-1248Aroclor-1254ArsenicBariumBenzo(a)anthraceneBenzo(a)pyreneBenzo(b)fluorantheneBenzo(k)fluorantheneChromiumChryseneIronManganeseMercuryThalliumVanadium
ArithmeticMcan-T
Concentration(mg/kg)
8,7751.5
0.0250.026
1.1118
N/AN/AN/AN/A
22N/A10,869
1840.12N/A
23
95% UCL-TConcentration
(mg/kg)
17,2512.9
0.0350.033
2.3688
N/AN/AN/AN/A
43N/A
23,7607590.41N/A
61
MaximumDetected
Concentration(mg/kg)
31,3006.20.170.125.39370.150.160.160.1477
0.1737,1002,6003.63.2105
MaximumQualifier
CB
JJJJJCG
G
Reasonable Maximum ExposureMedium
EPCValue
(mg/kg)
17,2512.9
0.0350.033
2.36880.150.160.160.1443
0.1723,760
7590.413.261
MediumEPC
Statistic
95% UCL-T95% UCL-T95% UCL-T95% UCL-T95% UCL-T95% UCL-TMaximumMaximumMaximumMaximum
95% UCL-TMaximum95% UCL-T95% UCL-T95% UCL-TMaximum95% UCL-T
MediumEPC
Rationale
< 10 Samples< 10 Samples< 10 Samples< 10 Samples
< 10 Samples
< 10 Samples
Statistics: Mean-T (log-transformed arithmetic mean); 95% UCL-T (log-transformed 95% UCL).N/A: Not applicable - statistical analysis is not recommended for data sets having less than 10 samples.j = Estimated Value.G = Duplicated analysis not within control limitsB = Analyte detected in associated method blank
-Cs.

TABLE 3.4EXPOSURE POINT CONCENTRATION SUMMARY, GROUNDWATER , EXPOSURE UNIT 1 AND EXPOSURE UNIT 2
AQUA-TECH SITE
Scenario Timeframe:Medium:
||Exposure Medium:
FutureGroundwaterGroundwater
Point
Exposure Unit 1 and 2Exposure Unit 1 and 2Exposure Unit 1 and 2Exposure Unit 1 and 2Exposure Unit 1 and 2Exposure Unit 1 and 2Exposure Unit 1 and 2Exposure Unit 1 and 2Exposure Unit 1 and 2Exposure Unit 1 and 2Exposure Unit 1 and 2Exposure Unit 1 and 2Exposure Unit 1 and 2Exposure Unit 1 and 2Exposure Unit 1 and 2Exposure Unit I and 2Exposure Unit 1 and 2Exposure Unit 1 and 2Exposure Unit 1 and 2Exposure Unit 1 and 2Exposure Unit 1 and 2Exposure Unit 1 and 2Exposure Unit 1 and 2Exposure Unit 1 and 2Exposure Unit 1 and 2Exposure Unit 1 and 2Exposure Unit 1 and 2Exposure Unit 1 and 2Exposure Unit 1 and 2
rhnm\^\
ofPotentialConcern
AluminumAntimonyArsenicBariumBenzeneBis(2-ethylhexyl) phthalateBromodichloromethaneCarbon tetrachlorideChlorobenzeneChloroethaneChloroformChromiumCobaltDichlorobenzene, 1,4-Dichloroethane, ,1-Dichloroethane, ,2-Dichloroethene, ,1-Dichloroethene, ,2- (cis)Dichloroelhene, ,2- (trans)IronManganeseMethyl tert butyl etherTetrachloroethane, 1.1,2,2-TctrachloroetheneThalliumTrichloroethane, 1,1.1-TrichloroetheneVanadiumVinyl chloride
Ar i thmnt i r
MeanConcentration
(mg/L)
1.90.00650.0050
0.270.021
0.00510.00790.00790.00760.0150.0120.00780.032
0.00830.0530.0130.0180.41
0.00445.112
0.0610.0150.11
0.00730.0720.33
0.00400.031
ns% IICI.-TConcentration
(mg/L)
N/AN/AN/AN/AN/AN/AN/AN/AN/AN/AN/AN/AN/AN/AN/AN/AN/AN/AN/AN/AN/AN/AN/AN/AN/AN/AN/AN/AN/A
MaximumDetected
Concentration(mg/L)
43.10.00620.0287
0.520.0540.011
0.000250.0020.0230.18
0.0790.0260.230.010.140.0280.0940.97
0.003995.42.9
0.0160.036
1.20.0092
0.2GO.C40.0280.084
Maximum 1Qualifier
B
JJ
B
J
J
J
B
B
Reasonable Maximum Exposure ||Medium
EPCValue
(mg/L)
1.90.00620.0050
0.270.021
0.00510.000250.00200.00760.0150.0120.00780.032
0.00830.0530.0130.0180.41
0.00395.12.9
0.0160.0150.11
0.00730.0720.33
0.00400.03 f
MediumEPC
Statistic
MeanMaximum
MeanMeanMeanMean
MaximumMaximum
MeanMeanMeanMeanMeanMeanMeanMeanMeanMean
MaximumMean
MaximumMaximum
MeanMeanMeanMeanMeanMeanMean
MediumEPC
Rationale
Mean>Max
Mean>MaxMean>Max
Mean>Max
Mean>MaxMean>Max
Statistics: Mean-T (log-transformed arithmetic mean); 95% UCL-T (log-transformed 95% UCL).N/A: Not applicable - statistical analysis is not recommended for data sets having less than 10 samples.J = Estimated valueD=Results from diluted sample.P=Samplc vial used in previous analysis
f ""•;
roO--'en

TABLE 3.5EXPOSURE POINT CONCENTRATION SUMMARY, SURFACE WATER, EXPOSURE UNIT 2
AQUA-TECH SITE
Scenario Timeframe:Medium:
||Exposure Medium:
CurrentSurface WaterSurface Water
ExposurePoint
Exposure Unit 2Exposure Unit 2Exposure Unit 2Exposure Unit 2Exposure Unit 2Exposure Unit 2Exposure Unit 2Exposure Unit 2Exposure Unit 2Exposure Unit 2Exposure Unit 2Exposure Unit 2Exposure Unit 2Exposure Unit 2Exposure Unit 2Exposure Unit 2Exposure Unit 2Exposure Unit 2Exposure Unit 2Exposure Unit 2
Chemicalof
PotentialConcern
AcetoneAluminumBenzeneCadmiumChloroformCobaltDi-n-butylphthalateDichloroethane, 1,1-Dichloroethene, 1,2- (total)DieldrinIronManganeseMercuryNickelNitrophenol, 2-TetrachloroetheneTrichloroethane, 1,1,1-TrichloroetheneVanadiumVinyl Chloride
ArithmeticMean-T
Concentration(mg/L)
0.00490.33N/A
0.0034N/A
0.0088N/A
0.00270.0042N/A
1.20.35
0.00010.014N/A
0.00250.00360.00220.0030.0037
95% UCL-TConcentration
(mg/L)
O.OOG71.1
N/A0.24N/AO.OG1N/A
0.00840.023N/A3.450
0.00020.12N/A
0.00810.0090.01
0.0058O.OOG1
MaximumDetected
Concentration(mg/L)
0.0164.17
0.0023.47
0.0010.04370.0010.010.085
0.00003710.57.22
0.0010.100.0020.0120.0050.038
0.01980.009
MaximumQualifier
J
JBBJ
JX
J
J
BJ
Reasonable Maximum ExposureMedium
EPCValue
(mg/L)
0.00671.1
0.0020.24
0.0010.04370.001
0.00840.023
0.0000373.47.22
0.00020.100.0020.00810.0050.01
0.00580.0061
MediumEPC
Statistic
95% UCL-T95% UCL-TMaximum95% UCL-TMaximumMaximumMaximum
95% UCL-T95% UCL-TMaximum
95% UCL-TMaximum
95% UCL-TMaximumMaximum
95% UCL-TMaximum95% UCL-T95% UCL-T95% UCL-T
MediumEPC
Rationale
< 10 Samples
< 10 SamplesUCL > Max
< 10 Samples
< 10 Samples
UCL > Max
UCL > Max< 10 Samples
UCL > Max
Statistics: Mean-T (log-transformed arithmetic mean); 95% UCL-T (log-transformed 95% UCL).N/A: Not applicable - statistical analysis is not recommended for data sets having less than 10 samples.J = Estimated valueB = Analyte detected in associated method blankX = Data entered manually into report-generating software

TABLE 3.GEXPOSURE POINT CONCENTRATION SUMMARY, AIR , EXPOSURE UNIT 1 AND EXPOSURE UNIT 2
AQUA-TECH SITt
Scenario Timeframe:Medium:Exposure Medium:
Current/FuturclAirAir
ExposurePoint
Exposure Unit 1 and 2Exposure Unit 1 and 2
Chemicalof
PotentialConcern
BenzeneVinyl chloride
ArithmeticMean-T
Concentration(mg/m3)
N/AN/A
95% UCL-TConcentration
(mg/mO
N/AN/A
MaximumDetected
Concentration(mg/nf)
0.00071760.0007872
MaximumQualifier
Reasonable Maximum ExposureMedium
EPCValue
(mg/mJJ
0.00071760.0007872
MediumEPC
Statistic
MaximumMaximum
MediumEPC
Rationaler
<10 samples<10 samples
N/A: Not applicable - statistical analysis is not recommended for data sets having less than 10 samples.
C.):V)CM

:"• •"? 7 O•J .L J O
Table 4 Series
Values Used for Daily Intake Calculations

TABLE 4.laVALUES USED FOR DAILY INTAKE CALCULATIONS
AQUA-TECH SITE
[Scenario Tirueframe:Medium:Exposure Medium:
Current/FutureSurface SoilSurface Soil
U 1Exposure Point
Any Exposure Unit 1 orExposure Unit 2 location
ReceptorPopulation
Current/FutureTrespasser/Visitor
KeceptorAge
Adolescent
ExposureRoute
Ingestion
Dermal
parameterCode
CDI
CS
EF
ED
FC
IRU
CF,
BW
AT-NC
AT-C
CDI
CS
EF
ED
FC
SA
AF
DA (organlcs)
DA (InorBanfcO
CF,
BW
AT-NC
AT-C
Poiaim.-^, £>.r...i::or.
Chronic Daily Intake
Concentration in Soil
ixposurc Frequency (EU-1)Exposure Frequency (EU-2)exposure Duration:raction Contacted (ingested or absorbed)'rom contaminated source (assumed 100%)
Oral Ingestion Rate for Soil
Conversion Factor
Body Weight
Averaging Time for noncarcinogens (periodover which exposure is averaged)Averaging Time for carcinogens (period overwhich exposure is averaged)
Clironic Daily Intake
Concentration in Soil
Exposure Frequency[exposure Frequency (EU-2)Exposure DurationFraction Contacted (ingested or absorbed)from contaminated source (assumed 100%)Skin Surface Area available for daily contact
Soil-to-skin Adherence Factor
Dermal Absorption factor for orgnnicsDermal Absorption factor for inorganicsConversion Factor
liody Weight
Averaging Time for noncarcinogens (periodover which exposure is averaged)
Averaging Time for carcinogens (period overwhich exposure is averaged)
'Jr.':1.:
mg/kg -day
mg/kg
days/yeardays/year
years
mg/day
kg/mg
kg
days
days
mg/kg'day
mg/kg
days/yeardays/year
years
cm'
rng/cmVdaj
kg/mg
kg
days
days
Dh,ii:Value
See Table 7. laand Table 7. IbSee Table 3. laand Table 3. Ib
5010010
1
100
l.OE-06
45
3.G50
25,550
See Table 7. laand Table 7. IbSee Table 3. laand Table 3. Ib
5010010
1
3,293
0.2
0.010.001
l.OE-OC
45
3.G50
25,550
BMP
Rationale/Reference
BPJBPJ
U.S. EPA. 1995a
U S EPA 1995a
U.S. EPA, 2000b
N/AU.S. EPA. 1995a;U.S. EPA, 1997
= ED ' 3G5
U.S. EPA, 1989
BPJliPJ
U.S. EPA, 1995a1 1 *\ PP A 1 QQ'iiu.j. cr/\. l3?ja
See Appendix E
U.S. EPA, 1992a;U.S. EPA. 1995a
U.S. EPA, 1995aU.S. EPA, I995a
N/AU.S. EPA, I995a;
U.S. EPA. 1997
= ED • 3G5
U.S. EPA. 1989
IIIntake Eouation/ [|
Model Name
CDI C S x E F x E D x F C x l K o x C F ,BWxAT
„„ C S x E F x E D x F C x S A x A F x D A x C F ,CDI - BWxAT
BPJ Best Professional Judgement. Trespasser exposure frequency based on one ortwo days/week for 50 weeks/year or two or four days/week for half the year.

TABLE 4.IbVALUES USED FOR DAILY INTAKE CALCULATIONS
AQUA-TECH SITE
1Scenario Timeframe: FutureMedium: Surface SoilExposure Medium:___Surface Soil
1 Exoosure Point
Any Exposure Unit 1 orExposure Unit 2 location
ReceptorPopulation
Commercial Worker
ReceptorAge
Adult
ExposureRoute
Ingest ion
Dermal
Parametert^otie
GDI
CS
EF
ED
FC
I*.
CF,
BW
AT-NC
AT-C
CDI
CS
EF
ED
FC
SA
AF
DA (urfpnics)
DA (lnorBanlcs)
CF,BW
AT-NC
AT-C
Parameter Definition
Chronic Daily Intake
Concentration in Soil
Exposure Frequency
ixposurc Duration
•raction Contacted (ingested or absorbed)rotn contaminated source (assumed 100%)
Oral digestion Rate for Soil
Conversion Factor
Body Weight
Averaging Time for noncarcinogcns (periodover which exposure is averaged)
Averaging Time for carcinogens (period overwhich exposure is averaged)
Chronic Daily Intake
Concentration in Soil
Exposure Frequency
Exposure Duration
Fraction Contacted (ingested or absorbed)Iroin contaminated source (assumed 100%)
Skirt Surface Area available for daily contact
Soil-to-skin Adherence Factor
Dermal Absorption factor for organics
Dermal Absorption factor for inorganics
Conversion Factor
Body Weight
Averaging Time for noncarcinogcns (periodover which exposure is averaged)
Averaging Time for carcinogens (period overwhich exposure is averaged)
Units
mg/kg-day
ing/kg
days/year
years
-
ing/day
kg/mg
kg
days
days
mg/kg-day
mg/kg
days /year
years
CM,'
mg/cmVda}
kg/nig
kg
clays
days
RME
See Table 7.2aand Table 7.2b
and Table 3. Ib250
25
1
50
l.OE-06
70
9.125
25.550
See Table 7.2aand Table 7.2bSee Table 3. laand Table 3.1b
250
25
1
2,503
0.3
0.01
0.001
l.OE-OG
70
9.125
25.550
RME
Reference
U.S. EPA. 1995a
U.S. UPA. 1995a
U.S.EPA. 1995a
U.S. EPA. 1995a;U.S. EPA, 1997
N/A
U.S. EPA. 1999
= ED ' 365
U.S. EPA. 1989
U.S. EPA. 1995a
U.S. EPA. 1995a
U.S. EPA, 1995a
See Appendix E
U.S. EPA, 1992a;U.S. EPA. 1995a
U.S. EPA. 1995a
U.S. EPA. 1995a
N/A
U.S. EPA. 1999
= ED ' 365
U.S. EPA. 1989
Intake Equation/
CS x EF x ED x FC x IRn x CF,BWxAT
CSxEFxEDxFCxSAxAFxDAxCF,BWxAT
CD
Page 1 of 5

TABLE 4.IbVALUES USED FOR DAILY INTAKE CALCULATIONS
AQUA-TECH SITE
Scenario Timeframe: Future[Medium: Surface Soil[[Exposure Medium: Surface Soil
Exposure Point
Any Exposure Unit 1 orExposure Unit 2 location
Receptorropuiuuun
Construction Worker
ReceptorABe
Adult
Exposure
Ingest ton
Dermal
Parameter
GDI
CS
EF
ED
FC
IR,,
CF,BW
AT-NC
AT-C
CDI
CS
EF
ED
FC
SA
AF
DA (organlcs)
DA (Inorganics)
CF,
BW
AT-NC
AT-C
Parameter Definition
Chronic Daily Intake
Conccuirauoji in Soii
Exposure Frequency
Exposure Duration
•"faction Contacted (ingested or absorbed)from contaminated source (assumed 100%)
Oral Ingestion Rate for Soil
Conversion Factor
Body Weight
Averaging Time for noncarcinogens (periodover which exposure is averaged)Averaging Time for carcinogens (period overwhich exposure is averaged)
Chronic Daily Intake
Concentration in Soil
Exposure Frequency
Exposure Duration
Fraction Contacted (ingested or absorbed)from contaminated source (assumed 100%)
Skin Surface Area available for daily contact
Soil-to-skin Adherence Factor
Dermal Absorption factor for organics
Dermal Absorption factor for inorganics
Conversion Factor
Body WeightAveraging Time for noncarcinogens (period
Averaging Time for carcinogens (period overwhich exposure is averaged)
Units
mg/kg'day
ing/kg
days/year
years
nig /day
kg/mg
*g
days
days
mg/kg-day
nig /kg
days/year
years
cm'
mg/cmVday
ky/mg
kg
days
days
RMKW-l..,,
See Table 7.6aand Table 7.GbSee Table 3. laand Table 3. Ib
250
0.33
1
195
l.OE-00
70
122
25.550
Sec Table 7.Caand Table 7.GbSee Table 3.1aand Table 3. Ib
250
0.33
1
5.000
0.5
0.01
0.001
l.OE-OG
70
122
25.550
RMED.,i;r..,rtU/
Reference
U.S. EPA. 1995a
BPJ (1)
U.S. EPA. 1995a
U.S. EPA. 1997:BPJ (2)
N/A
U.S. EPA, 1999
= ED • 365
U.S. EPA, 1989
U.S. EPA. 1995a
BPJ (1)
U.S.EPA, 1995a
U.S. EPA, 1997
U.S.EPA. IBSZa:U.S. EPA. 1995a
U.S. EPA. 1995a
U.S. EPA. I995a
N/A
U.S. EPA. 1999
= ED ' 365
U.S. EPA. 1989
Intake Equation/MnHdl NaniP
„_, CSxEFxEDxFCxIR0xCF,CDI" BWxAT
CSxEFxEDxFCxSAxAFxDAxCF,BWxAT
Page 2 of 5

TABLE 4.1bVALUES USED FOR DAILY INTAKE CALCULATIONS
AQUA-TECH SITE
Scenario Timeframe:Medium:
[[Exposure Medium:
FutureSurface SoilSurface Soil
Exposure Point
Any Exposure Unit 1 orExposure Unit 2 location
Receptor"wpuimtuM
Resident
Receptor'"•B'-
Adult
Child
Exposure"CL;."C
Ingestion
Derma)
Ingestion
ParameterCc;.'c
CDl
CS
EFED
FC
IR,CF,BW
AT-NC
CDI
CS
EFED
FC
SA
AF
DA (orRanlrs)
DA (ii»o/ya;ifts)
CF,BW
AT-NC
CDI
CS
EFF.D
FC
IR,,CF,BW
AT-NC •
Parameter Definition Units
Chronic Daily Intake
Concentration In Soil
Exposure FrequencyExposure Durationrraction Contacted (ingested or absorbed)rom contaminated source (assumed 100%)
Oral Ingestion Rate for Soil
Conversion Factor
Body Weight
Averaging Time for noncarcinogens (periodover which exposure is averaged)
Chronic Daily Intake
Concentration in Soil
Exposure FrequencyExposure Duration•raction Contacted (ingested or absorbed)
Skin Surface Area available for daily contact
Soil-to-skin Adherence Factor
Dermal Absorption factor for organics
Dermal Absorption factor for inorganicsConversion FactorBody Weight
Averaging Time for noncarcinogens (periodover which exposure is averaged)
Chronic Daily Intake
Concentration in Soil
Exposure Frequency
Exposure DurationFraction Contacted (ingested or absorbed)from contaminated source (assumed 100%)Oral Ingestion Rate for Soil
Conversion Factor
Body Weight
Averaging Time for noncarcinogens (periodover which exposure is averaged)
mg/kg -day
mg/kg
days /yearyears
mg/day
kg/mg
kg
days
mg/kg-day
mg/kg
days/yearyears
cm'
ing/cinz/day
kg/mg
kg
days
rng/kg'day
mg/kg
days/yearyears
mg/day
kg/mg
kg
days
RMEVtl..,,
See Table 7.4aand Table 7.4bSee Table 3.1aand Table 3. Ib
35024
1
100
l.OE-OG
70
8.7CO
Sec Table 7.4aand Table 7.4bSee Table 3.1aand Table 3.1b
35024
1
4.508
0.2
0.010.001
l.OE-0670
8.7GO
See Table 7.3aand Table 7.3bSee Table 3. laand Table 3. Ib
350G
1
200l.OE-OG
15
2.190
RMEDt.tln.talo/
Reference
U.S. EPA. 1995aU.S. EPA. 1995a
U.S. EPA. 1995a
U.S. EPA. 1995a
N/AU.S. EPA. 1999
= ED ' 365
U.S. EPA. 1995aU.S. EPA, 1995a
U.S. EPA. 1995a
See Appendix E
U.S. EPA. 1992a:U.S. EPA. 1995
U.S. EPA. 1995aU.S. EPA, 1995a
N/AU.S. EPA. 1999
= ED • 365
U.S. EPA. 1995aU.S. EPA. 1995a
U.S. EPA. 1995a
U.S. EPA. 1995aN/A
U.S. EPA. 1999
= ED ' 3G5
Intake Equation/MnHol IMamp
„„. CSxEFxEDxFCxIR0xCF,""' ~ BWxAT
C S x E F x E D x F C x S A x A F x D A x C F ,BWxAT
CSxEFxEDxFCxIR, ,xCF,BW x AT
V.O
Page 3 of 5

TABLE 4.1bVALUES USED FOR DAILY INTAKE CALCULATIONS
AQUA-TECH SITE
pcenario Timeframe: FutureMedium: Surface Soil
[[Exposure Medium: Surface Soil
1} Exposure Point
Any Exposure Unit 1 orExposure Unit 2 location
Receptorrupuimiun
Resident
Receptor
Child
Aggregate
Exposure
Dermal
Ingestlon
Parameter
' GDI
CS
EFED
FC
SA
AF
DA (urganlcs)
DA (imwBanlci)
CF,
BW
AT-NC
GDI
CS
EFED
FC
IR,,CF,BW
AT-C
Parameter Definition
-hronic Daily Intake
Concentration in Soil
Exposure FrequencyExposure DurationFraction Contacted (ingested or absorbed)Vom contaminated source (assumed 100%)
Skin Surface Area available for daily contact
Soil-to-skin Adherence Factor
Dermal Absorption factor for organicsDerma] Absorpli'on factor for inorganics
Conversion FactorBody WeightAveraging Time for noncarcinogens (period
Chronic Daily Intake
Concentration in Soil
Exposure Frequency
Exposure DurationFraction Contacted (ingested or absorbed)from contaminated source (assumed 100%)Oral Ingestion Rate for SoilConversion FactorBody Weight
Averaging Time for carcinogens (period overwhich exposure is averaged)
Units
mg/kg-day
iTKT/lm"•o- "o
days/yearyears
cm2
nig/cmVday
kg/ing
kg
days
mg/kg-day
nig/kg
days/yearyears
ing/day
kg/mg
kg
days
RMEValue
See Table 7.3aand Table 7.3bSee Table 3. laand Table 3. Ib
350G
1
1,720
0.2
0.010.001
l.OU-0615
2.190
See Table 7.5aand Table 7.5bSee Table 3. laand Table 3. Ib
35030
1
120I.OE-06
59
25.550
RMERationale/Reference
U.S. EPA. 1995aU.S. EPA, 1995a
U.S. EPA, 1995a
See Appendix E
U.S. EPA, 1992a:U.S. EPA. 1995a
U.S. EPA. 1995aU.S. EPA. 1995a
N/AU.S. EPA. 1999
= ED • 305
U.S. EPA, 1995aU.S. EPA. 1995a
U.S. EPA. 1995a
See Appendix EN/A
See Appendix E
U.S. EPA, 1389
Intake Equation/Model Name
CS x EF x ED x FC x SA x AF x DA x CF,CDI" BWxAT
CSxEFxEDxFCxIR,,xCF,BWxAT
Page 4 of 5

TABLE 4.IbVALUES USED FOR DAILY INTAKE CALCULATIONS
AQUA-TECH SITE
pcenario Timeframe: FutureMedium: Surface Soil
{[Exposure Medium: jurfaceSoil
Exposure Point
Any Exposure Unit 1 orExposure Unit 2 location
Receptor
Resident
Receptor- -u
Aggregate
Exposure
Dermal
Parameter
GDI
CS
EFED
FC
SA
AF
DA (organic*)
DA (finir|;aiilcs)
CF,
BW
AT-C
Parameter Definition
Chronic Daily Intake
Concentration 'n Soil
Exposure FrequencyExposure Duration
Fraction Contacted (ingested or absorbed)from contaminated source (assumed 100%)
Skin Surface Area available for daily contact
Soil-to-skin Adherence Factor
Dermal Absorption factor for organicsDerma] Absorption factor for inorganics
Conversion Factor
Body Weight
Averaging Time for carcinogens (period overwhich exposure is averaged)
Units
mg/kg -day
mg/kg
days/yearyears
--
cm2
mg/cmz/day
--
kg/mg
kg
days
RMEValue
See Table 7.5aand Table 7.5bSee Table 3.1aand Table 3. ib
35030
1
3.950
0.2
0.010.001
l.OE-OG
59
25.550
RMERationale/Reference
U.S. EPA. 1995aU.S. EPA. 1995a
U.S. EPA. 1995a
See Appendix E
U.S. EPA. 1992a;U.S. EPA. 1995aU.S. EPA. 1995aU.S. EPA, 1995a
N/A
See Appendix E
U.S. EPA. 1989
Intake Equation/Model Name
„„, CSxEFxEDxFCxSAxAFxDAxCF,CD1 - BVVxAT
BPJ (1) Best Professional Judgement. Construction duration of four months (0.33 year) assumed for early phase, intense exposure to uncovered media.BPJ (2) Best Professional Judgement. Ingestion rate based on one month of intense exposure at 480 mg/day and three months at 100 nig/day.
N/A Not Applicable.
f n
O
ro
Pago 5 of 5
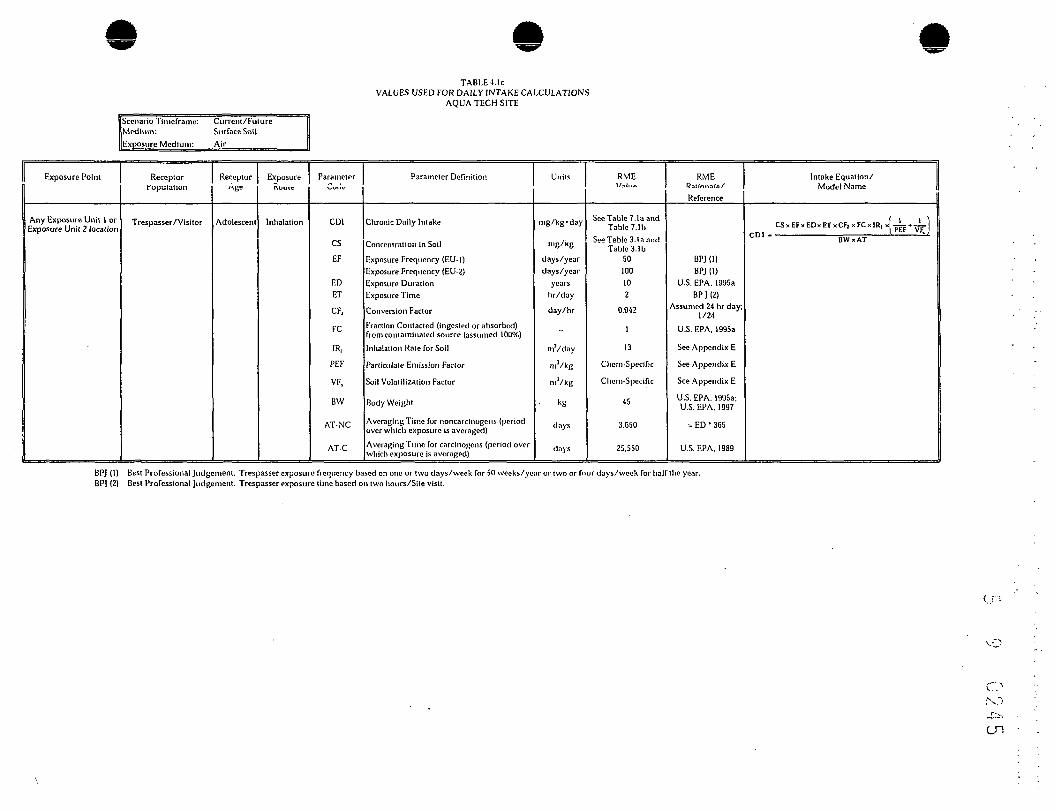
TABLE 4.IcVALUES USED FOR DAILY INTAKE CALCULATIONS
AQUA-TECH SITE
'Scenario Tiincframe: Current/Future,Mcdluin: Surface SoilExposure Medium: Air________
j Exposure Point
Any Exposure Unit 1 orExposure Unit 2 location
ReceptorPopulation
Trespasser/Visitor
ReceptorAge
Adolescent
Exposurei\uuie
Inhalation
Parameter
GDI
CSEF
EDET
CF,
FC
IR.PEF
VF,
BW
AT-NC
AT-C
Parameter Definition
Chronic Daily Intake
Concentration in Soil
Exposure Frequency (EU-1)Exposure Frequency (EU-2)Exposure DurationExposure Time
Conversion FactorFraction Contacted {ingested or absorbed)from contaminated source (assumed 100%)Inhalation Rate for Soil
Paniculate Emission Factor
Soil Volatilization Factor
Body Weight
Averaging Time for noncarcinogens (periodover which exposure is averaged)Averaging Time for carcinogens (period overwhich exposure is averaged)
Units
mg/kg'day
ing/kg
days /yeardays /year
yearshr/day
day/hr
-
mVday
rnVkg
mVkg
• kg
days
days
RMEVI.I.K.
See Table 7. la andTable 7.1b
See Table 3. la nnriTable 3.1b
50100102
0.042
1
13
diem-Specific
Chcin-Spccific
45
3.C50
25.550
RMERationale/
Reference
BPJ (1)BPj (1)
U.S. EPA. 1995aBPJ (2)
Assumed 24 hr day;1/24
U.S. EPA. 1995a
See Appendix E
See Appendix E
See Appendix E
U.S. EPA. 1995a;U.S. EPA, 1997
= ED ' 365
U.S. EPA. 1989
Intake Equation/Model Name
CSxEFxEDxETxCF,xFCxlR,x[ - i - + .-L]C BWxAT
BPJ (1)BPJ (2)
Best Professional Judgement. Trespasser exposure frequency ba:Best Professional Judgement. Trespasser exposure time based 01
iscd on one or two days/week for 50 wocks/yenr or two or four days/week for balf the year.>n two hours/Sile visit.
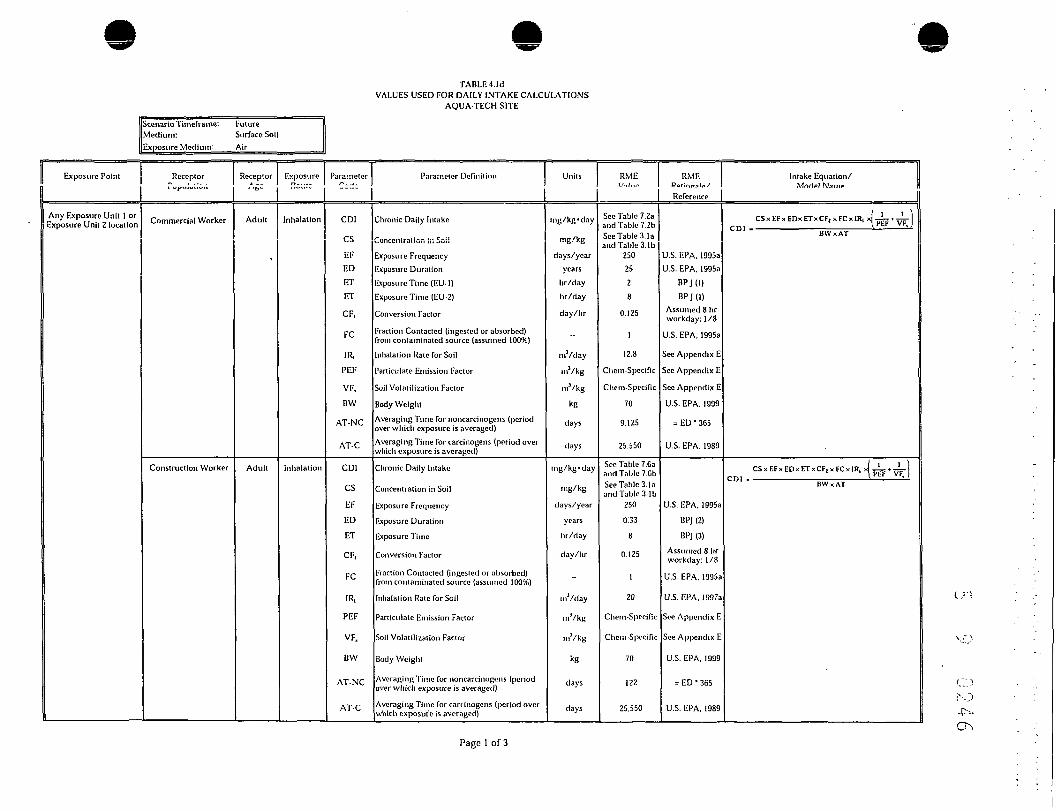
TABLE 4.1<1VALUES USED FOR DAILY INTAKE CALCULATIONS
AQUA-TECH SITE
1Scenario Tiineframe:Medium:Exposure Medium:
FutureSurface SoilAir
Exposure Point
Any Exposure Unit 1 orExposure Unit 2 location
Receptor
Commercial Worker
Construction Worker
Receptor- •&*•
Adult
,
Adult
Exposure
Inhalation
Inhalation
Parameter
CDI
CS
EFEDETET
CF,
FC
IR,
PEF
VF,
BW
AT-NC
AT-C
CDI
CS
EF
ED
ET
CF,
FC
IR,
PEF
VFS
BW
AT-NC
AT-C
Parameter Definition
Chronic Daily Intake
Concentration in Soil
Exposure Frequency
Exposure Duration
Exposure Time (EU-1)
IxposureTime (EU-2)
Conversion Factor
Fraction Contacted (ingested or absorbed)Yom contaminated source (assumed 100%)
Inhalation Rate for Soil
Participate Emission Factor
Soil Volatilization Factor
Body Weight
Averaging Time for noncarcinogens (periodover which exposure is averaged)
Averaging Time for carcinogens (period overwhich exposure is averaged)
Chronic Daily Intake
Concentration in Soil
Exposure Frequency
Exposure Duration
Exposure Time
Conversion Factor
Fraction Contacted (ingested or absorbed)from contaminated source (assumed 100%)
Inhalation Rate for Soil
Paniculate Emission Factor
Soil Volatilization Factor
Body Weight
Averaging Time for noncarcinogens (periodover which exposure is averaged)
Averaging Time for carcinogens (period overwhich exposure is averaged)
Units
ing/kg'day
mg/kg
days/year
years
hr/day
hr/day
day/hr
-
in1 /day
mVkg
mVkg
kg
days
days
mg/kg -day
mg/kg
days /year
years
hr/day
day/hr
mVday
mVkg
mVkg
kg
clays
days
RMEVnl....
Sec Table 7.2aand Table 7.2bSee Table 3. laand Table 3.1b
250
2528
0.125
1
12.8
Cliem-Spccific
Chcm-Specific
70
9.125
25.550
See Table 7.6aand Table 7.CbSec Table 3.1aand Table 3. Ib
250
0:33
8
0.125
1
20
Chern-Specific
Cbein-Spccific
70
122
25,550
RMEPa.m,,alo/
Reference
U.S. EPA. 1995a
U.S. EPA. 1995a
BPJ(l)BPJ(l)
Assumed 8 hrworkday; 1/8
U.S. EPA. 1995a
See Appendix E
See Appendix E
See Appendix E
U.S. EPA. 1999
= ED • 365
U.S. EPA. 1989
U.S. EPA. 1995a
BPJ (2)
BPJ (3)
Assumed 8 hrworkday: 1/8
U.S. EPA. 1995a
U.S. EPA. 1997a
See Appendix E
See Appendix E
U.S. EPA. 1999
= ED • 305
U.S. EPA. 1989
Intake Equation/Mnrlf*! Name if
CSxEFxEDxETxCF,xFCxIR, x J^.f.A-
BWxAT
CSxEFxEDxETxCF,xFCxIR, x pgp + -j
BWxAT
C.V)f-'l
Page 1 of 3

eTABLE 4.Id
VALUES USED FOR DAILY INTAKE CALCULATIONSAQUA-TECH SITE
Scenario Timeframe: FutureMedium: Surface SoilExposure Medium:___Air_____
Exposure Point
Any Exposure Unit 1 orExposure Unit 2 location
ReceptorPopulation
Resident
ReceptorAge
Adult
Child
Exposure Parameter Parameter DefinitionKoute 1 t^oue |! I
Inhalation
Inhalation
CDI
CS
EFEDET
CF,
FC
IR,
PEF
VF,BW
AT-NC
CDI
CS
EFEDET
CF,
FC
IR,
PEF
VF,BW
AT-NC
Chronic Daily Intake
Concentration in Soil
Zxposure FrequencyExposure DurationExposure Time
Conversion Factor
Fraction Contacted (ingested or absorbed)from contaminated source (assumed 100%)
Inhalation Rate Tor Soil
Paniculate Emission Factor
Soil Volatilization Factor
Body WeightAveraging Time for noncarcinogons (periodover which exposure is averaged)
Chronic Daily Intake
Concentration in Soil
Exposure FrequencyExposure DurationExposure Time
Conversion Factor
Fraction Contacted (ingested or ahsorhcd)from contaminated source (assumed 100%)
Inhalation Rale for Soil
Participate Emission Factor
Soil Volatilization Factor
Body WeightAveraging Time for noncarcinogi'iis (periodover which exposure is averaged}
Units
nig/kg- day
mg/kg
days/yearyears
lir/day
day/hr
mVday
mVkg
m'/kg
kg
days
mg/kg -day
mg/kg
days/yearyears
hr/day
day/hr
mVday
mVkg
mVkg
kg
days
RMEYc!;:c
Sec Table 7.4aand Table 7.4bSec Table 3 '••and Table 3.1b
3502424
0.042
1
13.25
Chem-Specific
Chcm-S pacific
70
8.760
See Table 7.3aand Table 7.3bSee Table 3. laand Table 3. Ib
350e
24
0.042
1
8.08
Chem-Spccific
Chem-Specific
15
2.190
RME"2t!^::~!:/Reference
U.S. EPA. 1995aU.S. EPA. 1995a
BPJ (4)
Assumed 24 hrday; 1/24
U.S. EPA. 1995a
See Appendix E
See Appendix E
See Appendix E
U.S. EPA. 1999
= ED ' 365
U.S. EPA. 1995aU.S. EPA, 1995a
BPJ (4)
Assumed 24 hrday: 1/24
U.S. EPA. 1995a
See Appendix E
Sec Appendix E
See Appendix E
U.S. EPA, 1999
= ED • 365
IIIntake Equation/
M™lnl M9r»o 11
CSxEFxEDxETxCFjxFCxIR, x v^lCDI- ——————————— iWTTf —————————
CSxEFxEDxETxCF IxFCxIR,xf. ji ;t^L-j
CDI " BWxAT
C7>ro
Page 2 of 3

TABLE 4.IdVALUES USED FOR DAILY INTAKE CALCULATIONS
AQUA-TECH SITE
[Scenario Timeframe: FutureMedium: Surface Soil.Exposure Medium:___Air_____
Exposure Point
Any Exposure Unit 1 orExposure Unit 2 location
Receptorr-p-^r.
Resident
ReceptorAsc
Aggregate
Exposure
Inhalation
Parameter
GDI
CS
EFEDET
CF,
FC
IR,
PEF
VF,BW
AT-C
Parameter Definition
Chronic Daily Intake
Concc-nlraiion in Sol!
Exposure Frequency
Exposure DurationExposure Time
Conversion Factor
Fraction Contacted (ingested or absorbed)from contaminated source (assumed 100%)
Inhalation Rate for Soil
Paniculate Emission Factor
Soil Volatilization Factor
Body Weight
Averaging Time for carcinogens (period overwhich exposure is averaged)
Units
mg/kg-day
H*l /\fCI•••o- -0
days /yearyears
hr/day
day/hr
mVday
mVkg
mVkg
kg
days
RME\/-,i..rt
See Table 7.5aand Table 7.5bSee Table 3.1aand Table 3.1b
350302-1
0.042
1
12.22
Chem-Specific
diem-Specific
59
25.550
RMEP*i:n,,9la/Reference
U.S. EPA. 1995aU.S. EPA. 1995a
BPJ (4)Assumed 24 hr
day; 1/24
U.S. EPA. 1995a
See Appendix E
See Appendix E
See Appendix ESee Appendix E
U.S. EPA, 1989
Intake Equation/Mnrt«1 Name
CSxEFxEDxETxCF.xFCxIR, x(^l= + ri-lGDI * ———————————————————— — — — -—^
BWxAT
BPJ (1) Best Professional Judgement. Exposure time based on two hours/day in EU-1 and 8 hours/day in EU-2 based on future development plans.BPJ (2) Best Professional Judgement. Construction duration of four months (0.33 year) assumed for early phase, intense exposure to uncovered media.BPJ (3) Best Professional Judgement. Exposure time based on typical 8-hr workday.BPJ (4) Best Professional Judgement. Exposure time for all residents conservatively based on spending 2-1 hours/day at home.
N;4^-CO
Page 3 of 3

[Scenario Timefrarne:Medium:Exposure Medium:
FutureSubsurface SoilSubsurface Soil
TABLE 4.2aVALUES USED FOR DAILY INTAKE CALCULATIONS
AQUA-TECH SITE
1 1TV,w»..r»Dni..l
Any Exposure Unit I orExposure Unit 2 .nratfcr.
Pcwentnr
Population
Construction Worker
RwpntnrAge
Adult
RxoosureRoute
Ingcstion
Dermal
ParameterCode
CDI
CS
EF
ED
FC
IR,.
CF,BVV
AT-NC
AT-C
CDI
CS
EF
ED
FC
SA
AF
DA (organic*)
DA<lnorBanM
CF,BW
AT-NC
AT-C
Parameter Definition
Chronic Daily Intake
Concentration in Soil
Exposure Frequency
Exposure Duration
Fraction Contacted (ingested or absorbed)from contaminated source (assumed 100%)
Oral Ingcstion Rate for Soil
Conversion Factor
Body Weight
Averaging Time for noncarcinogens (periodover which exposure is averaged)
Averaging Time for carcinogens (period overwhich exposure is averaged)
Chronic Daily Intake
Concentration in Soil
Exposure Frequency
Exposure Duration
Fraction Contacted (ingested or absorbed)
Skin Surface Area available for daily contact
Soil-to-skin Adherence Factor
Dermal Absorption factor for organics
Dermal Absorption factor for inorganics
Conversion Factor
Body Weight
Averaging Time for noncarcinogens (period
Averaging Time for carcinogens (period overwhich exposure is averaged)
Units
rng/kg-day
mg/kg
days/year
years
mg/clay
kg/rug
kg
days
days
mg/kg'day
mg/kg
days/year
years
cm'
mg/cmVday
-
kg/mg
kg
clays
days
RMEValue
See Table 7.6b
See Table 3.2
250
0.33
j
195
l.OE-OG
70
122
25.550
Sec Table 7.Gb
See Table 3.2
250
0.33
1
.5.000
0.5
0.01
0.001
l.OE-OG
70
122
25.550
RMEKationaie/Reference
U.S. EPA. 1995a
BPJ
U.S. EPA. 1995a
U.S. EPA. 1997:Appendix E
N/A
U.S. EPA. 1999
= ED ' 365
U.S. EPA. 1989
U.S. EPA. 1995a
BPJ
U.S. EPA. 1995a
U.S. EPA. 1997
U.S. EPA. 1992a:U.S. EPA. 1995a
U.S. EPA. 1995a
U.S. EPA. I995a
N/A
U.S. EPA. 1999
= ED ' 365
U.S. EPA. 1989
Intake Equation/iviouei i\iniie
CS x EF x ED x FC x IRn x CF,BWxAT
CS x EF x ED x FC x SA x AF x DA x CF,BW x AT
BPJN/A
Best Professional Judgement. Construction duration of four months (0.33 year) assumed for early phase, intense exposure to uncovered media.Not Applicable.

TABLE 4.2bVALUES USED FOR DAILY INTAKE CALCULATIONS
AQUA-TECH SITE
[Scenario Timeframe: FuturejMedium: Subsurface Soil[Exposure Medium: Air_______
1 P~.,,,c...., P,,i,,r
Any Fjcposure Unit 1 orExposure Unit 2 location
RprtmtorPopulation
Construction Worker
ReceotorAge
Adult
ExoosureRoute
Inhalation
ParameterCode
GDI
CS
EF
ED
ET
CF,
FC
IR,
PEF
VF,
BW
AT-NC
AT-C
Parameter Definition
Chronic Daily Intake
Concentration in Soil
Exposure Frequency
Exposure Duration
Exposure Time
Conversion Factor
Fraction Contacted (ingested or absorbed)from contaminated source (assumed 100%)
Inhalation Rate for Soil
Paniculate Emission Factor
Soil Volatilization Factor
Body Weight
Averaging Time for noncarcinogens (periodover which exposure is averaged)
Averaging Time for carcinogens (period overwhich exposure is averaged)
Units
mg/kg-day
mg/kg
clays/year
years
hr/day
day/hr
inVday
mVkg
mVkg
kg
days
days
RMEvalue
See Table 7.0b
Sec Table 3.2
250
0.33
8
0.125
1
20
Chcm-Specific
Chem-Specific
70
122
25.550
.RMEnmionaie/HeTerence
U.S. EPA. I995a
BPJ (1)
BPJ (2)
Assumed 8 hrday; 1/8
U.S. EPA, 1995a
U.S. EPA. 1997
See Appendix E
See Appendix E
U.S. EPA. 1999
= ED ' 305
U.S. EPA. 1989
Intake Eqilatloli/
CSxEFxEDxETxCFzxFCxlR, x .pL -LICDI " hwxA-?-
BPJ (1)BPJ (2)
Best Professional Judgement. ConslBest Professional Judgement. Expo:
itructlon duration of four months (0.33 year) assumed for early phase, intense exposure to uncovered media,isure time based on typical 8-hr workday.
CT>roenCD

TABLE 4.3aVALUES USED FOR DAILY INTAKE CALCULATIONS
AQUA-TECH SITE
Scenario Timeframc: Current/FutureMedium: SedimentExposure Medium: Sediment____
exposure Ponu
Selected ExposureUnit 2 locations
KCCL'plOr
Population
Trespasser/Visitor
Age
Adolescent
Route
Ingestion
Dermal
~
Code
GDI
CSEFED
FC
IR*
CF,
BW
AT-NC
AT-C
CDICSEFED
FC
SA
AF
DA (organ Ics)
DA (Inorganics)
CF,
BW
AT-NC
AT-C
"-,_... . . _ _ r»_r:. .!.:_..
Chronic Daily Intake
-oncentration in Sedimentexposure Frequencyixposure Durationfaction Contacted (ingested or absorbed)"rom contaminated source (assumed 100%)
Oral Ingestion Rate for Sediment
Conversion Factor
iody Weight
Averaging Time for noncarcinogens (periodover which exposure Is averaged)
Averaging Time for carcinogens (period overwhich exposure is averaged)
Chronic Daily Intake
Concentration in SedimentExposure FrequencyExposure DurationFraction Contacted (ingested or absorbed)from contaminated source (assumed 100%)
Skin Surface Area available for daily contact
Sediment-to-skin Adherence Factor
Dermal Absorption factor for organicsDermal Absorption factor for inorganics
Conversiojj Factor
Body Weight
Averaging Time for noncarcinogens (periodover which exposure is averaged)
Averaging Time for carcinogens (period overwhich exposure is averaged)
1 !.,!!.-
mg/kg 'day
mg/kgdays/year
years
-
mg/day
kg/mg
kg
days
days
mg/kg -daymg/kg
days/yearyears
cm'
mg/cm /da}
kg/ing
kg
days
days
PH/IC
Value
Sec Table 7.2b
See Table 3.310010
1
100
l.OE-OG
45
3.C50
25,550
Sec Table 7.2bSee Table 3.3
10010
1
3.293
0.2
0.010.001
l.OE-OG
45
3.G50
25.550
RMP
Rationale/Reference
BPJU.S. EPA. 1995a
U.S. EPA. 1995a
U.S. EPA, 1995a;U.S. EPA, 1997
N/A
U.S. EPA, 1995a;U.S. EPA. 1997
= ED • 3G5
U.S. EPA, 1989
BPJU.S. EPA. 1995a
U.S. EPA. 1995a
See Appendix F_
U.S. EPA. 1992a:U.S. EPA. I995aU.S. EPA. 1995aU.S. EPA. 1995a
N/A
U.S. EPA. 1995a:U.S. EPA. 1997
= ED • 3G5
U.S. EPA, 1989
Itttfllip Rniiallnn/ IIModel Name
__ . CSxkFxEDxFCxIR 0xCF,CDI = BWxAT
CSxEFxEDxFCxSAxAFxDAxCF,BWxAT
NOTE: Sediment exposure to humans conservatively set equivalent to surface soil exposure (U.S. EPA. 1995a).BPJ Best Professional Judgement. Trespasser/visitor exposure frequency based on two days/week for 50 weeks/year or 4 days/week for half the year.
N/A Not Applicable.

TABLE 4.3bVALUES USED FOR DAILY INTAKE CALCULATIONS
AQUA-TECH SITE
Exposure Point
Any Exposure Unit 2location
Scenario Timeframe: Future IIvledium: Sediment 11Exposure Medium: Sediment |
ReceptorPopulation
Construction Worker
ReceptorAge
Adult
ExposureRoute
Ingestion
Dermal
ParameterCode
CDI
CS
EF
ED
FC
IR,
CF,
BW
AT-NC
AT-C
CDI
CS
EF
ED
FC
SA
AF
DA (iirt-aniiA)
DA (lnorBank,s>
CF,
BW
AT-NC
AT-C
Parameter Definition
Chronic Daily Intake
Concentration in Sediment
Exposure Frequency
Exposure Duration
Fraction Contacted (ingested or absorbed)rrom contaminated source (assumed 100%)
Oral Ingestion Rate for Sediment
Conversion Factor
Body Weight
Averaging Time for noncarcinogens (periodover which exposure is averaged)
Averaging Time for carcinogens (period overwhich exposure is averaged)
Chronic Daily Intake
Concentration in Sediment
Exposure Frequency
Exposure Duration
Fraction Contacted (ingested or absorbed)from contaminated source (assumed 100%)
Skin Surface Area available for daily contact
Sectiinent-to-skin Adherence Factor
Dermal Absorption factor for organics
Dermal Absorption factor for inorganics
Conversion Factor
Body Weight
Averaging Time for noncarcinogens (periodover which exposure is averaged)
Averaging Time for carcinogens (period overwhich exposure is averaged)
Units
mg/kg-day
mg/kg
days /year
years
mg/day
kg/mg
kg
days
days
mg/kg*day
mg/kg
days /year
years
cm2
mg/cmVday
kg/mg
kg
days
days
RMEValue
See Table 7.6b
See Table 3.3
250
0.33
0.1
195
l.OE-06
70
122
25.550
Sec Table 7.6b
Sec Table 3.3
250
0.33
0.1
5,000
0.5
0.01
0.001
l.OE-06
70
122
25.550
RMIJ.Ralloriale/
U.S. EPA. 1995a
BPJ (1)
BPJ (2)
U.S. EPA. 1997;BPJ (3)
N/A
U.S. EPA. 1999
= ED • 365
U.S. EPA. 1989
U.S. EPA. 1995a
BPJ (1)
BPJ (2)
U.S. EPA. 1997
U.S. EPA. 1992a:U.S. EPA. 1995a
U.S. EPA. 1995a
U.S. EPA. 1995a
N/A
U.S. EPA. 1999
= ED • 365
U.S. EPA. 1989
Intake tdliatlon/Modfel Name
_ . CSxEFx tDxFCx lR jXCF,CDI " BWxAT
C S x E F x E D x F C x S A x A F x D A x C F ,BWxAT
c_nro
NOTE: Sediment exposure to humans conservatively set equivalent to surface soil exposure (U.S. EPA, I995a).BPJ (1) Best Professional Judgement. Construction duration of four months (0.33 year) assumed for early phase, intense exposure to uncovered media.BPJ (2) Best Professional Judgement. Fraction Contacted for sediment assumed to be 10%. based on limited area of impact and unlikely construction area.BPJ (3) Best Professional Judgement. Ingestion rate based on one month of intense exposure at 480 mg/day and three months at 100 ing/day.
N/A Not Applicable.
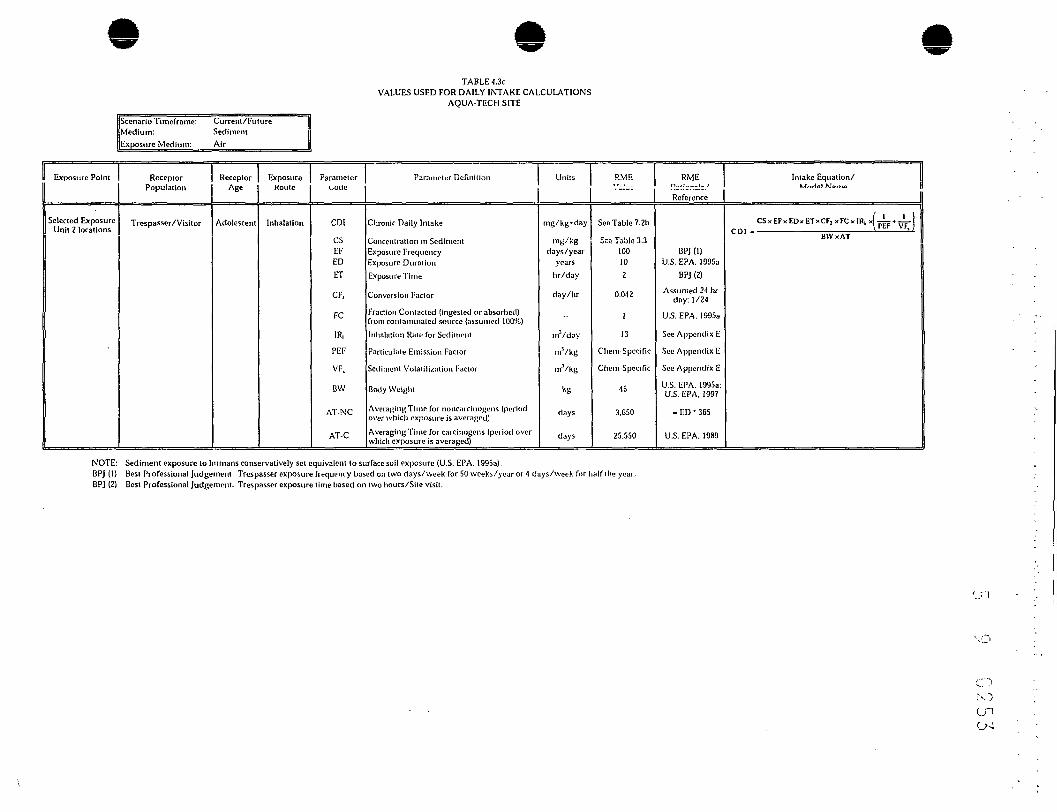
TABLE 4.3cVALUES USED FOR DAILY INTAKE CALCULATIONS
AQUA-TECH SITE
(Scenario Timeframe: Current/Future(Medium: Sediment[[Exposure Medium: J\ir________
1 Exposure Point
Selected ExposureUnit 2 locations
ReceptorPopulation
Trespasser/ Visitor
ReceptorAge
Adolescent
ExposureKoute
Inhalation
Parameteruocie
CD!
CSEFEDET
CF,
FC
IR,
PEF
VF,
BW
AT-NC
AT-C
Parameter Definition
Chronic Daily Intake
Concentration in SedimentExposure FrequencyExposure DurationExposure Time
Conversion Factor
Fraction Contacted (ingested or absorbed)from contaminated source {assumed 100%)
Inhalation Rate for Sediment
Participate Emission Factor
Sediment Volatilisation Factor
Body Weight
Averaging Time for noncarcinogens (periodover which exposure is averaged)
Averaging Time for carcinogens (period overwhich exposure is averaged)
Units
mg/kg-day
mg/kgdays/year
yearshr/day
day/hr
mVday
m'/kg
mVkg
kg
days
(lays
RME
See Table 7.2b
See Table 3.3100102
0.042
1
13
Chem-Spccific
diem-Specific
45
3.G50
25.550
RME
Reference
BPJ (1)U.S. EPA. 1995a
BPJ (2)
Assumed 24 hrday; 1/24
U.S. EPA. 1995a
See Appendix E
See Appendix E
See Appendix E
U.S. EPA. 1995a:U.S. EPA. 1997
= ED • 365
U.S. EPA. 1989
Intake Equation/
GDI - ———————————————————— ————— BWxAT
NOTE: Sediment exposure to humans conservatively set equivalent to surface soil exposure (U.S. EPA. 1995a).BPJ (1) Best Professional Judgement. Trespasser exposure frequency based on two days/week for 50 weeks/year or 4 days/week for half the year.BPJ (2) Best Professional Judgement. Trespasser exposure time based on two hours/Site visit.
roen
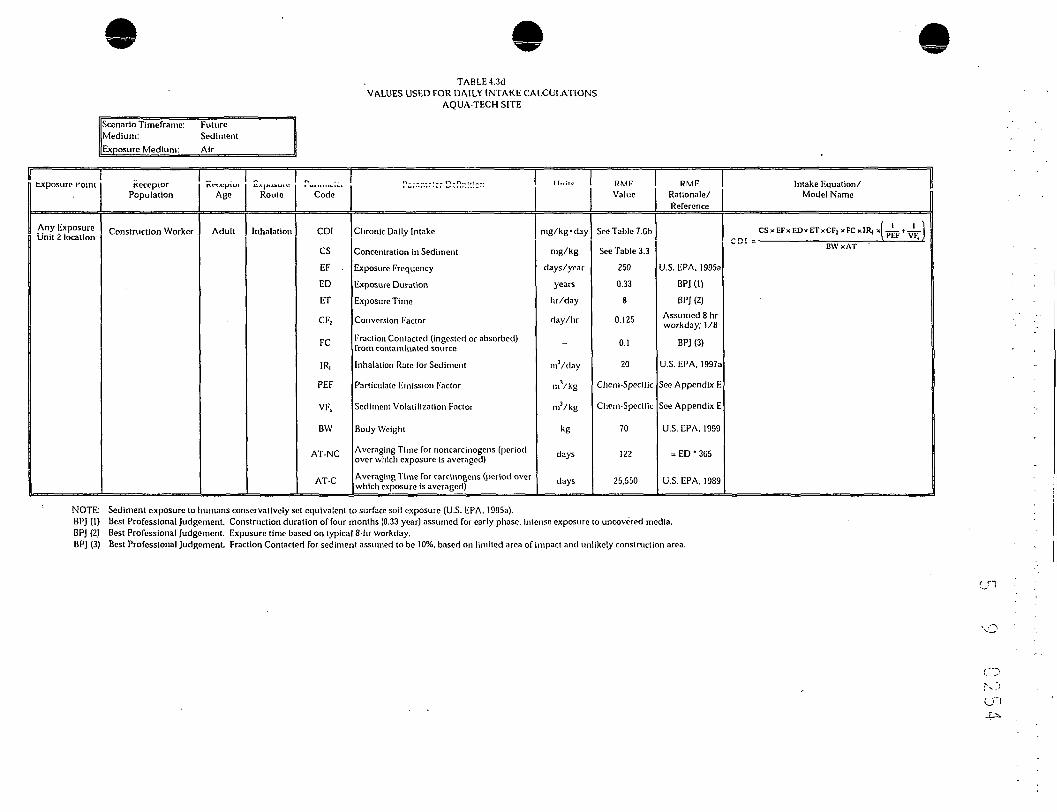
Scenario Timeframc: FutureMedium: SedimentExposure Medium:___Air____
TABLE 4.3dVALUES USED FOR DAILY INTAKE CALCULATIONS
AQUA-TECH SITE
txposure f omi
Any ExposureUnit 2 location
KecepiorPopulation
Construction Worker
l\e\.<:lJiuiAge
Adult
l^Apuauiu
Route
Inhalation
Putu , , ,viCl
Code
CDI
CSEF .EDET
CF,
FC
IR,
PEF
VF,
BW
AT-NC
AT-C
r*-_- — _ 4 _ _ r\_n. .!.:_..
Chronic Daily Intake
Concentration in Sediment
Exposure Frequency
Exposure Duration
Exposure Time
Conversion Factor
Fraction Contacted (ingested or absorbed)from contaminated source
Inhalation Rate for Sediment
Particulate Emission Factor
Sediment Volatilization Factor
Body Weight
Averaging Time for noncarcinogcns (periodover which exposure is averaged)
Averaging Time for carcinogens (period overwhich exposure is averaged)
1 I t l l t c
mg/kg'day
mg/kg
days/year
years
hr/day
day/hr
-
mVday
m'/kg
mVkg
kg
days
days
RMPValue
Sec Table 7.Gb
See Table 3.3
250
0.33
8
0.125
0.1
20
Chem-Specific
Chem-Spccific
70
122
25.550
RMF.Rationale/Reference
U.S.EPA. 199Sa
BPJ (1)
BPJ (2)Assumed 8 hrworkday; 1/8
BPJ (3)
U.S. EPA. 1997a
See Appendix E
See Appendix E
U.S. EPA, 1999
= ED ' 3G5
U.S. EPA, 1989
Intake Eauation/ |Model Name
CSxEFxEDxETxCF 2 xFCxIR,x p=p + ™-|CDI = ————————————————————— ————— i*BWxAT
NOTE: Sediment exposure to humans conservatively set equivalent to surface soil exposure (U.S. EPA. 1995a).BPJ (1) Best Professional Judgement. Construction duration of four months (0.33 year) assumed for early phase, intense exposure to uncovered media.BPJ (2) Best Professional Judgement. Exposure time based on typical 8-hr workday.BPJ (3) Best Professional Judgement. Fraction Contacted for sediment assumed to be 10%. based on limited area of impact and unlikely construction area.

TABLE 4.4aVALUES USED FOR DAILY INTAKE CALCULATIONS
AQUA-TECH SITE
Scenario Timcframe: FutureMedium: GroundwaterExjjosurc Medium: Groundwalcr
Exposure Point
Any Exposure Unit 1 orExposure Unit 2 location(groundwater sprayed on
ground surface)
Any Exposure Unit 1 orExposure Unit 2 location
(domestic use ofgroundwater)
ReceptorPopulation
Other Worker(Irrigation Maint)
Resident
ReceptorAge
Adult
Adult
ExposureRoute
Ingestion
Dermal
Ingestion
ParameterCode
GDI
CW
EFED
FC
"V,BW
AT-NC
AT-C
GDI
CW
EFED
FC
ET
SA
PC
CF3
BW
AT-NC
AT-C
GDI
CW
EFED
FC
IR,,BW
AT-NC
Parameter Definition
Chronic Daily Intake
Concentration in Water
Exposure FrequencyExposure Duration•"faction Contacted (ingested or absorbed)roin contaminated source (assumed 100%)
Oral Ingestion Rate for Water - Incidental
Body Weight
Averaging Time for noncarcinogens (periodover which exposure is averaged)
Averaging Time for carcinogens (period overwhich exposure is averaged)
Chronic Daily Intake
Concentration in Water
Exposure Frequency
Exposure Duration
Fraction Contacted (ingested or absorbed)from contaminated source (assumed 100%)iixposure Time
Skin Surface Area available for daily contact
Dermal Permeability Coefficient
Conversion Factor
Body WeightAveraging Time for noncarcinogens (periodover which exposure is averaged)
Averaging Time for carcinogens (period overwhich exposure is averaged)
Chronic Daily Intake
Concentration in Water
Exposure Frequency
Exposure DurationFraction Contacted (ingested or absorbed)from contaminated source (assumed 100%)Oral Ingestion Rate for WaterBody WeightAveraging Time for noncarcinogens (period
Units
mg/kg'day
mg/L
days/year
years
L/day
kg
days
days
mg/kg»day
mg/L
days/year
years
hr/day
cm*
cin/hr
L/c.n1
kg
days
days
mg/kg-day
mg/L
days/year
years
L/clay
kg
days
RMEValue
bee tables 1 .laand Table 7.7b
Sec Table 3.4
3225
1
0.02
70
9.125
25.550
See Tables 7.7aand Table 7.7b
See Table 3.4
32
25
1
2
5.000
Chem-Spccific
I.OE-03
70
9.125
25.550
See Table 7.4aand Table 7.4b
See Table 3.4
35024
1
270
8,700
RMERationale/Reference
BPJ (1)U.S. EPA. 1995a
U.S. EPA. 1995a
.01 L/hr (U.S. EPA.1995a) for 2 hr (BPJ(2))
U.S. EPA. 1999
= ED • 365
U.S. EPA. 1989
U.S. EPA. 1995aU.S. EPA. 1995a
U.S. EPA. I995a
BP] (2)U.S. EPA. 1997
See Appendix E
N/A
U.S. EPA, 1999
= ED ' 305
U.S. EPA. 1989
U.S. EPA. 1995aU.S. EPA, 1995a
U.S. EPA. 1995a
U.S. EPA. 1995aU.S. EPA. 1999
= ED • 305
Intake Equation/Model Name
CWxEFxEDxFCxIRo
BWxAT
CW x EF x ED x FC x ET x SA x PC x CF,BWxAT
CWxEFxEDxFCxIR,,BWxAT
CJ1cn
Page 1 of 2

TABLE 4.4aVALUES USED FOR DAILY INTAKE CALCULATIONS
AQUA-TECH SITE
{[Scenario Timeframe: FutureMedium: Ground water
[[Exposure Medium: Croundwaler
Exposure Point
Any Exposure Unit 1 orExposure Unit 2 location
(domestic use ofground water)
ReceptorPopulation
Resident
ReceptorAge
Adult
Child
Aggregate
ExposureRoute
Dermal
Ingestion
Dermal
Ingestion
Dermal
ParameterCode
Parameter Definition Units RMEValue
RMERationale/Reference
Intake Equation/Model Name
For VOC's. dermal and inhalation combined intake is assumed to be equivalent to an additional tngesUon exposure.
GDI
CWEFED
FC
IR.BW
AT-NC
Chronic Daily Intake
Concentration in Water
Exposure Frequency
Exposure DurationFraction Contacted (ingested or absorbed)rom contaminated source (assumed 100%)
Oral Ingestion Rale for WaterBody WeightAveraging Tfrne for noncarcinogens (periodover which exposure is averaged)
rng/kg'day
mg/L
days /year
years
L/day
kg
days
See Table 7.3aand Table 7.3bSee Table 3.4
350
6
1
115
2.190
U.S. EPA. i335aU.S. EPA. 1995a
U.S. EPA. 1995a
U.S. EPA. 1995aU.S. EPA. 1999
= ED ' 365
CWxEFxEDxFCxIR0
BWxAT
For VOC's, derma! and inhalation combined intake is assumed to be equivalent to an additional ingestion exposure.
GDI
CW
EFED
FC
IR.BW
AT-C
Chronic Daily Intake
Concentration in WaterExposure FrequencyExposure DurationFraction Contacted (ingested or absorbed)from contaminated source (assumed 100%)Oral Ingestion Rate for WaterBody WeightAveraging Time for carcinogens (period overwhich exposure is averaged)
mg/kg-day
niB/Ldays/year
years
L/day
kg
days
Sec Table 7.5aand Table 7.5bSee Table 3.4
35030
1
1.859
25.550
U.S. EPA. I995aU.S. EPA. 1995a
U.S. EPA. 1995a
Sec Appendix ESee Appendix E
U.S. EPA. 1989
CWxEFxEDxFCxIR,,BWxAT
For VOC's. dermal and inhalation combined intake is assumed lo be equivalent to an additional ingest ion exposure.
BPJ (1) Best Professional Judgement. Thirty -I wo days per year re )resents one day per week for the period March 1 through October 31.BPJ (2) Best Professional Judgement. Two hours per day assumed for a worker to be in contact will) water while maintaining an irrigation system.
N/A Not Applicable.
O
ONPage 2 of 2

TABLE 4.4bVALUES USED FOR DAILY INTAKE CALCULATIONS
AQUA-TECH SITE
Exposure Point
Any Exposure Unit 1 orExposure Unit 2 location(groundwater sprayed on
ground surface)
Any Exposure Unit ] orExposure Unit 2 location
(domestic use ofgroundwater)
Scenario Timeframe: FutureMedium: GroundwaterExposure Medium: Air
Receptori v. !«,,„,,„,,
Other Worker(irrigation Maim)
Resident
Receptor• •&*•
Adult
Adult
Child
Aggregate
Exposuren_... _
Inhalation
Inhalation
Inhalation
Inhalation
Parameter/•*--)..
CDI
CW
EF
ED
FC
ET
CF2
IR,
CVVV
BW
AT-NC
AT.C
Parameter Definition
Chronic Daily Intake
Concentration in Water
Exposure Frequency
Exposure Duration
Fraction Contacted (ingested or absorbed)from contaminated source (assumed 100%)
Exposure Time
Conversion Factor
Inhalation Rate for chemicals volatilized fromwater
Croundwater Volatilization factor
Body Weight
Averaging Time for noncarcinogens (periodover xvhich exposure is averaged)
Averaging Time for carcinogens (period overwhich exposure is averaged)
Units
mg/kg'day
mg/L
days/year
years
hr/day
day/hr
mVday
m'/l
kg
days
days
RMEValue
See Tables 7.7aand Table 7.7b
See Tables 3.4aand Table 3.<lb
32
25
1
2
0.125
20
Chem-Specific
70
9.125
25.550
RMERationale/Reference
BPJ (I)
U.S. EPA. 1995a
U.S. EPA. 1995a
BPJ (2)
Assumed 8-hrworkday; 1 /8
U.S. EPA. 1997
See Appendix E
U.S. EPA. 1999
= ED ' 365
U.S. EPA. 1989
Intake Equation/Model Name
CWxEFxEDxFCxETxCFjxIR, x-i—CDI v
BVVxAT
For VOC's. dermal and inhalation combined intake is assumed to be equivalent to an additional ingestion exposure.
For VOC's, dermal and inhalation combined in akc is assumed to be equivalent to an additional ingestion exposure.
For VOC's. dermal and inhalation combined intake is assumed to be equivalent to an additional ingestion exposure.
BPJ (1)BPJ (2)
Best Professional Judgement. Thirty-two daysBest Professional Judgement. Two hours per d-
per year represents one day per week for the period March 1 through October 31.lay assumed for a worker lo be in contact with water while maintaining an irrigation system.

TABLE 4.5aVALUES USED FOR DAILY INTAKE CALCULATIONS
AQUA-TECH SITE
Scenario Timeframe: Current/FutureMedium: Surface WaterExposure Medium: Surface Waler
1 Exposure Point
Any Exposure Unit 2location
ReceptorPopulation
Trespasser/Visitor
ReceptorAge
Adolescent
ExposureKOUtC
Ingest ion
Dermat
Parameteruocie
GDI
CWEFED
FC
IR.,
BW
AT-NC
AT-C
GDICWEFED
FC
ETSAPC
CF3
BW
AT-NC
AT-C
Parameter Definition
Chronic Daily Intake
Concentration in WaterExposure FrequencyIxposure Duration7raction Contacted (ingested or absorbed)"rom contaminated source (assumed 100%)
Oral Ingcstion Rate for Water - Incidental
Body WeightAveraging Time for noncarcinogens (periodover which exposure is averaged)Averaging Time for carcinogens (period overwhich exposure is averaged)Chronic Daily Intake
Concentration in WaterExposure FrequencyExposure DurationFraction Contacted (ingested or absorbed)from contaminated source (assumed 100%)Exposure TimeSkin Surface Area available for daily contact
Dermal Permeability Coefficient
Conversion Factor
Body WeightAveraging Time for noncarcinogens (periodover which exposure is averaged)Averaging Time for carcinogens (period overwhich exposure is averaged)
Units
mg/kg'daymg/L
days/yearyears
L/day
kg
days
days
mg/kg-day
mg/Ldays/year
years
hr/day
cm2
cm/hr
L/cm3
kg
days
days
RME
See Tables 7.2b
See Tables 3.510010
1
0.02
45
3.C50
25.550
See Tables 7.2b
See Tables 3.510010
1
23.293
Client-Specific
0,001
45
3.650
25.550
RME
Reference
BPJ (1)U.S. EPA, 1995a
U.S. EPA. 1995a
.01 L/iir (U.S. EPA,1995a) for 2 hr (BPJ(2»
U.S. EPA. 1997
= ED ' 365
U.S. EPA. 1989
BPJ (1)U.S. EPA. 1995a
U.S. EPA, 1995a
BPJ (2)See Appendix E
See Appendix E
U.S. EPA, 1997
= ED • 365
U.S. EPA. 1989
IIntake Equation/ |
i CWxEFxEDxFCxIR, ,BWxAT
CWxEFxEDxFCxETxSAxPCxCF,BWxAT
BPj (1)BPJ (2)
Best Professional Judgement. Tresp;Best Professional Judgement. Two 1:
iasser exposure frequency based on two days/week for 50 weoks/ycar or 4 days/week for half the year,[jours per day assumed for a trespasser/visitor to be in contact wilJi surface waier.
vo
onoo

TABLE 4.5bVALUES USED FOR DAILY INTAKE CALCULATIONS
AQUA-TECH SITE
Exposure Point
Any Exposure Unit 2location
Scenario Timeframe: Current/FutureMedium: Surface WaterExposure Medium: Air
ReceptorPopulation
Trespasser/Visitor
ReceptorAge
Adolescent
ExposureRoute
Inhalation
ParameterCode
CDI
CWEFED
FC
ET
CFZ
1R,
SWV
BW
AT-NC
AT-C
Parameter Definition
Chronic Daily Intake
Concentration in WaterExposure FrequencyExposure DurationFraction Contacted (ingested or absorbed)from contaminated source (assumed 100%)Exposure Time
Conversion Factor
Inhalation Rate for chemicals volatilized fromwater
Surface Water Volatilization factor
Body WeightAveraging Time for noncarcinogens (periodover which exposure is averaged)
Averaging Time for carcinogens (period overwhich exposure is averaged)
Units
mg/kg'day
mg/Ldays/year
years
hr/day
clay/hr
mVday
in'/L
kg
days
days
RMEValue
See Tables 7.2b
See Tables 3.510010
1
2
0.042
13
Chem-Specific
45
3.650
25.550
RMERationale/Reference
BPJ (1)U.S. EPA, 1995a
US. EPA. IS95a
BPJ (2)
Assumed 24-hrday: 1/24
U.S. EPA. 1997
See Appendix E
U.S. EPA. 1997
= ED ' 365
U.S. EPA. 1989
Intake Equation/Model Name
CWxEFxEDxFCxETxCF zxIRj x — —CDI v
BWxAT
BPJ (1)BPJ (2)
Best Professional Judgement. Trespasser exposure frequency based on one or two days/week for 50 weeks/year or two or four days/week for half the year.Best Professional Judgement. Two hours per day assumed for a trespasser/visitor to be in contact with surface water.
\o

TABLE 4.GaVALUES USED FOR DAILY INTAKE CALCULATIONS
AQUA-TECH SITE
[Scenario Timeframe: Current/FutureMedium: Landfill GasExposure Medium: Air________
1Exposure Point
Any Exposure Unit 1 orExposure Unit 2 location
Receptor
Trespasser/Visitor
ReceptorAoc
Adolescent
ExposureRoute
Inhalation
ParameterCode
CDI
CA
EF
EDET
CF,
FC
IR,
BW
AT-NC
AT-C
Parameter Definition
Chronic Daily Intake
Concentration in Air
Exposure Frequency (EU-1)Exposure Frequency (EU-2)Exposure DurationExposure Time
Conversion Factor
Fraction Contacted (ingested or absorbed)from contaminated source (assumed 100%)Inhalation Rate for air
Body Weight
Averaging Time for noticarcinogt'iis (periodover which exposure is averaged)
Averaging Time for carcinogens (period overwhich exposure is averaged)
Units
mg/kg-day
iiiB/m'
days /yeardays /year
yearshr/day
day/hr
mVday
^
days
days
RMEValue
See Table 7. la andTable 7.1b
See Table 3.6
50100102
0.0-12
1
13
45
3.650
25.550
RME' Rationale/
Ke/erence
BPJ (1)BPJ (1)
U.S. EPA. 1995aBPJ (2)
Assumed 24 hr day:1/24
U.S. EPA. 199Sa
Sec Appendix E
U.S. EPA. 1995a:U.S. EPA. 1997
= ED • 365
U.S. EPA, 1989
Intake Equation/Model Name
„,„ C A x E F x E D x E T x C F 2 x F C x I R ,CDI = BWxAT
BPJ (1)BPJ (2)
Best Professional Judgement. Trespasser exposure frequency based on one or two days/week for 50 weeks/year or two or four days/week for half the year.Best Professional Judgement. Trespasser exposure assumed to be 2 hours/Site visit.
roC~N
O

TABLE 4.GbVALUES USED FOR DAILY INTAKE CALCULATIONS
AQUA-TECH SITE
Exposure Point
Any Exposure Unit 1 orExposure Unit 2 location
Scenario Timeframe:Medium:Exposure Medium:
ReceptorPopulation
1
Commercial Worker
Resident
FutureLandfill CaAir
ReceptorAge
1
Adult
Adult
s
ExposureRoute
Inhalation
Inhalation
ParameterCode
1
CDI
CA
EF
ED
ETET
CF,
FC
IR,BW
AT-NC
AT-C
CD!
CAEFEDET
CF,
FC
IR,BW
AT-NC
Parameter Definition
Chronic Daily Intake
Concentration in Air
exposure Frequency
Exposure Duration
Exposure Time (EU-1)
Exposure Time (EU-2)
Conversion Factor
fraction Contacted {ingested or absorbed)from contaminated source (assumed 100%)
nhalation Rate for air
Uody Weight
over vvliich exposure is averaged)
Averaging Time for carcinogens (period oveiwhich exposure is averaged)
Chronic Daily Intake
Concentration in Air
Exposure Frequency
Exposure Duration
Exposure Time
Conversion Factor
Fraction Contacted (ingested or absorbed)from contaminated source (assumed 100%)
Inhalation Rate for Soil
Body Weight
Averaging Time for noncarcinogens (periodover which exposure is averaged)
Units
i
nig /kg -day
mg/nij
days /year
years
hr/day
hr/day
day/hr
m'Vday
kg
days
days
mg/kg'clay
ing/in1
days/yearyears
hr/day
day/hr
mVday
kg
cfays
RMEValue
Sec Table 7.2aand Table 7.2b
Sec Table 3.6
250
25
2
8
0.125
1
12.8
70
9.125
25.550
Sec Table 7.<1aand Table 7.4b
Sec Table 3.0
35021
24
0.042
1
13.25
70
8.7GO
RMERationale/
U.S. EPA. 1995a
U.S. EPA, 1995a
BPJ (1)
BPJ (1)
Assumed 8-hrworkday; 1/8
U.S. EPA, 1995a
See Appendix E
U.S. EPA. 1999
= ED ' 3G5
U.S. EPA. 1989
U.S. EPA. 1995a
U.S. EPA. lD95a
BPJ (2)
Assumed 2-1 hrday; 1/24
U.S. EPA. 1995a
Sec Appendix E
U.S. EPA. 1999
= ED • 365
Intake Equation/Model Name j
CAxEFxEDxETxCF ;xFCxIR,BWxAT
CAxEFxEDxETxCF,xFCxIR,BWxAT
Page 1 of 3

TABLE 4.CbVALUES USED FOK DAILY INTAKE CALCULATIONS
AQUA-TECH SITE
[IS cenario Timefrarne: FutureMedium: Landfill Gas
[[Exposure Medium: Air______
Exposure Point
Any Exposure Unit 1 orExposure Unit 2 location
ReceptorPopulation
Resident
Construction Worker
ReceptorAge
ExposureRoute
ParameterCode
Parameter Definition
1 1 i
Child
Aggregate
Adult
Inhalation
Inhalation
Inhalation
CDI
CA
EFEDET
CF,
FC
IR,BW
AT-NC
CDI
CA
EFCDET
CF2
FC
IR,BW
AT-C
CDI
CA
EF
EDET
CF,
Chronic Daily Intake
Concentration in Air
Ixposure FrequencyIxposure DurationIxposure Time
Conversion Factor
Fraction Contacted (ingestoti or absorbed)rom contaminated source (assumed 100%)
Inhalation Rate for Air
Body Weight
Averaging Time for noncarcinogens (periodover which exposure is averaged)
Chronic Daily Intake
Concentration in Air
Exposure FrequencyExposure DurationExposure Time
Conversion Factor
Fraction Contacted (ingested or absorbed)from contaminated source (assumed 100%)
Inhalation Rate for Air
Body Weight
Averaging Time for carcinogens (period overwhich exposure is averaged)
Chronic Daily Intake
Concentration in Air
Exposure Frequency
Exposure Duration
Exposure Time
Conversion Factor
Units
mg/kg'day
ing/in"
days/yearyears
hr/day
day/hr
mVday
kg
days
mg/kg'day
ing/in1
days/yearyears
hr/day
day/hr
mVday
kg
days
mg/kg'day
ing/in'
days/year
years
hr/day
day/hr
RMEValue
See Table 7.3aand Table 7.3b
Sec Table 3.6
350G
24
0.042
1
8.08
15
2,190
See Table 7.5aand Table 7.5b
See Table 3.G
3503024
0.042
1
12.22
59
25,550
Sec Table 7.Caand Table 7.Gb
See Table 3.6
250
0.33
8
0.125
RMERationale/B«IW«"W«
U.S. EPA. 1995aU.S. EPA. 1895a
BPJ (2)
Assumed 24 hrday: 1/24
U.S. EPA, 1995a
See Appendix E
U.S. EPA, 1999
= ED • 365
U.S. EPA. 1995aU.S. EPA, 1995a
BPJ (2)
Assumed 24 hrday: 1/24
U.S. EPA, 1995a
See Appendix E
See Appendix E
U.S. EPA, 1989
U.S. EPA. 1995a
BPJ (3)
BPJ (4)
Assumed 8-hrworkday: 1/8
Intake Equation/Model Name
CAxEFxEDxETxCF2xFCxIR,hw u _o/r
CAxEFxEDxETxCFjxFCxIR,BWxAT
c CAxEFxEDxETxCF^FCxIR,BWxAT f,n
Page 2 of 3

TABLE 4.0bVALUES USED FOR DAILY INTAKE CALCULATIONS
AQUA-TECH SITE
Exposure Point
Any Exposure Unit 1 orExposure Unit 2 location
Scenario Timeframe:Medium:Exposure Medium:
ReceptorPopulation
Construction Worker
Other Worker(Irrigation Maim)
FutureLandfill CaAir
ReceptorAge
Adult
Adult
1i
|
ExposureRoute
Inhalation
Inhalation
ParameterCode
FC
IR,
BW
AT-NC
AT-C
GDI
CAEFEDET
CF,
FC
IR,BW
AT-NC
AT-C
Parameter Definition
Fraction Contacted (ingested or absorbed)Yom contaminated source (assumed 100%)
Inhalation Rote for Air
Body Weight
Averaging Time for noncarcinogcns (periodover which exposure is averaged)
Averaging Time for carcinogens (period overwhich exposure is averaged)
Chronic Daily Intake
Concentration in Air
Exposure Frequency
Exposure Duration
Exposure Time
Conversion Factor
Fraction Contacted (ingested or absorbed)from contaminated source (assumed 100%)
Inhalation Rate for Air
Body Weight
Averaging Time for noncarcinogcns (periodover which exposure is averaged)
Averaging Time for carcinogens (period oveiwhich exposure is averaged)
Units
-
mVday
kg
days
days
mg/kg-day
mg/rn1
days/year
yearshr/day
day/hr
mVday
kg
days
days
RMEValue
I
20
70
122
25.550
See Table 7.7aand Table 7.7b
See Table 3.6
32252
0.125
,
20
70
9.125
25.550
RMERationale/P-:f:rr::c:
U.S, Et>A. 1995a
U.S. E!:A. 1997
U.S. EPA. 1999
= ED ' 365
U.S. EPA. 1989
BPJ (5)U.S. EPA. 1995a
BPJ (6)
Assumed 8-hrworkday; 1/8
U.S. EPA. 1995a
U.S. EPA. 1997
U.S. EPA. 1999
= ED ' 365
U.S. EPA. 1989
Intake Equation/Model Name
CAxEFxEDxETxCF,xFCxIR,BWxAT
BPJ (1) Best Professional Judgement. Exposure time based on iwo hours/day in EU-1 and 8 hours/day in EU-2 based on future development plans.BPJ (2) Best Professional Judgement. Exposure time for all residents conservatively based on spending 24 hours/day at home.BPJ (3) Best Professional Judgement. Construction duration of four months (0.33 year) assumed for early phase, intense exposure to uncovered media.BPJ (4) Best Professional Judgement. Exposure lime assumed to be 8 hours/day.BPJ (5) Best Professional judgement. Thirty-two days per year represents one day per week for the period March 1 through October 31.BPJ (6) Best Professional Judgement. Exposure time assumed to be 2 hours/day.
O-v•
Page 3 of 3
Q fi ''• •< /;•x U ^1 vj r
Table 5 Series
Non-Cancer Toxicity Data

TABLE 5.1NON-CANCER TOXICITY DATA - ORAL/DERMAL
AQUA-TECH SITE
Chemicalof Potential
Concern
AcetoneAldrin
AluminumAntimonyAroclor-1242Aroclor-1248Aroclor-1254ArsenicBariumBenzenelenzo(a}anthracene
Benzo(a)pyreneBenzo(b)f1uoranlheneBcnzo(k)fluorantheneBHC. alpha-Bis(2-chloroethyl)etherBis(2-ethylhexyl)phthalatcJromodichloromethane
CadmiumCarbon tetrachlorideChlorobenzeneChloroethaneChloroformChlorophenyl-phenylether. 4-ChromiumChryseneCobaltCopperCyanideDlchlorobenzenc, 1,4-Dichloroethane, 1,1-Oichloroethane, 1,2-Dichloroethcne, 1,1-Dichloroethcne. 1.2- (c/s)Dichloroelhene. 1,2- (trans)DieldrinDi-n-butyl phthalatcDinitrotoluene. 2,4-
SubchronicOral RfDValue (1)
(mg/kg-day)
l.OE-t-00NFNFNF
5.0E-05 (6)5.0E-05 (6)
5.0E-05NFNFNFNFNFNFNFNFNFNFNFNFNFNFNFNFNF
2.0E-02 (6)NFNFNFNFNF
l.OE+00NFNF
l.OE-01NFNF
l.OE+00NF
ChronicOral RID
Value(mg/kg-day)
l.OE-013.0E-05l.OE+004.0E-04
2.0E-05 (6)2.0E-05 (6)
2.0E-053.0E-047.0E-023.0E-03
NFNFNFNFNFNF
2.0E-022.0E-02
l.OE-03 (5)7.0E-042.0E-024.0E-01l.OE-02
2.0E-03 (6)3.0E-03 (6)
NF2.0E-024.0E-022.0E-023.0E-02l.OE-013.0E-029.0E-03l.OE-022.0E-025.0E-05l.OE-012.0E-03
Oral to DermalAdjustment
Factor (2)
0.81.0
0.04 (a)0.01 (a)0.85 (a)0.85 (a)0.85 (a)0.95 (a)
0.050.90 (a)
0.50.50.50.5
0.974 (a)0.98 (a)
0.50.98 (a)
0.044 (a)0.85 (a)0.31 (a)
0.81.0 (a)
0.50.013 (a)
0.50.25 (a)0.5C (a)
l ( a ) '
l (a)0.81 (a)l(a)0.80.8
I (a)Ka)1 (a)
SubchronicAdjustedDermalRfD(3)
(mg/kg-day)
8.0E-01INI-NFNF
4.3E-054.3E-054.3E-05
NFNFNFNFNFNFNFNFNFNFNFNFNFNFNFNFNF
2.GE-04NFNFNFNFNF
8.0E01NFNF
8.0K-02NFNF
l.OE+00NF
ChronicAdjustedDermalRfD(3)
(mg/kg'day)
8.0E-02J.UC.-UJ
4.0E-024.0E-OG1.7E-051.7E-051.7E-052.9E-043.5E-032.7E-03
NFNFNFNFNFNF
l.OE-022.0E-024.4E-056.0E-046.2E-033.2E-01l.OE-02l.OE-033.9E-05
NF5.0E-032.2E-022.0E-023.0E-028.0E-023.0E-029.0E-038.0E-03l.CE-025.0E-05l.OE-012.0E-03
PrimaryTargetOrgan
liver, kidneyavei
CNSblood
immunologicimmunologicimmunologic
skincardiovascular
CNS. bloodNF
lung
lungNFNFNF
kidney, liverkidneykidney
liverliverNF
liverliver
NOAELNFNFCI
body weightNF
NOAELCNS, liverCNS, liver
bloodliverliver
increased mortalityneurological
CombinedUncertainly/ModifyingFactors for Chronic RfD
1.000:.cccNF
1,000300 (6)300 (6)
3003
3NFNFNFNFNFNFNF
1,0001,000
101.0001.000
NF1.0001,000
900 (G)NFNFNF500NF
1.000NF
1.0001,0001.000100
1,000100
Sources of ChronicRfD/Target Organ
IRIS/IRIS'."".".P.'.S
NCEA/DOEIRIS/IRISsurrogatesurrogateIRIS/IRISIRIS/IRISIRIS/IRIS
NCEA/DOENFNFNFNFNFNF
IRIS/IRISIRIS/IRISIRIS/IRISIRIS/IRISIRIS/IRIS
NCEAIRIS/IRISIRIS/IRISIRIS/IRIS
NFNCEA
HEAST/HEASTIRIS/IRIS
NCEAHEAST/HEAST
NCEAIRIS/IRIS
HEAST/HEASTIRIS/IRISIRIS/IRISIRIS/IRISIRIS/IRIS
Dates ofRfD/Target Organ (4)
May 2002/May 200214-,., ?nrf> /Mat, 9m?
April 2002/May 2002May 2002/May 2002
N/AN/A
May 2002/May 2002May 2002/May 2002May 2002 /May 2002April 2002/May 2002
N/AN/A
•N/AN/AN/AN/A '
May 2002/May 2002May 2002/May 2002May 2002/May 2002May 2002 /May 2002May 2002/May 2002
April 2002May 2002/May 2002May 2002/May 2002May 2002/May 2002
N/AApril 20021997/1997
May 2002/May 2002April 20021997/1997April 2002
May 2002/May 20021997/1997
May 2002/May 2002May 2002/May 2002May 2002/May 2002May 2002 /May 2002
cn
Page 1 of 2

TABLE 5.1NON-CANCER TOXICITY DATA - ORAL/DERMAL
AQUA-TECH SITE
Chemicalof Potential
Concern
Hpntarhlnr pnoxirln
Indeno (1.2.3-cd) pyreneron-cadManganese
MercuryMethyl ten butyl etherNaphthaleneNickel (soluble salts)Nitrophenol. 2-Tetrachloroethane, 1.1,2,2-TetracliloroetheneThalliumTolueneToxaplieneTrichloroethane, 1,1,1-Trichloroethanc, 1,1.2-TrichloroetheneVanadiumVinyl chloride (adult lifetime)Vinyl chloride (entire lifetime)
SubchronicOralRfDValue (1)
(mg/kg'day)
NFNFNFNF
!.<!E-0!NFNFNFNFNFNF
l.OE-01NFNFNFNF
4.0E-02NFNFNFNF
ChronicOralRfD
Value(mg/kg'day)
1.3E-05NF
3.0E-01NF
2.0E-023.0E-04 (6)3.0E-02 (7)
2.0E-022.0E-02
8.0E-03 (0)6.0E-02l.OE-02
7.0E-05 (6)2.0E-01
NF2.8E-014.0E-033.0E-047.0E-033.0E-033.0E-03
Oral to DermalAdjustment
Factor (2)
0.4 (a)0.5
0.085 (a)N/A
O.M la}
0.10 (a)l(a )l(a)0.050.50.8l (a)0.2
10.5l(a)
0.81 (a)0.945 (a)0.02G (a)0.875 (a)0.875 (a)
SubchronicAdjustedDermalRfD(3)
(mg/kg'day)
NFNFNFNF
S.fiK-03NFNFNFNFNFNF
l.OE-01NFNFNFNF
3.2E-02NFNFNFNF
ChronicAdjustedDermalRID (3)
(mR/kg«clay)
5.2E-OGNF
2.6E-02NF
8.0E-043.0E-053.0E-022.0E-02l.OE-034.0E-034.8E-02l.OE-021.4E-052.0E-01
NF2.8E-013.2E-032.8E-0'!1 .8E-042.6E-032.CE-03
PrimaryTargetOrgan
CNS. liverNFCINF
CNSdevelopment. CNS
NFbody weight
decreased body weightNFNF
CNS. liverCNS
liver, kidneyNF
CNSblood, liver
CNS. kidneyCI, kidney
CNSCNS
CombinedUncertainty/ModifyingFactors for Chronic RID
1,000NFNFNF
]1,000(6)
3,000300NFNF
1,000NF
1.000NFNF
1,000NF100NFNF
Sources of ChronicRfD/Target Organ
IRIS/IRISNF
NCEA/Nlemlnen & Lemasltn
NF
IRIS/IRISsurrogate
IRIS/IRISIRIS/IRIS
NCEANCEA
IRIS/IRISNCEA
IRIS/IRISNF
NCEAIRIS/IRIS
NCEAHEAST/HEAST
IRIS/IRISIRIS/IRIS
Dates ofRfD/Target Organ (4)
May 2002/May 2002N/A
April 2002/1 996N/A
May 2002/May 2002N/A
May 2002/May 2002May 2002/May 2002
April 2002April 2002
May 2002/May 2002April 2002
May 2002/May 2002N/A
April 2002May 2002 /May 2002
April 20021997/1997
May 2002/May 2002May 2002/May 2002
N/A - Not Applicable.NF = Not Found.(1) All Subchronic RfDs were obtained from HEAST. 1997.(2) Values marked (a) were obtained from current ATSDR profiles (ATSDR, 1990-1998).
The other values are based on Region IV guidance: 0.8 for volatiles. 0.5 for semivolatiles and 0.2 for Inorganics.(3) Oral RfD multiplied by the oral-to-dermal adjustment factor.(4) For IRIS values, the date IRIS was searched.
For DOE values, the date of the web site search.For NCEA values, the date of the Region 3 RBC Table.
(5) Oral RfD for cadmium In food - for exposure to groundwater and surface water, the oral RID for cadmium in water (5E-04) was used.(6) Surrogate values based on closely related compounds as follows:
Aroclor 1254 for Aroclor 1242 and Aroclor 12-18Pentabromodiphenyl ether for 4-Chlorophenyl-phenyletherChromium VI for ChromiumMercuric chloride for MercuryThalllc oxide for Thallium4-Nitrophenol for 2-Nilrophenol
CNS = Central Nervous SystemCI = GastrointestinalNOAEL = No Observed Adverse Effects LevelIRIS = Integrated Risk Information SystemDOE = Department of Energy (website)HEAST = Health Effects Assessment Summary TablesNCEA = National Center for Environmental AssessmentATSDR = Agency for Toxic Substances and Disease Registry
or •-.:>c\ON
Page 2 of 2

TABLE 5.2NON-CANCER TOXICITY DATA -- INHALATION
AQUA-TECH SITE
Chemicalof Potential
Concern
r\V.CULMIC
AidrinAluminumAntimonyAroclor-1242Aroclor-1248Aroclor-1254ArseniclariumBenzeneJenzo{a)anthraceneJenzo(a)pyreneBenzo(b)fluorantheneBenza(k)nuorantheneBHC, alpha-Bis(2-chloroethyl)ctherBis(2-ctliylhexyl)phthalateBromodichloromethaneCadmiumCarbon tetraclllorideChlorobenzeneChloroethaneChloroformChlorophenyl-phenylether. 4-DhromiumChryseneCobaltCopperCyanideDtchlorobenzene, 1 .4-Dichlorocthane, 1,1-Dichloroethnne, 1,2-Dichloroethene, 1,1-Dlctiloroelliene, 1,2- (cis)Dichloroelhene, 1,2- (trans)DieldrinDl-n-butyl plillialale
SubchronicInhalation
RfCValue (1)(mg/nV1)
N t f ?
NFNFNFNFNFNFNF
5.0E-03NFNFNFNFNFNFNFNFNFNFNFNFNFNFNFNFNFNFNFNF
2.5E+005.0E+00
NFNFNFNFNFNF
ChronicInhalation
RfCValue
(mg/m3)
MD
NFNFNFNFNFNFNF
5.0E-04NFNFNFNFNFNFNFNFNFNFNFNF
l.UE+01NFNF
l.OE-04 (4)NFNFNFNF
8.0E-015.0E-01
NFNFNFNFNFNF
SubchronicAdjustedInhalation
RID (2)nig/kg • day)
MT
NFNFNFNFNFNFNF
1.4E-03NFNFNFNFNFNFNFNFNFNFNFNFNFNFNFNFNFNFNFNF
7. IE-011.4E+00
NFNFNFNFNF •NF
ChronicAdjustedInhalation
RID (2)(mg/kfi'day)
MP
NFl.OE-03
NFNFNFNFNF
1.4E-04I.7E-03
NFNFNFNFNFNFNFNFNF
5.7IE-0'!1.7E-022.9E+008.GE-05
NF2.9E-05
NF5.0E-OG
NFNF
2.29E-U11.4E-011.-1E-03
NFNFNFNFNF
PrimaryTargetOrgan
NF
NFlungNFNFNFNFNF
respiratory, blood pressureblood, CNS
NFNFNFNFNFNFNFNFNFNFNF
developmentNFNF
respiratoryNFNFNFNF
liverNF
CNS, kidney, liverNFNFNFNFNF
CombinedUncertainty/Modifying
Factors
NFNFNFNFNFNFNFNF
1,000NFNFNFNFNFNFNFNFNFNFNFNF300NFNF300NFNFNFNF100NFNFNFNFNFNFNF
Sources ofRrC.RfD /Target Organ
NFNF
NCEA/DOENFNFNFNFNF
HEAST/DOENCEA/DOE
NFNFNFNFNFNFNFNFNF
NCEANCEA
IRIS/IRISNCEA
NFIRIS/IRIS
NFNCEA
NFNF
IRIS/IRISHEAST
NCEA/DOENFNFNFNFNF
Dates ofRfC.RfD/Target Organ (3)
Kl/AN/A
Apr 2002/Nov 2000N/AN/AN/AN/AN/A
1997/Nov 2000Apr 2002/Nov 2000
N/AN/AN/AN/AN/AN/AN/AN/AN/A
Apr ZOOZApr 2002
May 2002/May 2002Apr 2002
N/AMay 2002/May 2002
N/AN/AN/AN/A
May 2002/May 20021997
Apr 2000/Nov 2000N/AN/AN/AN/AN/A
Page 1 of 2

TABLE 5.2NON-CANCER TOXICITY DATA - INHALATION
AQUA-TECH SITE
Chemicalof Potential
Concern
ninilrntnli ionp 2 4-
Heptachlorepoxldendeno (1,2,3-cd) pyreneTonLeadManganeseMercuryMethyl ten butyl etherNaphthaleneNickel (soluble salts)Nitrophenol, 2-Tetrachloroethane, 1,1.2,2-TetrachloroetheneThalliumTolueneToxapheneTrichloroethane. 1.1,1-Trichloroethane. 1,1.2-TrichloroetheneVanadiumVinyl chloride (adult lifetime)Vinyl chloride (entire lifetime)
SubchronicInhalation
RfCValue (1)(mg/m1)
NFNFNFNFNFNFNFNFNFNFNFNFNFNFNFNFNFNFNFNFNFNF
ChronicInhalation
RfCValue
(mg/mj)
NFNFNFNFNF
5.0E-053.0E-0-I3.0E+003.0E-03
NFNFNFNFNF
4.0E-01NFNFNFNF •NF
l.OE-OIl.OE-01
SubchronicAdjusted
InhalationRfD(2)
(mg/kg'day)
NFNFNFNFNFNFNFNFNFNFNFNFNFNFNFNFNFNFNFNFNFNF
ChronicAdjusted
InhalationRfD (2)
(mg/kg-day)
NFNFNFNFNF
1. -IE-058.GE-058.6E-018.6E-04
NFNFNF
1.4E-01NF
1. IE-01NF
6.30E-01NF
l.OE-02NF
2.9E-022.9E-02
PrimaryTargetOrgan
NFNFNFNFNF
CNSCNS
kidney, livernasal
NFNFNFNFNF
neurologicalNFNFNFNFNFNFNF
CombinedUncertainty /Modifying
Factors
NFNFNFNFNF
1.00030100
3,000NFNFNFNFNF300NFNFNFNFNFNFNF
Sources ofRfC.RfD /Target Organ
NFNFNFNFNF
IRIS/IRISIRIS/IRISIRIS/IRISIRIS/IRIS
NFNFNF
NCEANF
IRIS/IRISNF
NCEANF
NCEANF
IRIS/IRISIRIS/IRIS
Dates ofRfC.RfD/Target Organ (3)
N/AN/AN/AN/AN/A
May 2002/May 2002May 2002/May 2002May 2002/May 2002May 2002/May 2002
N/AN/AN/A
Apr 2002N/A
May 2002/May 2002N/A
Apr 2002N/A
Apr 2002N/A
May 2002/May 2002May 2002/May 2002
N/A = Not ApplicableNF = Not Found.(1) All subchronic RfCs were obtained from HEAST. 1997.(2) Derived by multiplying the RFC by the inhalation rate of 20mVday and dividing by the body weight of 70 kg.(3) For IRIS values, the date IRIS was searched.
For DOE values, the date of the web site search.For NCEA values, the date of the Region 9 PRG Table.
(4) Surrogate values based on closely related compounds as follows:Chromium VI for Chromium
CNS = Central Nervous SystemIRIS = Integrated Risk Information SystemDOE = Department of Energy (websitc)HEAST = Health Effects Assessment Summary TablesNCEA = National Center for Environmental Assessment
enroONCO
Page 2 of 2
69
Table 6 Series
Cancer Toxicity Data
€>

TABLE G.ICANCER TOXICITY DATA - ORAL/DERMAL
AQUA-TECH SITE
Chemicalof Potential
Concern
AcetoneAldrinAluminumAntimonyAroclor-1242Aroclor-1248Aroclor-1254ArsenicJariumBenzene3cnzo(a)anthracene3enzo(a)pyrene3enzo(b)fluorantheneBenzo(k) fluorantheneBHC, alpha-Bls(2-chloroethyl)etherBis(2-cthylhcxyl)plHhalateBromodichloromcthaneCadmiumCarbon tetrachlorideChlorobenzeneChloroethaneChloroformChlorophcnyl-phenylether, 4-ChromiumChryseneCobaltCopperCyanideDiclilorobcnzenc. 1,4-Dicliloroetliane. 1,1-Dichloroethane. 1.2-Dichloroethene, 1,1-Dichloroethene, 1,2- (cis)Dichloroethcne. 1.2- (trans)
Dieldrln
OralCancer Slope Factor
(mg/kg-day)'1
IN/A
1.7E+01N/AN/A
2.0E+00 (3)2.0E+00 (3)2.0E+00 (3)
I.5E+00N/A
5.5E-027.3E-017.3E+007.3E-017.3E-02G.3E+001.1E+001.4E-026.2E-02N/A
1.3E-01N/A
2.9E-03N/AN/AN/A
7.3E-03N/AN/AN/A
2.4E-02N/A
9.1E-02G.OE-01N/AN/A
l .GE+Ol
Oral to DermalAdjustment
Factor
1u.o1.0
0.040.010.850.850.850.950.050.90.50.50.50.5
0.9740.980.5
0.980.0440.850.310.81.00.5
0.0130.5
0.250.5G1.01.00.81.01.00.80.81.0
Adjusted DermalCancer Slope Factor (1)
(mg/kg-day)'1
. . . . 1IN/ t\
1.7E+01N/AN/A
2.4E+002.4E+002.4E+00J.GE+00N/A
G. IE-021.5E+001.5E-.-011.5E+001.5E-01
G.5E+001.1E+002.8E-02G.3L'-02N/A
1.5E-01N/A
3.GE-03N/AN/AN/A
1.5E-02N/AN/AN/A
2.4E-02N/A
9. IE-02G.OE-01N/AN/A
l.GE+01
Weight of Evidence/Cancer Guideline
Description
NUI I Ik,.-1 'Known/Likoly/B2
N/AN/A
Known/Likcly/B2Known/Likoly/B2Known/Likely/B2Known/Likely/A
N/AKnown/Likely/AKnown/Likely/B2Known/LikeIy/B2Known/Likely/B2Known/Likcly/B2Known/Likely/B2Known/Likely/B2Known/Likely/B2Knovvn/Likely/B2
N/AKnovvn/Likely/B2
Not LikelyNFNF
Not LikelyN/A
Known/Likcly/B2N/A
Cannot be determined/D
Cannot be determined/DKnown/Likely/C
N/AKnovvn/Likcly/B2Known/Likely/C
N/AN/A
Known/Ukoly/B2
SourceCancer Slope Factor
N,V.IRISN/AN/AIRISIRISIRISIRISN/AIRISTEF
NCEANCEA
TEFIRISIRISIRISIRISN/AIRISN/A
NCEAN/AN/AN/ATEFN/AN/AN/A
HEASTN/AIRISIRISN/AN/AIRIS
Date (2)
.-:.'.".May 2002
N/AN/A
May 2002May 2002May 2002May 2002
N/AMay 2002
N/AApril 2002April 2002
N/AMay 2002May 2002May 2002May 2002
N/AMay 2002
N/AApril 2002
N/AN/AN/AN/AN/AN/AN/A1997N/A
May 2002May 2002
N/AN/A
May 2002
'-Oo
Page 1 of 2

TABLE G.ICANCER TOXICITY DATA - ORAL/DERMAL
AQUA-TECH SITE
Chemical .of Potential
Concern
Di-n-butyl phUialate3inltrotoluene. 2,4--leptachlor epoxldeIndeno (!.2.3-cc!! pyrcneron-eadvlanganesevlercuryMethyl tert butyl ether^aphthaleneNickel (soluble salts)Mitrophenol. 2-Tetrachlorocthane, 1,1,2.2-TetrachloroethencThalliumTolueneToxaphcneTrichloroethane. 1,1,1-Trichloroethano, 1.1.2-TrichloroetheneVanadiumVinyl chloride (adult lifetime)Vinyl chloride (entire lifetime)
OralCancer Slope Factor
(mg/kg-day)'1
N/A6.8E-01 (3)
9.1E+007.3E-01N/AN/AN/AN/AN/AN/AN/AN/A
2.0E-015.2E-02N/AN/A
1.IE+00N/A
5.7E-024.0E-01N/A
7.5E-011.5E+00
Oral to DermalAdjustment
Factor
1.01.00.40.5
0.085N/A0.040.11.01.0
0.050.50.81.00.21.0
0.501.0
0.810.9450.02G0.8750.875
Adjusted DermalCancer Slope Factor (1)
(mg/kg-day)'1
1IN/A
G.8E-012.3E+011.5F.+00N/AN/AN/AN/AN/AN/AN/AN/A
2.5E-015.2E-02N/AN/A
2.2E+00N/A
7.0E-024.2E-OIN/A
8.GE-011.7E+00
Weight of Evidence/Cancer Guideline
Description
. ._ 1l*annul ue ut'iui I I IHICU/ LJ
Known/Likcly/B2Known/Likely/B2Known/Likely/B2
Cannot be determined/DN/A
Cannot be determined/DN/AN/A
Possible/CN/AN/A
Known/Likely/CNF
N/AN/A
Known/Likcly/B2Cannot be dotermincd/D
Known/Likely/CHighly likely/Bl
N/AKnown/AKnown/A
SourceCancer Slope Factor
ii v f r \
IRISIRISTEFN/AN/AN/AN/AN/AN/AN/AN/AIRIS
NCEAN/AN/AIRISN/AIRIS
NCEAN/AIRISIRIS
Date (2)
r.YAMay 2002May 2002
N/AN/AN/AN/AM/ANVAN/AN/AN/A
May 2002April 2002
N/AN/A
May 2002N/A
May 2002April 2002
N/AMay 2002May 2002
N/A Not applicable.IRIS = Integrated Risk Information SystemHEAST= Health Effects Assessment Summary TablesNCEA = National Center for Environmental AssessmentTEF = Benzo(a)pyrene Toxicity Equivalence Factor methodology
(1) Oral CSF multiplied by the dermal adjustment factor.(2) For IRIS values, the date IRIS was searched.
For HEAST values, the date of HEAST.For NCEA values, the date of the Region 9 PRO Table.
(3) The noted values are based on the following surrogates:Mixed PCBs for Aroclor 1242. 1248 and 1254Mixed 2.4- and 2.G- Dinitrotolucne for 2.4-Dinitrotolueiie
IRIS Croup:A - Human carcinogenBl - Probable human carcinogen - indicates that limited human data are availableB2 - Probable human carcinogen - indicates sufficient evidence in animals and
inadequate or no evidence in humans
C Possible human carcinogenD - Not classifiable as a human carcinogen
Weight of Evidence:Known/LikelyCannot be DeterminedNot Likely
Page 2 of 2

TABLE 6.2CANCER TOXICITY DATA -- INHALATION
AQUA-TECH SITE
Chemicalof Potential
Concern
AcetoneAldrinAluminumArsiimonyAroclor-1242Aroclor-1248Aroclor-1254ArsenicJariumJenzeneJenzo(a)anthracene5enzo(a)pyreneJenzo(b)fluorantheneJenzo(k)nuoranthene
BHC, alpha-Bis(2-chloroethyl)etherBis(2-ethylhexyl)phthalateJromodicnloromethaneCadmiumCarbon tetrachlorideChlorobenzeneChloroethancChloroformChlorophenyl-phenylether, 4-Chromium~hryseneCobaltCopperCyanideDichlorobenzene, 1,4-Dichloroethane. 1.1-Dichloroetnane. 1,2-Dichloroclhene. 1,1-Dichloroetliene, 1,2- (cis)Dichloroethene. 1,2- (trans)Dieldrin
Unit Risk(mg/m3)''
N/A4.9E+00
N/AN/ANFNFNF
4.3E+00N/A
7.8E-03N/ANFNFNF
l.SE-i-003.3E-01
NFN/A
l.SE-t-00I.5E-02N/AN/A
2.3E-02N/A
1.2E+01NF
N/AN/AN/ANF
N/A2.CE-025.0E-02N/AN/A
4.GE+00
Adjustment(1)
1N/A
x BW H- IRN/AN/AN/AN/AN/A
x BW * 1RN/A
x BW + IRN/AN/AN/AN/A
x BW + 1Rx BW + IR
N/AN/A
x BW + IRxBW + IR
N/AN/A
x BW + IRN/A
x BW * IRN/AN/AN/AN/AN/AN/A
x BW + IRx BW + IR
N/A. N/A
x BW-+ IR
Inhalation CancerSlope Factor
IN/A1.7E+01
N/AN/A
4.0E-01 (3)4.0E-01 (3)4.0E-01 (3)
1.5E+01N/A
2.7E-023.1E-013.1E+003. IE-013. IE-02G.3E+001.2E+001.4E-02N/A
G.3E+005.3E-02N/AN/A
8. IE-02N/A
4.2E+OJ3.1E-03N/AN/AN/A
2.2E-02N/A
9. IE-021.75E-01
N/AN/A
l.GE+01
Weight of Evidence/Cancer Guideline
Description
INOl llKCIy
Known/Likely/B2Not likelyNot likely
Known/Likcly/B2Known/Likely/B2Known/Likely/B2Known/LikcIy/A
Not likelyKnown/Likely/AKnown/Llkely/B2Known/Likely/B2Knovvn/Likely/B2Knovvn/Likely/B2Known/Likely/B2Known/Likely/B2
NFNot likely
Know/Likcly/BlKnown/Ukely/B?
Not likelyNot likely
Known/Llkcly/B2Not likely
Known/Likcly/AKnown/Likely/B2
Not likelyNot likelyNot likely
Known/Likely/CNot likely
Known/Likely/B2Known/Likely/C
Not likelyNot likely
Known/Llkely/B2
Source
IS/ /\
IRISN/AN/AIRISIRISIRISIRISN/AIRISTEF
NCEANCEA
TEFIRISIRIS
NCEAN/ADOEIRISN/AN/AIRISN/AIRISTEFN/AN/AN/A
NCEAN/AIRISIRISN/AN/AIRIS
Date (2)
i> / r\
May 2002N/AN/A
May 2002May 2002May 2002May 2002
N/AMay 2002
N/AApril 2002April 2002
N/AMay 2002May 2002April 2002
N/ANov 2000May 2002
N/AN/A
May 2002N/A
May 2002N/AN/AN/AN/A
April 2002N/A
May 2002May 2002
N/AN/A
May 2002
ro
r-o
Page 1 of 2

TABLE G.2CANCER TOXICITY DATA - INHALATION
AQUA-TECH SITE
IRIS = Integrated Risk Information SystemHEAST= Health Effects Assessment Summary TablesNCEA = National Center for Environmental AssessmentTEF = Benzo(a)pyrene Toxicity Equivalence Factor methodology
(1) Inhalation Unit Risk multiplied by body weight (BW; 70 kg)and divided by inhalation rate (IR: 20mVday).
(2) For IRIS values, the date IRIS was searched.(3) The noted values are based on the following surrogates:
Mixed PCBs for Aroclor 1242. 1248 and 1254N/A Not applicable.NF Not (build.
Chemicalof Potential
Concern
ui-n-Dutyi pnmaiaieDinltrotolucne, 2.4-4eptachlor epoxideIndeno (1.2.3-cd) pyreneron_eadManganesevlercuryVlethyl tert butyl etherNaphthaleneNickel (soluble salts)Nitrophenol. 2-Tetrachloroethane, 1,1.2.2-TetrachloroetheneThalliumTolueneToxaphcneTrichloroethane, 1.1.1-Trichloroethane. 1.1.2-TrichloroetheneVanadiumVinyl chloride (adult lifetime)Vinyl chloride (entire lifetime)
Unit Risk(nig/m'V
r,YAN/A
2.6E+00NF
N/AN/AN/AN/AN/AN/AN/AN/A
5.8E-02NF
N/AN/A
3.2E-01N/A
l.OE-02NF
N/A4.4E-038.8E-03
Adjustment
(1)
M.'AN/A
x BW + IRN/AN/AN/AN/AN/AN/AN/AN/AN/A
x B W t l RN/AN/AN/A
x BW + IRN/A
x BW + IRN/AN/AN/AN/A
Inhalation CancerSlope Factor
M /A
N/A9.1E+003.1E-01N/AN/AN/AN/AN/AN/AN/AN/A
2.0E-01l.OE-02N/AN/A
l.lE-t-00N/A
5.GE-024.0E-01N/A
1.5E-023.1E-02
Weight of Evidence/Cancer Guideline
Description
Nnt I lkc lv
Not likelyKnown/Likely/B2Known/Llkely/B2
Not likelyNot likelyNot likelyNot likelyNot likelyNot likelyNot likelyNot likely
Known/Likely/CNF
Not likelyNot likely
Known/Likely/B2Cannot be determined/D
Known/Likely/CNF
Not likelyNFNF
Source
N/AN/AIRISTEFN/AN/AN/AN/AN/AN/AN/AN/AIRIS
NCEAN/AN/AIRISN/AIRIS
NCEAN/AIRISIRIS
Date (2)
N/AN/A
May 2002N/AN/AN/AN/AN/AN/AN/AN/AN/A
May 2002April 2002
N/AN/A
May 2002N/A
May 2002April 2002
N/AMay 2002May 2002
EPA Croup:A - Human carcinogenBl - Probable human carcinogen • indicates that limited human data are availableB2 • Probable human carcinogen - Indicates sufficient evidence in animals and
inadequate or no evidence in humansC - Possible human carcinogenD • Not classifiable as a human carcinogen
Weight of Evidence:Known/LikelyCannot be DeterminedNot Likely
Page 2 of 2
o
OJ
9 0 2 7 4
Table 7 Series
Calculation of Non-Cancer Hazards and Calculation of Cancer Risks

TABLE T. laRMECALCULATION OF NON-CANCER HAZARDS AND CANCER RISKS
REASONABLE MAXIMUM EXPOSUREAQUA-TECH SITE
(Scenario Timeframe:Receptor Population:
|| Receptor Age:____
CurrentTrespasser/VisitorAdolescent
Medium
Surface Soil
ExposureMcd!-_—
Surface Soil
ExposureDnlnt
Any Exposure Unit 1 location
ExposureD^nlo
Ingcstion
Dermal
ChemicalnrPmmlin l
Concern
AldrinAluminumAntimonyAroclor-1242Aroclor-1248Aroclor-125-1Arsenic3ariumlenzo (a) anthracene3enzo(a)pyrenc3cnzo(b)fluorantheneJenzo(k)fluorantlleneBis(2-Clhylhcxyl)plithalatcCadmiumChromiumChryseneCopperCyanide, totalIronLeadManganeseMercuryNaphthaleneNickelTetrachloroctheneThalliumToxaphencTrichloroctheneVanadium
(Total)AldrinAluminumAntimonyAroclor- 12-12Aroclor-1248Arodor-1254ArsenicBariumBenzo(a)anthracencBen7.o(a)pyreneUenzo(b)nuoramheneBenzo(k)fluorantheneBis(2-cthylhexyl)phlhalatcCadmiumChromiumChrysenc
MediumEPC
Value(,,,g/kg)
0.006547.785
2.30.120.300.283.1
1.GG80.370.580.590.41
119.1111
0.431163.5
45,860985847.31.553
0.0800.910.580.098
147
. 0.006547,785
2.30.120.300.283.1
1.6G80.370.580.590.41
119.1111
0.43
Intake(Non-Caticprl(ing/kg-day)
2.0E-091.5E-02G.-JE-U73.GE-089.1E-088.5E-089.5E-075. IE-041. IE-071.8E-07l.SE-071.2E-073.3E-OG2.8E-OG3.4E-051.3E-073.5E-051.1E-OG1.4E-023.0E-051.8E-042.2E-OG4.4E-07l.GE-052.4E-082.8E-071 .8E-073.0E-084.5E-05
I.3E-IO9.GE-054.5E-092.3E-09G.OE-095.GE-096.3E-093.3E-OG7.4E-091.2E-081.2E-088.2E-092.2E-071.8E-082.2E-078.6E-09
ChronicReference
Dose(mg/kg'day)
3.0E-05l.OE+004.0E-042.0E-052.0E-052.0E-053.0E-047.0E-02
NFNFNFNF
2.0E-02l.OE-033.0E-03
NF4.0E-022.0E-023.0E-01
NF2.0E-023.0E-042.0E-022.0E-02l.OE-027.0E-05
NF3.0E-04'7.0E-03
3.0E-054.0E-024.0E-OG1.7E-051.7E-051.7E-052.9E-043.5E-03
NFNFNFNF
l.OE-024.4E-053.9E-05
NF
ReferenceConcentration
(me'"*')
N/AN/AN/AN/AN/AN/AN/AN/AN/AN/AN/AN/AN/AN/AN/AN/AN/AN/AN/AN/AN/AN/AN/AN/AN/AN/AN/AN/AN/A
N/AN/AN/AN/AN/AN/AN/AN/AN/AN/AN/AN/AN/AN/AN/AN/A
1-6.6E-051.5E-021.7E-031.8E-034.GE-034.2E-033.2E-037.3E-03
NCNCNCNC
1.7E-042.8E-031. IE-02
NC8.8E-045.3E-054.7E-02
NC8.9E-037.4E-032.2E-058.1E-042.4E-063.9E-03
NCl.OE-046.4E-031.3E-014.3E-OG2.4E-031. IE-031.4E-043.5E-043.3E-042.2E-059.GE-04
NCNCNCNC
2.2E-054. IE-045.7E-03
NC
Intake(Cancer)
mg/kg'day)
2.8E-102.1E-039.8E-OS5.IE-091.3E-081.2E-081.4E-077.3E-05l.GE-082.5E-082.6E-081.8E-084.8E-074.0E-074.8E-OG1.9E-085.1E-061.5E-072.0E-034.3E-OG2.5E-053.2E-076.3E-082.3E-063.5E-093.9E-082.5E-084.3E-096.4E-OG
1.8E-111.4E-056.5E-103.3E-108.6E-108.0E-IO8.9E-104.8E-071. IE-091.6E-091.7E-091.2E-093.1E-082.GE-093.2E-081.2E-09'
CancerSlope Factor(mg/kg'day)'1
1.7E+01N/AN/A
2.0E+002.0E+002.0E+001.5E+00N/A
7.3E-017.3E+007.3E-OI7.3E-021.4E-02N/AN/A
7.3E-D3N/AN/AN/AN/AN/AN/AN/AN/A
5.2E-02N/A
1.1E+004.0E-01N/A
1.7E+OIN/AN/A
2.4E+002.4E+002.4E+001.6E+00
N/A1.5E+001.5E+011.5E+001.5E-012.8E-02N/AN/A
I.5E-02
1"4.8E-09
NCN^*
l.OE-082.GE-082.4E-082.0E-07
NC1.2E-081.8E-071.9E-081.3E-096.7E-09
NCNC
1.4E-10NCNCNCNCNCNCNCNC
1.8E-10NC
2.8E-081.7E-09
NC5.2E-073.1E-10
NCNC
7.9E-102.0E-091.9E-091.4E-09
NC1.5E-092.4E-082.5E-091.7E-108.8E-10
NCNC
1.8E-II
vo
Page 1 of 3

TABLE T.laRMECALCULATION OF NON-CANCER HAZARDS AND CANCER RISKS
REASONABLE MAXIMUM EXPOSUREAQUA-TECH SITE
Scenario Timcframe: CurrentReceptor Population: Trespasser/VisitorReceptor Age: Adolescent
Medium
Surface Soil
ExposureMedium
Surface Soil
Air
Exposureruini
Any Exposure Unit 1 location
Any Exposure Unit 1 location
Exposure
Dermal
Inhalation
Chemical
Concern
CopperCyanide, totalron-cadManganesevtercuryNaphthaleneNickelTetrachlorocthencThalliumToxapheneTrichloroetheneVanadium
(Total)AldrinAluminumAntimonyAroclor-1242Aroclor-1248Aroclor-1254ArsenicBariumBenzo(a)anthraceneBenzo(a)pyreneBenzo(b)fluoranlheneBcnzo(k)fluorantheneBis(2-ethylhcxyl)phthalateCadmiumChromiumChryseneCopperCyanide, totalIronLeadManganeseMercuryNaphthaleneNickelTetrachloroethcncThalliumToxapheneTricJiloroetheneVanadium
(Total)
Medium |EPC I Intake
(,ng/kg)
1163.5
45.8G6985847.31.553
0.0800.910.580.10147
0.006547,785
2.30.120.300.283.1
1,6680.370.580.590.41
119.1111
0.431163.5
45,866985847.31.553
0.0800.910.580.098
147
(mg/kg-day)
2.3E-076.9E-099.2E-052.0E-071.2E-OC1.5E-082.9E-081. IE-07l.GE-091.8E-091.2E-082.0E-092.9E-07
3.3E-116.8E-103.2E-141. IE-092.7E-092.5E-094.4E-142.4E-111.9E-101.2E-106.5E-115.1E-112.9E-091.3E-13I.GE-127.8E-IO1.6E-124.9E-146.5E-101.4E-128.3E-121.1E-OGI.3E-077.5E-131.2E-071.3E-144.0E-101.9E-072.1E-12
ChronicReference
mg/kg'day)
2.2E-022.0E-022.BE-02
NF8.0E-043.0E-052.0E-02l.OE-03l.OE-021.4E-05
NF2.8E-041.8E-04
NFl.OE-03
NFNFNFNFNF
1.4E-04NFNFNFNFNFNF
2.9E-05NFNFNFNFNF
1.4E-058.GE-058.GE-04
NF1.4E-01
NFNF
l.OE-02NF
Reference
(mg/m')
N/AN/AN/AN/AN/AN/AN/AN/AN/AN/AN/AN/AN/A
NFNFNFNFNFNFNF
5.0E-04NFNFNFNFNFNF •
l.OE-04NFNFNFNFNF
5.0E-053.0E-043.0K-03
NFNFNFNFNFNF
1" Intake•-
l.OE-053.5E-073.6E-03
NC1.5E-034.9E-041.5E-06I. IE-041.6E-071.3E-04
NCG.9E-061.6E-03....___.
NC6.8E-07
NCNCNCNCNC
1.7E-07NCNCNCNCNCNC
5.5E-08NCNCNCNCNC
5.8E-071.3E-021.5E-04
NC8.8E-07
NCNC
I.9E-05NC
1.3E-02
(mg/kg'day)
3.3E-089.9E-10I.3E-G52.8E-081.7E-072. IE-094.2E-09I.5E-082.3E-102.6E-101.7E-092.8E-104.2E-08
4.7E-129.7E-114.6E-151.5E-103.9E-103.6E-106.3E-I53.4E-122.8E-111.7E-119.3E-127.3E-124.2E-101.8E-142.2E-131. IE-102.3E-137.0E-I59.3E-112.0E-131.2E-121.6E-071.8E-081. IE-131.8E-081.8E-155.7E-112.6E-083.0E-13
CancerSlone Factor(mg/kg'day)''
N/AN/AN/AN/AN/AN/AN/AN/A
5.2E-02N/A
2.2E+004.2E-01N/A
1.7E+01N/AN/A
4.0E-014.0E-014.0E-01I.5E+OI
N/A3.1E-013.1E+003.1E-013. IE-021.4E-026.3E+004.2E+OI3.1E-03N/AN/AN/AN/AN/AN/AN/AN/A
l.OE-02N/A
1.1E+004.0E-01N/A
1"NCNCNCNCNCNCNCNC
1.2E-11NC
3.GE-091.2E-10
NC""3.9E-08""
8.0E-11NCNC
6.0E-11l.GE-101.4E-109.5E-14
NC8.GE-125.2E-I12.9E-122.3E-135.9E-121.2E-139.4 E- 123.5E-13
NCNCNCNCNCNCNCNC
1.8E-10NC
6.4E-111. IE-08
NC1. IE-08
Oro
Page 2 of 3o\

TABLE7.1aRMECALCULATION OF NON-CANCER HAZARDS AND CANCER RISKS
REASONABLE MAXIMUM EXPOSUREAQUA-TECH SITE
Scenario Timeframe: CurrentReceptor Population: Trespasser/VisitorReceptor Age: Adolescent
Medium
Landfill Gas
Exposure
Air
ExposureDntnt
Any Exposure Unit I location
ExposureRnc.lo
Inhalation
ChemicalofPnlonrinl
Concern
BcnznnoVinyl chloride
(Total)
MediumEPC
Value(ing/kg)
•s'T'i.vwBrp-.EPC^(ing7m5;
0.0007180.0007872
Intake(Non.Cancer)(mg/kg'day)
2.4E-052.GE-OG
ChronicReference
Dose(mg/kg'day)
1.7E-03
2.9E-02
ReferenceConcentration
(ing/nil
NF
O.I
Total Hazard Index Across All Exposure Routes/Pathways
HazardQuotient |
1.4E-029.1E-05IAE-02
1.7E-01
Intake(Cane,,)
(mg/kg -day)
3.4E-oi3.?E-d?
CancerSlope Factor(mg/kg'day)'1
2.7E-021.5E-02
Tiitel Cancer Rkk
CancerRisk
9.2E-085.7E-099.8E-08
6.7E-07
c.n
Page 3 of 3

TABLE 7.1bRMECALCULATION OF NON-CANCER HAZARDS AND CANCER RISKS
REASONABLE MAXIMUM EXPOSUREAQUA-TECH SITE
Scenario Timeframe:Receptor Population:Receptor Age:
Current jTrespasser/Visitor !Adolescent |
Medium
Surface Soil
Sediment
Exposureivieaium
Surface Soil
Air
Sediment
Exposure
Any Exposure Unit 2 location
Any Exposure Unit 2 location
Any Exposure Unit 2 location
Exposure
Ingestion
Dermal
Inhalation
Ingestion
Dermal
Chemical
Concern
ronManganese
ThalliumVanadium
(Total)ronManganeseThallium
Vanadium(Total)
ronManganese
ThalliumVanadium
(Total)AluminumAntimonyAroclor-1248Aroclor-1254ArseniciariumBenzo(a)anthraccncBenzo(a)pyrene3enzo(b}fhioramhe;ie3enzo(k)nuorantheneChromiumChryscneIronManganeseMercuryThalliumVanadium
(Total)AluminumAntimonyAroclor-1248Aroclor-1254ArsenicBariumBenzo(a) anthraceneBcnzo(a)pyreneBenzo(b) lluorant heneBenzo(k)nuoramhcncChromiumChrysene ,
Medium IEPC
(mg/kB) [
27.8002540.7776
27.8002540.7776
27.8002540.777C
17.2512.9
0.0350.033
2.36880.150.160.160.1443
0.1723.760
7590.413.261
17.2512.9
0.0350.033
2.36880.150.160.160.1443
0.17
Intake
ing/kyday)
1.7E-021.5E-044.7E-074.6E-05
1. IE-04l.OE-063. IE-093.0E-07
7.9E-107.2E-122.2E-142.1E-I2
1. IE-021.8E-OG2. IE-082.0E-081.4E-064.2E-049. IE-089.7E-089.7E-088.5E-082.6E-05l.OE-071.4E-024.6E-042.5E-071.9E-063.7E-05
6.9E-05I.2E-081.4E-09I.3E-099.2E-092.8E-066.0E-096.4E-096.4E-095.6E-091.7E-07G.8E-09
ChronicReference
r*~,,.ms/kg'day)
3.0E-012.0E-027.0E-057.0E-03
2.GE-028.0E-041.4E-051.8E-04
NF1.4E-05
NFNF
l.OE+004.0E-042.0E-052.0E-053.0E-047.0E-02
NFNFNFNF
3.0E-03NF
3.0E-012.0E-023.0E-047.0E-057.0E-03
4.0E-024.0E-061.7E-05I.7E-052.9E-043.5E-03
NFNFNFNF
3.9E-05NF
Reference
(mii/nf1)
N/AN/AN/AN/A
N/AN/AN/AN/A
NF5.0E-05
NFNF
N/AN/AN/AN/AN/AN/AN/AN/AN/AN/AN/AN/AN/AN/AN/AN/AN/A
N/AN/AN/AN/AN/AN/AN/AN/AN/AN/AN/AN/A
^
5.6E-027.7E-036.7E-036.6E-03
"TfE-'bY"4.4E-031.3E-032.2E-04I.7E-03...__„..
NC5.0E-07
NCNC
5.0E-071. IE-024.4E-031. IE-03l.OE-034.7E-036.0E-03
NCNCNCNC
8.7E-03NC
4.8E-022.3E-028.3E-042.8E-025.3E-031.4E-01I.7E-032.9E-038.3E-057.8E-053.2E-057.9E-04
NCNCNCNC
4.4E-03NC
Intake
(mg/kg-day)
2.4E-032.2E-056.7E-086.6E-06
1.6E-051.5E-074.4E-104.4E-08
1. IE-10l.OE-123.1E-153.1E-13
1.5E-032.5E-073.0E-092.9E-092.0E-076.0E-051.3E-081.4E-08J.4E-081.2E-083.7E-061.5E-082. IE-036.6E-053.6E-082.8E-075.3E-06
9.9E-06I.7E-092.0E-101.9E-101.3E-093.9E-078.6E-109.2E-109.2E-108.0E-102.5E-089.7E-10
CancerSlnrv Farlnr(mg/kg-day) '
N/A •N/AN inN/A
N/AN/AN/AN/A
N/AN/AN/AN/A
N/AN/A
2.0E+002.0E+001.5E+00N/A
7.3E-017.3E+007.3E-017.3E-02N/A
7.3E-03N/AN/AN/AN/AN/A
N/AN/A
2.4E+002.4E+00l.GE+00N/A
1.5E+00I.5E+011.5E+001.5E-01N/A
1.5E-02
NCNCNCNC ........ „.. ...
NCNCNCNC.„.£ .
NCNCNCNCNCNCNC
6. IE-095.7E-093.0E-07
NC9.5E-09l.OE-07l.OE-088.9E-10
NC1. IE-10
NCNCNCNCNC
4.3E-07NCNC
4.7E-104.4E-102.1E-09
NC1.3E-091.3E-081.3E-091.2E-IO
NC1.4E-11
•o
Page 1 of 3

TABLE 7.1bRMECALCULATION OF NON-CANCER HAZARDS AND CANCER RISKS
REASONABLE MAXIMUM EXPOSUREAQUA-TECH SITE
Scenario Timeframe: CurrentReceptor Population: Trespasser /VisitorReceptor ARC: Adolescent
Medium
Sediment
Surface Water
ExposureMedium
Sediment
Air
Surface Water
ExposurePoint
Any Exposure Unit 2 location
Any Exposure Unit 2 location
Any Exposure Unit 2 location
ExposureRoute
Dermal
Inhalation
Ingestion
Chemicalof Potential
Concern
ronManganeseMercury'hallium
Vanadium(Total)
AluminumAntimonyAroclor-1248Aroclor-1254ArsenicJariumienzo(a)anlhraccneienzo(a)pyreneJenzo(b)fluoranlhcne3enzo(k)fluorantliene"hromiumChryseneronManganeseMercuryThalliumVanadium
(Total)
AcetoneAluminumBenzeneCadmiumChloroformCobaltDi-n-bulylphthalateDichloroethane. 1.1-Dichloroethene, 1,2- (total)DieldrinIronManganeseMercuryNickelNilroplicnol, 2-TetrachloroetheneTrichlorocthanc, 1,1.1-TrichloroethcneVanadiumVinyl Chloride
(Total)
Medium IIEPC Intake
Value | (Nun-CaiKui)(ni8/ktO
23.7007590.413.261
17.2512.9
0.0350.033
2.3GS80.150.1G0.100.1443
0.17237CO7590.413.2Gl
EPC (mg/L)0.0007
1.10.0020
0.240.00100.044
0.00100.00840.023
0.0000373.47.2
0.000200.10
0.00200.00810.00500.0100.00580.0001
(mis/kg-day)
9.5E-053.0E-061.6E-091.3E-082.4E-07
4.9E-IO8.2E-14G.3E-106.0E-106.5E-141.9E-11l.GE-10C.5E-113.5E-113.5E-111.2E-120.2E-100.7E-102.1E-111.2E-079.0E-141.7E-12
8.2E-071.3E-042.4E-072.9E-051.2E-075.3U-OG1.2E-07l.OE-002.8E-OG4.5E-094. IE-018.8E-042.4E-081.2E-052.4E-079.9E-076. IE-071.2E-067. IE-077.4E-07
ChronicReference
Doseing/kgiday)
2.GE-028.0E-043.0E-051.4E-051.8E-04
l.OE-03NFNFNFNF
1.4E-04NFNFNFNF
2.9E-05NFNF
1.4E-058.0E-05
NFNF
l.OE-01l.OE+003.0E-035.0E-04l.OE-022.0E-02l.OE-01l.OE-012.0E-025.0E-053.0E-012.0E-023.0E-042.0E-028.0E-03l.OE-022.8E-013.0E-047.0E-033.0E-03
ReferenceConcentration
(ms/m-)
N/AN/AN/AN/AN/A
NFNFNFNFNF
5.0E-04NFNFNFNF
l.OE-04NFNF
5.0E-053.0E-04
NFNF
N/AN/AN/AN/AN/AN/AN/AN/AN/AN/AN/AN/AN/AN/AN/AN/AN/AN/AN/AN/A
Intake(Cancer)
3.7E-033.8E-035.5E-059.2E-04I.3E-03
'TOE-02""4.9E-07
NCNCNCNC
HE-07NCNCNCNC
4.3E-08NCNC
I.5E-001.4E-03
NCNC.........__-.
8.HE-061.3E-048.1E-055.8E-021.2E-052.7E-041.2E-06l.OE-051.4E-049.0E-051.4E-034.4E-028. IE-056. IE-043.0E-059.9E-052.2E-064. IE-03l.OE-042.5E-04
"T.iE-oT"
mg/kg-day)
1.4E-054.3E-072.3E-101.8E-093.5E-08
7.0E-111.2E-149.1E-118.5E-119.3E-152.8E-122.2E-I19.3E-125.1E-125.0E-121.7E-138.8E-119.0E-113.1E-121.8E-081.3E-142.5E-13
1.2E-071.9E-053.5E-084.2E-OG1.7E-087.0E-071.7E-081.5E-074.0E-076.4E-105.9E-051.3E-043.5E-091.7E-063.5E-081.4E-078.7E-081.7E-07I.OE-071.1E-07
CancerSlope Factorimg/Rg'Oayj '
N/AN/AN/AN/AN/A
N/AN/A
4.0E-014.0E-011.5E+01N/A
3.1E-013.1E+003.1E-013. IE-024.2E+013. IE-03N/AN/AN/AN/AN/A
N/AN/A
5.5E-02N/AN/AN/AN/AN/AN/A
1.6E+01N/AN/AN/AN/AN/A
5.2E-02N/A
4.0E-01N/A
7.5E-01
NCNCNCNCNC
I.9E-08NCNC
3.6E-113.4E-111.4E-13
NC7.0E-122.9E-111.6E-121.5E-137.3E-122.7E-13
NCNCNCNCNC
""iTE'To""
NCNC
1.9E-09NCNCNCNCNCNC
l.OE-08NCNCNCNCNC
7.3E-09NC
7.0E-08NC
8.0E-08'~T.7E"6'f~
f..n
r-oPage 2 of 3

TABLE 7- lbRMECALCULATION OF NON-CANCER HAZARDS AND CANCER RISKS
REASONABLE MAXIMUM EXPOSUREAQUA-TECH SITE
Scenario Timeframe: CurrentReceptor Population: Trespasser/VisitorReceptor Age: Adolescent
Medium
Surface Water
Landfill Gas
Exposure
Surface Water
Air
Exposure
Any Exposure Unit 2 location
Any Exposure Unit 2 location
Exposure
Dermal
Inhalation
Inhalation
Chemical
Concern
AcetoneAluminumJenzeneCadmiumChloroformCobalt3i-n-butylphthalaleDichloroelhane. 1.1-Dichloroelhene. 1,2- (total)DieldrinTOIIManganeseMercuryNickel^itroplienol, 2-TetrachloroetheneTrichloroethane. 1.1,1-TrichloroctheneVanadiumVinyl Chloride
(Total)AcetoneAluminumBenzeneCadmiumChloroformCobaltDi-n-butylphlhalateDichloroethane. 1.1-DichloroelJiene. J.2- (lotai)DicldrlnIronManganeseMercuryNickelNitrophcnol. 2-TetrachloroctheneTrichloroethane. 1.1,1-TricliloroetheneVanadiumVinyl Chloride
• (Toial)
BenzeneVinyl chloride '
(Total)
Medium 11EPC Intake
N^>
EPC (mg/L)O.OOG7
1.10.0020
0.240.00100.044
0.00100.00840.023
0.0000373.47.2
0.000200.10
0.00200.00810.00500.0100.0058O.OOG1
O.OOG71.1
0.00200.24
0.00100.0440.00100.00840.023
0.0000373.47.2
0.000200.10
0.00200.00810.00500.0100.00580.0061
EPCJmg/m30.0007180.0007872
(mg/kg-day)
1.5E-074.4E-051.7E-OG9.GE-OG3.GE-071.8E-OG1.3E-OG3.0E-069.2E-OG2.4E-081.4E-042.9E-04S.OE-094.0E-OG4.0E-07l.GE-053.4E-OGG.4E-OG2.3E-07I.8E-OG
4.7E-07N/A
3.8E-07N/A
1.9E-07N/A
1.3E-12l.GE-OG4.7E-063.1E-10N/AN/A
3.0E-08N/A
2.5E-08I.4E-OS9.0E-07I.8E-OGN/A
7.6E-07
4.7E-055.2E-06
ChronicReference
n.g/kg-day)
8.0E-024.0E-022.7E-034.4E-05l.OE-025.0E-03l.OE-018.0E-02l.GE-025.0E-OS2.6E-028.0E-043.0E-05l.OE-034.0E-03l.OE-022.8E-012.8E-041.8E-042.GE-03
NFl.OE-031.7E-03
NF8.GE-055.0E-OG
NF1.4E-01
NFNFNF
HE-058.6E-05
NFNF
I .4E-OI6.3E-01l.OE-02
NF2.9E-02
1.7E-032.9E-02
Reference
(mg/m1)
N/AN/AN/AN/AN/AN/AN/AN/AN/AN/AN/AN/AN/AN/AN/AN/AN/AN/AN/AN/A
NFNFNFNFNFNFNF
5.0E-01NFNFNF
5.0E-053.0E-04
NFNFNFNFNFNF
l.OE-01
NF0.1
Total Hazard Index Across All Exposure Routes /Path waysPage 3 of 3
Hazard
1.9E-061.1E-036.2E-042.2E-013.6E-053.5E-041.3E-053.7E-055.8E-044.7E-045.3E-033.6E-012.7E-044.0E-03l.OE-041.6E-031.2E-052.3E-021.3E-036.8E-046.2E-01
NCNC
2.2E-04NC
2.2E-03NCNC
1. IE-05NCNCNCNC
3.5E-04NCNC
I.OE-051.4E-OG1.8E-04
NC2.6E-053.0E-03
2.8E-021.8E-042.8E-02l.OE+00
Intake
mg/kg-day)
2.2E-08B.3E-062.4E-071.4E-065. IE-082.5E-071.9E-074.3E-071.3E-OG3.4E-091.9E-054. IE-051. IE-095.7E-075.7E-082.2E-064.9E-079.2E-073.3E-082.6E-07
6.7E-08N/A
5.4E-08N/A
2.7E-08N/A
1.8E-132.3E-076.7E-074.4E-11N/AN/A
4.3E-09N/A
3.6E-092.0E-071.3E-072.6E-07N/A
1. IE-07
6.8E-067.4E-07
Cancer
(mg/kg'day}'1
N/AN/A
6. IE-02N/AN/AN/AN/AN/AN/A
I.6E+01N/AN/AN/AN/AN/A
5.2E-02N/A
4.2E-01N/A
8.6E-01
N/AN/A
2.7E-02N/A
8. IE-02N/AN/AN/AN/A
1.6E+01N/AN/AN/AN/AN/A
l.OE-02N/A
4.0E-01N/A
1.5E-02
2.7E-021.5E-02
Total Cancer Risk
CancerRi^k
NCNC
I.5E-08NCNCNCNCNCNC
5.4E-08NCNCNCNCNC
1.2E-07NC
3.9E-07NC
2.2E-077.9E-07
NCNC
1.5E-09NC
2.2E-09NCNCNCNC
7.1E-10NCNCNCNCNC
2.0E-09NC
l.OE-07NC
1.7E-091. IE-07
1.8E-071. IE-082.0E-071.7E-06
o
o

TABLE 7.2a RMECALCULATION OF NON-CANCER HAZARDS AND CANCER RISKS
REASONABLE MAXIMUM EXPOSUREAQUA-TECH SITE
Scenario Tiineframe: FutureReceptor Population: Commercial WorkerReceptor ARC: Adult
Medium
Surface Soil
Exposurei>A-^i.. —
Surface Soil
Exposurep«i«»
Any Exposure Unit 1 location
ExposureDn,.r<.
Ingcstlon
Dermal
ChemicalnrPnlnnl inl
Concern
AldrlnAluminumAntimonyAroclor-1242Aroclor-1248Aroclor-1254ArsenicJariumJenzo(a)anthracene
Benzo(a)pyreneJenzo(b)fluorantheneJenzo(k)fluoranlhene
Bls(3-e(hylhcxyl)piiihalaieCadmiumChromiumChryseneCopperCyanide, totalron
LeadvlanganesevlcrcuryNaphthaleneNickelTetrachloroethcne'rhalliumToxaphcneTrichloroetheneVanadium
(Total)AldrinAluminumAntimonyAroclor-12-12Aroclor-1248Aroclor-1254ArsenicBariumBenzo(a)anthraceneBenzo(a)pyreneBcnzo(b)fluorantheneBenzo(k)fluorantlicneBis(2-ethylhexyl)phthalateCadmiumChromiumChryseneCopper
rage
MediumEPC
Vnlc.n
(ing/kg)
O.OOG547,785
2.30.120.300.283.1
1.GG80.370.580.590.41
119.1111
0.4311G3.5
45,860985847.31.553
0.0800.910.580.098M7
O.OOG547,785
2.30.120.300.283.1
1.GG80.370.580.590.41
119.1111
0.43116
Intake/Nrll..r..i,,,.«a(mg/kg'day}
3.2E-092.3E-021.1E-OG5.7E-081.5E-071.4E-071.5E-OG8.2E-041.8E-072.8E-072.9E-072.0E-075.4E-064.4E-OG5.4E-052. IE-075.7E-051.7E-062.2E-024.8E-052.9E-043.GE-OG7.1E-072.GE-053.9E-084.4E-072.8E-074.8E-087.2E-05
4.7IMO3.5E-041.7E-088.GE-092.2E-082.0E-082.3E-08I.2E-052.7E-084.2E-084.3E-083.0E-088. IE-07G.7E-088. IE-073.2E-088.5E-07
ChronicReference
nn-jpmg/kg'day)
3.0E-05I.OE+004.0E-042.0E-052.0E-052.0E-053.0E-047.0E-02
NFNFNFNF
2.0E-02I.OE-033.0E-03
NF4.0E-022.0E-023.0E-01
NF2.0E-023.0E-042.0E-022.0E-02l.OE-027.0E-05
NF3.0E-047.0E-03
3.0E-054.0E-024.0E-06I.7E-051.7E-051.7E-052.9E-043.5E-03
NFNFNFNF
l.OE-024.4E-053.9E-05
NF2.2E-02
ReferenceConrrnlrotlnfl
(mg/M1)
N/AN/AN/AN/AN/AN/AN/AN/AN/<*.N/AN/AN/*N/AN/AN/AN/AN/AN/AN/AN/AN/AN/AN/AN/AN/AN/AN/AN/AN/A
N/AN/AN/AN/AN/AN/AN/AN/AN/AN/AN/AN/AN/AN/AN/AN/AN/A
HazardQuotient
1. IE-042.3E-022.8E-032.9E-037.3E-036.8E-035.1E-031.2E-02
NCNCNCNC
2.7E-044.4E-031.8E-02
NC1.4E-038.5E-057.5E-02
NC1.4E-021.2E-023.6E-051.3E-033.9E-06G.3E-03
NCl.GE-04l.OE-02
"ToifoT"l.GE-058.8E-034.2E-035.0E-041.3E-031.2E-038.0E-053.5E-03
NCNCNCNC
8. IE-051.5E-032.1E-02
NC3.8E-05
Intake(Cancer)
mg/kg*day)
I.1E-098.3E-D34.UE-U72.0E-085.26-084.9E-085.5E-07Z.9E-046.5E-08I.OE-07i.OE-077.2E-08i.SE-00l.GE-061.9E-057.5E-082.0E-056.0E-078.0E-031.7E-05l.OE-041.3E-062.5E-079.3E-OG1.4E-081.6E-07l.OE-071.7E-08Z.6E-05
1.7E-IO1.3E-045.9E-093. IE-097.9E-097.3E-098.2E-094.4E-OG9.7E-091.5E-081.5E-081. IE-082.9E-072.4E-082.9E-071. IE-083.0E-07
CancerSlooe Factor(mg/kg'day)'1
1.7E+01N/AN/A
2.0E+002.0E+002.0E+00I.5E+00N/A
13E-0113E+00T.3E-01f.3E-02UE-02N/AN/A
7.3E-03N/AN/AN/AN/AN/AN/AN/AN/A
5.2E-02N/A
1.1E+004.0E-01N/A
1.7E+01N/AN/A
2.4E+002.4E+002.4E+001.6E+00N/A
1.5E+00I.5E+011.5E+001.5E-012.8E-02N/AN/A
I.5E-02N/A
1"1.9E-08
NCNC
4. IE-08l.OE-079.7E-088.2E-07, NCJ.7E-087.3E-07T.5E-08? 2E-09?.7E-08
NCNC
5.5E-10NCNCNCNCNCNCNCNC
7.3E-10NC
1.1E-076.9E-09
NC"Tif-oe""
2.9E-09NCNC
7.2E-091.9E-081.7E-081.3E-08
NC1.4E-082.2E-072.2E-081.6E-098. IE-09
NCNC
1.6E-10NC
of3

TABLE 7.2a RMECALCULATION OF NON-CANCER HAZARDS AND CANCER RISKS
REASONABLE MAXIMUM EXPOSUREAQUA-TECH SITE
Scenario Timeframe: FutureReceptor Popu ation: Commercial WorkerReceptor Age: Adult
Medium
Surface Soil
ExposureMedium
Surface Soil
Air
Exposuren~!..*
Any Exposure Unit 1 location
Any Exposure Unit 1 location
ExposureDrt.,»n
Dermal
Inhalation
ChemicalnrPnronli t , !
Concern
Cyanide, totalron*eadManganeseMercuryNaphthaleneNickelfetrachloroetheneThalliumPoxaphcne
TrichloroetheneVanadium
(Total)AldrinAluminumAntimonyAroclor-1242Aroclor-1248Aroclor-1254Arsenicbarium3enzo(a)anlhraceneBenzo(a)pyrcnc3cnzo(b)fluorantlieneBcnzo{k}fluorantheneBis(2-ethylhexyl)phlhalateCadmiumChromiumChryseneCopperCyanide, totalIronLeadManganeseMercuryNaphthaleneNickelTetrachloroctheneThalliumToxapheneTrichloroetheneVanadium
(Total)
MediumEPC
Vnli.o
(ing/kg)
3.5
45.866935847.31.553
0.0800.910.580.098
147
O.OOG547,785
2.30.120.300.283.1
1.6680.370.580.590.41
119.1111
0.43116
3.4018-15,866
985847.31.553
0.08040.910.580.098
147
IntakefN'nll.r.nncprl
(ing/kg'day)
2.5E-083.4E-047.2E-074.3E-OG5.3E-081. IE-073.9E-075.9E-096.7E-094.2E-087.2E-091. IE-06
3. IE-106.4E-093.0E-13I.OE-082.6E-082.4E-084.2E-132.2E-101.8E-091. IE-096.2E-104.9E-102.8E-081.2E-121.5E-117.4E-09l.GE-114.6E-13C.2E-091.3E-117.8E-11l.OE-051.2E-OG7. IE-12I.2E-061.2E-133.8E-091 .8E-062.0E-11
ChronicReference
Dosemg/kg-day)
2.0E-022.6E-02
NF8.0E-043.0E-052.0E-02l.OE-03l.OE-021.4E-05
NF2.8E-041.8E-04
NFl.OE-03
NFNFNFNFNF
1.4E-04NFNFNFNFNFNF
2.9E-05NFNFNFNFNF
1.4E-058.6E-058.6E-04
NF1.4E-01
NFNF
l.OE-02NF
ReferenceConcentration
(ing/m1)
N/AN/AN/AN/AN/AN/AN/AN/AN/AN/AN/AN/A
NFNFNFNFNFNFNF
5.0E-04NFNFNFNFNFNF
l.OE-04NFNFNFNFNF
5.0E-053.0E-043.0E-03
NFNFNFNFNFNF
1" Intake(Cancer)
1.3E-061.3E-02
NC5.4E-031.8E-035.3E-063.9E-045.9E-074.8E-04
NC2.5E-055.9E-03
""6.9E-02""NC
6.4E-06NCNCNCNCNC
1.6E-06NCNCNCNCNCNC
S.2E-07NCNCNCNCNC
5.5E-061.2E-01I.4E-03
NC8.4E-06
NCNC
1.8E-04NC
1.2E-01
mg/kg'day)
9.1E-091.2E-042.GE-071.5E-061.9E-083.8E-081.4E-072.1E-092.4E-091.5E-082.6E-093.9E-07
1.1E-102.3E-091. IE-133.6E-099.2E-098.6E-091.5E-138.0E-116.6E-104.0E-102.2E-101.7E-109.9E-094.4E-135.3E-122.6E-095.6E-121.7E-132.2E-094.7E-122.8E-113.7E-064.4E-072.6E-124.2E-074.3E-141.4E-096.3E-077.1E-I2
CancerSlope Factor(mg/kg-day)-'
N/AN/AN/AN/AN/AN/AN/A
5.2E-02N/A
2.2E+004.2E-01N/A
1.7E+01N/AN/A
4.0E-014.0E-014.0E-011.5E+01N/A
3.1E-013.1E+003.1E-013. IE-021.4E-026.3E+004.2E+013. IE-03N/AN/AN/AN/AN/AN/AN/AN/A
l.OE-02N/A
I.1E+004.0E-01N/A
1"NCNCNCNCNCNCNC
1. IE-10NC
3.3E-081. IE-09
NC3.6E-071.9E-09
NCNC
1.4E-093.7E-093.4E-092.3E-12
NC2.0E-101.2E-096.8E-115.4E-121.4E-102.7E-122.2E-108.2E-12
NCNCNCNCNCNCNCNC
4.2E-09NC
1.5E-092.5E-07
NC.....£„__...
Page 2 of 3

TABLE T.ZaRMECALCULATION OF NON-CANCER HAZARDS AND CANCER RISKS
REASONABLE MAXIMUM EXPOSUREAQUA-TECH SITE
Scenario Timeframe: FutureReceptor Population: Commercial WorkerReceptor Age: Adult
Medium
Landfill Gas
ExposureMedium
Air
ExposurePoint
Any Exposure Unit 1 location
ExposureRoute
Inhalation
Chemicalof Potential
Concern
BenzeneVinyl chloride
(Total)
MediumEPC
Value(ing/kg)
•wr^raBWeri'rEPC(rng/m|)
0.0007180.0007872
Intake(Non-Cancer)(mg/kg'day)
2.2E-042.5E-05
ChronicReference
Dose(mg/kg'day)
1.7E-032.9E-02
Reference .Concentration
(ing/ml
NF0.1
Total Hazard Index Across All Exposure Routes/Pathways
HazardQuotient
1.3E-018.6E-041.3E-01
5.3E-01
Intake(CalicW)
(mg/k'g'day)
8.0E-058.8E-06
CancerSlope Factor(mg/kg-dayr
2.7E-02I.5E-02
Total Cancer Risk
CancerRisk
2.2E-OGI.4E-072.3E-06
5.0E-06
x-o
CT>roCO
Page 3 of 3

TABLE 7.2b RMECALCULATION OF NON-CANCER HAZARDS AND CANCER RISKS
REASONABLE MAXIMUM EXPOSUREAQUA-TECH SITE
Scenario Timeframe: Future 1Receptor Population: Commercial WorkerReceptor Age: Adult |
Medium
Surface Soil
Landfill Gas
ExposureMedium
Surface Soil
Air
Air
ExposurePoint
Any Exposure Unit 2 location
Any Exposure Unit 2 location
Any Exposure Unit 2 location
ExposureRoute
Ingestion
Dermal
Inhalation
Inhalation
Chemicalof Potential
Concern
IronManganeseThalliumVanadium
(Total)IronManganeseThalliumVanadium
(Total)IronManganeseThalliumVanadium
(Total)
BenzeneVinyl chloride
(Total)
MediumEPC
Value(mg/kg)
27,8002540.7776
27,8002540.7776
27,8002540.7776
Er^CJrng/nV1)0.0007180.0007872
Intake(Non-Cancer){mg/kgxtay)
1.4E-021.2E-043.8E-073.7E-05
2.0E-041.9E-065.7E-095.6E-07
1.5E-081.4E-104. IE-134. IE-11
2.2E-042.5E-05
ChronicReference
Dose[mg/kg«day)
3.0E-012.0E-027.0E-057.0E-03
2.6E-028.0E-041.4E-051.8E-04
NF1.4E-05
NFNF
1.7E-032.9E-02
ReferenceConcentration
(mg/m1)
N/AN/AN/AN/A
N/AN7AN/AN/A
NF5.0E-05
NFNF
NF0.1
Total Hazard Index Across All Exposure Routes/Pathways
HazardQuotient
4.5E-026.2E-035.4E-035.3E-036.2E-028.0E-032.3E-034.0E-043. IE-03
"111-02"NC
9.5E-06NCNC
9.5E-06
1.3E-018.6E-041.3E-01
2.1E-01
Intake(Cancer)
(mg/kg'day)
4.9E-034.4E-051.3E-OT1.3E-05
T.3E056.7E-072.0E-092.0E-07
5.3E-094.9E-111.5E-131.5E-11
8.0E-058.8E-06
CancerSlope Factor(mg/kg -day)'1
N/AN/AN/AN/A
N/ANMN/AN/A
N/AN/AN/AN/A
2.7E-021.5E-02
Total Cancer Risk
CancerRisk
NCNCNCNCNCNCNCNCNCNCNCNCNCNCNC
2.2E-061.4E-072.3E-06
2.3E-06
OroCO

TABLE 7.3a RMECALCULATION OF NON-CANCER HAZARDS AND CANCER RISKS
REASONABLE MAXIMUM EXPOSUREAQUA-TECH SITE
!
Scenario Timeframe: FutureReceptor Population: ResidentReceptor Age: Child
Medium
Surface Soil
ExposureKrfn.U.,...
Surface Soil
ExposurePoint
Any Exposure Unit 1 location
ExposureRonto
Ingcstion
Dermal
Chemicalof Potential
Concern
AldrinAluminumAntimonyArodor-1242Aroclor-1248Arodor-1254ArsenicBariumienzo(a)anthracene3enzo{a)pyreneienzo(b)fluorantheneBenzo(k)fluorantheneBis(2-clhyllicxyl)phlholateCadmiumChromiumChryscneCopperCyanide, totalTon_eadManganeseMercuryMaphthaleneNickelTetrachloroetheneThalliumToxaplieneTrichloroetheneVanadium
(Total)
AldrinAluminumAntimonyAroclor-1242Aroclor-1248Aroclor-1254ArsenicBariumBcnzo(a)an(hraccneBenzo(a)pyreneBenzo(b)riuorantheneBenzo(k)nuoraiitheneBis(2-elhylhexyl)phthalaleCadmiumChromiumChrysene
MediumEPC Intake
Value 1 (Non-Cancer)(nig/kg)
0.006547.785
2.30.120.3
0.283.1
1.6680.370.580.590.41
119.1111
0.431163.5
45.866985847.31.553
0.0800.910.580.098
147
0.006547.785
2.30.120.300.283.1
I.6G80.37
10.590.41
119.1111
0.43
(mg/kg-day)
8.3E-086.1E-012.5E-051.5E-063.8E-OG3.6E-064.0E-052.1E-024.7E-OG7.4E-OC7.5E-065.2E-OC1.4E-041.2E-041.4E-035.5E-061.5E.034.4E-055.9E-011.3E-037.5E-039.3E-051.9E-056.8E-04l.OE-OG1.2E-057.4E-061.3E-061.9E-03
1.4E-09• 1. IE-03
5.0E-082.GE-086.6E-086. IE-086.9E-083.7E-058. IE-081.3E-071.3E-079.0E-082.4E-062.0E-072.4E-OG9.5E-08
ChronicReference
Dose(mg/kg-day)
3.0E-05l.OE+00i.OE-O'i2.0E-052.0E-052.0E-053.0E-047.0E-02
NFNFNFNF
2.0E-02l.OE-033.0E-03
NF4.0E-022.0E-023.0E-01
NF2.0E-023.0E-042.0E-022.0E-02l.OE-027.0E-05
NF3.0E-047.0E-03
3.0E-054.0E-024.0E-061.7E-051.7E-051.7E-052.9E-043.5E-03
NFNFNFNF
l.OE-024.4E-053.9E-05
NF
ReferenceConcentration
(•»g/"0
N/AN/AN/AN/AN/AN/AN/AN/AN/AN/AN/AN/AN/AN/AN/AN/AN/AN/AN/AN/AN/AN/AN/AN/AN/AN/AN/AN/AN/A
N/AN/AN/AN/AN/AN/AN/AN/AN/AN/AN/AN/AN/AN/AN/AN/A
1"Intake(Cancer)
2.8E-036.1E-017.2E-027.5E-02I.9E-011.8E-011.3E-013.0E-01
NCNCNCNC
7.0E-031.2E-014.7E-01
NC3.7E-022.2E-032.0E+00
NC3.7E-013.1E-019.3E-043.4E-02l.OE-041.7E-OI
NC4.2E-032.7E-015.3E+004.7E-052.6E-021.2E-021.5E-033.9E-033.6E-032.4E-04l.OE-02
NCNCNCNC
2.4E-044.5E-036.2E-02
NC
mg/kg-day)
N/AN/AN/AN/AN/AN/AN/AN/AN/AN/AN/AN/AN/AN/A
'N/AN/AN/AN/AN/AN/AN/AN/AN/AN/AN/AN/AN/AN/AN/A
N/AN/AN/AN/AN/AN/AN/AN/AN/AN/AN/AN/AN/AN/AN/AN/A
CancerSlope Factor(mg/kg-day)"
1.7E+01N/AN/A
2.0E+002.0E+002.0E+001.5E+00N/A
7.3E-017.3E+007.3E-017.3E-021.4E-02N/AN/A
7.3E-03N/AN/AN/AN/AN/AN/AN/AN/A
5.2E-02N/A
1.1E+004.0E-01N/A
1.7E+01N/AN/A
2.4E+002.4E+002.4E+001.6E+00
N/A1.5E+001.5E+011.5E+001.5E-012.8E-02N/AN/A
1.5E-02
»"NCNCNCNCNCNCNCNCNCNCNCNCNCNCNCNCNCNCNCNCNCNCNCNCNCNCNCNCNC
""""NC" "'NCNCNCNCNCNCNCNCNCNCNCNCNCNCNCNC
CD
'O
GOen
Page 1 of 4

TABLE 7.3a RMECALCULATION OF NON-CANCER HAZARDS AND CANCER RISKS
REASONABLE MAXIMUM EXPOSUREAQUA-TECH SITE
[Scenario Timeframe: future |Receptor Population: ResidentReceptor Age: Child ||
Medium
Surface Soil
Exposure\Hr,^l,,^,
Surface Soil
Air
ExposureDnlnt
Any Exposure Unit 1 location
Any Exposure Unit 1 location
ExposurePra.ro
Dermal
Inhalation
ChemicalnrPmnnl ln l
Concern
Copper-yanide. totalron
LeadManganeseMercury
NaphthaleneNickelretrachlorocthene
ThalliumToxaphene["richloroethene
Vanadium(Total)
AldrinAluminumAntimonyAroclor-1242Aroclor-1248Aroclor-1254Arsenic3ariumBenzo(a)anthracene3enzo(a)pyrene3en?.o(b)fiuoranthencBenzo(k) fluoranlheneBis(2-clhylnexyl)phlhalateCadmiumChromiumChryseneCopperCyanide, totalIronLeadManganeseMercuryNaphthaleneNickelTclrachloroelheneThalliumToxaphcneTrichloroetheneVanadium
(Total
Medium ifEPC Intake
Val.10 II fN,m.r_n,,r.,l
(mg/kg) | (mg/kg-day)11
1163.5
45.866985847.31.553
0.0800.910.580.10147
0.006547.785
2.30.120.300.283.1
1.6680.370.580.590.41
119.1111
0.431163.5
45.866985847.31.553
0.0800.910.580.10147
2.6E-067.6E-08i.OE-032.2E-061.3E-051.6E-073.2E-071.2E-061.8E-082.0E-081.3E-072.2E-083.2E-06
5. IE-091. IE-075.0E-121.7E-074.3E-074.0E-076.9E-123.7E-093.0E-081.8E-08l.OE-088.0E-094.6E-072.0E-112.5E-101.2E-072.6E-107.7E-12l.OE-072.2E-101.3E-09I.7E-042.0E-051.2E-101.9E-052.0E-126.3E-082.9E-053.3E-10
ChronicReference
DfKP
(ing/kg -day)
2.2E-022.0E-022.6E-02
NF8.0E-043.0E-052.0E-02l.OE-03l.OE-021.4E-05
NF2.8E-041.8E-04
NFl.OE-03
NFNFNFNFNF
1.4E-04NFNFNFNFNFNF
2.9E-05NFNFNFNFNF
1.4E-058.6E-058.6E-04
NF1.4E-OI
NFNF
l.OE-02NF
ReferenceConcentration
(nig/m3)
N/AN/AN/AN/AN/AN/AN/AN/AN/AN/AN/AN/AN/A
NFNFNFNFNFNFNF
5.0E-04NFNFNFNFNFNF
l.OE-04NFNFNFNFNF
5.0E-053.0E-043.0E-03
NFNFNFNFNFNF
IIHazard Intake
Oiinlifint I) (Canrerl
I.lE-043.8E-064.0E-02
NC1.6E-025.3E-031.6E-051.2E-031.8E-061.4E-03
NC7.6E-051.8E-022.1E-01
NC1. IE-04
NCNCNCNCNC
2.6E-05NCNCNCNCNCNC
8.6E-06NCNCNCNCNC
9. IE-052.0E+002.4E-02
NC1.4E-04
NCNC
2.9E-03NC
2.0E+00
mg/kg -day)
N/AN/AN/AN/AN/AN/AN/AN/AN/AN/AN/A
' N/AN/A
N/AN/AN/AN/AN/AN/AN/AN/AN/AN/AN/AN/AN/AN/AN/AN/AN/AN/AN/AN/AN/AN/AN/AN/AN/AN/AN/AN/AN/A
CancerSlooe Factor(mg/kg-day)-1
N/AN/AN/AN/AN/AN/AN/AN/A
5.2E-02N/A
2.2E-I-004.2E-01N/A
1.7E+01N/AN/A
4.0E-014.0E-014.0E-011.5E+01N/A
3.1E-013. IE i-OO3.1E-013.1E-021.4E-026.3E+004.2E-.-013.1E-03N/AN/AN/AN/AN/AN/AN/AN/A
l.OE-02N/A
1.1E+004.0E-01N/A
»'NCNCNCNCNCNCNCNCNCNCNCNCNCNCNCNCNCNCNCNCNCNCNCNCNCNCNCNCNCNCNCNCNCNCNCNCNCNCNCNCNCNCNCNC
Page 2 of 4

TABLE 7.3a RMECALCULATION OF NON-CANCER HAZARDS AND CANCER RISKS
REASONABLE MAXIMUM EXPOSUREAQUA-TECH SITE
Scenario Timeframe: FutureReceptor Popu ation: ResidentReceptor Age: Child
Medium
Croundwater
Exposuret.,1,., li::,,.
Groundwater
ExposurePoint
Any Exposure Unit I location
ExposureRoute
Ingestion
Dermaland
Inhalation
Chemicalof Potential
Concern .
AluminumAntimonyArsenicBariumienzeneBis(2-elhyl)icxyl)pl)thalaieBromodichloromcthaneCarbon tetrachloride^hlorobenzeneChloroelhaneChloroformChromiumCobaltDichlorobcnzene, 1,4-Dichloroethane, ,1-Dichlorocthane. ,2-Dichloroethene, ,1-Dichloroethene, ,2- (cis)Dichloroethene, .2- (trans)IronVlanganeseVIethyl tert butyl etherTetrachloroethane, 1,1.2,2-TetrachlorocthcneThalliumTrichloroethane. 1.1.1-TrichloroetheneVanadiumVinyl chloride
(Total)AluminumAntimonyArsenicBariumBenzeneBis(2-elhylhexyl)|)lnliala(eBroinodichloromethaneCarbon tetrachloride
MediumEPC
Value(mg/kg)
1.9O.OOG20.0050
0.270.0210,0051
0.000250.00200.00760.0150.0120.00780.0320.00830.0530.0130.0180.41
0.00395.12.9
0.01 G0.0150.11
0.00730.0720.33
0.00400.031
N/AN/AN/AN/AN/AN/AN/AN/A
Intake(Non-Cancer)(mg/kg-day)
1.2E-014.0E-043.2E-041.7E-021.4E-033.3E-041.6E-051.3E-044.8E-049.8E-047.8E-045.0E-042.0E-035.3E-043.4E-038.6E-041.2E-032.6E-022.5E-043.3E-011.9E-01l.OE-039.GE-Q.17.0E-034.GE-044.GE-032. IE-022.5E-042.0E-03
N/AN/AN/AN/AN/AN/AN/AN/A
ChronicReference
Dosemg/kg'day)
l.OE+004.0E-043.0E-047.0E-023.0E-03
NF2.0E-027.0E-042.0E-024.0E-01l.OE-023.0E-032.0E-023.0E-02l.OE-013.0E-029.0E-03l.OE-022.0E-023.0E-012.0E-023.0E-02G.OE-02l.OE-027.0E-052.8E-013.0E-047.0E-033.0E-03
N/AN/AN/AN/AN/AN/AN/AN/A
ReferenceConcentration
(mg/in1)
N/AN/AN/AN/AN/AN/AN/AN/AN/AN/AN/AN/AN/AN/AN/AN/AN/AN/AN/AN/AN/AN/AN/AN/AN/AN/AN/AN/AN/A
N/AN/AN/AN/AN/A
-N/AN/AN/A
Intake(Cancer)
1.2E-019.9E-011.1E+002.5E-014.6E-01
NC8.0E-041.8E-012.4E-022.4E-037.8E-021.7E-01l.OE-011.8E-023.4E-022.9E-021.3E-012.GE+001.2E-021.1E+009.3E+003.4E-021.6E-027.0E-016.GE+00l.GE-027.0E+013.GE-02G.7E-OI
""9".4Etb7"NCNCNCNC
4.6E-01NC
8.0E-041.8E-01
mg/kg'day)
N/AN/AN/AN/AN/AN/AN/AN/AN/AN/AN/AN/AN/AN/AN/AN/AN/AN/A-N/AN/AN/AN/AN/AN/AN/AN/AN/AN/AN/A
N/AN/AN/AN/AN/AN/AN/AN/A
CancerSlope Factor(mg/kg'day)-'
N/AN/A
1.5E+00N/A
5.5E-021.1E+006.2E-021.3E-01N/A
2.9E-03N/AN/AN/A
2.4E-02N/A
9. IE-026.0E-01N/AN/AN/AN/AN/A
2.0E-0!5.2E-02N/AN/A
4.0E-01N/A
7.5E-01
N/AN/AN/AN/AN/AN/AN/AN/A
«"NCNCNCNCNCNCNCNCNCNCNCNCNCNCNCNCNCNCNCNCNCNCNCNCNCNCNCNCNCNCNCNCNCNCNCNCNCNC
Page 3 of 4

TABLE 7.3a RMECALCULATION OF NON-CANCER HAZARDS AND CANCER RISKS
REASONABLE MAXIMUM EXPOSUREAQUA-TECH SITE
Scenario Timeframe: FutureRecepior Popu ation: ResidentAcceptor Age: Quid
Medium
Croundwater
Landfill Cas
Exposure\*~*l!....*
Groundwater
Air
ExposurePnlnl
Any Exposure Unit 1 location
Any Exposure Unit 1 location
ExposureRmilo
Dermaland
Inhalation
Inhalation
Chemicalof Potential
Concern
ChlorobcnzeneChiuruutiiant:ChloroformChromiumCobaltDichlorobenzene. 1,4-Dichlorocthane, .1-Dichlorocthane. ,2-Dichloroethenc, ,1-Dichloroethene, .2- (cis)Dichloroethene, ,2- (trans)IronManganeseMethyl ten butyl etherTetrachloroethane, 1.1,2.2-TetrachloroelhcnoThalliumTrichloroethane, 1,1,1-TrichloroetheneVanadiumVinyl chloride
(Total)
BenzeneVinyl chloride
(Total)
MediumEPC
Value(nig/k^
EPClmg/L)N/AN/AN/AN/AN/AN/AN/AN/AN/AN/AN/AN/AN/AN/AN/AN/AN/AN/AN/AN/AN/A
EPCjmg/m3]0.0007180.0007872
Intake(Non-CanceO(mg/kg-day)
N/A
N/A
N/AN/AN/AN/AN/AN/AN/AN/AN/AN/AN/AN/AN/AN/AN/AN/AN/AN/AN/A
3.7E-034. IE-04
ChronicReference
Dose(mg/kg'day)
N/AN/AN/AN/AN/AN/AN/AN/AN/AN/AN/AN/AN/AN/AN/AN/AN/AN/AN/AN/AN/A
1.7E-032.9E-02
ReferenceConcentration
tag/ml
N/AN/AN/AN/AN/AN/AN/AN/AN/AN/AN/AN/AN/AN/AN/AN/AN/AN/AN/AN/AN/A
NF0.1
Total Hazard Index Across All Exposure Routes/Pathways
HazardQuotient
2.4E-022.4E-037.8E-02
NCNC
1.8E-023.4E-022.9E-021.3E-012.GE+00I.2E-02
NCNC
3.4E-02I.6E-027.0E-01
NC1.6E-027.0E+01
NC6.7E-017.5E+01
2.2E+001.4E-02
"T.2E+55"
1.8E+02
Intake(Cancer)
mg/kg-day)
N/AN/AN/AN/AN/AN/AN/AN/AN/AN/AN/AN/AN/AN/AN/AN/AN/AN/AN/AN/AN/A
N/AN/A
CancerSlope Factor{mg/kg«day)"
N/AN/AN/AN/AN/AN/AN/AN/AN/AN/AN/AN/AN/AN/AN/AN/AN/AN/AN/AN/AN/A
2.7E-021.5E-02
Total Cancer Risk
CancerRisk
NCNCNCNCNCNCNCNCNCNCNCNCNCNCNCNCNCNCNCNCNCNC
NCNCNC
N/A
VO
Page 4 of 4CO

TABLE 7.3b RMECALCULATION OF NON-CANCER HAZARDS AND CANCER RISKS
REASONABLE MAXIMUM EXPOSUREAQUA-TECH SITE
Scenario Timeframe:Receptor Population:Receptor Age:_____
FutureResidentChild
Medium
Surface Soil
Groundwater
ExposureMedium
Surface Soil
Air
Groundwater
ExposurePoint
Any Exposure Unit 2 location
Any Exposure Unit 2 location
Any Exposure Unit 2 location
ExposureRoute
Ingestion
Dermal
Inhalation
Ingestion
Chemicalof Potential
Concern
ronManganeseThalliumVanadium
(Total)ronManganeseThalliumVanadium
(Total)ron
ManganeseThalliumVanadium
(Total)
AluminumAntimonyArsenicBariumBenzeneBis(2-ethyJhexyl)phthalalcBromodichloromethaneCarbon tetrachlorideChlorobcnzencChloroethaneChloroformChromiumCobaltDichlorobcnzene, 1,4-Dichloroclhane, .1-Dichloroethane, .2-Dichloroethcne, ,1-Dichloroethene. ,2- (cis)Dichloroethene, ,2- (trans)IronManganeseMethyl tcrt butyl etherTetrachlorocthane, 1.1.2,2-
EPCValue(mg/kg)
27,8002540.7776
27.8002540.7776
27,8002540.7776
EPjCJrng/y1.9
0.00620.00500.270.021
0.00510.000250.00200.00760.0150.012
0.00780.0320.00830.0530.0130.0180.41
0.00395.12.9
0.0160.015
Intake(Non-Cancer)
(mg/kg'day)
3.6E-013.2E-039.8E-069.7E-04
6. IE-045.6E-061.7E-081.7E-06
6.2E-085.6E-101.7E-121.7E-10
1.2E-OI4.0E-043.2E-041.7E-021.4E-033.3E-041.6E-051.3E-044.8E-049.8E-047.8E-045.0E-042.0E-035.3E-043.4E-038.6E-041.2E-032.6E-022.5E-043.3E-011.9E-01l.OE-039.6E-04
ReferenceDose
(mg/kg-day)
3.0E-012.0E-027.0E-057.0E-03
2.6E-028.0E-041.4E-051.8E-04
NF1.4E-05
NFNF
I.OE+004.0E-043.0E-047.0E-023.0E-03
NF2.0E-027.0E-042.0E-024.0E-01l.OE-023.0E-032.0E-023.0E-02l.OE-013.0E-029.0E-03l.OE-022.0E-023.0E-012.0E-023.0E-026.0E-02
ReferenceConcentration
(mg/tn3)
N/AN/AN/AN/A
N/AN/AN/AN/A
NF5.0E-05
NFNF
N/AN/AN/AN/AN/AN/AN/AN/AN/AN/AN/AN/AN/AN/AN/AN/AN/AN/AN/AN/AN/AN/AN/A
HazardQuotient
_]
1.2E+001.6E-011.4E-011.4E-01I.GE+002.4E-027.0E-031.2E-039.2E-034.1E-OZ
NC3.9E-05
NCNC.....__„.
I.2E-OI9.9E-011.1E+002.5E-014.6E-01
NC8.0E-041.8E-012.4E-022.4E-037.8E-021.7E-01l.OE-011.8E-023.4E-022.9E-02I.3E-012.6E+001.2E-021.1E+009.3E+003.4E-021.6E-02
Intake(Cancer)
(mg/kg'day)
N/AN/AN/AN/A
N/AN/AN/AN/A
N/AN/AN/AN/A
N/AN/AN/AN/AN/AN/AN/AN/AN/AN/AN/AN/AN/AN/AN/AN/AN/AN/AN/AN/AN/AN/AN/A
CancerSlope Factor(mg/kg-day)1
N/AN/AN/AN/A
N/AN/AN/AN/A
N/AN/AN/AN/A
N/AN/A
1.5E+00N/A
5.5E-02UE+006.2E-021.3E-01N/A
2.9E-03N/AN/AN/A
2.4E-02N/A
9. IE-026.0E-01N/AN/AN/AN/AN/A
2.0E-OI
CancerRisk
NCNCNCNCNCNCNCNCNCNCNCNCNCNC
""""NC
NCNCNCNCNCNCNCNCNCNCNCNCNCNCNCNCNCNCNCNCNCNCNC
CO
Page 1 of 3

TABLE 7.3b RMECALCULATION OF NON-CANCER HAZARDS AND CANCER RISKS
REASONABLE MAXIMUM EXPOSUREAQUA-TECH SITE
1Scenario Timeframe:Receptor Population:Receptor Age:
FutureResidentChild
iMedium
Groundwater
iExposureMedium
Groundwater
ExposurePoint
Any Exposure Unit 2 location
ExposureRoute
Ingestion
Dermaland
Inhalation
Chemicalof Potential
Concern
TetrachloroethcneThalliumTrichloroetbanc, 1,1,1-TrichloroethcneVanadiumVinyl chloride
(Total)AluminumAntimonyArsenicBariumBenzeneBis(2-cthylhexyl)phthalateBromodichloromcthaneCarbon tetrachlorideChloro benzeneChloroelhaneChloroformChromiumCobaltDichlorobenzcne, 1.4-Dichloroethane, 1,1-Dichloroethane, 1,2-Dichlorocthene. 1,1-Dichloroethene. 1,2- (cis)Dichlorocthcne, 1.2- (irans)Iron .ManganeseMethyl tert butyl etherTetrachloroethane. 1.1,2,2-Tetraclilorocthcnc
Medium |jKF(J
Value(mg/kg)
EPe,"(mg/L)0.11
0.00730.0720.33
0.00400.031
N/AN/AN/AN/AN/AN/AN/AN/AN/AN/AN/AN/AN/AN/AN/AN/AN/AN/AN/A .N/AN/AN/AN/AN/A
Intake(Nun-Cancur)(mg/kg-day)
7.0E-034.GE-044.GE-032.1E-022.5E-042.0E-03
N/AN/AN/AN/AN/AN/AN/AN/AN/AN/AN/AN/AN/AN/AN/AN/AN/AN/AN/AN/AN/AN/AN/AN/A
ChronicKelcrence
Dose(mg/kg'day)
l.OE-027.0E-052.8E-013.0E-047.0E-033.0E-03
N/AN/AN/AN/AN/AN/AN/AN/AN/AN/AN/AN/AN/AN/A.N/AN/AN/AN/AN/AN/A
- N/AN/AN/AN/A
I 1!Kclercnce
Concentration(mg/m1)
N/AN/AN/A
. N/AN/AN/A
N/AN/AN/AN/AN/AN/AN/AN/AN/AN/AN/AN/AN/AN/AN/AN/AN/AN/AN/AN/AN/AN/AN/AN/A
nazaraQuotient
7.0E-016.6E+001.6E-027.0E+013.6E-026.7E-01...„.__„.„..
NCNCNCNC
4.GE-01NC
8.0E-041.8E-012.4E-022.4E-037.8E-02
NCNC
1.8E-023.4E-022.9E-021.3E-012.GE+001.2E-02
NCNC
3.4E-021.6E-027.0E-01
inuiKe(Cancer)
Img/kg-day)
N/A
N/A
N/AN/AN/AN/A
N/AN/AN/AN/AN/AN/AN/AN/AN/AN/AN/AN/AN/AN/AN/AN/AN/AN/AN/AN/AN/AN/AN/AN/A
cancerSlope Factor(mg/kg'day)''
5.2E-02N/AN/A
4.0E-01N/A
7.5E-01
N/AN/AN/AN/AN/AN/AN/AN/AN/AN/AN/AN/AN/AN/AN/AN/AN/AN/AN/AN/AN/AN/AN/AN/A
IIcancer
Risk
NCNCNCNCNCNC
""""NC""""NCNCNCNCNCNCNCNCNCNCNCNCNCNCNCNCNCNCNCNCNCNCNCNC
o
CDPage 2 of 3

TABLE 7.3b RMECALCULATION OF NON-CANCER HAZARDS AND CANCER RISKS
REASONABLE MAXIMUM EXPOSUREAQUA-TECH SITE
Scenario Timeframe:Receptor Population:Receptor Age:
Future iResidentChild |
IMedium
Groundwater
Landfill Gas
1ExposureMedium
Groundwater
Air
ExposurePoint
Any Exposure Unit 2 location
Any Exposure Unit 2 location
1Exposure
Route
Dermaland
Inhalation
Inhalation
Chemicalof Potential
Concern
ThalliumTrichloroethane. 1.1.1-TrichloroetheneVanadiumVinyl chloride
(Total)
BenzeneVinyl chloride
(Total)
Medium IIEPC I! Intake
Value (Non-Cancer)(mg/kg) (mg/kg'day)
"~N/A~~N/AN/AN/AN/A
EPCJmg/m3)0.0007180.0007872
N/AN/AN/AN/AN/A
3.7E-034. IE-04
ChronicReference
Dose(mg/kg'day)
N/AN/AN/AN/AN/A
1.7E-032.9E-02
-
ReferenceConcentration
(mg/m1)
N/AN/AN/AN/AN/A
NF0.1
Total Hazard Index Across All Exposure Routes/Pathways
IIHazardQuotient
NC1.6E-027.0E+01
NC6.7E-017.5E+bi
2.2E+001.4E-02
2.2E+00
1.7E+02
Intake(Cancer)
(mg/kg'day)
N/AN/AN/AN/AN/A
N/AN/A
CancerSlope Factor(mg/kg'day)'1
N/AN/AN/AN/AN/A
2.7E-021.5E-02
iiCancer
Risk
NCNCNCNCNCNC
NCNCNC
Total Cancer Risk || N/A
Page 3 of 3

TABLE 7A3 RMECALCULATION OF NON-CANCER HAZARDS AND CANCER RISKS
REASONABLE MAXIMUM EXPOSUREAQUA-TECH SITE
Scenario Timeframe: FutureReceptor Popu ntion: ResidentReceptor Age: Adult
Medium
Surface Soil
ExposureMedium
Surface Soil
ExposurePoint
Any Exposure Unit 1 location
ExposureRoute
Ingcstiou
Dermal
Chemicalof Potential
Concern
AldrinAluminumAntimonyAroclor-1242Aroclor-1248Aroclor-1254ArsenicBarium3enzo(a)anthracene3cnzo(a)pyrene3enzo(b)fluoranthene3enzo{k)fluorantheneBis(2-ethylliexyl)p!ithalateCadmiumChromiumChryseneCopperCyanide, totalTonLeadVlanganeseMercuryNaphthaleneNickelTetrachloroetheneThalliumToxapheneTrichloroetheneVanadium
(Total)AldrinAluminumAntimonyAroclor-1242Aroclor-1248Aroclor-1254ArsenicBariumGenzo(a)anthraccneBcnzo(a)pyrene13enzo(b)fluoranthcneBenzo(k)fluoranthencBis(2-ethylhexyl)phthalateCadmiumChromiumChryseneCopper
MediumEl'C Intake
Value I) (Nun-Cinccr)(mB / fcn) I (m|;/kB.djy)
0.006547,785
2.30.120.300.2S3.1
1,6680.370.580.590.41
119.11110.431163.5
45,866985847.31.553
O.OSO0.910.580.10147
0.006547,785
2.30.120.300.283.1
1,6680.370.580.590.41
119.11110.43116
S.SE-096.5E-023. IE-061.6E-074. IE-073.SE-074.3E-062.3E-035. IE-077.9E-07S.OE-075.6E-071.5E-051.2E-051.5E-045.9E-071.6E-044.7E-066.3E-021.3E-04S.OE-049.9E-062.0E-067.3E-051. IE-071.2E-067.9E-071.3E-072.0E-04
S.OE-105.9E-042.8E-OS1.4E-OS3.7E-OS3.4EOS3.9E-OS2.1E-054.6E-OS7. IE-OS7.3E-OS5. IE-OS1.4E-D61. IE-071.4E-065.3E-OS1.4E-06
ChronicReference
Dose<mB / l . s .djy>
3.0E-05l.OEtOO4.00-042.0E-052.0E-052.0E-053.0E-047.0E-02
NFNFNFNF
2.0E-02l.OE-033.0E-03
NF4.0E-022.0E-023.0E-01
NF2.0E-023.0E-042.0E-022.0E-02l.OE-027.0E-05
NF3.0E-047.0E-03
3.0E-054.0E-024.0E-06I.7E-051.7E-051.7E-052.9E043.5E-03
NFNFNFNF
l.OE-024.4E-053.9E-05
NF2.2E-02
ReferenceConcentration
(mu/m5)
N/AN/AN/AN/AN/AN/AN / AN/AN / AN/AN/AN/AN/AN/AN / AN / AN / AN/AN/AN/AN/AN / AN / A
' N / AN / AN/AN / AN/AN/A
N/AN/AN/AN / AN/AN/AN / AN / AN/AN / AN / AN / AN / AN/AN/AN/AN / A
Intake(Cancer)
|(mK/kB-day)
2.9E-046.5E-027.7E-038.0E-032.1E-021.9E-021.4E-023.3E-02
NCNCNCNC
7.5E-041.2E-025. IE-02
NC4.0E-032.4E-042.1E-01
NC4.0E-023.3E-02l.OE-043.6E-031. IE-05l.SE-02
NC4.5E-042.9E-025.7E-012.7E-051.5E-027.0E-038.5E-042.2E-032.0E-031.4E-045.9E-03
NCNCNCNC
1.4E-042.6E-033.5E-02
NC6.4E-05
N/AN/AN/AN/AN/AN/AN/AN/AN/AN/AN/AN/AN/AN/AN/AN/AN/AN/AN/AN/AN/AN/AN/AN/AN/AN/AN/AN/AN/A
N/AN/AN/AN/AN/AN/AN/AN/AN/AN/AN/AN/AN/AN/AN/AN / AN / A
CancerSlope Factor(mg/kK-day)"
1.7E+01N / AN / A
2.0E+002.0E+002.0E+001.5E+00N/A
7.3E-017.3E+007.3E-017.3E-021.4E-02N/AN / A
7.3E-03N/AN/AN / AN / AN / AN/AN / AN / A
5.2E-02N/A
1.1E+004.0E-01N/A
1.7E+01N/AN/A
2.4E+002.4E+002.4E+001.6E+00
N/A1.5E+001.5E+011.5E+001.5E-012.8E-02N/AN/A
1.5E-02N / A
CancerRisk
NCNCNCNCNCNCNCNCNCNCNCNCNC 'NCNCNCNCNCNCNCNCNCNCNCNCNCNCNCNCNCNCNCNCNCNCNCNCNCNCNCNCNCNCNCNCNCNC
VOro
Page 1 of 4

TABLE 7.4aRMECALCULATION OF NON-CANCER HAZARDS AND CANCER RISKS
REASONABLE MAXIMUM EXPOSUREAQUA-TECH SITE
Scenario Timeframe: FutureReceptor Population: ResidentReceptor Age: Adult
Medium
Surface Soil
Groundvvater
ExposureUoHit.m
Surface Soil
Air
Groundwater
ExposurePoint
Any Exposure Unit 1 location
Any Exposure Unit 1 location
Any Exposure Unit 1 location
ExposureRoute
Dermal
Inhalation
Ingestion
Chemicalof Potential
Concern
Cyanide, totalron-cadManganesevlercuryNaphthalene
Nickelfetrachloroethene
ThalliumToxaphenefrichloroetheneVanadium
(Total)AldrinAluminumAntimonyAroclor-1242Aroclor-124SAroclor-1254Arsenic3nrium3enzo(a)nnlhraceneBcnzo(a)pyrene3enzo(b)fluorantheneBenzo(k)fluorantheneB(s(2-etliylhoxyl)phthalaleCadmiumChromiumChryseneCopperCyanide, totalIronLeadManganeseMercuryNaphthaleneNickelTetrachloroethcneThalliumToxapheneTrichloroethcneVanadium
(Total;
AluminumAntimonyArsenic
MediumEl'C Intake
Value 1 (Non-Oncer)(mn/lB) |(m(;/k|;.djy)
3.5
45.S66985847.31.553
O.OSO0.910.5S0.10147
0.006547,785
2.30.120.300.283.1
1,6680.370.5S0.590.41
119.11110.431163.5
45,8669S
5847.31.553
O.OSO0.910.5S0.10147
EPC(rng/L)1.9
0.00620.0050
4.3E-085.7E-041.2E-067.2E-069.0E-OSl.SE-076.6E-079.9E-091. IE-OS7.1E-081.2E-OSl.SE-06
1.8E-093.7E-OSl.SE-125.SE-OS1.5E-071.4E-072.4E-121.3E-091. IE-OS6.5E-093.6E-092.8E-091.6E-077.1E-128.6E-114.3E-OS9.0E-112.7E-123.6E-OS7.6E-114.5E-106.0E-057. IE-064.1E-116.SE-067.1E-132.2E-OSl.OE-051. IE-10
5.2E-021.7E-041.4E-04
ChronicReference
Dose(mn/^.Jjy)
2.0E-022.6E-02
NFS.OE-043.0E-052.0E-02l.OE-03l.OE-021.4E-05
NF2.8E-041.8E-04
NFl.OE-03
NFNFNFNFNF
1.4E-04NFNFNFNFNFNF
2.9E-05NFNFNFNFNF
1.4E-05S.6E-058.6E-04
NF1.4E-01
NFNF
l.OE-02NF
l.OE+004.0E-043.0E-04
ReferenceConcentration
(m|j/in-)
N/AN/AN / AN / AN / AN / AN/AN/AN/AN / AN / AN / A
NFNFNFNFNFNFNF
5.0E-04NFNFNFNFNFNF
l.OE-04NFNFNFNFNF
5.0E-053.0E-043.0E-03
NFNFNFNFNFNF
N/AN/AN/A
Intake(Cancer)
jlfcitK/kK-Jay)
2.1E-06
2.2E-02. NC9.0E-033.0E-039.0E-066.6E-049.9E-07S.OE-04
NC4.3E-05l.OE-021.2E-01
NC3.7E-05
NCNCNCNC
' NC9. IE-06
NCNCNCNCNCNC
3.0E-06NCNCNCNCNC
3.2E-057.0E-01S.3E-03
NC4.9E-05
NCNC
l.OE-03NC
"TlE-bY"
5.2E-024.2E-014.6E-01
N/AN/AN / AN/AN/AN/AN/AN/AN/AN/AN/AN/A
N/AN/AN/AN/AN / AN/AN/AN / AN / AN/AN/AN/AN/AN/AN/AN / AN/AN/AN/AN/AN/AN/AN / AN/AN/AN/AN/AN/AN/A
N / AN/AN/A
CancerSlope Factor(mu/kjj'djy)"
N/A
N/AM / (.\
N/AN/AN/AN / A
5.2E-02N/A
2.2E+004.2E-01N/A
1.7E+01N/AN/A
4.0E-014.0E-014.0E-011.5E+01
N/A3. IE-013.IE+003. IE-013. IE-021.4E-026.3E+004.2E+013.1E-03N/AN/AN / AN/AN/AN/AN / AN/A
l.OE-02N/A
1.1E+004.0E-01N / A
N/AN/A
I.5E+00
CancerRisk
NCNCNCNCNCNCNCNCNCNCNCNCNCNCNCNCNCNCNCNCNCNCNCNCNCNCNCNCNCNCNCNCNCNCNCNCNCNCNCNCNCNCNC
NCNCNC
CDrO
Page 2 of 4
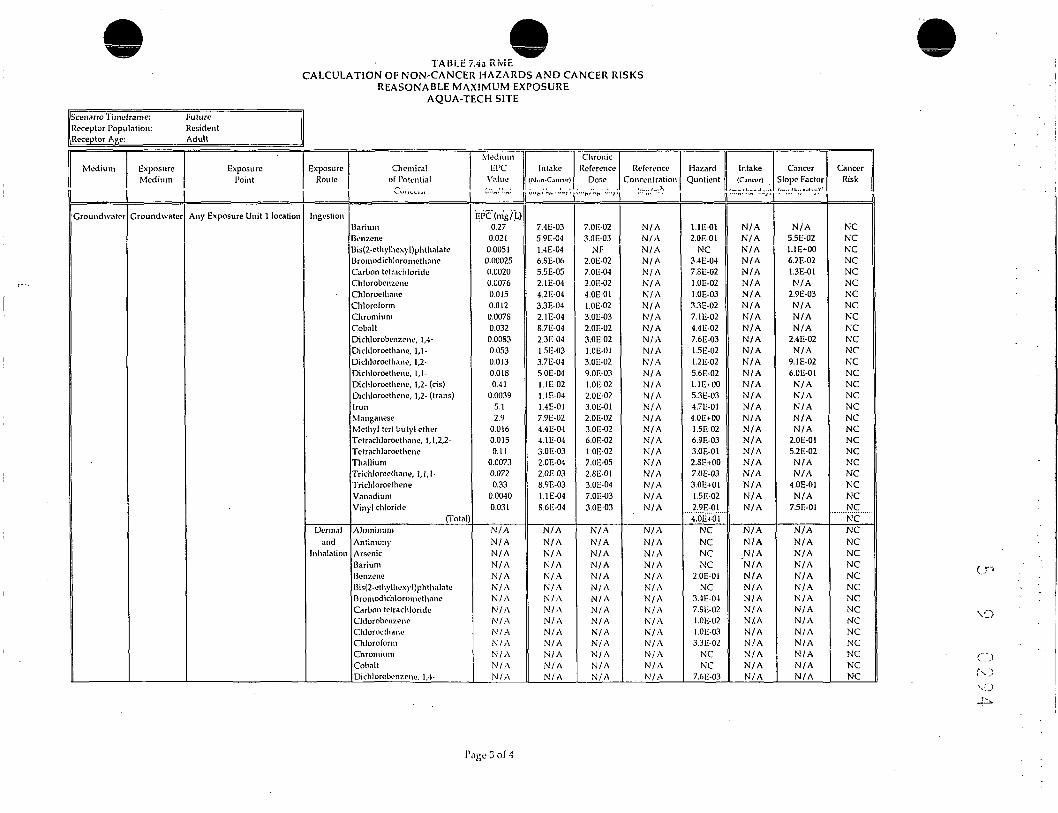
1 ABLE 7.4a RiviECALCULATION OF NON-CANCER HAZARDS AND CANCER RISKS
REASONABLE MAXIMUM EXPOSUREAQUA-TECH SITE
Scenario Timcframe: FutureReceptor Population: ResidentReceptor Age: Adult
Medium
Groundwnter
ExposureMedium
Groundwater
ExposurePoint
Any Exposure Unit 1 location
ExposureRoute
Ingestion
Dermaland
Inhalation
Chemicalof Potential
3ariumBenzeneBis(2.clhylliexyl)phtlialateJromodichloromcthane
Carbon tetrachlorideClitorobenzeneChlorocthaneChloroformChromiumCobaltDichlorobenzene, 1,4-Dichloroethane, 1,1-Dichloroethane, 1,2-Dichloroethene, 1,1-Dichloroethene, 1,2- (cis)Dichloroelhene, 1,2- (trans)[ronManganeseMethyl tcrt butyl etherTetrachloroethane, 1,1,2,2-TctrachloroetheneThalliumTridlloroethane, 1,1,1-TrichloroetheneVanadiumVinyl chloride
(Total)AluminumAntimonyArsenicBariumBenzeneBis(2-ethylhexyl)phthalateBromodichloromethaneCarbon tetrachlorideChlorobenzeneChlorocthaneChloroformChromiumCobaltDichlorobenzene, 1,4-
Medium |EPC Intnke
Value (Nnn-Cjncvr)
ChronicReference
DoseReference
Concentration.-„.--„. n ,...„,-„._,,,...„,..„....,, ..........
EPC(mg/L)0.27
0.0210.00510.000250.00200.00760.0150.0120.007S0.032
O.OOS30.0530.0130.0180.41
0.00395.12.9
0.0160.0150.11
0.00730.0720.33
0.00400.031
N/AN/AN / AN/AN / AN/AN/AN / AN / AN / AN / AN/AN / AN / A
7.4E-035.9E-041.4E-046.SE-065.5E-052. IE-044.2E-043.3E-042. IE-048.7E-042.3E-041.5E-033.7E-045.0E-041. IE-021. IE-041.4E-017.9E-024.4E-044.1E-043.0E-032.0E-042.0E-038.9E-031. IE-04S.6E-04
N/AN/AN / AN/AN / AN/AN / AN / AN / AN / AN / AN/AN / AN / A
7.0E-023.0E-03
NT2.0E-027.0E-042.0E-024.0E-01l.OE-023.0E-032.0E-023.0E-02l.OE-013.0E-029.0E-03l.OE-022.0E-023.0E-012.0E-023.0E-026.0E-02l.OE-027.0E-052.SE-013.0E-047.0E-033.0E-03
N/AN/AN / AN / AN / AN / AN/AN / AN / AN / AN / AN/AN/AN / A
N/AN/AN / AN / AN / AN/AN/AN / AN/AN/AN / AN / AN/AN/AN / AN / AN / AN/AN/AN/AN / AN / AN/AN/AN/AN / A
N/AN/AN / AN / AN/AN/AN/AN / AN / AN / AN / AN/AN / AN / A
II
1. IE-012.0E-01
NC3.4E-047.SE-02l.OE-02l.OE-033.3E-027. IE-024.4E-027.6E-031.5E-021.2E-025.6E-021.1E+005.3E-034.7E-014.0E+001.5E-026.9E-033.0E-012.SE+007.0E-033.0E+011.5E-022.9E-014.0E+01
NCNCNCNC
2.0E-01NC
3.4E-047.8IE-02l.OE-02l.OE-033.3E-02
NCNC
7.6E-03
Intake(Cjncxr)
CancerSlope Factor
•••'"•"" — " ' •" "
N/AN/A
N/AN/AN/AN/AN/AN/AN / AN/AN/AN/AN / AN/AN/AN/AN/AN/AN/AN/AN/AN/AN/AN/AN/AN/A
N/AN/AN/A
'N/AN/AN/AN/AN/AN/.AN/AN/AN/AN / AN / A
N/A5.5E-021.1E+006.2E-021.3E-01N/A
2.9E-03N/AN/AN/A
2.4E-02N/A
9.1E-026.0E-01N/AN/AN/AN / AN/A
2.0E-015.2E-02N/AN/A
4.0E-01N/A
7.5E-01
N/AN/AN/AN / AN/AN/AN/AN/AN/AN/AN/AN/AN/AN / A
NCNCNCNCNCNCNCNCNCNCNCNCNCNCNCNCNCNCNCNCNCNCNCNCNCNCNCNCNCNCNCNCNCNCNCNCNCNCNCNCNC
\O
Page 3 of 4

TABLE 7.4aRMECALCULATION OF NON-CANCER HAZARDS AND CANCER RISKS
REASONABLE MAXIMUM EXPOSUREAQUA-TECH SITE
Scenario Timeframe: FutureReceptor Population: ResidentReceptor Age: Adult
Medium
Groundwater
Landfill Gas
ExposureM^Jlut.,
Groundwater
Air
Exposure?;:r.t
Any Exposure Unit 1 location
Any Exposure Unit 1 location
Exposure?.™.:f"
Dermaland
Inhalation
Inhalation
Chemicalnf P,,l. >.,!,. -(I
Concern
Dichloroethane, 1,1-Dichlorocthane, 1,2-Dichloroethene, 1,1-Dichloroelhene, 1,2- (cis)Dichlorocthcnc, 1,2- (trans)IronManganeseMethyl tert butyl etherTetrachloroethane, 1, 1,2,2-TetrachlorocthencThalliumTrichloroethane, 1,1,1-TrichloroetheneVanadiumVinyl chloride
(Total)
BenzeneVinyl chloride
(Total)
MediumEI>C
Value(m(1/kK)
EPC(mg/i)N/AN/AN / AN/AN / AN/AN / AN / AN/AN / AN/AN / AN / AN / AN / A
EPCdng/m'1)0.0007 IS
0.0007S72
Intake(N<.n-Cancvr>(mBAi;-djy)
N/AN/AN / AN / AN / AN/AN / AN/AN / AN / AN/AN/AN/AN / AN / A
1.3E-031.4E-04
ChronicReference
Dose(mn/kn-djy)
N/AN/AN / AN / AN / AN/AN / AN / AN / AN / AN / AN / AN / AN / AN / A
I.7E-032.9E-02
ReferenceConcentration
(mg/tTV1)
N/AN/AN/AN / AN/AN/AN / AN/AN / AN/AN/AN / AN / AN / AN / A
NF0.1
Total Hazard Index Across Alt Exposure Routes/ Pathways
HazardQuotient
1.5E-021.2E-025.6E-021.1E+005.3E-03
NCNC
I.5E-026.9E-033.0E-01
NC7.0E-033.0E+01
NC2.9E-013.2E+bi
7.6E-015.0E-037.7E-01
7.4E+01
Intake(OincM)
(ms/kB-day)
N/AN/AN/AN / AN/AN/AN/AN/AN/AN / AN/AN/AN / AN/AN/A
N/AN/A
CancerSlope Factorfang/kg-day)"
N/AN/AN/AN / AN/AN/AN/AN/AN / AN/AN/AN/AN/AN / AN/A
2.7E-021.5E-02
Total Cancer Risk
CancerRisk
NCNCNCNCNCNCNCNCNCNCNCNCNCNCNCNC
NCNCNC
N / A
voOn
Page 4 of 4

TABLE 7.4b RMECALCULATION OF NON-CANCER HAZARDS AND CANCER RISKS
REASONABLE MAXIMUM EXPOSUREAQUA-TECH SITE
llScenario Timeframe:Receptor Population:(Receptor Age:
• FutureResidentAdult
1 - 1Medium
Surface Soil
Ground water
ExposureMedium
Surface Soil
Air
Ground water
ExposurePoint
Any Exposure Unit 2 location
Any Exposure Unit 2 location
Any Exposure Unil 2 location
ExposureRoute
Ingestion
Dermal
Inhalation
Ingestion
Chemicalof Potential
Concern
ronManganesePhalli urnVanadium
(Total)ronManganeseThalliumVanadium
(Total)ronvfanganeseThalliumVanadium
(Total)
AluminumAntimonyArsenicBarium3cnzcneBis(2-ethylhexyl)phthalate3romodichloromethancCarbon tetrachloride"hlorobcnzcneChlorocthaneChloroformChromiumCobaltDichlorobcii7.ene/ 1,4-Dichlorocthane, 1,1-Dichloroelliane, 1,2-Dichloroethene, 1,1-Dichloroethene, 1,2- (cis)Dichloroethenc, 1,2- (trails)IronManganeseMethyl tcrt butyl etherTctrachlorocthane, 1,1,2,2-
Medium jEPC
Value(ms/kg)
27,8002540.7776
27,8002540.7776
27,8002540.7776
EPC(mg/L)1.9
0.00620.0050
0.270.0210.00510.000250.00200.00760.0150.0120.00780.0320.00830.0530.0130.0180.41
0.00395.12.9
0.0160.015
Intake(Non-Cancer)(mg/kg'day)
3.8E-023.5E-041. IE-06l.OE-04
3.4E-043.1E-069.5E-099.4E-07
2.2E-08 -2.0E-106.0E-135.9E-11
5.2E-021.7E-041.4E-047.4E-035.9E-041.4C-046.8E-065.5E-052. IE-044.2E-043.3E-042.1E-048.7E-042.3E-041.5E-033.7E-045.0E-041. IE-021. IE-041.4E-017.9E-024.4E-044. IE-04
ChronicReference
Dose(mg/kg«day)
3.0E-012.0E-027.0E-057.0E-03
2.6E-028.0E-041.4E-051.8E-04
NF1.4K-05
NFNF
l.OE+004.0E-043.0E-047.0E-023.0E-03
NF2.0E-027.0E-042.0E-024.0E-01l.OE-023.0E-032.0E-023.0E-02l.OE-013.0E-029.0E-03l.OE-022.0E-023.0E-012.0E-023.0E-026.0E-02
KcterenceConcentration
(mg/nv1)
N / AN/AN/AN/A
N/AN/AN/AN/A
NF5.0E-05
NFNF
N/AN/AN/AN/AN/AN/AN/AN/AN/AN/AN/AN/AN/AN/AN/AN/AN/AN/AN / AN/AN/AN/AN/A
|!
iiazaru 11Quotient
1
1.3E-011.7E-021.5E-021.5E-021.7E-011.3E-023.9E-036.8E-045.2E-032.3E-02
NC1.4E-05
NCNC
1.4E-05
5.2E-024.2E-014.6E-011.1E-012.0E-01
NC3.4E-047.8E-02l.OE-02l.OE-033.3E-027.1E-024.4E-027.6E-031.5E-021.2E-025.6E-021.1E+005.3E-034.7E-014.0E+001.5E-026.9E-03
in lake(Cancer)
(mg/kg'day)
N/AN/AN/AN/A
N/AN/AN/AN/A
N/AN/AN/AN/A
N/AN/AN/AN/AN/AN/AN/AN/AN/AN/AN/AN/AN/AN/AN/AN/AN/AN/AN/AN/AN/AN/AN/A
\_tuu-*:i
Slope Factor(mg/kg'day)'1
N/AN/AN/AN/A
N/AN/AN/AN/A
N/AN/A.N/AN/A
N/AN/A
1.5E+00N/A
5.5E-021.1E+006.2E-021.3E-01N/A
2.9E-03N/AN/AN/A
2.4E-02N/A
9.1E-026.0E-01N/AN/AN/AN/AN/A
2.0E-01
|jCM..U.
Risk
NCNCNCNCNCNCNCNCNCNCNCNCNCNCNC
NCNCNCNCNCNCNCNCNCNCNCNCNCNCNCNCNCNCNCNCNCNCNC
CDrOVGCN
Page 1 of 3

TABLE 7.4b RMECALCULATION OF NON-CANCER HAZARDS AND CANCER RISKS
REASONABLE MAXIMUM EXPOSUREAQUA-TECH SITE
Scenario Timeframe:Receptor Population:Receptor Age:
Future 1ResidentAdult |
Medium
Groundwater
ExposureMedium
Groundwater
ExposurePoint
Any Exposure Unit 2 location
ExposureRoute
Ingestion
Dermaland
Inhalation
Chemicalof Potential
Concern
TetrachloroetheneITialliumTrichloroethane, 1,1,1-rrichloroethcneVanadiumVinyl chloride
(Total)AluminumAntimonyArsenicBariumBenzeneBis(2-ethylhexyl)phthalateBromodichloromethaneCarbon tclrachlorideChlorobenzeneChlorocthaneChloroformChromiumCobaltDichlorobenzene, 1,4-Dichloroethane, 1,1-Dichlorocthanc, 1,2-Dichloroethene, 1,1- ~Dichloroethene, 1,2- (cis)Dichloroethcne, 1,2- (trans)IronManganeseMethyl tert butyl etherTctrachloroethane, 1,1,2,2-TetrachloroctheneThalliumTrichloroethane, 1,1,1-TricliloroetheneVanadiumVinyl chloride
' ' (Total)
v »_J: . ._, 1
EPCValue.(mg/kg)
EPC(mg/L)0.11
0.00730.0720.33
0.00400.031
N/AN/AN/AN/AN/AN/AN/AN/AN / AN/AN/AN / AN/A
• N/AN/AN/AN/AN/AN/AN/AN/AN/AN/AN/AN/AN/AN / AN / AN/A
Intake(Non-Cancer)(mg/kg'day)
3.0E-032.0E-042.0E-038.9E-031.1E-048.6E-04
N/AN/AN/AN/AN/AN/AN/AN/AN/AN/AN/AN/AN/AN/AN/AN/AN/AN/AN/AN/AN/AN/AN/AN/AN/AN/AN/AN/AN/A
Qirrmir
ReferenceDose
(mg/kg«day)
l.OE-027.0E-052.8E-013.0E-047.0E-033.0E-03
N/AN/AN/AN/AN/AN/AN/AN/AN/AN/AN/AN/AN/AN/A.N/AN/AN/AN/AN/AN/AN/AN/AN/AN/AN/AN/AN/AN/AN/A
ReferenceConcentration
(mg/m3)
N/AN/AN/AN/AN/AN/A
N/AN/AN/AN/AN/AN/AN/AN/AN/AN/AN/AN/AN/AN/AN/AN/AN/AN/AN/AN/AN/AN/AN/AN/AN/AN/AN/AN/AN/A
1HazardQuotient
3.0E-012.8E+007.0E-033.0E+011.5E-022.9E-014.0E+01
NCNCNCNC
2.0E-01NC
3.4E-047.8E-02l.OE-02l.OE-033.3E-02
NCNC
7.6E-031.5E-021.2E-025.6E-021.1E+005.3E-03
NCNC
1.5E-026.9E-033.0E-01
NC7.0E-033.0E+01
NC2.9E-013.2E+01
Intake(Cancer)
(mg/kg'day)
N/AN/AN/AN/AN/AN/A
N/AN/AN/AN/AN/AN/AN/AN/AN/AN/AN/AN/AN/AN/AN/AN/AN/AN/AN/AN/AN/AN/AN/AN/AN/AN/AN/AN/AN/A
CancerSlope Factor(mg/kg-day)'1
5.2E-02N/AN/A
4.0E-01N/A
7.5E-01
N/AN/AN/AN/AN/AN/AN/AN/AN/AN/AN/AN/AN/AN/AN/AN/AN/AN/AN/AN/AN/AN/AN/AN/AN/AN/AN/AN/AN/A
CancerRisk
NCNCNC.NCNCNCNCNCNCNCNCNCNCNCNCNCNCNCNCNCNCNCNCNCNCNCNCNCNCNCNCNCNCNCNCNCNC
Page 2 of 3

TABLE 7.4b RMECALCULATION OF NON-CANCER HAZARDS AND CANCER RISKS
REASONABLE MAXIMUM EXPOSUREAQUA-TECH SITE
Scenario Timeframe: FutureReceptor Population: ResidentReceptor Age: Adult
Medium
Landfill Gas
ExposureMedium
Air
ExposurePoint
Any Exposure Unit 2 location
ExposureRoute
Inhalation
Chemicalof Potential
Concern
BenzeneVinyl chloride
(Total)
MediumEPC
Value(mg/kg)
EPC(mg/rr?)' 0.000718
0.0007872
Intake(Non-Cancer)(mg/kg«day)
1.3E-031.4E-04
ChronicReference
Dose(mg/kg-day)
1.7E-032.9E-02
ReferenceConcentration
(mg.'nt1)
NF0.1
Total Hazard Index Across All Exposure Routes/ Pathways'
HazardQuotient
7.6E-015.0E-037.7E-01
7.3E+01
Intake(Cancer)
(mg/kg«day)
N/AN/A
v_ai"iCcr
Slope Factor(mg/kg'day)"'
2.7E-021.5E-02
Total Cancer Risk
Risk
NCNCNC
N/A
vOCO
Page 3 of 3

TABLE 7.5a RMECALCULATION OF NON-CANCER HAZARDS AND CANCER RISKS
REASONABLE MAXIMUM EXPOSUREAQUA-TECH SITE
Scenario Timeframc: Future ItReceptor Popu ation: ResidentReceptor Age: Aggregate ||
Medium
Surface Soil
ExposureMedium
Surface Soil
Exposureruiiii
Any Exposure Unit 1 location
Exposurer>~«!~
Ingestion
Dermal
Chemicalnl Pr>l»nli.l1
Concern
AldrinAluminumAntimonyAroclor-1242Aroclor-124SAroclor-1254ArsenicJarium3enzo(a)anthraccne5enzo(a)pyreneBenzo(b)fluoranthene}enzo(k)fluoranthene
Bis(2-ethylhexyl)phthalateCadmiumChromiumChryseneCopperCyanide, tolalrcm
LeadManganeseMercuryNaphthaleneNickelTetrachloroetheneThalliumToxaphenoTrichloroetheneVanadium
n'otnl)
AldrinAluminumAntimonyAroclor-1242Aroclor-1248Aroclor-1254ArsenicBariumBenzo(a)anthraceneI3enzo(a)pyrem»Benzo(b)fluorantheneBenzo(k)fluorantheneBis(2-ethylhexyl)phthalateCadmiumChromiumChf)'seneCopper
MediumEre Intake
Value 1 (Non-Concor)(mji/lc) |(mB/kK.djy)
0.006547,785
2.30.120.300.2S3.1
1,6650.370.5S0.590.41
119.11110.431163.5
45,56695
5S47.31.553
O.OSO0.910.5S0.10147
0.006547,755
2.30.120.300.283.1
1,6650.370.5S0.590.41
119.1111
0.43116
N/AN / AN/AN / AN/AN / AN / AN / AN/AN / AN / AN/AN / AN/AN/AN/AN / AN/AN / AN / AN / AN/AN / AN / AN/AN/AN/AN / AN / A
N/AN / AN/AN / AN/AN / AN / AN / AN/AN / AN / AN/AN/AN / AN / AN/AN / A
ChronicReference
DoseReference
Concentration(nt|!/lK'<liyd (n.«/m)
3.0E-05l.OE+004.0E-8-!2.0E-052.0E-052.0E-053.0E-047.0E-02
NFNFNFNF
2.0E-02l.OE-033.0E-03
NF4.0E-022.0E-023.0E-OI
NF2.0E-023.0E-042.0E-022.0E-02l.OE-027.0E-05
NF3.0E-047.0E-03
3.0E-054.0E-024.0E-061.7E-051.7E-05I.7E-052.9E-043.5E-03
NFNFNFNF
l.OE-024.4E-053.9E-05
NF2.2E-02
N/AN / AN/AN / AN/A-N / AN / AN / AN/AN / AN / AN/AN / AN/AN / AN / AN / AN/AN / AN / AN / AN/AN / AN / AN/AN/AN/AN / AN/A
N/AN / AN/AN / AN / AN / AN / AN / AN / AN/AN / AN/AN/AN/AN / AN/AN / A
«" Intake(Cancer)
|("K/k(,-«i»y)
NCNCNCNCNCNCNCNCNCNCNCNCNCNCNCNCNC
' NCNCNCNCNCNCNCNCNCNCNCNC
'""""NC""""NCNCNCNCNCNCNCNCNCNCNCNC
• NCNCNCNCNC
5.4E-094.0E-021.9E-069.8E-082.5E-072.3E-072.6E-061.4E-033. IE-074.8E-074.9E-073.4E-079.2E-067.6E-0693E-053.6E-079.7E-052.9E-063.8E-02S.2E-054.9E-046.1E-061.2E-064.5E-056.7E-087.6E-074.SE-078.2E-081.2E-04
3.6E-102.6E-041.2E-086.4E-091.7E-081.5E-081.7E-089.2E-062.0E-083.2E-OS3.2E-OS2.3E-OS6.0E-075.0E-086.1E-072.4E-086.4E-07
CancerSlope FactorlmK/k|;-iiiyV'
1.7E+01
N/AN/A
2.0E+002.0E+002.0E+001.5E+00
N/A7.3E-017.3E+007.3E-017.3E-021.4E-02N/AN/A
7.3E-03N/AN/AN / AN/AN / AN/AN/AN / A
5.2E-02N/A
1.1E+004.0E-01N/A
1.7E+01N / AN / A
2.4E+002.4E+002.4E+001.6E+00
N / A1.5E+001.5E+011.5E+001.5E-012.SE-02N/AN / A
1.5E-02N / A
CancerRisk
9.2B-08NCNC
2.0E-075.0E-074.7E-073.9E-06
NC2.3E-073.5E-063.6E-072.5E-OS1.3E-07
NCNC
2.6E-09NCNCNCNCNCNCNCNC
3.5E-09NC
5.3E-073.3E-08
NCl.OE-056.0E-09
NCNC
1.5E-083.9E-083.6E-082.7E-08
NC3.0E-OS4.6E-074.7E-OS3.3E-091.7E-08
NCNC
3.5E-10NC
f_n
•-O
CDfO
Page 1 of 4

TABLE 7.5a RMECALCULATION OF NON-CANCER HAZARDS AND CANCER RISKS
REASONABLE MAXIMUM EXPOSUREAQUA-TECH SITE
Scenario Timeframe: FutureReceptor Population: ResidentReceptor Age: Aggregate
j . Medium
Surface Soil
Groundwalcr
ExposureMedium
Surface Soil
Air
Groundwate
Exposurei'oint
Any Exposure Unit 1 location
Any Exposure Unit 1 location
Any Exposure Unit 1 location
ExposureRouie
Dermal
Inhalation
>.
Ingestion
Chemicalof "oii-niiiu
Concern
Cyanide, totalron-cadVlangancsevlercuryNaphthaleneNickelTctrachloroethenefhalliumToxapheneTrichloroetheneVanadium
(Total)AldrinAluminumAntimonyAroclor-1242Aroclor-I24SAroclor-1254ArsenicBarium3enzo(a)anthraccne3cnzo(a)pyreneBenzo(b)fluariinthcneBenzo(k)fluorantheneBis(2-ethylliexyl)phthalateGidiniujnChromiumChryseneCopperCyanide, totalIronLeadManganeseMercuryNaphthaleneNickelTetrachloroetheneThalliumToxapheneTrichloroetheneVanadium
(Total)
AluminumAntimonyArsenic
MediumEPC
V?.!"<-(mB/kB)
3.545,866
9S584
' 7.31.553
O.OSO0.910.580.10147
0.006547,785
2.30.120.300.283.1
1,6650.370.580.590.41119.1111
0.431163.5
45,866985847.31.553
. O.OSO0.910.5S0.10147
EPC(mg/L)1.9
0.00620.0050
Intake!N::r. C;r.r--T>(mn/kK'd.iy)
N / AN / A
N/AN / AN / AN/AN / AN / AN/AN / AN / AN/A
N / AN / AN / AN/AN/AN / AN/AN/AN / AN / AN/AN / AN/AN/AN / AN / AN/AN / AN / AN / AN/AN / AN / AN / AN / AN / AN / AN/AN / A
N / AN / AN / A
ChronicReference
Do?1?mK/ku-djy)
2.0E-022.6E-02
NFS.OE-043.0E-052.0E-02l.OE-03l.OE-021.4E-05
NF2.SE-04l.SE-04
NFl.OE-03
NFNFNFNFNF
1.4E-04NFNFNFNFNFNF
2.9E-05NFNFNFNFNF
1.4E-058.6E-05S.6E-04
NF1.4E-01
NFNF .
l.OE-02NF
N / AN / AN / A
ReferenceCnnrpntrarinn
(mf/m1)
N / AN / AN/AN / AN / AN/AN / AN/AN/AN / AN / AN/A
NFNFNFNFNFNFNF
5.0E-04NFNFNFNFNFNF
l.OE-04NFNFNFNFNF
5.0E-053.0E-043.0E-03
NFNFNFNFNFNF
N / AN / AN / A
1" Intake(Cancer)
(mii/ky'djy)
NCNCNCNCNCNCNCNCNCNCNCNCNCNCNCNCNCNCNCNCNCNCNCNCNCNCNCNCNCNCNCNCNCNCNCNCNCNCNCNCNCNC
""" NC"""NCNC
1.9E-082.5E-045.4E-073.2E-064.0E-088.0E-OS2.9E-074.4E-095.0E-093.2E-085.4E-098. IE-07
8.5E-101.7E-08S.2E-132.7E-087.0E-086.5E-OS1.1E-126.1E-105.0E-093.0E-091.7E-091.3E-097.5E-OS3.3E-124.0E-112.0E-084.2E-111.3E-121.7E-083.6E-112.1E-102.8E-053.3E-061.9E-113.2E-063.3E-13l.OE-084.8E-065.4E-11
2.4E-027.SE-05
NC || 6.3E-05
CancerSlope Factor(mi;/k|;»day)'1
N/AN/AN/AN / AN / AN/AN/A
5.2E-02N/A
2.2E+004.2E-01N/A
1.7E+01N/AN / A
4.0E-014.0E-014.0E-011.5E+01
N/A3.1E-013.1E+003.1E-013.1E-021.4E-026.3E+004.2E+013.1E-03N/AN/AN/AN / AN/AN / AN / AN/A
l.OE-02N / A
1.1E+004.0E-01N/A
N / AN/A
1.5E+00
1'NCNCNCNCNCNCNC
2.3E-10NC
7.0E-082.3E-09
NC7.6E-071.5E-OS
NCNC
LIE-OS2.SE-OS2.6E-OS1.7E-11
NC1.6E-099.4E-09S.2E-104.1E-111.1E-092.1E-111.7E-096.2E-11
NCNCNCNCNCNCNCNC
3.2E-08NC
1.2E-OS1.9E-06
NC"Tb'E-uiT'
NCNC
9.4E-05
CM.-* ""•>
CD
Page 2 of 4

TABLE 7.5a RMECALCULATION OF NON-CANCER HAZARDS AND CANCER RISKS
REASONABLE MAXIMUM EXPOSUREAQUA-TECH SITE
Scenario Titneframe: FutureReceptor Population: ResidentReceptor Age: Aggregate
Medium
Groundwater
ExposureMedium
Groundwator
ExposurePoint
Any Exposure Unit 1 location
ExposureRouie
Ingestion
Dermaland
Inhalation
Chemical
Concern
JariumJenzeneBis(2-elhylhexyl)phllialateJroniodichloromethane
Carbon tctrachlorideChlorobenzeneChloroethnneChloroformChromiumCobaltDichlorobenzene, 1,4-Dichloroethane, 1,1-Dichloroclliane, 1,2-Dichloroelhene, 1,1-Dichloroethene, 1,2- (cis)Dichloroethene, 1,2- (trails)IronManganeseMethyl tert butyl etherTetrachloroethane, 1,1,2,2-TetrachloroetheneThalliumTrichloroethane, 1,1,1-TrichloroetheneVanadiumVinyl chloride
(Total)AluminumAntimonyArsenicBariumBenzeneBis(2-ethylhexyl)phthnlateBromodichloromethaneCarbon tctrachlorideChlorobenzeneChloroethaneChloroformChromiumCobaltDichlorobenzfHe, 1,4-Oichloroethane, 1,1-Dichloroethane, 1,2-Dichlorocthene, 1,1-Dichloroethcne, 1,2- (cis)DicMoroethene, 1,2- (trails)
MediumHI'C
<mB/ki:)
EPC(mg/i-)0.270.0210.0051
0.000250.00200.00760.0150.012
0.007S0.032
O.OOS30.0530.0130.0180.41
0.00395.12.9
0.0160.0150.11
0.00730.0720.33
0.00400.031
N / AN/AN / AN/AN/AN / AN / AN / AN / AN / AN / AN/AN / AN/AN / AN / AN / AN / AN/A
Intake
(m K/kB .d J y)
N / AN/AN / AN/AN / AN / AN/AN / AN / AN / AN / AN / AN/AN / AN / AN / AN / AN/AN / AN / AN/AN/AN / AN / AN / AN/A
N/AN / AN / AN/AN / AN / AN / AN / AN / AN / AN / AN / AN / AN/AN / AN / AN / AN / AN/A
ChronicReference
mK/kl!'djy)
N/A
N/AN / AN/AN / AN / AN/AN / AN / AN / AN/AN / AN/AN / AN / AN / AN / AN/AN / AN/AN/AN / AN / AN/AN / AN/A
N / AN / AN / AN/AN / AN / AN / AN / AN / AN / AN / AN / AN / AN/AN / AN / AN / AN / AN/A
Reference
, / \(mj;/m]
N/A
N/AN / AN/AN / AN / AN/AN / AN / AN / AN / AN / AN/AN / AN / AN / AN / AN/AN / AN / AN/AN/AN / AN / AN / AN/A
N / AN / AN / AN/AN/AN / AN / AN / AN / AN / AN / AN / AN / AN/AN / AN / AN / AN / AN/A
1" Intake«-,„,., „!
Lms/kg.day)
NC
NCNCNCNCNCNCNCNCNCNCNCNCNCNCNCNCNCNCNCNCNCNCNCNCNCNCNCNCNCNCNCNCNCNCNCNCNCNCNCNCNCNCNCNCNC
3.4E-032.7E-U46.4E-053.1E-062.5E-059.5E-051.9E-041.5E-049.7E-054.0E-04l.OE-046.6E-041.7E-042.3E-045.1E-034.9E-056.4E-023.6E-022.0E-041.9E-041.4E-039.1E-059.0E-044.1E-035.0E-053.9E-04
N/AN/AN / AN/AN/AN/AN / AN / AN/AN/AN / AN / AN/AN/AN / AN/AN/AN / AN/A
Cancer$lnnp Factor
OnR/kg-day)'1
N / A
5.5E-021.1E+006.2E-021.3E-01N / A
2.9E-03N/AN / AN/A
2.4E-02N / A
9. IE-026.0E-01N/AN / AN/AN/AN / A
2.0E-015.2E-02
N/AN / A
4.0E-01N/A
7.5E-01
N / AN/A
1.5E+00N/A
5.5E-021.1E+006.2E-021.3E-01N/A
2.9E-03N/AN / AN / A
2.4E-02N/A
9. IE-026.0E-01N / AN/A
CancerRisk
NC1.5E-057.1E-051.9E-073.3E-06
NC5.6E-07
NCNCNC
2.5E-06NC
1.5E-051.4E-04
NCNCNCNCNC
3.8E-057.1E-05
NCNC
1.6E-03NC
3.0E-042.4E-03
NCNCNCNC
1.5E-057.1E-051.9E-073.3E-06
NC5.6E-07
NCNCNC
2.5E-06NC
1.5E-051.4E-04
NCNC
Pago 3 of 4

TABLE 7.5a RMECALCULATION OF NON-CANCER HAZARDS AND CANCER RISKS
REASONABLE MAXIMUM EXPOSUREAQUA-TECH SITE
Scenario Timeframe: FutureReceptor Population: ResidentReceptor Age: Aggregate
Medium
Groundwater
Landfill Gas
Exposure
Groundwater
Air
Exposure
Any Exposure Unit 1 location
"
Any Exposure Unit 1 location
Exposure
Dermaland
Inhalation
Inhalation
Chemical
Concern
IronManganeseMethyl tert butyl etherTetrachlorOL'thane, 1,1,2,2-TetrachloroetheneThalliumTrichloroethane, 1,1,1-TrichloroethcneVanadiumVinyl chloride
(Total)
BenzeneVinyl chloride
(Total)
MediumUPC
Val,,,,
<"1BAH>
EpC(rng7L)N / AN / AN/AN / AN/AN/AN / AN/AN/AN / A
EPCdng/m3)0.00071S0.0007872
Intake
<^.c,ay>
N / AN / AN/AN/AN / AN/AN / AN/AN / AN / A
N/AN / A
ChronicReference
0-./M,-*)
N/AN / AN/AN / AN / AN/AN / AN/AN/AN / A
1.7E-032.9E-02
Reference
(m^/m*)
N/AN / AN/AN / AN / AN/AN / AN/AN / AN / A
NF0.1
Total Hazard Index Across All Exposure Routes/ Pathways
Hazard
NCNCNCNCNCNCNCNCNCNCNC
NCNCNC
N/A
Intake
Ons/k.-d^,
N/AN/AN / AN/AN / AN/AN / AN/AN/AN/A
6. IE-046.7E-05
Cancer
N/AN/AN / A
2.0E-015.2E-02N/AN/A
4.0E-01N/A
7.5E-01
2.7E-021.5E-02
Total Cancer Risk
CahccrR'bi
NCNCNC
3.SE-057.1E-05
NCNC
1.6E-03NC
3.0E-042.3E-03
1.7E-05l.OE-06l.SE-05
4.7E-03
o
ro
Page 4 of 4
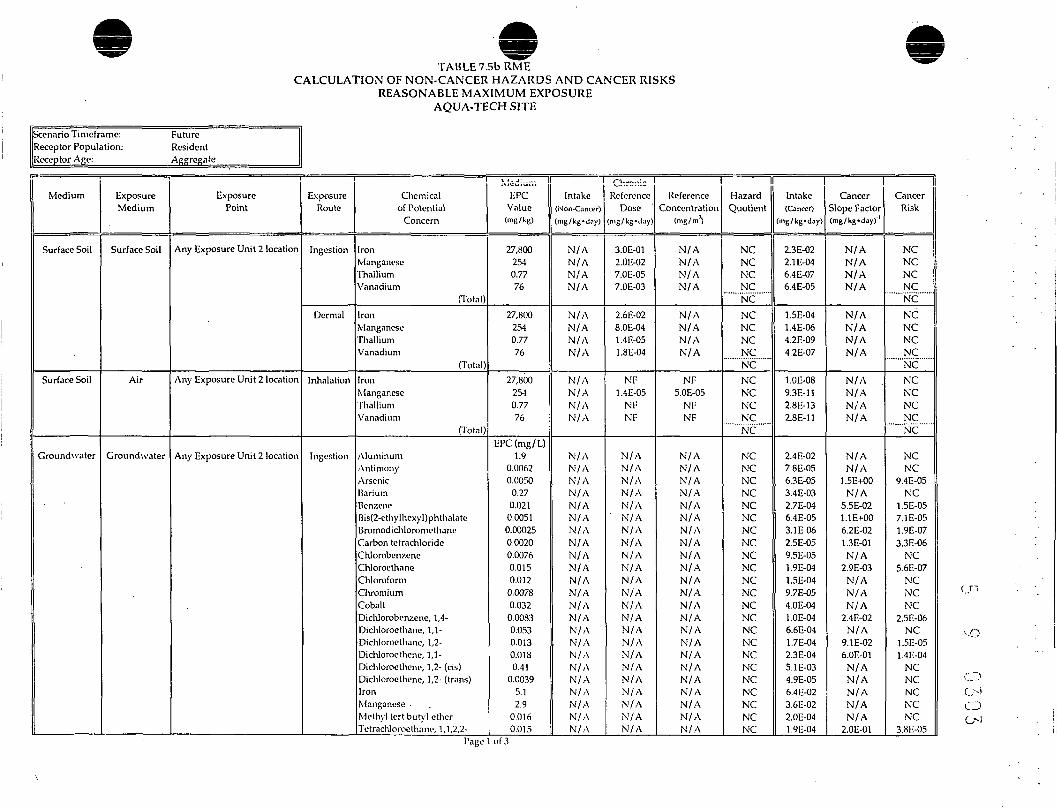
TABLE 7.5b RMECALCULATION OF NON-CANCER HAZARDS AND CANCER RISKS
REASONABLE MAXIMUM EXPOSUREAQUA-TECH SITE
Scenario Timeframe:Receptor Population:Receptor Age:
Future 1ResidentAggregate |
Medium
Surface Soil
Surface Soil
Groundwater
ExposureMedium
Surface Soil
Air
Groundwater
ExposurePoint
Any Exposure Unit 2 location
Any Exposure Unit 2 location
Any Exposure Unit 2 location
ExposureRoute
Ingestion
Dermal
Inhalation
Ingestion
iChemical
of PotentialConcern
TonVlanganeseThalliumVanadium
(Total)ironVlanganeseThalliumVanadium
(Total)IronManganeseThalliumVanadium
Octal)
AluminumAntimonyArsenicUariumBenzeneBis(2-ethylhcxyl)phthalateI3romodichloromethaneCarbon tetrachlorideChlorobenzeneChlorocthaneChloroformChromiumCobaltDichlorobenzene, 1,4-Dichloroethane, 1,1-Dichlorocthane, 1,2-Dichloroethene, 1,1-Dichlorocthcne, 1,2- (cis)Dichloroethcne, 1,2- (trans)IronManganese •Methyl tert butyl etherTetrachloroethane, 1,1,2,2-
v f ,- I*» lOduirvEPC
Value(mg/kg)
27,8002540.7776
27,8002540.7776
27,8002540.7776
EPC(mg/L)1.9
0.00620.0050
0.270.021
0.00510.000250.00200.00760.0150.0120.00780.0320.00830.0530.0130.0180.41
0.00395.12.9
0.0160.015
Intake(Non-Cancer)(mg/kg-day)
N/AN/AN/AN/A
N/AN/AN/AN/A
N/AN/AN/AN/A
N/AN/AN/AN/AN/AN/AN/AN/AN/AN/AN/AN/AN/AN/AN/AN/AN/AN/AN/AN/AN/AN / AN/A
ChrcrjcReference
Dose(mg/kg»day)
3.0E-012.0E-027.0E-057.0E-03
2.6E-028.0E-041.4E-051.8E-04
NF1.4E-05
NFNF
N/AN/AN/AN/AN/AN/AN/AN/AN/AN/AN/AN/AN/AN/AN/AN/AN/AN/AN/AN/AN/AN/AN/A
1Reference
Concentration(mg/m'1)
N/AN/AN/AN/A
N/AN/AN/AN/A
NF5.0E-05
NFNF
N/AN/AN/AN/AN/AN/AN/AN/AN/AN/AN/AN/AN/AN/AN/AN/AN/AN/AN/AN / AN/AN/AN/A
~lHazardQuotient
NCNCNCNCNCNCNCNCNCNCNCNCNCNCNC
NCNCNCNCNCNCNCNCNCNCNCNCNCNCNCNCNCNCNCNCNCNCNC
1Intake(Cancer)
(mg/kg-day)
2.3E-022.1E-046.4E-076.4E-05
1.5E-041.4E-064.2E-094.2E-07
l.OE-089.3E-112.8E-132.8E-11
2.4E-027.8E-056.3E-053.4E-032.7E-046.4E-053.1E-062.5E-059.5E-051.9E-041.5E-049.7E-054.0E-04l.OE-046.6E-041.7E-042.3E-045.1E-034.9E-056.4E-023.6E-022.0E-041.9E-04
CancerSlope Factor(mg/kg 'day)'1
N/AN/AN/AN/A
N/AN/AN/AN/A
N/A .N/AN/AN/A
N/AN/A
1.5E+00N/A
5.5E-021.1E+006.2E-021.3E-01N/A
2.9E-03N/AN/AN/A
2.4E-02N/A
9.1E-026.0E-01N/AN/AN/AN/AN/A
2.0E-01
liCancer
Risk
NCNCNCNCNCNCNCNCNC
"""""NC""""NCNCNC
- N CNC
NCNC
9.4E-05NC
1.5E-057. IE-051.9E-073.3E-06
NC5.6E-07
NCNCNC
2.5E-06NC
1.5E-051.4E-04
NCNCNCNCNC
3.8E-05Page 1 of 3
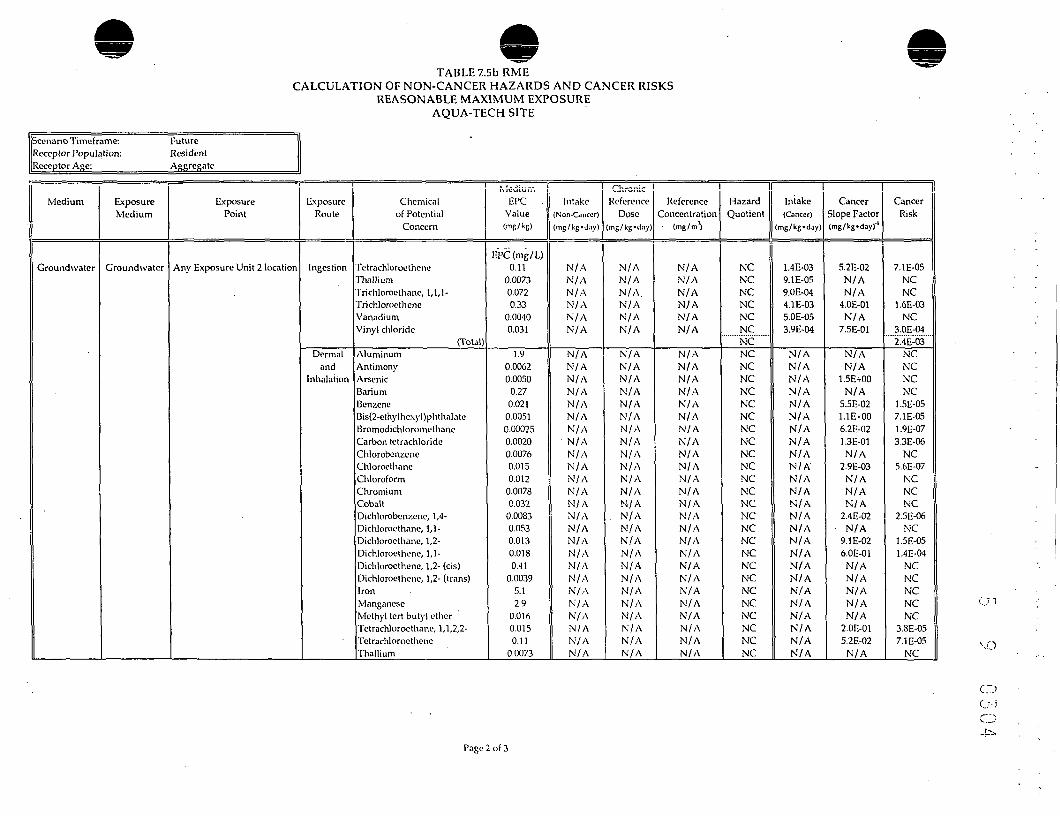
TABLE 7.5b RMECALCULATION OF NON-CANCER HAZARDS AND CANCER RISKS
REASONABLE MAXIMUM EXPOSUREAQUA-TECH SITE
Scenario Timeframe:Receptor Population:Receptor Age:____
FutureResidentAfifircfiate
Medium
Groundwater
ExposureMedium
Groundwater
ExposurePoint
Any Exposure Unit 2 location
ExposureRoute
Ingestion
Dermaland
Inhalation
Chemicalof Potential
Concern
["etrachloroetheneThallium
Trichloroethane, 1,1,1-TrichloroclheneVanadiumVinyl chloride
(Total)AluminumAntimonyArsenicBariumBenzeneBis(2-ethylhexyl)phthnlateSromodichloromethaneCarbon tetrachlorideChlorobcnzcncChlorocthancChloroformChromiumCobaltDichlorobenzcne, 1,4-Dichloroethnne, 1,1-Dichloroethane, 1,2-Dichloroethcne, 1,1-Dichloroethene, 1,2- (cis)Dichloroethene, 1,2- (trans)IronManganeseMethyl tert butyl etherTetrachloroethane, 1,1,2,2-TctrachloroctheneThallium
Medium |EPC .
Value(mg/kg)
EPC(mg/L)0.11
0.00730.0720.33
0.00400.031
1.90.00620.0050
0.270.021
0.00510.000250.00200.00760.0150.012
0.00780.032
0.00830.0530.0130.0180.41
0.00395.12.9
0.0160.0150.11
0.0073
1
Intake(Non-Cancer)(mg/kg'day)
N/AN/AN/AN/AN/AN/A
N/AN/AN/AN/AN/AN/AN/AN/AN/AN/AN/AN/AN/AN/AN/AN/AN/AN/AN/AN/AN/AN/AN/AN/AN/A
/~u _„,,:,.
ReferenceDose
(mg/kg'day)
N/AN/AN/A.N/AN/AN/A
N/AN/AN/AN/AN/AN/AN/AN/AN/AN/AN/AN/AN/A
. N/AN/AN/AN/AN/AN/AN/AN/AN/AN/AN/AN/A
1Reference
Concentration• (mg/m^)
N/AN/AN/AN/AN/AN/A
N/AN/AN/AN/AN/AN/AN/AN/AN/AN/AN/AN/AN/AN/AN/AN/AN/AN/AN/AN/AN/AN/AN/AN/AN/A
1!HazardQuotient
J
NCNCNCNCNCNCNCNCNCNCNCNCNCNCNCNCNCNCNCNCNCNCNCNCNCNCNCNCNCNCNCNC
1Intake(Cancer)
(mg/kg-day)
1.4E-039.1E-059.0E-044.1E-035.0E-053.9E-04
N/AN/AN/AN/AN/AN/AN/AN/AN/AN/AN/AN/AN/AN/AN/AN/AN/AN/AN/AN/AN/AN/AN/AN/AN/A
CancerSlope Factor(mg/kg'day)'1
5.2E-02N/AN/A
4.0E-01N/A
7.5E-01
N/AN/A
1.5E+00N/A
5.5E-021.1E+006.2E-021.3E-01N/A
2.9E-03N/AN/AN/A
2.4E-02- N/A
9.1E-026.0E-01N/AN/AN/AN/AN/A
2.0E-015.2E-02N/A
ilCancer
Risk
7.1E-05NCNC
1.6E-03NC
3.0E-042.4E-03
NCNCNCNC
1.5E-057.1E-051.9E-073.3E-06
NC5.6E-07
NCNCNC
2.5E-06NC
1.5E-051.4E-04
NCNCNCNCNC
3.8E-057. IE-05
NC
Page 2 of 3
V.——.'
-ts.

TABLE 7.5bRMECALCULATION OF NON-CANCER HAZARDS AND CANCER RISKS
REASONABLE MAXIMUM EXPOSUREAQUA-TECH SITE
Scenario Timeframc: Future 1Receptor Population: ResidentReceptor Age: Aggregate |
Medium
Groundwater
Landfill Gas
ExposureMedium
Groundwater
Air
ExposurePoint
Any Exposure Unit 2 location
Any Exposure Unit 2 location
. •
ExposureRoute
Dermaland
Inhalation
Inhalation
Chemicalof Potential
Concern
Trichloroethanc, 1,1,1-TrichloroetheneVanadiumVinyl chloride
(Total)
BenzeneVinyl chloride
(Total)
Mvdi-jmEPC
Value(mg/kg)
EPC(mg/L)0.071700.3263
• 0.0040.03
EPCdng/m3)0.000718
0.0007872
Intake(Non-Cancer)(mg/kg>day)
N/AN/AN/AN/A
N/AN/A
OironicReference
Dose(mg/kg-day)
N/AN/AN/AN/A
1.7E-032.9E-02
ReferenceConcentration
(mg/m1)
N/AN/AN/AN/A
NF0.1
1HazardQuotient
NCNCNCNCNC
NCNCNC
Total Hazard Index Across All Exposure Routes/ Pathways || N/A
Intake(Cancer)
(mg/kg»day)
N/AN/AN/AN/A
6.1E-046.7E-05
CancerSlope Factor(mg/kg'day)'1
N/A4.0E-01N/A
7.5E-01
2.7E-021.5E-02
Total Cancer Risk
CancerRisk
NC1.6E-03
NC3.0E-042.3E-03
1.7E-05l.OE-061.8E-05
4.7E-03
CDen
Page 3 of 3

TABLE 7.6a RMECALCULATION OF NON-CANCER HAZARDS AND CANCER RISKS
REASONABLE MAXIMUM EXPOSUREAQUA-TECH SITE
Scenario Timeframe:
Receptor Population:
Receptor Age:
Future
Construction Worker
Adult
Medium
Surface Soil
ExposureMedium
Surface Soil
l
Exposure
Point
Any Exposure Unit 1 location
1
Exposure
Route
Ingestion
Dermal
Chemical
of Potential
Concern
AldrinAluminumAntimonyAroclor-1242Arocior- 1248Arocior- 1254ArseniclariumBenzo(a)amliraccne3enzo(a)pyrene?enzo(b)fluoranlherie3enzo(k)fluorant!icneBis(2-cthylhexyl)phthalatcCadmiumCliroiniumChryseneCopperCyanide, totalIronLeadManganeseWercviryNaphthaleneNickelTetrachloroctheneThalliumToxaphencTrichloroetheneVanadium
(Total)AldrinAluminumAntimonyAroclor- 1 24 2Arocior- 1 248Arodur-1254ArsenicBariumBenzo(a)anthraccneBenzo(a)pyreneI)cnzo(b)nuoranthene
;,;odi;;;n '
EPC
Value(..ifi/kg)
O.OOG547.785
2.30.120.300.283.1
1.6G80.370.580.590.41
119.1111
0.431163.5
45,800985847.31.553
0.0800.910.580.10147
0.000547.785
2.30.120.300.283.1
1.CC80.370.580.59
Intake
(Nun-Cancn)
(mg/kg-day)
1.2E-089.1E-024.3E-OG2.2E-075.7E-075.3E-07G.OE-OG3.2E-037. IE-071. IE-001.1E-OG7.8E-072. IE-051.7E-052. IE-048.2E-072.2E-04G.GE-OG8.8E-021.9E-041. IE-031.4E-052.8E-OGl.OE-041.5E-071.7E-OG1.1E-OGI.9E-072.8E-04
l.GE-091.2E-035.5E-082.9E-087.3E-08G.8K-087.GE-084. IE-059. IE-081.4E-071.4E-07
Reference
Dose(mgAg'day)
3.0E-05l.OE+004.0E-045.0E-055.0E-055.0E-053.0E-047.0E-02
NFNFNFNF
2.0E-02l.OE-032.0F.-02
NF4.0E-022.0E-023.0E-01
NF1.4E-013.0E-042.0E-022.0E-02l.OE-017.0E-05
NF3.0E-047.0E-03
3.0E-054.0E-024.0E-OG4.3E-054.3E-054.3E-052.9E-043.5E-03
NFNFNF
Reference
Concentration(mg/m1}
N/AN/AN/AN/AN/AN/AN/AN/AN/AN/AN/AN/AN/AN/AN/AN/AN/AN/AN/AN/AN/AN/AN/AN/AN/AN/AN/AN/AN/A
N/AN/AN/AN/AN/AN/AN/AN/AN/AN/AN/A
1
F^ard
Quotient
4. IE-049. IE-021. IE-024.5E-031. IE-021.1E-022.0E-024.5E-02
NCNCNCNC
l.OE-031.7E-021. IE-02
NC5.5E-033.3E-042.9E-01
NC8.0E-034.GE-021.4E-045. IE-031.5E-062.5E-02
NCG.2E-044.0E-02G.5E-015.3E-052.9E-021.4E-02G.7E-04I.7E-03I.GE-032.7E-041.2E-02
NCNCNC
Intake
(Cancer)
mg/kg'day)
5.9E-114.3E-042. IE-081. IE-092.7E-092.5E-092.8E-081.5E-053.4E-095.2E-095.3E-093.7E-09l.OE-078.3E-08l.OE-063.9E-091. IE-063. IE-084.2E-048.9E-075.3E-066.6E-081.3E-084.8E-077.3E-108.2E-095.2E-098.9E-10I.3E-OG
7.5E-125.6E-062.6E-101.4E-103.5E-103.2E-IO3.6E-101.9E-074.3E-106.7E-IO6.8E-IO
CancerSlope Factor(mji/kg'day) '
1.7E+01N/AN/A
2.0E+002.0E+002.0EtOO1.5E+00N/A
7.3E-017.3EtOO7.3E-OI7.3E-021.4E-02N/AN/A
7.3E-03N/AN/AN/AN/AN/AN/AN/AN/A
5.2E-02N/A
I.IE+OO4.0E-01N/A
1.7E+01N/AN/A
2.4E+002.4E+002.4EtOOl.GE+00
N/A1.5E+00l.SE+011.5E+00
Cancer
Risk
l.OE-09NCNC
2. IE-095.5E-095. IE-094.3E-08
NC2.5E-093.8E-083.9E-092.7E-101.4E-09
NCNC
2.9E-11NCNCNCNCNCNCNCNC
3.8E-1!NC
5.8E-093.6E-10
NC1. IE-071.3E-10
NCNC
3.2E-108.2E-107.6E-IO5.7E-10
NC6.3E-109.8E-09l.OE-09
Page 1 of 4

TABLE 7.Ga RMECALCULATION OF NON-CANCER HAZARDS AND CANCER RISKS
REASONABLE MAXIMUM EXPOSUREAQUA-TECH SITE
Scenario Timeframe:
Receptor Population:
Receptor Age:
Future
Construction WorkerAdult
Medium
Surface Soil
i
Exposure
Medium
Surface Soil
Air
1
Exposure
Point
Any Exposure Unit 1 location
Any Exposure Unit 1 location
Exposure
Route
Dermal
Inhalation
Chemical
of Potent Jal
Concern
ienzo(k)f!uoranthcneBis(2-othylhcxyl)pli(liala(c"actiniumChromiumChryseneCopperCyanide, totalron.eadManganesevlercuryNaphthaleneNickelTetrachloroethencThalliumToxaphcneTrichloroetheneVanadium
(Total)AldriiiAluminumAntimonyAroclor-1242Aroclor-12-18Aroclor-1254Arsenic •BariumBenzo(a)anthraceneBcnzo(a)pyrcneBcnzo(b)DuoraMthcneBenzo(k)fhiorantheneBis(2-ethy1hcxyl)phthaluicCadmiumChromiumChryseneCopperCyanide, totalIronLeadManganeseMercury
M,.,,:...,, 1
EPCValue
(ing/ kg)
0.41119.1111
0.431103.5
45.8GO985847.31.553
0.0800.910.580.10147
0.000547.785
2.30.120.300.283.1
1.6G80.370.580.590.41
119.1111
0.431163.5
45.80C985847.3
Intake
(Nun-CanciT)(mg/kg-day)
l.OE-07
2.7E-OG2.2E-072.7E-QG1. IE-072.8E-008.5E-081. IE-032.4E-OGI.4E-051.8E-073.GE-071.3E-OG2.0E-082.2E-081.4E-072.4E-083.GE-OG
I.9E-098.0E-083.8E-126.3E-08 .1.6E-071.5E-075.2E-I22.8E-091.2E-087.0E-093.9E-093.0E-091.7E-071.5E-111.9E-104.6K-081.9E-105.8E-127.7E-08l.GE-109.8E-106.5E-05
Reference
Dose(mg/kK'day)
NFI.OE-024.4E-052.GE-04
NF2.2E-022.0E-022.GE-02
NF5.0E-033.0E-052.0E-021.0E.03l.OE-011.4E-05
NF2.8E-041.8E-04
NFl.OE-03
NFNFNFNFNF
I.4E-03NFNFNFNFNFNF
2.9E-05NFNFNFNFNF
1.4E-058.GE-05
Reference
Concentration(inn/m1)
N/AN/AN/AN/AN/AN/AN/AN/AN/AN/AN/AN/AN/AN/AN/AN/AN/AN/A
NFNFNFNFNFNFNF
5.0E-03NFNFNFNFNFNF
l.OE-04NFNFNFNFNF
5.0E-053.0E-04
1
Hazard
Quotient
NC2.7E-045.1E-03l.OE-02
NC1.3E-044.2E-064.4E-02
NC2.6E-035.9E-031.8E-051.3E-032.0E-071.6E-03
NC8.5E-052.0E-02_____....
NC8.0E-05
NCNCNCNCNC
2.0E-06NCNCNCNCNCNC
6.5E-06NCNCNCNCNC
6.9E-057.6E-01
Intake(Cancer)
mg/kg-day)
4.8E-10
1.3E-081.1E-091.3E-085.0E-101.4E-084.0E-105.3E-061. IE-086.8E-088.5E-101.7E-096.2E-099.4E-111. IE-106.7E-101. IE-101.7E-08
9.3E-123.8E-101.8E-143.0E-107.7E-107.1E-102.5E-141.3E-115.5E-113.3E-111.8E-111.4E-118.3E-107.3E-148.9E-132.2E-IO9.3E-132.8E-143.7E-107.8E-134.7E-123.1E-07
CancerSlope Factor(mg/ks-day)'1
1.5E-012.8E-02N/AN/A
1.5E-02N/AN/AN/AN/AN/AN/AN/AN/A
5.2E-02N/A
2.2E+004.2E-01N/A
1.7E+01N/AN/A
4.0E-014.0E-OI4.0E-011.5E+01N/A
3.1E-013.1E+003.IE-013. IE-021.4E-02
G.3E+004.2E+013. IE-03N/AN/AN/AN/AN/AN/A
1Cancer
Risk
7.0E-113.6E-10
NCNC
7.3E-12NCNCNCNCNCNCNCNC
4.9E-12NC
1.5E-094.8E-11
NC"TcE-ii""
1.6E-10NCNC
1.2E-IO3.IE-102.9E-103.8E-13
NC1.7E-11l.OE-105.7E-124.5E-13I.2E-114.0E-133.7E-11fi.SE-13
NCNCNCNCNCNC
f.n
vo
o
CD
Page 2 of 4

TABLE 7.Ga RMECALCULATION OF NON-CANCER HAZARDS AND CANCER RISKS
REASONABLE MAXIMUM EXPOSUREAQUA-TECH SITE
Scenario Timeframe:
Receptor Population:Receptor Age:
Future
Construction Worker'Adult
Medium
Surface Soil
Subsurface Soil
Exposure
Medium
Air
Subsurface Soil
ExposurePoint
Any Exposure Unit 1 location
Any Exposure Unit 1 location
I
Exposure
Route
Inhalation
Ingcstion
Dermal
1
Chemical
of PotentialConcern
•JaphthaleneNickel'etrachloroethene
ThalliumToxaphenefrichloroctticne
Vanadium(Total)
Aroclor 1242Aroclor 12-18Aroclor 1254ArsenicJenzo(a)anthraceneJenzo(a)pyrene3enzo(lj)fluoranthenQJen7o(k)fliio>aiithencChromium"hryseneDichloroelhenc. 1.1-DicMoroethene, cis-1,2-ndeno(1.2.3-cd)pyrcne.
IronTetrachloroctheneThalliumTolueneTrichloroethene
(Total)Aroclor 1242Aroclor 1248Aroclor 1254ArsenicBcnzo(a)anlhraceneBenzo(a)pyreneBenza(b)fiuoraniheneBonzo(k)fluoranlhcneChromiumChryseneDichloroethenc. 1,1-Dicliloroelhpne, cis-l.Z-Indcno(1.2,3-cd)pyriMieIron
............ iEPC
Value(ing/kR)
1.553
0.0800.910.580.10147
4.00.310.31•1.10.980.550.8-10.7384
0.870.270.29O.G4
43.820124127.650
4.00.310.314.1
0.980.550.840.7384
0.870.270.29O.C4
43,820
Intake
(Nun-Cancer)(mu/kK'day)
7.7E-06
8.9E-117.3E-OG1.5E-122.4E-081. IE-052.51MO
7.6E-OG5.8E-075.8E-077.9E-001.9E-OCl.OE-OGl.GE-OG1.4E-OGl.GE-041.7E-OG5.2E-075.5E-071.2E-OG8.4E-022.4E-042.2E-051.4E-059.5E-05
9.8E-077.5E-087.5E-08l.OE-072.4E-071.3E-072.0E-071.8E-072.0E-OG2.1E-07G.GE-087.0E-08l.GE-071. IE-03
Reference
Dose(ms/kifday)
8.6E-04
NF1.4E-01
NFNF
l.OE-02NF
5.0E-05 (1)5.0E-05 (1)5.0E-05 (1)
3.0E-04NFNFNFNF
2.0E-02 (1)NF
9.0E-03I.OE-01 (1)• NF3.0E-01
l.OE-01 (1)7.0E-052.0E-013.0E-04
4.3E-05 (1)4.3E-05 (1)4.3E-05 (1)
2.9E-04NFNFNFNF
2.GE-04 (1)NF
9.0E-038.0E-02 (1)
NF2.GE-02
Reference
Concentratio/i(riiR/m1)
3.0E-03NFNFNFNFNFNF
N/AN/AN/AN/AN/AN/AN/AN/AN/AN/AN/AN/AN/AN/AN/AN/AN/AN/A
N/AN/AN/AN/AN/AN/AN/AN/AN/AN/AN/AN/AN/AN/A
Hazard
Quotient
8.9E-03NC
5.2E-05. NC
NC1. IE-03
NC7.7E-011.5E-OI1.2E-02I.2E-022.GE-02
NCNCNCNC
8.0E-03NC
5.7E-055.5E-06
NC2.8E-012.4E-033.2E-017.2E-053.2E-01I.IEtOO2.3E-021.8E-031.8E-033.GE-04
NCNCNCNC
7.9E-03NC
7.3E-OG8.7E-07
NC4.2E-02
Intake
(Cancer)
mB/kyday)
3.6E-084.3E-133.5E-087.2E-151. IE-105.2E-081.2E-12
3.6E-082.8E-092.8E-093.8E-088.9E-095.0E-097.6E-096.6E-097.GE-077.9E-092.5E-092.GE-095.8E-094.0E-041.1E-061. IE-076.9E-084.5E-07
4.7E-093.6E-103.6E-104.8E-10I. IE-09G.4E-109.7E-108.5E-109.8E-09l.OE-093.1E-103.3E-107.5E-105. IE-06
Cancer
Slope Factor(mg/kj-'day) '
N/A
N/Al.OE-02N/A
I.I Ei-004.0E-01N/A
Z.OE+002.0E+002.0E+001.5E+007.3E-017.3E+007.3E-017.3E-02N/A
7.3E-036.0E-01N/A
7.3E-01N/A
5.2E-02N/AN/A
4.0E-01
2.4E+002.4E+002.4E+001.6E+001.5E+001.5E+011.5E+001.5E-01N/A
1.5E-026.0E-01N/A
1.5E+00N/A
ll1
Cancer
Risk
NCNC
3.5E-10NC
1.3E-102. IE-08
NC1.5E-097.3E-085.6E-095.6E-095.7E-086.5E-093.GE-085.5E-094.8E-10
NC5.SE-111.5E-09
NC4.2E-09
NC5.9E-08
NCNC
1.8E-074.3E-071. IE-088.4E-108.4E-107.6E-10I.7E-099.4E-091.4E-091.2E-10
NC1.5E-111.9E-IO
NC1. IE-09
NC
oGO
Page 3 of 4

TABLE 7.Ca RMECALCULATION OF NON-CANCER HAZARDS AND CANCER RISKS
REASONABLE MAXIMUM EXPOSUREAQUA-TECH SITE
Scenario Timcframe:
Receptor Population:
Receptor Age:
Future
Construction Worker
Adult
Medium
Subsurface Soil
Subsurface Soil
Landfill Gas
Exposure
Medium
Subsurface Soil
Air
Air
1
Exposure
Point
Any Exposure Unit 1 location
Any Exposure Unit 1 location
Any Exposure Unit 1 location
1
Exposure
Route
Dermal
Inhalation
Inhalation
Chemical
of Potential
Concern
retrachloroctheneThalliumTolueneTrichloroethene
(Total)Aroclor 1242Aroclor 1248Aroclor 1254Arsenic8enzo(a)anthraceneBenzo(a}pyrene3enzo(h)nuoranlhcneBetizo(k)fluorantheneChromiumChrysoncDichloroetliciie, 1.1-Dichloroethene. cis-1.2-Indeno(l,2,3-cd)pyreneIronTetrachloroelheneThalliumTolueneTrichloroethene
(Tolal)
BenzeneVinyl chloride
(Tolal)
Mpr l l i i i n
EPC
Value(mB/kg)
124127.650
4.00.310.314.10.980.550.840.7384
0.870.270.290.64
43,820124127.G50
EPCJrng/iji1)0.000718 '
0.0007872
Intake
(Nuu.Canccrl
(mR/kg'day)
3.0E-05
2.9E-071.9E-OG1.2E-05
1.8E-171.4E-181.4E-187.0E-122.6E-195.7E-204.7E-204.6E-20I.4E-IO8.0E-194.7E-I62.2E-1G2.8E-207.4E-089.7E-142.0E-114.8E-154.8E-14
1.4E-031.5E-04
Reference
Dose(mg/kg-day)
l.OE-01 (1)1.4E-052.0E-012.8E-04
NFNFNFNFNFNFNFNF
2.9E-05NFNFNFNFNF
1.4E-01NF
1.1E-01l.OE-02
I.7E-032.9E-02
Reference
Concentration(ms/m1)
N/AN/AN/AN/A
NFNFNFNFNFNFNFNF
I.OE-04NFNFNFNFNFNFNF
4.0E-01NF
NFl.OE-01
To al Hazard Index Across All Exposure Routes/Pathways
1Hazard
Quotient
3.0E-042.0E-029.3E-064.3E-02.____,....
NCNCNCNCNCNCNCNC
4.9E-OGNCNCNCNC
• NC7.0E-13
NC4.2E-144.8E-J2
"TflE'-bF"
8.2E-015.4E-03
""O'E-oi""3.7E+00
Intake
(Cancer)
mg/kg'day)
1.4E-071.4E-098.8E-095.8E-08
8.8E-206.7E-216.7E-213.3E-141.2E-212.7E-222.2E-222.2E-226.7E-I33.8E-212.3E-181. IE-181.3E-223.5E-104.6E-169.3E-142.3E-172.3E-16
6.7E-067.3E-07
CancerSlope Factor(mg/kgMay)-'
5.2E-02N/AN/A
4.2E-OI
4.0E-014.0E-014.0E-011.5E+013.1E-013.1E+003.1E-013. IE-024.2E+013.1E-031.8E-01N/A
3. IE-01N/A
l.OE-02N/AN/A
4.0E-01
2.7E-021.5E-02
Total Cancer Risk
Cancer
Risk
7.5E-09NCNC
2.4E-08..„„...
3.5E-202.7E-212.7E-215.0E-133.9E-228.4E-226.9E-23G.8E-242.8E-111.2E-234.0E-19
NC4.2E-23
NC4.GE-18
NCNC
9.1E-172.9E-I1
1.8E-071. IE-08_...„„„._._....
8. IE-07
(1) Indicates that the RfD or RfC is a subchronic value. All others are chronic values.
o
CJvO
Page 4 of 4
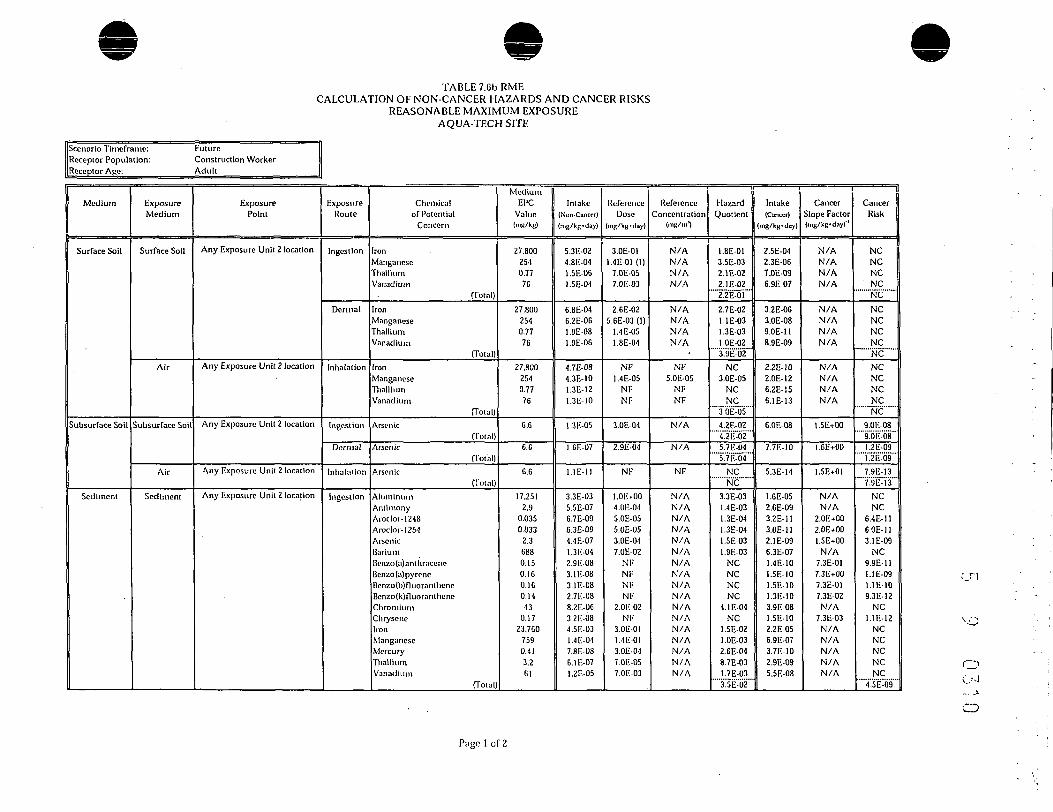
TABLE 7.6b RMECALCULATION OF NON-CANCER HAZARDS AND CANCER RISKS
REASONABLE MAXIMUM EXPOSUREAQUA-TECH SITE
Scenario Timeframe: FutureAcceptor Population: Construction WorkerAcceptor Age: Adult
Medium
Surface Soil
Subsurface Soil
Sediment
ExposureMedium
Surface Soil
Air
Subsurface Soil
Air
Sediment
ExposurePoint
Any Exposure Unit 2 location
Any Exposure Unit 2 location
Any Exposure Unit 2 location
Any Exposure Unil 2 location
Any Exposure Unit 2 location
ExposureRoute
Ingcstlon
Dermal
Inhalation
Ingcstiun
Dermal
Inhalat ion
Ingcstion
Chemicalof Potential
Concern
ronManganese
ThalliumVanadium
(Total)ronManganeseThalliumVanadium
(Total)ronManganeseThalliumVanadium
(Total)Arsenic
(Total)Arsenic
(Total)Arsenic
(Total)AluminumAntimonyAroclor-1248Aroclor-1254ArsenicSariumBenzo(a)anthraceneBenzo(a)pyreneBenzo(b)nuoramhcncBenzo(k)fluorantlieneChromiumChryseneIronManganeseMercuryThalliumVanadium
(Total)
MediumEPC
Value(niB/ks)
27.80025.)0.7775
27,8002540.7776
27.8002540.7776
6.6
6,6
G.6
17.2512.9
0.0350.033
2.36880,150.160.160.1443
0.1723.760
7590.413.261
Intake(Nun-CanctT)(ms/k|i-day)
5.3E-024.8E-041.5E-OG1.5E-04
6.8E-046.2E-061.9E-081.9E-06
4.7E-084.3E-IO1.3E-121.3E-10
1.3E-05
1.6E-07
1. IE-11
3.3E-035.5E-076.7E-096.3E-094.4E-071.3E-042.9E-083. IE-083.1E-082.7E-088.2E-063.2E-084.5E-031.4E-047.8E-086.1E-071.2E-05
ReferenceDose
(ing/ks-day)
3.0E-0!1.4E-01 (1)
7.0E-057.0E-03
2.6E-025.6E-03 (1)
1.4E-051.8E-04
NF1.4E-05
NFNF
3.0E-04
2.9E-04
NF
l.OE+004.0E-045.0E-055.0E-053.0E-047.0E-02
NFNFNFNF
2.0E-02NF
3.0E-011.4E-013.0E-047.0E-057.0E-03
ReferenceConcentration
(ms/ml
N/AN/AN/AN/A
N/AN/AN/AN/A
NF5.0E-05
NFNF
N/A
N/A
NF
N/AN/AN/AN/AN/AN/AN/AN/AN/AN/AN/AN/AN/AN/AN/AN/AN/A
HazardQuotient
1.8E-013.5E-032. IE-022. IE-022.2E-012.7E-021. IE-031.3E-03l.OE-02
'"3.91-02"NC
3.0E-05NCNC
"TOE-OS"4.2E-024.2E-025.7E-045.7E-04
NCNC
3.3E-03.4E-03.3E-04.3E-04.5E-03.9E-03NCNCNCNC
4. IE-04NC
1.5E-02l.OE-032.6E-048.7E-031.7E-033.5E-02
Intake(Cancer)
mS/k8-day)
2.5E-042.3E-067.0E-096.9E-07
3.2E-063.0E-089.0E-118.9E-09
2.2E-102.0E-126.2E-156.1E-13
6.0E-08
7.7E-10
5.3E-14
1.6E-052.6E-093.2E-113.0E-1!2.1E-096.3E-071.4E-101.5E-IO1.5E-101.3E-103.9E-081.5E-102.2E-056.9E-073.7E-102.9E-095.5E-08
CancerSlope Factor(ms/kg-day)'1
N/AN/AN/AN/A
N/AN/AN/AN/A
N/AN/AN/AN/A
1.5E+00
I.6E+00
I.5E+01
N/AN/A
2.0E+002.0E+OD1.5E+00N/A
7.3E-017.3E+007.3E-017.3E-02N/A
7.3E-03N/AN/AN/AN/AN/A
11Cancer
Risk
NCNCNCNCNCNCNCNCNC
""""NC""""NCNCNCNC
"""NC""""9.0E-089.0E-081.2E-09
"T.2E-09"7.9E-137.9E-13
NCNC
6.4E-1I6.0E-113. IE-09
NC9.9E-11I. IE-091. IE-109.3E-12
NC1.1E-12
NCNCNCNCNC
4.5E-09 (..--I... -iCD
Page 1 of 2

TABLE 7.6b RMECALCULATION OF NON-CANCER HAZARDS AND CANCER RISKS
REASONABLE MAXIMUM EXPOSUREAQUA-TECH SITE
Scenario Tlmeframe: FutureAcceptor Population: Construction WorkerReceptor ARC: Adult
Medium
Sediment
Landfill Gas
ExposureMedium
Sediment
Air
Air
ExposurePoint
Any Exposure Unit 2 location
Any Exposure Unit 2 location
Any Exposure Unit 2 location
ExposureRoute
Dermal
Inhalation
Inhalation
Chemicalof Potential
Concern
AluminumAntimonyAroclor-1248Arodor-1254ArsenicBarium3enzo(a)anthraccneienzo(a)pyrene3enzo(b)fluoranthene3enzo(k)fluoranthcneChromiumChryscneIronManganeseMercuryThalliumVanadium
(Total)AluminumAntimonyAroclor-1248Aroclor- 1 254ArsenicBarium[Jcnzo(a)amhraccneBenzo(a)pyrcncBenzo(b)ftuorantheneBenzo{k)fluorantheneChromiumChryseneIronManganeseMercuryThalliumVanadium
(Total)
BenzeneVinyl chloride
(Total)
MediumEPC
Value(mis/kfi)
17.2512.9
0.0350.033
2.3G880.150.1G0.160.1443
0.1723,760
7590.413.2Gl
17.2512.9
0.0350.033
2.3G880.15O.IGO.IG0.1443
0.1723,760
7590.413.2Gl
EPC(mg/nf)"0000718*0.0007872
Intake(Non-Cancer)(mg/kg'day)
4.2E-057.1E-098.GE-108. IE- 105.GE-091.7E-OG3.7E-093.9E-093.9E-093.4E-091. IE-074.2E-095.8E-051.9E-06l.OE-097.8E-091.5E-07
2.9E-094.9E-I31.9E-091.8E-093.9E-131.2E-IO4.7E-101.9E-101. IE-10l.OE-IO7.2E-121.8E-094.0F.-091.3E-103.7E-075.4E-I3l.OE-11
1.4E-031.5E-04
ReferenceDose
(MiR/kg-day)
4.0E-024.0E-OG4.3E-054.3E-052.9E-043.5E-03
NFNFNFNF
2.GE-04NF
2.6E-025.GE-033.0E-051.4E-051.8E-04
l.OE-03NFNFNFNF
1.4E-03NFNFNFNF
2.9E-05NFNF
1.4E-058.GE-05
NFNF
1.7E-032.9E-02
ReferenceConcentration
(mg/m1)
N/AN/AN/AN/AN/AN/AN/AN/AN/AN/AN/AN/AN/AN/AN/AN/AN/A
NFNFNFNFNF
5.0E-03NFNFNFNF
l.OE-04NFNF
5.0E-053.0E-04
NFNF
NF0.1
Total Hazard Index Across All Exposure Routes/Pathways
HazardQuotient
1.1E-031.8E-032.0E-051.9E-052.0E-054.8E-04
NCNCNCNC
4.0E-04NC
2.3E-033.3E-043.3E-055.6E-048.2E-04....__._
2.9E-06NCNCNCNC
8.1E-08NC
• NCNCNC
2.5E-07NCNC
8.9E-064.3E-03
NCNC
"T3E-03"
8.2E-OI5.4E-038.3E-01
1.2E+00
Intake(Cancer)
mg/kg'day)
2.0E-073.4E-114.1E-123.8E-122.7E-118.0E-091.7E-111.9E-111.9E-111.6E-115.0E-102.0E-112.8E-078.8E-094.8E-123.7E-117. IE-10
1.4E-112.3E-I59.0E-128.4 E- 121.8E-155.5E-132.2E-129.2E-135.0E-134.9E-133.4E-148.7E-121.9E-116.1E-131.7E-092.6E-154.9E-14
6.7E-067.3E-07
CancerSlope Factor(mg/kg-day)'1
N/AN/A
2.4E+002.4E+001.6E+00
N/A1.5E+001.5E+011.5E+001.5E-01N/A
1.5E-02N/AN/AN/AN/AN/A
N/AN/A
4.0E-014.0E-011.5E+01
N/A3.IE-013.1E+003.1E-OI3. IE-024.2E+013. IE-03N/AN/AN/AN/A
' N/A
2.7E-021.5E-02
Total Cancer Risk
CancerRisk
NCNC
9.6E-129.0E-124.2E-11
NC2.6E-112.7E-102.7E-112.4E-12
NC2.9E-13
NCNCNCNCNC
"T9E-To"NCNC
3.6E-123.4E-122.8E-14
NCG.9E-I32.9E-12l.GE-131.5E-141.4E-122.7E-14
NCNCNCNCNC
"T.2E-71""
1.8E-071. IE-081.9E-07
2.9E-07
CDC ••.'
(1) Indicates that the RID or RfC is a subchronic value. All others ore chronic values.
Page 2 of 2

TABLE 7.7 RMECALCULATION OF NON-CANCER HAZARDS AND CANCER RISKS
REASONABLE MAXIMUM EXPOSUREAQUA-TECH SITE
Scenario Timeframe:
Receptor Population:
Receptor ARC:
FutureOther Worker(Irrigation Maint)Adult
1Medium
Ground iv.iter
exposure
Medium
Croundwater
liA|>G5ui"c
Point
Any EU- 1 or EU-2 location
-OR^FW!
Ex«c=-jrc'Route
digestion
Derma!
Ch'-':r!!C?Jof Potential
Concern
AluminumAntimonyArsenicJariumienzeneBis(2-ethylhexyl)phthalateiroinodichloromcthane
Carbon tetrachloridcChlorobcnzeneIhloroethaneChloroformChromiumCobaltDichlorobenzene, 1,4-Dichloroethane, 1,1-Dichloroethane, 1,2-Dichloroethene, 1,1-Dichloroethene, l,2-(cis)Dichloroethene, 1,2- (trans)ironManganeseMethyl tert butyl etherTetrachloroethane, 1,1,2,2-TctrachloroetheneThalliumTrichloroethane, 1,1,1-TrichloroetheneVanadiumVinyl chloride
(Total)AluminumAntimonyArsenicBariumBenzeneBis(2-cthylhexyl)phthalateBromodichloromethaneCnrl'on tetrachlorideChlorobenxeneChlorocthaneCliloroformChromiumCobaltDichlorobenzene, 1,4-Dichloroethane, 1,1-Dichloroethane, 1,2-Dichloroethene, 1,1-Dichforoethene, 1,2- (cis)
,PC \Value(rn«/L>
1.90.00620.0050
0.270.0210.0051
0.000250.00200.00760.0150.012
0.00780.032
O.OOS30.0530.0130.0180.41
0.00395.12.9
0.0160.0150.11
0.00730.0720.33
0.00400.031
1.90.00620.00500.270.0210.00510.000250.00200.00760.0150.012
0.00780.032
0.00830.0530.0130.0180.41
Intake(Non-CjnCi-r)
{m£/V.K'd.jy}
4.SE-05
1.6E-071.3E-076.8E-065.4E-071.3E-076.3E-095.0E-081.9E-073.8E-073. IE-071.9E-078.0E-072. IE-071.3E-063.4E-074.6B-07l.OE-059.8E-081.3E-047.3E-054.0E-073.8E-072.7E-06l.SE-071.6E-068.2E-069.9E-087.9E-07
2.4E-057.SE-OS6.3E-083.4E-065.6E-061.3E-07l.SE-085.5E-073.9E-061.5E-061.4E-069.7E-084.0E-076.4E-065.9E-068.9E-073.7F.-065. IE-05
ReferenceDose
m|4/kB-day)
l.OE+004.0E-043.0E-047.0E-023.0E-03
NF2.0E-027.0E-042.0E-024.0E-01l.OE-023.0E-032.0E-023.0E-02'l.OE-013.0E-029.0E-03l.OE-022.0E-023.0E-012.0E-023.0E-026.0E-02l.OE-027.0E-052.SE-013.0E-047.0E-033.0E-03
4.0E-024.0E-062.9E-043.5E-032.7E-03
NF2.0E-026.0E-046.2E-033.2E-01l.OE-023.9E-055.0E-033.0E-028.0E-023.0E-029.0E-038.0E-03
ReferenceConcentration
(ms/mJ)
N/AN/AN/AN/AN/AN/AN/AN/AN/AN/AN/AN/A'N/AN/AN/AN/AN/AN/AN/AN/AN/AN/AN/AN/AN/AN/AN/AN/AN/A
N/AN/AN/AN/AN/AN/AN/AN/AN/AN/AN/AN/AN/AN/AN/AN/AN/AN/A
1Haz.ird IQuotient •
|
4.8E-053.9E-044.2E-049.7E-OS1.8E-04
NC3.1 E-077.2E-059.5E-069.6E-073.1E-056.5E-054.0E-056.9E-061.3E-051.1E-055.1E-05l.OE-034.9E-064.3E-043.6E-031.3E-056.3E-062.7E-042.6E-036.4E-062.7E-021.4E-052.6E-043.7E-026.0E-041.9E-022.2E-049.7E-042. IE-03
NC9.3E-079.3E-046.3E-044.8E-06I.4E-042.5E-038.0E-052. IE-047.4E-053.0E-054.1E-046.4E-03
Intake(Cancer)
(mii/kn-day)
1.7E-055.5E-084.5E-082.4E-061.9E-074.6E-082.2E-091.8E-086.SE-OS1.4 E-071.1 E-077.0E-082.9E-077.4E-084.7E-071.2E-071.6E-073.6E-063.5E-084.6E-052.6E-051.4E-071.3E-079.8E-076.5E-086.4 E-072.9E-063.5E-082.8E-07
S.5E-062.8E-082.2E-081.2E-062.0E-064.SE-086.5E-092.0E-071.4E-065.5E-074.9E-073.5E-081.4E-072.3E-062.1E-063.2E-071.3E-06l.SE-05
CancerSlope Factor(ms/ku-dj,.)-'
N/AN/A
1.5E+00N/A
5.5E-021.1E+006.2E-021.3E-01N/A
2.9E-03N/AN/AN/A
2.4E-02N/A
9.1E-026.0E-01N/AN/AN/AN/AN/A
2.0E-015.2E-02
N/AN/A
4.0E-01N/A
7.5E-01
N/AN/A
1.6E+00N/A
6.1E-021.1E+006.3E-021.5E-01N/A
3.6E-03N/AN/AN/A
2.4E-02N/A
9. IE-026.0E-01N/A
CancerRisk
NCNC
6.7E-08NC
1. IE-085.0E-081.4E-102.3E-09
NC4.0E-10
NCNCNC
l.SE-09NC
1. IE-089.8E-08
NCNCNCNCNC
2.7E-085. IE-08
NCNC
1 .2E-06NC
2.1E-071.7E-06
NCNC
3.5E-08NC
1.2E-075.4E-084.1E-103.0E-08
NC2.0E-09
NCNCNC
5.5E-08NC
2.9E-087.8E-07
NC
D
ro
Page 1 of 3

TABLE 7.7 RMECALCULATION OF NON-CANCER HAZARDS AND CANCER RISKS
REASONABLE MAXIMUM EXPOSUREAQUA-TECH SITE
Scenario Timeframe:
Receptor Population:
Receptor ARC:
FutureOther Worker(Irrigation Maint)Adult
Medium
Groundwaier
ExposureMedium
Gruundwater
Air
ExposurePoint
Any EU- 1 or EU-2 location
Any EU- 1 or EU-2 location
ExposureRoute
Dermal
Inhalation
Chemicalof Potential
Concern
Dichloroethene, 1,2- (trans)ronManganeseMethyl tert butyl etherTelrachloroethane, 1,1,2,2-PetrachloroetheneThalliumTrichloroethane, 1,1,1-TrichloroetheneVanadiumVinyl chloride
(Total)AluminumAntimonyArsenicUariumBenzeneBis(2-ethylhexyl)phthalateBromodichloromelhaneCarbon tetrachforideChlorobenzencChloroethaneChloroformChromiumCobaltDt'chlorobenzene, 1,4-Dichloroethane, 1,1-Dictiloroethane, 1,2-Dichloroethene, 1,1- •Dichloroethene, 1,2- (cis)Dichloroetlicne, 1,2- (trans)IronManganeseMethyl terl butyl etherTetrachloroethane, 1,1,2,2-
r.rCValue(mB/U
0.00395.12.9
0.0160.015
•0.110.00730.0720.33
O.OWO0.031
1.9,0.00620.00500.270.021
0.00510.000250.00200.00760.0150.012
0.007S0.0320.00830.0530.0130.0180.41
0.00395.12.9
0.0160.015
(Min-Cmm)
(mB/VB'djy)
4.9E-076.4E-053.6E-056.0E-071.7E-066.6E-059.1E-08I.5E-056.5E-054.9E-OS2.9E-06
N/AN/AN/AN/A
3.3E-065.0E-103.SE-083.7E-071. IE-062.6E-061.9E-06N/AN/A
1. IE-068.5E-062.0E-063.2E-066.6E-056.6E-07N/AN/A
2.3E-061.7E-06
n.,._™
Dosem8/k|i'd»y)
1.6E-02
2.6E-02S.OE-043.0E-024.8E-021.0E-021.4E-052.8E-012.8E-041.8E-042.6E-03
l.OE-03NFNF
1.4E-041.7E-03
NFNF
5.7E-041.7E-022.9E+008.6E-052.9E-05S.OE-062.3E-0)1.4E-011.4E-03
NFNFNFNF
1.4E-058.6E-01
NF
PoF,.r...ir» -
Concentration(ms/nrt
N/AN/AN/AN/AN/AN/AN/AN/AN/AN/AN/A
NFNFNF
5.0E-04NFNFNFNFNF
l.OE+01NF
l.OE-04NF
8.0E-OI5.0E-01
NFNFNFNFNF
5.0E-053.0E+00
NF
Hn7.ird 1Quotient
3.1E-052.5E-034.5E-022.0E-053.5E-056.6E-036.5E-035.5E-052.3E-012.7E-041. IE-03....__.......
NCNCNCNC
1.9E-03NCNC
6.4E-046.5E-OS9. IE-072.2E-02
NCNC
4.9E-066.0E-051.4E-03
NCNCNCNCNC
2.7E-06NC
Intake(One,-,)
(rttB/kR*day)
1.7E-072.3E-OS1.3E-052. IE-076.0E-072.3E-053.2E-085.5E-062.3E-051.8E-08l.OE-06
N/AN/AN/AN/A
1.2E-061.8E-101.4E-081.3E-073.9E-079.3E-076.8E-07N/AN/A
4.0E-073.0E-067.1E-071. IE-062.4E-052.4E-07N/AN/A
8.2E-076.0E-07
CancerSlope Factor(mB/kfi'day)'1
N/AN/AN/AN/A
2.5E-015.2E-02N/AN/A
4.2E-01N/A
8.6E-01
N/AN/A
1.5E+01N/A
2.7E-021.2E+00N/A
5.3E-02N/AN/A
8. IE-024.2E+01
N/A2.2E-02N/A
9.1E-021.8E-01N/AN/AN/AN/AN/A
2.0E-01
CancerRisk
NCNCNCNC
1.5E-071.2E-06
NCNC
9.9E-06NC
8.8E-07"Ts'E-bif"
NCNCNCNC
3.2E-082.1E-10
NC6.9E-09
NCNC
5.5E-08NCNC
8.9E-09NC
6.4E-082.0E-07
NCNCNCNCNC
1.2E-07
VO
O
_,_\
C--J
Pnge 2 of 3

TABLE 7.7 RMECALCULATION OF NON-CANCER HAZARDS AND CANCER RISKS
REASONABLE MAXIMUM EXPOSUREAQUA-TECH SITE
Scenario Timeframe: Future
Receptor Population: °'her ""*". .r (Irrigation Maint)Receptor Age: Adult
11Medium
Groundwnter
Landfill Gas
ExposureMedium
Air
Air
cxpusuic
Point
Any EU-1 or EU-2 location
Any EU- 1 or EU-2 location
.-,
„..—.._Route
Inhalation
Inhalation
rtv.,>,|Mlof Potential
Concern
TetrachloroetheneThalliumTricllloroetliane, 1,1,1-TrichloroetlicneVanadiumVinyl chloride
(Total)
BenzeneVinyl chloride
(Total)
EPCValue(kiS/U
0.110.00730.0720.33
0.00400.031
EPCtmg/m3)0.0007180.0007872
Intake(Ni«vCanci.f)
(mR/kB'djy)
1.6E-05N/A
1. IE-054.9E-OSN/A
1.9E-06
4.5E-054.9E-06
ReferenceDose
(mB/kB-dJy)
1.4E-01MC
6.3E-01l.OE-02
NF2.9E-02
I.7E-032.9E-02
ReferenceCoilcehlration
Imn/m1)
NFNFNF! FIMF
1.6fe-oi
VjF•D.i
Total Hazard Index Across All Exposure Routes/ Pathways
MazardQuotient
1. IE-04NC
1.7E-054.9E-03
NC6.8E-053. IE-02
2.6E-021.7E-042.6E-6'2
4.2E-OI
intake<0n«r>
(ms/kB-Ji.y)
5.6E-06N/A
3.8E-061 .8E-05N/A
6.9E-07
1.6E-051.8E-06
CancerSlope factor(mB/kg-d.,).)-'
l.OE-02N/AN/A
4.0E-01N/A
1.5E-02
2.7E-021.5E-02
Total Cancer Risk
CancerKISK
5.6E-08NCNC
7.0E-06NC
1.1E-087.6E-06
4.4E-072.7E-OS4.7E-07
2.3E-05
Page 3 of 3
9 0 3 1 5
Table 8 Series
Summary of Receptor Risks and Hazards for COPCs

TABLE o.laRMESUMMARY OF RECEPTOR RISKS AND HAZARDS FOR COPCs
REASONABLE MAXIMUM EXPOSUREAQUA-TECH SITE
Medium
Surface Soil
Scenario Tlmeframe: CurrentReceptor Population: Trespasser/Visitorteceptor Age: Adolescent
Exposure"c;I:-:r.
Surface Soil
ExposureP^lnr
Any Exposure Unit 1 location
Chemical
AldrlnAluminumAntimonyAroclor-1242Aroclor-1248Aroclor-1254ArsenicBarium}enzo(a) anthraceneienzo(a)pyreneienzo(b)nuoranthene!enzo(k)nuorantliene
Bls(2-eihylhexyl)plilhalaieCadmiumChrornlurrrChryseneCopperCyanide, tola!run
LeadManganese
VlercuryNaplilKalene
NickelTetrachluroelheneThalliumToxapheneTrlchloroctheneVanadium
(Total
Carcinogenic Risk
Ingestlon
4.8E-09NCNC
l.OE-082.6E-082.4E-082-OE-07
NC1.2E-081.8E-07I.9E-081.3E-09G.7E-09
NCNC
1.4E-IONCNCNCNCNCNCNCNC
1.8E-10NC
2.8E-08I.7E-09
NC5.2E-07
Inlialallon Dermal
3. IE-10
NCNC
7.9E.102.0E-091.9E-091.4E-09
NCI.5E-092.4E-082.5E-091.7E.IO8.8E-10
NCNC
I.8E-1INCNCNCNCNCNCNCNC
1.2E-11NC
3.GU.091.2E-IO
NC3.9E. 08
ExposureRoutes Total
5. IE-09NCNC
1. IE-082.8E-082.GE.082. IE 07
NC1.3E-082.1E.072. IE-081.5E-097.CE-09
NCNC
1.5E-10NCNCNCNCNCNCNCNC
1.9E-10NC
3.1E08I.8E-09
NC5.CE.07
Non-Carcinogenic Hazard Quotient
Primary
Target OrRan
liverCNSblood
ImmunologlclinmunologlcIminunologfc
skin
cardiovascularNF
lunglungNF
kidney, liverkidney
NOAELNFCl
body weightClNF
CNSdevelopment. CNS
body weight
decreased body weigh!
CNS. liverCNSNF
CNS. kidneyCl. kidney
fTotal)
ingcsnon
6.GE-051.5E-021.7E-031.8E-034.6E-034.2E-033.2E-037.3E-03
NCNCNCNC
1.7E-042.BE-031. IE-02
NC8.8E-045.3E-054.7E-02
NC8.9E-037.4E-032.2E-058. IE-042.4E-003.9E-03
NCI.OE-04C.4E031.3E-01
. . . . . 1 „. _ _, c __ rtir^
..
4.3E-062.4E-031.1E-03I.4E-043.5E-043.3E-042.2E-059.CE-04
NCNCNCNC
2.2E-054.IE-04S.7E-03
NCI.OE-053.5E073.0E03
NCl.SE-034.9E-04I.5E-001. IE-04I.CE-071.3E-04
NCG.9EOCl.GE-03I.9E-02
Routes Total
7.0E-05I.7E-022.9E.03I.9E-034.9E-034.5E-033.2E-038.2E-03
NCNCNCNC
1.9E-043.2E-031.7E-02
NC8.9E-045.3E-055.0E-02
NC. I.OE-02
7.9E-032.4E-059.2E-042.GE-OG
4. IE-03NC
1. IE-048.0E-03I.5E-OI
Page 1 of 2

TABLE 8.URMESUMMARY OF RECEPTOR RISKS AND HAZARDS FOR COPCs
REASONABLE MAXIMUM EXPOSUREAQUA-TECH SITE
Medium
Surface Soil
Scenario Tlmeframe: Current
(eceptor Population: Trespasser/Visitorleccptor ARC: Adolescent
Exposure
Mcuiu,,,
Air
Exposure
D..I..I
Any Exposure Unit 1 location
Landfill Gas Air Any Exposure Unit 1 location
Chemical
Aldrln
Aluminum
Antimony
Aroclor-1242
Aroclor-1218
Aroclor-1254
Arsenic
Bariumlenzo(a)anthracene
Jenzo(a)pyrene
lenzo(b)fluoranthene '
Jenzofklfluoranthcne
Bls(2-etliylhexyl)phthalate
Cadmium
Chromium
Chrysene
Copper
Cyanide, total
ron
Lead
vlanganese
Mercury
^aplithaleilc
Nickel
Telrachluroelhcne
Thallium
Toxaphene
Trlchloroethenc
Vanadium
(Total
Carcinogenic Ulsk
digestion Inhalation
8.0E-11
NC
NC
C.OE-11
l.CE-IO
I.-IE-IO
9.5E-H
NC
8.GE 12
S.2E-1I
2.9E-I2
2.3E-13
S.9E-12
1.2E-I3
9.-IE 12
3.5E-13
NC
NCNC
NC
NC
NCNC
NCI.8E-IO
NC
G.4E-I1
1. IE-OSNC
1. IE-08
Dermal
-
Total Risk Across Surface Soil
Benzene
Vinyl chloride
(Total)
9.2E-08
5.7E09
9.8E-08
CNS Central Nervous System. Total Risk Across Landfill CasNF Nul found.
NOAEL No Observed Adverse Effect Level. Total Risk Across All Media and All RoutesCI Castrolntestlonal tract
NC Not calculated.
Exposure
Routes Total
8.0E-1I
NC
NC
COE.il
I.6E-10
I.4E-IO
9.5EI4NC
8.6E-125.2E-112.9E12
2.3E 13
5.9E-12
I.2E-13
9.4E-I2
3.5E-I3
NC
NC
NC
NC
NC
NCNC
NC1.8E-IO
NCC.4E-11
1. IE-08
NC
1. IE-08
5.7E-07
9.2E-08
5.7E-09
9.8E-08
9.8E-08
6.7E-07
Non-Carcinogen c Hazard Quot ent
Primary
Target Organ
NF "
lung
NF
NFNF
NF
NFrespiratory, blood pressure
NF
NF
NFNFNF
NFrespiratory
NFNF
NF
NF
NF
CNSCNS
nasalNF
NFNF
NF
NFNF
(Total
Ingestlon Inhalation
NC
6.8E-07
NC
NC
NCNC
NCI.7E-07
NC
NCNCNC
NC
NCS.SE-08
NC
NC
NC
NCNC
5.8E-07
1.3E.02I.5E-04
NC8.8E-07
NC
NCI.9E-05
NC
I.3E-02
Dermal
-
Total Hazard Index Across Surface Soil
blood. CNS
NF1.4E-029.1E-05
1.4E-02
Total Hazard fndex Across Landfill Cas
Total Hazard Index Across All Media and All Routes
exposure
Routes Total
NC
6.8E-07
NC
NC
NC
NCNC
I.7E-07
NCNC
NCNCNC
NC5.5E-08
NC
NCNC
NC
NC
5.8E-07
I.3E-02I.SE-04
NC8.8E-07
NC
NC1.9E-05
NC
I.3E-02
l.GE-01
I.4E-029.IE-05
1.4E-02
I.4E-02
1.7E-01
Page 2 of 2

TABLE S. lbRMESUMMARY OF RECEPTOR RISKS AND HAZARDS FOK COl'Cs
REASONABLE MAXIMUM EXPOSUREAQUA-TECH SITE
lario Timcfr«»mc: Current
Receptor Population: Trv.spJssor/Receptor AB<?:______Adolescent
| Medium
Surface Soil
Exposure
Medium
Surface Soil
Air
Exposure
Com t
Any Exposure Unit 2 location
Any Exposure Unit 2 location
CIlLTtlilTdl
Iron
Manganese
rhallium
Vanadium
(TiUal)ron
Manganese
Thallium
Vanadium
(Tolal)
Carcinogenic Risk
lnseslion
NC
NC
NC
NC
NC
_
-
• -
Inhalation
-
-
NC
NC
NC
NC
NC
Dermal
NC
NC
NC
NC
NC
-
-
Exposure
Routes Total
NC
NC
NC
NC
NC
NC
NC
NCNC
NC
Non-Carcinogenic Ha/arJ Quotient
Primary
Target Or^an
Cl
CNS
CNS
Cl. kidney
(Total)
NF
CNS
NF
NF
(Total)
Ingestion
5.6E-U2
7.7E-03
6.7E-03
S.6E-03
7.7E-II2
-
-
_
Inhalation
_
-
_
-
-
NC5.IIE-II7
NCNC
5.0E-U7
Dermal
4.4E-03
1.3E-03
2.2E-W
1.7E-03
7.5E-03
-
--_
-
ExrMfure
Routes Total
6. IE-02
V.OE-03
(i.9E-<O
8.3E-03
85E-U2
NC5.0E-D7
NC
NC5.UE-07
Total Risk Across Surface Si.il || NC || Total Ha/ard Index Across Surface Soil || 8JE-U2
Sediment Sediment
Air
Any Exposure Unit 2 location
Any Exposure Unit 2 location
Aluminum
Antimony
Aroclor-1248
Aroclor-1254
Arsenic
iarium
{en/o(a)anlhraivne
Bcn*o(a)pyrenc
Ben/o(b)fluoranlhene
Ben/o(k)fluoranthene
Chromium
Chrysene
ron
Manganese
vlercury
Thallium
Vanadium(Total)
Aluminum
Antimony
Aroclor-1248
Ar.Klor.1251
Arsenic
Barium
Ben/o<a)anlhracene
Ben/o(a)pyrcne
Ben/o(b)lluoranthene
Ben/o(k)fbaoranthene
Chromium
Chrysene
NCNC
n.lE-IW
5.7E-IW
3.(IE-07
NC
V.5EJ.W
UIE-07
I.IIE-IIX
s.yE-ioNC
1. IE-HI
NC
NC
NC
NC
NC4.3E-07
-
-
..
-
-
_
-
---
-
-
-_
NC
NC
3.hE-11
3.4E-I1
1. -IE-13
NC
7.IIE-I2
2.9E-11
1.6E-12
1.5E-13
7.3E-12
2.7E-13
NC
NC
4.7E-10
4.4E-10
2.IE-IW
NC
1.3E-IW
1.3E-OS
I.3E-IW
I.2E-HI
NC
1.4E-II
NC
NC
NC
NC
NC1.9E-IW
_
NC
NC
6.fiE-(W
0.2E-OT
3.0E-<r7
NC
1.1E-(W
I.IE-W
I.IE-(«
1.DE-IW
NC
1.2E-1U
NC
NC
NC
NC
NC4.5E-II7
NC
NC
3.I.E-1I
J.4E-11
1.4E-I3
NC
7.0E-12
2.9E-11
1.6E-12
1.5E-13
7.3E-12
2.7E-13
CNS
blood
immunolojjic
immunologic
skin
cjfjiova.scular
NF
lur-Btunj;
NF
NOAEL
NF
. Cl
CNS
development, CNS
CNS
Cl. kidney
(Total)
I»"K
NF
NF
NF
NF
respiratory, bltxid pressure
NF
NFNF
NF
respiratory
NF
1. IE-02
4.4E-I13
1.1E-03
1.0E-IO
4.7E-03
6.I)E-I)3
NC
NC
NC
NC
B.7E-03
NC
4.SE-02
2.3E-02
S.3E-IM
2.RE-02
5.3E-II31.4E-IM
-
-
-
-
-_
-
-
-
-
_
-
-
---
-
---
-
--
-.
--_-
4.VE-II7
NC
NC
NC
NC1.4E-07
NC
NCNC
NC
4.3E-08
NC
1.7E-03
2.fE-l)3
8.3E^e
7.«E4I5
3.2E.I6
7.9E^H
NC
NC
NC
NC4.4E413
NC
3.7E-U3
3.8E-03SJEJB
9.2EJH
1.3Em32.0E-02
-
-
-
-
-
-
_
-
_
-
-
-
1.2E I2
7.3E-I13
1. IE-113
1. IE-03
4.7E-II3
6.8E4I3
NC
NC
NC
NC
1.3E-02
NC
5.2E-02
2.7E-02
«.¥£•«
2.«E-02
h.6E-U3
1.6E-01
4.!)E-(I7
NC
NC
NC
NC
1.4E-07
NC
NC
NC
NC
4.3E-(I8
NC
L---J_.-^oo
Pagel of 3

TABLE S.lbRMESUMMARY OF RECEPTOR RISKS AND HAZARDS FOR COPCs
REASONABLE MAXIMUM EXPOSUREAQUA-TECH SITE
lScenarii>Timi.'frjmi*: CurrentJRecvptur Population; Tn.spasM.-r/ VisitorIJReeupfor AK*-*-' Adnj«iccnt
Mediumi
Si-dimwit
Exposure
Medium
Air
Expire
' ""''
Any Exposure Unit 2 lixralion
Chemical
Intn
Marines.-
vlercury
Fhatlium
Vanadium
CTnlaD
Carcinoe.cnic Risk N,,n-Carcimi(;i'nicHa/ard Quotient
lnKeslioil
-
_
Inhalation
NC
NC
NC
NC
NC
1.2E-1I1
Dermal
-
Exposure
Rnuh~.Tnl.il
NC
NC
NC
NC
NC
1.26-11)
Primary
Tjru.-tOrc.in
NF
CNS
CNS
NF
NF
(Tolal)
ln«eslii.n
-
-
-
_
Inhalation
NC
I.5E-06
1.4EJ13
NC
NC
1.4E-03
Uermal
-
-
_
_
-
Ti.lal Risk Across Svdimenl || 43E-II7 || TuUl Hazard Index Acriiss Sediment
Surface Water SurlaceWaler
Air
Any Exposure Unit 2 location
Any Exposure Unit 2 Uxralion
Acetone
Aluminum
Benzene
Cadmium
Chloroform
Cobalt
)i-n-butylphthalate
Dichlorocthane, 1,1-
OicMoroethcne, 1.2- (Intel)
Dieldrin
ron
Manganese
Mercury
Nickel
Nilrophennl, 2-
Tetrachloroclhcne
rrichlorovthanc, 1.1,1-
rrichlonvtlu-ne
Vanadium
Vinyl Chloride
(Tula !
Acetone
Aluminum
Ben/.ene
Chloroform
Cobalt
Di-n-butylphlhalate
Dichloroeiliane, 1,1-
Dichlimielhene, 1.2- (total)
Dieldrin
run
Manganese
Mercury
Nickel
Nilrophcnol, 2-
NC
NC
i,yE-oyNC
NC
NC
NC
NC
NC
1.IIE-OS
NC
NC
NC
NC
NC
7.3E-OV
NC
7.DE-OK
NC
K.(JE-(1S
1.7E-U7
-
..
-
• - .
-
-
-
-
-
-
-
' -
-
-
-
-
--
-
-
-
NC
NC
1.5E-W2.2E-IW
NC
NC
NC
NC
7.1E-1II
NC
NC
NC
NC
NC
NC
NC
1.5E-OH
NCNC
NC
NC
NC
NC
5.4E-U8
NC
NC
NC
NC
NC
I.2E-II7
NC
3.VE-D7
NC
2.2E-II7
7.YE-07
..
-
-
NC
NC
1.7E-I1S
NC
NC
NC
NC
NC
NC
6.SE-O.S
NC
NC
NC
NC
NC
UE-II7
NC
4.hE-ll7
NC
3.I1E-II7
9.6E-II7
NC
NC
1.5E-IN
2.2E-IW
NC
NC
NC
NC
7. IE- Id
NCNC
NC
NC
NC
liver, kidney
CNS
CNS. blood
kidney
liver
NF
increased mortality
NOAEL
liver
liver
Cl
CNS
development. CNS
decreased body weight
NF
CNS. liver
.CNS
CNS, kidney
Cl, kidney
CNS
(Total)
NF
'U"Hblood, CNS
NF
NF
NF
NFNF
NF
NF
CNS
CNSNF
NF
S.2E-()fi
1.3E-IH
S. IE-IB
5.8E-II2
1.2E-05
2.7E-04
1.2E-Of.
1. (IE-IE
1.4E-IH
9.IIE-II5
1.4E-03
4.4E-02
8.1E-15
h.lE-lU
3.IIE-II5
V.VE-U5
2,2E-lh
4.1E^I3
l.OE-m
2.5E-IW
1. IE-01
-
-
_
-
-
.-
-
-
_
-_
---
--
-
-_-
-
--
--
-
-_
NC
NC2.2E-042.2E-03
NC
NC
1. IE-IBNCNC
NC
NC
3JE-W
NC
NC
1.9E-OB
1. IE-113
(i.2E-(M
2.2E-U13.6E-05
3JEJH
1.3E-IS
3.7E-U5
S.SE-<H
4.7E-W
5.3E-(I3
J.fiE-tll
2.7E-04
4.0E-03
1.0E-B4
1.6E-03
1.2EJI5
2.3E-02
1.3EX13
fi.SEJM
6.2E-D1
_
-_
_
_
-
_
_
_
-
Expo»ure
Routes Total
NC
1.5E-06
1.4E-U3
NC
NC
1.4E-03
1.ISE-(I1
I.UE-IB
1.2E-03
7.0E-IH
2.8E-U1
4.SE-U5
6.2E-W
1.4E-05
4.8E-05
7.2E-IH
5.6E-IH
6.7E-03
4.1E-01
3.5E-W
4.6E-II3
1.3E-W
I.7E-03
1.4E-II5
2.7E-H2
I.4E-I13
V.3E-IM
7.3E-III
NC
NC
2.2E-IH
2.2E-U3
NC
NC
1. IE-IB
NC
NC
NC
NC3.5E-IM
NC
NC
n
Page 2 of 3
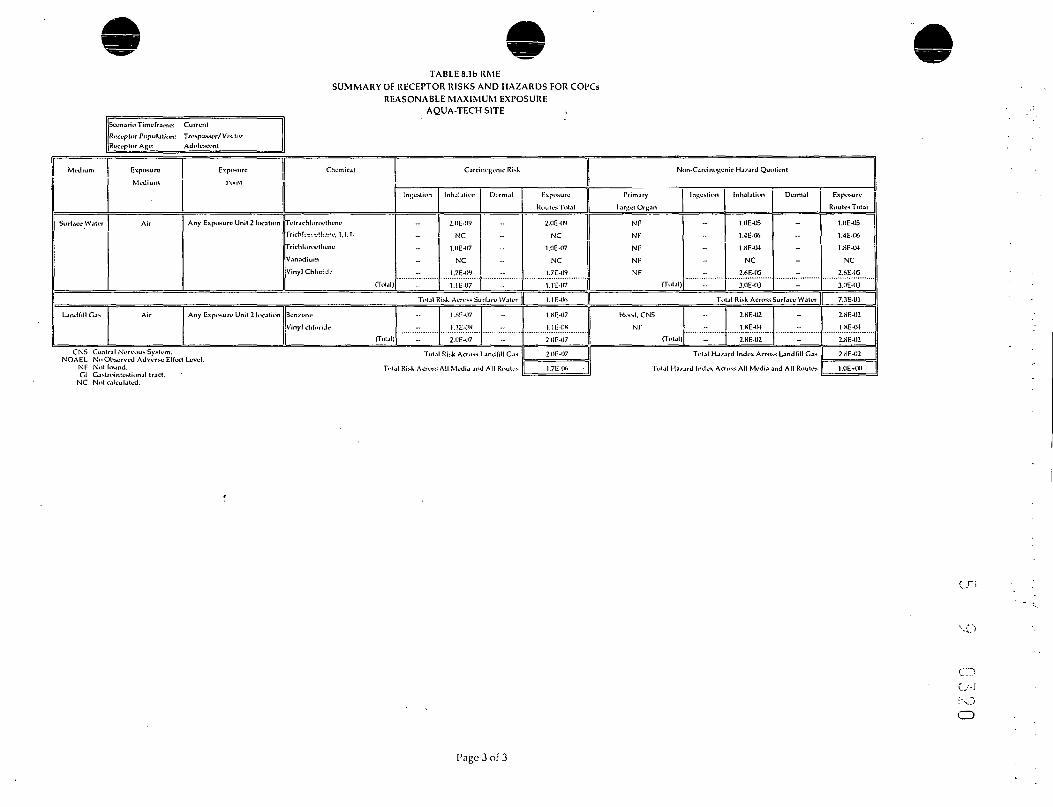
TABLE S.lbllMESUMMARY OF RECEPTOR RISKS AND HAZARDS FOR COPCs
REASONABLE MAXIMUM EXPOSUREAQUA-TECH SITE
Medium
Surface Water
Scenario Timeframe: Current
Receptor Population: Trespasser/ VisitorReceptor Aj-e: Adolescent
Exp.v.ur0
Modium
Air
Exp^urc
roml
Any Expiisuri.' Unil 2 Uicatiun
Chtmicjl
rL-lrjchlunMhcno
rrichlnrtivlhjni.-, I.I.I-
Trichli>rivtlK-ne
Vanadium
Vinyl Chluridf
O'l'UI)
Carcino^i-nic Ri>k
lnKvMiim
_
-
-
lnlul.ili.nl
2.I1E.IW
NC
1.IIE-II7
NC
1.7E-IW
1. IE-07
Dorm.il
_
_
_
Total Risk Across Surface Water
Landfill Ca> Air Any Exp,-.un- Unit 2 liKMlinn 3cn/onu
Vinyl chloriJe
(Tc'ljl)
-
-
1.SC417
1. IE-OS
2.HE-II7
-
-
CMS Central Nervou* System. Total Ri^k Across Landfill Ca*NOAEL No Observed Adverse Effect Level.
NF Not found. Total Risk Amiss All Media and All RouU->Gl CaislrointeMionjl trad.
NC Not calculated.
Expitsuri;
RoulcsToUl
2.I1E-IM
NC
1.1IE-07
NCI.7E-CW
1. IE-117
UE-lh
1. HE-07
1. IE-OS2.IIE-II7
2.0E-II7
1.7E-(Vi
Ntin-Cjrcinn^cnic Hj/ard Qunlionl
Primary
TjrBvl Orsan
NF
NF
NF
NF
NF
(Ti'UI)
lnf,cslion
_
_
_
_
-
Inhalation
l.OE-05
l.-iE-lK
1.KE-IM
NC
2.6E-IS
3.0E-03
Dermal
_
-
-
_
-
Tolal Ri.sk Across Surf JCL' VV jU-r
bUiKl, CNS
NF
(Ti'UI)
-
-
2.KE-02
1.8E-IH
2.8E-02
-
-
-
1 Tol.il Hj/ord Index Across Landfill Gas
Tol.il Hazard Indfx Across All Media and All Routes
Exposure
Routes Total
1. (IE-05
1.4E-06
I.SE-IH
NC
2.f.E-(B
3.(IE-(D
7.3E-01
2.SE-02
I.8E-IM
2.KE-02
2.BE-H2
MIE»(KI
C.3C.-J:~OCD
Page 3 of 3
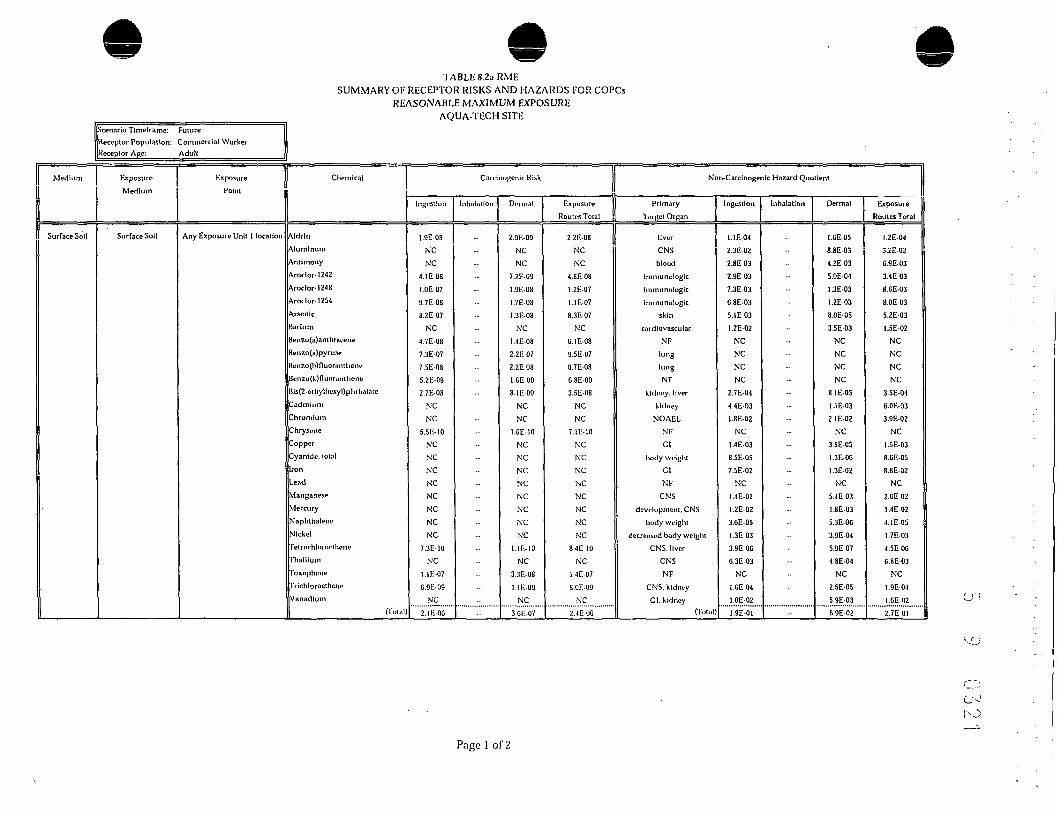
TABLE 8.2a RMESUMMARY OF RECEPTOR RISKS AND HAZARDS FOR COPCs
REASONABLE MAXIMUM EXPOSUREAQUA-TECH SITE
j Medium
Surface Soil
Scenario Tirneframe: FutureReceptor Population: Commercial Worker?eceptor Age: Adult
ExposureMedium
Surface Soil
ExposurePoint
Any Exposure Unit 1 location
Chemical
AldrlnAluminumAntimonyAroclor-1242Aroclor-1248Aroclor-1254ArseniciarlumJenzo(a)antliraceneienzo(a)pyreneJenzo(b)nuorantherK'Jenzo(k)nuoranlhene
Bi5(2-ethylhexyl)phllialateCadmium
ChromiumChryscneCopperCyanide, totalron-eadManganeseMercuryNaphthalene
Nickel
fetrachloroetlienefhalliumfoxapheneFrichloroethene
Vanadium
fToi.il)
Carcinogenic Risk Non-Carcinogen c Hazard Quotient
|
Ingcstion
1.9E-08NCNC
4. IE-081.0E-Q79.7E-088.2E-07
NC4.7E-087.3E-077.5E-085.2E-092.7E-U8
NCNC
5.5E-10NCNCNCNCNCNCNCNC
7.3E-10NC
1. IE-07G.9E-09
NC2.IE-OG
Inhalation Dermal
2.9E-00NCNC
7.2E-091.9E-08I.7E-08I.3E-08
NCI.4E-082.21-072.2E-08l.GE-098. IE-09
NCNC
l.CE-IONCNCNCNCNCNCNCNC
1. IE-10NC
3.3E-081. IE-09
NC3.GE-07
ExposureRoutes Total
2.2E-08NCNC
4.8E081.2E-071. IE-078.3E-07
NCC.1E-089.5E-079.7E-086.8E-093.5E-08
NCNC
7.1E-IONCNCNCNCNCNCNCNC
8.4E 10NC
I.4E078.0F.-09
NC2.4E-OG
PrimaryTarget Organ
liverCNSblood
Immunologicimmunologicimmunolugic
skincardiovascular
NFlung
kingNF
kidney, liverkidney
NOAELNFCl
body weight
Cl
NFCNS
development. CNSbody weight
decreased body weightCNS. liver
CNSNF
CNS, kidneyGl, kidney
(Total
Ingestion
I. IE-042.3E-OZ2.8E-032.9E-037.3E-03G.8E-035.1E031.2E-02
NCNCNCNC
2.7E-044.4E-031.8E-02
NC1.4E-038.5E-057.5E-02
NC1.4E-02I.2E-023.GE-05I.3E-033.9E-066.3E-03
NCl.GE-04l.OE-021.9E-01
Inhalation
-
Dermal
I.GE-055.8E-034.2E-035.0E-04I.3E-03I.2E-038.0E-053.5E-03
NCNCNCNC
8. IE-051.5E-032.1E-02
NC3.8E-051.3E-OG1.3E-02
NC5.4E-031.8E-035.3E-OG3.9E-045.9E-074.8E-04
NC2.5E-055.9E-036.9E-02
ExposureRoutes Total
1.2E-043.2E-026.9E-033.4E038.GE-038.0E-03S.2E-031.5E-02
NCNCNCNC
3.5E-046.0E-033.9E-02
NC1.5E-038.GE-058.8E-02
NC2.0E-021.4E-024. IE-OS1.7E-034.5E-OG6.8E-03
NC1.9E-04l.GE-022.7E01
Page 1 of 2

TABLE 8.2a RMESUMMARY OF RECEPTOR RISKS AND HAZARDS FOR COPCs
REASONABLE MAXIMUM EXPOSUREAQUA-TECH SITE
Medium
Surface Soil
Scenario Tlmeframe: Future
leceptor Population: Commercial WorkerReceptor Age: Adult
ExposureK4,,,1I.._
Air
ExposureDnlnt
Any Exposure Unit 1 location
Chemical
AldrlnAluminum
Antimony
Aroclor-1242
Aroclor-1248
Aroclor-1254
Arsenic
larlum
ienzo(a)anthracene
Jenzo(a)pyrene
Jenzo(b)Fluoranthene
Jenzo(k)nuoranlliene
BisR-cthylhexyOphthalateCadmium
Chromium
Chrysene
'opper
Cyanide, total
ron
Lead
Manganese
Mercury
•Japhtlialene
Nickel
fetrachlorocthene
Thallium
foxaphene
[Yichloroelhcne
Vanadium
(Total)
Carcinogenic Risk
Ingestion [nhalatiun
I.9E-09
NC
NC
I.4E-09
3.7E-09
3.4E-09
2.3E-12
NC2.0E-10
1.2E09
C.8E-11
5..IE-I2
1.4E-JO
2.7E-12
2.2E-IO
B.2E-I2
NC
NC
NC
NC
NC
NC
NC
NC
4.2E-09
NC
I.5E-09
2.5E-07
NC
2.7E-07
Dermal
Total Risk Across Surface Soil
Landfill Gas Air Any Exposure Unit 1 location [[Benzene
Vinyl chloride
1 (Total)
2.2E-OG
I.4E-07
2.3E-OG
CNS Cciiiral Nervous System. Tofa] jjjs(( Across Landfill GasNOAEL No Observed Adverse Effect Level.
NF Not found. Total Risk Across All Media and All RoutesGl Gaslroimestional tract.
NC Not calculated.
Exposure
Routes Total
1.9E-09
NC
NC
1.4E-09
3.7E-09
3.1E-09
2.3E 12
NC
2.0E 10
1.2E-09
G.8E-II
5ME-I2
1.4E-10
2.7E-I2
2.2E-10
8.2E-I2
NC
NC
NC
NC
NC
NC
NC
NC
4.2E-09
NC
1.5E-09
2.5E07
NC
2.7E07
2.7E-06
2.2E-00
1.4E-07
. 2.3E-00
2.3E-05
5.0E.OG
Non-Carcinogenic Hazard Quotient II
||
PrimaryTarget Organ
NF
lung
NF
NF
NF
NF
NF
respiratory, blood pressure
NF
NF
NF
NF
NF
NF
respiratory
NF
NF
NF
NF
NF
CNS
CNS
nasal
NF
NF
NF
NF
NF
NF(Total
Ingcstion
-
.-
Inhalation
NC
6.4E-OIS
NC
NC
NC
NC
NC1.6E-06
NCNCNC
NC
NC
NC
5.2E-07
NC
NC
NC
NC
NC
5.5E-OG
1.2E-01
I.4E-03
NC
8.4E-06
NC
NC
I.8E-04
NC
I.2E01
Dermal
Total Hazard Index Across Surface Soil
blood. CNS
NF
(Total)
I.3E01
8.6E-04
1.3E-OI
Total Hazard Index Across Landfill Gas
Total Hazard Index Across All Media and All Routes
Exposure
Routes Total
NC
6.4E-06
NC
NC
NC
NC
NC1.GE-OG
NCNC
NC
NC
NC
NC
5.2E-07
NC
NC
NC
NC
NC5.5E-OG
1.2E-01
I.4E-03
NC
8.4E-06
NC
NC
I.8E-04
NC
1.2E-01
4.0E-01
I.3E-OI
8.GE-04
1.3E-01
I.3E-OI
5.3E-01
CT.)C.--Jroro
Page 2 of 2

TABLE 8.2b RMESUMMARY OF RECEPTOR RISKS AND HAZARDS FOR COPCs
REASONABLE MAXIMUM EXPOSUREAQUA-TECH SITE
1Medium
Surface Soil
Surface Soil
Scenario Ttmeframe: Future IIReceptor Population: Commercial WorkerAcceptor Age: Adult J
Exposure
Medium
Surface Soil
Air
1C-ApUiUl c
Point
Any Exposure Unit 2 location
Any Exposure Unit 2 location
Chcmlca!
ron
Manganese
Thallium
Vanadium
(Tola))
iron
Manganese
fhallium
Vanadium
(Total)
Cnrci—— -ic Risk
[ngcstion
NC
NC
NCNC
NC
Inhalation
NC
NCNC
NCNC
Dermal
NC
NC
NC
NC
NC
Exposure
Roules Tola!
NCNCNCNC
NC
NC
NC
NC
NC
NC
Non-CarclnoGenlc Hazard Quotient jj
Primary
Target Organ
CI
CNS
CNSCI. kidney
(Total)
NF
CNS
NF
NF
Total Risk Across Surface Soil || NC ||
Landfill Gas Air Any Exposure Unit 2 location llBenzcne
Vinyl chloride
I (Total)
2.2E-OGI.4E-07
2.3E-OG
Cl Castro ntestional tract. Total Risk Across Landfill GasCNS Central Nervous System.
NF Not found. Tola) Risk Across All Media and All Routes
2.2E-OG
1.4E-07
2.3E-00
2.3E-00
2.3E.06
blood. CNS
NF(Total)
Ingestlon
4.5E-02
G.2E-03
5.4E-03
5.3E-03
G.2E-02
Inhalation
NC
9.5E-06
NC
NC
9.5E-OG
Dermal
8.0E-03
2.3E-03
4.0E-04
3. IE-03
1.4E-02
Total Hazard Index Across Surface Soil
1.3E-01
8.GE-04
I.3E-01
Total Hazard Index Across Landfill Gas
Total 1 lazard Index Across All Media and All Routes
Exposure
Roules Tola!
5.3E-02
8.5E.03
5.8E-03
8.4E.03
7.6E-02
NC
9.SE-06
NC
NC
9.5E-OG
7.6E-02
1.3E-01
8.GE-04
1.3E-01
1.3E-OI
2.1E-01
O-1
ro

TABLE 8.3a RMESUMMARY OF RECEPTOR RISKS AND HAZARDS FOR COPCs
REASONABLE MAXIMUM EXPOSUREAQUA-TECH SITE
Scenario Timeframe: FutureReceptor Population: ResidentReceptor ARC:_____Child
Medium
Surface Soil
Surface Soil
Exposure •Medium
Surface Soil
Air
Exposure ChemicalHolm
Any Exposure Unit 1 location
Any Exposure Unit 1 location
AldrinAluminumAntimonyAroclor-1242Aroclor- 12-18Aroclor. 1254ArsenicJariumJenzo(a) anthraceneJenzo(a) pyreticienzo(b)fli]oranthenelenzo(k)nuoramhene
iis{2-ethylhexyl)phthalateCadmiumChromiumChryseneCopperCyanide, totalran.cadManganeseMercuryNaphthaleneNickelretraclilorotlhene
ThalliumfoxaphenelYIchloroetheneVanadium
(TotalAldrinAluminumAntimonyAroclor-1242Aroclor- 1 248
Aroclor- 1254Arsenic
Care nogenic Risk
Ingestion
NC
NCNCNCNCNCNCNCNCNCNCNCNCNCNCNCNCNCNCNCNCNCNCNCNCNCNCNCNCNC
Inhalation
NCNCNCNCNCNCNC
Dermal
NCNCNCNCNCNCNCNCNCNCNCNCNCNCNCNCNCNCNCNCNCNCNCNCNCNCNCNCNCNC
ExposureRoutes Total
NCNCNCNCNCNCNCNCNCNCNCNCNCNCNCNCNCNCNCNCNCNCNCNCNCNCNCNCNCNCNCNCNCNCNCNCNC
Non-Carcinogen c Hazard Quotient
PrimaryTarget Organ
liverCNSblood
imnumologiciinmunologlcimmunologic
skincardiovascular
NFlunglungNF
kidney, liverkidney
NOAELNFCl
body weightCINF
CNSdevelopment, CNS
body weight
decreased body weightCNS. liver
CNSNF
CNS. kidneyCl, kidney
(Total
NFlungNFNFNFNFNF
Ingestion
2.8E-036. IE-0 17.2E-027.5E-02I.9E-011.8E-01I.3E-OI3.0EOI
NCNCNCNC
7.0E-031.2E014.7E-OJ
NC3.7E-022.2E-03Z.OEtOO
NC3.7E-OI3. IE-019.3E-043.4E02l.OE-04I.7E-OI
NC4.2E032.7E-OI5.3E+00
Inhalation
-
-
NC1. IE-04
NCNCNCNCNC
Dermal
4.7E-052.GE-021.2E-021.5E-033.9E-033.6E-032.4E-04l.OE-02
NCNCNCNC
2.4E-044.5E-036.2E-02
NC1. IE-043.8E-004.0E-02
NCl.OE-025.3E-03l.CE-05I.2E-031.8E061.4E-03
NC7.0E-05I.8E022.IE-01
ExposureRoutes Total
2.8E-036.4E-018.5E-027.6E-022.0E-OII.8E-011.3E-013.2E-01
NCNCNCNC
7.3E-031.2E-015.3E-OI
NC3.7E-022.ZE-032.0E+00
NC3.9E-OI3. IE-019.5E-043.5E02l.OE-04I.7E-OI
NC4.3E032.9E-015,5E»00
NC1.1 E-04
NCNCNCNCNC J
Page 1 of 3

TABLE 8.3a RMESUMMARY OF RECEPTOR RISKS AND HAZARDS FOR COPCs
REASONABLE MAXIMUM EXPOSUREAQUA-TECH SITE
:enarioTimeframe: Future[eceptor Population: Residentleceplor Age:_____Child
Medium
Surface Soil
Exposure
Medium
Air
Exposure [I Chemical
Point
Any Exposure Unit 1 location iarlum
tenzo(a}amliraccne
Benzo(a)|>yrene
Jenzo(b)nuoran(hene
Jenzo(k)fluoranthene
)is(2-ethylhexyl)phthalate
Cadmium
Chromium
Chrysenu
Copper
Cyanide, totalronLead
Manganese
Mercury
Naphthalene
Nickel
fetrachloroethene
rhallium
Toxaphenc
Trlchloroelhene
Vanadium
(Total)
Carcinogenic Risk Non-Carcinogen c Hazard Quotient
Ingcstion nlialation
NC
NC
NC
NC
NC
NC
NC
NC
NC
NC
NC
NC
NC
NC
NC
NC
NC
NC
NC
NC
NC
NC
NC
Dermal
.. V
Exposure
Routes Total
NC
NC
NC
NC
NC
NC
NC
NC
NC
NC
NC
NC
NC
NC
NC
NC
NC
NC
NC
NC
NC
NC
NC
Primary
Target Organ
respiratory, blood pressure
NF
NF
NF
NF
NF
NF
respiratory
NF
NF
NF
NF
NF
CNS
CNS
nasal
NF
NFNF
NF
NF
NF(Total;
Ingcstion Inhalation
2.6E-05
NC
NC
NC
NC
NCNC
8.GE-OG
NC
NC
NC
NC
NC
9. IE-05
Z.OE+00
2.4E-02
NC
1.4E-04
NC
NC
2.9E-03
NC
2.0E+00
Dermal Exposure
Routes Total
2.6E-05
NC
NC
NC
NCNCNC
8.6E-06
NC
NCNC
NC
NC
9.1E-05
2.0E+00
2.4E-02
NC
I.4E-04
NC
NC
2.9E-03
NC
2.0E»00
Total Risk Across Surface Soil || NC || Tola) Hazard Index Across Surface Soil || 7,5E*00
Groundwaler Croundwater Any Exposure Unit 1 location Aluminum
AntimonyArsenic
barium
Benzene
Bis(2-elhylhexyl)pluhalale
Sromodicliloroiuethane
Carbon tetrachlorlde
3hloro benzene
Chloroethane
Chloroforni
Chromium
Cobalt
NC
NC
NC
NC
NC
NC
NC
NC
NC
NC
NC
NC
NC
NC
NCNCNC
NC
NC
NC
NC
NC
NC
NC
NC
NC
NC
NC
NC
NC
NC
NC
NC
NC
NC
NC
NC
NC
NC
CNS
blood
skin
cardiovascular
CNS. blood
NF
kidney
liver
liver
NF
liver
NOAEL
NF
1.2E-01
9.9E-01
l.lEtOO
2.5E-01
4.GE-OI
NC
8.0E-04
1.8E-01
2.4E-02
2.4E-03
7.8E-02
1.7E-01
1.0E.01
NC
NCNC
NC
4.6E-01
NC
8.0E-04
1.8E-01
2.4E-02
2.4E-03
7.8E-02
NC
NC
1.2E-OI
9.9E.Q1
I.1E»00
2.5E-01
9.1E-OI
NC
I.GE-03
3.7E-OI
4.8E-02
4.9E-03
l.GE-01
I.7E-01
l.OE-01
Page 2 of 3

Scenario Timeframe: FutureReceptor Population: ResidentReceptor Age:_____Child
TABLE 8.3aRMESUMMARY OF RECEPTOR RISKS AND HAZARDS FOR COPCs
REASONABLE MAXIMUM EXPOSUREAQUA-TECH SITE
Medium
Groundwater
ExposureMedium
Croundwaler
Exposure
Point
Any Exjjosure Unit 1 location
LandHl! Gas Air Any Exposure Unit I location
Chemical
Dichlorobenzene. 1.4-
)lchluroethane. 1.1-
Dichloroelhane. 1.2-)ichloroclhene. 1.1-
Dichloroelhene, 1.2- (cis)Dichloroelhenc. 1.2- (trails)
ronManganeseMethyl ten butyl etherretrachloroethanc. 1.1.2.2-
"ctrachloroelliene
Thalliumfrichloroethane, 1.1,1-
rrichloioethene
VanadiumVinyl chloride
(Total)
Care nngenic Risk
Ingestion
NCNCNCNCNCNCNCNCNCNCNCNCNCNCNCNCNC
Inhalation Dermal
NCNCNCNCNCNCNCNCNCNCNCNCNCNCNCNCNC
Total Risk Across Croundwalerbenzene
Vinyl chloride(Total) • ——— '••" ———
NCNCNC
CNS Central Nervous System. Tolal Ris* Across Landfill GasNF Not found, _. _. . .. ,CJ Castro mestional tract. Tolal Rlsk Across A" Mwl'a arld A" l(ou"-'5
Exposure
Routes Total
NCNCNCNCNCNCNCNCNCNCNCNCNCNCNCNCNC
NC
NCNC
N/A
NC
NC
Non-Carcinogenic Hazard Quotient I
PrimaryTarget Organ
NFNOAEL
CNS. liver
CNS. liver
bloodliver
CICNSNFNF
CNS. liver
CNSCNS
CNS. kidneyCI. kidney
CNS(Total;
Ingesiion
1.8E-02
3.4E-022.9E-02
1.3E-01
2.5E»00
1.2E-02MEtOO
9.3E*00
3.4E-02l.CE-02
7.0E-01G.OEtOO
1.6E-02l.OEtOI3.GE-026.7E-019.4E»01
Inhalation
-
Dermal
1.8E-023.4E-022.0E-02
1.3E-OI
2.CE»00
I.2E-OZNCNC
3.4E-02
1.6E-027.0E-01
NC1.GE.02
7.0E+01
NCG.7E-OI7.5E+01
Total Hazard Index Across Groundwaterblood. CNS
NF(Total)
2.2E+00
1.4E-022.2E+00
Total Hazard Index Across Landfill Gas
Tolal Hazard Index Across All Media and All Routes
ExposureRoutes Tolal
3.5E-026.8E-02
5.7E-022.GE-01
5.2EtOO
2.5E-021.IE+009.3E»00
G.8E-02
3.2E-021.4E»006.GE»00
3.3E-02
l,4Et023.GE-02I.3E+00
1.7E+02
1.7Et02
2.2E»DO
1.4E-02
2.2E+00
2.2EtOO
I.8E4-02NC Not calculated.
N/A Not applicable.
"Dermal" Hazard Quotients Tor groundwater are the combined dermal and Inhalation surrogate values as noted on Tables 7 and as discussed in Section 3.4.1.4 of the lexl
Tolal CI HI -
Total kidney HI =
Total CNS HI =
Total liver HI -
C.n
r-oON
Page 3 of 3

TABLE 8.3bRMESUMMARY OF RECEPTOR RISKS AND HAZARDS FOR COPCs
REASONABLE MAXIMUM EXPOSUREAQUA-TECH SITE
inario Timeframe: Future|Receplor Population: ResidentReceptor Age:_____Child
I
Medium
Surface Soil
Exposure
Medium
Surface Soil
Air
1exposurePoint
Any Exposure Unit 2 location
Any Exposure Unit 2 location
Chemical
IronManganeseThalliumVanadium
(Total)IronManganeseThalliumVanadium
O'olal)
Cilitiiiugciiii Kiak
Ingestion
NC
NC
NCNCNC
Inhalation
NCNCNCNC
Dermal
NCNCNCNCNC
Total Risk Across Surface Soil
Groundwaler Groundwater Any Exposure Unit 2 location AluminumAntimonyArsenicbariumJcnzene
Bis(2-ethylhexyl)phthalateJromodichloroinethaneCarbon tetrachloricteChlorobcnzcneChlorocthancChloroformChromiumCobaltDichlorobenzene, 1.4-Dichloroethanc, 1,1-Dichlorocthane, 1,2-Dichlorocthene, 1,1-
Dichloroethcnc, 1.2- (cis)Dichloroethcne. 1.2- (trans)fronManganese
NCNCNCNCNCNCNCNCNCNCNCNCNCNCNCNCNCNCNCNCNC
-
-
-
-
NCNCNCNCNCNCNCNCNCNCNCNCNCNCNCNCNCNCNCNCNC
ExposureRoutes Total
NCNCNCNCNCNCNCNCNCNCNC
NCNCNCNCNCNCNCNCNCNCNCNCNCNCNCNCNCNCNCNCNC
r-.'cr.-C-rdr.cgcr.ic Hsrird Quo:::.-.!
PrimaryTarget Organ
CICNSCNS
GI, kidney(Total)
NFCNSNFNF
(Total)
Ingestion
1.2E+00l.OE-01I.4E-011.4E-01l.GEtOO
-
-
Inhalation
..
-NC
3.SE-05NCNC
3.9E-05
Dermal
2.4E-027.0E-031.2E-039.2E-034. IE-02
--
ExposureRoutes Total
1.2E+001.7E-011.4E-011.5E-011.7E+00
NC3.9E-05
NCNC
3.9E-05
Total Hazard Index Across Surface Soil |[_ 1.7E+00
CNSbloodskin
cardiovascularCNS. blood
NFkidney
liverliverNF
liverNOAEL
NFNF
NOAELCNS, liverCNS. liver
blood
liverCI
CNS
1.2E-019.0E-011.IE+002.5E-014.6E-01
NC8.0E-041.8E-OI2.4E-022.4E-Q37.8E-021.7E-01l.OE-011.8E-023.4E-022.9E-021.3E-012.6E+001.2E-02I.IE+009.3E+00
-
--
-
-
NCNCNCNC
4.6E-OINC
8.0E-041.8E-012.4E-022.4E-037.8E-02
NCNC
1.8E-023.4E-022.9E-021.3E-012.6E+001.2E-02
NCNC
1.2E-019.9E-011.1E+002.5E-019.1E-01
NC1.6E-033.7E-OI4.8E-024.9E-031.6E-011.7E-01l.OE-013.5E-026.8E-025.7E-022.CE-015.2E+002.5E-02I.1E+009.3E-1-00
o
Page 1 of 2

Scenario Timeframe: FutureReceptor Population: ResidentReceptor Age:_____Child
TABLE 8.3b RMESUMMARY OF RECEPTOR RISKS AND HAZARDS FOR COPCs
REASONABLE MAXIMUM EXPOSUREAQUA-TECH SITE
Medium
Groundwater
ExposureMedium
Croundwater
Exposure I! Chemical
Point
Any Exposure Unit 2 location Methyl ten buiyi ether
Telrachloroelhane. 1.1.2,2-
Tetrachloroethene
Thallium
rrichloroethane. 1.1. I-
rrichlorocthene
Vanadium
Vinyl chloride
(Total)
Carcinogenic Risk Non-Carcinogenic Hazard Quotient
Ingestion
NC
NCNCNCNCNCNCNCNC
Inhalation Dermal
NC
NCNCNCNCNCNCNCNC
Exposure
Routes Total
NC
NCNCNCNCNCNCNCNC
Primary
Target Organ
NF
NF
CNS. liver
CNS '
CNS
CNS. kidney
GI, kidney
CNS(Total)
Ingestion
3.iE-02
l.BE-02
7.0E-01
6.GE+00
I.6E-02
7.0E+01
3.6E-02
6.7E-01
9.4E+01
Inhalation
..
-
-
Dermal
3.4E-02
l.GE-02
7.0E-01
NC
1.6E-027.0E+01
NC6.7E-01
7.5E+01
Total Risk Across Croundwatcrjl NC [f Total Hazard Index Across Croundwater
Landfill Gas Air Any Exposure Unit 2 location Benzene
Vinyl chloridefTotal)
NCNCNC
Total liisk Across Landfill GasCI Castrointestional iracl.
CNS Central Nervous System. Tolal '?isl< Across All Media and All Routes
NC
NC
N/A
NC
NC
blood. CNS
NF(Total)
2.2E+00
1.4E-02
2.2E+00
-
Total Hazard Index Across Landfill Gas
Total Hazard Index Across AH Media and All Routes
Exposure
Routes Total
G.8E-02
3.2E-02
1.4E+00
6.6E+00
3.3E-02
1.4E+02
3.6E-02
1.3E+00
1.7E+02
1.7E+02
2.2EtOO
1.4E-02
2.2E+00
2.2EtOO
1.7E+02NC Not calculated.
N/A Not applicable.NF Not found.
'Dermal' Hazard Quotients for groundwaterare the combined dermal and inhalation surrogate values as noted on Tables 7 and as discussed in Section 3.4.1.4 of the text.
Total GI HI.
Tolal kidney HI =Total CNS HI =Total liver HI =
U-J••>. ^
CO
Page 2 of 2

TABLE 8.4a RMESUMMARY OF RECEPTOR RISKS AND HAZARDS FOR COPCs
REASONABLE MAXIMUM EXPOSUREAQUA-TECH SITE
Scenario TlmeCrame: FutureReceptor Population: ResidentReceptor Age: Adult
Medium
Surface Soil
ExposureMedium
Surface Soil
Air
ExposurePoint
Any Exposure Unit i location
Any Exposure Unit I location
Chemical
AidrinAluminumAntimonyAroclor-1242Aroclor-1248Aroclor-1254
Arseniciarium'Cnzo(a) anthraceneJenzo(a)pyreneienzo(b)nuoninlheneienzo(k)nuoranthune!is(2-elhyltiexyl)phthatate'adrnium
Chromium'hrysene
CopperCyanide, totalron.ead•langancseMercuryNaphthalene
NickelfetrachjoroethenerhalllumPoxaphene[YichloroctnerieVanadium
(Total)Aidrin
AluminumAntimonyAroclor-1242Aroclor-1248
C;trcim>f>t'nic Risk
Ingestion
NCNCNCNCNCNCNCNCNCNCNCNCNCNCNCNCNCNCNCNCNCNCNCNCNCNCNCNCNCNC
Inhalation
NCNCNCNCNC
Dtnnal
NCNCNCNCNCNCNCNCNCNCNCNCNCNCNCNCNCNCNCNCNCNCNCNCNCNCNCNCNCNC
ExposureRoutes Total
NCNCNCNCNCNCNCNCNCNCNCNCNCNCNCNCNCNCNCNCNCNCNCNCNCNCNCNCNCNCNCNCNCNCNC
Non-Carcinogenic Hazard Quot ent
Primary
Target Organ
liverCNSblood
immunologicImmunologicimmunologic
skincardiovascular
NFlunglung
NF
kidney, liver
kidneyNOAEL
NFCl
body weight
ClNF
CNSdevelopment. CNS
body weightdecreased body weight
CNS. liverCNS
NFCNS, kidneyC I, kidney
(Total
NFlungNFNFNF
Ingestion
2.9E-046.5E-027.7E038.0E-032.1E.Q21.9E-02UE-023.3E-02
NCNCNCNC
7.5E-041.2E-025.IE-02
NC4.0E-032.4E-042.1E.01
NC4.0E-023.3E-02I.OE-043.6E-031, IE-051.8E-02
NC4.5E-042.9E-025.7E-01
Inhalation
NC3.7E05
NCNCNC
Dermal
Z.7E-051.5E-027.0E-038.5E-042.2E-032.0E-03I.4E-045.9E-03
NCNCNCNC
I.4E-042.6E-033.5E-02
NC6.4E-052.1E-OG2.2E-02
NC9.0E-033.0E-039.0E-OG
6.6E-049.9E-078.0E-04
NC4.3E-05l.OE-021.2E-01
ExposureRoutes Total
3.2E-048.0E-021.5E-028.8E-032.3E-022.IE-021.4E-023.9E02
NCNCNCNC
8.9E-04I.5E.028.CE-02
NC4.0E-032.4E-042.3E-01
NC4.9E-023.0E-021. IE-044.3E-031.2E-05I.9E-02
NC4.9E-043.9E-026.9E.OI
NC3.7E-05
NCNCNC
Page 1 of 3

[Scenario Thneframe:
[Receptor Population:[Receptor Ape:
Future 1
ResidentAdult ||
TABLE 8.4aRMESUMMARY OF RECEPTOR RISKS AND HAZARDS FOR COPCs
REASONABLE MAXIMUM EXPOSUREAQUA-TECH SITE
1 M--,
Surface Soil
r..™..,.
Medium
F,™,,. 1
Point
1Air Any Exposure Unit 1 location
Clictnlc.il
Aroclor-1254
Arsenic
Jarium
lenzo(a}anthracene
lenzo(a)pyrene
tenzo(b)nuoranlheiie
Jenzo(k)nuoranthene
Bis(2-ethylhexyl)phlhalate
Cadmium
Chrorniunl
Chrysene
Copper
Cyanide, total
ron
.cad
Manganese
Mercury
xlaphthaleile
Nickel
retrachloroethcne
riialllum
Toxaphenc
rrichloroetliene
Vanadium
(Total)
Care MOKenic Risk j
[ngeslion Inhalation
NC
NC
NC
NC
NC
NC
NC
NC
NC
NC
NC
NC
NC
NC
NC
NC
NC
NC
NC
NC
NC
NCNCNC
NC
Dermal
Total Risk Across Surface Soil
Groundwater Croundwater Any Exposure Unit 1 location Aluminum
Antimony
Arsenic3arium
Benzene
Bis(2-ethylhexyl)phlhatotc
Sromodichloromethane
Carbon telrachloridt-
Chlorobenzcne
Chloroethane
NC
NC
NC
NC
NC
NC
NC
NC
NC
NC
NC
NC
NC
NC
NC
NC
NC
NC
NC
NC
Exposure
Routes Total
NC
NC
NC
NC
NC
NC
NC
NC
NC
NC
NC
NC
NC
NC
NC
NC
NC
NC
NC
NC
NC
NC
NC
NC
NC
NC
NC
NC
NC
NC
NC
NC
NC
NC
NC
NC
Non-Carcinogenic Hazard Quotient
Primary
Target Organ
NF
NF
respiratory, blood pressure
NF
NF
NF
NF
NF
NF
respiratory
NF
NF
NF
NF
NF
CNS
CNS
nasal
NF
NF
NF
NF
NF
NF(Total)
Ingestion Inhalation
NC
NC
9.1E-OT
NC
NC
NC
NC
NC
NC
3.0E-06
NC
NC
NC
NC
NC
3.2E-05
7.0E-01
8.3E-03
NC
4.9E-05
NC
NC
l.OE-03
NC
7.IE-01
Dermal
Total Hazard Index Across Surface Soil
CNS
blood
skin
cardiovascular
CNS. blood
NF
kidney
liver
liver
liver
5.2E-02
4.2E-01
4.6E-01
1. IE-01
2.0E-01
NC
3.4E-04
7.8E-02
I.OE-OZ
l.OE-03
NC
NC
NC
NC
2.0E-01
NC
3.4E-04
7.8E-02
I.OE-02
l.OE-03
Exposure
Routes Total
NCNC
9. IE-06NCNC
NC
NCNC
NC
3.0E-OS
NC
NC
NC
NC
NC
3.2E-05
7.0E-01
8.3E.03
NC
4.9E-05
NC
NC
l.OE-03
NC
7.1E-01
I.4E-1-00
5.2E-02
4.2E-01
4.GE-01
1. IE-01
3.9E-01
NC
G.8E-04
I.CE01
2. IE-02
Z.1E-03
f .n
CD
Page 2 of 3

Scenario Timeframe: FutureReceptor Population: ResidentAcceptor ARC:_____Adult
TABLE 8.4a RMESUMMARY OF RECEPTOR RISKS AND HAZARDS FOR COPCs
REASONABLE MAXIMUM EXPOSUREAQUA-TECH SITE
MfHiuni
Croundwater
Rvnnstire
Medium
Groundwator
1Exposure 1
Point
Any Exposure Unit 1 location
Chemical
ChloroformChromiumCobaltJichlorobenzene, 1.4-)ictt(oroechane. 1.1-Dichloroethane. 1.2-Dichlorocthcne. l . l -Dlchloroethene, 1.2- (cis)Dichloroelhene. 1.2- (trans)ronManganeseMethyl tert butyl etherretrachloroethane. 1.1.2.2-retracliloroelheneThallluinrrichloroethanc. 1,1.1-rrichloroethene
VanadiumVinyl chloride
(Total)
Carcinogenic Risk ]
IngestioTi
NCNCNCNCNCNCNCNCNCNCNCNCNCNCNCNCNCNCNCNC
Inhalation Dermal
NCNCNCNCNCNCNCNCNCNCNCNCNCNCNCNCNCNCNCNC
Total Risk Across Croundwater
Landfill Gas Air Any Exposure Unit I location jlfJenzeneVinyl chloride
(Total)
NC
NC
NC
CNS Central Nervous System. Tola! Risk Across Landfill CasNOAEL No Observed Adverse Effect Level. T , n , . . . . » . • j . , , n
NF Not found Across All Media and All Routes
ExposureRoutes Total
NCNCNCNCNCNCNCNCNCNCNCNCNCNCNCNCNCNCNCNC
NC
NCNC
NM
NC
| NC
Non-Carcinogen c Hazard Quot em
PrimaryTarget Organ
MFliver
NOAELNFNF
NOAELCNS. liverCNS, liver
bloodliverGl
CNS
NFNF
CNS. liverCNSCNS
CNS. kidney
CI. kidney(Total
Ihgestion
3.3E-027.1E-024.4E-027.GE-031.5E-021.2E-025.GE-02l.lEtOO5.3E-034.7E014.0E»00
I.5E-026.9E-033.0E-012.8E»007.0E-033.0E»011.5E-022.9E-014.0E+01
Inhalation Dermal
3.3E-02NCNC
7.GE-03I.5E-021.2E-025.GE-02I.1E*005.3E-03
NCNC
1.5E.026.9E.033.0E-OI
NC7.0E-033.0E+01
NC2.9E-013.2E»01
Total Hazard Index Across Croundwater
blood. CNSNF
(Total)
7.CE.015.0E-037.7E-01
Total Hazard Index Across Landfill Gas
Total Hazard Index Across All Media and All Routes
ExposureRoutes Total
6.7E-027.1E-024.4E-021.5E-022.9E-022.5E-02LIE-01
2.2E+00
1.1E024.7E-OI4.0E»002.9E-021.4E-026.0E-OI2.8E+001.4E-026.0E+01I.5E-025.7E-017.2E»01
7.2E+OI
7.6E-015.0E-037.7E-01
7.7E-01
7.4E+01Gl Castiointestfonal tract.
NC Not calculated.N/A Not applicable.
"Derma!" Hazard Quotients for groundwater are the combined derma! and inhalation sutujgato values as noted on Tables 7 and as discussed in Section 3.4.1.4 of the text.
Total CI HI-|| 4.8E*00
TolalkidneyHI. i l 6.5E-01
Total CNS HI =11 G.7E*01
r-.n
Total liver HI -1| 5.9E+00
Page 3 of 3

TABLE 8.4bRMESUMMARY OF RECEPTOR RISKS AND HAZARDS FOR COPCs
REASONABLE MAXIMUM EXPOSUREAQUA-TECH SITE
Medium
Surface Soil
Scenario Timeframe: FutureReceptor Population: ResidentReceptor Age: Adult
ExposureMedium
Surface Soil
Air
ExposurePoint
Any Exposure Unit 2 location
Any Exposure Unit 2 location
Chemical
IronManganeseThalliumVanadium
(Total)IronVlanganeseThalliumVanadium
(Total)
Carcinogcnic Risk
Ingestion
NCNCNCNCNC
Inhalation
NCNCNCNCNC
Derma!
NCNCNCNCNC
Total Risk Across Surface Soil
Croundwater Groundwater Any Exposure Unit 2 location AluminumAntimonyArseniciariurn3enzeneBis(2-e(hylhexyl)phthalate3romodicbloromethane-arbon letrachlorideChlorobenzeneChloroethaneChloroformChromiumCobaltDichlorobenzene, 1.4-DfchJoroetliane, 1,1-Dichloroethane. 1.2-Dichloroctliene, 1.1-Dichlorocthene. 1.2- (cis)Dichloroctlicne, 1.2-(lraus)IronManganeseMethyl tert butyl etherTctrachlorocthane, 1.1.2,2-
NCNCNCNCNCNCNCNCNCNCNCNCNCNCNCNCNCNCNCNCNCNC•NC
NCNCNCNCNCNCNCNCNCNCNCNCNCNCNCNCNCNCNCNCNCNCNC
ExposureRoutes Total
NCNCNCNCNCNCNCNCNCNC
Non-Carcinogenic Hazard Quotient
PrimaryTarget Organ
CICNSCNS
CI. kidney(To(al)
NFCNSNFNF
(Total)
IngestEon
1.3E-011.7E-021.5E-021.5E-02I.7E-OI
Inhalation
-
NC1.4E-05
NCNC
1.4E-05
Dermal
I.3E-023.9E-036.8E-045.2E-032.3E-02
..
NC _|[ Total Hazard Index Across Surface Soil
NCNCNCNCNCNCNCNCNCNCNCNCNCNCNCNCNCNCNCNCNCNCNC
CNSbloodskin
cardiovascularCNS. blood
NFkidney
liverliverNF
liverNOAEL
NFNF
NOAELCNS. liverCNS, liver
bloodliver
CICNSNFNF
5.2E-024.2E-014.6E-011. IE-012.0E-01
NC3.4E-047.8E-02l.OE-02l.OE-033.3E-OZ7.1E-024.4E-027.6E-031.5E-02
1.2E-025.6E-021.1E+005.3E-034.7E-01t.OEfOO1.5E-026.9E-03
-
..
.-
-
NCNCNCNC
2.0E-OINC
3.4E-047.8E-02l.OE-02l.OE-033.3E-02
NCNC
7.6E-031.5E-021.2E-025.6E-021.1E+005.3E-03
NCNC
I.5E-026.9E-03
ExposureRoutes Total
I.4E-OI2. IE-021.6E-022.0E-022.0E-OI
NC1.4E-05
NCNC
1.4E-052.0E-01
5.2E-024.2E-014.6E-011. IE-013.9E-01
NCG.8E-041.6E-012. IE-022. IE-03G.7E-027. IE-024.4E-021.5E-022.9E-022.5E-021. IE-012.2E+001. IE-024.7E-014.0E*-002.9E-021.4E-02
(VJ
Page 1 of 2
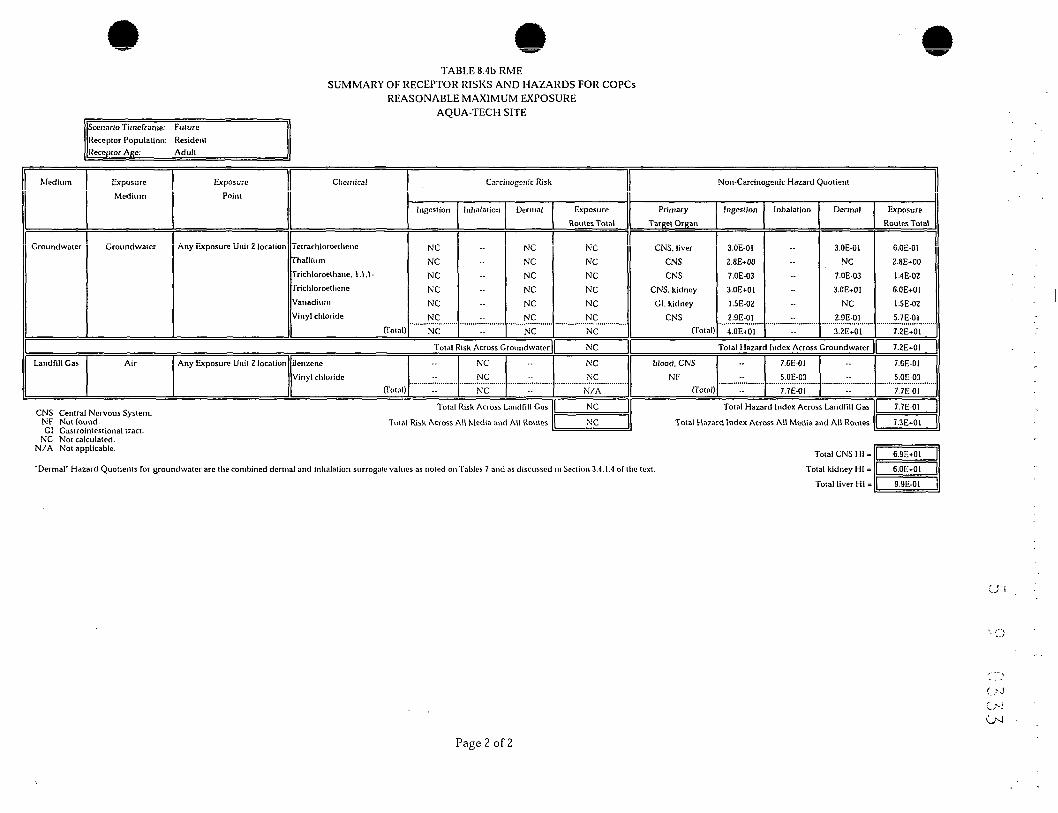
Scenario Timeframe: FutureReceptor Population: ResidentReceptor Age;_____Adult
TABLE 8.4b RMESUMMARY OF RECEPTOR RISKS AND HAZARDS FOR COPCs
REASONABLE MAXIMUM EXPOSUREAQUA-TECH SITE
Medium
Groundwater
Exposure
Medium
Groundwater
Exposure Chemical
Point II
I
Any Exposure unit 2 location Teirachloroethene
Thallium
Trichlorocthane. 1,1,1-
rrichloroethcne
VanadiumVinyl chloride
(Total)
Carcinogenic Risk
Ingestion
NC
NC
NCNCNCNCNC
Inhalation
-
Dermal
NCNCNCNCNCNCNC
Exposure
Routes Total
NCNCNCNCNCNCNC
Non-Carcinogenic Hazard Quotient
Primary
Target Organ
CNS. liver
CNSCNS
CNS. kidney
GI, kidney
CNS(Total)
Ingestion
3.0E-01
2.8E+00
7.0E-03
3.0E+01
1.5E-02
2.9E-01
4.0E+01
Inhalation
-
Dermal
3.0E-01
NC
7.0E-03
3.0E+01
NC2.9E-013.2E+01
Total Risk Across Groundwater || NC || Total Hazard Index Across Groundwater
Landfill Gas Air Any Exposure Unit 2 location ([Benzene
Vinyl chloride(I (Total)
-
...........:.:...........NCNC
NC-
„ „ Kt _ Total Risk Across Landfill GasCNS Central Nervous System.
NF Not found. Total Risk Across All Media and All Routes
NCNC
N/A
|_ "c
blood. CNS
NF(Total)
7.6E-01
5.0E-03
7.7E-01
-
Total Hazard Index Across Landfill Gas
Total Hazard Index Across All Media and All Routes
Exposure
Routes Total
o.OE-Oi
2.8E-I-001.4E-02
6.0E+OI
1.5E-02
5.7E-017.2E+01
7.2Et01
7.6E-OI5.0E-03
7.7E-OI
7.7E.01
7.3E+OI
NC Not calculated.N/A Not applicable.
"Dermal" Hazard Quotients for groundwater are the combined dermal and inhalation surrogate values as noted on Tables 7 and as discussed in Section 3.4.1.4 of the text.Total CNS HI =
Total kidney HI =
Total liver HI =
OM
Page 2 of 2

Scenario Timeframe:
Receptor Population:JReceptor Age:
Future |ResidentAggrcfinlc 1
TABLE 8.5a RMESUMMARY OF RECEPTOR RISKS AND HAZARDS FOR COPCs
REASONABLE MAXIMUM EXPOSUREAQUA-TECH SITE
1 ...^
Surface Soil
Expcrjre
Medium
,Surface Soil
Air
Exposure
Point
Any Exposure Unit 1 location
Any Exposure Unit 1 location
l-Vio-v.:.-:.!
Aldrin
Aluminum
Antimony
Aroclor-1242
Aroclor-1248
ArocIor-1254
Arsenic
larium
ienzo(a)anthracene
Jenzo(a)pyrene
ienzo(b)fluoranthene
Benzo(k)fluoranlhene
Bi5(2-ethy)ht?xy))phthnbte
Cadmium
Chromium
Chryscne
Copper
Cyanide, lot.nl
ron
Lead
Manganese
Mercury
Naphthalene
Nickel
Tetrachloroelhene
Thallium
Foxaphene
Trichloroethene
Vanadium
{Total
Aldrin
Aluminum
Antimony
Aroclor-1242
Aroclor-1248
r.,™™,™!,**
Ingestion
9.2E-OS
NC
NC
2.0E-07
5.0E-07
4.7E-07
3.9E-06
NC
2.3E-07
3.5E-06
3.6E-07
2.5E-OS
I.3E-07
NC
NC
2.6E-09
NC
NC
NC
NC
NC
NC
NC
NC
3.5E-09
NC
5.3E-07
3.3E-03
NC
l.OE-05
Inhalation
-
-
-
-
-
-
-
-
_
-
-
I.5E-08
NC
NC
1. IE-03
2.8E-OS
Dermal
6.0E-09
NC
NC
1.5E-OS
3.9E-08
3.6E-08
2.7E-08
NC
3.0E-OS
4.6E-07
4.7E.OS
3.3E-09
1.7E-08
NC
NC
3.5E-IO
NC
NC
NC
NC
NC
NC
NC
NC
2.3E.10
NC
7.0E-OS
2.3E-09
NC
7.6E-07
Exposure
Roules Total
9.SE-08
NC
NC
2, IE-07
5.4E-07
S.OE-07
3.9E-06
NC
2.6E-07
4.0E-06
4. IE-07
2.SE-OS
1.5E-07
NC
NC
3.0E-09
NC
NC
NC
NC
NC
NC
NC
NC
3.7E-09
NC
6.0E-07
3.5E-OS
NC
1. IE-05
1.5E-08
NC
NC
1. IE-08
2.8E-08
Non-Carcinoeentc Hazard Quotient ||
Primary
Target Organ
liver
CNS
blood
inimunologtc
immunologic
immunologic
skin
cardiovascular
NF
lung
lung
NP
kidney, liver
kidney
NOAEL
NF
Cl
body weight
Cl
NE
CNS
development, CNS
body weight
decreased body weight
CNS, liver
CNS
NF
CNS, kidney
Cl, kidney(Total)
NF
lung
NF
NF
NF
Ingestion Inhalation
NC
NC
NC
NC
NC
NC
NC
NC
NC
NC
NC
NC
NC
NC
NC
NC
NC
NC
NC
NC
NC
NC
NC
NC
NC
NC
NC
NC
NC
NC-.
-
-
-
-
-
-
-
-
-
-
-
-
-
-
-
-
-
-
-
-
-
-
-
-.
NC
NC
NC
NC
NC
Dermal Exposure
Routes Total
NC
NC
NC
NC
NC
NC
NC
NC
NC
NC
NC
NC
NC
NC
NC
NC
NC
NC
NC
NC
NC
NC
NC
NC
NC
NC
NC
NC
NC
NC-
-
-
-
NC
NC
NC
NC
NC
NC
NC
NC
NC
NC
NC
NC
NC
NC
NC
NC
NC
NC
NC
NC
NC
NC
NC
NC
NC
NC
NC
NC
NC
NC
NC
NC
NC
NC
NC
(." J
Page 1 of 3
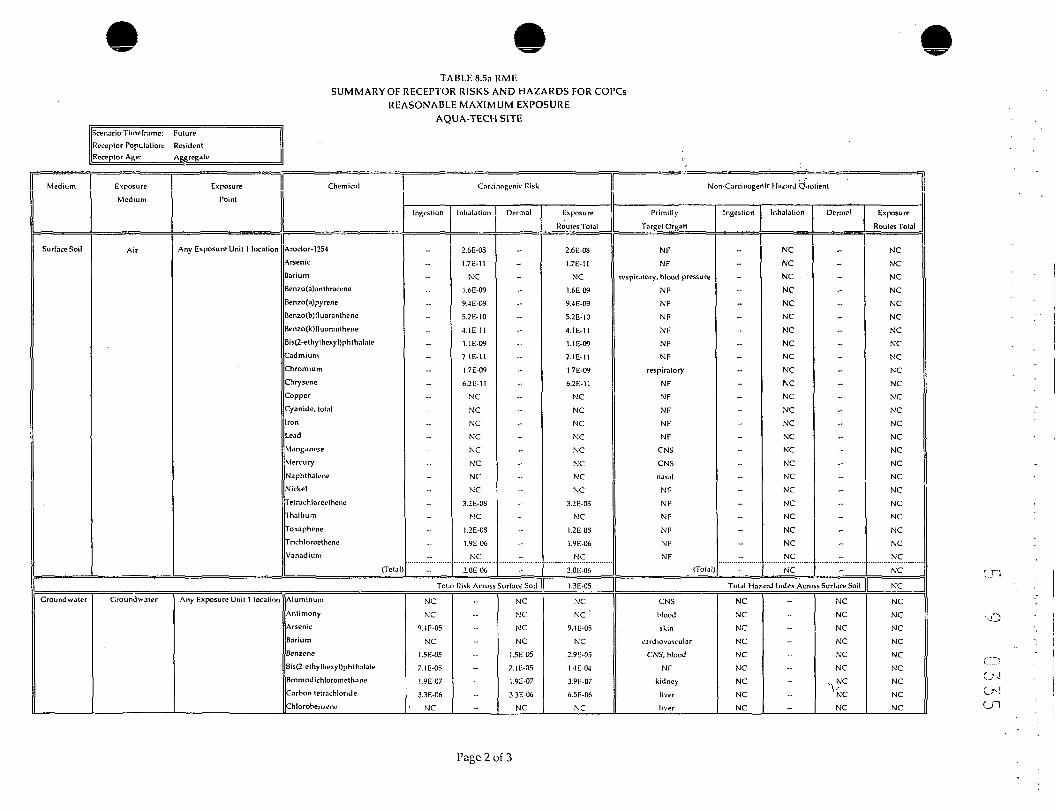
TABLE 8.5.1 RMESUMMARY OF RECEPTOR RISKS AND HAZARDS FOR COPCs
REASONABLE MAXIMUM EXPOSUREAQUA-TECH SITE
!
Scenario Time frame: Future
Receptor Population: ResidentReceptor Age:______Aggregate
I Medium
Surface Soil
Exposure
Medium
Air
Exposure I
Point
Any Exposure Unit 1 location
Chemical
Aroclor-1254
Arsenic
larium
5enzo(a)anthracene
Jenzo(a)pyrene
Benzo(b)fluoranthene
Benzo(k)fluoranthene
Bis(2-ethylhexyl)phthalate
Cadmium
Chromium
Chrysene
Copper
Cyanide, total
ron
.ead
vlanganese
Mercury
Naphthalene
Nickel
retrachloroethene
Thallium
foxaphene
Trichloroethene
Vanadium
(To(al)
I I , - . . - .Carcinogenic Risk |j Non-CarcinogeriiC Hazard Quotient
Ingcstion
--
-
.-
-
-
-
_
-
-.
..
nlialation
2.6E-OS
1.7E-1I
NC
1.6E-09
9.4E-09
5.2E-IO
4. IE-11
1. IE-09
2.1E-11
1.7E-09
6.2 E- 11
NC
NC
NC
NC
NC
NC
NC
NC
3.2E-03
NC
1.2E-OS
1.9E-06
NC
2.0E-06
Dermal
-
-
-
-
-
-
-
-
_
Exposure
Routes Total
2.6E-03
I.7E-II
NC
1.6E-09
9.4E-09
5.2E-10
4.1E-1I
1. IE-09
2.1E-11
1.7E-09
6.2E-11
NC
NC
NC
NC
NC
NC
NC
NC
3.2E-OS
NC
1.2E-OS
1.9E-06
NC
2.0E-06
Primilly
Target Organ
NF
NF
respiratory, blood pressure
NR
NF
NF
NF
NF
NF
respiratory
NF
NF
NF
NF
NF
CNS
CNS
nasal
NF
NF
NF
NF
NF
NF(Total)
Ingcstioh
„
-
-
-
-
-
_
-
_
-
-
-
-
-
_
-
-
-
-
_
_
_
-
-
-
Inhalation
NC
NC
NC
NC
NC
NC
NC
NC
NC
NC
NC
NC
NC
NC
NC
NC
NC
NC
NC
NC
NC
NC
NC
NC
NC
Derm.-!
_
-
-
-
_
-
_
-
-
-
-
_
_
-
_
_
-
-
-
-
Exposure
Routes Total
NC
NC
NC
NC
NC
NC
NC
NC
NC
NC
NC
NC
NC
NC
NC
NC
NC
NC
NC
NC
NC
NC
NC
NC
NC
Tot.nl Risk Across Surface Soil || 1.3E-05 j| Total Hazard Index Across Surface Soil || NC
Groundwater Croundwater Any Exposure Unit 1 location Aluminum
Antimony
Arsenic
Barium
3enzene
8is(2-ethylhexyl)phthalate
Sromodiehlorom ethane
Carbon tetrachloride
Chlorobenzene
NC
NC
9.4E-05
NC
1. SB-OS
7. IE-05
I.9E-07
3.3E-06
NC
.-
-
_
_
_
NC
NC
NC
NC
I.5E-OS
7. IE-05
1.9E-07
3.3E-06
NC
NC
NC '
9.4E-05
NC
2.9E-05
1.4E-04
3.9E-07
6.5E-06
NC
CNS
blood
skin
cardiovascular
CNS, Wood
NF
kidney
liver
liver
NC
NC
NC
NC
NC
NC
NC
NC
NC
-
-
_
_
-
NC
NC
NC
NC
NC
NC
, NCVNC
NC
NC
NC
NC
NC
NC
NC
NC
NC
NC
Page 2 of 3

TABLE 8.5aRMESUMMARY OF RECEPTOR RISKS AND HAZARDS FOR COPCs
REASONABLE MAXIMUM EXPOSUREAQUA-TECH SITE
Scenario Time frame: FutureReceptor Population: ResidentReceptor Age:_____Aggregate
1 Medium
Groundwater
Exiinsure
Medium
Groundwater
Exposure I! Chemical
Point
||
Any Exposure Unit 1 location Chloroethane
Chloroform
Chromium
Cobalt
Dichlorobenzene, 1,4-
Dichloroethane, 1,1-
Dichloroethane, 1,2-
Dichloroethene, 1,1-
Dichloroethene, 1,2- (cis)
Dichloroethene, 1,2- (trans)
ron
Manganese
Methyl tert butyl ether
fetrachloroelhane, 1,1,2,2-
Tetrachloroelhene
Thallium
frichloroethane, 1,1,1-
rrichloroethcne
Vanadium
Vinyl chloride
(Tola }
1rim-itKVPnii- Risk I
Ingestion
5.6E-07
NC
NC
NC
2.5E-06
NC
1.5E-05
1.4E-04
NC
NC
NC
NC
NC
3.SE-05
7.1E-05
NC
NC
1.6E-03
NC
3.0E-04
2.4E-03
inhalation
_
-
-
-
-
-
-
_
-
Dermal
5.6E-07
NC
NC
NC
2.5E-06
NC
1.5E-05
1.4E-04
NC
NC
NC
NC
NC
3.SE-05
7. IE-05
NC
NC
1.6E-03
NC
3.0E-04
2.3E-03
Exposure
Routes Total
1. IE-06
NC
NC
NC
5.0E-06
NC
3. IE-05
2.7E-04
NC
NC
NC
NC
NC
7.5E-05
1.4E-04
NC
NC
3.3I--03
NC
5.9E-04
4.7E-03
Nnn-Cnn-innpenii- H.-j/ard Quotient [I
Primary
Target Organ
NF
liver
NOAEL
NF
NF
NOAEL
CNS, liver
CNS, liver
blood
liver
Gl
CNS
NF
NF
CNS, liver
CNS
CNS
CNS, kidney
Cl, kidney
CNS
(Total;
Ingestion
NC
NC
NC
NC
NC
NC
NC
NC
NC
NC
NC
NC
NC
NC
NC
NC
NC
NC
NC
NC
NC
Inhalation
..
-
-
_
-
_
-
_
_
-
_
-
-
_
_
-
-.
-
-
_
-
Dermal
NC
NC
NC
NC
NC
NC
NC
NC
NC
NC
NC
NC
NC
NC
NC
NC
NC
NC
NC
NC
NC
Exposure
Routes Total
NC
NC
NC
NC
NC
NC
NC
NC
NC
NC
NC
NC
NC
NC
NC
NC
NC
NC
NC
NC
NC
Total Risk Across Croundwater || NC || Total Hazard Index Across Croundwater || NC
Landfill Gas Air Any Exposure Unit J location ([Benzene
Vinyl chloride1 (Total)
1.7E-05
l.OE-06
l.SE-05
CNS Central Nervous System. Total Risk Across Landfill GasNOAEL No Observed Adverse Effect Level.
NF Not found. Total Risk Across All Media and All RoutesCl Castrointestional tract.
NC Not calculated.N/A Not applicable.
1.7E-05 I! blood, CNS
l.OE-06
l.SE-05
l.SE-05
4.7E-03
NF
| (Total)
-
-
-
NC
NC
NC
-
-
-
Total Hazard Index Across Landfill Gas
Total Hazard Index Across All Media and All Routes
NC
NC
N/A
NC
NC
•'./I
"Dermal" risks for ground water are the combined dermal and inhalation surrogate values as noted on Tables 7 and as discussed in Section 3.4.1.4 of the U'\t.
.'/••Jc-JON
Page 3 of 3
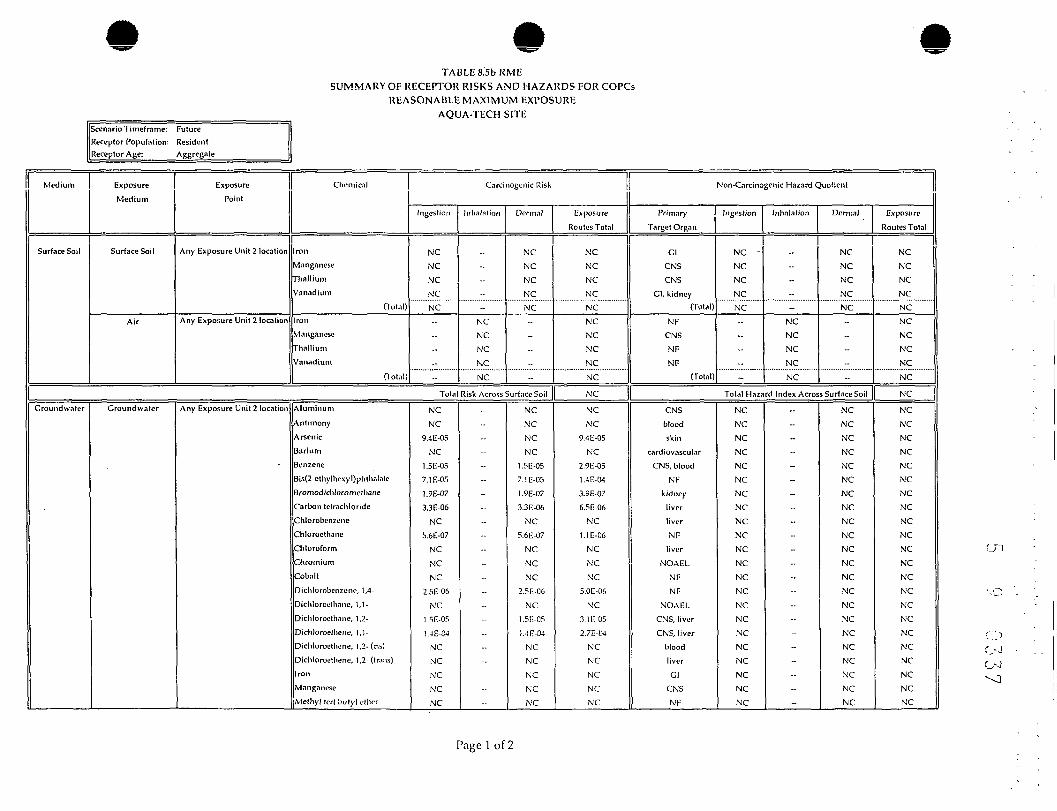
TABLE S.SbRMESUMMARY OF RECEPTOR RISKS AND HAZARDS FOR COPCs
REASONABLE MAXIMUM EXPOSUREAQUA-TECH SITE
ilario Timeframe: Future'Receptor Population: Resident[Receptor Age:_____Aggregate
1 Medium
Surface Soil
Exposure
Medium
Surface Soil
Air
Exposure
Point
Any Exposure Unit 2 location
Any Exposure Unit 2 location
Chemical
ron
Manganese
Thallium
Vanadium
(Total)
ron
Manganese
Thallium
Vanadium
(Total)
Carcinogenic Risk |
Ingcstion
NCNCNCNCNC
..-
Inhalation
NC
NC
NC
NC
NC
Dermal
NC
NC
NC
NC
NC
-
-
Exposure
Routes Total
INC
NC
NC
NC
NC
NC
NC
NC
NC
NC
||Non-Carcinogenic Hazard Quotient
Primary
Target Organ
Cl
CNS
CNS
Cl, kidney
(Total)
NF
CNS
NF
NF(Total)
Ingestion
NC -
NC
NC
NC
NC
-
-
-
Inhalation
..
_
-
NC
NC
NC
NC
NC
Dermal
NC
NC
NC
NC
NC-
_
-
-
-
Exposure
Routes Total
NC
NC
NC
NC
NC
NC
NC
NC
NC
NC
Tola! Risk Across Surface Soil || NC || Total Hazard Index Across Surface Soil || NC
Groundwater Groundwater Any Exposure Unit 2 location Aluminum
Antimony
Arsenic
Jarium
Benzene
Bis(2-ethylhexy1)phthalate
3romodicliloromethiine
Carbon tetrnchloride
Ch to ro benzene
Chloroethane
Chloroform
Chromium
Cobalt
3ichlorobenzene, 1,4-
Dichloroethane, 1,1-
Dichloroctliane, 1,2-
Dichloroelhene, 1,1-
Dichlorocthene, 1,2- (cis)
Dichloroethenc, 1,2- (trans)
ron
Manganese
Methyl tert butyl ether
NC
NC9.4E-05
NC
1.5E-05
7. IE-05
1.9E-07
3.3E-06
NC5.6E-07
NC
NCNC
2.5E-06
NC
1.5E-05
1.4E-W
NC
NC
NC
NC
NC
--
-
-
-
NC
NC
NC
NC
1.5E-05
7. IE-05
I.9E-07
3.3E-06
NC
5.6E-07
NC
NC
NC
2.5E-06
NC
1.5E-05
1.4E-04
NC
NC
NC
NC
NC
NC
NC
9.4E-05
NC
2.9E-05
1.4E-04
3.9E-07
6.5E-06
NC
1. IE-06
NC
NC
NC
5.0E-06
NC
3. IE-05
2.7E-04
NC
NC
NC
NC
NC
CNS
blood
skin
CNS, blood
NF
kidney
liver
liver
NF
liver
NOAEL
NF
NF
NOAEL
CNS, liver
CNS, liver
blood
liver
Cl
CNS
NF
NC
NC
NC
NC
NC
NC
NC
NC
NC
NC
NC
NC
NC
NC
NC
NC
NC
NC
NC
NC
NC
NC
-
-
_
-
-
-
-
-
-
„
.-
-
NC
NC
NC
NC
NC
NC
NC
NC
NC
NC
NC
NC
NC
NC
NC
NC
NC
NC
NC
NC
NC
NC
NC
NC
NC
NC
NC
NC
NC
NC
NC
NC
NC
NC
NC
NC
NC
NC
NC
NC
NC
NC
NC
NC
Page 1 of 2

TABLE S.SbRMESUMMARY OF RECEPTOR RISKS AND HAZARDS FOR COPCs
REASONABLE MAXIMUM EXPOSUREAQUA-TECH SITE
Scenario Timcframe: FutureReceptor Population: ResidentReceptor Age:_____Aggregate
1 Medium
Groundwater
Exposure
Medium'
Groundwater
Exposure [I Chemical
Point
Any Exposure Unit 2 location retrachlorocthane, 1,1,2,2-
retrachloroethcnc
Thallium
Trichlorocthane, 1,1,1-
Trichloroethene
Vanadium
Vinyl chloride
(Total)
Carcinogenic Risk
Ingestion
3.8E-05
7.1E-05
NC
NC
1.6E-03
NC
3.0E-04
2.4E-03
Inhalation
..
-
-
-
Dermal
3.SE-05
7.1E-05
NC
NC
1.6E-03
NC
3.0E-04
2.3E-03
Exposure
Routes Total
7.5E-05
1.4E-04
NC
NC
3.3E-03
NC
5.9E-04
4.7E-03
Non-Carcinogenic Hazard Quotient
Primary
Target Organ
NF
CNS, liver
CNS
CNS
CNS, kidney
Cl, kidney
CNS
(Tolal)
Ingestion
NC
NC
NC
NC
NC
NC
NC
NC
Inhalation
-
_
-
--
Dermal
NC
NC
NC
NC
NC
NC
NC
NC
Exposure
Routes Total
NC
NC
NC
NC
NC
NC
NC
NC
Tolal Risk Across Croundu'iitcr ][ 4.7E-03 || Total Hazard Index Across Croundwater || NC
Landfill Gas Air Any Exposure Unit 2 location Benzene
Vinyl chloride
(Total)
--
-
1.7E-05
l.OE-06 -
CNS Central Nervous System. Total Risk Across Landfill GasNF Not found.Gl Castroinlcslion.il tract. Total Risk Across All Media and All Routes
NC Not calculated.N/A Not applicable.
1.7E-05 || blood, CNS
1.0E-06
1.8E-05
1.8E-05
NF
[ (Total)
-
NC
NC
NC
-
-
-
Total Hazard Index Across Landfill Gas
Total Hazard Index Across AH Media and All Routes
NC
NC
N/A
NC
NC
"Dermal" risks for ground water aro the combined dermal and inhalation surrogate values as noted on Tables 7 and as discussed in Section 3.4.1-4 of the text.
VQ
OO
Page 2 of 2
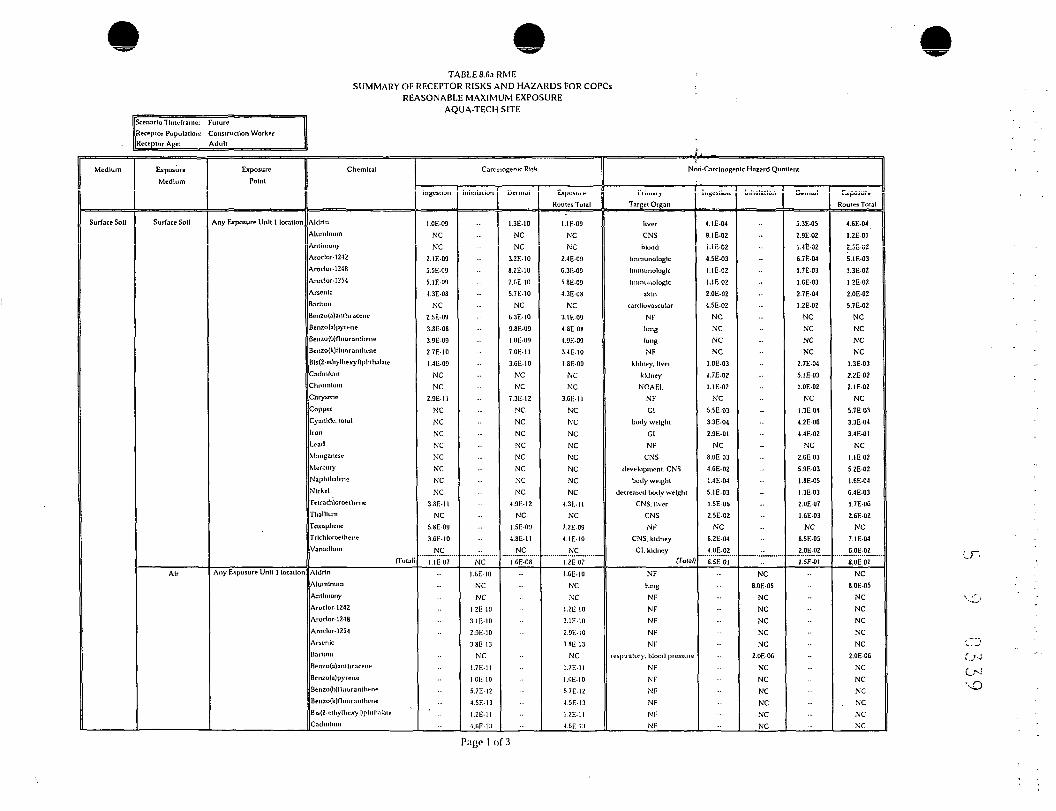
TABLE 8.6.1 RMESUMMARY OF RECEPTOR RISKS AND HAZARDS FOR COPCs
REASONABLE MAXIMUM EXPOSUREAQUA-TECH SITE
[Scenario Tlmen-anie: FutureReceptor Population: Construction WorkerReceptor ARC: Adult
Medium
Surface Soil
ExposureMedium
Surface Soil
Air
ExposurePoint
Any Exposure Unit 1 location
Any Exposure Unit 1 location
Chemical
AldrlnAluminumAiilimuiiyAroclor-1242Aroclor-1248Aroclor-1254ArsenicBariumJenzu(a)anlhracene
Benzo(a}pyreneJenzo(b)rtuoranlriene
Jenzo(k)fluorantheneBl5(2-elliylhexyl)plithalateCadmiumChromiumChryscneCopperCyanide, totalIronLeadManganeseviitrcuryvjaphllialcnc
Nickelfctracliloroethene
ThalliumToxaphene
TrlchloroctheneVanadium
(Total)
Aldrln
AluminumAntimonyAroclor-1242
Aroclor-1248Aroclor-1254Arsenic
Barium3enzo(a)anlhracene
Senzo{a)pyrcneBenzolbJIluoranthi-ne
BenzoflOnuaranlheneBls(2-etliyllii!xyl)plitlialaleCadmium
Carcinogenic Risk
ingesuon
l.OE-09
NC
NC
2.1E-09
S.5E-095.IE-094.3E-08
NC
2.5E-09
3.SE-08
3.9E-09
2.7E-IO
I.4F.-09
NCNC
2.9E-IINCNCNCNCNCNCNCNC
3.8E-11NC
5.8E-093.6E-10
NC1. IE-07
innabuoti
NC1.6E-10
NCNC
I.2E- IO3 . I E - I O2.9E-103.8E-13
NCI . 7 E - I Il.OE-105.7E-124.5E-131 .ZE- I14.GE-13
Demiai
I.3E-10
NCNC
3.2E-108.2E-107.DE-IO5.7 E- 10
NCC.3E-IO9.8E-09
I.OE-03
7.0E-1I3.GE-10
NCNC
7.3E-I2NCNCNCNCNCNCNCNC
4.9E-12NC
I.5E-094.8E-I1
NCI.GE-08
Exposure
Routes Total
1. IE-09
NCNC
2.4E-09G.3E-035.8E-094.3E-08
NC3.IE-09
4.8E-08
4.9E-09
3.4E-10
1.8E-09
iVC
NC
3.GE-11
NCNCNCNCNCNCNCNC
4.3E-1INC
7.ZE-OS4.1E-10
NCI.2E07I.GE-10
NCNC
I.2E-103.1E-10
2.9E-IO
3.8E-13
NC
I.7E-1I
l.OE-105.7E-I2
4.5E-13
1.2E-11
4 .GE-I3
.
Non-Carcinogen c Hazard Quot ent
~i i iu«i ,Target Organ
liverCNSblood
Immunologtc
ImmunologlcImmunaloglc
skincardiovascular
NFlung
lung
NFkill. ley. liver
kidneyNOAEL
NFCl
body weightClNF
CNSdevelopment. CNS
body weightdecreased body weight
CNS. liver
CNS
NFCNS. kidney
Cl. kidney(Total
NFlungNFNFNFNFNF
rttspiratory. blood pressure
NFNFNFNFNFNF
1
4 . IE049.IE-02i. IE-024.5E-03I. IE-02I. IE-022.0E-024.5E-02
NCNCNCNC
l.OE-03I.7E-021. IE-02
NC5.5E-033.3E-042.9E-OI
NC8.0E034.GE-021.4E-045.1E-03I.5E-062.5E-02
NCG.2E04
4.0E-02
C.5E-OI
llil.uUtlO.
„
NC8.0E-05
NCNCNCNCNC
2.0EOGNCNCNCNCNCNC
" „• '
5.3E-OS2.9E-021.4E-026.7E-04I.7E03l.GE-032.7E-04I.2E-02
NCNCNCNC
2.7E-045. IE-03I.OE-02
NCI.3E-044.2E-OG4.4E-02
NC2.GE-035.9E-031.8E-051.3E-032.0E071.6E-03
NC8.5E-052.0E-02l.SE-OI
Lxpo^r.Routes Total
4.6E-04I.2E-012.5E-025.1E-031.3E-021.2E-022.0E-025.7E-02
NCNCNCNC
I.3E-032.2E-022. IE 02
NC5.7E033.3E-043.4E-01
NC1. IE-025.2E-021.6E-046.4E-03I.7E-002.6E-02
NC7. IE-046.0E-028.0E-OI
NC8.0E-05
NCNCNCNCNC
2.0E06NCNCNCNCNCNC
•o
Page 1 of 3

TABLE 8.Ga RMESUMMARY OF RECEPTOR RISKS AND HAZARDS FOR COPCs
REASONABLE MAXIMUM EXPOSUREAQUA-TECH SITE
Medium
Surface Soil
Scenario Tlineframe: FutureReceptor Population: Construction WorkerReceptor Ape: Adult
ExposureMedium
Air
Exposure 1 ChemicalPoint |
Any Exposure Unit 1 location
Subsurface Soil Subsurface Soil Any Exposure Unit 1 location
ChromiumChryseneCopperCyanide, totalran
LeadManganeseMercuryNaphthaleneNickelTetrachloroet hcneThalliumToxaphene
frlchloroetheiieVanadium
(Total)
Aroclor 12-12Aroclor 1248Aroclor 1254ArsenicJt'nzo(a)anthracene
3enzo(a)pyrene3enzo(b)fluoranlheneBenzo(k)nuoranlhcneChromiumChrysene
Dlchloroethone, 1.1-Dlchloroelhfne. cls-1,2-
[ndeno(1.2.3-cd)pyreneronretracllluroethene
ThalliumTolueneTrlchloroelhene
(Total)
Cairlnogenlc Risk
Ingeslion nhalatlon
3.7E-1IG.8E-13
NCNCNCNCNCNCNCNC
3.5E-10NC
1.3E 102.1E-08
NC2.2E-08
Di-rmal
Total Rbk Across Surface Soil
7.3E-085.GE-095.GE-095.7E-08G.5E-093.GE-08
5.5E-094.8E-10
NC5.8E 111.5E-09
NC4.2E-09
NC5.9E-OS
NCNC
l.SH-074.3E-U7 NC
I.1E-088.4IMO8.-IE-107.GEIO1.7E-099.4E-09I.4E-091.2E-10
NCI.5E-II1.9E-10
NC1. IE-09
NC7.5E-09
NCNC
2.4E085.UK.08
ExposureRoutes Total
3.7E-116.8E-13
NCNCNCNCNCNCNCNC
3.5E-10NC
I.3E-102. IE 08
NC2.2E-03
I.SE-078.4E-OS
C.4E-09
C.4E09
5.7E-OS
8.2E-09
4.GE08
7.0E-09
6.1E-IO
NC
7.3E-I1
1.7E09NC
5.3E-09NC
6.GE-08NCNC
2.1E.074.9E-07
Non-Carcinogenic Hazard Quotient
PrimaryTarget Organ
respiratoryNFNFNFNFNF
CNSCNSnasal
NFNFNFNFNFNF
(Total)
Ingcstion
-
Inhalation
6.SE-OCNCNCNCNCNC
6.9E-057.GE.018.9E-03
NC5.2E-05
NCNC
1. IE-03NC
7.7E-01
Dermal
.-
..
Total Hazard Index Across Surface Soil
Immiinologlc
ImmunologlcImmunulogk
skinNF
lunglungNF
NOAELNF
CNS. liverblood
NFCl
CNS. liver
CNSliver, kidney
CNS. kidney(Total)
1.5E-01I.2E-OZI.2E-022.6E-02
NCNCNCNC
8.0E-03NC
5.7E-055.5E.06
NC2.8E:OI2.4E-033.2E-OI7.2E-053.2E-01UE»00
..
..
2.3E-021.8E-03
1.8E-033.GE-04
NCNCNCNC
7.9E-03NC
7.3E.OG8.7E-07
NC4.2E-023.0E-042.0E-029.3E-OG4.3E.02I.4E-OI
ExposureRoutes Total
6.SE-OGNCNCNCNCNC
6.9E-057.6E-018.9E-03
NC5.2E-OS
NCNC
1. IE-03NC
7.7E-OI
1.6E»00
1.8EOI1.3E02I.3E-022.7E-02
NCNCNCNC
I.GE-02NC
6.5E-056.3E-06
NC3.2EOI2.7E-033.4E-OI8.2E-053.6E-011.3E»00
I ^
CD
Page 2 of 3

TABLE S.Ga RMESUMMARY OF RECEPTOR RISKS AND HAZARDS FOR COPCs
REASONABLE MAXIMUM EXPOSUREAQUA-TECH SITE
Medium
Subsurface Soil
landfill Cas
Scenario Tlinefraine: FutureReceptor Population: Construction Worker
Receptor Ape: Adult
Exposure
}.'.:i\\zr.
Air
Air
ExposurePfilnl
Any Exposure Unit 1 location
Chemical
Aroclor 1242
Aroclorl248
Aroclor 1254
Arsenic
}enzo(a)anthracene
}enzo(a)pyrene
JeitzofoJ/luoranthene
)enzo(k)fluoramhene
Chromium
ChryseneDlchloroelhene. 1.1-
D1chlomlhenc.cb-1.Z-
[ndeno(1.2.3-cd)pyrene
Iron
Tetrachlorocthene
Thallium
Toluene
Trlchloroelhene
(Total)
Any Exposure Unit 1 location Benzene
Vinyl chloridefl'ulal)
Care nogenlc Risk
Ingestlon Inhalation
3.5E-20
2.7E-21
2.7E-21
5.0E-I3
3.9E-22
8.4E-22
G.5E-23
G.8E-24
2.8E-II
I.2E-23
4.0E-19
NC
4.2E-23
NC4.GE-I8
NC
NC
9.1E-I7
2.9E-11
Detmal
Total Risk Across Snlisurface Soil
1.8E-07
1. IE-01
1.9E-07
CNS Central Nervous System. Total Risk Across Landfill GasNF Nol found.Cl Castrolntesllonal tract. Tolil Rlsk Ac'°" A" M«ll:1 a'"' A11 R»'"cs
Exposure
Routes Total
3.5E-20
2.7E-21
2.7E-2I
5.0E-13
3.9E-22
8.4E-22
6.SE.23
G.8E-24
2.8E.1I
I.2E-23
4.0E-19
NC
4.2E-23
NC
J.GE-18
NCNC
9.1E-172.9E-II
4.9E-07
1.8E-07
1.1E-08I.9EU7
I.9E-07
8.3E-07
Non-Carcinogenic Hazard Quotient
Primary
Target Organ
NF
NF
NFNFNFNFNKNF
respiratory
NF
NF
NFNFNFNFNF
neurological
NF(Total)
Ingestlun Inhalation
NC
NC
NC
NCNCNCNCNC
4.9E-06NCNCNCNCNC
7.0E-13NC
4.2E-144.8E-124.9E-06
Dermal
Total Hazard Index Across Subsurface Soil
blood. CNS
NF
(Total)
8.2E-01
5.4E-03
8.3E-01
Total Hazard Index Across Landfill Cas
Tolal Hazard Indi-x Across All Media and All Routes
Exposure
Routes Total
NCNCNCNCNCNCNCNC
4.9E-OGNCNCNCNCNC
7.0E-13
NC4.2E 14
4.8E-I2
4.9E-OG
1.3E.OO
8.2E-01
5.4E-03
8.3E-OI
8.3E-OI
3.7E+00NC Not calculated.
NOAEL No Observed Adverse Effect Level Tolal cl H, _ II 72E-01
Total CNS HI = || 2.5E»00
CD
Page 3 of 3

icenariu Tfmeframe: FutureReceptor Population: Construction Worker'Receptor Age:______Adult___________
TABLE 8.6b RMESUMMARY OF RECEPTOR RISKS AND HAZARDS FOR COPCs
REASONABLE MAXIMUM EXPOSUREAQUA-TECH SITE
Medium
Surface Soil
ExoositreMedium
Surface Soil
Air
ExposurePoint
Any Exposure unit 2 location
Any Exposure Unit 2 location
Chi'mical
ironManganeseThalliumVanadium
(Total)IronManganeseDialliumVanadium
(Total)
II llCare nogenic Risk jj Non-Carcinogenic Hazard Quol ent jj
IngL'stion
NCNCNCNCNC
nhalalion
NC
NCNCNCNC
Dermal
NCNCNCNCNC
Total Risk Across Surface Soil
Subsurface Soil Subsurface Soil
Air
Any Exposure Unit 2 location
Any Exposure Unit 2 location
Sediment Sediment Any Exposure Unit 2 location
Arsenic(Total)
Arsenic(Total)
9.0E-08O.OE-08
7.9E-137.9E-13
I.2E-091.2E-09
Total Risk Across Subsurface Soil
AluminumAntimonyAroclor-1248Aroclor-1254Arseniclarium3enzo(a)anthraceneJenzo(a)pyrene3enzo(b)fluoranthcne3enzo(k)riuorantheneChromium3hryseneIronManganese
MercuryThalliumVanadium
(Total)
NCNC
C.I E- 11G.OE-I I3. IE-09
NC9.9E-111. IE-091. IE-10S.3E-12
NC1. IE-12
NCNCNCNCNC
•I.SE-09
NCNC
9.GE-129.0E-124.2E-11
NC2.6E-112.7E-102.7E-112..1E-12
NC2.9E-13
NCNCNCNCNC
3.9IMO
ExposureRoutes Total
NCNCNCNCNCNCNCNCNCNC
NC
9.1E089. IE-087.9E-I37.9E-13
9. IE-08
NCNC
7.3E-116.9E-113.2E-09
NC1.3E-10I.3E091.3E-101.2E-II
NC1.4E-12
NCNCNCNCNC
4.3E-09
PrimaryTarget Organ
GlCNSCNS
CI, kidney(Total)
NFCNSNFNF
(Total)
Ingestion
I.8E-013.5E-032.1E-022. IE-022.2E-OI
-.
Inhalation
NC3.0E-05
NCNC
3.0E-05
Dermal
2.7E-021. IE-031.3E-03l.OE-023.9E-02
Total Hazard Index Across Surface Soil
skin(Total)
NF(Total)
4.2E-024.2E-02
NCNC
5.7E-045.7E-04
Total Hazard Index Across Subsurface Soil
CNSblood
immunologlcimmunologic
skincardiovascular
NFlunglungNF
NOAELNFCI
CNSdevelopment. CNS
CNSCI, kidney
(Total)
3.3E-03I.4E-03I.3E-041.3E-04I.5E-031.9E-03
NCNCNCNC
4.1E-04NC
1.5E-02I.OE-032.6E-048.7E-03I.7E-033.5E-02
1. IE-03I.8E-032.0E-051.9E-052.0E-054.8E-04
NCNCNCNC
4.0E-04NC
2.3E-033.3E-043.3E-055.6E-048.2E-047.8E-03
ExposureRoutes Total
2.0E-014.6E-032.2E-023.1E-022.6E-01
NC3.0E-05
NCNC
3.0E-05
2.GE-01
4.3E-024.3E-02
NCNC
4.3E-02
4.3E-033.2E-031.5E-041.4E-04I.5E-032.4E-03
NCNCNCNC
8. IE-04NC
I .7E02I.4E-032.9E-049.3E-032.5E-034.3K-02
Page 1 of 2
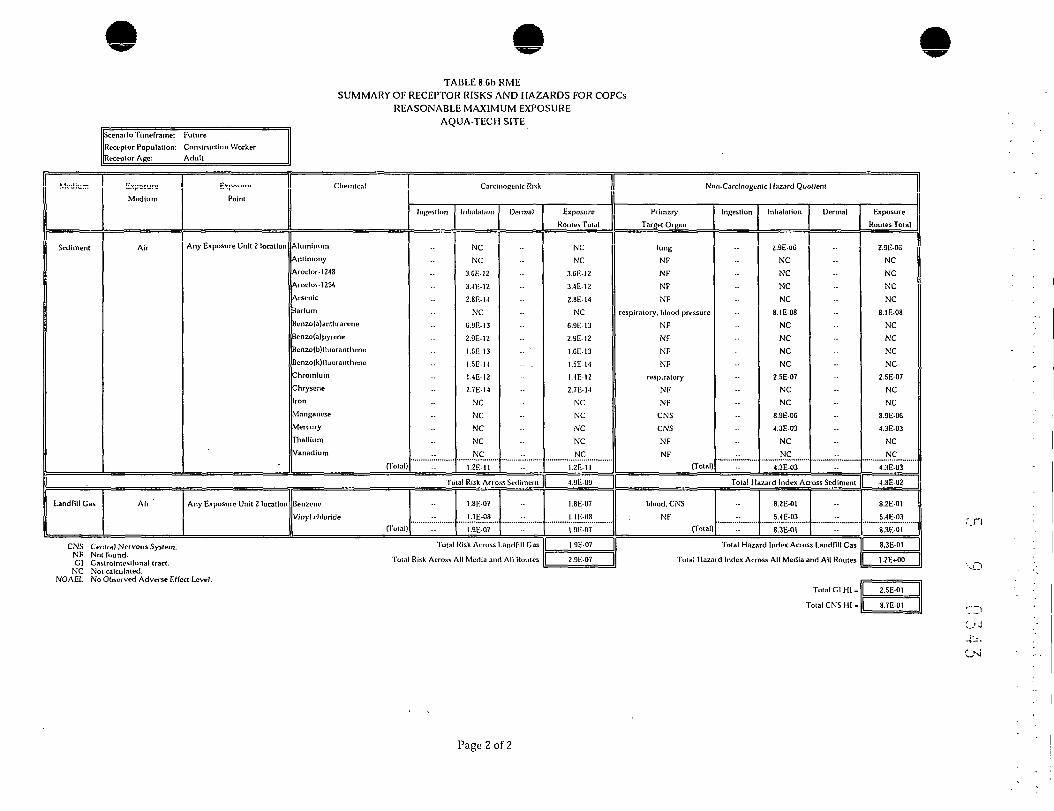
TABLE 8.6b RMESUMMARY OF RECEPTOR RISKS AND HAZARDS FOR COPCs
REASONABLE MAXIMUM EXPOSUREAQUA-TECH SITE
Medium
Sediment
Scenario Timeframe; FutureReceptor Population: Construction WorkerReceptor Age: Adult
E.,F,-,,v,Medium
Air
Fyjv«»«. I
Point
Any Exposure Unit 2 location
Chemical
Aluminum
Antimony
ArocJor- 12-18
Arocloi-1254
Arsenic
Jarium
ienzo(a)anlhracL'ne
lenzo(a)pyrene
)enzo(b)rtuorant1iene
:Jenzo(k)fluoranthene
Chromium
Chryscne
ron
vlanganese
Mercury
rhalllum
Vanadium
(Total)
Care iioacnic Risk
Ingestion Inhalation
NC
NC
3.0E-12
3.4E-12
2.8E-M
NC
G.9E-13
2.9E-I2
1.GE-13
1.5E-N
I.4E-I2
2.7E-14
NC
NC
NC
NC
NC
1.2E-II
Demia)
Tula! Risk Across Sudimcnt
Landfill Gas Air '
CNS CenlraJ Nervous System.NF Not found.CI Castrointt'stlonal tract.
Any Exposure Unit 2 location Benzene
Vinyl chlorideffotal)
1.8F.-07
l.JE-08
I.OE-07
Total Risk Across Landfill Cas
Total Risk Across All Media and All Routes
Exposure
Routes Total
NC
NC
3.GE-12
3.4EI2
2.8E-14
NC
6.9E-13
2.3E-12
l.GE-13
1.5E-14
1.4E-I2
2.7E-I4
NC
NC
NC
NC
NC
1.2E-I1
4.9E-09
1.8E-07
1. IE-08
I.9E-07
1 .9E-07
2.9E-07
Noft-Carcinugenic Hazard Quotient
Primary
Target Organ
lung
NF
NF
NF
NF
respiratory, blood pressure
NF
NF
NF
NF
respiratory
NF
NF
CNS
CNS
NF
NF(Total)
Ingestion Inhalation
2.9E-06
NC
NC
NC
NC8.IE08
NC
NCNCNC
2.5E-07NCNC
8.9E-OG
4.3E-03
NC
NC
4.3E-03
Dermal
Total Hazard index Across Sediment
blood. CNS
NF(Total)
8.2E-01
5.4E-03
8.3E-01
S Total Hazard Index Across Landfill Gas
Total Hazard Index Across All Media and All Routes
Exposure
Routes Total
2.SE-OG
NCNCNCNC
8.IE-08
NC
NC
NCNC
2.5E-07
NC
NC
8.9E-06
4.3E-03
NC
NC
4.3E-03
4.8E02
8.2E-01
5.4E-03
8.3E-01
8.3E-01
I.2E+00
•'J~l
NC Not calculated.NOAEL No Observed Adverse Effect Level.
Total Cl HI .
Total CNS HI -
Page 2 of 2

TABLE 8.7 RMESUMMARY OF RECEPTOR RISKS AND HAZARDS FOR COPCs
REASONABLE MAXIMUM EXPOSUREAQUA-TECH SITE
icenario Timeframe: FutureOther WorkerReceptor Population:
{[Receptor Age:____
(Irrigation M.iint)Adult
Medium
Groundwaler
Exposure
Medium
Groundwater
Exposure Chemical
Point
Any Exposure Unit J or 2 location AluminumAntimony
Arsenic
iarium
Benzene
Bis(2-elhylhexyl)phlhalale
Bromodichloromelhane
Carbon tetrachloride
Chlorobenzene
Chloroelhane
Chloroform
Chromium
Cobalt
Dichlorobenzene, 1,4-
Dichloroelhane, 1,1-
Dichloroethane, 1,2-
Dichloroethene, 1,1-
Dichforoelhene, 1,2- (cis)
Dichloroethene, l,2-(lrans)
Iron
Manganese
Methyl tert butyl ether
retrachloroethane, 1,1,2,2-
retrachlorocthene
rhallium
rrichloroelhane, 1,1,1-
rrichloroethene
Vanadium
Vinyl chloride
(Total)
iCarcinogenic Kisk
Ingestion
NC
NC
6.7E-08
NC
1.1E-08
5.0E-08
1.4E-10
2.3E-09
NC
4.0E-10
NC
NC
NC
1.8E-09
NC
1. IE-08
9.8E-08
NC
NC
NC
NC
NC
2.7E-08
5. IE-08
NC
NC
1.2E-06
NC
2. IE-07
1.7E-06
Inhalation
-.
Dermal
NC
NC3.5E-08
NC1.2E-07
5.4E-08
4. IE-10
3.0E-08
NC
2.0E-09
NC
NC
NC
5.5E-08
NC
2.9E-08
7.8E-07
NC
NC
NC
NC
NC1.5E-07
1.2E-06
NC
NC9.9E-06
NC
8.3E-07
1.3F.-05
Exposure
Routes Total
NC
NC
l.OE-07
NC
1.3E-07
l.OE-07
5.5 E- 10
3.2E-08
NC
2.4E-09
NC
NC
NC
5.7E-OS
NC
4.0E-08
8.8E-07
NC
NC
NC
NC
NC
1.8E-07
1.3E-06
NC
NC
1. IE-05
NC
1. IE-06
1.5E-05
- . - . . - . . . I IINOil-i-arcmogenK: nuiaru vuoueru
Primary
Target Organ
CNS
blood
skin
cardiovascular
CNS, blood
NF
kidney
liver
liver
NF
liver
NOAEL
NF
NF
NOAEL
CNS, liver
CNS, liver
blood
liver
Cl
CNS
NF
NF
CNS, liver
CNS
CNS
CNS, kidney
Cl, kidneyCNS
(Total)
Ingestion
4.8E-05
3.9E-04
4.2E-04
9.7E-05
1.8E-04
NC
3.1E-07
7.2E-05
9.5E-06
9.6E-07
3.1E-05
6.5E-05
4.0E-05
6.9E-06
I.3E-05
1. IE-05
5.1E-05
1. 0 E-03
4.9E-06
4.3E-04
3.6 E-03
1.3E-05
6.3E-06
2.7E-04
2.6E-03
6.4E-06
2.7E-02
1.4E-05
2.6E-04
3.7E-02
Inhalation
_
-
--_
„
_
-_
_
_
_
_
-_
_
_
_
-
-
-
-.
-
-
_
-
__
-
Dermal
6.0E-04
1.9E-02
2.2E-04
9.7E-04
2.1 E-03
NC
9.3E-07
9.3E-04
6.3E-04
4.8E-06
1.4E-04
2.5 E-03
8.0E-05
2. IE-04
7.4E-05
3.0E-05
4. IE-04
6.4 E-03
3.1E-05
2.5 E-03
4.5E-02
2.0E-05
3.5E-05
6.6E-03
6.5E-03
5.5E-05
2.3E-01
2.7E-04
1.1 E-03
3.3E-OI
Exposure
Routes Total |
6.4E-04
2.0E-02
6.4E-04
1.1 E-03
2.3E-03
NC
1.2E-06
l.OE-03
6.4E-04
5.7E-06
1.7E-04
2.6E-03
UE-04
2.2E-04
8.7E-05
4.1E-05
4.6E-04
7.4 E-03
3.5E-05
3.0E-03
4.9E-02
3.3E-05
4.2E-05
6.8E-03
9. IE-03
6.1E-05
2.6E-OI
2.9E-04
1.4 E-03
3.6E-01
Page 1 of 2
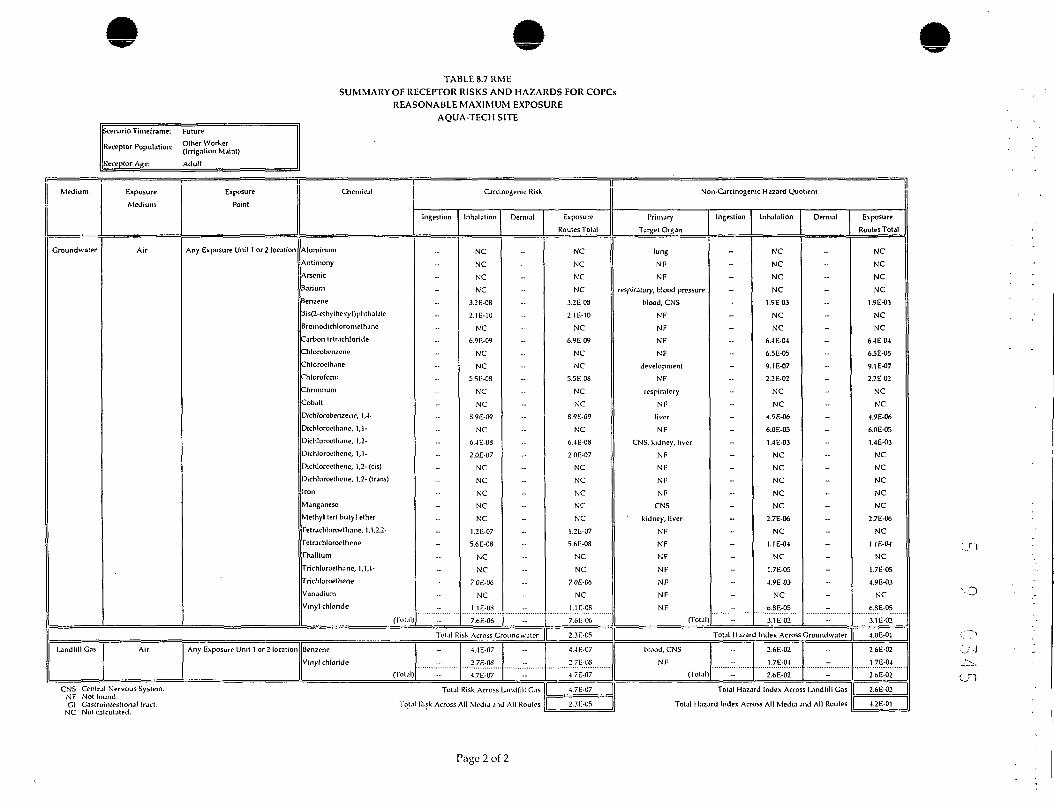
TABLE 8.7 RMESUMMARY OF RECEPTOR RISKS AND HAZARDS FOR COPCs
REASONABLE MAXIMUM EXPOSUREAQUA-TECH SITE
Scenario Timeframe: FutureOther WorkerReceptor Population:
Receptor Age:____(Irrigation Maint)Adult
Medium
Groundwater
Exposure
Medium
Air
Exposure
Point
Any Exposure Unit I or 2 location
Chemical
Aluminum
Antimony
Arsenic
tarium
Jenzene
Bis(2-ethylhexyl)phthalale
Bromodichloromethane
Carbon tetrachloride
Chlorobenzene
Chloroelhane
Chloroform
Chromium
Cobalt
~>ichlorotienzene, 1,4-
~>ichloroelhane, 1,1-
Dichloroethane, 1,2-
DjchlorOL'thene, 1,1-
Dichloroethene. 1,2- (cis)
Dichloroethene, 1,2- (trans)
Iron
Manganese
Methyl tert buty! ether
felrachloroethane, 1,1,2,2-
Tetrachloroethene
Thallium
Trichloroelhane, 1,1,1-
rricnloroethene
Vanadium
Vinyl chloride
n~ot.il)
1Carcinogenic Risk
Ingestion
-
-
-
-
_
-
-
-
_
-
-
-
-
-
-
Inhalation
NC
NC
NC
NC
3.2E-08
2.IE-1I)
NC6.9E-09
NC
NC
5.5E-OS
NC
NC
S.9E-09
NC
6.4E-08
2.0E-07
NC
NC
NC
NC
NC
1.2E-07
5.6E-08
NC
NC
7.0E-06
NC
1. IE-OS
7.6E-06
Dermal
_
Exposure
Routes Total
NC
NC
NC
NC
3.2E-08
2.IE-10
NC
6.9E-09
NC
NC
5.5E-OS
NC
NC
8.9E-09
NC
6.4E-08
2.0E-07
NC
NC
NC
NC
NC
1.2E-07
5.6E-08
NC
NC
7.0E-06
NC
1. IE-08
7.6E-06
Non-Carcinogenic Hazard Quotient
Primary
Target Organ
lung
NF
NF
respiratory, blood pressure
blood, CNS
NF
NF
NF
NF
development
NF
respiratory
NF
liver
NF
CNS, kidney, liver
NF
NF
NF
NF
CNS
kidney, liver
NF
NF
NF
NF
NF
NF
NF(Total)
Ingestion
-
-
-
-
-
--
_
-
-
-
-
-
-
--
-
-
-.-
-
-
-
-
_
-
Inhalation
NC
NC
NC
NC
1.9E-03
NC
NC
6.4E-04
6.5E-05
9. IE-07
2.2E-02
NC
NC
4.9E-06
6.0E-05
1.4E-03
NC
NC
NC
NC
NC
2.7E-06
NC
I. IE-04
NC
1.7E-05
4.9E-03
NC
6.8E-05
3. IE-02
Dermal
_
-
-
-
-
--
_
-
-
-
-
_
_
-
-_
-
_
-
--
-
-
-
-
-
Exposure
Routes Total
NC
NC
NC
NC
1.9E-03
NC
NC
6.4E-04
6.5E-05
9.1E-07
2.2E-02
NC
NC
4.9E-06
6.0E-05
1.4E-03NC
NC
NC
NC
NC
2.7E-06
NC
1. IE-04
NC
1.7E-05
4.9E-03
NC
6.8E-05
3.1E-02
Total Risk Across Croundw.iter |[ 2.311-05 || Total Hazard Index Across Groundwater || 4.0E-01
Landfill Gas Air Any Exposure Unit 1 or 2 location Benzene
Vinyl chloridecroi.ii)
- 4.4E-07
2.7E-03
4.7E-07
-
CNS Central Nervous System. Total Risk Across Landfill GasNF Not found.Cl Gaslroinlestional Irai-l. Total Risk Across All Media and All Routes
4.4B-07
2.7E-OS
4.7E-07
4.7E-07
2.3E-05
blood, CNS
NF
(Total)
-_
-
2.6E-02
1.7E-04
2.6E-02
_
-
Total Hazard Index Across Landfill Gas
Total Hazard Index Across All Media and All Routes
2.6E-02
1.7E-04
2.6E-02
2.6E-02
4.2E-01
Page 2 of 2

b '•) 0 5 4 6
Table 9 Series
Risk Assessment Summary

TABLE9.1aRMERISK ASSESSMENT SUMMARY
REASONABLE MAXIMUM EXPOSUREAQUA-TECH SITE
Scenario Ttmeframe: FutureReceptor Population: Commercial WorkerReceptor ARC:_____Adult_________
llMedium
Landfill Gas
Exposure
Medium
Air
1Exposure
Point
Any Exposure Unit 1 location
Chemical
Benzene
(Total)
- . 1carcinogenic KISK
Ingcstion Inhalation
2.2E-06
2.2E-06
Dermal
-
Exposure
Routes Total
2.2E-06
2.2E-OC
Primary
Target Organ
(folal)
Ingestion lilltalallon
<-""-"
Dermal Exposure
Routes Total
Total Risk Across Landfill Gas || 2.2E-OS || Total Hazard Index AcrosS Land/111 Gas || ____ -
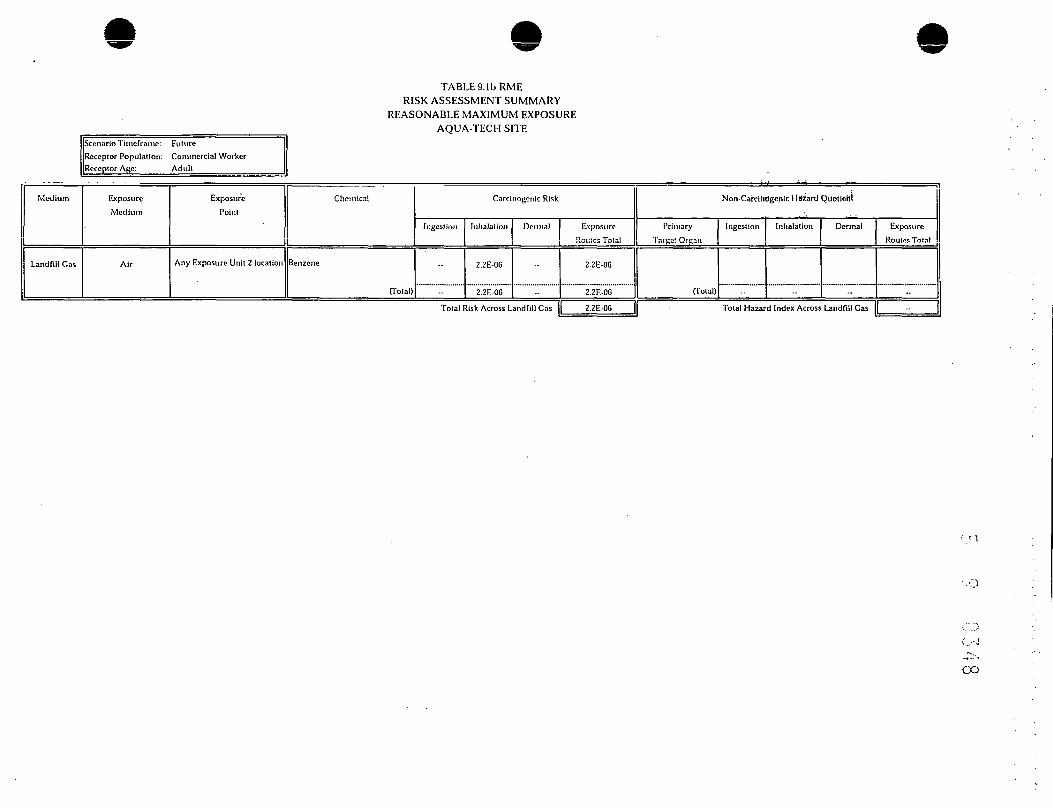
:enario Tiincfraine: FutureReceptor Population: Commercial WorkerReceptor Age:_____Adult_________
TABLE O. lbRMERISK ASSESSMENT SUMMARY
REASONABLE MAXIMUM EXPOSUREAQUA-TECH SITE
Medium
Landfill Gas
Exposure
Medium
Air
Exposure
Point
Chemical
(Total)
Carcinogenic Risk
Ingest ion Inhalation
2.2E-OG
2.2E-06
Dermal Exposure
RGUICS Tola!
2.2E-06
2.2E-06
Non-CarciMdgenic Ha/ard QUotieHl
Primary
Targe! Organ
(Total)
Ingest ion Inhalation Dermal
Tolal Risk Across Landfill Gas || 2.2E-OG || Total Hazard Index Across Landfill Gas
Exposure
Routes Total
n
CO

TABLE 9.2a RMERISK ASSESSMENT SUMMARY
REASONABLE MAXIMUM EXPOSUREAQUA-TECH SITE
llSccnarioTltncrramtt FutureIIRuccplor Population: RcsldcnCllRctcpiurARc-: Child
Medium
SurfacuSoIl
Surface Sol)
Exposure
Medium
Surface Soil
Air
Expmiiru
Point
Any Exposure Unit 1 location
Any Exposuii: Unit 1 location
Clu-mlri!
Aluminum
Aioelur-IZ«
Aiiiclm-lZSI
Aiscnk
Bailnm
Cadmium
Iron
Manganese.
Mercury
Thallium
Vanadium
front)
Merairy
(Total)
Can inoKi'iiic W^ Nini-CarclnngL.nlc Ha/Ard Quullonl 1
liili.sllnn
NC
NC
f-iC
NC
NC
NC
NC
NC
NC
NC
NC
NC
NC
lllialiiliun
NC
NC
Tn»al Risk Across
Crou.idwalL-r Cruumtwatur
Landfill Cas Air
Any Exposure Unit 1 local [t>n Aliinilnu.il
Allllinnny
Arsenic
Biiilnni
BttlAW
Cailxuilolraclilnil.k-
Clllnrnhn ill
Cliromlum
Colmll
Dklil.inH-l l»in-. I.I.
DidilniiK:llii-iH<. I.Z-(cis)
Iron
Man^Hin^u
riaiKlllluroollicnc
riialtjitill
TtlclilnnK-llicnc
Vinyl chloride
(Tnla)
NC
NC
NC
NC
NC
NC
NC
NC
NC
NC
NC
NC
NC
NC
NC
NC
NC
NC
Dermal
NC
NC
NC
NC
NC
NC
NC
NC
NC
NC
NC
NC
NC
Sin laic Snil
NC
NC
NC
NC
NC
NC
NC
NC
NC
NC
NC
NC
NC
NC
NC
NC
NC
NC
Traal Risk ArniVi Cioiindwalr-r
Any Exposure Unit 1 lucailon 11 Ik- n /.cm-
| rr.,,,,CNS Central NiTvmis System.
NF N..I found.C| CaMrnlntcstlnnal tract. TM
NC Not calculated.N/A Not applicable.
"Dermal" Ha/ard Quullcul-i for ground watt-rare ihccumblnrd dermal and liduilHllon .sumig lL' valuirstt*
NC
NC
Ttilat Risk Amiss Umlull C*s
1 KKk Annss All Mi lla and All Kmitrs
luted nn Tables 7 and a.s dlMt^scd In Six
buittinr || PliniaryRuling Tnliil jj Target Oruan
NC
NC
NC
NC
NC
NC
NC
NC
NC
NC
NC
NC
NC
NC
NC
NC
NC
NC
NC
NC
NC
NC
NC
NC
NC
NC
NC
NC
NC
NC
NC
NC
NC
NC
NC
NC
N/A
NC
NC
CNS
Ininiiinulniilc
miniumiloBIc
skin
kidney
NOAEL
Cl
CNS
development. CNS
CNS
Cl. kidneyfTilal)
CNS(Tolal)
CNS
blood
.skin
tardlovHMidar
CNS. blood
liver
liver
NOAEL
NF
CNS, liver
blond
Cl
CNS
CNS. liver
CNS
CNS. kidney
CNS(Total
blood, CNS
(Tmal)
Tntal Max
Him 3.4.1.4 urihelext.
digestion
C 1 E O I
I.SE-01
UE-OI
UE-OI
3.0E-OI
I.2F.-OI
4.7E.OI
2.0E.OO
3.7E-OI
3 It 01
I.7E-01
Z.7E-OI
S.IE.OO
........::........
lohalallon
2.0E*00
Z.OE.M
DLYrtial
1
Z.GE-02
3.9E-OJ
j.tiE-uj2.4E-04
l.OE-02
4.SE.03
6.2E-02
4.0E-02
I.CE-02
S.3E-03
I.4E-03
I.8E-02
I9E-01
Tnlal t la/dtd Index Across Stnfaee Soil
I.ZE-OI
9.0E01
LIE. 00
Z.5EOI
4.GE-01
1.8EOI
7.IE-02
1-7E 01
I.OE-OI
I.3E-UI
2.0E.OO
LIE. 00
9.3E*00
7.0E-OI
C.CE.OO
7.0E.OI
6.7E-OI
9.4E*OI
Tnlal Ha/aril Index Across
2.2E»00
2.2E«00
NC
NC
NC
NC
4.6E-01
I.8E-OI
7.8E-02
NC
NC
I.3E-OI
2.0E.OO
NC
NC
7.0E-OI
NC -
7.0E.01
0.7E-OI
7.4E.OI
Crnundwaler
Tutal Ha/ard Intk-x Acros.1 Landfill Cas
aid liukx AITOS.S Alt Media and All Routes
Tolal Cl HI .
Total kidney HI -
Total CNS Hl-
Tulat liver III.
Exposure [j
Routes Tolal
6 IE-01
2.0E-01
1BE-01
I.3E-OI
3.2E-OI
1.2E-OI
5.3E-OI
2.0E.OO
3.9E.OI3 IE 01
1.7E-01
2.9E-OI
5.3E.OO
2.0E*00
Z.0£*00
7.3E.OO
I.2E-OI
9.9E-OI
1 1E.OO
2.SE-OI
9.IE-OI
3.7E.OI
I.CE-OI
1.7E-OI
I.OE-OI
2.CE-01
5.2E.OO
1 1F..OO
9.3E*00
I.4E.OO
0.6E.OO
KE.02
1.3E.OO
I.7E.02
I.7E.02
2.2E.OO
2.2E+00
2.2E.OO
l.BE*02
3.4E*00
I.4E*02
LGE»02
2.2E.OO

TABLE 9.2b RMERISK ASSESSMENT SUMMARY
REASONABLE MAXIMUM EXPOSUREAQUA-TECH SITE
Medium
Surface Sol]
Scenario Tlineframe: Future
Receptor Population: Resident
Receptor ARC: Child
Exposure
Surface So)]
Air
.Croundwater Croundwater
Exposure ID..,.,. I
Any Exposure Unit 2 location
Any Exposure Unit 2 location
Any Exposure Unit 2 location
Landfill Gas Air
Chemical
Iron
Manganese
Thallium
Vanadium
(Total)
(Total)
Carcinogenic Risk
Ingfsllon
NC
NC
NC
NC
NC
Inhalation Dermal
NC
NC
NC
NC
NC
Total Risk Across Surface Sail
Aluminum
Antimony
Arsenic
iariuin
Jenzene
Bls(2-ethylhcxyl)phthalate
Carbon letrachlurlde
^hlorufonn
Chromium
Cobalt
Dlchloroelhcne. 1.1-
Dlchloroelhene. 1,2- (els)
ron
tfangaiicse
retrachloroethene
Thallium
Tlichloioelliene
Vinyl chlurlde
(Total)
NC
NC
NC
NC
NC
NCNC
NCNC
NC
NCNC
NCNC
NCNC
NCNC
NC
NCNCNC
NCNC
NC
NCNC
NCNC
NC
NCNC
NCNC
NCNC
NC
NC
Tolal Risk ACIOM Croiimlwalei
Any Exposure Unit 2 location (Benzene
|| (Total)
NC
NC
Total Risk Across Landfill Gas
CNS General Nervous System. Total Risk Across All Media a id All Routes
Exposure
Routes Total
NC
NC
NCNC
NC
NC
NC
NCNCNC
NCNC
NC
NC
NCNCNC
NC
NCNC
NC
NCNCNC
NC
NC
NC
NC
N/A
Non-Carcinogenic Hazard Quotient
Primary
Target Organ
CI
CNS
CNS
Cf. kidney
(Total)
(Total)
CNSblood
skin
cardiovascular
CNS. blood
NF
liver
liver
NOAEL
NFCNS. liver
blood
Cl
CNSCNS. liver
CNS
CNS. kidney
CNS(Tola )
blood. CNS
(Total)
Ingestlon
1.2E.OO
l.GF-01
1.4E-OI
I.4E.OI
l.GE»00
Inhalation Dermal
2.4E-02
7.0E03
1.2E-03
3.2E-03
4. IE-02
Total Hazard Index Across Surface Soil
I.2E-01
9.9E-01
!.IE»00
2.5E-01
4.GE-01
NC
1.8E-01
7.8E.02
1.7E-OI
' l.OE-01
1.3E-012.6E.OO
UEtOO
9.3E.OO
7.0E-0!
G.GE»00
7.0E»01
C.7E-01
9.4E*01
-.
NC
NC
NCNC
4.GE-01
NCI.SE-01
7.8E-02
NC
NC1.3E-OI
2.GE»00NC
NC7.0E-01
NC7.0E»01
6.7E017.1E.01
Total Hazard Index Across Croundwaler
2.2E*00
2-2E»00
NC Total Hazard Index Across Landfill Gas
NC Total Hazard IndM Across All Media and AM Routes
Exposure
Routes Total
1.2E.OO
1.7E-01
1.4E-01
1.5E-01
1.7E-.00
NC
1.7E»00
1.2E-OI
9.9E-01I.IE»00
2.5E-01
9.IE-01
NC3.7E-01
1.6E-01
I.7E-OI
l.OE-012.6E-01
5.2E*00
l.lEtOO
9JE»00
1.4E»00
G.CE.OO
I.4E»02
1.3E»00
I.7E»02
1.7E«02
2.2E+00
2.2f.tWl
2.2E»00
].7E»02NC Not calculated.
N/A Not applicable.NF Noi found.
"Dermal" Hazard Quotients for groundwatcr are the combined dermal and Inhalation suirogate valu s noted on Tables 7 a : discussed in Sect Ion 3.4.1.4 of the text.
Total CI 1II -Total kidney HI =
Tolal CNS HI =Total liver HI «

TABLE 9.3a RMERISK ASSESSMENT SUMMARY
REASONABLE MAXIMUM EXPOSUREAQUA-TECH SITE
Scenario Timeframe: FutureReceptor Population: ResidentReceptor Age:_____Adult
| Medium
Surface Soil
Exposure
Medium
Surface Sol!
Air
Exposure |[ Chemical
Point
Any Exposure Unit 1 location
Any Exposure Unit I location
Iron
(Total)
Mercury
(TuialJ
Carcinogenic Risk
Ingeslion
NC
NC
Inhalation
NC
NC
Dermal
NC
NC
Total Risk Across Surface Soil
Ground water
Landfill Gas
Croundwater Any Exposure Unit 1 location
Antimony
Arsenic
Jarlum
ienzene
Carbon totrachloride
Dichloroethene. 1,1-
Dichloroethene. 1,2- (cis)
ron
Manganese
retrachloroethenc
Thallium
Trlchloroethene
Vinyl chloride
(Total)
NC
NC
NC
NC
NC
NC
NC
NC
NC
NC
NC
NC
NC
NC
NC
NC
NC
NC
NC
NC
NC
NC
NC
NC
NC
NC
NC
NC
Exposure
Routes Total
NC
NC
NC
NC
NC
NC
NC
NC
NC
NC
NC
NC
NC
NC
NC
NC
NC
NC
NC
Total Risk Across Groundwaier|| NC
Air Any Exposure Unit 1 location IjBenzene
|] (Total)
NC
NC
CNS Central Nervous System. Total Risk Across Landfill GasNOAEL No Observed Adverse Effect Level. .....
NF Not found Total Risk Across All Media and All Routes
NC
N/A
NC
NC
Nun-Carcinogen c Hazard Quol ent [I
Primary
Target Organ
Gl
(Total)
CNS
fTotal)
Ingestlon
Z.IE-01
2.IE.OI
Inhalation
7.0E-OI
7.0E-OI
Dermal
2.2E-02
2.2E-02
Total Hazard Index Across Surface Soil
blood
skin
cardiovascular
CNS. blood
liver
CNS. liver
CNS, liver
liver
CI
NF
CNS. liver
CNS
CI. kidney(Total)
4.2E-01
4.6E-OI
1. IE-01
2.0E-01
7.8E-02
5.6E-02
l.lEtOO
4.7E-01
4.0E+00
3.0E-01
2.8E+00
S.OEtOl
2.9E-01
4.0E+01
.-
NC
NCNC
2.0E-01
7.8E-02
5.GE-02
1.1E+00
NC
NC
3.0E-01
NC
3.0E+OI
2.9E-01
3.2E+01
Total Hazard Index Across Croundwater
blood. CNS
(Total)
7.6E-OI
7.CE-01
Total Hazard Index Across Landfill Gas
Total Hazard Index Across All Media and All Routes
Exposure
Routes Total
2.3E-01
2.3E-OI
7.0E-01
7.0E-01
9.3E-01
4.2E-01
4.0E-01
1. IE-01
3.9E01
l.OE-OI
1. IE-01
2.2E»00
4.7E-01
4.0EtOO
G.OE-01
2.8E*00
G.OE+Ol
5.7E-OI
7.2E+01
7.2E+01
7.0E-01
7.GE-OI
7.6E-01
7.4E+01
r_,n
Gl Gastrointestional tract.NC Not calculated.
N/A Not applicable.
"Dermal" Hazard Quotients for groundwater are the combined dermal and inhalation surrogate values as noted on Tables 7 and as discussed in Section 3.4.1.1 of the text.
Total CI HI -Total kidney HI -
Total CNS HI -
Total liver HI =
4.2E+00
5.7E-01
C.TEtOl
5.8E»00
"
CD

TABLE 9.3b RMERISK ASSESSMENT SUMMARY
REASONABLE MAXIMUM EXPOSUREAQUA-TECH SITE
Medium
Surface Soil
Scenario Timeframe: FutureReceptor Population: ResidentReceptor Age: Adult
Exposure
Medium
Surface Soil
Air
Exposure
Point
Any Exposure Unit 2 location
Any Exposure Unit 2 location
- ' :Chemical
Iron
(Total)
(Total)
Care nogenic Risk
Ingestion
NC
NC
Inhalation
NC
Dermal
NC
NC
Exposure
Routes Total
NC
NC
NC
Total Risk Across Surface Soil )| NC
Ground water Croundwater Any Exposure Unit 2 location
Antimony
Arsenic
barium
3enzene
Carbon Ictrachloride
Dichloroethene. 1.1-
Dicliloroethene, 1.2- (cis)
iron
Manganese
Tetrachloroethenc
Thallium
rrichlorocthcne
Vinyl chloride
fTotal)
NCNCNC
NC
NC
NC
NCNCNCNCNCNCNCNC
NC
NC
NCNCNCNCNCNCNCNCNCNCNCNC
Total Risk Across Groundwater
Landfill Gas Air Any Exposure Unit 2 location Benzene
fTolal)
NC
NC
-
„ Total Risk Across Landfill GasCNS Central Nervous System.
NF Not found. Total Risk Across All Media and AM Routes
NC
NCNCNCNCNCNCNCNCNCNCNCNCNC
Non-Carc'innyenlc Hdiaid Quotient
Primary
Target Organ
CI
(Total)
(Total)
Ingcslion
1.3E-01
1.3E-01
Inhalation DerrrMl
1.3E-02
1.3E-02
--
Total Hazard Index Across Surface Soil
blood
skin
cardiovascular
CNS. blood
liver
CNS. liver
blood
CI
CNS
CNS. liver
CNS
CNS. kidney
CNS(Total)
4.2E-01
4.GE-01
1. IE-01
2.0E-01
7.8E-02
5.6E-02
1.1E+00
4.7E-01
4.0E+00
3.0E-01
2.8E+00
3.0E+01
2.9E-014.0E+01
-
NCNCNC
2.0E-01
7.8E-02
5.6E-02
1.1E+00
NCNC
3.0E-01
NC3.0E+012.9E-01
3.2E+01
NC (I Total Hazard Index Across Croundwater
NC
N/A
blood. CNS
(Total)
7.6E-01
7.6E-01
_____ NC _____ 1 Total Hazard Index Across Landfill Gas
_____ NC ____ | Total Hazard Index Across All Media and All Routes
Exposure
Routes Total
1.4E-01
1.4E-01
NC
1.4E-01
4.2E-01
4.6E-OI1. IE-013.9E-01
1.6E-01
1. IE-01
2.2E+00
4.7E-01
4.0E+00
6.0E-01
2.8E-t-00
6.0E+01
5.7E-017.2E+01
7.2E+01
7.6E-01
7.6E-01
7.6E-01
7.3E+01
NC Not calculated.N/A Not applicable.
"Dermal" I lazard Quotients for groundwaler are the combined dermal and inhalation surrogate values as noted on Tables 7 and as discussed in Section 3.4.1.4 of the text.
Total CNS HI =
Total kidney HI =Total liver HI =

TABLE 9.4a RMERISK ASSESSMENT SUMMARY
REASONABLE MAXIMUM EXPOSUREAQUA-TECH SITE
IScenario Timeframe: FutureReceptor Population: ResidentReceptor Age:_____Aggregate
1 Medium
Surface Soil
Rxnosurp
Medium
Surface Soil
Air
Exnosure
Point
Any Exposure Unit 1 location
Any Exposure Unit 1 location
Chemical
Arsenic
3enzo(a)pyrene
(Total)
Trichloroethene
(Total)
r.-in-innsfnii- Risk 1
Ingestion
3.9E-06
3.5E-06
7.4E-06
Inhalation
_
1.9E-06
1.9E-06
Dermal
2.7E-08
4.6E-07
4.9E-07
Exposure
Routes Total
3.9E-06
4.0F--06
7.9E-06
1.9E-06
1.9E-06
Nnn-Carrinnopnir Hn7nrd Ountipnt it
Primary
Target Organ
skin
lung
(Total)
NF
(Total)
Ingestion
NC
NC
NC
-
Inhalation
--
-
-
NC
NC
Dermal
NC
NC
NC
-
-
Exposure
Routes Total
NC
NC
NC
NC
NC
Total Risk Across Surface Soil || 9.SE-06 || Total Hazard Index Across Surface Soil || NC
Croundwater Croundwater Any Exposure Unit 1 location
Arsenic
Jenzene
Bis(2-ethylhe\yl)phlhalate
Carbon tetrachloride
Chloroethane
Dichlorobenzene, 1,4-
3ichloroethane, 1,2-
Dichloroelhene, 1,1-
retrachloroelhane, 1,1,2,2-
retrachloroethene
rrichloroelhene
Vinyl chloride
(Total)
9.4E-05
1.5E-05
7. IE-05
3.3E-06
5.6E-07
2.5E-06
1.5E-05
1.4E-04
3.8E-OS
7. IE-05
1.6E-03
3.0E-04
2.4E-03
-
- .
-
-
NC
I.5E-05
7. IE -05
3.3E-06
5.6E-07
Z5E-06
1.5E-05
1.4E-04
3.SE-05
7. IE-05
1.6E-03
3.0E-04
2.3E-03
9.4E-05
2.9E-05
1.4E-04
6.5E-06
1. IE-06
5.0E-06
3. IE-05
2.7E-04
7.5E-05
1.4E-04
3.3E-03
5.9E-04
4.7E-03
skin
CNS, blood
NF
liver
NF
NF
CNS, liver
CNS, liver
NF
CNS, liver
CNS, kidney
CNS
(Total)
NC
NC
NC
NC
NC
NC
NC
NC
NC
NC
NC
NC
NC
-
-
-
~
-
-
_
-
-
-
-
NC
NC
NC
NC
NC
NC
NC
NC
NC
NC
NC
NC
NC
NC
NC
NC
NC
NC
NC
NC
NC
NC
NC
NC
NC
NC
Total Risk Across Groundwaler || NC || Total Hazard Index Across Croundwater || NC
Land fill Gas Air Any Exposure Unit 1 location Benzene
Vinyl chloride(Total)
-
-
1.7E-05
l.OE-06
l.SE-05
-
CMS Central Nervous System. Total Risk Across Landfill GasNOAEL No Observed Adverse Effect Level.
NF Not found. To al Risk Across All Media and All RoutesCl CastroinlestionaJ tract
NC Not calculated.N/A Not applicable.
1.7E-05
l.OE-06
l.SE-05
l.SE-05
4.7E-03
blood, CNS
NF
(Total)
-
-
NC
NC
NC
-
-
Total Hazard Index Across Landfill Gas
Total Hazard Index Across Alt Media and All Routes
NC
NC
N/A
NC
NC.
"Dt'rmar risks for groundwater are the combined derma! and inhalation surrogate values as noted on Tables 7 and as discussed in Section 3.4.1.4 of the text. enQ-J

TABLE 9.4bRMERISK ASSESSMENT SUMMARY
REASONABLE MAXIMUM EXPOSUREAQUA-TECH SITE
'iiarioTimeframe: FutureReceptor Population: ResidentReceptor Age:_____Aggregate
Medium
Surface Soil
Exposure
Medium
Surface Soil
Air
Exposure j
Point
Any Exposure Unit 2 location
Any Exposure Unit 2 location
Chemical Carcinogenic Risk j
Ingestion
I
(Total)
(Total)
NC
Inhalation
-
NC
Dermal
NC
Exposure
Routes Total
NC
NC
||Non-Carcinogenic Hazard Quotient [j
PrimaryTarget Organ
(Total)
(Total)
Ingestion
NC
Inhalation
NC
Dermal
NC
-
ExposureRoutes Total
NC
NC
Total Risk Across Surface Soil || NC || Total Hazard Index Across Surface Soil || NC
Groundwater Croundwater Any Exposure Unit 2 location
Arsenic
3enzeneBis(2-ethylhexyl)phthalale
Carbon tetrachloride
Chloroethane
Dichlorobenzcne, 1,4-
Dichloroethane, 1,2-
Dichloroethene, 1,1-
relracriloroethane, 1.1,2,2-
rctrachloroethenc
rrichloroethene
Vinyl chloride
(Total)
9.4E-05
1.5E-05
7. IE-05
3.3E-06
5.6E-07
2.5E-06
1.5E-05
1.4E-04
3.SE-05
7. IE-05
1.6E-03
3.0E-04
2.4E-03
-
-
-
NC
1.5E-05
7. IE-05
3.3E-06
5.6E-07
2.5E-06
1.5E-05
1.4E-04
3.SE-05
7. IE-05
l.GE-03
3.0E-04
2.3E-03
9.4E-05
2.9E-05
1.4E-04
6.5E-06
1. IE-06
5.0E-06
3. IE-05
2.7E-04
7.5E-05
I.4E-04
3.3E-03
5.9E-04
4.7E-03
skin
CNS, blood
NF
liver
NF
NF
CNS, liver
CNS, liver
NF
CNS, liver
CNS, kidney
CNS(Total)
NC
NC
NC
NC
NC
NC
NC
NC
NC
NC
NC
NC
NC
-
-
-
_
-
-
NC
NC
NC
NC
NC
. NC
NC
NC
NC
NC
NCNC
NC
NCNCNC
NC
NC
NC
NC
NC
NC
NCNCNC
NC
Total Risk Across Groundwater || 4.7E-03 || Total Hazard Index Across Croundwater || NC
Landfill Gas Air Any Exposure Unit 2 location Benzene
Vinyl chloride
(Total)
-
-
1.7E-05
l.OE-06 -
CNS Central Nervous System. Total Risk Across Landfill Gas
Gl Castrointestional tract. Total Risk Across All Media and All Routes
1.7E-05
l.OE-06
l.SE-05
l.SE-05
4.7E-03
blood, CNS
NF(Total)
-
-
NC
NC
NC
-
-
Total Hazard Index Across Landfill Gas
Total Hazard Index Across All Media and All Routes
NCNC
N/A
(_ NC
L NC
N/A Not applicable.
"Dermal" risks for groundwaler are the combined dermal and inhalat ion surrogate values as noted on Tables 7 and as discussed in Section 3.4.1.4 of the text.

TABLE 9.5a RMERISK ASSESSMENT SUMMARY
REASONABLE MAXIMUM EXPOSUREAQUA-TECH SITE
II «-,=
Surface Soil
Scenario Timeframe: FutureReceptor Population: Construction WorkerReceptor Age: Adult
Medium
Surface Soil
Air
Point
Any Exposure Unit 1 location
Any Exposure Unit 1 location
*-'""•"*•«'
Aluminum
Iron
(Total)
Mercury
(Total)
Ingcstion
NC
NC
NC
--
t,«i.-,..u|s..,,u.,u:>iv
Inhalation
NC
NC
Dermal
NC
NC
NC
-
Total Risk Across Surface Soil
Subsurface Soi
Subsurface Soil
Subsurface Soil
Air
Any Exposure Unit 1 location
Any Exposure Unit 1 location
Aroclor 1242
Iron
Thallium
Trichloroolhenc
(Total)
(Total)
7.3E-08
NC
NC1.8E-07
2.5E-07
--
NC
1. IE-08
NCNC
2.4E-08
3.5E-08
Exposure
Routes Total
NC
NC
NC
NC
NC
NC
8.4E-08NCNC
E.1E-07
2.SE-07
N'uii-CaiKiiiup.eiiic Hazard Quotiem
PrimaryTarget Orgflrl
CNSCl
(Total)
CNS
(Total)
Ingestion
9. IE-02
2.9E-01
3.8E-OI
Inhalation
•-
7.6E-01
7.CE-01
Dermal
2.9E-b24.4E-02
7.3E-02
Total Hazard Index Across Surface Soil
imnuinologic
CI
CNS
CNS, kidney(Total)
(Total)
1.5E-012.8E-01
3.2E-01
3.2E-01
1.1E+00
-
2.3E-024.2E-022.0E-024.3E-02
1.3E-01
Total Risk Across Subsurface Soi! || 2.9E-07 || Total Hazard Index Across Subsurface Soil
Landfill Gas Air Any Exposure Unit 1 location Benzene
(Total)
1.8E-07
1.8E-07
CNS Central Nervous System. Total Risk Across Landfill GasNF Not found.Gl Gastrointestiona! tract. Total Risk Across All Media and All Routes
NC Not calculated.NOAEL No Observed Adverse Effect Level
1.8E-07
1.8E-07
I.8E-07
4.7E-07
blood, CNS
(Total) -
8.2E-01
8.2E-01
Total Hazard Index Across Landfill Gas
Total Hazard Index Across All Media and All Routes
T«tai rt wt
Exposure
Routes Total
I.2E-OI
3.4E-01
4.6E-01
7.6E-01
7.6E-01
1.2E+00
1.8E-01
3.2E-01
3.4E-01
3.6E-01
1.2E+00
———•••••• ———
1.2E+00
8.2E-01
8.2E-01
8.2E-01
| 3.2E+00
1 r, fip.ni I

Scenario Timeframe: FutureReceptor Population: Construction WorkerReceptor Age:_____Adult__________
TABLE 9.5b RMERISK ASSESSMENT SUMMARY
REASONABLE MAXIMUM EXPOSUREAQUA-TECH SITE
Mcd:-j:r.
Surface Soil
Medium
Surface Soil
Air
Subsurface Soil Subsurface Soil
Air
Sediment
Sediment
Sediment
Air
Point
Any Exposure Unit 2 location
Any Exposure Unit 2 location
Iron
(Total)
(Total)
rarrlnnnonlr Ri<l I
fngestion
NC
NC
Inhalation
NC
Dermal
NC
NC
Total Risk Across Surface Soil
Any Exposure Unit 2 location
Any Exposure Unit 2 location
Any Exposure Unit 2 location
Any Exposure Unit 2 location
(Total)
(Total)
NC
.... ———— ......NC
NC
Total Risk Across Subsurface Soil
(Total)
(Total)
NC
NC
NC
Total Risk Across Sediment
Landfill Gas Air
CNS Central Nervous System.NF Not found.Cl Gastrointestional tract.
Any Exposure Unit 2 location Benzene
fTotal)
I.8E-07
1.8E-07
Total Risk Across Landfill Gas
Total Risk Across All Media and All Routes
Exposure
Routes Total
NC
NC
NC
NC
NC
NC
NC
NC
NC
NC
I.8E-07
1.8E-07
I.81--07
1.8E-U7
Non-Carcinoocn c Hazard Quotient
Primary
Target Organ
Cl
(Total)
(Total)
Ingestion
1.8E-01
I.8E-01
Inhalation
NC
Dermal
2.7E-02
2.7E-02
... ————— .....
Total Hazard Index Across Surface Soil
(Total)
(Total)
NC
NC
NC
Total Hazard Index Across Subsurface Soil
(Total)
(Total)
NC
NC
NC
Total Hazard Index Across Sediment
blood. CNS
(Total)
8.2E.01
8.2E-01
Total Hazard Index Across Landfill Gas
Total Hazard Index Across All Media and All Routes
Exposure
Routes Total
2.0E-01
2.0E-01
NC
2.0E-01
NC
NC
NC
NC
NC
NC
8.2E-01
8.2E-OI
8.2E-01
l.OE+00NC Not calculated.
NOAEL No Observed Adverse Effect Level.
Total CNS HI- 8.2E-01

Scenario Tirneframc: Future
Receptor Population:v °"er W°r , .(Irrigation Malnt)Receptor Ape: ______ Adult
TABLE 9.G RMERISK ASSESSMENT SUMMARY
REASONABLE MAXIMUM EXPOSUREAQUA-TECH SITE
1 ..,_
Croundwater
Groundwater
Eipuauie
Medium
Groundwater
Air
1exposure
Point
Any Exposure Unit 1 or 2 location
Any Exposure Unit 1 or 2 location
.Clii'inical
fetracliloroclhene
rrichlorocthene
Vinyl chloride
(Total)
rrichloroelhene
(Total)
1Care nogcnic Risk
Ingestion
5. IE-08
I.2E-OG
2. IE-07
I.4E-OG
Total R
Landfill Gas
CNS CentraNF NotfoCl Castro
NC Notca
Air Any Exposure Unit 1 or 2 location
CTotal)
Inhalation
7.0E-00
7.0E-OG
Dermal
1.2E-06
9.9E-OG
8.8E-07
1.2E05
sk Across Croundwatcr
NC
1 Nervous System. Total Risk Across Landfill Casund.intestional tract. Total Risk Across All Media and All Routesculated.
Exposure
Routes Total
1.3E.OG
1. IE-05
I.IE-OG
1.3E-05
7.0E-OG
7.0E-OG
2.0E-05
NC
NC
2.0E-05
Non-Carcinogenic Hazard Quotient
Primary
Target Organ
CNS. liver
CNS, kidney
CNS(Total)
NF
(Total)
Ingestion
2.7E-04
2.7E-02
2.GE-04
2.8E-02
Inhalation
4.9E.03
4.9E-03
Dermal
C.GE-03
2.3E.01
1. IE-03
2.4E-01
Total Hazard Index Across Groundwater
CTotal)
Total llaz
Total Haza
rd Index Acr
NC
rd Index Across Landfill Gas
oss All Media and All Routes
ExposureRoutes Total
G.8E-03
2.6E-OI
HE-03
2.7E-01
4.9E-03
4.9E-03
2.7E-01
NC
NC
2.7E-01

5 9 0 3 5 8
APPENDIX D
RECORD OF PUBLIC MEETING - 8/5/03

Ur oo y
AQUA-TECH ENVIRONMENTAL SUPERFUND SITEGREEK, SOUTH CAROLINA
7:14 P.M.AUGUST 5, 2002
MIDDLE TYGER COMMUNITY CENTER24 GROCE ROAD
LYMAN, SOUTH CAROLINA
PUBLIC HEARING

THIS IS THE TRANSCRIPT OF THE PROPOSED PLAN
PUBLIC MEETING CONDUCTED BY THE UNITED STATES
ENVIRONMENTAL PROTECTION AGENCY, BEING TAKEN BY SUSAN
M. WILSON, NOTARY PUBLIC, AT MIDDLE TYGER COMMUNITY
CENTER, 84 GROCE ROAD, LYMAN, SOUTH CAROLINA, ON THE
5TH DAY OF AUGUST, 2003, BEGINNING AT 7:14 P.M.
****************
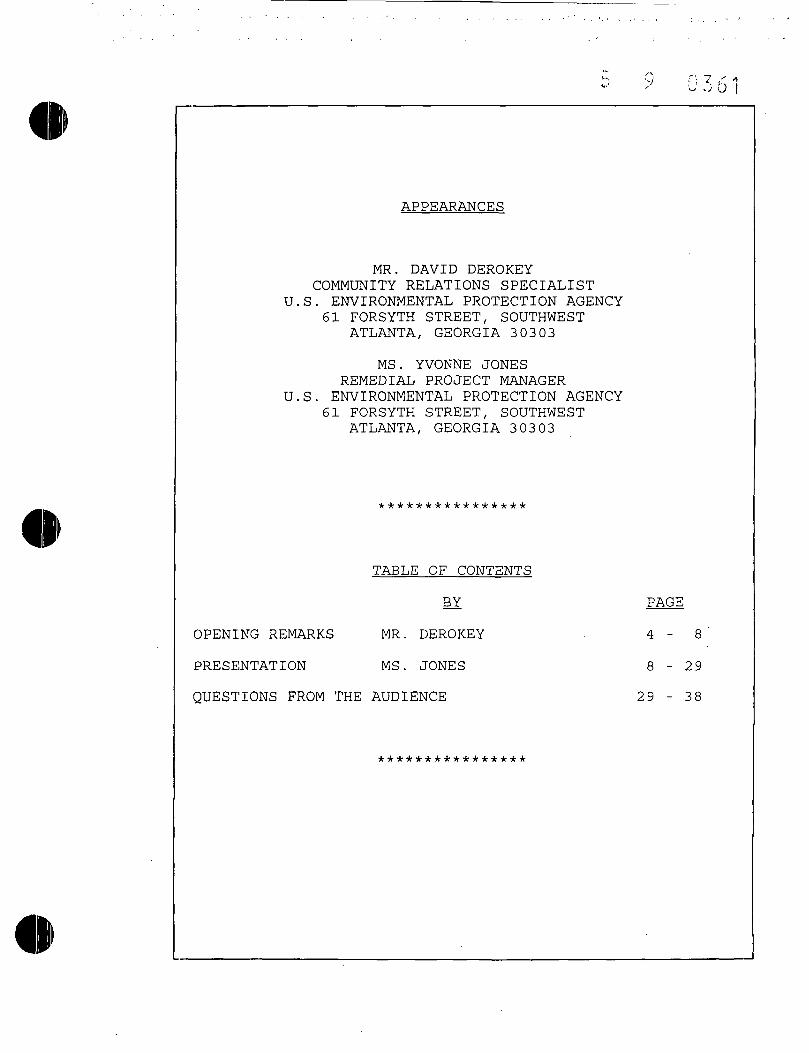
APPEARANCES
MR. DAVID DEROKEYCOMMUNITY RELATIONS SPECIALIST
U.S. ENVIRONMENTAL PROTECTION AGENCY61 FORSYTH STREET, SOUTHWEST
ATLANTA, GEORGIA 30303
MS. YVONNE JONESREMEDIAL PROJECT MANAGER
U.S. ENVIRONMENTAL PROTECTION AGENCY61 FORSYTH STREET, SOUTHWEST
ATLANTA, GEORGIA 30303
****************
TABLE OF CONTENTS
BY PAGE
OPENING REMARKS MR. DEROKEY - 4-8
PRESENTATION MS. JONES 8 - 2 9
QUESTIONS FROM THE AUDIENCE 2 9 - 3 8
****************

2
3
4
5
6
7
8
9
10
11
12
13
14
15
16
17
18
19
20
21
22
23
24
25
MR . DEROKEY ;
GOOD EVENING AND WELCOME. WE ARE INDEED HAPPY
YOU DECIDED TO COME HERE TONIGHT AND TO BRAVE THE
POSSIBILITY OF A STORM AND THIS HEAT. PERHAPS YOU
' CAN BE WITH US TONIGHT AND ENJOY THE COOL OF THE AIR
CONDITIONING.
ON BEHALF OF THE ENVIRONMENTAL PROTECTION
AGENCY REGION FOUR, WHICH COMPRISES AN EIGHT STATE
SOUTHEASTERN AREA -- THIS INCLUDES SOUTH CAROLINA.
AND ON BEHALF OF THE SOUTH CAROLINA DEPARTMENT OF
HEALTH AND ENVIRONMENTAL CONTROL, WE SAY THANKS TO
EACH ONE OF YOU. OUR PURPOSE AND FORMAT THIS
EVENING IS SIMPLE. WE INTEND TO COVER AND EXPLAIN
THE RECOMMENDED ALTERNATIVES FOR CLEANING UP THE
CONTAMINATED SOIL AND GROUNDWATER AT THE AQUA-TECH
ENVIRONMENTAL SITE. IF YOU DO NOT UNDERSTAND WHAT
IS PRESENTED OR IF YOU HAVE DOUBTS ABOUT ANYTHING,
WE WILL ADDRESS ANY QUESTIONS, CONCERNS OR COMMENTS
FOR YOU, THE CONCERNED CITIZENS OF THIS COMMUNITY,
AFTER WE HAVE PRESENTED THE MATERIAL TO YOU. THERE
ARE SEVERAL THINGS THAT I WOULD LIKE TO TELL YOU
BEFORE WE GET INTO THE FACTS OF THIS PROPOSED PLAN
MEETING. FIRST, FOR CREATURE COMFORTS, THE
RESTROOMS ARE LOCATED DOWN THE HALL. FOR THE LADIES
THE RESTROOM IS ON THE RIGHT. FOR THE GENTLEMEN, ON

1
2
3
4
5
6
7
8
9
10
11
12
13
14
15
16
17
18
19
20
21
22
23
24
25
THE LEFT. AND THE SOFA DOWN AT THE END OF THE HALL
IS YOUR MARKER TO GO RIGHT OR LEFT.
SECOND, TO MY RIGHT AT THE TABLE OVER HERE,
THERE IS SOME MATERIAL THAT YOU MAY WISH TO REFER
TO. THERE'S A FACT SHEET SUMMARY OF THE VERY TOPIC
WE ARE TALKING ABOUT THIS EVENING. YOU SHOULD FIND
IT AS A GUIDE AND A HELP THROUGH THE FACTS AND THE
FIGURES WE ARE PRESENTING TO YOU. THE FACT SHEET
WILL REFRESH YOUR MEMORY ONCE YOU LEAVE HERE AND
RETURN HOME. SO, TAKE ONE.
INCLUDED IN THIS FACT SHEET, YOU WILL FIND A
GLOSSARY OF TERMS. THE GLOSSARY OF TERMS WILL
DEFINE CERTAIN TERMS AND AID YOU IN UNDERSTANDING
THE MATERIAL PRESENTED TO YOU. THERE ARE TERMS THAT
ARE REPEATED SUCH AS "REMEDIAL INVESTIGATION," WHICH
IS AN EXTENSIVE STUDY OF THE SITE TO DETERMINE
FIRST, THE CAUSE AND THE EXTENT OF CONTAMINATION;
SECONDLY, WHAT CONTAMINANTS ARE PRESENT, AS WELL AS
THE POTENTIAL RISK POSED TO PEOPLE AND THE
ENVIRONMENT. ANOTHER REPEATED TERM IS "FEASIBILITY
STUDY." THIS IS A STUDY OF ALL POSSIBLE TREATMENT
OPTIONS OR ACTIONS THAT CAN BE USED TO TREAT
CONTAMINANTS ON THE SITE AND TO REMOVE OR GREATLY
REDUCE ANY THREATS TO PEOPLE OR THE ENVIRONMENT.
EACH ALTERNATIVE OR OPTION FOR CLEANUP MUST MEET

0364
i2
3
4
5
6
7
8
9
10
11
12
13
14
15
16
17
18
19
20
21
22
23
24
25
SPECIFIC CRITERIA THAT ALLOWS SUBJECTIVITY AND
OBJECTIVITY WITHIN ITS RESTRICTIONS.
THERE ARE NINE FACTORS OF SELECTING THE TYPE OF
CLEANUP THAT IS TO BE DONE. ONE, PROTECTION OF
HUMAN HEALTH AND THE ENVIRONMENT. TWO, COMPLIANCE
WITH APPLICABLE OR RELEVANT AND APPROPRIATE
REQUIREMENTS, ARAR. AGAIN, THIS IS SOMETHING THAT
YOU WILL FIND IN THE FACT SHEET. THESE APPLICABLE
OR RELEVANT AND APPROPRIATE REQUIREMENTS ARE FEDERAL
AND STATE REQUIREMENTS THAT A SELECTED REMEDY MUST
CONTAIN. THESE FIRST TWO ARE REFERRED TO AS
THRESHOLD CRITERIA.
NUMBER THREE, THE LONG-TERM EFFECTIVENESS AND
PERMANENCE. FOUR, REDUCTION OF TOXICITY, MOBILITY
AND VOLUME. FIVE, SHORT-TERM EFFECTIVENESS. SIX,
IMPLEMENTABILITY. SEVEN, COST. OF THESE NINE
FACTORS, THREE THROUGH SEVEN, LONG-TERM
EFFECTIVENESS AND PERMANENCE, REDUCTION OF TOXICITY,
MOBILITY AND VOLUME, SHORT-TERM EFFECTIVENESS AND
IMPLEMENTABILITY ARE REFERRED TO AS EVALUATING
CRITERIA.
THE LAST TWO ARE, EIGHT, COMMUNITY ACCEPTANCE
AND STATE ACCEPTANCE. THESE LAST TWO ARE REFERRED
TO AS MODIFYING CRITERIA. ALL NINE OF THESE ARE
TAKEN INTO CONSIDERATION IN ACCEPTING A CLEANUP

5
41
1
2
3
4
5
6
7
8
9
10
11
12
13
14
15
16
17
18
19
20
21
22
23
24
25
METHOD.
. WHEN A PROPOSED PLAN MEETING, SUCH AS THIS, IS
GIVEN, THE EPA ISSUES A FACT SHEET, PUBLISHES A
DISPLAY AD IN THE NEWSPAPER, PROVIDES A 30 DAY
PUBLIC COMMENT PERIOD, AND HOLDS A PUBLIC READING.
IT IS IMPORTANT FOR YOU TO REMEMBER THAT YOU, THE
CITIZENS OF THIS COMMUNITY WHO ARE POTENTIALLY
AFFECTED BY THIS SITE, HAVE A VOICE IN THE CLEANUP
PROCESS. YOUR COMMUNITY INVOLVEMENT OCCURS
THROUGHOUT THE SUPERFUND PROCESS. WE HAVE .A
SUPERFUND PROCESS SHEET, AGAIN, ON THE TABLE TO MY
RIGHT, THAT GIVES YOU AN OUTLINE OF THE PROCESS AND
SUGGESTS LEVELS OF COMMUNITY INVOLVEMENT.
COMMUNITY INVOLVEMENT HAS THREE GOALS IN MIND.
ONE, KEEP THE PUBLIC INFORMED AND INVOLVED. TWO,
GIVE THE PUBLIC A CHANCE TO PROVIDE FEEDBACK ON
DECISIONS. THREE, IDENTIFY AND RESOLVE ANY
CONFLICTS. COMMUNITY INVOLVEMENT COMPONENTS ALSO
PROVIDE ALL THE DOCUMENTS THAT PERTAIN TO THE SITE
IN THE RECORD. THE RECORD IS CALLED AN
ADMINISTRATIVE RECORD AND IS HELD IN THE INFORMATION
REPOSITORY FOR THE GENERAL PUBLIC TO REVIEW. AGAIN,
AT THE TABLE WE HAVE SOME CDs WITH THE REPORTS, ALL
THE REPORTS THAT HAVE BEEN DONE, ANYTHING THAT HAS
BEEN DONE TO THE SITE AVAILABLE FOR YOU THERE.

0566
2
3
4
5
6
"7
8
9
10
11
12
13
14
15
16
17
18
19
20
21
22
23
24
25
THE INFORMATION REPOSITORY CAN BE REVIEWED
LOCALLY AT THE MIDDLE TYGER BRANCH LIBRARY. ALSO ON
THE TABLE TO MY RIGHT IS A SIGN-IN SHEET. I THINK
EVERYONE HERE SIGNED IN, BUT IF YOU HAVE NOT, PLEASE
DO SO AND LET US KNOW THAT YOU ARE HERE THIS
EVENING. AND IF YOU ARE NOT ON OUR MAILING LIST, WE
WILL INCLUDE YOU. THIS WILL MAKE IT CONVENIENT FOR
YOU TO RECEIVE ANY INFORMATION ABOUT THE SITE AT
YOUR HOME-
ALSO, IF YOU HAVE SOMETHING TO SAY THIS
EVENING, COME UP TO THE MIC IN THE CENTER HERE WHERE
KEVIN IS AT THE END OF THE TABLE, AND STATE YOUR
NAME AND COMMENT LOUDLY AND CLEARLY SO WE MAY RECORD
IT AS PART OF THIS MEETING'S PROCEEDINGS.
AT THIS TIME I WOULD LIKE TO RECOGNIZE ANY
PUBLIC OFFICIALS WHO ARE IN ATTENDANCE. PLEASE
STAND AND STATE YOUR NAME AND FUNCTION IF WE DO HAVE
ANY HERE. WITH THAT, I WOULD LIKE TO INTRODUCE THE
EPA STAFF IN ATTENDANCE. KEVIN KOPOREK, WHO IS AN
ENVIRONMENTAL RISK ASSESSOR. MYSELF, I'M DAVID
DEROKEY. I AM AN ENVIRONMENTAL OUTREACH SPECIALIST
FOR THE EPA REGION FOUR. OUR OFFICES ARE LOCATED IN
ATLANTA. THE STATES WE SERVE ARE FLORIDA,
MISSISSIPPI, GEORGIA, ALABAMA, KENTUCKY, TENNESSEE,
NORTH AND SOUTH CAROLINA. LAST BUT NOT LEAST ON OUR

1
2
3
4
5
6
7
8
9
10
11
12
13
14
15
16
17
18
19
20
21
22
23
24
25
EPA STAFF IS OUR REMEDIAL PROJECT MANAGER FOR THIS
SITE, YVONNE JONES. YVONNE, WOULD YOU COME UP AND
DO THE HONOR OF TALKING WITH US ABOUT THE AQUA- TECH
ENVIRONMENTAL SITE?
MS. JONES:
THANK YOU. GOOD EVENING EVERYONE. PRIOR TO US
GETTING STARTED, FIRST OF ALL I WOULD LIKE TO SAY
THAT I WOULD LIKE TO THANK EVERYONE FOR COMING OUT
TONIGHT. ALSO IN ADDITION TO THAT, PREVIOUSLY WHEN
MR. DEROKEY BASICALLY GAVE THE INTRODUCTION OR ASKED
FOR INTRODUCTIONS, HE BASICALLY REQUESTED WHETHER OR
NOT THERE WERE ANY STATE OR LOCAL OFFICIALS IN THE
ROOM TONIGHT. AND AT THIS PARTICULAR TIME, I WOULD
LIKE TO GIVE THE STATE OF SOUTH CAROLINA THE
OPPORTUNITY TO INTRODUCE THEMSELVES.
MR. WILSON;
MY NAME'S SCOTT WILSON. I'M THE STATE PROJECT
MANAGER. I HAVE BEEN WORKING ON THE SITE FOR ABOUT
FOUR AND A HALF YEARS NOW. AND YVONNE AND I WORK
VERY CLOSELY TO MAKE SURE THAT EVERYTHING IS DONE AS
IT NEEDS TO BE. WE'VE GOT A COUPLE OTHER PEOPLE,
AND I'LL LET THEM INTRODUCE THEMSELVES. I
APOLOGIZE FOR BEING LATE. IF ANYBODY HAS THEIR
WINDOWS DOWN, THEY NEED TO GO CHECK THEM. IT'S A
ROUGH STORM COMING THIS WAY.
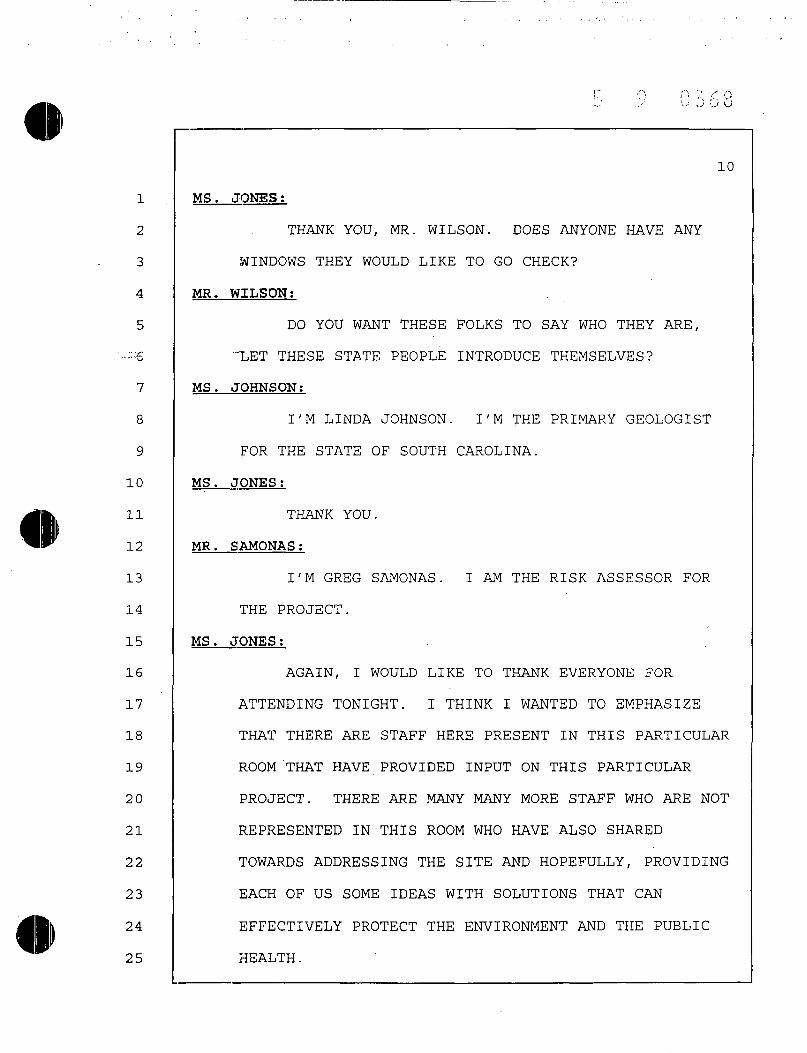
1
2
3
4
5
',,;; -g
7
8
9
10
11
12
13
14
15
16
17
18
19
20
21
22
23
24
25
10
MS. JONES:
THANK YOU, MR. WILSON. DOES ANYONE HAVE ANY
WINDOWS THEY WOULD LIKE TO GO CHECK?
MR. WILSON;
DO YOU WANT THESE FOLKS TO SAY WHO THEY ARE,
'"LET THESE STATE PEOPLE INTRODUCE THEMSELVES?
MS. JOHNSON;
I'M LINDA JOHNSON. I'M THE PRIMARY GEOLOGIST
FOR THE STATE OF SOUTH CAROLINA.
MS. JONES;
THANK YOU.
MR. SAMONAS;
I'M GREG SAMONAS. I AM THE RISK ASSESSOR FOR
THE PROJECT.
MS. JONES;
AGAIN, I WOULD LIKE TO THANK EVERYONE FOR
ATTENDING TONIGHT. I THINK I WANTED TO EMPHASIZETHAT THERE ARE STAFF HERE PRESENT IN THIS PARTICULAR
ROOM 'THAT HAVE PROVIDED INPUT ON THIS PARTICULARPROJECT. THERE ARE MANY MANY MORE STAFF WHO ARE NOTREPRESENTED IN THIS ROOM WHO HAVE ALSO SHAREDTOWARDS ADDRESSING THE SITE AND HOPEFULLY, PROVIDINGEACH OF US SOME IDEAS WITH SOLUTIONS THAT CANEFFECTIVELY PROTECT THE ENVIRONMENT AND THE PUBLICHEALTH.

S-->
1
2
3
4
5
6
7
•8
9
10
11
12
13
14
15
16
17
18
19
20
21
22
23
24
25
11
WITH THAT STATED, I WOULD LIKE TO START THE
PRESENTATION. I HAVE TO ASK AT THIS PARTICULAR TIME
THAT IF ANY TIME DURING THE PRESENTATION THAT YOU
.ARE UNABLE TO HEAR ME OR YOU WOULD LIKE FOR ME TO
CLARIFY ANY ISSUES, PLEASE DO SO AND WE WILL PLAN
ACCORDINGLY. WITH THAT STATED, I WOULD LIKE AT THIS
PARTICULAR TIME, TO OFFICIALLY START THE
PRESENTATION.
THE PURPOSE OF THIS MEETING ---
MS. WOODCOCK;
I'M SORRY. I DID NOT GET YOUR NAME.
MS . JONES ;
YVONNE JONES. Y-V-0-N-N-E JONES.
MS. WOODCOCK;
SORRY.
MS . JONES ;
THE PURPOSE OF' THIS MEETING TONIGHT IS TO
DISCUSS THE PROPOSED PLAN FOR THE AQUA-TECH SITE.
THE AQUA-TECH SITE IS LOCATED RIGHT OFF OF 290.
IT'S ACTUALLY LOCATED ON THE CORNER OF ROBINSON ROAD
AND HIGHWAY 290. THE PROPERTY IS APPROXIMATELY 61
ACRES. AT ONE PARTICULAR TIME THIS SITE WAS A
FORMER RCRA HAZARDOUS WASTE TREATMENT SITE. THAT
PARTICULAR FACILITY WAS OPERATING ON APPROXIMATELY
20 ACRES OF THIS 61 ACRES. AND IN ADDITION TO THAT,

J 5 7 0
2
3
4
5
6
7
8
9
10
11
12
13
14
15
16
17
18
19
20
21
22
23
24
25
12
PRIOR TO OPERATION OF THIS RCRA HAZARDOUS WASTE
FACILITY, A CLOSED MUNICIPAL SOLID WASTE LANDFILL
WAS ALSO OPERATED ON APPROXIMATELY TEN OF THOSE
ACRES .
THE PROPERTY IS CURRENTLY ZONED
COMMERCIAL/ INDUSTRIAL AND IS LOCATED IN THE AIRPORT
ENVIRONS AREA. THIS PARTICULAR ORDINANCE IS AN
ORDINANCE THAT WAS PUT IN PLACE IN 1996. THAT
ORDINANCE AT THIS PARTICULAR TIME PRECLUDES ANY
FUTURE RESIDENTIAL DEVELOPMENT.
BEFORE THE 1940' S LITTLE IS KNOWN ABOUT THE
WASTE ACTIVITIES THAT OCCURRED AT THIS SITE. DURING
THE 1950 'S, GENERALLY THERE WAS DUMPING BY
RESIDENTS. AND FROM 1963 TO 1968 THE CITY OF GREER
OPERATED A MUNICIPAL SOLID WASTE LANDFILL. DURING
THE MID 1970 'S THROUGH 1987, A COMPANY BY THE NAME
OF GROCE LABORATORIES OPERATED A HAZARDOUS WASTE
TREATMENT, STORAGE AND RECLAMATION FACILITY.
IN 1987, A COMPANY BY THE NAME OF AQUA- TECH
ENVIRONMENTAL CONTINUED TO ACCEPT, STORE AND TREAT
MOST HAZARDOUS WASTE AS WELL AS A VARIETY OF SOLID
WASTE. IN SEPTEMBER, 1991, AS A RESULT OF SEVERAL
RCRA VIOLATIONS AND ON-SITE ACCIDENTS, THE FACILITY
WAS ORDERED CLOSED BY THE STATE OF SOUTH CAROLINA.
JUST TO GIVE YOU SOME IDEA OF WHAT THE SITE
1
2
3
4
5
6
7
8
9
10
11
12
13
14
15
16
17
18
19
20
21
22
23
24
25
13
LOOKED LIKE DURING THOSE TIMES -- I'M NOT REALLY FOR
CERTAIN IF YOU CAN SEE A LOT IN THIS PARTICULAR
PICTURE. BUT, AT ONE PARTICULAR TIME THIS
PARTICULAR SITE HAD BASICALLY OVER 7,000 DRUMS,
CLOSE TO 1,800 GAS CYLINDERS, THERE WAS A LOT OF
BIO-MEDICAL WASTE AT THE SITE, RADIOACTIVE WASTE,
AND POSSIBLY UNEXPLODED ORDNANCE.
FROM SEPTEMBER OF 1991 TO JANUARY OF 1992, THE
STATE OF SOUTH CAROLINA CONDUCTED EMERGENCY
STABILIZATION ACTIVITIES. AND IN APRIL OF 1992, EPA
ISSUED A UNILATERAL ORDER. BASICALLY THAT IS AN
AGREEMENT THAT DIRECTS THE POTENTIALLY RESPONSIBLE
PARTY TO CONDUCT IN THIS PARTICULAR INSTANCE,
CLEANUP ACTIVITIES AT THE SITE. FROM NOVEMBER 1992
TO 1994, APPROXIMATELY 90 POTENTIALLY RESPONSIBLE
PARTIES CONDUCTED A TIME CRITICAL REMOVAL ACTION AT
THE SITE. DURING THAT REMOVAL ACTION -- THE PURPOSE
OF THAT REMOVAL ACTION WAS TO REMOVE THE
CONTAMINATION AT THE SITE. IN OTHER WORDS, THE
REMOVAL OF THE MANY DRUMS THAT WERE AT THE SITE, THE
MANY GAS CYLINDERS AT THE SITE, SEVERAL, I GUESS,
TONS OF CONTAMINATED SOIL, AND OF COURSE THE
UNEXPLODED ORDNANCE AND MILITARY-TYPE MATERIALS.
IN DECEMBER 16, 1994, THIS SITE WAS ADDED TO
THE NATIONAL PRIORITIES LIST. AND OF COURSE, IN
x 7 oj / t.
1
2
3
4
5
6
7
8
9
10
11
12
13
14
15
16
17
18
19
20
21
22
23
24
25
14
SEPTEMBER, 1995, THE EPA ENTERED INTO AN AGREEMENT
WITH THE POTENTIALLY RESPONSIBLE PARTIES TO CONDUCT
A REMEDIAL INVESTIGATION/FEASIBILITY STUDY AT THE
SITE. AS PREVIOUSLY STATED, A REMEDIAL
INVESTIGATION IS AN ACTIVITY WHERE EPA IN
CONJUNCTION WITH THE STATE OF SOUTH CAROLINA
OVERSIGHT, CONDUCTS SITE CHARACTERIZATION ACTIVITIES
AT THE SITE. IN OTHER WORDS, THE PURPOSE OF THAT
INVESTIGATION IS TO DETERMINE WHETHER OR NOT AND
WHERE THERE IS THE PRESENCE OR ABSENCE OF
CONTAMINATION OF THE SOIL, THE GROUNDWATER, THE
SURFACE WATER, AND THE SEDIMENTS AT OR NEAR THE
VICINITY OF THIS SITE.
THIS PHOTO WAS TAKEN, I BELIEVE IN FEBRUARY OF
1993. THIS IS JUST SORT OF AN AERIAL VIEW OF THE
SITE. JUST TO GIVE YOU SOME IDEA OF WHERE WE ARE IN
THIS PARTICULAR SITE, FOR THOSE WHO ARE AWARE OF
SEVERAL LOCATIONS IN GREEK, HIGHWAY 290 ACTUALLY
RUNS ALMOST PARALLEL TO THIS PARTICULAR BUILDING.
AND ROBINSON ROAD IS JUST A LITTLE BIT NORTH UP
THROUGH HERE. SO LITERALLY THIS IS A PARTICULAR
SITE THAT EVEN IN THE EARLY 90 'S, YOU COULD PROBABLY
SEE -- YOU COULD SEE THE MAJORITY OF THE STORAGE
DRUMS ON SITE DURING THAT TIME. AND OF COURSE, AS
YOU CAN TELL THERE ARE SEVERAL DRUMS LOCATED

12
3
4
5
6
7
8
9
10
11
12
13
14
15
16
17
18
19
20
21
22
23
24
25
15
THROUGHOUT THE SITE.
BETWEEN 1985 AND 2000, OVER 450 SAMPLES WERE
COLLECTED AT THE SITE. THOSE PARTICULAR SAMPLES
CONSISTED OF SAMPLES COLLECTED OF THE GROUNDWATER,
THE SOIL, THE SURFACE WATER, SEDIMENT, AND THE
LANDFILL GAS. AS I STATED EARLIER, ALTHOUGH THERE
WAS A RCRA HAZARDOUS WASTE FACILITY THAT OPERATED AT
THIS PARTICULAR SITE, THIS PARTICULAR SITE OR THAT
PARTICULAR FACILITY OPERATED ABOVE THE MUNICIPAL
SOLID WASTE LANDFILL THAT IS STILL CURRENTLY IN
PLACE. GREATER THAN 300 OF THOSE SAMPLES WERE
COLLECTED JUST FOR THE REMEDIAL INVESTIGATION ALONE.
AND THOSE SAMPLES WERE COLLECTED INTERMITTENTLY
BETWEEN MAY, 1998 AND DECEMBER, 2001.
AS A RESULT OF THE REMEDIAL INVESTIGATION, THE
SITE CHARACTERISTICS OF THE SITE ARE AS FOLLOWS.
THERE IS A MUNICIPAL SOLID WASTE LANDFILL THAT IS AT
THE SITE, OBVIOUSLY STILL AT THE SITE. IT'S
CURRENTLY COVERED WITH CLAY SOIL. THE SITE ITSELF
BASICALLY SLOPES TOWARDS MAPLE CREEK. AND IT IS
ESTIMATED THAT THE MUNICIPAL SOLID WASTE LANDFILL
CONTAINS APPROXIMATELY 320,000 CUBIC YARDS OF WASTE
MATERIAL. JUST RIGHT OFF THE TOP OF MY HEAD, I
GUESS THAT'S CLOSE TO MAYBE 700,000 TONS OF WASTE.
THE MUNICIPAL SOLID WASTE LANDFILL WASTE INTERSECTS

u 0 6.7 4
i2
3
4
5
6
7
8
9
10
11
12
13
14
15
16
17
18
19
20
21
22
23
24
25
16
THE WATER TABLE.
THERE ARE THREE PARTICULAR AREAS OF CONCERN
THAT WE FEEL ARE CONTINUING TO BE AN ONGOING SOURCE
FOR THE GROUNDWATER CONTAMINATION AT THE SITE. IN
ADDITION TO THAT, THOUGH, WE DO KNOW THAT THE
LANDFILL GAS SAMPLES, OR FROM THE LANDFILL GAS
SAMPLES, THAT A LOT OF THIS PARTICULAR LANDFILL DOES
CONTAIN PUTRESCIBLE WASTE. SO, WASTE VERY SIMILAR
TO WHAT YOU WOULD SEE AT A MUNICIPAL LANDFILL. AND
OF COURSE, WE DO FEEL THAT THE LIMITED IMPACT OF
SOIL REMAINING ON SITE APPEARS TO BE A SECONDARY
SOURCE. AND AGAIN, ALTHOUGH A LOT OF -- ACTUALLY,
ALTHOUGH THE DRUMS AT THE SITE.AND THE GAS CYLINDERS
AT THE SITE HAVE BEEN REMOVED AND SEVERAL AMOUNTS OF
SOIL CONTAMINANT HAVE BEEN REMOVED FROM THE SITE,
THERE STILL APPEARS TO BE SOME RESIDUAL
CONTAMINATION OF THAT SOIL STILL ON SITE.
IN SUMMARY, THE MUNICIPAL SOLID WASTE LANDFILL
AND THE FORMER AQUA-TECH OPERATION HAS IMPACTED THE
SURFACE WATER, GROUNDWATER, AND SEDIMENT IN THE EAST
DRAINAGE DITCH -- THIS IS ADJACENT TO THE LANDFILL
PORTION OF THE SITE -- BUT NOT MAPLE CREEK. THE
CONTAMINANTS THAT WE ARE SEEING THAT ARE EXCEEDING
EPA'S SCREENING VALUES, IN OTHER WORDS EPA'S HEALTH-
BASED SCREENING VALUES, ARE VOCs, PCBs AND METALS.

1
2
3
4
5
6
7
8
9
10
11
12
13
14
15
16
17
18
19
20
21
22
23
24
25
17
THE MAJORITY OF THOSE AREAS WHERE THERE ARE
EXCEEDANCES, THEY ARE LOCATED ON THE SURFACE OR
WITHIN THE FOOTPRINT OF THE LANDFILL.
I THINK IT'S PROBABLY HARD TO SEE THIS
PARTICULAR SLIDE, BUT THE AREAS IN QUESTION ARE
PRIMARILY IN THE PROCESS DISTILLATION AREA, THIS
AREA HERE.
MS. WOODCOCK;
I HAVE A QUESTION. YOU WERE SAYING THAT, AS I
UNDERSTOOD IT, THE MAPLE CREEK WAS -- THAT THE
GROUND SLOPES DOWN TO MAPLE CREEK RIGHT? DIDN'T YOU
SAY THAT?
MS . JONES :
CORRECT.
MS. WOODCOCK:
OKAY. AND YOU'RE SAYING THAT THE GROUNDWATER
AND THE WASTE HAD IMPACTED THE SURFACE SOIL AND
GROUNDWATER WITH CONTAMINATION, AND YET NONE OF THAT
HAS AFFECTED MAPLE CREEK?
MS . JONES ;
ACTUALLY, YOU BRING UP A VERY GOOD QUESTION.
DURING THE REMOVAL ACTION THAT TOOK PLACE AT THIS
PARTICULAR SITE, THERE ARE SOME SEDIMENTS THAT ARE
CONTAMINATED. HOWEVER, DURING A REMOVAL ACTION, THE
EPA REMOVAL PROGRAM BASICALLY INSTALLED WHAT WE CALL

<"• 7 '~i f/ 6'.;
1
2
3
4
5
6
1
8
9
10
11
12
13
14
15
16
17
18
19
2 0
21
22
23
24
25
18
.A fi-RnTMRMTATTDM BASIN, WHICH IS LOCATED RIGHT AROUND
THIS PARTICULAR AREA. AS A RESULT OF PLACEMENT OF
THAT SEDIMENTATION BASIN, WE ARE SEEING FAIRLY HIGH
LEVELS OY COTTTAMINATION IN THIS PARTICULAR AREA.
AND THERE IS A VERY STRONG POSSIBILITY THAT IF THAT
SEDIMENTATION BASIN HAD NOT BEEN PUT IN PLACE, THAT
THE WASTE FROM THE SITE COULD HAVE MIGRATED DOWN TO
MAPLE CREEK, WHICH IS HERE. SO AGAIN, WE ARE SEEING
CONTAMINATION HERE BUT AGAIN, THERE'S A VERY STRONG
POSSIBILITY THAT IF THIS HAD NOT BEEN PUT IN PLACE,
THAT A LOT OF THE CONTAMINATION THAT WE ARE SEEING
HERE WITHIN THE LIMITS OF THE LANDFILL COULD HAVE
MIGRATED POTENTIALLY DOWN TO MAPLE CREEK. THAT'S A
VERY, VERY GOOD QUESTION.
MR . KOPOREK ;
YVONNE, DO YOU WANT TO HOLD YOUR QUESTIONS
UNTIL THE END BECAUSE SOME OF THE QUESTIONS MAY BE
ANSWERED THROUGH YOUR PRESENTATION?
MS. JONES:
OKAY .
MR. GRIGGS:
LET ME COMMENT ON THAT. WHAT YOU'RE SAYING --
AND I KNOW WHAT HE SAID, TOO -- BUT WHAT YOU SAID IS
THERE'S NO CONTAMINATION OF MAPLE CREEK EVEN THOUGH
THE POTENTIAL WAS THERE? BUT YOU HAVE NOT MEASURED

C377
1
2
3
4
5
6
7
8
9
10
11
12
13
14
15
16
17
18
1 9
20
21
22
23
24
25
19
ANY CONTAMINATION OF MAPLE CREEK. IS THAT WHAT YOU
SAID?
MS . JONES ;
ACTUALLY WHAT WE ARE SAYING IS THERE IS NO
SIGNIFICANT IMPACT. IN OTHER WORDS, WE ARE
DETECTING SOME CONTAMINANTS IN MAPLE CREEK.
HOWEVER, THOSE CONTAMINANTS ARE WELL BELOW EPA' S
SAFE DRINKING WATER LEVELS, OR FOR THE SOIL --
SEDIMENTS, WELL BELOW THE HEALTH BASED STANDARDS.
TO GIVE YOU AN EXAMPLE OF THAT -- AND AGAIN, THIS IS
JUST A HYPOTHETICAL EXAMPLE, NOT NECESSARILY DEALING
WITH MAPLE CREEK. TO GIVE YOU AN EXAMPLE OF THAT IS,
SAY FOR INSTANCE IN THE SURFACE WATER WE DETECTED,
I'LL SAY ZINC, AT FIVE PARTS PER BILLION. AND EPA
SAFE DRINKING WATER STANDARD FOR ZINC IS 5,000 PARTS
PER BILLION. SO, WHILE WE MAY HAVE DETECTED CERTAIN
CONSTITUENTS IN MAPLE CREEK, THOSE LEVELS ARE AT A
CERTAIN CONCENTRATION LEVEL, SO THAT THEY ARE BELOW
THE HEALTH BASED STANDARDS . SO , THAT ' S ALSO A VERY ,
VERY GOOD QUESTION. AND ACTUALLY, THANK YOU FOR
HELPING ME CLARIFY THAT.
MR. KOPOREK;
AND ALSO SINCE WE ARE TALKING ABOUT MAPLE
CREEK, THEY WOULD ALSO BE BELOW ECOLOGICALLY BASED
VALUES AS WELL.

0 3 7 8
1
2
3
4
5
6
7
8
9
10
11
12
13
14
15
16
17
18
19
2 0
21
22
23
24
25
20
MR. GRIGGS;
I JUST WANTED TO HEAR IT SAID IN THAT WAY SO
THERE WASN'T ANY FEAR FROM SOMETHING ELSE.
MS. JONES:
THANK YOU.
MS. WOODCOCK;
. ARE WE SURE THAT THERE IS NOT GOING TO BE A
LONG-TERM HEALTH IMPACT ON THE COMMUNITY FROM HAVING
THIS STUFF IN THE GROUND FOR TEN YEARS. AND Y'ALL
HAVE BASICALLY SAID, "OH. WELL, IT'S HERE." AND WE
SAT AND TOOK SAMPLES FOR ALL THIS LENGTH OF TIME,
AND WE DID CLEAN UP SOME STUFF, BUT YOU KNOW, IT
DOES SEEM LIKE IT'S -- IT WAS ALLOWED TO SORT OF
SIT.
MS . JONES ;
WE HAVE COLLECTED SAMPLES BOTH ON SITE AND OFF
SITE AT THE'-- THERE ARE SEVERAL RESIDENCES THAT ARE
LOCATED ON ROBINSON ROAD, ACTUALLY, I GUESS I WOULD
SAY CROSS RADIANT OF THIS SITE. I DON'T KNOW IF
THAT MAKES ANY SENSE OR NOT . AND WE HAVE' ACTUALLY
COLLECTED SAMPLES OF THEIR GROUNDWATER TO DATE.
BASED ON THE ANALYSIS OF THOSE SAMPLES, ALL OF THOSE
ANALYSES HAVE SHOWN LEVELS THAT ARE, AGAIN, EPA SAFE
DRINKING WATER STANDARDS.
MR. DEROKEY:

0379
1
2
3
4
5
6
7
8
9"
10
11
12
13
14
15
16
17
18
19
20
21
22
23
24
25
21
LET ME JUST INTERRUPT ONE MORE TIME. IF INDEED
YOU HAVE A QUESTION OR COMMENT, ANYTHING THAT YOU
WOULD LIKE TO SAY, BECAUSE IT IS BEING RECORDED, WE
WOULD LIKE FOR YOU TO COME UP AND STATE YOUR NAME SO
THAT WE CAN HAVE THAT RECORDED AS PART OF THE
PROCEEDINGS. AND AGAIN, TOO, YVONNE WILL ANSWER
YOUR QUESTIONS. AND IF WE COULD POSSIBLY HOLD THE
QUESTIONS UNTIL THE END, BECAUSE SOME OF YOUR
QUESTIONS WILL BE ANSWERED DURING THE PRESENTATION
ITSELF.
MS . JONES ;
DID I ANSWER YOUR QUESTIONS? I KNOW I'M
BREAKING THE RULES. DID I ADDRESS EACH OF YOUR
QUESTIONS?
MS. WOODCOCK;
EVIDENTLY, YES.
MR. KOPOREK;
YEAH. AS FAR AS THE QUESTIONS ABOUT HEALTH
IMPACT, WHY DON'T WE WAIT UNTIL SHE GOES THROUGH THE
REST OF THE SUMMARY OF THE INVESTIGATION AND SEE IF
YOUR QUESTIONS ARE ANSWERED. IF THEY'RE NOT, THEN
SHE'LL ADDRESS THEM.
MS. JONES;
BASICALLY AS PART OF THE RI, ONE OF THE THINGS
WE LOOK AT IS WHAT WE CONSIDER OR WE CALL FATE AND

1
2
3
4
5
6
7
8
9
10
11
12
13
14
15
16
17
18
19
20
21
22
23
24
25
22
TRANSPORT.. . IN OTHER WORDS, IF THERE'S CONTAMINATION
IN SOILS, WE WANT TO LOOK AT ALL THE POTENTIAL MEDIA
THAT A POTENTIAL CONSTITUENT OR CONTAMINANT CAN
TfllGKKTE'TO, WHETHER IT'S VIA THE AIR, VIA THE
GROUNDWATER, OR VIA RUNOFF TO SURFACE WATER.
EPA CONCENTRATED ON FOUR PARTICULAR TYPES OF
MIGRATION OF CONTAMINANTS. WE BASICALLY EVALUATED
THE POSSIBILITY OF LANDFILL GAS EMISSIONS MIGRATING
TO THE AIR. WE EVALUATED THE POSSIBILITY OF
CONTAMINANTS IN SOILS MIGRATING TO THE GROUNDWATER.
AND OF COURSE, WE EVALUATED THE CONTAMINANTS IN THE
GROUNDWATER MIGRATING TO SURFACE WATER. AND OF
COURSE, A POSSIBILITY -- EVEN THOUGH AT THIS
PARTICULAR TIME THERE ARE NOT RESIDENTS THAT ARE ON
SITE, WE DID EVALUATE THE POSSIBILITY OF
CONTAMINANTS MIGRATING FROM THE GROUNDWATER TO
INDOOR AIR. AND OF COURSE, THIS IS DONE MODELING
BECAUSE OBVIOUSLY WE DO NOT HAVE ANYONE LIVING ON
SITE AT THIS PARTICULAR TIME.
AS A RESULT OF THAT IT WAS DETERMINED THAT
EMISSIONS WERE BELOW SOUTH CAROLINA'S, I'M JUST
GOING TO SAY, STANDARDS. IN ADDITION TO THAT, IT
APPEARS THAT CONTAMINANTS HAVE NOT LEACHED TO DEPTH,
AND THAT'S IN THE MAJORITY OF THE AREAS. BUT WE ARE
HAVING SOME CONTAMINANTS LEACHING.

12
3
4
5
6
7
8
9
10
11
12
13
14
15
16
17
18
19
20
21
22
23
24
25
23
DUE TO THE CLOSURE OF THE MUNICIPAL SOLID WASTE
LANDFILL AND THE REMOVAL ACTIVITIES, IT APPEARS THAT
THE GROUNDWATER CONCENTRATIONS HAVE OVERALL DECLINED
ACROSS THE SITE, AND THAT GROUNDWATER HAS NOT
IMPACTED THE SURFACE WATER. NOW, AGAIN I'M STATING
THAT THE GROUNDWATER CONCENTRATIONS HAVE DECLINED.
I'M NOT SAYING THAT THE GROUNDWATER IS SAFE TO
DRINK. WE'RE JUST SAYING THAT THE GROUNDWATER
CONTAMINATIONS HAVE DECLINED.
IN ADDITION TO THAT, IN REGARDS TO VAPOR
MIGRATION FROM GROUNDWATER, WE DO NOT SEE AN
UNACCEPTABLE RISK. AND OF COURSE, IN ADDITION TO
THAT, RESIDENTIAL DEVELOPMENT ON SITE IS PROHIBITED.
IN ADDITION TO CHARACTERIZING THE SITE, EPA
CONDUCTS WHAT WE CALL A BASELINE RISK ASSESSMENT..
IN THE BASELINE RISK ASSESSMENT WE LOOK AT THE
POTENTIAL OF RISKS TO BOTH THE HUMAN POPULATIONS AND
THE ECOLOGICAL RECEPTORS. FROM AN ECOLOGICAL
STANDPOINT, THERE WAS NO SIGNIFICANT ECOLOGICAL
RISK.
FROM A HUMAN HEALTH STANDPOINT, WE LOOK AT
BOTH THE POTENTIAL FOR CURRENT RISK ON THE SITE AND
WE LOOK AT THE POTENTIAL FOR FUTURE RISK ON THE
SITE. FOR THE CURRENT SCENARIO, IN OTHER WORDS
TODAY, CURRENTLY THERE IS NO UNACCEPTABLE RISK TO

^ 7 0 O;J ..l O /
12
3
4
5
6
7
8
9
10
11
12
13
14
15
16
17
18
19
20
21
22
23
24
25
24
HUMAN HEALTH ON THIS PARTICULAR SITE. HOWEVER, FROM
A FUTURE PERSPECTIVE THERE IS AN UNACCEPTABLE RISK
BASED ON THREE VARIOUS WAYS -- THREE VARIOUS
MIGRATION PATHWAYS OF EXPOSURE.
THE FIRST ONE IS THERE IS AN UNACCEPTABLE RISK
TO INGESTION OF GROUNDWATER AND SOIL FROM THE AQUA-
TECH SITE. IN ADDITION, THERE IS AN UNACCEPTABLE
RISK FOR DERMAL CONTACT OF SURFACE SOILS AT THIS
PARTICULAR SITE. AND THEN THIRD, THERE IS AN
UNACCEPTABLE RISK IN THE FUTURE TO INHALATION OF AIR
OF THIS PARTICULAR SITE.
I PROBABLY NEED TO CLARIFY THAT BECAUSE
INHALATION OF AIR, THAT PARTICULAR UNACCEPTABLE RISK
WOULD BE GENERATED SHOULD A CONSTRUCTION WORKER
ACTUALLY LITERALLY DIG DOWN INTO THE LANDFILL
ITSELF. BUT, I DID NEED TO CLARIFY THAT WHEN WE SAY
"INHALATION OF AIR" WE'RE NOT SAYING JUST SOMEONE
GOING ON THE SITE BREATHING THE AIR, THAT THAT WOULD
BE AN UNACCEPTABLE RISK TO THEM.
AS A RESULT OF THE UNACCEPTABLE RISK FOR THIS
PARTICULAR SITE, EPA WILL ADD SEVERAL DIFFERENT
PATHWAYS OR SEVERAL-DIFFERENT MEDIA. AGAIN, WHEN WE
COLLECTED THOSE SAMPLES, WE SAMPLED THE SOILS, WE
SAMPLED THE GROUNDWATER, WE SAMPLED THE AIR, WE
SAMPLED THE SEDIMENT, AND WE SAMPLED THE SURFACE
12
3
4
5
6
7
8
9
•10
11
12
13
14
15
16
17
18
19
20
21
22
23
24
25
25
WATER. OF THOSE MEDIA, SOIL, GROUNDWATER, AND AIR
ALL HAD CONTAMINANTS IN THEM THAT POSE AN
UNACCEPTABLE FUTURE RISK TO THE HUMAN POPULATIONS.
FOR SOIL, THE CONTAMINANTS WERE ARCLOR 1242 --
.AND THAT IS THE SAME AS PCB'S IF ANYONE IS FAMILIAR
WITH PCB'S -- LEAD, MERCURY, AND THALLIUM. FOR
GROUNDWATER, THE CONTAMINANTS OF CONCERN, IN OTHER
WORDS THE CONTAMINANTS THAT ARE CONTRIBUTING TO THE
UNACCEPTABLE FUTURE RISK AT THE SITE, ARE BENZENE,
CIC-1,2-DICHLOROETHENE, 1,1-DICHLOROETHANE, 1,1,2,2-
TETRACHLOROETHANE, TETRACHLOROETHANE,
TRICHLOROETHENE AND VINYL CHLORIDE.
THE MAJORITY OF THE CONTAMINANTS THAT I HAVE
JUST STATED ARE WHAT ARE KNOWN AS VOLATILE ORGANIC
COMPOUNDS. VOLATILE ORGANIC COMPOUNDS ARE VERY,
VERY SIMILAR TO COMPOUNDS THAT YOU MAY FIND IN PAINT
THINNERS OR SOLVENTS. AND AS STATED EARLIER, THERE
IS AN UNACCEPTABLE RISK -- THERE IS A POTENTIAL
UNACCEPTABLE RISK DUE TO EXPOSURE OF AIR AT THIS
PARTICULAR SITE. AND THE CONTRIBUTING CONTAMINANT
FOR THAT UNACCEPTABLE RISK IS BENZENE.
NOW, IN SUMMARY, AT THIS PARTICULAR SITE,
ALTHOUGH A LOT OF CLEANUP ACTIONS HAVE TAKEN^TO
DATE, THOSE CLEANUP ACTIONS HAVE STABILIZED THE
SITE. HOWEVER, BASED ON OUR INVESTIGATION, THE

b u
J.
2
3
4
5
6
7
8
9
10
11
12
13
14
15
16
17
18
19
20
21
22
23
24
25
26
REMEDIAL INVESTIGATION, AND THEN BASED ON RISK
ASSESSMENT, IT HAS BEEN DETERMINED THAT THERE IS A
POTENTIAL UNACCEPTABLE RISK TO HUMAN POPULATION.
AS A RESULT OF THAT, EPA HAS IDENTIFIED SEVERAL
REMEDIAL ACTION OBJECTIVES THAT WILL NEED TO BE PUT
IN PLACE IN ORDER TO ENSURE THAT THE PUBLIC IS
PROTECTED. THE FIRST IS TO PREVENT EXPOSURE OF
HUMAN AND ECOLOGICAL RECEPTORS TO CONTAMINATED
SOILS. THE SECOND ONE IS TO PREVENT EXPOSURE OF
HUMAN RECEPTORS TO CONTAMINATED. GROUNDWATER . THE
THIRD IS TO RESTORE CONTAMINATED GROUNDWATER LOCATED
OUTSIDE OF THE FOOTPRINT OF THE MUNICIPAL WASTE
LANDFILL TO DRINKING WATER STANDARDS. THE NEXT IS
TO CONTROL MIGRATION OF CONTAMINANTS FROM THE SITE
TO SURFACE WATER.
I BELIEVE EARLIER SOMEONE HAD A QUESTION IN
REGARDS TO SURFACE WATER. AGAIN, AT THIS PARTICULAR
TIME THE DECISION WAS THAT WHAT WE ARE SEEING IN THE
SURFACE WATER ARE BELOW THE SAFE DRINKING WATER
STANDARDS. HOWEVER, IN AN EFFORT TO ENSURE THAT
THERE IS NO ADDITIONAL MIGRATION OF CONTAMINANTS TO
THE SURFACE WATER, OUR PREFERRED REMEDY SHOULD HELP
ADDRESS THAT. IT SHOULD HELP REDUCE THE POSSIBILITY
OF THAT. AND OF COURSE, OUR LAST REMEDIAL ACTION
OBJECTIVE IS TO MONITOR THE EFFECTIVENESS OF THE

0385
1
2
3
4
5
6
7
8
9
10
11
12
13
14
15
16
17
18
19
20
21
22
23
24
25
27
REMEDY ONCE THE REMEDY IS IN PLACE.
FOR THE AQUA-TECH SITE, SEVERAL ALTERNATIVES
WERE GENERATED TO ADDRESS THE UNACCEPTABLE RISK AT
THE SITE. THESE PARTICULAR ALTERNATIVES WERE
DIVIDED UP INTO THREE DIFFERENT CATEGORIES. THE
FIRST CATEGORY DEALS WITH BOTH SOIL AND GROUNDWATER .
THE SECOND CATEGORY DEALS ONLY WITH THE SOIL. AND
THE THIRD CATEGORY DEALS ONLY WITH THE GROUNDWATER.
ONE OF THE THINGS THAT YOU WILL NOTICE ON THIS
PARTICULAR SLIDE IS THAT THERE IS A NO ACTION
ALTERNATIVE. AND I KNOW SEEING THAT, IS THAT REALLY
AN ALTERNATIVE? NO ACTION? AND IF IT IS, AS YOU
CAN SEE THE COST OF $62,000. BASICALLY, AS PART OF
OUR PROCESS, EPA HAS TO EVALUATE THE POSSIBILITY OF
NO ACTION SHOULD NO ACTION BE SELECTED FOR A
PARTICULAR SITE. AND IF NO ACTION IS SELECTED,
WHERE WE HAVE UNACCEPTABLE RISK OR CONCENTRATION
LEVELS THAT ARE ABOVE SAFE DRINKING WATER STANDARDS
FOR EPA AND DHEC ACTUALLY, HEALTH BASED STANDARDS,
MONITORING OVER A THIRTY YEAR PERIOD EVERY FIVE
YEARS WILL HAVE TO TAKE PLACE. SO ALTHOUGH IT'S
BASICALLY NO ACTION, THERE IS A COST ASSOCIATED WITH
CONDUCTING THAT MONITORING PROGRAM.
IN ADDITION TO THAT, THE SECOND CATEGORY DEALS
WITH SOILS. AT THIS PARTICULAR SITE AS WE STATED

03 36
1
2
3
4
5
6
7
8
9
10
11
12
13
14
15
16
17
18
19
20
21
22
23
24
25
28
PREVIOUSLY, THIS PARTICULAR SITE CONSISTS OF A
MUNICIPAL SOLID WASTE LANDFILL. AND THEREFORE, AS A
RESULT OF THAT, THE TYPE ALTERNATIVES THAT WE
EVALUATED ARE ALTERNATIVES THAT WE COULD USE TO HELP
ENHANCE THE CURRENT CAP AT THE SITE. WE LOOKED AT
SEVERAL DIFFERENT TYPES OF CAPS.
A RCRA SUBTITLE D CAP IS A CAP -- AND I
ACTUALLY HAVE A DISPLAY UP FRONT IF YOU'D LIKE TO
SEE IT LATER ON -- BUT A RCRA SUBTITLE D CAP IS A
CAP THAT WOULD CONSIST OF BASICALLY 18 INCHES OF
SOIL COMPRESSED AT A CERTAIN PERMEABILITY, AND AN
ADDITIONAL 12 INCHES FOR A ROOF ZONE, IF THAT MAKES
ANY SENSE, TO PLANT GRASS, ET CETERA, ET CETERA.
A SUBTITLE C CAP IS A LITTLE BIT MORE
SUBSTANTIAL, AND IT WOULD CONSIST OF 24 INCHES OF.
SOIL, BASICALLY A LINER. AND AN ADDITIONAL 24
INCHES OF SOIL. SO, AS YOU CAN SEE THE RCRA
SUBTITLE C CAP -- ALTHOUGH THERE ARE SEVERAL CAPS UP
HERE, THE RCRA SUBTITLE C CAP IS A LITTLE - - I S MORE
SUBSTANTIAL THAN A RCRA SUBTITLE D CAP.
AND THEN OF COURSE, ALTERNATIVE S3C IS A
MIXTURE OF BOTH A SUBTITLE C CAP AND A SUBTITLE D
CAP." THE ONLY REASON WHY WE LOOKED AT THAT
ALTERNATIVE IS BECAUSE ONE OF THE THINGS THAT WE
NOTICED AT THE AQUA-TECH SITE IS THE MAJORITY OF THE

"• 7 r; rj'•J O 0 /
1
2
3
4
5
6
7
8
9
10
11
12
13
14
15
16
17
18
19
20
21
22
23
24
25
29
LANDFILL THAT IS OUT THERE, THE 10.1 ACRE LANDFILL
THAT IS OUT THERE, CONSISTS OF, OR HAS CONSTITUENTS
THAT ARE SIMILAR TO WHICH YOU WOULD SEE AT A
SUBTITLE D FACILITY. A SUBTITLE D FACILITY, I LIKE
TO THINK OF THAT AS A MUNICIPAL SOLID WASTE
FACILITY. WHEREAS A RCRA SUBTITLE C FACILITY, THAT
IS SOMETHING TO WHICH YOU WOULD SEE AT A HAZARDOUS
WASTE FACILITY.
SO WHEN WE LOOKED AT THIS PARTICULAR SITE, WE
BECAME AWARE THAT THE MAJORITY OF THIS PARTICULAR
LANDFILL HAD CONSTITUENTS, AGAIN, THAT ARE VERY,
VERY SIMILAR TO WHAT YOU WOULD SEE IN A MUNICIPAL
WASTE LANDFILL. HOWEVER, IN SOME OF THE AREAS WHERE
THE AQUA-TECH OPERATIONS TOOK PLACE, AND THE GROCE
LAB OPERATIONS TOOK PLACE, THERE IS WASTE THAT WE.
COULD CATEGORIZE OR WOULD MORE THAN LIKELY PLACE IN
THAT HAZARDOUS WASTE LANDFILL. SO BASICALLY YOU
HAVE A MIXED-TYPE LANDFILL OUT THERE. IT'S NOT ALL
MUNICIPAL PLANT LANDFILL AND IT'S NOT ALL A
HAZARDOUS WASTE-TYPE LANDFILL.
AND THEN OF COURSE, THE VERY LAST ALTERNATIVE
THAT WE EVALUATED FOR SOIL IS SITE CAPPING AND IN-
SITU SOIL TREATMENT. SITE CAPPING WOULD CONSIST OF
THE MIXED COVER THAT WE SAW IN S3C, BUT IT WOULD
ALSO PROVIDE ADDITIONAL TREATMENT OF THE SOILS TO

s ' "' p.• U O
1
2
3
4
5
6
7
8
9
10
11
12
13
14
15
16
17
18
19
20
21
22
23
24
25
30
ADDRESS THE VOC CONTAMINATION. IN OTHER WORDS, WE
DID HAVE, AS STATED EARLIER, TRICHLOROETHENE, WHICH
IS A VOLATILE SUBSTANCE THAT WE ARE SEEING IN THE
UPPER DEPTHS OF SOIL AT THIS PARTICULAR SITE.
FOR GROUNDWATER, WHICH IS THE LAST CATEGORY, WE
EVALUATED THE CHEMICAL INJECTION AND MONITORED
NATURAL ATTENUATION. CHEMICAL INJECTION FOR THIS
PARTICULAR SITE, REALLY WOULD CONSIST OF INJECTING
CHEMICALS INTO THE GROUNDWATER THAT WOULD ALLOW AN
APPROPRIATE LEVEL OF BREAKDOWN OF THE PRODUCTS DOWN
TO LEVELS THAT WOULD BE SAFE TO DRINK. AND THAT IS
AN ACTIVE REMEDY.
MONITORED NATURAL ATTENUATION IS AN ACTUAL
REMEDY BUT IT IS A PASSIVE REMEDY. WHAT I MEAN BY
THAT IS THERE'S CURRENTLY A NATURAL BIOLOGICAL
PROCESS THAT IS OCCURRING AT THE SITE. AND WHILE WE
LOOKED AT MONITORED NATURAL ATTENUATION, UNLIKE THE
USE OF CHEMICAL INJECTION THAT WOULD ALLOW US TO
CLEAN UP THE GROUNDWATER IN THREE TO FIVE YEARS,
MONITORED NATURAL ATTENUATION -- AGAIN, A PASSIVE
REMEDY -- COULD TAKE ANYWHERE FROM 15 TO 30 YEARS.
SO WE DID EVALUATE IT ALONG WITH SEVERAL
ALTERNATIVES THAT WE SEE HERE. BUT ONE OF THE
THINGS WE NOTICED IS THAT WE HAVE BOTH UNACCEPTABLE
RISK IN THE GROUNDWATER AND THE SOIL. SO AS A
0389
1
2
3
4
5
6
7
8
9
10
11
12
13
14
15
16
17
18
19
20
21
22
23
24
25
31
RESULT OF THAT, WE HAVE TO BASICALLY CHOOSE NOT ONLY
ALTERNATIVES FOR SOIL, BUT IN ORDER TO BE
PROTECTIVE, WE WILL ALSO HAVE TO CHOOSE ALTERNATIVES
FOR THE GROUNDWATER.
THEREFORE, AS A RESULT OF HAVING TO ADDRESS
BOTH UNACCEPTABLE RISKS THAT ARE GENERATED AS A
RESULT OF CONTAMINATION OF SOIL AND GROUNDWATER, EPA
PREFERRED REMEDY IS AS FOLLOWS: TO CONDUCT ROUTINE
GROUNDWATER MONITORING AT THE SITE TO ENSURE THE
EFFECTIVENESS OF THE INTEGRITY IS IN PLACE AND
ONGOING. IN ADDITION TO THAT, THE EPA' S PREFERRED
ALTERNATIVE INCLUDES INSTITUTIONAL CONTROLS, WHICH
WILL RESTRICT THE USE OF THE SITE.
AGAIN, AS WE STATED EARLIER, THIS PARTICULAR
SITE IS LOCATED IN THE AIRPORT ENVIRONS ORDINANCE.
IT IS AN ORDINANCE THAT HAS BEEN IN PLACE THAT
BASICALLY PROHIBITS ANY FUTURE RESIDENTIAL
DEVELOPMENT. HOWEVER, THE PROPERTY CAN BE USED FOR
COMMERCIAL AND INDUSTRIAL DEVELOPMENT. AND AGAIN,
AS PART OF OUR INSTITUTIONAL CONTROLS, THERE'S A
POSSIBILITY THAT WE COULD PUT DEEPER RESTRICTIONS IN
PLACE TO ENSURE THAT SHOULD THAT ZONING CHANGE, THAT
THE FUTURE LAND USE WOULD REMAIN INDUSTRIAL OR
COMMERCIAL.
IN ADDITION TO THAT, FOR SOILS OUR PREFERRED

0390
i
i2
3
4
5
6
7
8
9
10
11
12
13
14
15
16
17
18
19
20
21
22
23
24
25
32
ALTERNATIVE IS SITE CAPPING, THIS PARTICULAR SITE
USING BOTH THE COMBINATION OF THE RCRA SUBTITLE C
CAP AND THE RCRA SUBTITLE D CAP. BUT IN ADDITION TO
THAT, IN ORDER TO ADDRESS THE VOC CONTAMINATION, THE
VOLATILE ORGANIC COMPOUNDS THAT ARE IN THE SURFACE
SOIL, WE ARE ALSO SUGGESTING THAT WE ALSO ADD WHAT
WE CALL A SOIL VAPOR EXTRACTION SYSTEM. AGAIN, THAT
IS TO BASICALLY ADDRESS THE SOIL IN THE LANDFILL
AREA.
AND OF COURSE IN ADDITION TO THAT, FOR
GROUNDWATER, AS STATED EARLIER, WE ARE TALKING ABOUT
CHEMICAL INJECTION INTO THE GROUNDWATER. AND AGAIN,
THIS IS HOPEFULLY TO ENHANCE THE OVERALL
BIODEGRADATION OF RESIDUAL VOCs IN GROUNDWATER.
THIS REMEDY IN ITS ENTIRETY, TO CAP THE
LANDFILL,SHOULD TAKE US APPROXIMATELY 18 MONTHS. TO
ADDRESS THE GROUNDWATER, THAT SHOULD TAKE ANYWHERE
FROM THREE TO FIVE YEARS. AGAIN, AS STATED, AT THIS
PARTICULAR SITE WE ARE LOOKING AS OUR PREFERRED
REMEDY AT INSTITUTIONAL CONTROLS AND MONITORING,
SITE CAPPING AND IN-SITU SOIL TREATMENT -- AGAIN,
THAT'S TO ADDRESS THE SOILS IN PLACE WHERE THEY ARE
-- AND CHEMICAL INJECTION. THE TOTAL COST TO
IMPLEMENT THIS REMEDY IS $4,673,000.
I'M NOT REALLY FOR CERTAIN IF EVERYONE CAN SEE

0391
2
3
4
5
6
"7
8
9
10
11
12
13
14
15
16
17
18
19
20
21
22
23
24
25
33
-THIS PARTICULAR SLIDE, BUT THE AREAS THAT ARE
HIGHLIGHTED IN ORANGE ARE ALL THE AREAS WHERE WE
HAVE GROUNDWATER -- WHERE WE DETECTED GROUNDWATER AT
'1LEVELS THAT WERE ABOVE SAFE DRINKING WATER STANDARDS
-- OVER THE AREAS WHERE THAT WILL RECEIVE TREATMENT
FOR GROUNDWATER.
THE AREAS HIGHLIGHTED IN YELLOW ARE THE AREAS
WHERE A RCRA SUBTITLE D CAP, IN OTHER WORDS SIMILAR
TO WHAT YOU WOULD SEE AT A MUNICIPAL LANDFILL.
THAT'S THE PARTICULAR AREA WHERE THE RCRA SUBTITLE
TYPE D CAP WILL BE PLACED. AND IN THIS DARK BLUE
AREA THAT IS LOCATED HERE, THAT IS AN AREA WHERE WE
DID SEE THE HIGH LEVEL CONCENTRATION OF
CONTAMINANTS. AND THAT IS THE AREA WHERE WE ARE
WANTING TO BE MORE CONSERVATIVE. AND OUR PREFERRED
ALTERNATIVE IS TO PLACE A CAP THAT IS SIMILAR TO
WHAT YOU WOULD SEE AT A HAZARDOUS WASTE FACILITY.
ONE OTHER THING I WANT TO MENTION HERE IS YOU
SEE THESE AREAS THAT ARE HIGHLIGHTED IN GREY. THOSE
ARE ACTUALLY CONCRETE PADS. AT THIS PARTICULAR TIME
A LOT OF THE BUILDINGS ARE STILL IN PLACE ON THIS
PARTICULAR SITE. IN ORDER FOR US -- SHOULD THIS
PREFERRED ALTERNATIVE BE SELECTED, IN ORDER FOR US
TO APPROPRIATELY ADDRESS THE SITE AND ACTUALLY
APPROPRIATELY PLACE THE CAP ON THIS PARTICULAR SITE,

1
2
3
4
5
6
7
8
9
10
11
12
13
14
15
16
17
18
19
20
21
22
23
24
25
34
A LOT OF THOSE BUILDINGS AND THE CONCRETE PADS WILL
HAVE TO BE DISMANTLED FIRST. SO WHILE YOU SEE THEM
ON THIS PARTICULAR SLIDE, ALL OF THOSE CONCRETE PADS
WILL BE DISMANTLED IN ORDER FOR US TO EFFECTIVELY
IMPLEMENT THE REMEDY. AGAIN, TO ADDRESS THIS
PARTICULAR SITE AND TO COMPLETE CONSTRUCTION AND
REALLY CLEAN UP THE SITE, WE ARE LOOKING AT A TOTAL
ESTIMATED TIME OF THREE TO FIVE YEARS.
THE FACT SHEET THAT HAS BEEN PROVIDED TO YOU
HERE TODAY OR VIA MAIL IS REALLY JUST A SUMMARY OF
ALL OF THE INFORMATION THAT HAS BEEN OBTAINED FOR
THIS PARTICULAR SITE. FOR THIS PARTICULAR SITE,
THERE IS ADMINISTRATIVE RECORD THAT IS LOCATED AT
THE MIDDLE TYGER BRANCH LIBRARY AT 170 GROCE ROAD.
AND ALTHOUGH THE HARD COPIES ARE THERE, IF YOU ARE
INTERESTED WE DO HAVE TONIGHT THE ENTIRE
ADMINISTRATIVE RECORD ON CD-ROM, AND WE COULD
PROVIDE THAT TO YOU. IN ADDITION TO THAT, WE WOULD
LIKE TO HEAR FROM YOU. AND THEREFORE, WE DO HAVE A
1-800 NUMBER. IT'S 1-800-435-9233. WE WOULD
LIKE TO HEAR FROM YOU IN REGARDS TO YOUR THOUGHTS ON
THE PREFERRED REMEDY -- THE ALTERNATIVE OR ANY OTHER
ALTERNATIVES. IN ADDITION TO THAT, IF YOU WOULD
LIKE TO BE ADDED TO THE MAILING LIST, WE WOULD LIKE
TO HEAR FROM YOU WITH ANY OTHER SUGGESTIONS THAT YOU

/-\ -7v 5
1
2
3
4
5
6
7
8
9
10
11
12
13
14
15
16
17
18
19
20
21
22
23
24
25
35
MAY HAVE. SHOULD YOU HAVE COMMENTS, EITHER WRITTEN
OR ORAL, PLEASE FEEL FREE TO CONTACT ME VIA MAIL OR
VIA PHONE OR VIA MY E-MAIL ADDRESS. AT THIS
PARTICULAR TIME, THERE IS A 30 DAY COMMENT PERIOD
THAT IS IN PLACE. HOWEVER, UPON TIMELY REQUEST THE
EPA WILL EXTEND THAT PUBLIC COMMENT PERIOD AN
ADDITIONAL 30 DAYS. I GUESS AT THIS PARTICULAR
TIME, ARE THERE ANY QUESTIONS?
MS. WOODCOCK;
YOU SAID THERE WAS A PREFERRED ---
MR. KOPOREK:
STATE YOUR NAME, PLEASE.
MS. WOODCOCK;
I'M JULIE WOODCOCK WITH THE MIDDLE TYGER TIMES.
YOU SAID THAT THERE WAS A PREFERRED -- THERE SEEMS
TO BE SOME SORT OF A CHOICE INVOLVED IN THAT. WHO'S
GOING TO MAKE THE DECISION ABOUT WHICH OF THESE
ALTERNATIVES TO USE?
MS. JONES;
BASICALLY THE EPA HAS PRESENTED THEIR PREFERRED
ALTERNATIVE. HOWEVER, EPA IN CONSULTATION WITH THE
STATE OF SOUTH CAROLINA WILL EVALUATE ANY COMMENTS
THAT ARE GENERATED BY THE PUBLIC DURING THE PUBLIC
COMMENT PERIOD AND FACTOR THOSE COMMENTS INTO THE
OVERALL DECISION AS FAR AS THE REMEDY FOR THIS SITE.

1
2
3
4
5
6
7
8
9
10
11
12
13
14
15
16
17
18
19
20
21
22
23
24
25
36
SO ALTHOUGH THIS IS THE EPA PREFERRED ALTERNATIVE,
THIS ALTERNATIVE WILL BE BASED ON STATE ACCEPTANCE
.AND COMMUNITY ACCEPTANCE.
MS. WOODCOCK;
WHAT I WAS GETTING AT IS THAT RIGHT NOW THE
STATE IS IN A BAD BUDGETARY SITUATION AND THEY HAVE
BEEN CUTTING FUNDS FOR A LOT OF STUFF. AND I WAS
TRYING TO FIGURE OUT WHO WOULD BE -- WHO WOULD PAY
FOR THIS AND HOW LIKELY IS IT NOT TO GET DONE
BECAUSE NOBODY IS WILLING TO SPRING FOR THE COST?
MS . JONES ;
THAT IS A VERY, VERY GOOD QUESTION. FIRST OF
ALL, LET ME STATE FOR THE RECORD THAT I AM NOT AN
ATTORNEY. AND I CAN PROVIDE TO YOU AFTER THE
MEETING THE LEGAL COUNSEL FOR THE AQUA-TECH SITE..
BUT, IN SUMMARY FOR THIS PARTICULAR PROJECT,
TYPICALLY EPA WILL GIVE THE POTENTIALLY RESPONSIBLE
PARTIES AN OPPORTUNITY TO ENTER INTO AN AGREEMENT
WITH EPA TO APPROPRIATELY ADDRESS THE SITE. AND
WHAT I MEAN BY ENTER INTO THE AGREEMENT IS NOT ONLY
THAT THEY WILL ADDRESS THIS PARTICULAR SITE, IT WILL
BE THAT THEY WILL ADDRESS IT UNDER THE OVERSIGHT OF
NOT ONLY EPA BUT ALSO DHEC.
MS. WOODCOCK;
AREN'T SOME OF THOSE PEOPLE, LIKE, BANKRUPT? I

n 7 o t:••.j -J ; D
1
2
3
4
5
6
7
8
9
10
11
12
13
14
15
16
17
18
19
20
21
22
23
24
25
37
MEAN, AREN'T THEY GONE? SO ARE WE GOING TO WAIT
ANOTHER DECADE BEFORE THIS GETS CLEANED UP?
MS . JONES :
AT THIS PARTICULAR TIME OUR PLANS ARE TO START
NEGOTIATIONS ONCE A REMEDY HAS BEEN SELECTED FOR
THIS PARTICULAR SITE. AND ACTUALLY, YOU'VE BROUGHT
UP A VERY, VERY GOOD QUESTION AND ONE THING THAT I
' SHOULD HAVE PROBABLY TOUCHED BASE ON.
THE OVERALL PROCESS OF THIS SITE AS FAR AS
WHERE WE GO FROM HERE IS AS FOLLOWS: ONCE THE
PUBLIC COMMENT CLOSES -- AND I BELIEVE AT THIS
PARTICULAR TIME IT IS AUGUST 25, 2003, -- SHOULD EPA
NOT RECEIVE AN EXTENSION FOR AN ADDITIONAL 30 DAYS,
THEN AT THAT PARTICULAR TIME, EPA WILL MOVE TOWARD
ISSUING A RECORD OF DECISION FOR THIS PARTICULAR
SITE., A RECORD OF DECISION OF THE SITE IS. A
DOCUMENT THAT DOCUMENTS EPA' S DECISION AS FAR AS THE
TYPE OF REMEDY, OR PREFERRED REMEDY THAT WILL BE
IMPLEMENTED AT THE SITE.
, ONCE THAT IS IN PLACE, EPA WILL HAVE THE
OPPORTUNITY TO ENTER INTO A NEGOTIATION PERIOD WITH
THE POTENTIALLY RESPONSIBLE PARTIES. THAT PARTICULAR
PROCESS CAN TAKE AT LEAST 120 DAYS. AGAIN, THAT IS
A LEGAL PROCESS. IT CAN BE LONGER. IT COULD BE
SHORTER. BUT, IT CAN TAKE AT LEAST 120 DAYS. ONCE
••". v C; f.'., o y U
2
3
•4
5
6
7
8
9
10
11
12
13
14
15
16
17
18
19
20
21
22
23
24
25
38
AN AGREEMENT HAS BEEN ISSUED, SHOULD NEGOTIATIONS
END IN AN AGREEMENT THAT IS APPROVABLE TO EPA --
ONCE THAT TAKES PLACE, THEN THE EPA IN CONJUNCTION
WITH THE POTENTIALLY RESPONSIBLE PARTIES AND DHEC,
WE WILL START WORKING ON WHAT WE CALL A REMEDIAL
DESIGN.
A REMEDIAL DESIGN IS VERY, VERY SIMILAR TO WHAT
YOU WOULD SEE BEFORE YOU START ANY. TYPE OF
CONSTRUCTION. NOT TO CHANGE THE TOPIC, BUT
TYPICALLY BEFORE YOU CONSTRUCT A HOME, USUALLY THERE
IS SOME TYPE OF BLUEPRINT THAT MAY BE IN PLACE THAT
MAY SPECIFY -- SAY, SPECIFICATIONS AS TO WHAT IS
GOING TO BE BUILT FOR THAT PARTICULAR HOME.
SOMETHING VERY, VERY SIMILAR PROCESS-WISE, NOT
EXACTLY, BUT SOMETHING VERY, VERY SIMILAR TO THAT
WILL HAVE' TO TAKE PLACE HERE. SO, ALTHOUGH WE'RE
STATING OUR PREFERRED ALTERNATIVE IS TO CAP THE SITE
AND TO ADDRESS THE GROUNDWATER, THERE WILL HAVE TO
BE A DESIGN THAT CAN PROBABLY BE DONE IN AS EARLY AS
SIX MONTHS. BUT, TYPICALLY THEY TAKE ANYWHERE FROM
EIGHT MONTHS TO A YEAR. AND THAT HAS TO GO THROUGH
PEER REVIEW BY NOT. ONLY EPA BUT ALSO DHEC.
FOR THIS PARTICULAR SITE, WE ARE AWARE THAT THE
PROCESS IS TAKING A VERY LONG TIME, SO WE ARE TRYING
TO PUT IN PLACE HOPEFULLY VARIOUS THINGS THAT COULD

0397
2
3'
4
5
-- B-
"7
8
9
10
11
12
13
14
15
16
17
18
19
20
21
22
23
24
25
39
HELP US MOVE THROUGH THIS PROCESS A LITTLE MORE
EFFICIENTLY. ONCE THAT. DESIGN HAS BEEN COMPLETE AN
ACTUAL CONSTRUCTION AT THE SITE CAN TAKE PLACE. SO
THEREFORE, JUST SUMMARIZING A LITTLE BIT ABOUT WHAT
I JUST STATED, WE ARE PROBABLY LOOKING AT ACTUAL
CONSTRUCTION FOR THIS SITE PROBABLY NOT TAKING PLACE
BEFORE -- AGAIN, IT COULD OCCUR EARLIER -- BUT,
PROBABLY NOT TAKING PLACE BEFORE THE FALL OF 2004.
AND WHEN I SAY "CONSTRUCTION," THAT'S THE
ACTUAL LITERALLY GOING OUT TO THE SITE, MOVING SOIL,
ADDRESSING THE GROUNDWATER. AND WHEN I SAY "MOVING
THE SOIL," CAPPING, REGRADING, PUTTING INSTITUTIONAL
CONTROLS IN PLACE. USUALLY ONCE WE GET TO THAT
POINT, EVERYTHING GOES VERY FAST. ACTUALLY, ONCE A
DECISION HAS BEEN SELECTED AT A SITE, THE PROGRESS
OF THE SITE USUALLY GOES BY A LOT FASTER. DID I
ANSWER YOUR QUESTION?
MS. WOODCOCK;
WELL, YOU KNOW, I'M — MY ISSUE OR THE KIND OF
QUESTION THAT I'M TRYING TO GET AT IS, ARE THESE
PRPs GOING TO PROCEED TO DRAG THIS WHOLE ISSUE TO
COURT AND KEEP IT THERE FOR FOUR OR FIVE YEARS, YOU
KNOW, IN WHICH CASE, YOU KNOW. . .
MS. JONES:
THAT IS A VERY GOOD QUESTION. AGAIN, I AM NOT

3^;8
1
2
3
4
5
6
7
8
9
10
11
12
13
14
15
16
17
18
19
20
21
22
23
24
25
40
AN ATTORNEY. BUT I CAN TELL YOU THAT TO DATE THE
PRPs HAVE BEEN PRETTY COOPERATIVE. AT THIS
PARTICULAR TIME WE ANTICIPATE THAT THE PRPs WILL BE
COOPERATIVE IN THE FUTURE. THAT IS A VERY, VERY
GOOD QUESTION. WE ARE TALKING ABOUT $4.6 MILLION.
AND AGAIN, I DO UNDERSTAND THAT THERE IS A CONCERN
AS TO WHO COULD POTENTIALLY HAVE TO PAY FOR THE
CLEANUP, AND IS THERE FUNDING. TO ADDRESS THE
CONTAMINATION AT THE SITE.
MS. LUNDEEN;
' PRPs ARE WHAT?
MS . JONES ;
I'M SORRY. POTENTIALLY RESPONSIBLE PARTIES.
AND I HAVE TO SAY POTENTIALLY RESPONSIBLE PARTIES.
AGAIN, I AM NOT AN ATTORNEY. I KNOW I'M PROBABLY.
SAYING THAT A LOT. BUT, THE EPA -- SORRY ABOUT
THAT.
MS. LUNDEEN:
MY NAME IS NAN LUNDEEN.
MS . JONES ;
BASICALLY AT A SITE, THE EPA BASICALLY HAS FOUR
CATEGORIES FOR A POTENTIALLY RESPONSIBLE PRP .
AGAIN, I AM NOT AN ATTORNEY. BASICALLY SOMEONE IS
POTENTIALLY RESPONSIBLE IF THEY WERE A TRANSPORTER,
OR A GENERATOR, OR A PROPERTY OWNER, OR I GUESS YOU

P: "f G Q
1
2
3
4
5
6
7
8
9
10
11
12
13
14
15
16
17
18
19
20
21
22
23
24
25
41
WOULD SAY A FACILITY OPERATOR. I SHOULD NOT SAY,
"GUESS YOU WOULD SAY." I AM SAYING A FACILITY
OPERATOR. AND AGAIN, IT'S POTENTIALLY RESPONSIBLE
PARTY. WE'RE NOT ACTUALLY SAYING THAT THEY ARE
RESPONSIBLE. WE'RE SAYING THEY ARE A POTENTIALLY
RESPONSIBLE PARTY.
MS. LUNDEEN;
NAN LUNDEEN. GREENVILLE. NEWS . WOULD YOUR PRPs
INCLUDE THE CITY OF GREER?
MS . JONES ;
AT THIS PARTICULAR TIME, I WOULD LIKE TO DEFER
THAT QUESTION TO THE ATTORNEY FOR THIS PARTICULAR
SITE. HER NAME IS ELISA ROBERTS. AND ACTUALLY IF
YOU CONTACT THE 1-800 NUMBER THAT WAS PREVIOUSLY
DISPLAYED, THEY CAN TRANSFER YOU DIRECTLY TO THE
LEGAL COUNSEL FOR THIS SITE.
MS. WOODCOCK;
DIDN'T YOU SAY THERE WERE, LIKE, 90 OF THESE
PRPs AT ONE POINT? WHEN YOU START TALKING ABOUT --
YOU KNOW, THIS WAS A HAZARDOUS WASTE -- YOU KNOW,
THESE -- AND LANDFILL FOLK. SO THERE WERE, YOU
KNOW, HUGE NUMBERS OF PEOPLE THAT WERE SENDING STUFF
TO THIS SITE, YOU KNOW. SO, Y'ALL HAVE GOT A LIST
OF. PEOPLE THAT YOU HAVE NARROWED IT DOWN TO?
MS. JONES;

1
2
3
4
5
6
7
8
9
10
11
12
13
14
15
16
17
18
19
20
21
22
23
24
25
42
ACTUALLY, YOU HAVE A VERY, VERY GOOD QUESTION
ALSO. AND AGAIN, I PROBABLY NEED TO CLARIFY. THE
APPROXIMATELY 90 POTENTIALLY RESPONSIBLE PARTIES WHO
YOU NOTICED ON THE SLIDE, THOSE ARE THE PARTIES WHO
BASICALLY ENTERED INTO AN ADMINISTRATIVE ORDER AND
CONSENTED WITH EPA TO CONDUCT A REMEDIAL
INVESTIGATION/FEASIBILITY STUDY AT THE SITE.
THERE ARE OTHER POTENTIALLY RESPONSIBLE
PARTIES, AND THEY ARE IN WHAT WE WOULD CALL VARIOUS
CATEGORIES AS I STATED EARLIER. HOWEVER,
APPROXIMATELY 90 POTENTIALLY RESPONSIBLE PARTIES
ENTERED INTO AN AGREEMENT WITH EPA TO CONDUCT THE
REMEDIAL INVESTIGATION/FEASIBILITY STUDY AT THE
SITE. AND AGAIN, I NEED TO CLARIFY THAT I WAS NOT
SAYING THAT THERE ARE ONLY 90 POTENTIALLY
RESPONSIBLE PARTIES FOR THIS PARTICULAR SITE. DID I
ANSWER- YOUR QUESTION? I'M SORRY. DID I ANSWER YOUR
QUESTION?
MS. WOODCOCK;
YEAH.
MS . JONES ;
OKAY.
MS. WOODCOCK;
HAVE Y'ALL DONE ANY GAS REMEDIATION FOR --
YOU'VE GOT A LANDFILL THERE, SO YOU'VE GOT ROTTING
_f •; u
1
2
3
4
5
6
7
8
9
10
11
12
13
14
15
16
17
18
19
20
21
22
23
24
25
43
STUFF. HAVE YOU DONE ANYTHING ABOUT THE METHANE, OR
IS THAT A PROBLEM?
MS. JONES;
AT THIS PARTICULAR SITE IN COMPARISON TO
SEVERAL OF THE SOUTH CAROLINA STANDARDS, WE DO NOT
HAVE AN UNACCEPTABLE RISK TO THE METHANE GAS AT THIS
PARTICULAR SITE.
MS. LUNDEEN:
NAN LUNDEEN. CAN YOU TELL US JUST A LITTLE BIT
MORE FOR THE LAYPERSON TO UNDERSTAND THIS CHEMICAL
INJECTION? IS IT COMMONLY USED, AND HOW DOES IT
WORK IN LAY TERMS?t
MS. JONES;
I THINK PROBABLY THE FIRST THING IS -- IN LAY'?/ TERMS. VERY, VERY LAY. HOW'S THAT? BASICALLY WHAT
WE'RE DOING IT WE WOULD BE PROVIDING A CATALYST.
THERE'S ALREADY CURRENTLY ONGOING BIOLOGICAL
DEGRADATION OR THE BREAKDOWN OF A LOT OF THE
CONSTITUENTS THAT ARE OUT THERE, THAT ARE IN THE
GROUNDWATER. NOW, I HAVE TO AGAIN CLARIFY THAT
WHILE THAT MAY BE OCCURRING, WE DO NOT BELIEVE THAT
IT IS OCCURRING AT A RATE THAT WOULD HELP US
EFFECTIVELY ADDRESS THE GROUNDWATER IN A SHORT
AMOUNT OF TIME.
BASICALLY WHAT WE WOULD BE INJECTING -- AND
r 9
i2
3
4
5
6
7
8
9
10
11
12
13
14
15
16
17
18
19
20
21
22
23
24
25
44
AGAIN, THIS IS SOMETHING IN LAYMAN'S TERMS. IT'S
SOMETHING VERY SIMILAR TO, LITERALLY, MOLASSES, SAY,
FOR INSTANCE.' AND I'M JUST HYPOTHETICALLY STATING
THAT. ONE OF THE THINGS THAT WE WILL DO DURING OUR
REMEDIAL DESIGN IS WE WILL LOOK AT SEVERAL DELIVERY
SYSTEMS, IN OTHER WORDS, SEVERAL DIFFERENT
SUBSTANCES. SOME WILL WORK BETTER THAN OTHERS, THAT
WE CAN BASICALLY USE FOR THE TREATMENT OF
GROUNDWATER.
BUT, SAY FOR INSTANCE IF WE DID USE SOMETHING
VERY, VERY SIMILAR TO MOLASSES, ONCE THAT IS
ACTUALLY INJECTED -- AGAIN, THIS SORT OF SERVES AS A
MEDIUM OR, IS IT SAFE TO SAY FOOD? THAT'S A GOOD
WAY OF LOOKING AT IT. IT SORT OF SERVES AS FOOD FOR
YOUR BIOLOGICAL ORGANISMS. IT'S SORT OF LIKE THIS,
THE MORE YOU FEED THEM, THE MORE THEY'LL EAT AND
BREAK DOWN THOSE VOLATILE ORGANIC COMPOUNDS.
I'M NOT REALLY SURE IF I ADDRESSED YOUR
QUESTION. BUT THAT'S WHAT WE ARE DOING. WE'RE
BASICALLY GIVING THE BIOLOGICAL ORGANISMS SOMETHING
TO HELP THEM REPRODUCE MORE, EAT MORE QUICKLY OR
FASTER, SO THAT THEY CAN QUICKLY BREAK DOWN THE
CONCENTRATIONS OF THE CONTAMINANTS THAT WE SEE IN
THE GROUNDWATER.
MS. WOODCOCK;
9• -»• •• J o
45
1 DO YOU MEAN LITERALLY MOLASSES? THAT'S NOT A
2 METAPHOR? I MEAN, YOU SAID SOMETHING LITERALLY
3 SIMILAR TO MOLASSES ---
4 MS. JONES;
5 CORRECT. THANK YOU FOR CLARIFYING THAT. NOT
6 NECESSARILY MOLASSES, BUT SOMETHING THAT'S VERY,
7 VERY SIMILAR TO THAT.
8 MS . LTJNDEEN;
9 SO, YOU'RE NOT FEEDING CHEMICALS. YOU'RE
10 FEEDING DOWN THE NATURAL ELEMENTS IN THE GROUNDWATER
11 THAT EAT THE CHEMICAL?
12 MS. JONES:
13 CORRECT. ANY MORE QUESTIONS. I THINK THAT FOR
14 THOSE OF YOU WHO TALKED TO ME ON THE PHONE, YOU KNOW
15 THAT I'M VERY LONG WINDED. AND AS A RESULT OF THAT
16 " I PROBABLY GET OFF THE ACTUAL QUESTION THAT YOU'RE
17 ASKING ME. SO, IF I DID NOT ADDRESS YOUR QUESTION,
18 PLEASE FEEL FREE TO INFORM ME AND I'LL ATTEMPT TO DO
19 SO. I'LL ATTEMPT TO STAY ON PATHWAY AND DO SO.
20 MS. WOODCOCK;
21 I KEEP HARPING ON THIS. HOW SURE ARE WE THAT
22 THIS IS GOING TO GET CLEANED UP?
23 MS. JONES;
24 I FEEL VERY, VERY CONFIDENT. AND I GUESS IF I
25 HAD TO RATE IT ON A SCALE OF ONE TO TEN -- I THINK

r:vj G;O
2
3
4
5
6
7
8
9
10
11
12
13
14
15
16
17
18
19
46
YOUR CONCERN IS IN REGARDS TO FUNDING. ON A SCALE
OF ONE TO TEN, I FEEL VERY, VERY CONFIDENT AND I
WOULD SAY PROBABLY A 9.5, 9.6. ARE THERE ANY MORE
QUESTIONS?
AGAIN, WE'D LIKE TO ENCOURAGE EVERYONE^ HERE
TONIGHT AND ANYONE ELSE THAT YOU KNOW, IF THEY ARE
INTERESTED IN BEING PLACED ON THE MAILING LIST, OR
IF THEY ARE INTERESTED IN EITHER REVIEWING THE
INFORMATION THAT WE HAVE OBTAINED FROM THIS
PARTICULAR SITE, IN-DEPTH INFORMATION, PLEASE FEEL
FREE TO VISIT YOUR LOCAL LIBRARY. ACTUALLY, IT WAS
STATED AT THE MIDDLE TYGER BRANCH LIBRARY. AND/OR
WE CAN PROVIDE YOU OR ANYONE ELSE A COPY OF THE CD-
ROM, WHICH ALSO IS THE ENTIRE ADMINISTRATIVE RECORD
FOR YOUR PERSONAL USE.
MS. DEROKEY;
WE THANK EVERYONE FOR COMING.
MS. JONES;
THANK YOU.

1234567
8
9
10
11
12
13
14
15
16
17
18
19
20
21
22
23
24
25
26
27
47
STATE OF SOUTH CAROLINA
COUNTY OF SPARTANBURGCERTIFICATE
I, SUSAN M. WILSON, VERBATIM REPORTER AND
NOTARY PUBLIC, DO HEREBY CERTIFY THAT THE FOREGOING
HEARING WAS TAKEN AND TRANSCRIBED BY ME AND THAT THE
FOREGOING THIRTY-EIGHT (Vfe) PAGES CONSTITUTE A VERBATIM
TRANSCRIPTION OF THE PROCEEDING CONDUCTED HEREIN.
I DO FURTHER CERTIFY THAT I AM NOT OF COUNSEL
FOR OR IN THE EMPLOYMENT OF ANY OF THE PARTIES TO THIS
ACTION, NOR DO I HAVE ANY INTEREST, FINANCIAL OR
OTHERWISE, IN THE RESULT THEREOF.
IN WITNESS WHEREOF, I HAVE HEREUNTO SUBSCRIBED
MY NAME, THIS 8TH DAY OF AUGUST, 2003.
SUSAN M. WILSON, N.P.i
VERBATIM REPORTER
MY COMMISSION EXPIRES:
JUNE 4, 2013
PLEASE NOTE THAT UNLESS OTHERWISE SPECIFICALLY REQUESTED
IN WRITING, THE TAPE FOR THIS TRANSCRIPT WILL BE RETAINED
FOR THIRTY DAYS FROM THE DATE OF THIS CERTIFICATE.

APPENDIX E
PROPOSED PLAN FACT SHEET

July 2 003
SUPERFUND PROPOSED PLANAqua-Tech Environmental Site
Greer, Spartanburg County, South Carolina
EPA Region 4 Fact Sheet
EPA ANNOUNCES PROPOSED ACTION
The Region 4 Office of the United StatesEnvironmental Protection Agency (EPA) hasdeveloped this Proposed Plan to inform citizens andlocal officials of the Preferred Alternative forcleaning up contaminated soil and ground water atthe Aqua-Tech Environmental Site and the rationalefor this preference. In addition, this Plan includessummaries of other cleanup alternatives evaluated foruse at this site.
EPA, the lead agency for site activities, and the SouthCarolina Department of Health & EnvironmentalControl (SCDHEC), will select a final remedy for thesite after reviewing and considering all informationsubmitted during the 30-day public comment period.EPA, in consultation with SCDHEC, may modify thePreferred Alternative or select another responseaction presented in this Plan based on newinformation or public comments. Therefore, thepublic is encouraged to review and comment on allthe alternatives prssented in this Proposed Plan.
EPA is issuing this Proposed Plan as part of its publicparticipation responsibilities under Section 117(A) ofthe Comprehensive Environmental Response,Compensation, and Liability Act (CERCLA) of1980, as amended by the Superfund Amendmentsand Reauthorizzition Act (SARA) of 1986, andSection 300.430(0(2) of the National Oil andHazardous Substances Pollution Contingency Plan(NCP). This Proposed Plan summarizes informationthat can be found in greater detail in the RemedialInvestigation/Feasibility Study (RI/FS) reports andother technical documents in the AdministrativeRecord file for this site. This plan summarizes key
information from the Administrative Record. EPAand SCDHEC encourage the public to review thesedocuments to gain a more comprehensiveunderstanding of the site and Superfund activities thathave been conducted at the site.
For more information regarding the AdministrativeRecord for the Aqua-Tech Environmental Site, referto the information repositories listed on page 17.
Terms that appear in bold throughout the text aredefined in the glossary at the end of this publication.
IMPORTANT DATES
EPA's Proposed Cleanup PlanPublic Comment Period:
July 27, 2003 - Aug 25, 2003
Availability SessionTuesday, August 5, 2003
4:00 p.m. - 6:00 p.m.Middle Tyger Community Center
84 Groce Road, Lyman, SC
Public MeetingTuesday, August 5, 2003
the meeting will begin at 7:00 p.m.Middle Tyger Community Center
84 Groce Road, Lyman, SC

(!u
SITE BACKGROUND
The Aqua-Tech Environmental Site (the "Site") islocated on Robinson Road near its intersection withSouth Carolina Highway 290, approximately 3 mileseast of the City of Greer and approximately 1 milewest of the City of Duncan, South Carolina (reier toFigure 1 atthe end of this publication).
The Site .consists of 61.56 acres of land. A formerResource Conservation and Recovery Act (RCRA)hazardous waste treatment and storage facility waslocated on approximately 20 acres of the Site. Aclosed municipal solid waste landfill (MSWL) ispresent on approximately 10 acres within this 2C-acrearea.The primary operating areas that comprise theRCRA Facility and the closed MSWL are illustratedon Figure 2.
The Site is presently abandoned and the landsurrounding the Site is generally wooded, with theclosest residences Located approximately 650 feet tothe east. There an: several small businesses to thenorth of the Site on SC Highway 290. An autosalvage dealer (junkyard) previously was locatedimmediately north of the Site. Automobile's and othermaterials stored in i:hejunkyard were removed by thatproperty owner. The area west of the Site is formerfarmland. The area south of the Site is wooded andcontains a sanitary sewer Iinl5. The nearest surfacewater body is Maple Creek, which is located on thesouthern boundary of the facility. Maple Creek flowsto the east into the South Tyger River which isapproximately 3000 feet downstream of the Site.
/The Site is zoned as commercial/industrial and islocated within the "Airport Environs Area" asdefined by the Greenville - Spartanburg AirportEnvirons Area zoning Ordinance, dated March 29,1996. This zoning ordinance precludes futureresidential development use of the Site. There areseveral residences to the east of the Site on RobinsonRoad and to the north of the Site on SC Highway 290.There are several residential neighborhoodsconsisting of a few houses each within a 1-mileradius of the Site.
SITE HISTORYXPREVIOUS INVESTIGATIONS
Prior to the 1940's, activities at the Site are unknown.The Site was used for waste management activities asearly as the 1940's when local residents used theproperty for general dumping. It is unknown whoowned the Site before the J950's or 1960's when theCity of Greer purchased 35 acres of land. From 1963until 1968, the City operated an MSWL coveringapproximately 10 acres of the Site. The MSWL wassubsequently closed and capped with clay in the early1970's.
In December 1974, Groce Laboratories, Incorporated(GLI) purchased the 35 acres from the City of Greerand began operating a hazardous waste treatment,storage, and reclamation facility over the MSWLarea. From the mid-I970's unti l 1987, site operationsconsisted of hazardous waste treatment, recycling,reclamation and storage activities. Aqua-TechEnvironmental, Inc. (Aqua-Tech) purchased theoperations in April 1987 and continued to accept,store, and treat most hazardous wastes as well as avariety of other solid wastes. These wastes includedexplosives, laboratory pack materials, cyanides, waterreactives, oxidizers, acids and bases, fuels and gascylinders. Most of the waste arrived at the Site indrums or other containers, although some materialsarrived by bulk tank truck. Both GLI and Aqua-Techwere regulated by RCRA.
On September 4, 1991, after several complaints,RCRA violations and on-site accidents, Aqua-Techwas ordered closed by SCDHEC due to the largevolume of improperly stored hazardous waste and theimminent threat to public health. Upon closing Aqua-Tech, SCDHEC and EPA personnel discoveredapproximately 7,000 drums and lab packs, 97above-ground tanks, 1,200 gas cylinders (somecontaining phosgene and other toxic gases),unexploded ordinance material, and small amounts oflow-level radioactive material and biohazard materialat the Site. Many of the drums, tanks, and cylinderswere deteriorating, leaking and improperly stored.Prior to emergency stabilization activities, severalinvestigations indicated significant contaminationthroughout the site including soils, drainage ditches,

surface water and ground water. The primarycontaminants included metals (cadmium, chromium,cobalt, lead, mercury, nickel, and zinc), variousvolatile organic compounds(VOCs), and semi-volatile organic compounds (SVOCs). FromSeptember 1991 to January 1992, SCDHECconducted emergency stabilization activities. OnApril 24, 1992, EPA issued a UnilateralAdministrative Order to more than 90 potentiallyresponsible parties (PRPs) requiring that theyconduct necessary removal actions to "abate animminent and substantial endangerment to the publichealth, welfare, or the environment that may bepresented by the actual or threatened release ofhazardous substances from the Site." On May 4,1992, the PRPs assumed responsibility for the Site toproperly manage and dispose of materials stillremaining at the Site. During the removal action,treatment took place, as well as removing materialsfrom the Site for disposal. The removal action wascompleted on November 9, 1993. On August 23,1994, EPA proposed the Site for inclusion on theNational Priorities List (NPL). Subsequently, theSite was listed on the NPL on December 16, 19.94.
Although the removal of drums, cylinders and solidand liquid wastes reduced the potential for exposureto contaminated materials at the Site, additionalinvestigation was required to farther characterize theSite. On September 26, 199/, the Aqua-Tech PRPGroup (PRP Group) signed an AdministrativeOrder of Consent (AOC) with EPA agreeing to fullyf u n d a n d c o n d u c t a R e m e d i a lInvestigation/Feasibility Study (RI/FS) at the Site.The purpose of the RI/FS was to assess the nature andextent of soil a:nd grouridwater contamination;evaluate the potential risks to human health and theenvironment from site environmental media, andevaluate cleanup alternatives based on the potentialimpacts at the Site.
SUMMARY OF SITE CHARACTERISTICS
Due to access and enforcement issues, field samplingactivities did not begin until May 1998. The RI/FSfield work was conducted intermittently from May1998 to December 2001 with oversight by EPA andSCDHEC. During the RI/FS field work,
approximately 300 samples (groundwater, soil,surface water, sediment and landfill gas) werecollected to characterize the Site (Figure 3).
Based on the data collected during the RI, the twopotential contaminant sources currently on the Siteare: the closed MSWL and soils impacted by theformer Aqua-Tech operations.
The area of the closed MSWL is approximately 10.1acres and the estimated volume of waste does notexceed 320,000 cubic yards. Based on the landfillgas samples, not all of this volume containsputrescible waste. The water table beneath the Siteappears to intersect the waste. VOCs detected inlandfill gas samples indicate the closed MSWLcontains hazardous constituents mixed withmunicipal waste. Therefore, given thesecharacteristics, the closed MSWL is and willcontinue to be a source of landfill gas andgroundwater contamination over the long term.
The soil data collected during the various phases ofthe RI and following the removal action haveindicated a limited number of areas with exceedancesof health-based standards. The primary chemicals ofconcern (COCs) in surface soil are Lead andMercury. The Primary COCs in subsurface soils arePCB 1242, Thallium and Trichloroethene. Most ofthese are located within the limits of the closedMSWL. A quali tat ive assessment of thecontaminants fromon-Site soils identified three areasof impact (501, 601-02 and the Process DistillationArea) where residual soil contamination represents apotential on-going source of groundwater degradation(Figure 2). The Process Distillation Area is the onlyarea where contaminants extended through the soilcolumn, to groundwater. Based on thesecharacteristics, the limited impacted soil remainingon Site appears to be a secondary source of potentialcontamination.
The closed MSWL and the former Aqua-Techoperations have impacted surface soil, groundwater,and sediment in the east drainage ditch(Sedimentation Basin Area). However, the Siteactivities have not significantly impacted the surfacewater or sediment in Maple Creek.

n n
Groundwater impact has occurred at the Site. Theprimary COCs in the groundwater are 1,1,2,2 -Tetrachloroethane, 1,1- Dichloroethene, Benzene, cis-1,2-Dichloroe thene , Te t r ach lo roe thene ,Trichloroethene and Vinyl Chloride. The availabledata indicate that £!ite related contaminants have notmigrated south of Maple Creek.
Contaminant Fate and Transport
The evaluation of all available Site data identifiedfour potentially significant migration pathways:landfill gas emissions to ambient air; leaching ofcontaminants from soil to groundwater; migration ofgroundwater to surface water; and, vapor transportfrom groundwater <:o indoor air.
• A landfill gas assessment was conducted toestimate maximum landfill gas emission rates andexposure point concentrations. Comparison ofthe predicted maximum emission rates to SouthCarolina's de minimis emission criteria showedthat only benzene and vinyl chloride exceededthe criteria. Based on the results of the airdispersion mode), the resulting 24 hour averageconcentrations are below South CarolinaMaximum Ambient Air Concentrations(MAACs). Therefore, landfill gas emissions donot pose a significant risk to on-Site or off-Sitereceptors.
• A qualitative assessment of the potential forleaching of contaminants from soil togroundwater identified a limited potential forgroundwater impact. Residual soil primarilycontaminated with VOCs is generally limited tothe upper 4 feel of the soil horizon.
• The evaluation, of groundwater migration tosurface water has shown that the closure of thelandfill, and the Removal Action has resulted inthe general decline of contaminant concentrationsin the groundwater across the Site. Groundwaterdischarges to Maple Creek over most of the Site.However, this discharge of groundwater toMaple Creek has not resulted in an unacceptableimpact on the surface water quality and is notexpected to impact surface water quality.
• An evaluation of the potential migration of VOCvapors from the groundwater to indoor air wasundertaken for the former Administration Area.This evaluation used the an air modelingprogram, and assumed conservatively futureresidential development even though suchdevelopment is currently prohibited at the Site.The results of this evaluation indicated that thepotential vapor migration from groundwaterwould not result in an unacceptable risk.
SCOPE AND ROLE OF THE ACTION
EPA's proposed cleanup plan described in thisdocument is intended to fully address the threats tohuman health and the environment posed by theconditions at this Site. The purpose of this responseaction is to implement a site-wide strategy forpreventing or minimizing further exposure tocontaminated soils and groundwater impacted by theclosed MSWL and the former Aqua-Tech operations.This will be the final action for remediating the Siteand returning groundwater to its expected beneficialuse.
HUMAN HEALTH RISK ASSESSMENTAPPROACH
As part of the RI/FS, a Baseline Risk Assessment(BRA) was conducted to evaluate current and futureeffects of contaminants on human health and- theenvironment. Chemicals detected on-Site wereevaluated according to their potential to produceeither cancer and/or non-cancer health effects. Thecarcinogenic risk range EPA has set for Superfundcleanups to be protective of human health is 1 x IO"4
to 1 x IO"6. For example, a cancer risk of 1 x IO"4
indicates that an individual has a 1 in 10,000 or 1 in1,000,000 for 1 x 10'6 incremental chance ofdeveloping cancer as a result of site-related exposureto a carcinogen over a 70 year lifetime under thespecific exposure conditions at the site. EPAgenerally uses the cumulative benchmark risk level of1 x 10"4 for all exposures relating to a particularreceptor to trigger action for site media (soil,groundwater, etc.). In other words, a carcinogenicrisk greater than 1 x IO"4 for soil would indicate thatremedial action for soil is necessary.

r
Non-cancer exposure estimates were developed usingEPA references dose to calculate a Hazard Index(HI). A HI greater than 1 indicates that constituentsare present at concentrations that are above EPA'sacceptable dose level. CERCLA guidance indicatesthat a cancer risk of 1 x 10"6 and an HI of 1.0 shouldbe used as the point of departure when consideringacceptable risk levels for a site. EPA may basecleanup levels on a cancer risk level as high as
IxlO"4, for the Aqua-Tech Site. However, EPA isselecting cleanup levels based on a more conservativecancer risk level of IxlO"6 . Actual or threatenedreleases of hazardous substances from this Site, if notaddressed by the Preferred Alternative or one of theother active measures considered, may present acurrent or potential threat to public health, welfare, orthe environment.
WHAT IS RISK AND HOW IS IT CALCULATED?
A Superfund human health risk assessment estimates the "baseline risk." This is an estimate that the likelihood of health problems couldpotentially occur if no cleanup action were taken at a site. To estimate the baseline risk at a Superfund site, EPA undertakes a four-stepprocess:
Step I: Analyze ContaminationStep 2: Estimate ExposureStep 3: Characterize Site RiskStep 4: Summarize Site Risk
In Step 1, EPA looks at the concentrations of contaminants found at a site as well as past scientific studies on the effects thesecontaminants have had on people (or animals, when human studies are unavailable). Comparisons between site-specific concentrationsand concentrations determined to be safe based on toxicity studies helps EPA to determine which contaminants are most likely to posethe greatest threat to human health.
In Step 2, EPA considers the different ways that people might be exposed to the contaminants identified in Step 1, the concentrationsthat people might be exposed to, and the potential frequency and duration of exposure. Using this information, EPA calculates a"reasonable maximum exposure" (RME) scenario, which portrays the highest level of human exposure that could reasonably beexpected to occur.
In Step 3, EPA uses the information from Step 2 combined with information on the toxicity of each chemical to assess potential healthrisks. EPA considers two types of risk: cancer risk and non-cancer risk. The likelihood of any kind of cancer resulting from aSuperfund site is generally expressed as an upper bound probability; for example, a " 1 in 10,000 chance." In other words, for every10,000 people that could be exposed, one extra cancer may occur as a result of exposure to site contaminants. An extra cancer casemeans that one more person could get cancer than would normally be expected to from all other causes. For non-cancer health effects,EPA calculates a "hszard index." The key concept here is that a "threshold level" (measured usually as a hazard index of less than 1)exists below which non-cancer health effects are no not expected to occur.
In Step 4, EPA determines whether site risks are great enough to cause concern based on potential health problems for people at or nearthe Superfund site. Ilie results of the three previous steps are combined, evaluated and summarized. EPA adds up the potential risks
SUMMARY OF HUMAN HEALTH RISKSFROM THIS SITE:In evaluating the current land use (abandoned), theBRA considered the risks from Site contaminants ona site visitor/trespasser. This part of the BRAexamined surface soil, sediment, surface water andair as the primary sources of exposure. The exposure
pathways included dermal contact of surface soils,sediments and surface water; ingestion of surfacesoils, sediments; and surface water and inhalation ofair (landfill gas). The BRA found no unacceptablerisk for the current site visitor/trespasser scenario.
In developing the risk assessment for futureexposures, the BRA considered the future use of theSite. The Site is located within the "Airport Environs

9
Area" as defined by the Greenville - SpartanburgAirport Environs Area zoning Ordinance, datedMarch 29, 1996 which precludes residentialdevelopment of the Site. Therefore, cleanup levels forall media of concern at the Site (excludingg r o u n d w a t e r ) were based . on f u t u r ecommercial/industrial use. However, forcompleteness of th<; BRA, the BRA assessed both thefuture residential and commercial/industriaHand usescenarios. Groundwater ingestion may not be a likelyexposure pathway since groundwater at the Site is notcurrently used for consumption. However, sinceSCDHEC classifies all groundwater as a potentialsource of drinking water, the shallow groundwaterbeneath Site was conservatively assumed to be asource of drinking water.
Exposure pathway:; evaluated for the future child andadult residents; and for the future commercial,construction and irrigation workers included dermalcontact of surface soils, sediments and surface water;incidental ingestion of surface soils, sediments,surface water and groundwater; and inhalation of air(landfill gas). A summary of the findings of the BRAare as follows:
• The residential scenarios assumed that residenceswould be buili: on the Site and wells would bedrilled for drinking water purposes. The BRAfound that an unacceptable risk exists for thefuture residential scenario.
• There is no unacceptable cancer risk exists forthe future commercial v/orker scenario.
• There is an unacceptable noncancer risk for thefuture construction worker scenario.
• The is no unacceptable risk for the futureirrigation worker scenario.
• In general, the BRA found the summedcarcinogenic risk associated with exposure toingestion of groundwater and soil and dermalcontact of surface soils and inhalation of air(landfill gas) exceeds EPA's acceptable riskrange (104 tolO"6). One example, underthe futureresidential scenario, exposure primarily throughingestion of Site groundwater poses an
unacceptable estimated cancer risk of 5.0 x 10 "3
This cancer risk exceeds EPA's acceptable riskrange. Therefore, if the Site is used for residentialdevelopment, unacceptable risks would be posedto the resident.
• Furthermore, the BRA summed non-carcinogenichazard associated with exposure to ingestion ofSite groundwater and soil and dermal contact ofsurface soils and inhalation of air (landfill gas)exceeds EPA's target HI of 1. One example,under the future residential scenario, exposureprimarily through ingestion of groundwaterresults in an estimated HI of 175. This non-cancer risk exceeds the target HI of 1. Therefore,if the Site is used for residential development,unacceptable risks would be posed to thoseresidents.
• Several metals and VOCs in groundwater andsoil contribute most significantly to the overallcancer and non-cancer (HI) risks. For the air oneVOC, benzene contributes an unacceptablecancer risk. The primary contaminants ofconcern for surface soil are Iron, Lead andMercury. The primary contaminants of concernin subsurface soils are Aroclor 1242, Iron,Thallium and Trichloroethene. Most of these arelocated within the limits of the closed MSWL.The primary COCs in the groundwater are 1,1,2,2-Tetrachloroethene, 1,1-Dichloroethene,B e n z e n e , c i s - 1 , 2 - D i c h l o r o e t h e n e ,Tetrachloroethene, Trichloroethene and VinylChloride. The primary COC in air is benzene.
• Several metals were found in sediments.However, analyses performed provide strongevidence that the metal concentrations detectedin sediments, as well as soils, reflectnaturally-occurring concentrations.
ECOLOGICAL RISKS
The ecological risk assessment (ERA) performed forthe Site led to the following conclusions:
• There were no chemicals of potentialconcern(COPC) in the surface water andsediments.

o
• The maximum concentrations of several metalsin soils exceeded their conservative screeninglevels, indicating the potential for unacceptableecological risk,
REMEDIAL ACTION OBJECTIVES
The results of the BRA performed during the RIindicated that only soil and groundwater warrantremedial action as the presence of contaminants, inthese media, may present an unacceptable risk tohuman health under specific exposure scenarios.Astive-Feinetfial alternatives being considered for soiland/or groundwater will further reduce chemicalconcentrations in the ambient air, if any, attributableto the Site.
Based on the results of the RI, BRA and ERA thefollowing remedial action objectives for the Site havebeen established:
• to prevent or mitigate to the maximum extentpracticable, direct human exposure to Site soilsand/or the MSWL contents.
• to prevent exposure of human receptors tocontaminated groundwater c o n t a i n i n gcontaminant levels above State and Federalmaximum contaminant levels (MCLs)established under the Safe Drinking Water Act.
• to restore contaminated groundwater locatedoutside of the closed MSWL to drinking waterstandards and risk-based levels within areasonable time frame.
• to control migration of contaminants from theSite to surface water by eliminating contact ofstormwater runoff with MSWL contents andcontaminated surface soil; and
• to monitor the groundwater and soil in a mannerto verify the effectiveness of the remedial actions
Soil
This proposed action will reduce the human riskassociated with exposure to contaminated soil to an
excess cancer risk of IxlO"6 or (one in one million) ora hazard quotient of 1. This will be achieved byreducing the concentrations of the soil contaminantsto the following target levels:
LeadArclor 1242MercuryThalliumTrichloroethene
598 mg/kg9 mg/kg
73 mg/kg35 mg/kg54 mg/kg
Because there are no Federal or State cleanupstandards for soil contamination, EPA establishedthese targets, or Remedial Goals (RGs), based on theSite baseline risk assessment. Targets were selectedthat would both reduce the risk associated with siteworker exposure to soil contaminants to anacceptable level, and ensure minimal migration ofcontaminants into the ground water. Iron waseliminated as a contaminant of concern for soilsbecause the maximum detected concentration for Ironwas 56,300 mg/kg which was below the target levelof 137,000 mg/kg.
Groundwater
This proposed action will reduce the human riskassociated with exposure to contaminatedgroundwater. This will be achieved by reducing theconcentrations of the groundwater contaminants ofconcern to the following target levels:
1,1,2,2-Tetrachloroethane 2 ug/L1,1-Dichlorothene 7 ug/LBenzene 5 ug/Lcis-l,2-Dichloroethene 70 ug/LTetrachloroethene 5 ug/LTrichloroethene 5 ug/LVinyl Chloride 2 ug/L
The Remedial Goals or target levels for groundwatercontaminants of concern are based on the MCLestablished under the Safe Drinking Water Act orrisked-based levels.
Air
Although benzene is the primary COC for air, atarget level for benzene was not calculated since the

0 4 1 4
air itself cannot reasonably be remediated. However,all of the modeled air concentrations were less thanthe current SMAACs. Furthermore, active remedialalternatives being considered for soil and/orgroundwater wil l further reduce chemicalconcentrations in the ambient air at the Site.
SUMMARY OF REMEDIAL ALTERNATIVES
The following alternatives are grouped into threecategories which include soil/groundwateralternatives, soil alternatives, and groundwateralternatives. Remedial alternatives for the Site arepresented in the following summary table. Thealternatives are numbered to correspond with the
numbers in the FS report. Routine groundwatermonitoring will be a component of any remedyselected with the exception of the "No Action"alternative. Costs for monitoring required over andabove the routine monitoring (such as would berequired for Monitored Natural Attenuation orchemical injection) are included in the appropriatealternative.
Alternatives G3 and G4 for groundwater treatment,are evaluated as independent alternatives, however, itis anticipated that they would be combined with oneof soil alternatives to address all impacted media atthe Site.
Summary of Alternatives
Medium
Soil/Groundwater
Soil
Groundwater
FS Designation
S1/G1S2/G2
S3S3AS3BS3CS4
G3G4
Description
No ActionInstitutional Controls
Site CappingRCRA Subtitle D CoverRCRA Subtitle C CoverMixed Cover/Cap
Site Capping and In-Situ Soil Treatment
Chemical InjectionMonitored Natural Attenuation
Cost
$ 62,000$ 810,000
$ 1,649,000$ 5,202,000$ 2,842,000$ 3,355,000
$ 508,000$ 340,000
GROUNDWATER/SOIL ALTERNATIVES
Alternative Sl/Gll - No ActionEstimated Capital Cost:$0Estimated Annual Operation and Maintenance(O&M) Cost: $5,000Estimated Present Worth Cost: $62,000Estimated Time To Completion: NoneSatisfaction of Remedial Action Objectives: No
The No Action alternative is considered a baselineagainst which other alternatives are compared. Withthe No Action alternative, no remedial actions will beperformed to actively reduce mobility, toxicity, orvolume of the chemicals of concern found in the
groundwater and associated soil. Under thisalternative, no changes would be made to existing siteconditions or exposure scenarios. NCP-required fiveyear monitoring costs are associated with thisalternative. Present worth analysis are based on
review once every five years for 30 years. Thisalternative relies on natural attenuation anddegradation and leaching for the reduction of thechemicals of concern in the Site soils andgroundwater. Natural degradation is the tendency ofthe chemicals to reduce through physical, chemicaland biological processes in the natural environment.Attenuation is the tendency of a chemical to bind toin situ soil particles or organic matter resulting in a

n0 4 1 5
reduction of the chemical's mobility. The leachingprocess relies on infiltration or groundwater flow todesorb chemicals in the soil.
Alternative S2/G2 - Institutional Controls andMonitoringEstimated Capital Cost; $100,000Estimated Annual O&M Cost: $57,000Estimated Present Worth Cost:$810,000Estimated Time To Completion: ^ 2 yearsSatisfaction of Remedial Action Objectives: Some
(Note: This cost value is considered conservativesince annual monitoring costs are expected todecrease in future years after the well network andanalyte list is reduced).
Institutional controls would limit the exposurepathways to soils and groundwater potentiallycontaining contaminants of concern. Institutionalcontrols may involve deed restrictions, wellpermitting requirements, zoning controls and accessrestrictions, and would mitigate the potential risk tohuman health by restricting the potential exposurepathways. Currently, the Site is zonedcommercial/industrial and is located within the"Airport Environ:; Area" as defined by theGreenville-Spartanburg Airport Environs Area zoningordinance, dated March 29, 1996. Groundwatermonitoring at the Site will be a component of thisremedial alternative. Groundwater monitoring wouldbe performed using the existing well networksupplemented by a minimum of two new wells.Results of the monitoring program will be used toevaluate the movement of Site related chemicals ofconcern in the groundwater. Although groundwatermonitoring would ;not reduce the present risk levels,it: would provide an early warning for the migrationof contaminants from the Site; and a betterunderstanding and evaluation of the naturalattenuation mechanisms in effect.
Established procedures and mechanisms already existto implement institutional controls over the shortterm, and these means are sustainable over theproposed long terra (e.g., a minimum of 30 years).
This alternative partially complies with the remedialaction goals by being protective of human health;
however, the Institutional Controls alternative doesnot minimize the volume of untreated contaminantsof concern or the continued migration ofcontaminants.
SOIL ALTERNATIVES
Alternative S3 - Site Capping
Under this remedial alternative, a cover designed inaccordance with RCRA Subpart F - Closure andPost-Closure Care, would be constructed over theMSWL to isolate the waste and to reduce infiltrationand erosion. The Subpart F cover serves to preventsurface exposure to the environment, and to reduce orminimize infiltration. Three remedial alternativeswere developed for covering soil and municipal solidwaste (MSW) at the Aqua-Tech Site, and thelocations of MSW and chlorinated compounds wereconsidered. The alternatives for covering the wasteare organized into three basic options: 3A RCRASubtitle D Soil Cover; 3B-RCRA Subtitle C Cover,and; 3C Combination Cover. A preliminarydetermination of the extent of a cover is illustrated onFigure 3.
Alternative S3A - RCRA Subtitle D CoverEstimated Capital Cost: $1,319,000Estimated Annual O&M Cost: $22,000Estimated Present Worth Cost:$l,649,000Estimated Time To Completion: 18 monthsSatisfaction of Remedial Action Objectives:Moderate
Paragraph (a) of RCRA Subpart F defines Subtitle Dcover requirements for closure of an inert pre-RCRAMSWL. The cover consists of an infiltration layerthat reduces infiltration through the placement of aminimum 10"5 cm/second permeability layer ofearthen fill material, and an erosion layer thatsupports vegetative cover and protects the infiltrationlayer. In general accordance with Subpart F, theinfiltration layer is a minimum of 18 inches earthenmaterial, and the erosion layer has a minimumthickness of one foot. There are no specificrequirements for drainage slopes, although coverdesign must account for potential long-term erosionpotential, and facilitate long-term maintenance.

n
Installation of an infiltration layer and protectivevegetation erosion layer will be immediately effectivein preventing surface -contact with waste, however,infiltration will continue, and Alternative S3A is notexpected to dramatically reduce peroohtLion throughsoils and buried-JVI5W^djeQ-caaipared.JD.existingSite conditions. "Effectiveness In isolation frompercolation is moderate, however, -mechanisms thatserve to reduce contaminant mass' in the environmentcan "be sustained. Hgure 4 illustrates the cross-sections of a RCRA Subtitle D Cover.
Although the Aqua-Xech^Siteiaadfiilis relatively old"(approximatefy'36 years); siibsJantial'Subsidence canoccur if a landfill cover remedy is combined withother remedial technologies such as soil vaporextraction or bio-venting. Implementation ofAlternative S3A also facilitates the economical repairand maintenance of active remedial systems installedbeneath the cover that require penetrations throughthe cover to ground surface. An example would bemaintenance or modification of soil vapor extractionlaterals used to a.ctively remove volatile landfillconstituents.
Alternative S3B - RCRA Subtitle C Cover
Estimated Capital Cost: $4,448,000Estimated Annual O&M Cost: $57,500Estimated Present Worth Cost:$5,202,000Estimated Time To Completion: 18 monthsSatisfaction of Remedial Action Objectives:Moderate
Paragraph (k) of RCRA Subpart F requires that theSubtitle C cover include a gas management layer, aninfiltration layer, a flexible membrane liner andassociated drainage layer, and a two foot erosionlayer. Slope of the final cover must be between 2percent and 33 percent. The RCRA Subtitle C coverconsidered in this alternative is consistent withParagraph (k) but includes 24 inches of compactedclay with a permeability of 10"7 cm/second, and a 60mil High Density Polyethelyne (HDPE) liner. Figure4 illustrates the cross-sections of a RCRA Subtitle CCover.
A multi-layer cover that virtually eliminates rainpercolation through buried waste is effective in
reducing the vertical leaching of landfill constituents.It is also effective in preventing surface exposure tothe environment. Overall effectiveness of thisalternative is dependent on the buried wastescontaining leachable constituents lying above thegroundwater so they can be isolated from bothvertical or horizontal groundwater flow.Effectiveness of this remedy can be compromised ifcombined with remedies that promote aerobicconditions in the waste, and hence cause landfillsubsidence. As with Alternative S3A, maintenanceand repair of a lined cover should be considered ifAlternative S3B is combined with remedialtechnologies such as SVE. A multi-layer cover ofthis magnitude is expected to be difficult andexpensive to repair in the event of waste subsidence.As with Alternative S3A, the potential exists that theimpermeable cover will disrupt mechanisms thatcurrently result in the long-term removal ofcontaminant mass through reductive dechlorination.While an impermeable cover will effectively haltpercolation of rain infiltration, the long-term resultmay be increased groundwater impact down gradientwhen carbon sources-are consumed beneath thecover, and are not replenished via rain infiltration andpercolation.
The use of geocomposite materials in the linedlandfill offer modern construction alternatives thatmay reduce costs and replace some of the dependenceon accessible and acceptable borrow materialsobtainable from nearby sources. This technicalapproach is not readily adapted to construction onsteep ravine slopes.
Alternative S3C - Combination Cover
Estimated Capital Cost: $2,346,000Estimated Annual O&M Cost: $40,000Estimated Present Worth Cost:$2,842,000Estimated Time To Completion: 18 monthsSatisfaction of Remedial Action Objectives:Moderate
Note: A combination of Alternative S3A (73% Coverage)and Alternative S3B (27% Coverage)
This alternative consists of utilizing an impermeableliner with associated gas and drainage layers in areas
10

of the Site where halting all infiltration is desirableregardless of the impact on current active reductivedechlorination processes consistent with the approachdescribed in Alternative S3B. Other areas of the Sitewould be covered in accordance with Paragraph (a)of Subpart F, consistent with the approach describedin Alternative S3A.. Alternative S3C is designed toallow impermeable capping of areas of the Site thathave been shown to have elevated chlorinated ethenesin soil, MSW, orgroundwater, while using soil coverfor areas of the Situ that present little or no potentialgroundwater impact threat.
This alternative is effective in preventing surfaceexposure to the environment, and is effective inreducing or halting rain infiltration and percolation inareas where the liner is present. If sustainedreductive dechlorination is desirable in areas wherechlorinated ethenes are present in groundwater, thenthis alternative presents overall effectivenesslimitations as described in Alternative S3B. Thereappears to be limited practical reasons to haltpercolation through areas of the Site where there isno evidence of chlorinated ethenes, so AlternativeS3C offers a combination of cover systems thatcompromises between the lower cost of AlternativeS3A, while retaining the greater isolationcharacteristics of Alternative S3B. Combining andjoining the lined cover with unlined cover is easilyimplemented and presents no serious technicalconstruction difficulty.
Alternative S4 - Site Capping and In Situ SoilTreatment
Estimated Capital Cost: $2,736,000Estimated Annual O&M Cost: $40,000(landfill cap)+$30,000(In Situ Soil Treatment System )Estimated Present Worth Cost:$3,355,000Estimated Time To Completion: 18 months for cover,5 years for Soil Vapor Extraction (SVE)Satisfaction of Remedial Action Objectives: High(Primarily soil)
Note: Estimated costs for Alternative S4 weredeveloped on the assumption that it would beimplemented in conjunction with Alternative S3C.
This alternative combines isolation of soil and MSWthrough construction of a soil or RCRA cover, with amechanical SVE system to aggressively pursue theremoval of chlorinated compounds in soils above theMSW in the former Process Distillation Area at theSite. It is anticipated that the SVE collection networkwould replace the layer for passive gas collection.This alternative offers the advantage of physicalremoval of the chlorinated compounds and thereforeis preferred over remedies that only isolate or covervolatile contaminants in the soil. In areas of the Sitewhere it is unlikely that short-circuiting of airflowwill occur, horizontal soil vapor collection lineswould be trenched into the soil above the MSWdeposits using a vibratory trencher. No excavation orsoil removal would be used in the installation of theselaterals.
If SVE is combined with Alternative S3A - RCRASubtitle D Soil Cover, then it may be desirable toinstall a lower permeability clay layer (i.e.: 10'6 or10"7 cm/second) and also to install a drainage layerabove the clay to prevent excess water accumulationin the treatment system. If a geocomposite drainagelayer is used in the final Remedial Design, then aflexible membrane liner can be incorporated into thegeocomposite and ensure optimum SVE conditions.
Potential subsidence of waste as a result ofcomposting of wood debris in the MSW could causeproblems in cover integrity, particularly in • thegeosynthetics and flexible membrane liner. Twosolutions are 1) to measure small temperatureincreases resulting from the in situ oxidation process;and 2) to periodically survey inert points on thebarrier cover placed throughout the waste cover thatpenetrate to the surface providing surface detection ofinterior layer movement.
Alternative S4 retains the effectiveness offered byAlternative S3 plus the added benefit of reducing thecontaminant mass in the soils.
11

8
GROUND WATEFL ALTERNATIVES
Alternative G3 - CHEMICAL INJECTION
Estimated Capital Cost: $508,000Estimated Annual O&M Cost: $0Estimated Present Worth Cost:$508,000Estimated Time to Completion: 3-5 yearsSatisfaction of Remedial Action Objectives: High(Primarily Groundwater)
Note: Includes 6 injections over a three year period.
Note: The costs for this alternative include initialtreatability studies, permitting, injection events,interim monitoring between injection events, andon-going performance assessments. It is anticipatedthat initial baseline and/or interim monitoring eventswill be scheduled to coincide with annual samplingevents. Interim sampling events will focus on specifictreatment areas and will not incorporate the entirewell net\vork. In addition, interim monitoring eventswill utilize a shortened analyte list (VOCs andselected metals).
Chemical injection involves thoroughly permeatingcontaminated zones with a chemical oxidant orreductant (potassium permanganate, sodium lactate,hydrogen peroxide, ozone, etc.) to induceoxidations-eduction (redox) reactions resulting in thecomplete destruction of chemical concentrations. Theinjectant can be placed as a slurry or as a reactivebarrier wall.
The main limitation on treatment effectiveness at theSite will be the low permeability of the soils. Thechemical application method can be modified asneeded to utilize hydraulic fracturing and liquidatomized injection to improve delivery to thesubsurface. If long term permeability enhancementis desired, coarse sand can also be co-injected toleave the pore spaces open after the fracturing iscompleted.
Chemical injection would be effective at reducing theconcentrations of COCs in groundwater. Thistechnology would provide significant reductionthrough destruction, rather than through transferringthem to other media such as air or carbon matrices.
Therefore, this technology would also be affective atreducing the toxicity of contaminants at the Site.Treatability studies would be required during designto determine the optimum chemical(s) to be used,number of injection points, and volume of injectant.
Alternative G4 - Monitored Natural Attenuation
Estimated Capital Cost: $40,000Estimated Annual O&M Cost: $60,000 (for 5 years)Estimated Present Worth Cost: $340,000Estimated Time to Completion: 15 - 30 yearsSatisfaction of Remedial Action Objectives:Long-Term
Note: Initial monitoring frequency would beincreased to semi-annual. Additional sampling,modeling and data management requirements wouldresult in an approximately 30 to 50 percent increaseover Alternative G2 groundwater monitoring costs ifimplemented with no other groundwater remedy.
Monitored Natural Attenuation is the monitored useof the natural processes of intrinsic bioremediation,advection, dispersion, and sorption to removecontaminants from groundwater. It requires astructured program of groundwater monitoring ofbiological and chemical parameters to determine thatthe transformation processes are taking place at a ratethat is protective of human health and ' theenvironment, and that the processes will continue atan acceptable rate for an extended period of time.Because engineering controls are not used to controlplume migration, it is necessary to ensure that naturalattenuation is appropriate to address all contaminantsof concern in the groundwater.
The majority of source material for the detectedVolatile Organic Compounds (VOCs) was removedduring the remedial activities performed in 1992, asevidenced by the Site-wide drop in total VOCconcentrations in groundwater. The landfill area doesnot appear to be a significant source of VOCs, andfree product does not appear to be present at the Site.The extent of the contaminant plume appears to bestable and is not migrating. The use of naturalattenuation does not rely upon cross-media transfer ofcontaminants (i.e., sorption), and would be protectiveof human health and the environment.
12

o
The rate of attenuation at each monitoring welllocation varies suggesting that bioattenuation ratesare not sufficient to utilize natural attenuation as thesole remedial action Site-wide. Historicalgroundwater sampling data suggests that the landfillserves as a significant carbon source for naturalattenuation. As a result, placement of alow-permeability cap over the old municipal landfill,effecting a reduction in leachate production, couldpotentially initial!; renewed migration of thecontaminant plume after the rate of bioattenuationdecreases due to reduction of the carbon source. Use
of natural attenuation will be a long-term application,because of the present inability to reduceconcentrations (reduction rate lower than sourcecontribution) of all contaminants in all areas.
EVALUATION OF ALTERNATIVES
Each remedial alternative was evaluated according tothe nine criteria described below and summarized onthe next page. A detailed comparison of eachalternative according to these criteria can be found inthe FS.
Summary of Evaluation Criteria
How EvaluationCriteria are Usedi
In selecting a preferredcleanup alternative, the
EPA uses the criteriapresented here.
The first two must be metbefore an alternative is
considered further.
The next five are used tofurther evaluate options.
The final two are thenused to evaluate the
remaining options aftercomments have been
received from the:community and the state.
Overall Protectiveness of Human Health and the Environment determines whether an alternativeeliminates, reduces, or controls threats to public health and the environment through institutional controls,engineering controls, or treatment.Compliance with ARARs evaluates whether the alternative meets Federal and State environmentalstatutes, regulations, and other requirements that pertain to the site, or whether a waiver is justified.
Long-term Effectiveness and Permanence considers the ability of an alternative to maintain protection ofhuman health and the environment over time.
Reduction of Toxicity, Mobility, or Volume of Contaminants through Treatment evaluates analternative's use of treatment to reduce the harmful effects of principal contaminants, their ability to movein the environment, and the amount of contamination present.Short-term Effectiveness considers the length of time needed to implement an alternative and the risks thealternative poses to workers, residents, and the environment during implementation.
Implementability considers the technical and administrative feasibility of implementing the alternative,including factors such as the relative availability of goods and services.
Cost includes estimated capital and annual operations and maintenance costs, as well as present worth cost.Present worth cost is the total cost of an alternative over time in terms of today's dollar value. Costestimates are expected to be accurate within a range of +50 to -30 percent.State/Support Agency Acceptance considers whether the State agrees with EPA's analyses andrecommendations, as described in the RI/FS and Proposed Plan.
Community Acceptance considers whether the local community agrees with EPA's analyses and preferredalternative. Comments received on the Proposed Plan are an important indicator of community acceptance.
Overall Protection of Human Health and theEnvironment
Alternative S1/G1 - No Action does not change thecurrent or potential future risks to human health orthe environment identified in the RI, BRA or ERA.All 4 remaining Alternatives provide varying degreesof protection.
Alternative S2/G2 - Institutional Controls' willprovide protection for specific future human exposurescenarios identified at the Site.
Alternative S3 - Site capping will address variousdirect exposure risks identified in the RI, BRA andERA. No individual Alternative is completelyprotective of human health and the environment
13
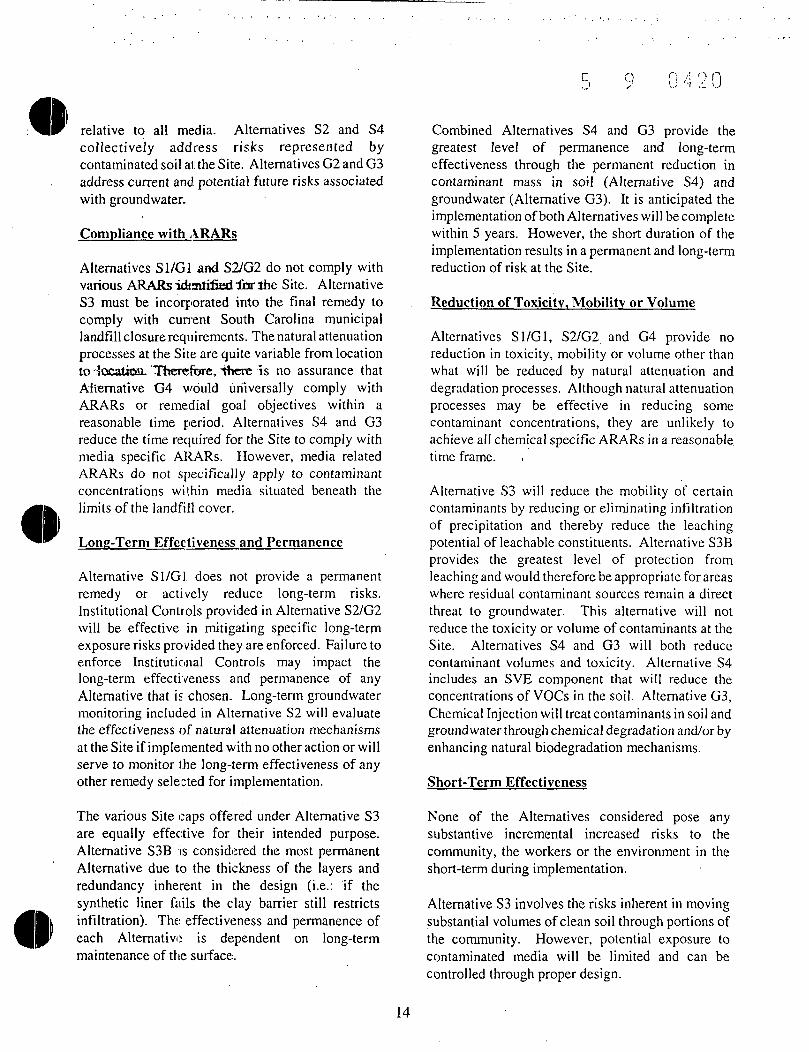
relative to all media. Alternatives S2 and S4collectively address risks represented bycontaminated soil at: the Site. Alternatives G2 and G3address current and potential future risks associatedwith groundwater.
Compliance with ARARs
Alternatives S1/G1 and S2/G2 do not comply withvarious ARARs icbailifiedibr the Site. AlternativeS3 must be incorporated into the final remedy tocomply with current South Carolina municipallandfill closure requirements. The natural attenuationprocesses at the Site are quite variable from locationto "locatioaL Therefore, "there is no assurance thatAlternative G4 would universally comply withARARs or remedial goal objectives within areasonable time period. Alternatives S4 and G3reduce the time required for the Site to comply withmedia specific ARARs. However, media relatedARARs do not specifically apply to contaminantconcentrations within media situated beneath thelimits of the landfill cover.
Long-Term Effectiveness and Permanence
Alternative S1/G1. does not provide a permanentremedy or actively reduce long-term risks.Institutional Controls provided in Alternative S2/G2will be effective in mitigating specific long-termexposure risks provided they are enforced. Failure toenforce Institutional Controls may impact thelong-term effectiveness and permanence of anyAlternative that is chosen. Long-term groundwatermonitoring included in Alternative S2 will evaluatethe effectiveness of natural attenuation mechanismsat the Site if imple mented with no other action or willserve to monitor the long-term effectiveness of anyother remedy selected for implementation.
The various Site caps offered under Alternative S3are equally effective for their intended purpose.Alternative S3B iis considered the most permanentAlternative due to the thickness of the layers andredundancy inherent in the design (i.e.: if thesynthetic liner fails the clay barrier still restrictsinfiltration). The: effectiveness and permanence ofeach Alternative is dependent on long-termmaintenance of the surface.
9 Q 4 2 0
Combined Alternatives S4 and G3 provide thegreatest level of permanence and long-termeffectiveness through the permanent reduction incontaminant mass in soil (Alternative S4) andgroundwater (Alternative G3). It is anticipated theimplementation of both Alternatives will be completewithin 5 years. However, the short duration of theimplementation results in a permanent and long-termreduction of risk at the Site.
Reduction of Toxicity, Mobility or Volume
Alternatives S1/G1, S2/G2 and G4 provide noreduction in toxicity, mobility or volume other thanwhat will be reduced by natural attenuation anddegradation processes. Although natural attenuationprocesses may be effective in reducing somecontaminant concentrations, they are unlikely toachieve all chemical specific ARARs in a reasonabletime frame. ,
Alternative S3 will reduce the mobility of certaincontaminants by reducing or eliminating infiltrationof precipitation and thereby reduce the leachingpotential of leachable constituents. Alternative S3Bprovides the greatest level of protection fromleaching and would therefore be appropriate for areaswhere residual contaminant sources remain a directthreat to groundwater. This alternative will notreduce the toxicity or volume of contaminants at theSite. Alternatives S4 and G3 will both reducecontaminant volumes and toxicity. Alternative S4includes an SVE component that will reduce theconcentrations of VOCs in the soil. Alternative G3,Chemical Injection will treat contaminants in soil andgroundwater through chemical degradation and/or byenhancing natural biodegradation mechanisms.
Short-Term Effectiveness
None of the Alternatives considered pose anysubstantive incremental increased risks to thecommunity, the workers or the environment in theshort-term during implementation.
Alternative S3 involves the risks inherent in movingsubstantial volumes of clean soil through portions ofthe community. However, potential exposure tocontaminated media will be limited and can becontrolled through proper design.
14
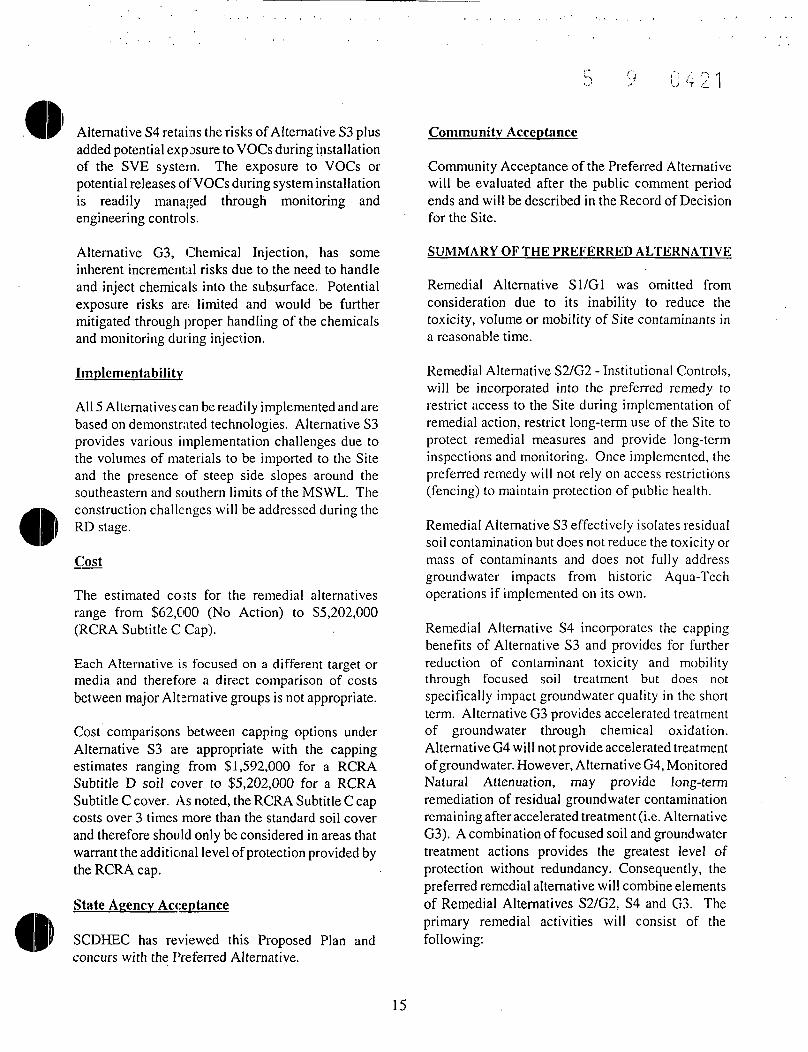
0 4 2 1
Alternative S4 retains the risks of Alternative S3 plusadded potential exposure to VOCs during installationof the SVE system. The exposure to VOCs orpotential releases of VOCs during system installationis readily managed through monitoring andengineering controls.
Alternative G3, Chemical Injection, has someinherent incremental risks due to the need to handleand inject chemicals into the subsurface. Potentialexposure risks are; limited and would be furthermitigated through proper handling of the chemicalsand monitoring during injection.
Implementability
All 5 Alternatives can be readily implemented and arebased on demonstrated technologies. Alternative S3provides various implementation challenges due tothe volumes of materials to be imported to the Siteand the presence of steep side slopes around thesoutheastern and southern limits of the MSWL. Theconstruction challenges will be addressed during theRD stage.
Cost
The estimated costs for the remedial alternativesrange from $62,000 (No Action) to $5,202,000(RCRA Subtitle C Cap).
Each Alternative is focused on a different target ormedia and therefore a direct comparison of costsbetween major Alternative groups is not appropriate.
Cost comparisons between capping options underAlternative S3 are appropriate with the cappingestimates ranging from $1,592,000 for a RCRASubtitle D soil cover to $5,202,000 for a RCRASubtitle C cover. As noted, the RCRA Subtitle C capcosts over 3 times more than the standard soil coverand therefore should only be considered in areas thatwarrant the additional level of protection provided bythe RCRA cap.
State Agency Acceptance
SCDHEC has reviewed this Proposed Plan andconcurs with the Preferred Alternative.
Community Acceptance
Community Acceptance of the Preferred Alternativewill be evaluated after the public comment periodends and will be described in the Record of Decisionfor the Site.
SUMMARY OF THE PREFERRED ALTERNATIVE
Remedial Alternative S1/G1 was omitted fromconsideration due to its inability to reduce thetoxicity, volume or mobility of Site contaminants ina reasonable time.
Remedial Alternative S2/G2 - Institutional Controls,will be incorporated into the preferred remedy torestrict access to the Site during implementation ofremedial action, restrict long-term use of the Site toprotect remedial measures and provide long-terminspections and monitoring. Once implemented, thepreferred remedy will not rely on access restrictions(fencing) to maintain protection of public health.
Remedial Alternative S3 effectively isolates residualsoil contamination but does not reduce the toxicity ormass of contaminants and does not ful ly addressgroundwater impacts from historic Aqua-Techoperations if implemented on its own.
Remedial Alternative S4 incorporates the cappingbenefits of Alternative S3 and provides for furtherreduction of contaminant toxicity and mobilitythrough focused soil treatment but does notspecifically impact groundwater quality in the shortterm. Alternative G3 provides accelerated treatmentof groundwater through chemical oxidation.Alternative G4 will not provide accelerated treatmentof groundwater. However, Alternative G4, MonitoredNatural Attenuation, may provide long-termremediation of residual groundwater contaminationremaining after accelerated treatment (i.e. AlternativeG3). A combination of focused soil and groundwatertreatment actions provides the greatest level ofprotection without redundancy. Consequently, thepreferred remedial alternative will combine elementsof Remedial Alternatives S2/G2, S4 and G3. Theprimary remedial activities will consist of thefollowing:
15

Q
1) Routine groun.dwater monitoring and Siteinspections to asses;; the effectiveness and integrity ofthe selected remedial alternative;
2) Institutional Controls to restrict use anddevelopment of the Site to minimize public exposureto residual contaminants, and to ensure the long-termintegrity of the remedy;
3) Site Capping using a combination of a RCRASubtitle C Cover and RCRA Subtitle D soil cover fordifferent portions of the municipal landfill to ensureall municipal wast2 is isolated from exposure andprovide an extra level of protection in areas where thegreatest concentrations of VOCs were reported;
4) In situ Soil Treatment in the former ProcessDistillation Area to reduce the mass of VOCs inshallow soils throughout this area; and
5) In situ Groundwater Treatment by chemicalinjection to immediately reduce the contaminant massand enhance the long term biodegradation of residualVOCs in groundwater. Once in situ-treatment iscomplete, final remediation of groundwater will beachieved through natural attenuation.
The primary elements of the preferred remedy areillustrated on Figure 4.
EPA's PROPOSED CLEANUP PLAN FOR THE AQUA-TECH ENVIRONMENTAL SITE
Medium FS Designation Description Total Present Worth
Soil/Groundwater S2/G2
Soil S4
Institutional Controls/monitoring $ 810,000
Site Capping and In-Situ Soil Treatment S 3,355,000
Groundwater G3 Chemical Injection $ 508,000
$ 4,673,000
COMMUNITY PARTICIPATION
EPA and SCDHEC provide information regarding thecleanup of the Aqua-Tech Environmental Site to thepublic through public meetings, the AdministrativeRecord file for the site, and announcements publishedin the Greenville News. EPA and SCDHECencourage the public to gain a more comprehensiveunderstanding of the site and the Superfund activitiesthat have been conducted at the site. Dates for thepublic comment period and the date, location, andtime of the public meetings are provided on the frontpage of this Proposed Plan.
All comments, written and oral, should be directed toYvonne Jones, Remedial Project Manager for theSite, at the address, telephone number, or EMAILaddress provided below. Upon timely request, EPAwill extend the public comment period by 30 days.Background and other information on the Aqua-TechEnvironmental Site cleanup (including investigationreports and work plans) can be found in theAdministrative Record and information repositoriesestablished for the public by EPA. These repositoriescan be visited at the locations below.
16

Q
ADMINISTRATIVE RECORD AND INFORMATION REPOSITORIES
Middle Tyger Branch Library170 Groce Road
Lyman, SC 29365(364)439-4759
U.S. EPA Region 4 Records CenterAttn: Debbie Jourdan61 Forsyth Street, SW
Atlanta, GA 30303(404)568-8862
FOR MORE INFORMATION CONTACT:Yvonne Jones
Remedial Project ManagerEPA Region 4
Atlanta Federal Center61 Forsyth Street, SW, Atlanta, GA 30303
(404) 562-8793; 1-800-435-9233janes. vvonneO© epa. yov
or
Scott WilsonProject Manager
SCDHECBureau of Land & Waste Management
2600 Bull Street, Columbia, SC(803) 896-4077
wilson rs @ colwnbia34. dhec. state, sc. its
GLOSSARY
Administrative Order on Consent (AOC) - A negotiatedlegal agreement between EPA and the PRPs. The AOC isenforceable in a court of law, and AOC activities areoverseen by EPA.
Applicable or Relevant and Appropriate Requirements(ARARs) - Cleanup plans selected under CERCLA mustcomply with other pertinent federal, state, and localenvironmental laws, or justify a waiver where appropriate.These other laws an; collectively referred to as ARARs.
Administrative Record - A file containing all informationused by EPA to select a response action under CERCLA.This file must be available for public review and a copy isto be established at or near the Site, usually at theinformation repository. A duplicate file is maintained in acentral location such as a regional EPA and/or state office.
Background Levels - Two types of background levels mayexist for chemical substances: concentrations occurring
naturally in the environment and concentrations present inthe environment due to human-made, non-site sources (e.g.,automobiles, industries).
Baseline Risk Assessment - An evaluation of the potentialrisk to human health and the environment in the absence ofremedial action or cleanup.
Capital Costs - Expenditures required to construct aremedial action. They are exclusive of costs required tooperate and maintain the action.
Chemicals of Concern - Those constituents thatsignificantly contribute to a pathway in an exposurescenario for a receptor that either exceeds the cumulativesite cancer risk range of 10-4 to 10-6 or exceeds anon-carcinogenic hazard index (HI) of 1.
Chemicals of Potential Concern (COPCs) - Chemicalsthat are potentially site related and whose data are of
17

4 2 4
sufficient quality for use in the quantitative RiskAssessment after screening. If the detected concentrationwas less than two times the concentration in average ofbackground samples, the chemical was not retained as aCOPC. Mostorganic^ajjapouflds do not occur naturally inenvironmental media. Both inorganic compounds andorganic compounds were compared to published screeningconcentrations.
Cleanup- Actions talcen to deal with a release or threat ofrelease of a hazardous substance that could affect humansand/or the environment.
Comprehensive Envi ronmenta l Response,Compensation and Liability Act (CERCLA) - A federallawpassod in 1980 aid modified in 1986 by the SuperfundAmendments and Reauthonzation Act (SARA). The Actcreated a trust fund, known as Superfund to investigate andclean up abandoned or uncontrolled hazardous waste sites.
Concentration - The amount of a chemical in a givenvolume of air, water, or other medium. An example is 15parts of carbon in a million parts of air.
Contaminant level - A measure of -how much of acontaminant is present.
Deed Restriction - A legal document that placesrestrictions on how a property may be used. Deedrestrictions are used to prevent property owners fromconducting certain activities (for example, digging into theground) that may cause them to come into contact withcontamination.
Discount Rate (or Real Interest Rate) - The interest rateused in calculating the present value of expected futurecosts. A real interest rate is an interest rate that has beenadjusted to account for the effect of expected or actualinflation. Real interest rates can be approximated bysubtracting the expected or actual inflation rate from anominal interest rate, such as are those that may be foundas the published rale on a savings account or a treasurybond. Real interest rates are used to estimate the cost ofalternatives so that zilternati ves over different time periodscan be compared. By US EPA's RI/FS policy, aseven-percent discount rate is used for present-worth costcomparisons.
Drinking Water Standards - Regulations applying topublic water systems and specifying the maximumcontamination levels that, in the judgment of EPA, arerequired to protect (he public welfare.
Ecological Risk Assessment - As part of the RI, this is aphased (multi-part) study to consider whether, and to what
degree, natural ecosystems on and around the site havebeen affected by site contamination. As with the BaselineRisk Assessment, results from this study are considered inthe Feasibility Study.
Environmental Media - Specific environments—air,water, soil—which are the subject of regulatory concern andactivities.
Environmental Medium - A major environmentalcategory that surrounds or contacts humans, animals,plants, and other organisms (e.g., surface water, groundwater, soil or air) and through which chemicals orpollutants move.
Exposure - Coming into contact with a substance throughinhalation, ingestion, or direct contact with the skin; whichmay be acute (short-term) or chronic (long-term).
Hazard Index (HI) - A summary of HQ values for onepathway, medium, or land use scenario. EPA generallyrequireds that remedial actions be taken at sites which havea current land use HI, or future use HI, that is greater than1.0.
Hazard Quotient (HQ) - A ratio of the amount of achemical taken in, divided by the reference dose which isan intake amount below which no adverse effects areknown to occur.
Groundwater - Water found beneath the Earth's surfacethat fills pores between materials, such as sand, soil, orgravel, or within the fractures of competent rock.
Information Repository - Materials on Superfund and aspecific site located conveniently for local residents.
Institutional controls - A legal or administrative action orrequirement imposed on a property to limit or preventproperty owners or other people from coming into contactwith contamination on the property. Institutional controlsmay be used to supplement a cleanup (by limiting contactwith residual contamination). Examples include deednotices, deed restrictions, and long-term site monitoring orsite security requirements.
Landfill gas - Gases typically are generated by thedecomposition of organic materials in a landfill. Thecomposition, quantity, and generation rates of the gasesdepend on such factors as refuse quantity and composition,placement characteristics, landfill depth, refuse moisturecontent, and amount of oxygen present. The principal gasesgenerated (by volume) are carbon dioxide, methane, tracethiols, and occasionally, hydrogen sulfide. Volatile organic
18

compounds may also be present in landfill gases,particularly at co-disposal facilities.
Maximum Contaminant Levels (MCLs) - The maximumpermissible level of a contaminant in water that is deliveredto any user of a public water system.
Milligrams per kilogram (mg/kg) - The term mg/kg ormilligrams per kilogram, is equivalent to the expression "part per million or ppm." This is a common unit of measurefor chemical concentrations in soil. One milligram is1/1000 of a gram. One gram weighs about the same as apostage stamp, or about 1/28 of an ounce.
Monitored Natural Attenuation - The reliance on naturalprocesses to achieve site-specific remedial objectiveswithin a time that is reasonable, compared to that offeredby more active methods. Such processes may includebiodegradation; dispersion, di lut ion; sorption;volatilization, and chemical or biological stabilization,transformation, or destruction of contaminants.
National Contingency Plan (NCP) - Short name for the"National Oil and Hazardous Substances PollutionContingency Plan," the Federal regulation that implementsSuperfund Program and other parts of the nation's responseto hazardous substances. The NCP is 40 Code of FederalRegulations (CFR) Part 300. It was last revised in 1990 andwas published in Volume 55, Number 46 of the FederalRegister (pages 8666-8865).
Natural attenuation - The natural breakdown ofhazardous substances in the environment. Once releasedinto the environment, many hazardous substances willdegrade or be broken down into nonhazardous substances.Natural attenuation processes work without humanintervention within the context of a carefully controlled andmonitored site cleanup approach to achieve site-specificremedial objectives within a time frame that is reasonablecompared to that offered by other methods.
Operation and Maintenance (O&M) Costs -Post-construction costs necessary to ensure continuedeffectiveness of a remedial action. Includes both short-termO&M and long-term O&M costs. Most O&M costs areestimated on an annual basis.
parts per billion (jipb) - This term is a way of expressingthe concentration of a contaminant in a liquid or air. Thisterm is equivalent to the expression " micrograms perKilogram" one par!: per billion is equal to one inch in adistance of about sixteen thousand miles (or a penny in tenmillion dollars), a very small amount.Pathway - The "roate" a hazardous substance takes fromits point of release: (the "target") to a person, plant or
animal (the "receptor"). The pathway can be direct (whenthe receptor comes to the target) or indirect (when thehazardous substance migrates from the target to thereceptor).
Potentially Responsible Parties (PRPs)- This may be anindividual, a company or a group of companies who mayhave contributed to the hazardous conditions at a site.These parties may be held liable for costs of the remedialactivities by EPA through CERCLA Laws.
Preferred Alternative - EPA's selected cleanup plan,which is described on the Proposed Plan along with thereasons EPA prefers it to the other possible cleanup plans.
Present Worth or Present Value - This is a method forplacing the cost of future expenses in current dollarsallowing the cost of alternatives with different O&Mperiods. The present worth of O&M costs is the amount ofmoney, which, if invested in the current year, would besufficient to cover all the O&M costs associated with analternative. The total present worth project is the sum of thecapital cost and the present worth O&M cost.
Presumptive Remedy - A standard remedy for a group ofsimilar sites. EPA's term for a Generic Remedy.Presumptive remedies have been developed for municipallandfills, wood treatment facilities, sites with groundwatercontamination, and sites contaminated with volatile organiccompounds (VOCs).
Proposed Plan - A public participation requirement inwhich the lead agency summarizes for the public theevaluation of cleanup alternatives, the preferred cleanupstrategy, and the rationale for the preference. Thisdocument must actively solicit public review nd commenton all alternatives under consideration.
Reasonable Maximum Exposure (RME) - Themaximum exposure reasonably expected to occur within apopulation.
Receptor - The exposed individual relative to the ExposurePathway considered.
Remedial Design/Remedial Action (RD/RA) - Theremedial design (RD) is a plan formulated by either thePRP or EPA or both to provide the appropriate measures toremediate a hazardous waste site. The remedial action (RA)is the actual construction or implementation phase of aSuperfund hazardous waste site cleanup that follows theremedial design.
Remedial Investigation/Feasibility Study - Performed atthe Site after a site is listed on the National Priorities List
19
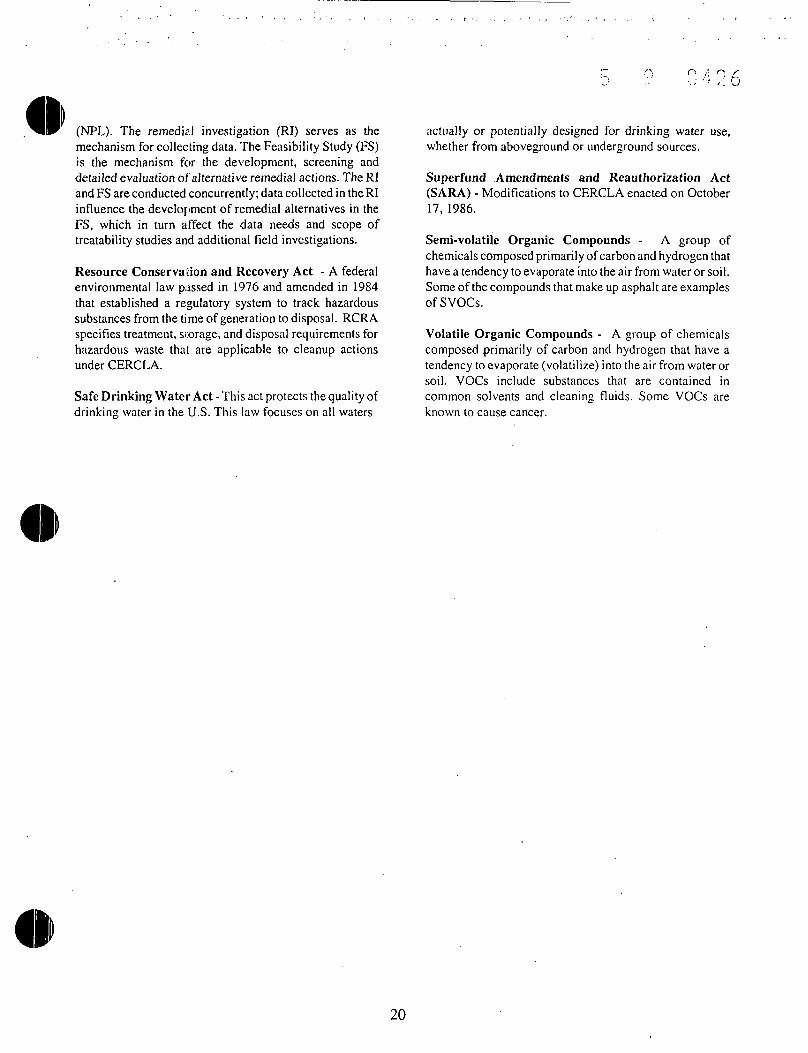
(NPL). The remedid investigation (RI) serves as themechanism for collecting data. The Feasibility Study (FS)is the mechanism for the development, screening anddetailed evaluation of alternative remedial actions. TheRIand FS are conducted concurrently; data collected in the RIinfluence the development of remedial alternatives in theFS, which in turn affect the data needs and scope oftreatability studies and additional field investigations.
Resource Conservation and Recovery Act - A federalenvironmental law passed in 1976 and amended in 1984that established a regulatory system to track hazardoussubstances from the time of generation to disposal. RCRAspecifies treatment, storage, and disposal requirements forhazardous waste that are applicable to cleanup actionsunder CERCLA.
Safe Drinking Water Act - This act protects the quality ofdrinking water in the U.S. This law focuses on all waters
actually or potentially designed for drinking water use,whether from aboveground or underground sources.
Superfund Amendments and Reauthorization Act(SARA) - Modifications to CERCLA enacted on October17, 1986.
Semi-volatile Organic Compounds - A group ofchemicals composed primarily of carbon and hydrogen thathave a tendency to evaporate into the air from water or soil.Some of the compounds that make up asphalt are examplesofSVOCs.
Volatile Organic Compounds - A group of chemicalscomposed primarily of carbon and hydrogen that have atendency to evaporate (volatilize) into the air from water orsoil. VOCs include substances that are contained incommon solvents and cleaning fluids. Some VOCs areknown to cause cancer.
20

5 9 0 4 2 7
33^ r"t- TfjM?^:
SOURCEUSGS GREER. SCtUTH CAROLINAQUADRANGLE, PROVISIONAL EDITION 1983. Figure 1
SITE LOCATIONAQUA-TECH, INC.
Greer, South Carolina
13926-00(008)GN-AT001 MAY 28/2003
21

N)K)
kS\\\Vs\*' :'• '*~^'~^~' ^•^^^^~^j^^-'~-J-[f'^-f ^\\\ /f ^S^^^^^- "-Ns .
\':'"7 7 / ^^^S i x .\\ // " // -isvtrss^——•" -"s-v " ' '
V/ ^-^—«! ~ir *~ '— ' . - ' /
POSTWa CUHCMLIl- PAD
•JMITSOflANOTIlL
PROOUCnONWELL
FlguneSSITE PLAN AND
OPERATING AREASAQUA-TECH. INC.
£/ee/; 5iaw^ Carolina13920-00(009 (GN-AT002 MAY W2OO2

toU)
*£SS?IITO "** ""OKwro
V'BM
UEOEHOEXBWO GONOQTTBsiATtt rsf»«iUM mom*
OUfVMX WA1CA KMtfU LOQkTCM•TMCMf X
uucni 0*4 cume woman
CnFiguro 3
Rl SAMPLE LOCATIONSAQUA-TECH, INC
GHEER. SOUTH CAROLINA

^'&%&&'S83gf.''&.,. .. •-.. ..V;-.-...-./T rtC -J
* {•
RCRA SUBTITLE C COVERNOT TO SCALE
•FLEXIBLEMEMBRANELINER
13926-OD(008)GN-AT007 MAY 30/2003
12"
18"
'-#'j -y• & ^.*^i~7ft*fc$^&m^MVtvQ.:- ..'.HJX*:.:, >^
RCRA SUBTITLE D COVERNOT TO SCALE
figure 4
TYPICAL COVERCROSS-SECTIONSAQUA-TECH, INC.
Greer, South Carolina
cn
CD
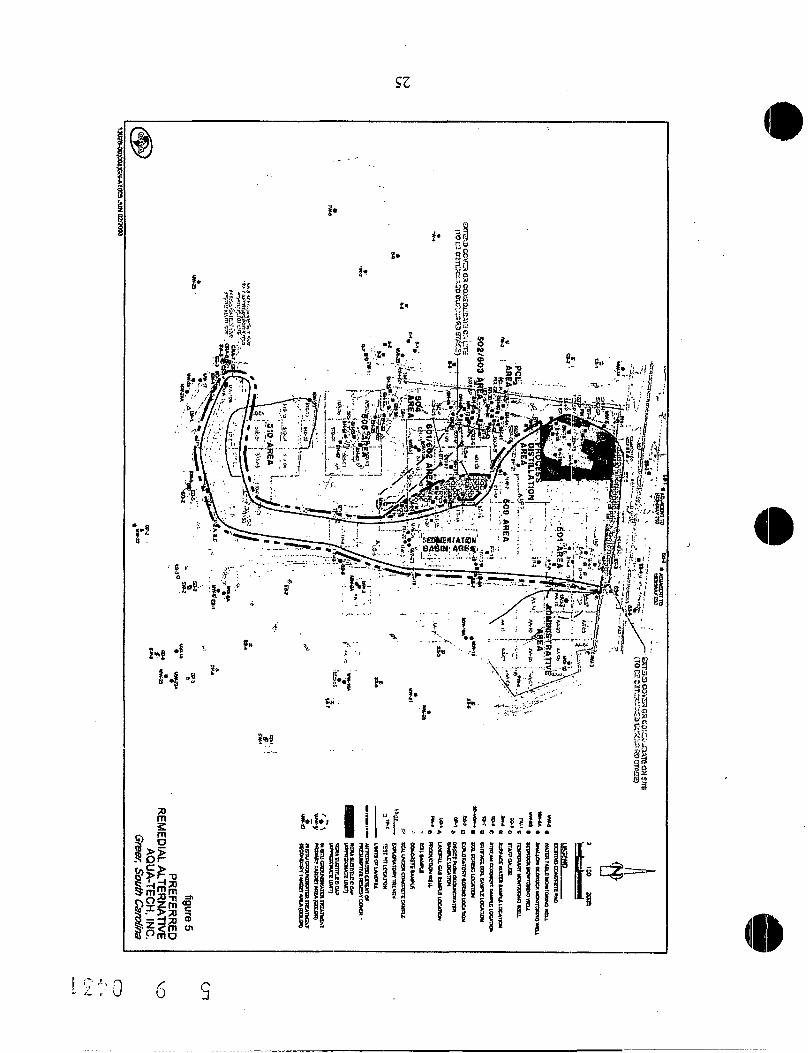
" I* r<S i Mi]'M
iiiii
I
••-' 6

u 4 5 2
USE THIS SPACE TO WRITE YOUR COMMENTS
Your input on the Proposed Cleanup Plan for the Aqua-Tech Environmental Site is important to EPA. Thepublic's comments help EPA select a final cleanup remedy for the site.
You may use the space below to write your comments, then fold and mail. Comments must be postmarkedby August 25, 2003. Please contact Yvonne Jones at 404-562-8793 if you have any question about the commentperiod.
If you have access to E-Mail, you may send comments to: [email protected]

.0 J
U.S. EPA .Region 4Yvonne Jones, 11* FloorAtlanta Federal Center61 Forsyth Street, S.W.Atlanta, Georgia 30303
OFFICIAL BUSINESSPENALTY FOR PRIVATE USE $300
INSIDE: EPA Proposes Action for the Aqua-Tech Environmental Site
0 4 3
Fold on dashed l:ine, staple, stamp and mail.Name:__________________________Address:________:________________City:___________State:_______ Zip:.
Yvonne JonesRemedial Project Manager
U.S. EPA Region .4Atlanta Federal Center61 Forsyth Street, S.W.Atlanta, Georgia 30303

5 9 0 4 3 5
APPENDIX F
INFORMATION REPOSITORIES
0 4 3 6
ADMINISTRATIVE RECORD ANDINFORMATION REPOSITORIES
Middle Tyger Branch LibraryIVOGroceRoad ,
Lyman, SC 29365(864) 439-4759
U.S. EPA Region 4 Records CenterAttn: Debbie Jourdan61 Forsyth Street, SW
Atlanta, GA 30303(404)568-8862

5 9 0 4 5 7
APPENDIX G
(DRAFT) ADMINISTRATIVE RECORD INDEX FOR THE AQUA-TECHENVIRONMENTAL SITE (DATED JULY 2003)

u O H A 7- Q09/22/03 11:16AM [Draft] '"' '' - ; -J O
Administrative Record Indexfor the
AQUA-TECH ENVIRONMENTAL INC (GROCE LABS) NPL Site
1.0 PRE-REMEDIAL
1. 8 Preliminary Assessment Documents
1 . "Preliminary Assessment" form, U.S. EPA. Concerning assessment of Groce Laboratories, Inc.(November 05, 1987)
1. 9 Situ Inspection Documents
1 . "Sits Investigation for Aqua-Tech Environmental, Inc. (Groce Laboratories) - Greer, SpartanburgCounty, South Carolina," B & V Waste Science and Technology Corp for EPA Region 4 [Note:Appendix A - Score Sheets is not included due to its confidential nature]. (May 29, 1992)
1.10 Expanded Site Inspection Documents
1 . "Final Expanded Site Investigation for Aqua-Tech Environmental, Inc. (Groce Laboratories) - Greer,Spcirtanburg County, South Carolina," B & V Waste Science and Technology Corp. for EPA Region4. (November 23, 1992)
2.0 REMOVAL RESPONSE
2. 4 Work Plans and Progress Reports
1 . "Surface Soil Removal Evaluation - Aqua-Tech Environmental, Inc., Site," RMT, Inc. (November1993)
3.0 REMEDIAL INVESTIGATION (Rl)
3.1 Correspondence
1 . E-mail from Russell Jeffers, U.S. Fish & Wildlife Service to Yvonne O. Jones, EPA Region 4.Concerning a conference call scheduled for February 8, 2000. (February 08, 2000)
2 . Letier from Robert T. Pyle, Conestoga-Rovers & Associates to Yvonne O. Jones, EPA Region 4.Concerning appropriate standards for closure cover over the municipal solid waste landfill atAqua-Tech (with attachments). (May 06, 2003)
3. 2 Sampling and Analysis Data
1 . "Remedial Investigation and Feasibility Study - Sampling and Analysis Plan," RMT, Inc. (May 1997)
2 . Letter from Robert T. Pyle, Conestoga-Rovers & Associates to Yvonne O. Jones, EPA Region 4.Submitting the "Field Sampling and Analysis (FSAP)-Addendum 1" for the Aqua-TechEnvironmental, Inc. Site. (March 30, 2000)
3 . Letter from Thomas A. Lawrence, Conestoga-Rovers & Associates to Yvonne O. Jones, EPARegion 4. Concerning the installation of two additional overburdened monitoring wells. (June 28,2000)
4 . Memorandum from William N. O'Steen, EPA Region 4 to Yvonne O. Jones, EPA Region 4.Reporting responses to a request for a Preliminary Evaluation of the Potential for Monitored NaturalAttenuation as a Remedial Component for the Aqua-Tech Site. (April 27, 2001)
5 . Letter from R. Scott Wilson, South Carolina Department of Health and Environmental Control toYvonne O. Jones, EPA Region 4. Concerning Remedial Investigation (Rl) Supplemental SamplingResults for the Aqua-Tech Site. (February 27, 2002)

S 9 C 4 3 909/22703 11:16 AM [Draft]
Administrative Record Indexfor the
AQUA-TECH ENVIRONMENTAL INC (GROCE LABS) NPL Site
3-fl REMEDIAL INVESTJGATJON (Rl)
3.4 Work Plans and Progress Reports
1 . "Remedial Investigation and Feasibility Study Workplan - Volume I: Text," RMT, Inc. (May 1997)
2 . "Remedial Investigation and Feasibility Study Workplan - Volume II: Appendices," RMT, Inc. (May1997)
3 . Letl.er from Robert T. Pyle, Conestoga-Rovers & Associates to Yvonne O. Jones, ERA Region 4.Submitting the Supplemental Remedial Investigation Workplan. (August 07, 2001)
3. 8 Interim Deliverables
1 . "Remedial Investigation and Feasibility Study - Health and Safety Plan - Volume I: Text," RMT, Inc.(January 1997)
2 . "Remedial Investigation and Feasibility Study - Health and Safety Plan - Volume II: Appendices,"RMT, Inc. (January 1997) [NOTE: Volume II is dated December 1995 - Appendices were notrevised and did not receive new report date of January 1997].
3.10 Remedial Investigation (Rl) Reports
1 . Let:er from Yvonne O. Jones, EPA Region 4 to Charles H. Tisdale, Jr., King & Spalding Law Firm.Transmitting comments on the Remedial Investigation Report - August 1999; Screening EcologicalRisk Assessment (SERA) Report - August 1999; and, the Problem Formulation - Step 3 Report -August 1999 for the Aqua-Tech Environmental NPL Site. (November 18, 1999)
2 . Letter from R. Scott Wilson, South Carolina Department of Health and Environmental Control toYvonne O. Jones, EPA Region 4. Submitting comments on the Remedial Investigation Report forthe Aqua-Tech Environmental Site. (January 25, 2000)
3 . Letter from Yvonne O. Jones, EPA Region 4 to Charles H. Tisdale, King & Spalding Law Firm.Concerning the Remedial Investigation & Baseline Risk Assessment Reports for the Aqua-TechEnvironmental NPL Site. (November 08, 2000)
4 . "Remedial Investigation Report, Volume I, Aqua-Tech Environmental, Inc. Site, Greer, SouthCarolina," Conestoga-Rovers & Associates. Transmitted by the attached letter dated December 7,2000 from Robert T. Pyle, Conestoga-Rovers & Associates to Yvonne O. Jones, EPA Region 4.
. (December 2000)5 . "Remedial Investigation Report, Volume II, Aqua-Tech Environmental, Inc. Site, Greer, South
Carolina," Conestoga-Rovers & Associates. (December 2000)6 . Letter from Yvonne O. Jones, EPA Region 4 to Charles H. Tisdale, Jr., King & Spalding Law Firm.
Transmitting comments on the Remedial Investigation Report - December 2000 for the Aqua-TechEnvironmental Site. (March 06, 2001)
7 . Letter from R. Scott Wilson, South Carolina Department of Health and Environmental Control toYvonne O. Jones, EPA Region 4. Transmitting comments of the Remedial Investigation Report andthe additional characterization phase for the Aqua-Tech Environmental Site. (April 11, 2001)
8 . Letter from Yvonne O. Jones, EPA Region 4 to Charles H. Tisdale, Jr., King & Spalding Law Firm.Recommending that the Aqua-Tech Steering Committee proceed with the submittal of the RemedialInvestigation and the Baseline Risk Assessment Reports for the Aqua-Tech Environmental, Inc. Site.(April 15, 2002)
9 . Letter from Robert T. Pyle, Conestoga-Rovers & Associates to Yvonne O. Jones, EPA Region 4.Transmitting the Remedial Investigation Report-Addendum 1 for the Aqua-Tech Environmental Site.(May 20, 2002)

5 c) f; 4 4 Q09/22/03 11:16 AM [Draft] '"
Administrative Record Indexfor the
AQUA-TECH ENVIRONMENTAL INC (GROCE LABS) NPL Site
3.0 REMEDIAL INVESTIGATION (Rl)
3.10 Remedial Investigation (Rl) Reports
10 . Letter from Yvonne O. Jones, ERA Region 4 to Eric Melaro, South Carolina Department of Healthand Environmental Control. Transmitting the Remedial Investigation Report - Addendum 1 - May2002 for the Aqua-Tech Environmental Site. (May 28, 2002)
11 . Letler from Yvonne O. Jones, ERA Region 4 to Gregory Hogue, U.S. Department of the Interior.Tra ismitting the Draft Remedial Investigation Report - Addendum 1 - May 2002 for the Aqua-TechEnvironmental Site. (May 29, 2002)
12 . Memorandum from Eric Melaro, South Carolina Department of Health and Environmental Control toR. Scott Wilson, South Carolina Department Health and Environmental Control. Submittingcomments on the Remedial Investigation Report - Addendum 1 - May 2002 for the Aqua-TechEnvironmental Site. (June 17, 2002)
13 . Memorandum from William N. O'Steen, ERA Region 4 to Yvonne O. Jones, ERA Region 4.Responding to a request for review of the Remedial Investigation Report Addendum 1 for theAqua-Tech Environmental Site. (June 17, 2002)
14 . Let:er from R. Scott Wilson, South Carolina Department of Health and Environmental Control toYvonne O. Jones, ERA Region 4. Transmitting comments on the Remedial Investigation ReportAddendum 1 for the Aqua-Tech Environmental Site. (June 18, 2002)
15 . Memorandum from William N. O'Steen, ERA Region 4 to Yvonne O. Jones, ERA Region 4.Responding to a request for review of the Revised Remedial Investigation Report Addendum 1 forthe Aqua-Tech Environmental Site. (October 01, 2002)
16 . Memorandum from William N. O'Steen, ERA Region 4 to Yvonne O. Jones, ERA Region 4.Responding to request for review of the second revision to the Remedial Investigation ReportAddendum 1 for the Aqua-Tech Environmental Site. (February 10, 2003)
17 . "Remedial Investigation Report, Addendum 1, Aqua-Tech Environmental, Inc. Site,"Conestoga-Rovers & Associates. (April 2003)
18 . Letter from Yvonne 0. Jones, ERA Region 4 to Charles H. Tisdale, Jr., King & Spalding Law Firm.Tramsmitting comments on the Remedial Investigation Report - Addendum 1 - May 20, 2002 andsubsequent revisions for the Aqua-Tech Environmental Site. (April 10, 2003)
19 . Lelter from R. Scott Wilson, South Carolina Department of Health and Environmental Control toYvonne O. Jones, ERA Region 4. Granting approval of the Remedial Investigation ReportAddendum 1 for the Aqua-Tech Environmental Site. (April 25, 2003)
3.11 Health Assessments
1 . E-mail from Yvonne O. Jones, ERA Region 4 to addressees. Concerning review of Aqua-Tech PRPdeliverables for the Aqua-Tech Environmental Site. (September 29, 1999)
2 . Leiter from R. Scott Wilson, South Carolina Department of Health and Environmental Control toYvonne O. Jones, ERA Region 4. Concerning the Baseline Risk Assessment (BRA) for theAqua-Tech Environmental Site. (November 15, 1999)
3 . Letter from Yvonne O. Jones, ERA Region 4 to Charles H. Tisdale, Jr., King & Spalding Law Firm.Transmitting comments from the SCDHEC and ERA on the Baseline Risk Assessment Report -October 1999 for the Aqua-Tech Environmental Site. (January 27, 2000)
4 . Letter from R. Scott Wilson, South Carolina Department of Health and Environmental Control toYvonne O. Jones, ERA Region 4. Approving, with one exception, the Baseline Risk Assessment -December 2000 for the Aqua -Tech Environmental Site. (February 07, 2001)

09/22/03 11:16 AM [Draft]
Administrative Record Indexfor the
AQUA-TECH ENVIRONMENTAL INC (GROCE LABS) NPL Site
3.0 REMEDIAL INVESTIGATION (Rl)
3.11 Health Assessments
5 . "Public Health Assessment, Aqua-Tech Environmental, Incorporated (Groce Laboratories), Greer,Spzirtanburg County, South Carolina;" South.Carolina Department of Health and EnvironmentalControl under cooperative agreement with the Agency for Toxic Substances and Disease Registry.(March 23. 2001)
6 . Letter from ChristophefW.T^alf^at-ardous Substance & Waste Management Research, Inc. toYvonne O. Jones, EPA Region 4. Transmitting the Baseline Risk Assessment (BRA), Volumes 1 & 2for the Aqua-Tech Environmental Site. (May 30, 2002)
7 . Letter from Yvonne O. Jones, EPA Region 4 to Eric Melaro, South Carolina Department of Healthand Environmental Control. Transmitting the Baseline Risk Assessment (BRA) Volumes 1 & 2 forthe Aqua-Tech Environmental Site. (May 31, 2002)
8 . Letter from Yvonne O. Jones, EPA Region 4 to Gregory Hogue, U.S. Department of the Interior.Concerning the Draft Baseline Risk Assessment, Volumes 1 & 2 - May 2002 for the Aqua-TechEnvironmental Site. (May 31, 2002)
9 . "Baiseline Risk Assessment for the Aqua-Tech Environmental Site, Greer, South Carolina, Volume Iof II - Text and Appendices A,B,C," Aqua-Tech PRP Group. (August 2002)
10 . "Baseline Risk Assessment for the Aqua-Tech Environmental Site, Greer, South Carolina, Volume IIof II, Appendices D,E,F,G,H,I,J," Aqua-Tech PRP Group. (August 2002)
11 . Letter from Yvonne O. Jones, EPA Region 4 to Cindy Carter, South Carolina Department of Healthand Environmental Control. Transmitting the final Baseline Risk Assessment for the Aqua-TechEnvironmental Site. (September 03, 2002)
12 . Letter from Yvonne O. Jones, EPA Region 4 to Gregory Hogue, U.S. Department of the Interior.Transmitting the final Baseline Risk Assessment for the Aqua-Tech Environmental Site.(September 03, 2002)
13 . Lel.ter from Yvonne O. Jones, EPA Region 4 to R. Scott Wilson, South Carolina Department ofHealth and Environmental Control. Transmitting the final Baseline Risk Assessment for theAqua-Tech Environmental Site. (September 03, 2002)
14 . Letter from Yvonne O. Jones, EPA Region 4 to Tracey Shelley, South Carolina Department ofEnvironmental Control. Transmitting the final Baseline Risk Assessment for the Aqua-Tech'Environmental Site. (September 03, 2002)
15 . Leiter from R. Scott Wilson, South Carolina Department of Health and Environmental Control toYvonne O. Jones, EPA Region 4. Granting approval of the final revision of the Baseline RiskAssessment for the Aqua-Tech Environmental Site. (September 09, 2002)
16 . E-mail from Kevin Koporec, EPA Region 4 to Yvonne O. Jones, EPA Region 4. Concerning the finalrevisions in the Baseline Risk Assessment for the Aqua-Tech Environmental Site. (September 26,2002)
17 . Letter from Yvonne O. Jones, EPA Region 4 to Charles H. Tisdale, Jr., King and Spalding Law Firm.Granting approval from the SCDHEC and EPA of the Baseline Risk Assessment for the Aqua-TechEnvironmental Site. (April 10, 2003)
3.12 Endangerrnent Assessments
1 . Letter from R. Scott Wilson, South Carolina Department of Health and Environmental Control toYvonne O. Jones, EPA Region 4. Concerning a review of the Preliminary Ecological Screening oftho Aqua-Tech Environmental Site. (September 04, 1998)

09/22/03 11:16 AM [Draft] S 9
Administrative Record Indexfor the
AQUA-TECH ENVIRONMENTAL INC (GROCE LABS) NPL Site
3.0 REMEDIAL INVESTIGATION (Rl)
3.12 Endangerment Assessments
2 . Let:er from Yvonne O. Jones, ERA Region 4 to Daniel McDonnell, RMT, Inc. Deciding to formallychange the submittal date for the Site Characterization Report from December 24, 1998 to January15, 1999. (November 19, 1998)
3 . Letter from Yvonne O. Jones, ERA Region 4 to Arthur Chin, Exxon Corp. Submitting comments fromERA and SCDHEC on Preliminary Ecological Screening - August 20, 1998 for the Aqua-TechEnvironmental Site. (November 23, 1998)
4 . Letter from R. Scott Wilson, South Carolina Department of Environmental Control to Yvonne O.Jones, ERA Region 4. Submitting comments on the Preliminary Site Characterization Summary forthe Aqua-Tech Environmental Site. (March 08, 1999)
5 . Letter from Yvonne O. Jones, ERA Region 4 to Charles H. Tisdale, Jr., King & Spalding Law Firm.Transmitting comments on the Site Characterization Report/Ecological Screening Report for theAqua-Tech Environmental Site. (June 14, 1999)
6 . Letter from Yvonne O. Jones, ERA Region 4 to Charles H. Tisdale, Jr., King & Spalding Law Firm.Transmitting comments on the Screening Ecological Risk Assessment Report - December 1999 forthe Aqua-Tech Environmental Site. (March 17, 2000)
7 . "Screening Ecological Risk Assessment, Aqua-Tech Environmental Site, Greer, South Carolina,"Conestoga-Rovers & Associates. (April 2000)
8 . Letter from Steven M. Jones, Conestoga-Rovers & Associates to Yvonne O. Jones, ERA Region 4.Submitting the revised Screening Ecological Risk Assessment/Problem Formulation Document forthe Aqua-Tech Environmental. (April 04, 2000)
9 . "Screening Ecological Risk Assessment, Step 3 - Problem Formulation, [Revised] Aqua-TechEnvironmental Site, Greer, South Carolina,". (June 2000)
10 . Le'lterfrom Yvonne O. Jones, Region 4 to Charles H. Tisdale, Jr., King & Spalding Law Firm.Tninsmitting comments on the Ecological Risk Assessment/Problem Formulation Report, dated April2000 for the Aqua-Tech Environmental Site. (June 13, 2000)
11 . Letter from Robert T. Pyle, Conestoga-Rovers & Associates to Yvonne O. Jones, ERA Region 4.Submitting revisions to Screening Ecological Risk Assessment/Problem Formulation Report for theAqua-Tech Environmental Site. (June 29, 2000)
4.0 FEASIBILITY STUDY (FS)
4. 9 Feasibility Study (FS) Reports
• 1 . "Feasibility Study Report, Aqua-Tech Environmental, Inc. Site, Greer, South Carolina,"Conestoga-Rovers & Associates. (July 2003)
4.10 Proposed Plans for Selected Remedial Action
1 . "[Fact Sheet] Superfund Proposed Plan Aqua-Tech Environmental Site, Greer, Spartanburg County,South Carolina," ERA Region 4. (July 2003)
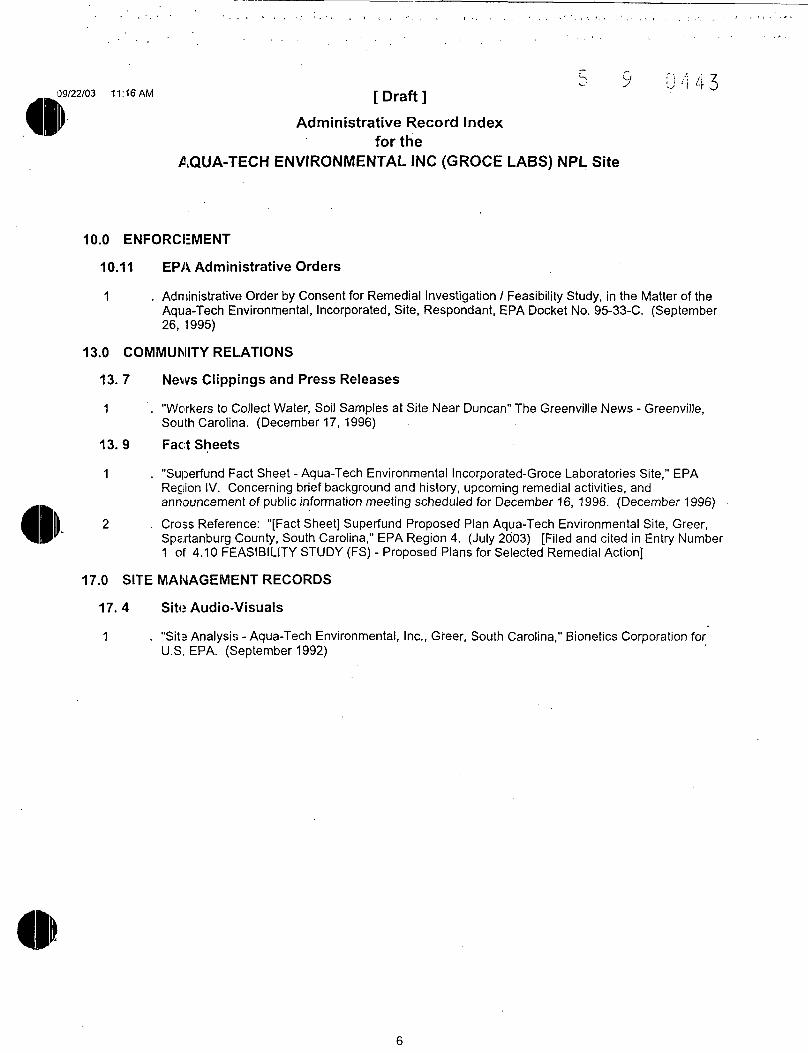
•-. u-•• y09/22/03 11:16 AM [Draft]
Administrative Record Indexfor the
AQUA-TECH ENVIRONMENTAL INC (GROCE LABS) NPL Site
10.0 ENFORCEMENT
10.11 ERA Administrative Orders
1 . Administrative Order by Consent for Remedial Investigation / Feasibility Study, in the Matter of theAqua-Tech Environmental, Incorporated, Site, Respondant, ERA Docket No. 95-33-C. (September26,1995)
13.0 COMMUNITY RELATIONS
13. 7 News Clippings and Press Releases
1 . "Wcfkers to Collect Water, Soil Samples at Site Near Duncan" The Greenville News - Greenville,South Carolina. (December 17, 1996)
13.9 Fact Sheets
1 . "Superfund Fact Sheet - Aqua-Tech Environmental Incorporated-Groce Laboratories Site," ERARegion IV. Concerning brief background and history, upcoming remedial activities, andannouncement of public information meeting scheduled for December 16, 1996. (December 1996)
2 . Cross Reference: "[Fact Sheet] Superfund Proposed Plan Aqua-Tech Environmental Site, Greer,Spa.rtanburg County, South Carolina," ERA Region 4. (July 2003) [Filed and cited in Entry Number1 of 4.10 FEASIBILITY STUDY (FS) - Proposed Plans for Selected Remedial Action]
17.0 SITE MANAGEMENT RECORDS
17.4 Site Audio-Visuals
1 . "Site Analysis - Aqua-Tech Environmental, Inc., Greer, South Carolina," Bionetics Corporation forU.S. EPA. (September 1992)

*0 4 4 4
APPENDIX H
STATE CONCURRENCE LETTER
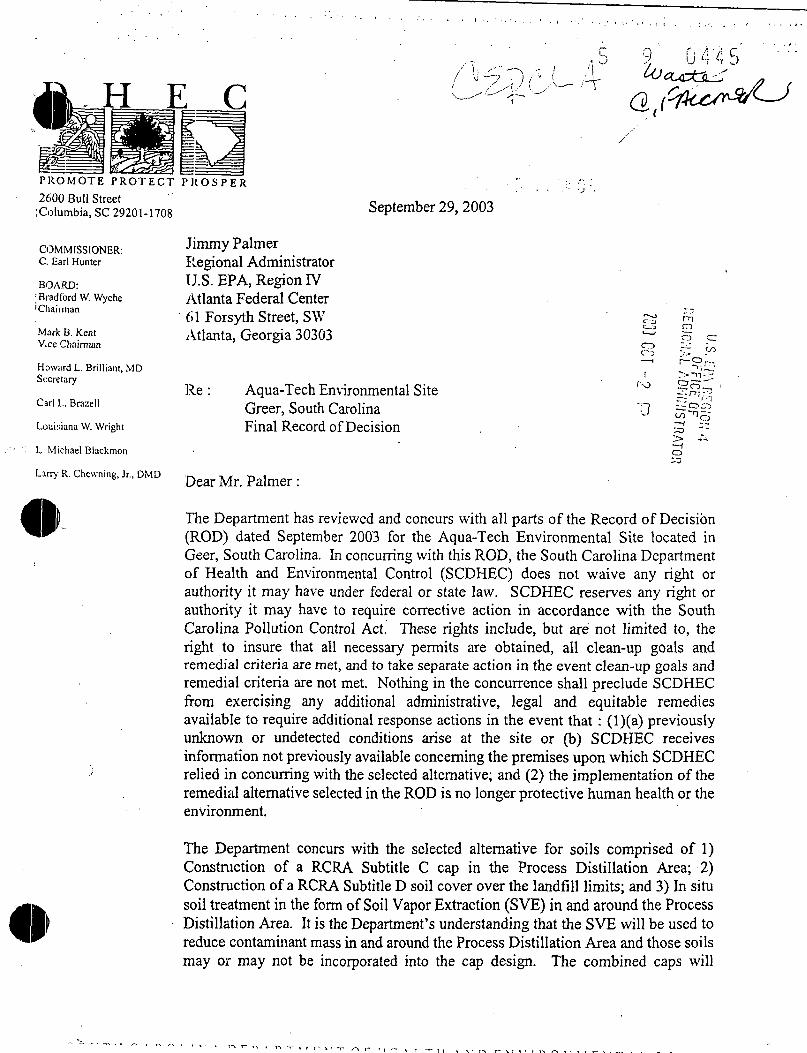
,5 4 4 5
C
P R O M O T E PROTECT P R O S P E R2600 Bull Street
;Columbia,SC 29201-1708 September 29,2003
COMMISSIONER:C. Earl Hunter
BOARD:; Bradford W. Wyche'Chairman
Mark B. KentVice Chairman
Howard L. Brilliant, MDSecretary
Carl L. Brazell
Louisiana W. Wright
L, Michael Blackmon
Lirry R. Chewning, Jr., DMD
Jimmy PalmerRegional AdministratorU.S. EPA, Region IVAtlanta Federal Center61 Forsyth Street, SWAtlanta, Georgia 30303
Re : Aqua-Tech Environmental SiteGreer, South CarolinaFinal Record of Decision
ir-o o
13 SPO•>—ro
Dear Mr. Palmer :
The Department has reviewed and concurs with all parts of the Record of Decision(ROD) dated September 2003 for the Aqua-Tech Environmental Site located inGeer, South Carolina. In concurring with this ROD, the South Carolina Departmentof Health and Environmental Control (SCDHEC) does not waive any right orauthority it may have under federal or state law. SCDHEC reserves any right orauthority it may have to require corrective action in accordance with the SouthCarolina Pollution Control Act. These rights include, but are not limited to, theright to insure that all necessary permits are obtained, all clean-up goals andremedial criteria are met, and to take separate action in the event clean-up goals andremedial criteria are not met. Nothing in the concurrence shall preclude SCDHECfrom exercising any additional administrative, legal and equitable remediesavailable to require additional response actions in the event that : (l)(a) previouslyunknown or undetected conditions arise at the site or (b) SCDHEC receivesinformation not previously available concerning the premises upon which SCDHECrelied in concurring with the selected alternative; and (2) the implementation of theremedial alternative selected in the ROD is no longer protective human health or theenvironment.
The Department concurs with the selected alternative for soils comprised of 1)Construction of a RCRA Subtitle C cap in the Process Distillation Area; 2)Construction of a RCRA Subtitle D soil cover over the landfill limits; and 3) In situsoil treatment in the form of Soil Vapor Extraction (SVE) in and around the ProcessDistillation Area. It is the Department's understanding that the SVE will be used toreduce contaminant mass in and around the Process Distillation Area and those soilsmay or may not be incorporated into the cap design. The combined caps will

46
involve the handling of approximately 66,000 cubic yards of soil with the finallimits of the caps being confirmed in the Remedial Design.
'with the selected alternative of In situ Chemical Treatmentfor contaminated groundwater at the site. It is our understanding that in situchemical injection will be utilized to stimulate degradation of chlorinated solventcontaminants found in me groundwater of the site. The specific chemical oxidantor reductant to be used at the site will be selected based on treatability testingconducted during the Remedial Design. Treatment will begin in upgradient areas ofthe contaminant plume, with downgradient areas being monitored for potentialimpact and future treatment options. In addition, treatment will also begin in thesaprolite zone of the aquifer, with monitoring of the bedrock zone. The decision to.initiate treatment of downgradient and bedrock areas of the plume will be made byEPA and the Department based on initial treatment performance data.
If you should have any questions regarding the Department's concurrence with theROD, please contact Scott Wilson at (803) 896-4077.
cc : Haitsill Truesdale, BLWMKeith Lindler, BLWMRichard Haynes, BLWMScott Wilson, BLWMKent Coleman, BLWMRick Richier, Trident EQC52233; file
Sincerely,
R. Lewis ShawDeputy CommissionerEnvironmental Quality Control