Supplemental Data Two Novel GPCR-Type G Proteins Are Abscisic Acid Receptors in Arabidopsis
29
1 Cell, Volume 136 Supplemental Data Two Novel GPCR-Type G Proteins Are Abscisic Acid Receptors in Arabidopsis Sona Pandey, David C. Nelson, and Sarah M. Assmann Supplemental Experimental Procedures Identification of GTG1 and GTG2 genes. We did a preliminary screen of GPCR-like proteins in Arabidopsis based on Kim et al., (2000). This preliminary screen identified a large number of transmembrane proteins. Nine proteins were selected from this group of proteins that showed obvious similarity to human GPCRs or GPCR- like proteins. We focused further on GTG proteins due to their very high similarity with human GPR89, and their evolutionary conservation. Since the GTG1 and GTG2 genes showed high sequence similarity with each other, a double mutant of these two genes was also used for ABA sensitivity assays. Seed germination assays. Seeds used for germination assays were all from seed lots produced and harvested from plants grown under identical conditions. Seeds were stored at 4 o C and germination experiments were performed with seed lots that were 1 month, 3 months or 1 year old. At least one hundred seeds from each genotype, wild-type Ws, gtg1, gtg2 single mutants, gtg1 gtg2 double mutants and gtg1 gtg2 double mutant complemented with GTG1 or GTG2 gene, were plated on the 0.5 X MS media, 1% sucrose and 0.8% agar with 1 μM ABA (AG Scientific, San Diego, CA) or solvent (ethanol) control. All the genotypes were plated on the same plate for efficient comparison. Seeds were stratified at 4 o C in the dark for 48 h, and germinated at 22°C, in 16 h light/8 h dark conditions. Germination is defined as protrusion of radicle (1 mm in length). Number of germinated seeds was recorded after placing seed in light for 48 h and is expressed as percentage of total seeds.
-
Upload
danforthcenter -
Category
Documents
-
view
1 -
download
0
Transcript of Supplemental Data Two Novel GPCR-Type G Proteins Are Abscisic Acid Receptors in Arabidopsis

1
Cell, Volume 136
Supplemental Data
Two Novel GPCR-Type G Proteins Are
Abscisic Acid Receptors in Arabidopsis Sona Pandey, David C. Nelson, and Sarah M. Assmann
Supplemental Experimental Procedures
Identification of GTG1 and GTG2 genes.
We did a preliminary screen of GPCR-like proteins in Arabidopsis based on Kim et al., (2000).
This preliminary screen identified a large number of transmembrane proteins. Nine proteins were
selected from this group of proteins that showed obvious similarity to human GPCRs or GPCR-
like proteins. We focused further on GTG proteins due to their very high similarity with human
GPR89, and their evolutionary conservation. Since the GTG1 and GTG2 genes showed high
sequence similarity with each other, a double mutant of these two genes was also used for ABA
sensitivity assays.
Seed germination assays.
Seeds used for germination assays were all from seed lots produced and harvested from plants
grown under identical conditions. Seeds were stored at 4oC and germination experiments were
performed with seed lots that were 1 month, 3 months or 1 year old. At least one hundred seeds
from each genotype, wild-type Ws, gtg1, gtg2 single mutants, gtg1 gtg2 double mutants and gtg1
gtg2 double mutant complemented with GTG1 or GTG2 gene, were plated on the 0.5 X MS
media, 1% sucrose and 0.8% agar with 1 μM ABA (AG Scientific, San Diego, CA) or solvent
(ethanol) control. All the genotypes were plated on the same plate for efficient comparison.
Seeds were stratified at 4oC in the dark for 48 h, and germinated at 22°C, in 16 h light/8 h dark
conditions. Germination is defined as protrusion of radicle (1 mm in length). Number of
germinated seeds was recorded after placing seed in light for 48 h and is expressed as percentage
of total seeds.
2
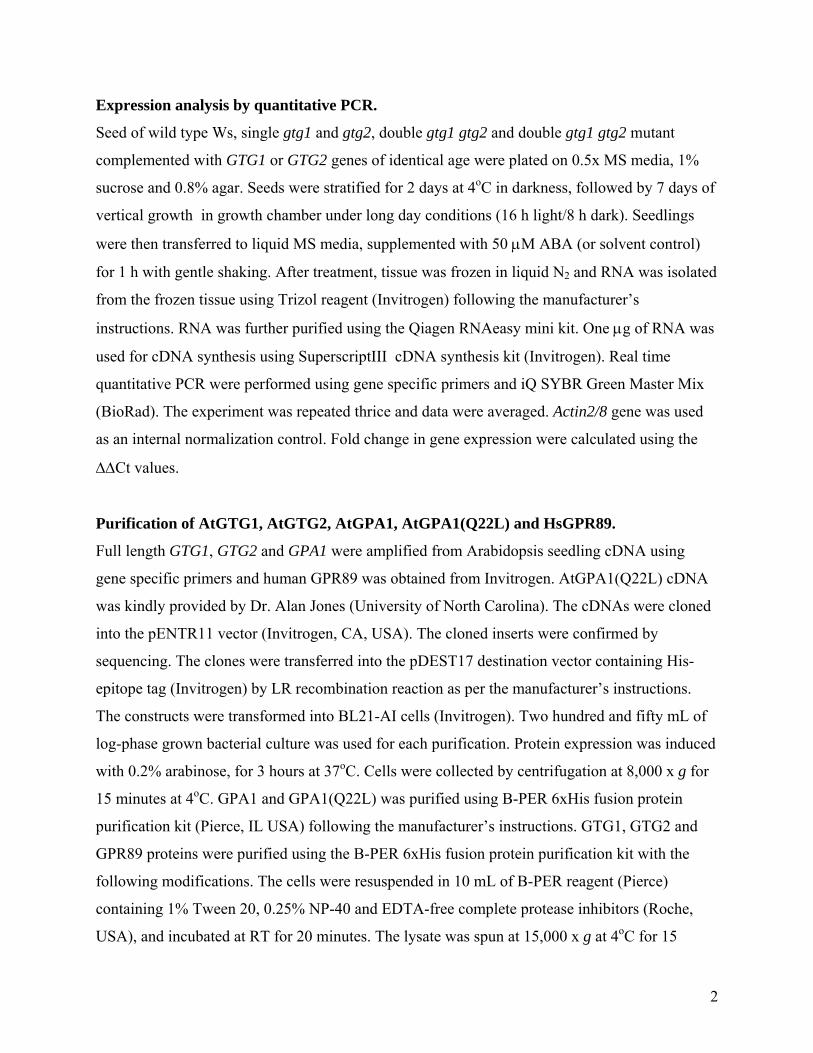
Expression analysis by quantitative PCR.
Seed of wild type Ws, single gtg1 and gtg2, double gtg1 gtg2 and double gtg1 gtg2 mutant
complemented with GTG1 or GTG2 genes of identical age were plated on 0.5x MS media, 1%
sucrose and 0.8% agar. Seeds were stratified for 2 days at 4oC in darkness, followed by 7 days of
vertical growth in growth chamber under long day conditions (16 h light/8 h dark). Seedlings
were then transferred to liquid MS media, supplemented with 50 μM ABA (or solvent control)
for 1 h with gentle shaking. After treatment, tissue was frozen in liquid N2 and RNA was isolated
from the frozen tissue using Trizol reagent (Invitrogen) following the manufacturer’s
instructions. RNA was further purified using the Qiagen RNAeasy mini kit. One μg of RNA was
used for cDNA synthesis using SuperscriptIII cDNA synthesis kit (Invitrogen). Real time
quantitative PCR were performed using gene specific primers and iQ SYBR Green Master Mix
(BioRad). The experiment was repeated thrice and data were averaged. Actin2/8 gene was used
as an internal normalization control. Fold change in gene expression were calculated using the
ΔΔCt values.
Purification of AtGTG1, AtGTG2, AtGPA1, AtGPA1(Q22L) and HsGPR89.
Full length GTG1, GTG2 and GPA1 were amplified from Arabidopsis seedling cDNA using
gene specific primers and human GPR89 was obtained from Invitrogen. AtGPA1(Q22L) cDNA
was kindly provided by Dr. Alan Jones (University of North Carolina). The cDNAs were cloned
into the pENTR11 vector (Invitrogen, CA, USA). The cloned inserts were confirmed by
sequencing. The clones were transferred into the pDEST17 destination vector containing His-
epitope tag (Invitrogen) by LR recombination reaction as per the manufacturer’s instructions.
The constructs were transformed into BL21-AI cells (Invitrogen). Two hundred and fifty mL of
log-phase grown bacterial culture was used for each purification. Protein expression was induced
with 0.2% arabinose, for 3 hours at 37oC. Cells were collected by centrifugation at 8,000 x g for
15 minutes at 4oC. GPA1 and GPA1(Q22L) was purified using B-PER 6xHis fusion protein
purification kit (Pierce, IL USA) following the manufacturer’s instructions. GTG1, GTG2 and
GPR89 proteins were purified using the B-PER 6xHis fusion protein purification kit with the
following modifications. The cells were resuspended in 10 mL of B-PER reagent (Pierce)
containing 1% Tween 20, 0.25% NP-40 and EDTA-free complete protease inhibitors (Roche,
USA), and incubated at RT for 20 minutes. The lysate was spun at 15,000 x g at 4oC for 15
3
minutes to remove cell debris and the cleared supernatant was loaded on a Ni-NTA column (1
mL packed volume), pre-equilibrated with B-PER reagent. The unbound fractions were passed
through the column twice. The column was washed with wash buffer 1 (50 mM Tris, 200 mM
NaCl, 15 mM imidazol, 10% glycerol, 0.25% Tween 20, pH 7.5) five times with three column
volumes each and with wash buffer 2 (50 mM Tris-HCl, 300 mM NaCl, 30 mM imidazol, 12%
glycerol, 0.25% Tween 20, pH 7.0) three times with 3 column volumes each. The proteins were
eluted with 5 mL of elution buffer (50 mM Tris-HCl, 300 mM NaCl, 300 mM imidazol, 12%
glycerol, 100 ng/mL unsaturated phosphatidyl choline (UPC, Avanti Polar Lipids) 0.1% Tween
20 and 1 x EDTA-free complete protease inhibitor) in 1 mL fractions. The fractions were further
loaded on the Extracti-Gel D detergent removing gel column (Pierce) and the proteins were
purified according to manufacturer’s instructions. Eluted proteins were stored as aliquots of 200
μL each at -80oC. Protein estimation was performed by densitometric scanning of CBB stained
gels. Known amount of protein standards were loaded on the same gel for effective comparison
of proteins. Quantification of protein bands was performed using PDquest software.
Split Ubiquitin Interaction and In Vivo Co-immunoprecipitation Assays.
Split ubiquitin vectors and interaction assay have been described previously (Ludwig et al.,
2003; Obrdlik et al., 2004). Briefly, full length GTG1, GTG2 and GPA1 were cloned in CUb, NUbG and NUbWT vectors by mating based in vivo recombination cloning. Interaction was
determined by growth on minimal media lacking Leu, Trp, His and Ade but containing 1 mM
methionine and also by X-gal filter assay (Pandey and Assmann 2004; Obrdlik et al., 2004).
Twelve-day-old seedlings of Ws, gtg1gtg2, gtg1gtg2:GTG1-FLAG and gtg1gtg2:GTG2-FLAG
were used as the source of proteins for in planta pull down assays. Five g of seedling tissue was
ground to a fine powder in the presence of liquid N2. The frozen powder was mixed with 3
volumes of extraction buffer A (50 mM Tris-HCl, pH 7.5, 150 mM sucrose, 1 mM PMSF, 0.1%
Triton X-100, and 1x EDTA-free complete protease inhibitor cocktail) and ground further at 4oC.
The slurry was centrifuged at 12,000 x g for 30 min at 4°C. The supernatants containing total
protein were centrifuged further at 100,000 x g at 4oC for 1 h to separate total microsomal
fractions (pellet) and soluble fractions. The pellet was re-suspended in extraction buffer B (50
mM Tris-HCl, pH 7.5, 300 mM sucrose, 1 mM PMSF, 0.1% Triton X-100, and 1x EDTA-free
complete protease inhibitor cocktail). Protein concentrations in the extracts were measured by the

4
Bradford (1976) assay (Bio-Rad) and were adjusted to 1.2 mg/mL. The Catch and Release
system (Upstate, VA, USA) was used for immuno-precipitation assays. Five hundred μg of total
microsomal proteins, 3 μg FLAG antibodies, and 10 μL of affinity ligand were added to the
column and the columns were incubated at 4oC, on a rotatory shaker, overnight. The washing and
elution of the bound proteins were done according to the manufacturer’s instructions. Eluted
proteins were run on SDS-PAGE, immuno-blotted and probed with GPA1 antibodies as
described in Pandey and Assmann (2004).
Phosphate Assay.
GTPase activity of purified proteins was independently assayed using the ENZchek Phosphate
assay kit (Invitrogen). The assay was performed according to the manufacturer’s instructions
using the enzyme standard provided with the assay kit (purine nucleoside phosphorylase) or
purified recombinant GPA1, GTG1, GTG2 and human GPR89 in the presence of 200 μM GTP.
Phosphate production was recorded as change in absorbance at 360 nm.
Radiolabeled [35S]GTPγS binding assay.
Purified GTG1, GTG2, GPA1 and CaGPA1 (1 μg each) were diluted in 200 μL of reaction
buffer (50 mM Tris-HCl, pH 8, 10 mM MgCl2, 1 mM DTT, 100 ng/mL UPC and 1x EDTA-free
complete protease inhibitor cocktail) with ABA (10 μM) or equimolar concentration of EtOH
(solvent). The samples were incubated at 30°C and the reaction was started by adding 0.2 μM
[35S]GTPγS. Aliquots (30 μL) were collected in new tubes at four different time points (5, 15, 45,
120 minutes) and 1 mL of ice cold wash buffer (20 mM Tris-HCl, pH 8, 100 mM NaCl, 25 mM
MgCl2) was added to the tubes to stop the reaction. The tubes were stored on ice. The reaction
mixture was then filtered using a vacuum attachment, through nitrocellulose membranes
(Protron, Whatman Inc. NJ, USA) prewashed with 3 mL of ice cold wash buffer. The filters were
washed three times with 3 mL of ice cold wash buffer each, and dried on 3M filter papers. Bound
radioactivity was measured using a liquid scintillation counter in 5 mL of Optiphase HiSafe 3
(Perkin Elmer, MA, USA).

5
[α-32P]GTP-hydrolysis assay.
Purified GTG1, GTG2, GPA1 and CaGPA1 (1 μg each) were diluted in 200 μL of reaction
buffer (50 mM Tris-HCl, pH 8, 10 mM MgCl2, 1 mM DTT, 100 ng/mL UPC and 1x EDTA-free
complete protease inhibitor cocktail) with ABA (10 μM) or equimolar concentration of EtOH
(solvent). The samples were incubated at 30°C and the reaction was started by adding 20 pmol of
[α-32P]GTP. Aliquots (10 μL) were collected in new tubes at four different time points (5, 15, 45,
90 minutes) and 10 μL of EDTA (0.5M) was added to the tubes to stop the reaction. The tubes
were stored on ice. One μL of sample was spotted on the PEI-cellulose TLC plates and plates
were allowed to dry. The spotting was repeated two more times. TLC plates were run in
KH2PO4, (0.5 M, pH 3.4) solution and dried. The plates were exposed to a phosphorimager
screen overnight and scanned.
Endogenous ABA-level Measurements.
Endogenous ABA levels were measured in 2-week-old seedlings of Ws and gtg1 gtg2 double
mutants by competitive ELISA using the Phytodetek ABA test kit (Agdia Inc., IN, USA)
according to the manufacturer’s instructions.
Transient expression assay in Arabidopsis mesophyll protoplasts.
GTG1 and GTG2 were cloned in a modified pEarleyGate 102 vector (Earley et al., 2006) by LR
recombination to produce C-terminal GFP fusion proteins. The modified vector was constructed
by replacing the CFP of original pEarleyGate 102 with eGFP and adding a stop codon so that the
HA-tag is not translated (a kind gift from Dr. Gabriele Monshausen, University of Wisconsin,
Madison). Mesophyll cell protoplasts were isolated from 4 week old Arabidopsis leaves
essentially according to Tiwari et al. (2006). DNA was isolated using an Endo free plasmid mini
kit (Qiagen, CA) and transfected using the poly ethylene glycol method according to Sheen
(2001) and Tiwari et al. (2006). At least 105 protoplasts were transfected for each assay (GTG1,
GTG2 or vector plasmids). Protoplasts were incubated at 22oC for 18-24h in darkness before
confocal microscopy. The protoplasts expressing fusion protein were visualized using an
Olympus FV1000 Laser Scanning Confocal Microscope (Olympus America Inc., Melville, NY)
by Blue Argon 488 nm excitation. Images were analyzed using FV10-ASW version 1.6 software.

6
Figure S1. Purification of GTG proteins.
GTG1 and GTG2 proteins were purified as Histidine-tagged fusion proteins and run on a 10%
SDS-PAGE. Mr indicates marker lane. Numbers at the top represent protein amount (μg) loaded
to each lane.
26 33
50
79
118
213
Mr BSA GTG1 GTG2
0.5 1.0 2.5 0.2 0.4 0.2 0.4

7
A B Figure S2. GTG proteins specifically bind GDP but not ATP.
GDP binding was measured using GDP-BODIPY FL and ATP binding was measured using
ATP-BODIPY FL in real time fluorescence assays. Relative Fluorescence Units (RFU) was

8
recorded as a function of time. Three replicates of each assay were performed in each of two
separate experiments. The graphs show data from one representative experiment, mean ± S.D.
Arabidopsis GTG1 (A) and GTG2 (B) have specific GDP-binding activity that is efficiently
competed with non-labeled GTP but not by non-labeled ATP. GTG1 and GTG2 do not bind
BODIPY-FL ATP.

9
A B

10
Figure S3. ATP does not affect GTP binding of GTG proteins.
GTP binding was measured using GTP-BODIPY FL in real time fluorescence assays. Relative
Fluorescence Units (RFU) was recorded as a function of time. Three replicates of each assay
were performed in each of two separate experiments. The graphs show data from one
representative experiment, mean ± S.D. Arabidopsis GTG1 (A) and GTG2 (B) have specific
GTP-binding activity that is efficiently competed with non-labeled GDP but not by non-labeled
ATP.
11
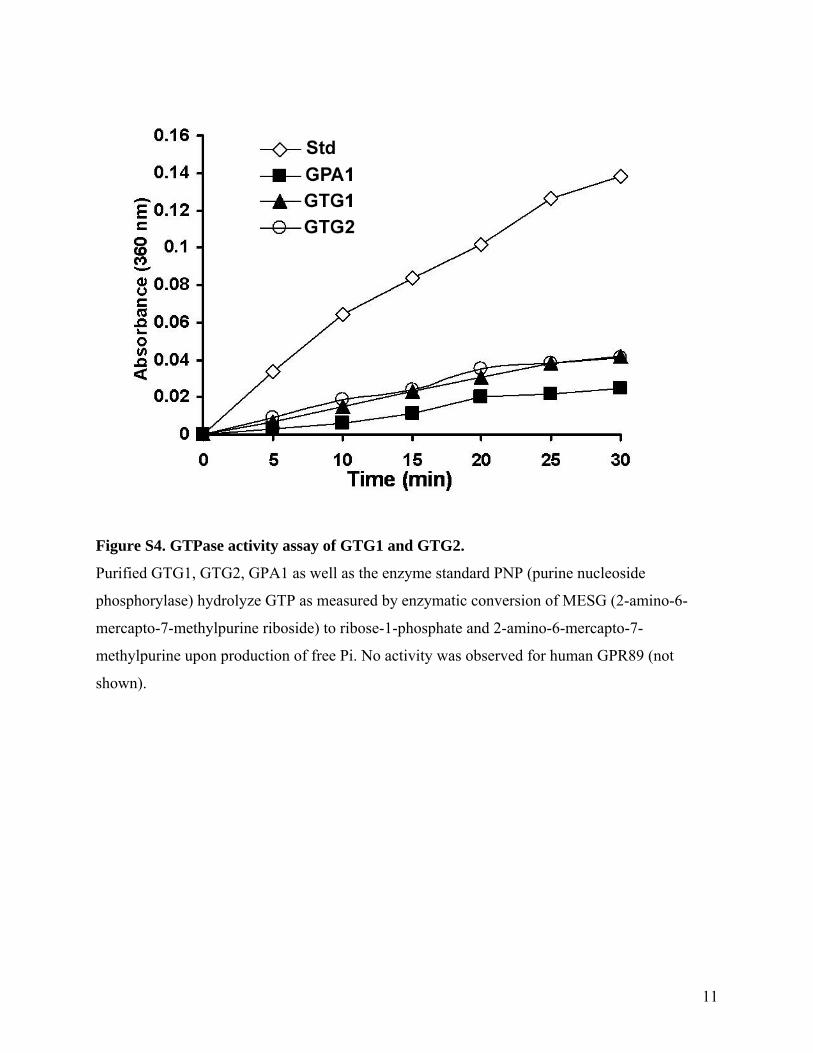
Figure S4. GTPase activity assay of GTG1 and GTG2.
Purified GTG1, GTG2, GPA1 as well as the enzyme standard PNP (purine nucleoside
phosphorylase) hydrolyze GTP as measured by enzymatic conversion of MESG (2-amino-6-
mercapto-7-methylpurine riboside) to ribose-1-phosphate and 2-amino-6-mercapto-7-
methylpurine upon production of free Pi. No activity was observed for human GPR89 (not
shown).

12
Figure S5. GTP-binding and GTPase activities of GTG1 and GTG2 are Mg2+-dependent.
Both GTG1 and GTG2 specifically bind and hydrolyze GTP only in the presence of Mg2+. No
activity was detected in the absence of Mg2+ as also reported for other G proteins (Coleman and
Sprang, 1998).
13
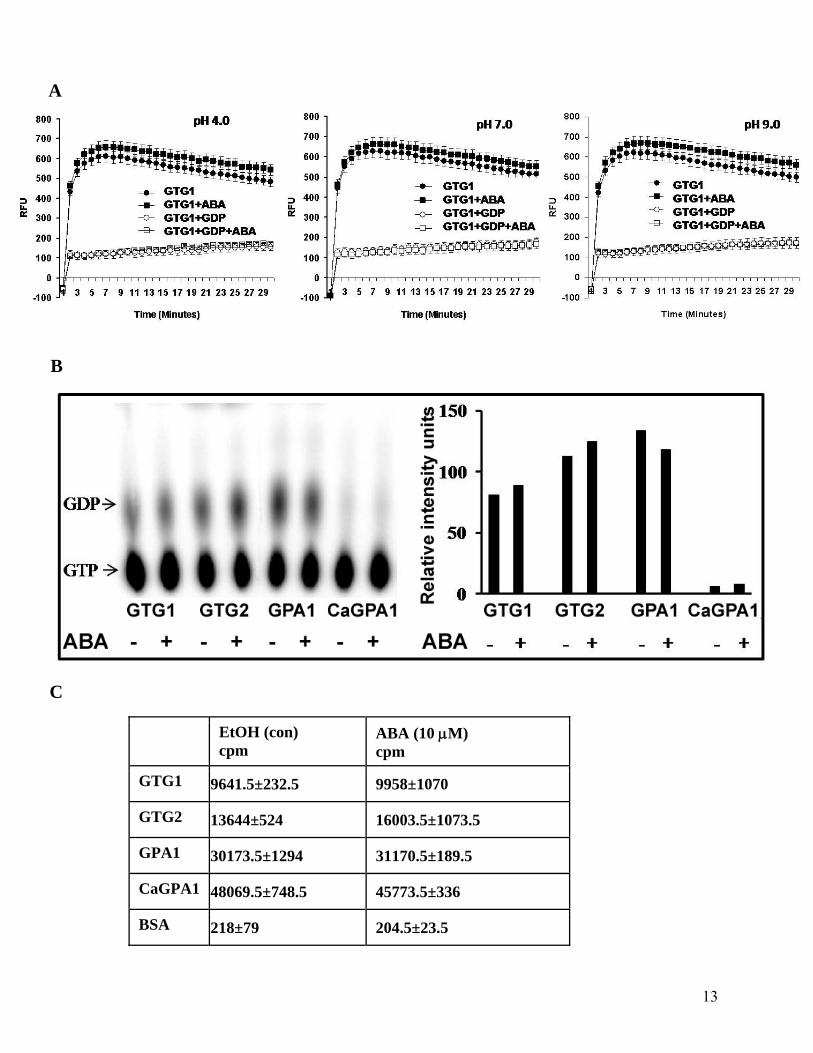
EtOH (con) cpm
ABA (10 μM) cpm
GTG1 9641.5±232.5 9958±1070
GTG2 13644±524 16003.5±1073.5
GPA1 30173.5±1294 31170.5±189.5
CaGPA1 48069.5±748.5 45773.5±336
BSA 218±79 204.5±23.5
A
C
B
14
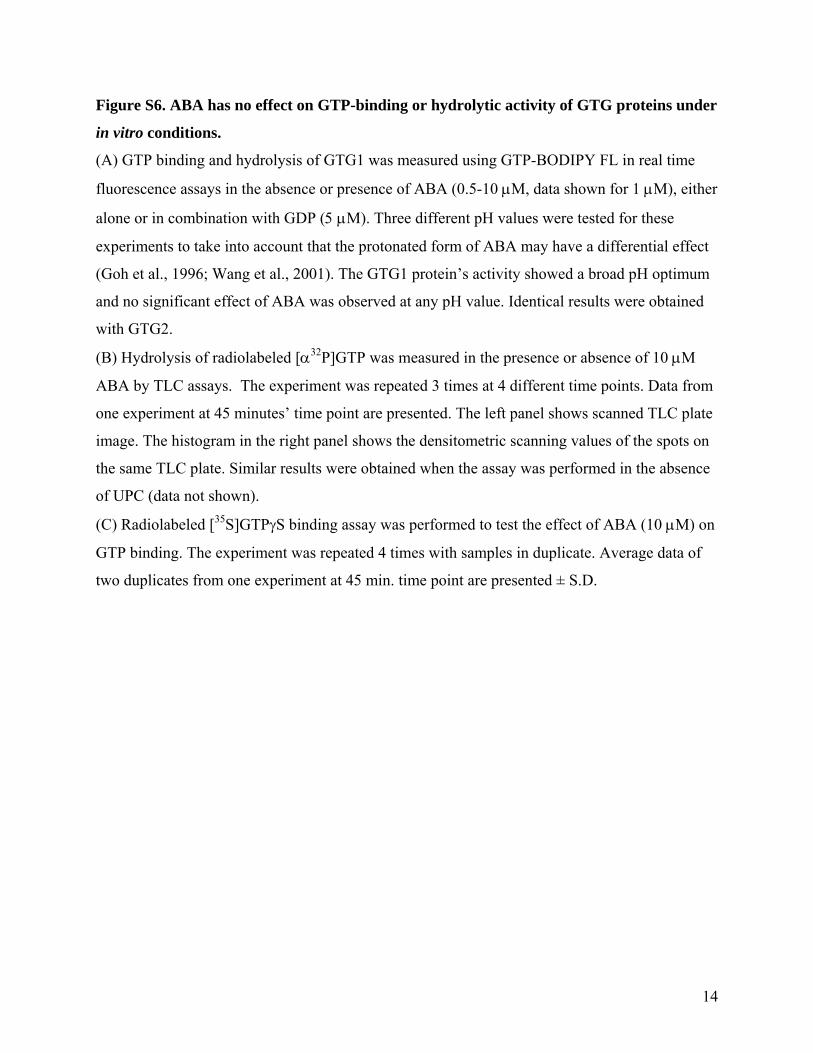
Figure S6. ABA has no effect on GTP-binding or hydrolytic activity of GTG proteins under
in vitro conditions.
(A) GTP binding and hydrolysis of GTG1 was measured using GTP-BODIPY FL in real time
fluorescence assays in the absence or presence of ABA (0.5-10 μM, data shown for 1 μM), either
alone or in combination with GDP (5 μM). Three different pH values were tested for these
experiments to take into account that the protonated form of ABA may have a differential effect
(Goh et al., 1996; Wang et al., 2001). The GTG1 protein’s activity showed a broad pH optimum
and no significant effect of ABA was observed at any pH value. Identical results were obtained
with GTG2.
(B) Hydrolysis of radiolabeled [α32P]GTP was measured in the presence or absence of 10 μM
ABA by TLC assays. The experiment was repeated 3 times at 4 different time points. Data from
one experiment at 45 minutes’ time point are presented. The left panel shows scanned TLC plate
image. The histogram in the right panel shows the densitometric scanning values of the spots on
the same TLC plate. Similar results were obtained when the assay was performed in the absence
of UPC (data not shown).
(C) Radiolabeled [35S]GTPγS binding assay was performed to test the effect of ABA (10 μM) on
GTP binding. The experiment was repeated 4 times with samples in duplicate. Average data of
two duplicates from one experiment at 45 min. time point are presented ± S.D.
15
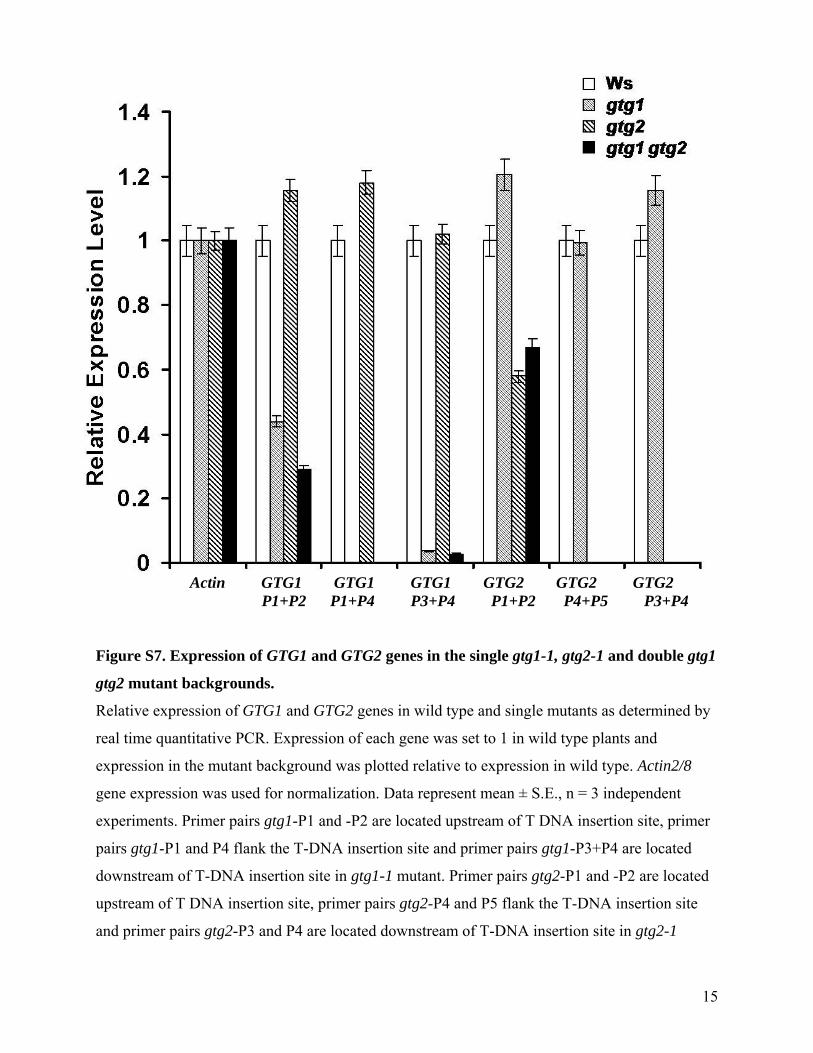
Figure S7. Expression of GTG1 and GTG2 genes in the single gtg1-1, gtg2-1 and double gtg1
gtg2 mutant backgrounds.
Relative expression of GTG1 and GTG2 genes in wild type and single mutants as determined by
real time quantitative PCR. Expression of each gene was set to 1 in wild type plants and
expression in the mutant background was plotted relative to expression in wild type. Actin2/8
gene expression was used for normalization. Data represent mean ± S.E., n = 3 independent
experiments. Primer pairs gtg1-P1 and -P2 are located upstream of T DNA insertion site, primer
pairs gtg1-P1 and P4 flank the T-DNA insertion site and primer pairs gtg1-P3+P4 are located
downstream of T-DNA insertion site in gtg1-1 mutant. Primer pairs gtg2-P1 and -P2 are located
upstream of T DNA insertion site, primer pairs gtg2-P4 and P5 flank the T-DNA insertion site
and primer pairs gtg2-P3 and P4 are located downstream of T-DNA insertion site in gtg2-1
Actin GTG1 GTG1 GTG1 GTG2 GTG2 GTG2 P1+P2 P1+P4 P3+P4 P1+P2 P4+P5 P3+P4

16
mutant. Positions of primers are also depicted in Figure 5. PCR with primer combinations P1+P2
and P3+P4 revealed that reduced levels of a truncated transcript could be detected for both GTG1
and GTG2 upstream of the insertion site at ~40% of the wild type level in gtg1-1 and ~50% of
the wild type in gtg2-1.

17
Figure S8. Inhibition of seed germination by ABA.
The graph shows germination of wild type, single (gtg1-1 and gtg2-1) and double (gtg1 gtg2)
mutants and gtg1 gtg2 complemented with GTG1, GTG2 or empty vector controls. Lines 1 (data
presented in the main text) and 2 have C terminal and line 3 and 4 have N terminal FLAG-
epitope fusions. Germination was recorded in the presence of different concentrations of ABA at
48h after transfer of plates to light at 22oC. The experiment was repeated three times and data
were averaged; values are means ± S.E; n = 100 for each experiment per genotype.

18
Figure S9. Inhibition of primary root length by ABA.
The graph shows root length inhibition of wild type, single (gtg1-1 and gtg2-1) and double (gtg1
gtg2) mutants and gtg1 gtg2 complemented with GTG1, GTG2 or empty vector controls in the
presence of different concentrations of ABA. Lines 1 (data presented in the main text) and 2
have C terminal and line 3 and 4 have N terminal FLAG-epitope fusions. Seedlings were
germinated and grown on MS media for 3 days followed by transfer to media containing
indicated amounts of ABA. The seedlings were grown for 10 more days and root lengths were
recorded. The experiment was repeated thrice and data were averaged. For all experiments,
values are means ± S.E; n = 72 per genotype.

19
Figure S10. Expression of ABA-responsive genes determined by real time quantitative PCR in
Ws, single gtg1, gtg2 mutants, gtg1 gtg2 double mutants and gtg1 gtg2 mutants complemented
with GTG1, GTG2 or empty vector controls. Line 1 (main text) has C terminal and line 2 (this
figure) has N terminal FLAG-epitope fusion. Act 2/8 expression was used for normalization.
Values are means ± S.E., n = 3 independent experiments.

20
Figure S11. ABA-promoted stomatal closure.
ABA-induced stomatal closure was assayed in Ws, single gtg1, gtg2 mutants, gtg1 gtg2 double
mutants and gtg1 gtg2 mutants complemented with GTG1 or GTG2. gtg1 gtg2 mutants show
ABA-hyposensitivity to ABA-induced promotion of stomatal closure, which is complemented by
introduction of either GTG1 or GTG2 genes but not by the empty vector. Both C terminal (main
text) and N terminal (this figure) FLAG-epitope tagged lines showed similar results. The
experiment was repeated thrice and data were averaged, ± S.E. For each experiment n=300 per
genotype per treatment.

21
Figure S12. ABA-induced inhibition of stomatal opening.
ABA-induced inhibition of stomatal opening was assayed in Ws, single gtg1, gtg2 mutants, gtg1
gtg2 double mutants and gtg1 gtg2 mutants complemented with GTG1, GTG2 or empty vector.
Both C terminal (main text) and N terminal (this figure) FLAG-epitope tagged lines showed
similar results. The experiment was repeated thrice and data were averaged, ± S.E. For each
experiment n=300 per genotype per treatment.
22
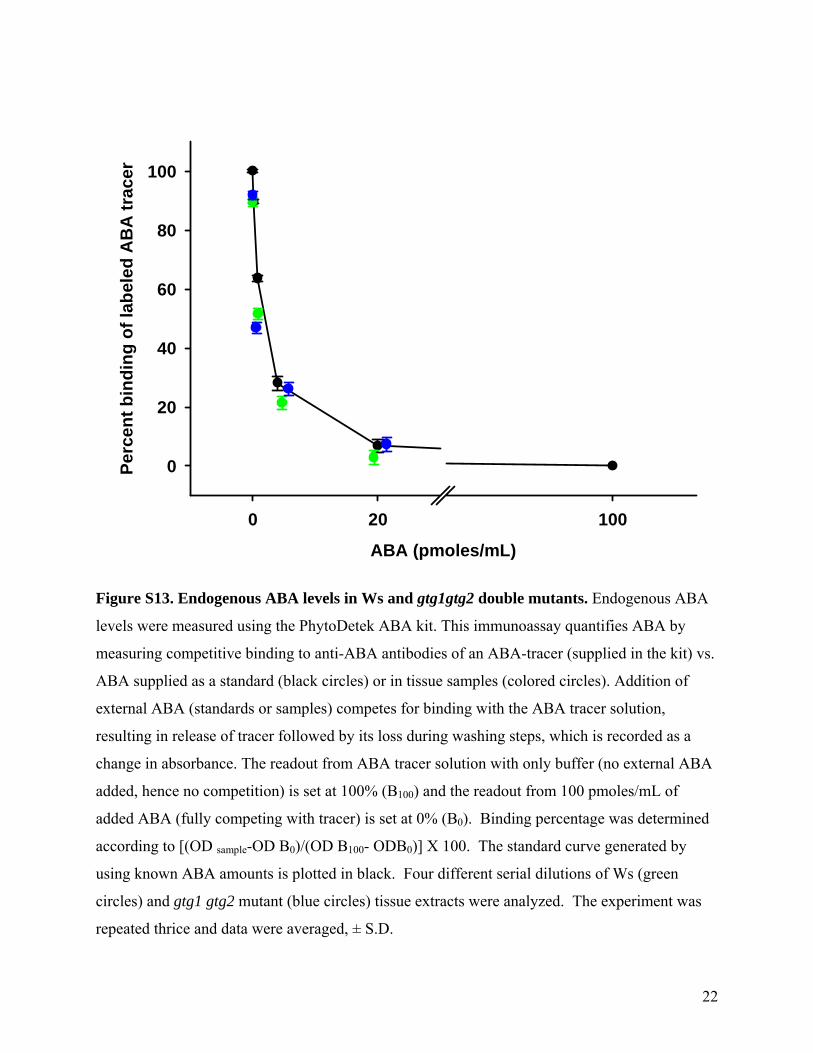
Figure S13. Endogenous ABA levels in Ws and gtg1gtg2 double mutants. Endogenous ABA
levels were measured using the PhytoDetek ABA kit. This immunoassay quantifies ABA by
measuring competitive binding to anti-ABA antibodies of an ABA-tracer (supplied in the kit) vs.
ABA supplied as a standard (black circles) or in tissue samples (colored circles). Addition of
external ABA (standards or samples) competes for binding with the ABA tracer solution,
resulting in release of tracer followed by its loss during washing steps, which is recorded as a
change in absorbance. The readout from ABA tracer solution with only buffer (no external ABA
added, hence no competition) is set at 100% (B100) and the readout from 100 pmoles/mL of
added ABA (fully competing with tracer) is set at 0% (B0). Binding percentage was determined
according to [(OD sample-OD B0)/(OD B100- ODB0)] X 100. The standard curve generated by
using known ABA amounts is plotted in black. Four different serial dilutions of Ws (green
circles) and gtg1 gtg2 mutant (blue circles) tissue extracts were analyzed. The experiment was
repeated thrice and data were averaged, ± S.D.
ABA (pmoles/mL)
0 20 100
Perc
ent b
indi
ng o
f lab
eled
AB
A tr
acer
0
20
40
60
80
100

23
Figure S14. Expression of other reported ABA-receptor transcripts in Ws and gtg1 gtg2
mutant background.
Gene expression was analyzed by real time quantitative PCR using gene specific primers for
FCA, CHLH and GCR2. Expression of Actin2/8 gene was used as normalization control.

24
Table S1. Summary of split ubiquitin assay for GTG1, GTG2 and GPA1.
Test Construct (Gene-Cub)
Test Construct (Gene-Nub or
NUb-Gene)
Growth Assay/ β-galactosidase
filter assay
Notes
GPA1-CUb GTG1-NUbwt Positive Positive Control GPA1-CUb NUbwt-GTG1 Positive Positive Control GPA1-CUb GTG1-NUbG Positive Test Interaction GPA1-CUb NUbG-GTG1 Positive Test Interaction GPA1-CUb GTG2-NUbwt Positive Positive Control GPA1-CUb NUbwt-GTG2 Positive Positive Control GPA1-CUb GTG2-NUbG Positive Test Interaction GPA1-CUb NUbG-GTG2 Positive Test Interaction GPA1-CUb Vector-NUbwt Positive Positive Control GPA1-CUb NUbwt-Vector Positive Positive Control GPA1-CUb Vector-NUbG Negative Test Interaction GPA1-CUb NUbG-Vector Negative Test Interaction GTG2-CUb GPA1-NUbwt Positive Positive Control GTG2-CUb NUbwt-GPA1 Positive Positive Control GTG2-CUb GPA1-NUbG Positive Test Interaction GTG2-CUb NUbG-GPA1 Positive Test Interaction GTG2-CUb GTG1-NUbwt Positive Positive Control GTG2-CUb NUbwt-GTG1 Positive Positive Control GTG2-CUb GTG1-NUbG Positive Test Interaction GTG2-CUb NUbG-GTG1 Positive Test Interaction GTG2-CUb Vector-NUbwt Positive Positive Control GTG2-CUb NUbwt-Vector Positive Positive Control GTG2-CUb Vector-NUbG Negative Test Interaction GTG2-CUb NUbG-Vector Negative Test Interaction
GTG1-Cub does not show any interaction with any proteins, including positive controls.
25
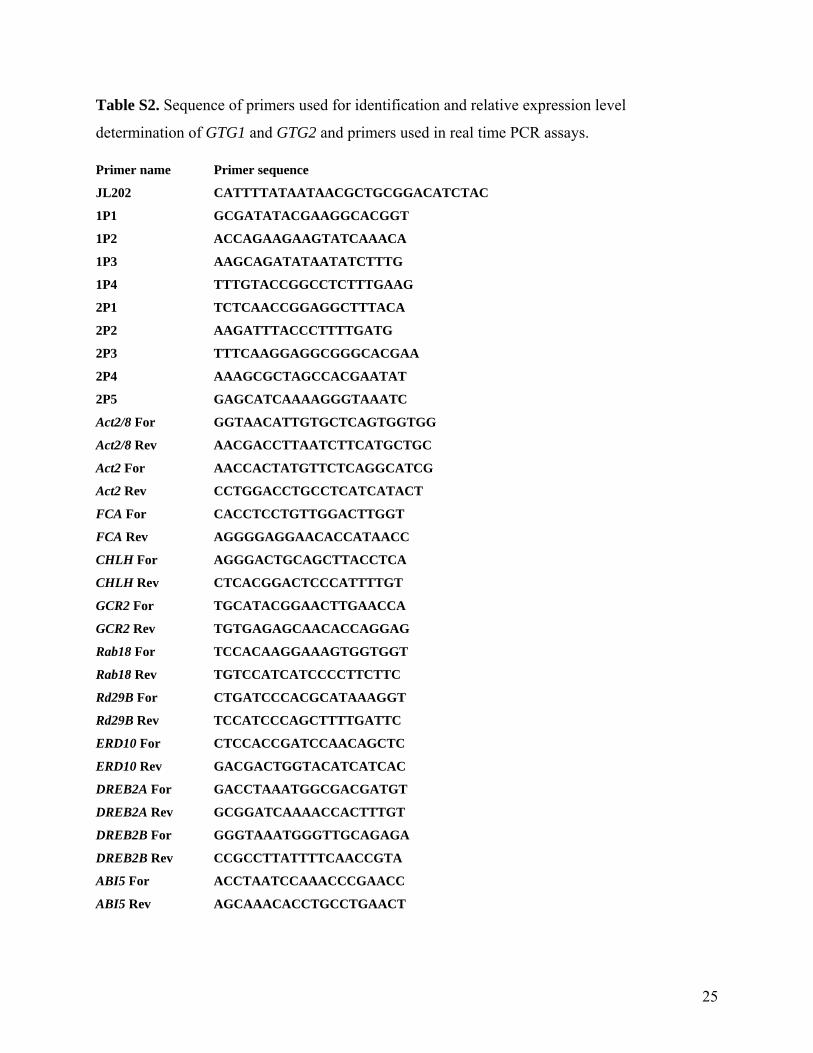
Table S2. Sequence of primers used for identification and relative expression level
determination of GTG1 and GTG2 and primers used in real time PCR assays.
Primer name Primer sequence
JL202 CATTTTATAATAACGCTGCGGACATCTAC
1P1 GCGATATACGAAGGCACGGT
1P2 ACCAGAAGAAGTATCAAACA
1P3 AAGCAGATATAATATCTTTG
1P4 TTTGTACCGGCCTCTTTGAAG
2P1 TCTCAACCGGAGGCTTTACA
2P2 AAGATTTACCCTTTTGATG
2P3 TTTCAAGGAGGCGGGCACGAA
2P4 AAAGCGCTAGCCACGAATAT
2P5 GAGCATCAAAAGGGTAAATC
Act2/8 For GGTAACATTGTGCTCAGTGGTGG
Act2/8 Rev AACGACCTTAATCTTCATGCTGC
Act2 For AACCACTATGTTCTCAGGCATCG
Act2 Rev CCTGGACCTGCCTCATCATACT
FCA For CACCTCCTGTTGGACTTGGT
FCA Rev AGGGGAGGAACACCATAACC
CHLH For AGGGACTGCAGCTTACCTCA
CHLH Rev CTCACGGACTCCCATTTTGT
GCR2 For TGCATACGGAACTTGAACCA
GCR2 Rev TGTGAGAGCAACACCAGGAG
Rab18 For TCCACAAGGAAAGTGGTGGT
Rab18 Rev TGTCCATCATCCCCTTCTTC
Rd29B For CTGATCCCACGCATAAAGGT
Rd29B Rev TCCATCCCAGCTTTTGATTC
ERD10 For CTCCACCGATCCAACAGCTC
ERD10 Rev GACGACTGGTACATCATCAC
DREB2A For GACCTAAATGGCGACGATGT
DREB2A Rev GCGGATCAAAACCACTTTGT
DREB2B For GGGTAAATGGGTTGCAGAGA
DREB2B Rev CCGCCTTATTTTCAACCGTA
ABI5 For ACCTAATCCAAACCCGAACC
ABI5 Rev AGCAAACACCTGCCTGAACT

26
Table S3. Summary of number of transmembrane domains in GTG1, GTG2, GCR1 and GCR2
using different TM prediction softwares.
TM
prediction
program
Reference GTG1 GTG2 GCR1 GCR2
TMHMM www.cbs.dtu.dk/services/TMHMM 9 9 7 none
HMMTOP www.enzim.hu/hmmtop 9 9 7 none
Phobius http://phobius.sbc.su.se 9 9 7 1
DAS www.sbc.su.se/~miklos/DAS/maindas.html 9 9 5 1
SPLIT www.split.pmfst.hr 9 9 6 1
SOSUI www.bp.nuap.nagoya-u.ac.jp/sosui/ 10 10 3 none
TM Pred www.ch.embnet.org/software/TMPRED_form.html 8 8 7 3

27
Table S4. Comparison of stomatal aperture values of Ws, gtg1, gtg2, gtg1 gtg2, and
complemented lines using two different parameters of for statistical analysis, n=300 (total
number of stomata counted) and n=3 (number of independent replicate experiments). Data
presented are for the ABA induced promotion of closure response. P values are for WT (Ws)
versus mutant apertures in the presence of ABA using two-tailed Student’s t test.
Average Apertures (μm) Change in
Aperture
P value
Genotypes
Control ABA (%) n=300 n=3
Ws 5.66±0.45 3.15±0.22 44.32 - -
gtg1 5.43±0.34 3.09±0.31 43.19 0.613 0.692
gtg2 5.43±0.39 3.14±0.61 42.18 0.939 0.971
gtg1 gtg2 4.95±0.65 4.09±0.29 17.47 0.00057 0.037
gtg1 gtg2:GTG1 #1 5.42±0.39 3.29±0.71 39.34 0.825 0.923
gtg1 gtg2:GTG1 #2 5.40±0.28 3.18±0.44 41.17 0.733 0.892
gtg1 gtg2:GTG2 #1 5.36±0.76 3.23±0.35 39.77 0.584 0.768
gtg1 gtg2:GTG2 #2 5.45±0.41 3.22±0.37 40.95 0.811 0.886
gtg1 gtg2:EV #1 4.85±0.53 3.90±0.36 19.50 0.0014 0.042
gtg1 gtg2:EV#2 5.02±0.77 3.99±0.26 20.48 0.00082 0.039
28
Supplemental Acknowledgments
All confocal microscopy was done at the Cytometry Facility at the Huck Institutes of the Life
Sciences, Penn State University. This project is funded, in part, under a grant with the
Pennsylvania Department of Health using Tobacco Settlement Funds. The Department
specifically disclaims responsibility for any analyses, interpretations or conclusions.
Supplemental References
Andre, B., Hamacher, T., Boles, E., Von Wiren, N., and Frommer, W.B. (2003) Homo- and
hetero-oligomerization of AMT1 NH4+-uniporters. J. Biol. Chem. 278, 45603-45610.
Coleman, D. E., and Sprang, S. R. (1998). Crystal structures of the G protein Giα 1 complexed
with GDP and Mg2+: a crystallographic titration experiment. Biochemistry 37, 14376-14385.
Earley, K.W., Haag, J.R., Pontes, O., Opper, K., Juehne, T., Song, K., Pikaard, C.S. (2006)
Gateway-compatible vectors for plant functional genomics and proteomics. Plant J. 45,616-629.
Goh, C.H., Kinoshita, T., Oku, T., and Shimazaki, K. (1996) Inhibition of blue light-dependent
H+ pumping by abscisic acid in Vicia guard-cell protoplasts. Plant Physiol. 111,433-440.
Kim, J., Moriyama, E.N., Warr, C.G., Clyne, P.J., and Carlson, .JR. (2000) Identification of
novel multi-transmembrane proteins from genomic databases using quasi-periodic structural
properties. Bioinformatics 16, 767-775.
Ludewig, U., Wilken, S., Wu, B., Jost, W., Obrdlik, P., El Bakkoury, M., Marini, A.M.,
Obrdlik, P., El-Bakkoury, M., Hamacher, T., Cappellaro, C., Vilarino, C., Fleischer, C.,
Ellerbrok, H., Kamuzinzi, R., Ledent, V., Blaudez, D., Sanders, D., Revuelta, J.L., Boles, E.,
André, B., and Frommer, W.B. (2004) K+ channel interactions detected by a genetic system
optimized for systematic studies of membrane protein interactions. Proc. Natl. Acad. Sci. USA.
101, 12242-12247.

29
Pandey, S., and Assmann, S.M. (2004) The Arabidopsis putative G protein-coupled receptor
GCR1 interacts with the G protein α subunit GPA1 and regulates abscisic acid signaling. Plant
Cell, 16, 1616-1632.
Sheen, J. (2001) Signal transduction in maize and Arabidopsis mesophyll protoplasts. Plant
Physiol. 127,1466-1475.
Tiwari, S., Wang, S., Hagen, G., and Guilfoyle, T.J. (2006) Transfection assays with protoplasts
containing integrated reporter genes. Methods Mol Biol. 323,237-244.
Wang, X.Q., Ullah, H., Jones, A.M., and Assmann, S.M. (2001) G protein regulation of ion
channels and abscisic acid signaling in Arabidopsis guard cells. Science. 292,2070-2072.