Sunyaev-Zel'dovich observation of the Bullet-like cluster Abell 2146 with the Arcminute Microkelvin...
14
arXiv:1011.0325v2 [astro-ph.CO] 16 Mar 2011 Mon. Not. R. Astron. Soc. 000, 000–000 (2010) Printed 21 January 2014 (MN L A T E X style file v2.2) Sunyaev-Zel’dovich observation of the Bullet-like cluster Abell 2146 with the Arcminute Microkelvin Imager ⋆ AMI Consortium: Carmen Rodr´ ıguez-Gonz´ alvez 1 † Malak Olamaie, 1 ‡ Matthew L. Davies, 1 Andy C. Fabian, 2 Farhan Feroz, 1 Thomas M. O. Franzen, 1 Keith J. B. Grainge, 1,3 Michael P. Hobson, 1 Natasha Hurley-Walker, 1 Anthony N. Lasenby, 1,3 Guy G. Pooley, 1 Helen R. Russell, 2 Jeremy S. Sanders, 2 Richard D. E. Saunders, 1,3 Anna M. M. Scaife, 4 Michel P. Schammel, 1 Paul F. Scott, 1 Timothy W. Shimwell, 1 David J. Titterington, 1 Elizabeth M. Waldram, 1 and Jonathan T. L. Zwart 5 1 Astrophysics Group, Cavendish Laboratory, 19 J. J. Thomson Avenue, Cambridge CB3 0HE 2 Institute of Astronomy, Madingley Road, Cambridge CB3 0HA 3 Kavli Institute for Cosmology Cambridge, Madingley Road, Cambridge, CB3 0HA 4 Dublin Institute for Advanced Studies, 31 Fitzwilliam Place, Dublin 2, Ireland 5 Columbia Astrophysics Laboratory, Columbia University, 550 West 120th Street, New York, NY 10027, USA Accepted ????. Received ???? ABSTRACT We present 13.9 −18.2-GHz observations of the Sunyaev-Zel’dovich (SZ) effect towards Abell 2146 using the Arcminute Microkelvin Imager (AMI). The cluster is detected with a peak signal-to-noise ratio of 13σ in the radio source subtracted map from 9 hours of data. Compar- ison of the SZ image with the X-ray image from Russell et al. (2010) suggests that both have extended regions which lie approximately perpendicular to one another, with their emission peaks significantly displaced. These features indicate non-uniformities in the distributions of the gas temperature and pressure, and suggest complex dynamics indicative of a cluster merger. We use a fast, Bayesian cluster analysis to explore the high-dimensional parameter space of the cluster-plus-sources model to obtain robust cluster parameter estimates in the presence of radio point sources, receiver noise and primordial CMB anisotropy; despite the substantial radio emission from the direction of Abell 2146, the probability of SZ + CMB pri- mordial structure + radio sources + receiver noise to CMB + radio sources + receiver noise is 3 × 10 6 : 1. We compare the results from three different cluster models. Our preferred model exploits the observation that the gas fractions do not appear to vary greatly between clusters. Given the relative masses of the two merging systems in Abell 2146, the mean gas temperature can be deduced from the virial theorem (assuming all of the kinetic energy is in the form of internal gas energy) without being affected significantly by the merger event, provided the primary cluster was virialized before the merger. In this model we fit a simple spherical isothermal β-model to our data, despite the inadequacy of this model for a merging system like Abell 2146, and assume the cluster follows the mass-temperature relation of a virialized, singular, isothermal sphere. We note that this model avoids inferring large-scale cluster parameters internal to r 200 under the widely used assumption of hydrostatic equilib- rium. We find that at r 200 the average total mass M T = (4.1 ± 0.5) × 10 14 h −1 M ⊙ and the mean gas temperature T = 4.5 ± 0.5 keV. 1 INTRODUCTION Galaxy clusters are the largest collapsed structures known to exist in the Universe. The masses of rich clusters can reach ≈ 10 15 h −1 M ⊙ and the more distant ones, from around z > 0.2, subtend several ar- cminutes on the sky due to the slow variation of the angular di- ameter distance with redshift. As a result, clusters are powerful tracers of structure formation and evolution on scales of the or- der of a few megaparsecs. According to the standard Λ Cold Dark Matter (ΛCDM) model, galaxy clusters form via hierarchical in- teractions of smaller subsystems. During merger, these subclusters collide at relative velocities of thousands of kms −1 and can release gravitational binding energies of up to ∼ 10 57 J, which can lead
Transcript of Sunyaev-Zel'dovich observation of the Bullet-like cluster Abell 2146 with the Arcminute Microkelvin...

arX
iv:1
011.
0325
v2 [
astr
o-ph
.CO
] 16
Mar
201
1
Mon. Not. R. Astron. Soc.000, 000–000 (2010) Printed 21 January 2014 (MN LATEX style file v2.2)
Sunyaev-Zel’dovich observation of the Bullet-like cluster Abell 2146with the Arcminute Microkelvin Imager ⋆
AMI Consortium: Carmen Rodrıguez-Gonzalvez1† Malak Olamaie,1‡Matthew L. Davies,1 Andy C. Fabian,2 Farhan Feroz,1
Thomas M. O. Franzen,1 Keith J. B. Grainge,1,3 Michael P. Hobson,1
Natasha Hurley-Walker,1 Anthony N. Lasenby,1,3 Guy G. Pooley,1
Helen R. Russell,2 Jeremy S. Sanders,2 Richard D. E. Saunders,1,3
Anna M. M. Scaife,4 Michel P. Schammel,1 Paul F. Scott,1
Timothy W. Shimwell,1 David J. Titterington,1 Elizabeth M. Waldram,1
and Jonathan T. L. Zwart51 Astrophysics Group, Cavendish Laboratory, 19 J. J. ThomsonAvenue, Cambridge CB3 0HE2 Institute of Astronomy, Madingley Road, Cambridge CB3 0HA3 Kavli Institute for Cosmology Cambridge, Madingley Road, Cambridge, CB3 0HA4 Dublin Institute for Advanced Studies, 31 Fitzwilliam Place, Dublin 2, Ireland5 Columbia Astrophysics Laboratory, Columbia University, 550 West 120th Street, New York, NY 10027, USA
Accepted ????. Received ????
ABSTRACTWe present 13.9−18.2-GHz observations of the Sunyaev-Zel’dovich (SZ) effect towards Abell2146 using the Arcminute Microkelvin Imager (AMI). The cluster is detected with a peaksignal-to-noise ratio of 13σ in the radio source subtracted map from 9 hours of data. Compar-ison of the SZ image with the X-ray image from Russell et al. (2010) suggests that both haveextended regions which lie approximately perpendicular toone another, with their emissionpeaks significantly displaced. These features indicate non-uniformities in the distributionsof the gas temperature and pressure, and suggest complex dynamics indicative of a clustermerger. We use a fast, Bayesian cluster analysis to explore the high-dimensional parameterspace of the cluster-plus-sources model to obtain robust cluster parameter estimates in thepresence of radio point sources, receiver noise and primordial CMB anisotropy; despite thesubstantial radio emission from the direction of Abell 2146, the probability of SZ+ CMB pri-mordial structure+ radio sources+ receiver noise to CMB+ radio sources+ receiver noiseis 3 × 10⁶ : 1. We compare the results from three different cluster models. Our preferredmodel exploits the observation that the gas fractions do notappear to vary greatly betweenclusters. Given the relative masses of the two merging systems in Abell 2146, the mean gastemperature can be deduced from the virial theorem (assuming all of the kinetic energy isin the form of internal gas energy) without being affected significantly by the merger event,provided the primary cluster was virialized before the merger. In this model we fit a simplespherical isothermalβ-model to our data, despite the inadequacy of this model for amergingsystem like Abell 2146, and assume the cluster follows the mass-temperature relation of avirialized, singular, isothermal sphere. We note that thismodel avoids inferring large-scalecluster parameters internal tor200 under the widely used assumption of hydrostatic equilib-rium. We find that atr200 the average total massMT = (4.1± 0.5) × 1014h−1M⊙ and the meangas temperatureT = 4.5± 0.5 keV.
1 INTRODUCTION
Galaxy clusters are the largest collapsed structures knownto existin the Universe. The masses of rich clusters can reach≈ 1015h−1M⊙and the more distant ones, from aroundz> 0.2, subtend several ar-cminutes on the sky due to the slow variation of the angular di-ameter distance with redshift. As a result, clusters are powerful
tracers of structure formation and evolution on scales of the or-der of a few megaparsecs. According to the standardΛ Cold DarkMatter (ΛCDM) model, galaxy clusters form via hierarchical in-teractions of smaller subsystems. During merger, these subclusterscollide at relative velocities of thousands of kms−1 and can releasegravitational binding energies of up to∼ 1057 J, which can lead

2 AMI Consortium: Rodrıguez-Gonzalvez et al.
to shocks in the intracluster medium (IM). These conditionsmakecluster mergers ideal places to study the dynamics of matterunderextreme conditions. The three assumed main components compris-ing the cluster, namely galaxies, hot ionized gas and dark matter,exhibit very different behaviours during subcluster mergers. Thehot intergalactic gas is heated and compressed by the hydrodynam-ical shocks produced during the passage of the subcluster throughthe core of the primary, whereas the dark matter and galaxiesarecollisionless (see e.g. Markevitch et al. (2007)). As a result, the gasis slowed down by ram pressure and is displaced from the darkmatter and the galaxies. Later, when the subcluster reachesregionsof lower gas density in the primary cluster, the ram pressuredropssharply. Without as much ram pressure, the gas pressure and sub-cluster gravity cause some of the subcluster gas, which had beenlagging behind the subcluster’s dark matter centre, to ‘slingshot’past it. This gas is then left unbound from the subcluster andfreeto expand adiabatically (Hallman et al. 2004).
Abell 2146 is a cluster atz = 0.23 consisting of two mergingsubclusters. The smaller subcluster passed through the centre of thelarger subcluster some 0.1 − 0.3 Gyrs ago producing shock frontswhich have been detected by Chandra (Russell et al. 2010). Theseshock fronts are unusual features which only show at a specificstage in the cluster merger, before the shock reaches the outer, low-surface-brightness regions, and at angles on the sky plane whichusually prevents the projection from hiding the density edge. There-fore, it is not surprising that shock fronts with Mach numbers sig-nificantly greater than one have only been detected in two otherclusters: 1E0657-56 (Markevitch et al. 2002) –the “Bullet cluster”–and A520 (Markevitch 2006). Unlike A520, the Bullet clusterandAbell 2146 appear to be at an early stage of the merger event, wherethe cluster dynamics are simpler and the separation of the hot gasand the dark matter components is clearer.
The thermal Sunyaev-Zeldovich (SZ) effect provides an inde-pendent way of exploring the physics of the intracluster gasandexamining typical cluster parameters such as core radius and gasmass. When Cosmic Microwave Background (CMB) photons tra-verse a rich galaxy cluster some will be inverse-Compton scatteredby the random thermal motion of the electrons in the intraclustergas (Sunyaev & Zel’dovich 1970; Birkinshaw 1999). Unlike X-raysurface brightness, SZ surface brightness is independent of redshiftand is therefore well suited for the study of galaxy clustersat anyredshift. It is also less sensitive than X-ray measurementsto small-scale clumping and the complex dynamics associated with theclus-ter core.
In this paper we present 16-GHz SZ effect images of Abell2146 using AMI. In Section 2 we discuss the telescope, while de-tails of the observations and the reduction pipeline are given in Sec-tion 3. In Section 4 Bayesian inference is introduced. Section 5 de-scribes our analysis methodology while in Section 6 and Section7 we present the results and discuss their significance. We presentour conclusions in Section 8.
Throughout the paper we assume a concordanceΛCDM cos-mology withΩm,0 = 0.3,ΩΛ,0 = 0.7,Ωk = 0,Ωb = 0.041,w0 = −1,wa = 0, σ8 = 0.8 andH0 = 100 km s−1Mpc−1. Relevant param-eters are given in terms of the dimensionless Hubble parameterh = H0/100 km s−1 Mpc−1, except where otherwise stated. We alsorefer to hX = H0/X km s−1 Mpc−1. All coordinates are at epochJ2000.
Table 1. AMI technical summary
SA LA
Antenna diameter 3.7 m 12.8 m
Number of antennas 10 8
Baseline lengths (current) 5− 20 m 18− 110 m
Primary beam at 15.7 GHz 20′.1 5
′.5
Synthesized beam ≈ 3′
≈ 30′′
Flux sensitivity 30 mJy s−1/2 3 mJy s−1/2
Observing frequency 13.9− 18.2GHz 13.9− 18.2GHz
Bandwidth 4.3 GHz 4.3 GHz
Number of channels 6 6
Channel bandwidth 0.72 GHz 0.72 GHz
Table 2. Assumed I+Q flux densities of 3C286 and 3C48, and errors on fluxmeasurements in each frequency channel, over the commonly-used AMISA bandwidth.
Channel ν/GHz S3C286/Jy S3C48/Jy σS
3 14.2 3.61 1.73 6.5%
4 15.0 3.49 1.65 5.0%
5 15.7 3.37 1.57 4.0%
6 16.4 3.26 1.49 3.5%
7 17.1 3.16 1.43 4.0%
8 17.9 3.06 1.37 7.0%
2 THE TELESCOPE
AMI comprises two arrays: the Small Array (SA) which con-sists of ten 3.7-m diameter antennas, and the Large Array (LA)with eight 13-m antennas, located at Lord’s Bridge, Cambridge(AMI Consortium: Zwart et al. 2008). The higher resolution andflux sensitivity of the LA allows contaminating radio sources tobe dealt with. These sources can then be subtracted from theSA maps. A summary of the technical details of AMI is givenin Table 1. Further details on the telescope can be found inAMI Consortium: Zwart et al. (2008).
3 OBSERVATIONS AND DATA REDUCTION
Observations of Abell 2146 were made by the SA and LA be-tween November 2009 and March 2010, yielding approximately9 hours of good quality SA data; approximately the same amountof data suffered from artifacts and was discarded. Data reductionwas perfomed usingreduce, a local software tool developed forthe Very Small Array (VSA) (Watson et al. 2003) and AMI (seee.g. AMI Consortium: Zwart et al. (2008) for further details). Thispackage is designed to apply path delay corrections and a series ofalgorithms tailored to remove automatically bad data points arisingfrom interference, shadowing, hardware and other errors. We ap-ply amplitude clips at a 3σ level. Periods where the data has been

Sunyaev-Zel’dovich observation of Abell 21463
contaminated by interference are excised. These interference sig-nals are identified as persistent high amplitude signals in the lagdomain, which appear in all the lag channels. The system temper-ature is monitored by a modulated noise signal sent to the front-end of each antenna and synchronously detected at the end of eachintermediate-frequency channel and is used inreduce to correctthe amplitude scale on an antenna basis. If the system temperaturefalls below 10% of the nominal value of an antenna the associateddatapoints are removed. For further details on the AMI reductionpipeline see Hurley-Walker (2009). Additional manual flagging ofremaining bad data points is done to ensure the quality of thedata.The correlator data are then Fourier transformed into the frequencydomain and stored on disk in FITS format.
Flux calibration was performed using short observations ofprimary calibrators, either 3C48 or 3C286. The flux densities for3C48 and 3C286, see Table 2, are in agreement with Baars et al.(1977) at 16-GHz. Since Baars et al. (1977) measure I, as opposedto AMI which measures I+Q, the flux densities were corrected byinterpolating from VLA 5-, 8- and 22- GHz observations. Previoustests have shown this calibration to be accurate to better than 5 percent (AMI Consortium: Scaife et al. 2009). The phase is calibratedusing interleaved calibrators selected from the Jodrell Bank VLASurvey (Patnaik et al. 1992; Browne et al. 1998; Wilkinson etal.1998) based on their proximity and flux density. The phase cali-brators used for the observations of Abell 2146 were J1642+6856for the SA and J1623+6624 for the LA. These phase calibratorswere interleaved approximately every hour for the SA and everyten minutes for the LA.
3.1 Source subtraction
Contamination from radio point sources at≈ 15 GHz can signifi-cantly obscure the SZ signal and must therefore be taken intoac-count in any SZ effect analyses at these frequencies. The higherresolution and flux sensitivity of the LA is exploited to deter-mine the position of the sources in the SA maps accurately in ashort amount of time. Local maxima on the continuum LA mapsabove 4σn, whereσn is the corresponding value in Janskys perbeam at that pixel in the noise map, are identified as LA de-tected sources using AMI-developed source extraction software(see AMI Consortium: Franzen et al. (2010)). Out of these LA-detected sources only those which appear within 0.1 of the SApower primary beam having an apparent flux above 4σn on the SAmap are included in the source model.
Every source in the source model is parameterized by aposition, a spectral index and a flux density whose priors arebased on the LA measurements. The source model is analysedby McAdam (Monte Carlo Astronomical Detection and Measure-ment), a Bayesian analysis package for cluster detection and pa-rameter extraction developed by Marshall et al. (2003) and adaptedfor AMI by Feroz et al. (2009), which fits a probability distribu-tion to the source flux densities at the positions given by theLA.The source flux densities are fitted by McAdam to allow for pos-sible intercalibration difference between the two AMI arrays andfor source variability. The mean source flux-density valuesare thenused to subtract the sources from the SA map.
4 BAYESIAN ANALYSIS OF CLUSTERS
4.1 Bayesian inference
The cluster analysis software implemented in this paper(Marshall et al. 2003) is based on Bayesian inference. This robustmethodology constrains a set of parameters,Θ, given a model orhypothesis,H and the corresponding data,D, using Bayes’ theo-rem:
Pr(Θ|D,H) ≡Pr(D|Θ,H) Pr(Θ|H)
Pr(D|H). (1)
Here Pr(Θ|D,H) ≡ P(Θ) is the posterior probability distribution ofthe parameters, Pr(D|Θ,H) ≡ L(Θ) is the likelihood, Pr(Θ|H) ≡π(Θ) is the prior probability distribution and Pr(D|H) ≡ Z theBayesian evidence. If chosen wisely, incorporating the prior knowl-edge into the analysis reduces the amount of parameter spaceto besampled and allows meaningful model selection. Bayesian infer-ence can serve as a tool for two main purposes:
(i) Parameter estimation—In this case, the evidence factorcanbe neglected since it is independent of the model parameters, Θ.Sampling techniques can then be used to explore the unnormalizedposterior distributions. One obtains a set of samples from the pa-rameter space distributed according to the posterior. Constraints onindividual parameters can then be obtained by marginalising overthe other parameters.
(ii) Model selection—The evidence is crucial for ranking mod-els for the data. It is defined as the factor required for normalisingthe posterior overΘ:
Z =
∫L(Θ)π(Θ)dD
Θ, (2)
whereD is the dimensionality of the parameter space. This factorrepresents an average of the likelihood over the prior and will there-fore favour models with high likelihood values throughout the en-tirety of parameter space. This satisfies Occam’s razor which statesthat the evidence will be larger for simple models with compactparameter spaces than for more complex ones, unless the latter fitthe data significantly better. Deciding which of two models,H0 andH1, best fits the data can be done by computing the ratio
Pr(H1|D)Pr(H0|D)
=Pr(D|H1)Pr(H1)Pr(D|H0)Pr(H0)
=Z1
Z0
Pr(H1)Pr(H0)
, (3)
wherePr(H1)Pr(H0) is the prior probability ratio set before any conclusions
have been drawn from the dataset.
4.2 Nested sampling
Nested sampling is a Monte Carlo method introduced bySkilling et al. (2004) which focuses on the efficient calculation ofevidences and generates posterior distributions as a by-product.Feroz & Hobson (2008) and Feroz, Hobson & Bridges (2009) havedeveloped this sampling framework and implemented the Multi-Nest algorithm. This algorithm can sample from posterior distribu-tions where multiple modes and/or large (curving) degeneracies arepresent. This robust technique has reduced by a factor of≈ 100 thecomputational costs incurred during Bayesian parameter estima-tion and model selection. For this reason the analysis in this paperis based on this technique.

4 AMI Consortium: Rodrıguez-Gonzalvez et al.
5 PHYSICAL MODEL AND ASSUMPTIONS
5.1 Interferometric data model
An interferometer, like AMI, operating at a frequency,ν, measuresamples from the complex visibility planeIν(u). These are given bya weighted Fourier transform of the surface brightness,Iν(x):
Iν(u) =∫
Aν(x)Iν(x)exp(2πiu · x)d2x, (4)
where x is the position relative to the phase centre,Aν(x) is the(power) primary beam of the antennas at an observing frequency, ν(normalized to unity at its peak) andu is the baseline vector in unitsof wavelength. In our model we assume the measured visibilitiescan be defined as
Vν(ui) = Iν(ui) + Nν(ui), (5)
whereIν(u) is the signal component, which contains contributionsfrom the cluster SZ effect signal and identified radio point sourcesandNν(ui) is a generalized noise component that includes signalsfrom unresolved point sources, primordial CMB anisotropies andinstrumental noise.
5.2 Cluster models
In order to calculate the contribution of the cluster SZ signal to thevisibility data the Comptonization parameter of the cluster, y(s),across the sky must be determined (see Feroz et al. (2009) forfur-ther details). This parameter is the integral of the gas pressure alongthe line of sightl through the cluster:
y(s) =σT
mec2
∞∫
−∞
nekBTdl ∝∫ +rlim
−rlim
ρgTdl, (6)
whereσT is the Thomson scattering cross-section,ne is the electronnumber density, which is derived from equation (9),me is the elec-tron mass,c is the speed of light andkB is the Boltzmann constant.s = θDθ is the deprojected radius such thatr2 = s2 + l2 andDθ isthe angular diameter distance to the cluster which can be calculatedfor clusters at redshifts,z, using
Dθ =c∫ z
0H−1 (z′) dz′
(1+ z). (7)
We set r lim in equation (6) to 20h−1Mpc—this result has beentested and shown to be large enough even for small values ofβ
(Marshall et al. 2003).The cluster geometry, as well as two linearly independent
functions of its temperature and density profiles, must be specifiedto compute the Comptonization parameter. For the cluster geome-try we have chosen a spherical cluster model as a first approxima-tion. The temperature profile is assumed to be constant throughoutthe cluster. An isothermalβ-model is assumed for the cluster gasdensity,ρg (Cavaliere & Fusco-Fermiano 1978):
ρg(r) =ρg(0)
[1+
(rrc
)2] 3β
2
, (8)
where
ρg(r) = µene(r), (9)
µe = 1.14mp is the gas mass per electron andmp is the proton mass.The core radius,rc, gives the density profile a flat top at lowrrc
andρg has a logarithmic slope of 3β at large r
rc.
Parameter estimates can depend on the way the cluster modelis parameterized. We examine the impact of different physical as-sumptions by presenting the parameter estimates for Abell 2146obtained using three different cluster parameterizations (or ‘mod-els’). Modelled sources for all three models are characterised bythree parameters: position, flux density and spectral index. The cor-responding priors for these parameters are given in Section5.3.2.The parameterizations of the sources and the source priors are thesame in all three models, unlike the cluster parameterizations whichdo change between models. The mean values fitted by our McAdamsoftware to both the source and cluster sampling parameterswill,however, vary for each cluster model. We proceed to describeourthree cluster parameterizations and their results.
Tables 4 and 3 indicate which parameters are derived in eachmodel and the assumptions made in each case. A summary of thesampling parameters for each model together with their priors isgiven in Table 5.
5.2.1 Cluster model 1
Our first model, henceforth M1, is based on traditional methods forthe analysis of SZ and X-ray data. The sampling parameters for M1are:
• (xc, yc)—the position of the cluster centroid on the sky.• T—the temperature of the cluster gas, which is assumed to be
uniform.• β—defines the outer logarithmic slope of theβ-profile.• rc—gives the density profile a flat top at lowr• Mg(r200)—the gas mass inside a radius,r200, which is the ra-
dius at which the average total density is 200 timesρcrit, the criticaldensity for closure of the Universe.• z—the cluster redshift.
In applying this cluster model to Abell 2146 bothz andT areassumed to be known, which is equivalent to assigning them delta-function priors (see Table 5) .
The derived parameters for M1 are:
• rX—the radius at which the average total density isX timesρcrit.• MT(rX)—the total cluster mass within the radiusrX.• Mg(rX)—the cluster gas mass within the radiusrX.• fg(rX)—the cluster average gas fraction within the radiusrX.• ρg(0)—the central gas density.• y(0)—the central Comptonization parameter.
In this model, the cluster gas is assumed to be in hydrostaticequilibrium with the total gravitational potential of the cluster,Φ,which is dominated by dark matter. As a result, the gravitationalpotential must satisfy
dΦdr= −
1ρg
dpdr. (10)
This equation can be simplified if the cluster gas consists purely ofideal gas with a uniform temperature,T, to give
d logρg
dlogr= −
GµkBT
MT (r)r, (11)
where µ is the mass per particle,µ ≈ 0.6mp ≈0.61.14µe (see
Marshall et al. 2003). Expressions for the total mass of the cluster,MT(rX), can be obtained for spherical symmetry:
MT(rX) =4π3
r3XXρcrit , (12)
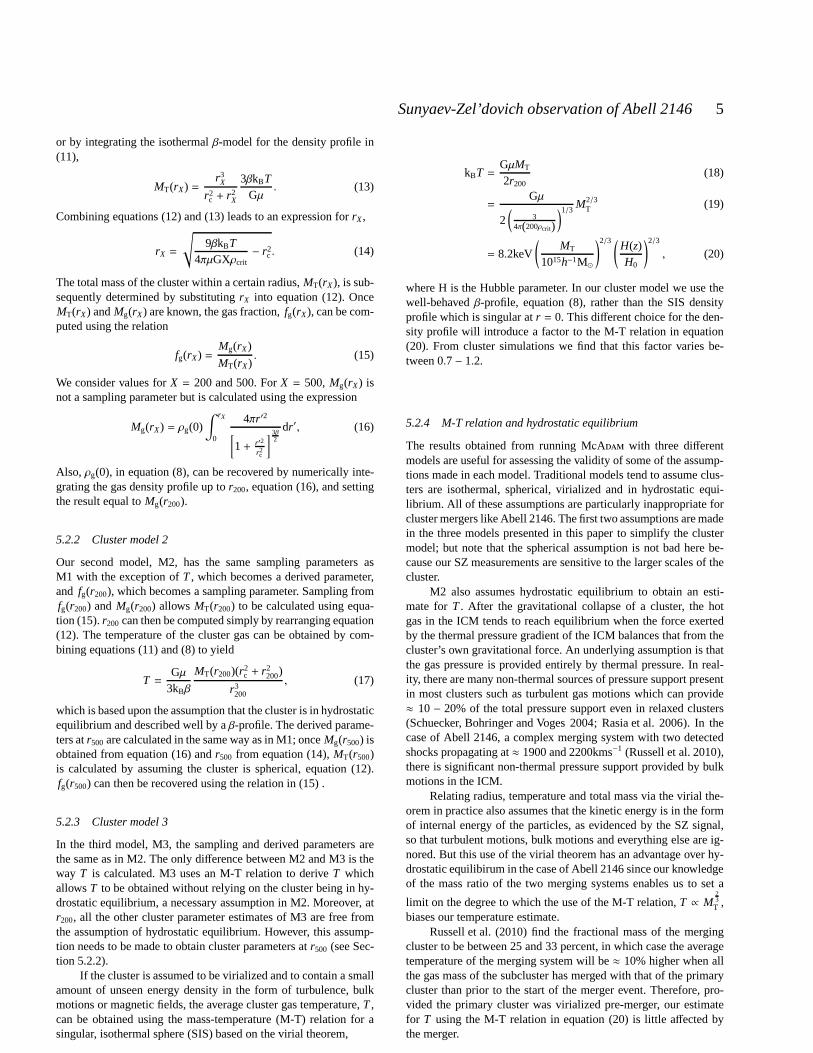
Sunyaev-Zel’dovich observation of Abell 21465
or by integrating the isothermalβ-model for the density profile in(11),
MT(rX) =r3
X
r2c + r2
X
3βkBTGµ
. (13)
Combining equations (12) and (13) leads to an expression forrX,
rX =
√9βkBT
4πµGXρcrit− r2
c. (14)
The total mass of the cluster within a certain radius,MT(rX), is sub-sequently determined by substitutingrX into equation (12). OnceMT(rX) andMg(rX) are known, the gas fraction,fg(rX), can be com-puted using the relation
fg(rX) =Mg(rX)
MT(rX). (15)
We consider values forX = 200 and 500. ForX = 500, Mg(rX) isnot a sampling parameter but is calculated using the expression
Mg(rX) = ρg(0)∫ rX
0
4πr ′2
[1+ r′2
r2c
] 3β2
dr ′, (16)
Also, ρg(0), in equation (8), can be recovered by numerically inte-grating the gas density profile up tor200, equation (16), and settingthe result equal toMg(r200).
5.2.2 Cluster model 2
Our second model, M2, has the same sampling parameters asM1 with the exception ofT, which becomes a derived parameter,and fg(r200), which becomes a sampling parameter. Sampling fromfg(r200) and Mg(r200) allows MT(r200) to be calculated using equa-tion (15).r200 can then be computed simply by rearranging equation(12). The temperature of the cluster gas can be obtained by com-bining equations (11) and (8) to yield
T =Gµ
3kBβ
MT(r200)(r2c + r2
200)
r3200
, (17)
which is based upon the assumption that the cluster is in hydrostaticequilibrium and described well by aβ-profile. The derived parame-ters atr500 are calculated in the same way as in M1; onceMg(r500) isobtained from equation (16) andr500 from equation (14),MT(r500)is calculated by assuming the cluster is spherical, equation (12).fg(r500) can then be recovered using the relation in (15) .
5.2.3 Cluster model 3
In the third model, M3, the sampling and derived parameters arethe same as in M2. The only difference between M2 and M3 is theway T is calculated. M3 uses an M-T relation to deriveT whichallowsT to be obtained without relying on the cluster being in hy-drostatic equilibrium, a necessary assumption in M2. Moreover, atr200, all the other cluster parameter estimates of M3 are free fromthe assumption of hydrostatic equilibrium. However, this assump-tion needs to be made to obtain cluster parameters atr500 (see Sec-tion 5.2.2).
If the cluster is assumed to be virialized and to contain a smallamount of unseen energy density in the form of turbulence, bulkmotions or magnetic fields, the average cluster gas temperature,T,can be obtained using the mass-temperature (M-T) relation for asingular, isothermal sphere (SIS) based on the virial theorem,
kBT =GµMT
2r200(18)
=Gµ
2(
34π(200ρcrit)
)1/3M2/3
T (19)
= 8.2keV
(MT
1015h−1M⊙
)2/3 (H(z)H0
)2/3
, (20)
where H is the Hubble parameter. In our cluster model we use thewell-behavedβ-profile, equation (8), rather than the SIS densityprofile which is singular atr = 0. This different choice for the den-sity profile will introduce a factor to the M-T relation in equation(20). From cluster simulations we find that this factor varies be-tween 0.7− 1.2.
5.2.4 M-T relation and hydrostatic equilibrium
The results obtained from running McAdam with three differentmodels are useful for assessing the validity of some of the assump-tions made in each model. Traditional models tend to assume clus-ters are isothermal, spherical, virialized and in hydrostatic equi-librium. All of these assumptions are particularly inappropriate forcluster mergers like Abell 2146. The first two assumptions are madein the three models presented in this paper to simplify the clustermodel; but note that the spherical assumption is not bad herebe-cause our SZ measurements are sensitive to the larger scalesof thecluster.
M2 also assumes hydrostatic equilibrium to obtain an esti-mate forT. After the gravitational collapse of a cluster, the hotgas in the ICM tends to reach equilibrium when the force exertedby the thermal pressure gradient of the ICM balances that from thecluster’s own gravitational force. An underlying assumption is thatthe gas pressure is provided entirely by thermal pressure. In real-ity, there are many non-thermal sources of pressure supportpresentin most clusters such as turbulent gas motions which can provide≈ 10− 20% of the total pressure support even in relaxed clusters(Schuecker, Bohringer and Voges 2004; Rasia et al. 2006). Inthecase of Abell 2146, a complex merging system with two detectedshocks propagating at≈ 1900 and 2200kms−1 (Russell et al. 2010),there is significant non-thermal pressure support providedby bulkmotions in the ICM.
Relating radius, temperature and total mass via the virial the-orem in practice also assumes that the kinetic energy is in the formof internal energy of the particles, as evidenced by the SZ signal,so that turbulent motions, bulk motions and everything elseare ig-nored. But this use of the virial theorem has an advantage over hy-drostatic equilibirum in the case of Abell 2146 since our knowledgeof the mass ratio of the two merging systems enables us to set a
limit on the degree to which the use of the M-T relation,T ∝ M23T ,
biases our temperature estimate.Russell et al. (2010) find the fractional mass of the merging
cluster to be between 25 and 33 percent, in which case the averagetemperature of the merging system will be≈ 10% higher when allthe gas mass of the subcluster has merged with that of the primarycluster than prior to the start of the merger event. Therefore, pro-vided the primary cluster was virialized pre-merger, our estimatefor T using the M-T relation in equation (20) is little affected bythe merger.

6 AMI Consortium: Rodrıguez-Gonzalvez et al.
Table 4. Summary of the main assumptions made in the calculation of the derived parameters for each model. H stands for hydrostatic equilibrium, M-T forthe mass-temperature relation given in equation (20) , B forisothermalβ-profile, S for spherical geometry and N/A means not applicable, since that parameteris a sampling parameter for that particular model.
Model Assumptions
Derived Parameter Model 1 Model 2 Model 3
r200/h−1 Mpc H, S, B; Eq. 14 S; Eq.12 S; Eq.12
MT(r200) S; Eq.12 Eq.15 Eq.15
fg(r200)/h−1 Eq.15 N/A N/A
Mg(r500)/h−2M⊙ S, B; Eq.16 S, B; Eq.16 S, B; Eq.16
r500/h−1 Mpc H, S, B; Eq.14 H, S, B; Eq.14 H, S, B; Eq.14
MT(r500) S; Eq.12 S; Eq.12 S; Eq.12
fg(r500)/h−1 Eq.15 Eq.15 Eq.15
T keV N/A H; Eq.17 M-T; Eq.20
Table 3. Summary of the derived parameters for each cluster model.
Derived Parameter Model
r200 & r500/h−1 Mpc All
MT(r200) & MT(r500)/h−1M⊙ All
Mg(r500)/h−2M⊙ All
y All
ne All
T keV M2, M3
fg(r200)/h−1 M1
fg(r500)/h−1 All
5.3 Priors
5.3.1 Cluster priors
For simplicity the priors are assumed to be separable. The priorsused in the analysis of Abell 2146 are given in Table 5.
We note that, although the prior onMg(r200) assumes the clus-ter produces a non-zero SZ effect, it is wide enough that our resultswill not be biased. In fact, our posterior distributions forMg(r500)peak atMg(r500) > 3 × 10¹³/h−2M⊙ and have fallen to zero byMg(r500) > 2 × 10¹³/h−2M⊙, while our prior forMg(r200) extendsdown to 1× 10¹³/h−2M⊙
The prior on the gas mass fraction was set to a Gaussiancentered at the WMAP7 best-fit value,fg = 0.12h−1, with σ =0.016h−1. This result was obtained from WMAP7 estimates ofΩm = 0.266± 0.029,Ωb = 0.0449± 0.0028 andh = 0.710± 0.025using the relationfb =
ΩbΩm
, where fb is the universal baryon frac-tion (Larson et al. 2010). The prior onfg can be based onfb sincefg in clusters at large radii approachesfb. The prior on the positionof the cluster was a Gaussian withσ = 60′′ centered at the X-raycentroid.
5.3.2 Source priors
As with the cluster priors, the source priors are assumed to be sep-arable, such that
π (ΘS) = π (xs) π (ys) π (S0) π (α) .
π (xs) andπ (ys) are given delta priors at the source positionfound from the high-resolution LA maps. The flux-density priorsfor modelled sources on the other hand are chosen to be Gaussianscentered on the flux-density value given by the LA withσ ≈ 40%of the LA source flux. Tight constraints on the flux-density pri-ors are best avoided due to inter-array calibration differences andsource variability. The channel flux densities taken from the LAdata are used to calculate an estimate for the spectral indexof eachsource. The spectral index prior is then set as a Gaussian centeredat the predicted LA value with a widthσ = 1.
6 RESULTS
6.1 Maps and evidences
Fifteen sources were detected above 4σn on the LA map, Fig. 1.McAdam was used to determine the flux densities and spectral in-dices of these sources in the SA data. The standard AIPS taskswereused toclean the images with a singleclean box. No primary beamcorrection has been applied to the AMI maps presented in thispapersuch that the thermal noise,σn, is constant throughout the map. Thetask imean was applied to the data to determine the noise level onthe maps. Contours increasing linearly in units ofσn were used toproduce all the contour maps. The half-power contour of the syn-thesized beam for each map is shown at the bottom left of eachmap.
Further analysis was undertaken in the visibility plane takinginto account receiver noise, radio sources, and contributions fromprimary CMB imprints. Figs 2 and 3 show the SA maps of Abell2146 before and after radio source subtraction. The source sub-traction was performed at the LA source position using the meanflux-density estimates given by the McAdam results of M3, Table 6.Sources with a high signal-to-noise ratio and close to the pointingcentre tend to have good agreement between flux densities mea-sured by the LA and those obtained by McAdam. Possible reasons

Sunyaev-Zel’dovich observation of Abell 21467
Table 5. Summary of the priors for the sampling parameters in each model.
Parameter Models Prior Type Values Origin
xc, yc′′ all gaussian atxX-ray, σ = 60
′′15h56m07s, +6621.′35.′′ Ebeling et al. (2000)
β all uniform 0.3− 2.5 Marshall et al. (2003)
Mg(r200)/h−2M⊙ all uniform in log 1013 − 1015 physically reasonable
rc/h−1kpc all uniform 10− 1000 physically reasonable
z all delta 0.23 Ebeling et al. (2000)
fg(r200)/h−1 M2, M3 gaussian,σ = 0.016 0.12 Larson et al. (2010)
T keV M1 delta 6.7 Russell et al. (2010)
for source flux-density discrepancies between the arrays, in partic-ular for the remaining sources, include: a poorer fit of the Gaussianmodelled primary beam at largeuv-distances from the pointing cen-tre, loss of signal due to the white light fringes falling off the endof the correlator, time and bandwidth smearing, correlatorartifacts,source variability and, some sources with low signal-to-noise ratiosdetected on the LA, might appear as noise features on the SA.
It should be noted that, since a single flux-density value isused for subtracting the modelled sources in the map-plane,theradio source subtracted map does not reflect the uncertaintyinthe McAdam derived flux-density estimates1. Nevertheless, flux-density estimates given by McAdam have been tested in Feroz et al.(2009) and shown to be reliable. Fig. 9 shows that there is no de-generacy between the flux density fitted for source A in Fig. 3 andthe fitted values forMg(r200), the cluster gas mass withinr200 Thedetection of Abell 2146 in the AMI data is confirmed by compar-ing the evidence obtained by running McAdam with a model in-cluding SZ+ CMB primordial structure+ radio sources+ receivernoise and the null evidence, which corresponds to a model with-out a cluster, i.e. simply CMB+ radio sources+ receiver noise.The first model, which included an SZ feature, was found to bee15
times more probable than one without.In Fig. 4 a 0.6-kλ taper is used to enhance large scale struc-
ture and consequently the signal-to-noise ratio of the SZ effect. Thepeak decrement in it is≈ 13σ.
The AMI SZ maps are compared to the Chandra X-ray emis-sion and projected temperature maps for Abell 2146 in the discus-sion, Section 7.
6.2 Parameter estimates from three cluster models
McAdam was run on the same Abell 2146 data for each of the threemodels described in 5.2. The results obtained for these models areshown in Figs 5 to 11. The contours in all the 2D marginalizedposterior distributions represent 68% and 95% confidence limits.Axis labels forMg(r200) are in units of 1013 for clarity.
1 Note that, unlike for the radio source subtracted maps, whenobtainingestimates for the cluster parameters the whole probabilitydistribution forthe source flux density is taken into account, such that a larger uncertaintyin the source flux densities will lead to wider distributionsin the clusterparameters.
Cont peak flux = 5.8479E-03 JY/BEAM Levs = 1.806E-04 * (-10, -9, -8, -7, -6, -5, -4,-3, 3, 4, 5, 6, 7, 8, 9, 10)
DECLINATION (J2000)
RIGHT ASCENSION (J2000)16 00 15 59 58 57 56 55 54 53 52
66 45
40
35
30
25
20
15
10
05
00
65 55
Figure 1. LA contour map.
Cont peak flux = 5.3271E-03 JY/BEAM Levs = 1.202E-04 * (-10, -9, -8, -7, -6, -5, -4,-3, -2, 2, 3, 4, 5, 6, 7, 8, 9, 10)
DECLINATION (J2000)
RIGHT ASCENSION (J2000)15 58 00 57 30 00 56 30 00 55 30 00 54 30 00
66 35
30
25
20
15
10
Figure 2. SA map before source subtraction. The crosses indicate the posi-tion of the sources detected on the LA map.

8 AMI Consortium: Rodrıguez-Gonzalvez et al.
Table 6. List of the detected sources with their J2000 position coordinates, as determined by the LA map. Columns 3 and 4 show the flux densities of thedetected sources at 16-GHz (S16) given by McAdam using M3 with their associated Gaussian errors. For comparison, the LA measured flux densities at thesame frequency are given. The letters represent the labeledsources in Fig. 3.
Source RA (h m s) Dec (o ′ ′′ ) McAdam-fitted S16(mJy) σ LA S16(mJy)
A 15 56 04.23 +66 22 12.94 5.92 0.18 5.95
B 15 54 30.95 +66 36 39.58 0.60 0.29 0.61
C 15 56 14.30 +66 20 53.45 1.83 0.14 1.70
D 15 56 36.51 +66 35 21.65 2.15 0.15 1.65
E 15 55 57.42 +66 20 03.11 1.65 0.08 1.64
F 15 58 10.23 +66 24 35.72 1.49 0.12 1.29
G 15 54 03.96 +66 28 41.90 1.12 0.15 0.74
H 15 55 25.67 +66 22 03.96 0.48 0.05 0.67
I 15 55 10.84 +66 19 45.82 0.61 0.06 0.65
J 15 57 09.46 +66 22 37.62 0.43 0.06 0.63
K 15 54 47.50 +66 28 37.43 0.91 0.09 0.53
L 15 54 49.11 +66 14 21.49 0.72 0.09 0.47
M 15 56 15.40 +66 22 44.48 0.16 0.07 0.43
N 15 56 27.90 +66 19 43.82 0.11 0.05 0.33
O 15 57 56.10 +66 22 49.80 0.30 0.07 0.49
Cont peak flux = -1.3725E-03 JY/BEAM Levs = 1.408E-04 * (-10, -8, -6, -4, -2, 2, 4, 6,8, 10, 12)
DECLINATION (J2000)
RIGHT ASCENSION (J2000)15 58 00 57 30 00 56 30 00 55 30 00 54 30 00
66 35
30
25
20
15
10
A
CE
F
G
H
I
J
K
L
M
N
O
Figure 3. SA contour map after source subtraction. The letters represent theposition of the sources detected on the LA map.
6.2.1 Cluster model 1
The 2-D and 1-D marginalized posterior probability distributionsfor the parameters of M1 are depicted in Figs. 5 and 6, respectively.
M1 is representative of the more conventional method for ex-tracting cluster parameters from SZ data. In this model, theaver-age cluster gas temperature withinr200 is assumed to be known,from X-ray measurements, allowing the morphology of the cluster,namelyrX, to be inferred by assuming the cluster is spherical, in hy-
Cont peak flux = -1.9027E-03 JY/BEAM Levs = 1.500E-04 * (-10, -9, -8, -7, -6, -5, -4,-3, -2, 2, 3, 4, 5, 6, 7, 8, 9, 10)
DECLINATION (J2000)
RIGHT ASCENSION (J2000)15 58 00 57 30 00 56 30 00 55 30 00 54 30 00
66 35
30
25
20
15
10
Figure 4. SA map after source subtraction using a 0.6-kλ taper. The crossesrepresent the position of the sources detected on the LA map.
drostatic equilibrium and described well by an isothermalβ-model.The overall bias onrX arises from all of these assumptions, whichare particularly unphysical in a cluster merger like Abell 2146, andis therefore expected to be large. Indeed, by comparing Figs. 6 and11 we find thatr200 is overestimated with respect to the value ob-tained in M3, our most physically motivated model. Moreover, inM1, Mg(rX) for X = 500 and 1000 depends onrX, which results in

Sunyaev-Zel’dovich observation of Abell 21469
2 4 6M
g(r
200)/h−2M
Sun
y0/a
rcse
c
−30−20−10
010
r c/h
−1kp
c
500
1000
β
0.51
1.52
2.5
x0/arcsec
Mg(r
20
0)/
h−
2M
Su
n
0 20 40
2
4
6
y0/arcsec
−30 −10 10rc/h−1kpc500 1000
β0.5 1.5 2.5
Figure 5. Two-dimensional marginalized posterior distributions for thesampling parameters of Abell 2146—M1.
0.5 1 1.5 2 2.5 3
x 1015M
T(r
500)/h−1M
Sun
1 2 3 4 5
x 1015M
T(r
200)/h−1M
Sun
2 3 4 5 6
x 1013M
g(r
500)/h−2M
Sun
0 0.02 0.04 0.06 0.08 0.1fg(r
500)/h−1
0 0.02 0.04 0.06 0.08fg(r
200)/h−1
0.8 1 1.2 1.4r500
/h−1Mpc
1.4 1.6 1.8 2 2.2r200
/h−1Mpc
Figure 6. One-dimensional posterior probability distributions forselectedderived parameters of Abell 2146—M1. We note that the axes for the plotsof the 1-D and 2-D marginalized posterior distributions of both the samplingand derived parameters are tailored to suit the results of each model and willtherefore be different in each case
.
the bias onrX to be propagated to the remaining derived parametersfor these values ofX.
6.2.2 Cluster model 2
The 2-D and 1-D marginalized posterior probability distributionsfor the parameters of M2 are depicted in Figs 7 and 8.
M2 introduces a new sampling parameter,fg(r200). Samplingfrom this parameter allows more prior information to be included
0.1 0.15fg(r
200)/h−1
y0/a
rcse
c
−20
0
20
r c/h
−1kp
c
500
1000
β
0.51
1.52
2.5
Mg(r
20
0)/
h−
2M
Su
n
5
10
x0/arcsec
f g(r
20
0)/
h−
10 20 40
0.1
0.15
y0/arcsec
−20 0 20rc/h−1kpc500 1000
β0.5 1.5 2.5
Mg(r
200)/h−2M
Sun
5 10
Figure 7. Two-dimensional marginalized posterior distributions for thesampling parameters of Abell 2146—M2.
0 1 2 3 4
x 1014M
T(r
500)/h−1M
Sun
4 5 6 7 8 9
x 1014M
T(r
200)/h−1M
Sun
3 4 5 6 7 8
x 1013M
g(r
500)/h−2M
Sun
0 0.1 0.2 0.3fg(r
500)/h−1
0.6 0.65 0.7 0.75 0.8 0.85r500
/h−1Mpc1.1 1.2 1.3 1.4
r200
/h−1Mpc
2 3 4 5 6T/KeV
Figure 8. One-dimensional marginalized posterior distributions for the de-rived parameters of Abell 2146—M2.
in the analysis, which has the effect of constraining the parame-ter distributions better than in M1. It has a great advantageoverM1, namely, the only parameter obtained by assuming hydrostaticequilibrium is the temperature, which is not used explicitly in thecalculation of the other derived parameters atr200.
Fig. 9 shows the two-dimensional marginalized posterior dis-tribution for the flux density of source A,SA, and Mg(r200)–wechoose to plotSA since source A is the brightest source close to thepointing centre. One can see from Fig. 9 thatSA and Mg(r200) donot appear to be significantly correlated. This is confirmed by thesample correlation, which was found to be 0.12. We note that thesample correlation remains unaffected by shifts of origin or changesof scale inSA andMg(r200). The flux density of source A is given

10 AMI Consortium: Rodrıguez-Gonzalvez et al.
Mg(r
200)/h−1M
Sun
SA/J
y
5 6 7 8 9 10
x 1013
5.3
5.4
5.5
5.6
5.7
5.8
5.9
6
6.1
6.2
6.3
x 10−3
Figure 9. Two-dimensional marginalized posterior distribution forthe fluxof source A shown in Fig. 3,SA, and the cluster gas mass withinr200,Mg(r200).
a Gaussian prior and yet the LA-measured and McAdam-derivedflux-density estimates for this source are very close.
6.2.3 Cluster model 3
The 1-D and 2-D marginalized posterior probability distributionsfor the parameters of M3 are presented in Figs 10 and 11.
The only difference between M2 and M3 is in how the averagecluster gas temperature atr200, T, is calculated. To obtain an esti-mate forT, M2 assumes the cluster is in hydrostatic equilibriumwhile M3 uses the M-T relation in equation (20), which assumesthe cluster is virialized and contains no unseen energy density.
7 DISCUSSION
7.1 Comparison with X-ray maps
Two new Chandra observations of Abell 2146 were taken in April2009 (Russell et al. 2010). Fig. 13 shows the exposure-corrected X-ray image taken in the 0.3 − 5.0 keV energy band smoothed witha 2D Gaussian ofσ = 1.5 arcseconds superimposed with the AMISZ effect from Fig. 3. The AMIuv-coverage is well-filled and goesdown to≈ 180λ which corresponds to a maximum angular scale of≈ 10 arcminutes or a cluster radius of≈ 1.1 Mpc. Thus, in practice,the SZ signal traces a more extended region of the gas than theX-ray data. Any small features in the cluster environment are notresolved by the SA maps which consequently appear much moreuniform than the X-ray maps. Nevertheless, given the synthesizedbeams in Figs. 3 and 4 the SZ effects in these two figures appear toshow signs of some real extended emission. To verify that we haveresolved the SZ decrement we bin the data from thecleaned, radiosource subtracted, non-tapered map of Abell 2146, Fig. 2, inbinsof 100λ and plot it against baseline, see Fig. 12. The signal steadilybecomes more negative from scales of 800λ to 200λ; it is on theselarger scales that we find the most negative binned value for the SZdecrement, demonstrating the sensitivity of the SA to largeangular
0.1 0.15fg(r
200)/h−1
y0/a
rcse
c
−40−20
0
r c/h
−1kp
c
500
1000
β
0.51
1.52
2.5
Mg(r
20
0)/
h−
2M
Su
n
4
6
x0/arcsec
f g(r
20
0)/
h−
10 20 40
0.1
0.15
y0/arcsec
−40 −20 0rc/h−1kpc500 1000
β0.5 1.5 2.5
Mg(r
200)/h−2M
Sun
4 6
Figure 10. Two-dimensional marginalized posterior distributions for thesampling parameters of Abell 2146—M3.
0 1 2 3
x 1014M
T(r
500)/h−1M
Sun
2 3 4 5
x 1014M
T(r
200)/h−1M
Sun
2 3 4 5 6
x 1013M
gas(r
500)/h−2M
Sun
0 0.1 0.2 0.3fg(r
500)/h−1
0.3 0.4 0.5 0.6 0.7r500
/h−1Mpc1 1.05 1.1 1.15 1.2 1.25
r200
/h−1Mpc
2 3 4 5 6 7T/KeV
Figure 11. One-dimensional marginalized posterior distributions for the de-rived parameters of Abell 2146—M3.
scales. To determine the shape of the cluster in greater detail highresolution SZ observations are needed.
During a cluster merger, elongations in the dark matter andgas components are expected. In general, the orientation ofthiselongation for both components tends to be parallel to the mergeraxis, though the gas component can also be extended in a directionperpendicular to the merger axis due to adiabatic compressions inthe ICM (Roettiger et al. 1997), as shown in simulations of clustermergers (Poole et al. 2007). We fitted a six-component (position,peak intensity, major and minor axes and position angle) ellipticalGaussian to the SZ decrement in our 0.6 tapered map, Fig. 4, anda zero level using the AIPS task JMFIT. The results for the param-eters defining the shape of the fitted ellipse are given in Table 7.
Sunyaev-Zel’dovich observation of Abell 214611
Mill
iJan
skys
Kilo Wavelength0.0 0.2 0.4 0.6 0.8 1.0
0.0
-0.5
-1.0
-1.5
-2.0
-2.5
-3.0
-3.5
-4.0
-4.5
-5.0
Figure 12. Binned data from thecleaned, radio source subtracted, non-tapered map of Abell 2146 in bins of 100λ against baseline (in kλ). Itshould be noted that the FWHM of the aperture illumination function ofthe AMI SA is≈ 185λ such that the visibilities in each bin are not entirelyindependent. The baseline distance corresponding to the McAdam derivedparemetersr200, r500 and r1000 were found to be 0.42kλ,0.816kλ, 1.46kλ,respectively.
Table 7. JMFIT results for the parameters of the ellipse fitted to the SZdecrement in the 0.6-tapered SAcleaned maps. The extension of the minorand major axes are given in arcseconds and the position anglein degrees.
Nominal Minimum Maximum
Major axis 205 171 236
Minor axis 145 109 175
Position angle 46 3 68
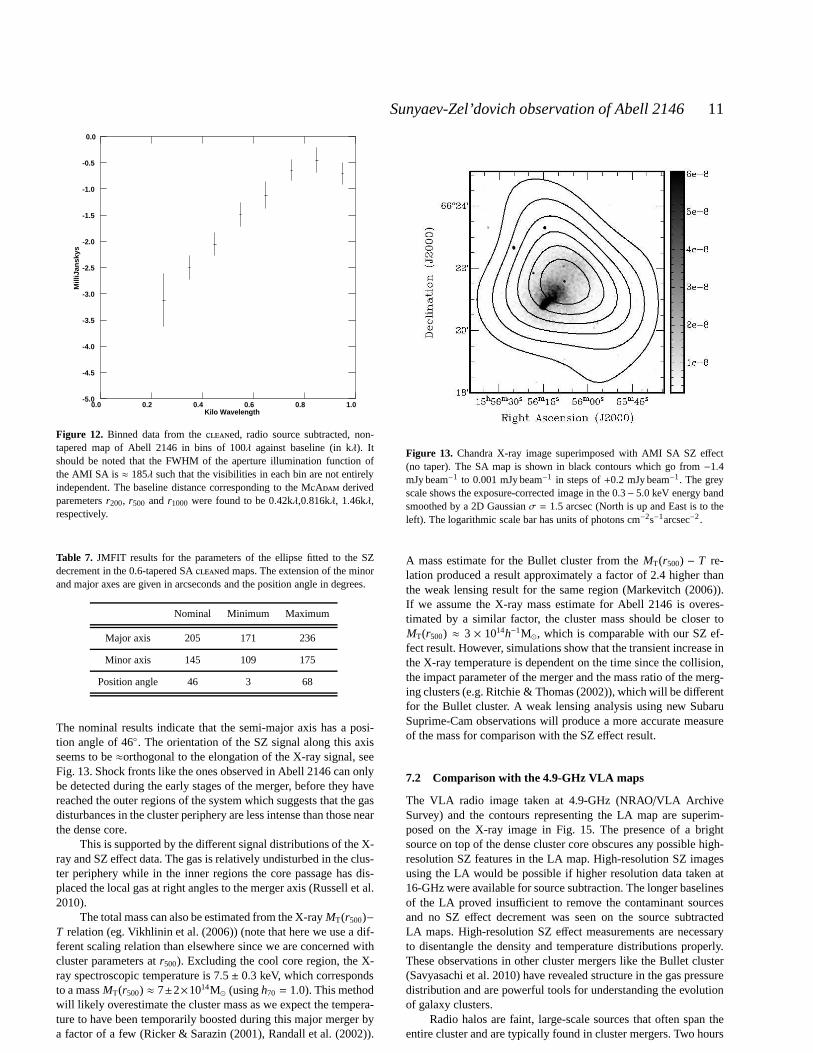
The nominal results indicate that the semi-major axis has a posi-tion angle of 46. The orientation of the SZ signal along this axisseems to be≈orthogonal to the elongation of the X-ray signal, seeFig. 13. Shock fronts like the ones observed in Abell 2146 canonlybe detected during the early stages of the merger, before they havereached the outer regions of the system which suggests that the gasdisturbances in the cluster periphery are less intense thanthose nearthe dense core.
This is supported by the different signal distributions of the X-ray and SZ effect data. The gas is relatively undisturbed in the clus-ter periphery while in the inner regions the core passage hasdis-placed the local gas at right angles to the merger axis (Russell et al.2010).
The total mass can also be estimated from the X-rayMT(r500)−T relation (eg. Vikhlinin et al. (2006)) (note that here we usea dif-ferent scaling relation than elsewhere since we are concerned withcluster parameters atr500). Excluding the cool core region, the X-ray spectroscopic temperature is 7.5± 0.3 keV, which correspondsto a massMT(r500) ≈ 7±2×10¹⁴M⊙ (usingh70 = 1.0). This methodwill likely overestimate the cluster mass as we expect the tempera-ture to have been temporarily boosted during this major merger bya factor of a few (Ricker & Sarazin (2001), Randall et al. (2002)).
Figure 13. Chandra X-ray image superimposed with AMI SA SZ effect(no taper). The SA map is shown in black contours which go from−1.4mJy beam−1 to 0.001 mJy beam−1 in steps of+0.2 mJy beam−1. The greyscale shows the exposure-corrected image in the 0.3− 5.0 keV energy bandsmoothed by a 2D Gaussianσ = 1.5 arcsec (North is up and East is to theleft). The logarithmic scale bar has units of photons cm−2s−1arcsec−2.
A mass estimate for the Bullet cluster from theMT(r500) − T re-lation produced a result approximately a factor of 2.4 higher thanthe weak lensing result for the same region (Markevitch (2006)).If we assume the X-ray mass estimate for Abell 2146 is overes-timated by a similar factor, the cluster mass should be closer toMT(r500) ≈ 3 × 10¹⁴h−1M⊙, which is comparable with our SZ ef-fect result. However, simulations show that the transient increase inthe X-ray temperature is dependent on the time since the collision,the impact parameter of the merger and the mass ratio of the merg-ing clusters (e.g. Ritchie & Thomas (2002)), which will be differentfor the Bullet cluster. A weak lensing analysis using new SubaruSuprime-Cam observations will produce a more accurate measureof the mass for comparison with the SZ effect result.
7.2 Comparison with the 4.9-GHz VLA maps
The VLA radio image taken at 4.9-GHz (NRAO/VLA ArchiveSurvey) and the contours representing the LA map are superim-posed on the X-ray image in Fig. 15. The presence of a brightsource on top of the dense cluster core obscures any possiblehigh-resolution SZ features in the LA map. High-resolution SZ imagesusing the LA would be possible if higher resolution data taken at16-GHz were available for source subtraction. The longer baselinesof the LA proved insufficient to remove the contaminant sourcesand no SZ effect decrement was seen on the source subtractedLA maps. High-resolution SZ effect measurements are necessaryto disentangle the density and temperature distributions properly.These observations in other cluster mergers like the Bulletcluster(Savyasachi et al. 2010) have revealed structure in the gas pressuredistribution and are powerful tools for understanding the evolutionof galaxy clusters.
Radio halos are faint, large-scale sources that often span theentire cluster and are typically found in cluster mergers. Two hours

12 AMI Consortium: Rodrıguez-Gonzalvez et al.
Figure 14. Projected temperature map(keV) (Russell et al. 2010) overlaidon black contours representing the SA SZ effect decrement. The contoursgo from−1.5 mJy beam−1 to 0.1 mJy beam−1 in steps of+0.1 mJy beam−1
and the grey linear scale indicates the temperature variation in keV.
of VLA observations in two configurations, C and D, towardsA520 revealed a radio halo with a power of 6.4 × 1024W Hz−1
(Govoni et al. 2001) at 1.4-GHz. The Bullet cluster was also foundto have a radio halo with a power of (4.3±0.3)×1025 W Hz−1 at 1.3-GHz (Liang et al. 2000). No low frequency radio data are currentlyavailable for Abell 2146. 4.9-GHz VLA observations of Abell2146do not show signs for a radio halo, Fig. 15, though deeper observa-tions, particularly at lower frequencies where radio halo emissiontends to be stronger, would be needed to determine whether a radiohalo is present in Abell 2146. Since such halos are characterizedby a steeply falling spectrum (e.g Hanisch (1980); Govoni etal.(2004)) and no radio halo emission was detected at 4.9-GHz, wedo not expect our observations to be contaminated by this diffuseemission.
A520 and 1E0657-56 are the only two clusters that have beenfound to have both bow shocks and radio halos. They have pro-vided unique information that allows determination of whatpro-portion of the ultrarelativistic electrons producing the radio haloare generated as a result of merger-driven turbulence, as opposedto shock acceleration (Markevitch et al. 2002; Markevitch 2006).Since Abell 2146 is the third cluster merger known to containsub-stantially supersonic shock fronts, finding a radio halo would sig-nificantly improve our current understanding of how they aregen-erated and powered.
7.3 Cluster Parameters
The cluster parameters obtained from M3, our preferred model, arediscussed below.
7.3.1 Position
The mean value for the position, RA 15h56m07s Dec + 6621.′33.′′,with errors of 6 and 7 arcseconds respectively, coincides with theX-ray centroid position, RA 15h56m07s Dec+6621.′35.′′, as shown
Figure 15. VLA 4.9-GHz map in thick, grey contours overlaid on theAMI LA map, in thin, black contours and the X-ray grey map fromChan-dra observations. The logarithmic grey scale corresponds to the exposure-corrected X-ray image taken in the 0.3 − 5.0 keV energy band smoothedwith a 2D Gaussian ofσ = 1.5 arcseconds and it is in units of photonscm−2s−1arcsec−2. The VLA and LA contours range from 0.5 mJy beam−1
to 9 mJy beam−1 in steps of 0.3 mJy beam−1.
in Fig. 13. However, the peak of the X-ray flux is significantlydis-placed from the peak of the SZ signal, as depicted in Fig. 13. TheX-ray spectral luminosity is proportional to
∫n2
eT−1/2dl, while the
SZ effect is a measure of the integrated line-of-sight pressure andis proportional to
∫neTdl. Therefore, the X-ray emission is more
sensitive to substructure than the SZ data and peaks at the positionof the dense cluster core.
7.3.2 β and rc
Results from running McAdam on large samples of clusters haveforced the prior onβ to be relaxed to include higher values (seeAMI Consortium: Zwart et al. (2008)). The distributions forβ tendto favour higher values than typical X-ray estimates. However, thisdiscrepancy is not surprising since previous studies have revealedincompatibilities in theβ fits between X-ray and SZ effect profilesdue to their different dependencies on parameters such as tempera-ture and density (Hallman et al. 2007). The results show the degen-eracy betweenrc andβ but also show evidence of strong constraintson this relation. This relation is positively correlated inM1 and M2,where the assumption of hydrostatic equilibrium is made to esti-mate parameters atr200, and negatively correlated in M3 where thisassumption is avoided.
7.3.3 Gas fraction
Sampling fromfg(r200) allows further prior information to be intro-duced into the model which leads to better constrained parameterestimates.
All the models were run through McAdam without data tocheck the effect of the priors on the results. From this test we dis-covered that in M1 the seemingly inconspicuous priors on thesam-pling parameters lead to an effective prior onfg that peaks around

Sunyaev-Zel’dovich observation of Abell 214613
0.01 and strongly disfavours values offg ≈ 0.1. Since in our currentmodels SZ data alone cannot place strong constraints onfg, the ef-fective prior biases low the estimates offg obtained in M1. On theother hand, when running M3 without data, the effective prior onfg does not change significantly from the Gaussian prior it was ini-tially given. Given the importance of analysing cluster models with-out any data to interpret their results, a detailed discussion of theseno-data runs and the effects of cluster parameterization are pre-sented in the forthcoming paper, AMI Consortium: Olamaie etal.(2011).
7.3.4 Temperature
The average cluster gas temperature withinr200 ≈ 900 kpc forh70 =
1.0 was found to be 4.5±0.5 keV. The projected emission-weightedtemperature map, Fig. 14, shows a range of X-ray temperaturemea-surements in different regions of the cluster. At the position of themost negative value of the SZ decrement, the X-ray temperature is≈ 8 keV whereas at a radius of≈ 500 kpc the temperature dropsbelow 5 keV. In Russell et al. (2010), a single-temperature fit to thecluster spectrum of Abell 2146 using an absorbed thermal plasmaemission model yields a temperature of 6.7+0.3
−0.2 keV. The higher X-ray temperature measurement is not surprising since M3’s derivedtemperature estimate refers to the mean cluster gas temperaturewithin r200 and therefore averages over scales where the temper-ature is lower. Moreover, emission-weighted temperatureswill behigher than mass weighted temperature estimates.
7.3.5 Total mass
Analytical and numerical simulations have already establishedthe integrated SZ signal as a robust tool for determining thetotal cluster mass (see e.g. Bartlett & Silk (1994); Barbosaet al.(1996); Eke, Cole & Frenk (1996); Da Silva et al. (2000);Kravtsov, Vikhlinin & Nagai (2006); Nagai (2006); Motl et al.(2005)). The measured SZ signal is sensitive to large scalesawayfrom the cluster core and is therefore able to provide an estimatefor the MT which is independent of the small-scale mechanismsthat regulate the state of the cluster gas near the core.
We find that, subject to the assumptions of M3 describedin Section 5.2.3, at the virial radius,r200, MT = (4.1± 0.5) ×1014h−1M⊙; note that this estimate is free from the assumption ofhydrostatic equilibrium.
8 CONCLUSION
The AMI 16-GHz observations of Abell 2146 presented in this pa-per show the Sunyaev-Zel’dovich effect produced by this clusterwith a peak signal-to-noise ratio of 13σ. We detect 15 4-σn sourceswithin 0.1 of the primary beam in the SA pointed map using thehigh resolution LA observations. These sources were subtractedfrom the SA maps at the LA position using the flux densities ob-tained from running our Bayesian analysis software, McAdam, onthe cluster model M3. Despite the substantial radio emission fromthe direction of Abell 2146, no significant contamination from ra-dio sources is visible on the maps.
We compare our SZ observations with X-ray data taken byChandra and find an offset between the peaks of the two signals. Weshow that the SA data resolves our SZ decrement and note that thedirections of the most pronounced elongations in the SZ and X-ray
signals seem to be at≈ 90 to each other. These results show com-plex dynamics indicative of a cluster merger and the differences inthe gas emission and pressure distributions.
We run McAdam, on three different cluster models, all ofwhich assume an isothermal, sphericalβ-model, and extract pos-terior probability distributions of large-scale cluster parameters ofAbell 2146 in the presence of radio point sources, primordial CMBand receiver noise. In M1, a model representative of more tradi-tional cluster parameterizations, the seemingly inconspicuous pri-ors on the sampling parameters lead to an effective prior on the de-rived parameterfg(r200) which biases low this parameter and leadsto further biases in other model parameters.
M2 and M3 exploit the observation that the gas fractions donot appear to vary greatly between clusters and sample directlyfrom fg(r200)—introducing further constraints in our parameterspace and avoiding the bias problem in M1. The difference betweenM2 and M3 lies in the derivation of the global cluster gas tempera-ture,T. M2 assumes the cluster is in hydrostatic equilibrium whilein M3 T can be deduced from the virial theorem (assuming all ofthe kinetic energy is in the form of internal gas energy). Given therelative masses of the two merging systems in Abell 2146 and,pro-vided the primary cluster was virialized before the merger,we findthat theT derived from the M-T relation in M3 will change by≈ 10% K during the merger.
The results from M2 and M3 are consistent, despite differ-ences in the mean values of the large-scale cluster parameters.However, we choose to focus on the results obtained in M3 sincethis model overcomes some of the shortcomings of more tradi-tional models and its global temperature estimate is not signifi-cantly affected by the merger event. We find that atr200 MT =
(4.1± 0.5) × 1014h−1M⊙, β = 1.7 ± 0.3, T = 4.5 ± 0.5 keV andcore radiusrc = 358± 100h−1 kpc. We also find that the probabilityof SZ+ CMB primordial structure+ radio sources+ receiver noiseto CMB+ radio sources+ receiver noise is 3× 10⁶ : 1.
ACKNOWLEDGMENTS
We thank the referee, Mark Birkinshaw, for helpful suggestions andcomments. We are grateful to the staff of the Cavendish Labora-tory and the Mullard Radio Astronomy Observatory for the main-tenance and operation of AMI. We acknowledge support from theUniversity of Cambridge and PPARC/STFC for funding and sup-porting AMI. ACF also acknowledges the Royal Society. CRG,HR, MLD, MO, MPS, TMOF, TWS are grateful for support fromPPARC/STFC studentships. This work was carried out using theDarwin Supercomputer of the University of Cambridge High Per-formance Computing Service (http://www.hpc.cam.ac.uk/), pro-vided by Dell Inc. using Strategic Research InfrastructureFundingfrom the Higher Education Funding Council for England and theAltix 3700 supercomputer at DAMTP, University of Cambridgesupported by HEFCE and STFC. We thank Stuart Rankin for hiscomputing support.
REFERENCES
Baars J. W. M., Genzel R., Pauliny-Toth I. I. K., Witzel A., 1977,A&A, 61, 99
Barbosa D., Bartlett J. G., Blanchard A., Oukbir J., 1996, A&A,314, 13
Bartlett J. G., Silk J., 1994, ApJ, 423, 12

14 AMI Consortium: Rodrıguez-Gonzalvez et al.
Birkinshaw M., 1999, Physical Reports, 310, 97Birkinshaw M., Lancaster K., 2008, Lecture Notes in Physics,740, 255
Borgani S., & Guzzo L., 2001, Nature, 409, 39Browne I. W. A., Wilkinson P. N., Patnaik A. R., Wrobel J. M.,1998, MNRAS, 293, 257G
Cavaliere A. & Fusco-Fermiano R., 1978, A & A, 70, 677Chieze J-P., Alimi J-M. & Teyssier R, 1998, ApJ, 495, 630Da Silva A. .C., Barbosa D., Liddle A, Thomas P. A., 2000, MN-RAS, 326, 155
AMI Consortium: Franzen T. M. O. et al., 2010, arXiv:1012.3711Ebeling, H. and Edge, A. C. and Allen, S. W. and Crawford, C. S.and Fabian, A. C. and Huchra & J. P., 2000, MNRAS, 318, 333
Ebeling H. & Wiedenmann G., 1993, Phys. Rev E., 47, 704Eke V. R., Cole S. & Frenk C. S., 1996, MNRAS, 282, 263Feretti L., Giovannini G., 2008, A Pan-Chromatic View of Clus-ters of Galaxies and the Large-Scale structure, edited by M.Plio-nis, O. Lopez-Cruz and D. Hughes. Lecture Notes in Physics Vol.740.474, p.143
Feroz F., Hobson M. P., 2008, MNRAS, 384, 449Feroz F., Hobson M. P., Bridges M., 2009, MNRAS, 398, 4Feroz F., Hobson M. P., Zwart T. L. et al., 2009, MNRAS, 398,2049
Govoni F., Feretti L., Giovannini G., Bohringer H., Reiprich T. H.,Murgia M., 2001, A & A, 376, 803
Govono F., Markevitch M., Vikhlinin A., VanSpeybroeck L., Fer-etti L., Giovannini G., 2004, ApJ, 605, 695
Hanisch R. J., 1980, AJ, 85, 1565Hallman E. J., Burns J. O., Motl P. M. Norman, Michael L., 2007,ApJ, 665, 911
Hallman E. J., Markevitch M., 2004, ApJ, 610, L81Hogbom J. A., 1974, A & A. Suppl., 15, 417Hurley-Walker N., 2009, PhD Thesis, Cambridge UniversityLiang H., Hunstead R. W., Birkinshaw M., Andreani P., 2000,ApJ, 544, 686
Jeltema T. E., Canizares C. R., Bautz M. W. & Buote D. A., 2005,ApJ, 624, 606
Jones M. E. et al., 1993, Nat, 365, 320Rines K., Geller M. J., Diaferio A., 2010, ApJ, 715, 2 180-184Knebe A. & Muller V. , 1999, A & A, 341, 1Kravtsov A. V., Vikhlinin A., Nagai D., 2006, ApJ, 650, 128Larson D., Dunkley J., Hinshaw G., Komatsu E. et al., 2010,arXiv:1001.4635
Loken C., Norman M. L., Nelson E., Burns J., Bryan, G. L.,Motl P., 2002, ApJ, 579, 571
AMI Consortium: Olamaie M., Rodrıguez-Gonzalvez C. et al.,2010, arXiv:1012.4996
Markevitch M. et al., 2000, ApJ, 541, 542Markevitch M., Gonzalez A. H., David L., Vikhlinin A., Mur-ray S., Forman W., Jones C. & Tucker W., 2002, ApJ, 567, L27
Markevitch M., Vikhlinin A., 2007, Phys. Rep., 443, 1Markevitch M., in ESA Special Publication, 604, A. Wilson, ed,The X-ray Universe, 2005, 723
Marshall P. J., Hobson M. P. & Slozar A., 2003, MNRAS, 346,489
Mason B. S., Myers S. T., 2000, ApJ, 540, 614Maughan B. J., Jones L. R., Forman W. & Van Speybroeck L.,2008, ApJS, 174, 117
Motl P. M., Hallman E. J., Burns J. O, Norman M. L., 2005, ApJ,623, 63
Nagai D., 2006, ApJ, 650, 538Nagai D., Vikhlin A & Kravtsov A., 2007, ApJ, 655, 98
Patnaik A. R., Browne I. W. A., Wilkinson P. N., Wrobel J. M.,1992, MNRAS, 254, 655
Gregory B., Poole V., Mark A. et al., 2007, MNRAS, Volume 380,2,437-454.
Randall S. W., Sarazin C. L. & Ricker P. M., 2002, ApJ, 577, 579Rasia E., Ettori S., Moscardini L, et al., 2006, MNRAS, 369, 2013Ricker P. M. & Sarazin C. L., 2001, ApJ, 561, 621Ritchie B. & Thomas P. A., 2002, MNRAS, 329, 675Roettiger K., Loken C., & Burns J. O., 1997, ApJSS, 109, 307Russell, H. R. and Sanders, J. S. and Fabian, A. C. and Baum, S.A. and Donahue, M. and Edge, A. C. and McNamara, B. R. andO’Dea, C. P., 2010, MNRAS
Sarazin C., 1988, X-ray Emission from Clusters of Glaxies, Cam-bridge University Press
Savyaschi M. S., Subrahmanyan R., Wieringa M, et al., 2010,arXiv:1005.1394
AMI Consortium: Scaife A. M. M., Green D., Pooley G. et al.,2009, MNRAS, 403, 46
Schuecker P., Bohringer H., Voges W., 2004, A & A, 420, 61Skilling J., Fischer R., Preuss R et al., 2004, AIP Conf. Ser.,Bayesian Inference and Maximum Entropy Methods in Scienceand Engineering. Am. Inst. Phys., New York, 735, 395
Sunyaev R. A., & Zel’dovich Y. B., 1970, Comments on Astro-physics and Space, 2, 66
Takizawa M., 1998, ApJ, 509, 579Takizawa M., Nagino R. & Matsushita K., 2010, PASJVikhlinin A., Markevitch M., Murray S. S., Jones C., Forman W.,Van Speybroeck L., 2005, ApJ, 628, 655
Vikhlinin A., Kravtsov A., Forman W., Jones C., Markevitch M.,Murray S. S., Van Speybroeck L., 2006, ApJ, 640, 691
Watson R. A., Carreira P., Cleary K. et al., 2003, MNRAS, 341,1057
Wilkinson P. N., Browne I. W. A., Patnaik A. R., Wrobel J. M.,Sorathia B., 1998, MNRAS, 300, 790
AMI Consortium: Zwart J. T. L., Barker R. W., Biddulph P. et al.,2008, MNRAS, 391, 1545