Weak lensing mass distributions for 24 X-Ray Abell Clusters
23
arXiv:astro-ph/0310009v1 30 Sep 2003 Weak lensing mass distributions for 24 X-Ray Abell Clusters. 1 Eduardo S. Cypriano and Laerte Sodr´ e Jr. Departamento de Astronomia, Instituto de Astronomia, Geof´ ısica e Ciˆ encias Atmosf´ ericas da USP, Rua do Mat˜ ao, 1226, 05508-900, S˜ ao Paulo, Brazil eduardo,[email protected] Jean-Paul Kneib Observatoire Midi-Pyr´ en´ ees, Laboratoire d’Astrophysique, UMR 5572, 14 Avenue E. Belin, 31400 Toulouse, France and Caltech, Astronomy, 105-24, Pasadena, CA 91125, USA [email protected],[email protected] Luis E. Campusano Observatorio Astron´ omico Cerro Cal´ an, Departamento de Astronom´ ıa, Universidad de Chile, Casilla 36-D, Santiago, Chile [email protected] ABSTRACT We use the weak gravitational lensing effect to study the mass distribution and dynamical state of a sample of 24 X-ray luminous clusters of galaxies (0.05 <z< 0.31) observed with the FORS1 instrument mounted on the VLT-Antu (Unit Telescope 1) under homogeneous sky conditions and subarsecond image quality. The galaxy shapes were measured in the combined V, I, R image after deconvolution with a locally determined point-spread-function, while the two-dimensional mass distributions of the clusters were computed using an algorithm based on the maximum entropy method. By comparing the mass and light distributions of the clusters in our sample, we find that their mass centers, for the majority of the clusters, is consistent with the positions of optical centers. We find that some clusters present significant mass substructures which generally have optical counterparts. At least in one cluster (Abell 1451), we detect a mass substructure without an obvious luminous counterpart. The radial profile of the shear of the clusters was fitted using circular and elliptical isothermal elliptical distributions, which allowed the finding of a strong correlation between the orientation of the major-axis of the matter distribution and the corresponding major-axes of the brightest cluster galaxy light-profiles. Estimates of how close to dynamical relaxation are these clusters were obtained through comparison of our weak- lensing mass measurements with the x-ray and velocity dispersion determinations available in the literature. We find that clusters with intra-cluster gas colder than 8 keV show a good agreement between the different mass determinations, but clusters with gas hotter than 8 keV present discrepant mass values. The clusters diagnosed to be out of equilibrium are Abell 1451, 2163 and 2744, all of them having hints of substructure. Abell 2744 presents the largest discrepancy between its X-ray and weak-lensing temperature determinations, which can be interpreted as being due to the interaction between the two kinematical components along the line of sight found by Girardi & Mezzeti (2001). Subject headings: cosmology: observations- dark matter - galaxies: clusters: general- galaxies: clusters: individual (Abell 2744, Abell 1451, Abell 2163)- gravitational lensing 1
Transcript of Weak lensing mass distributions for 24 X-Ray Abell Clusters
arX
iv:a
stro
-ph/
0310
009v
1 3
0 Se
p 20
03
Weak lensing mass distributions for 24 X-Ray Abell Clusters. 1
Eduardo S. Cypriano and Laerte Sodre Jr.Departamento de Astronomia, Instituto de Astronomia, Geofısica e Ciencias Atmosfericas da USP, Rua do
Matao, 1226, 05508-900, Sao Paulo, Brazil
eduardo,[email protected]
Jean-Paul KneibObservatoire Midi-Pyrenees, Laboratoire d’Astrophysique, UMR 5572, 14 Avenue E. Belin, 31400
Toulouse, France and Caltech, Astronomy, 105-24, Pasadena, CA 91125, USA
[email protected],[email protected]
Luis E. CampusanoObservatorio Astronomico Cerro Calan, Departamento de Astronomıa, Universidad de Chile, Casilla 36-D,
Santiago, Chile
ABSTRACT
We use the weak gravitational lensing effect to study the mass distribution and dynamical stateof a sample of 24 X-ray luminous clusters of galaxies (0.05 < z < 0.31) observed with the FORS1instrument mounted on the VLT-Antu (Unit Telescope 1) under homogeneous sky conditionsand subarsecond image quality. The galaxy shapes were measured in the combined V, I, R imageafter deconvolution with a locally determined point-spread-function, while the two-dimensionalmass distributions of the clusters were computed using an algorithm based on the maximumentropy method. By comparing the mass and light distributions of the clusters in our sample, wefind that their mass centers, for the majority of the clusters, is consistent with the positions ofoptical centers. We find that some clusters present significant mass substructures which generallyhave optical counterparts. At least in one cluster (Abell 1451), we detect a mass substructurewithout an obvious luminous counterpart. The radial profile of the shear of the clusters wasfitted using circular and elliptical isothermal elliptical distributions, which allowed the findingof a strong correlation between the orientation of the major-axis of the matter distribution andthe corresponding major-axes of the brightest cluster galaxy light-profiles. Estimates of howclose to dynamical relaxation are these clusters were obtained through comparison of our weak-lensing mass measurements with the x-ray and velocity dispersion determinations available in theliterature. We find that clusters with intra-cluster gas colder than 8 keV show a good agreementbetween the different mass determinations, but clusters with gas hotter than 8 keV presentdiscrepant mass values. The clusters diagnosed to be out of equilibrium are Abell 1451, 2163and 2744, all of them having hints of substructure. Abell 2744 presents the largest discrepancybetween its X-ray and weak-lensing temperature determinations, which can be interpreted asbeing due to the interaction between the two kinematical components along the line of sightfound by Girardi & Mezzeti (2001).
Subject headings: cosmology: observations- dark matter - galaxies: clusters: general- galaxies: clusters:individual (Abell 2744, Abell 1451, Abell 2163)- gravitational lensing
1
1. Introduction
The emergence of mass structures in the uni-verse is currently linked to primordial densityperturbations, dominated by cold dark matter,through a hierarchical clustering process involvinggravitational instabilities. A natural consequenceof this bottom-up scenario is that the most mas-sive structures form later in time, and, depend-ing on the world models, they are expected toshow signatures of their assembling history. Sincegalaxy clusters are possibly the largest (nearly)virialized structures (e.g. Press & Schechter 1974),the study of their main properties (masses, shapes,radial profiles etc.) can provide valuable clueson the details of the agglomeration of matter inthe universe and hence on the nature of the darkmatter (e.g. Kauffmann et al. 1999). Clusterscan also be used as cosmological probes provid-ing additional data that, together with cosmic mi-crowave background observations, can be used onthe determination of several cosmological parame-ters. Studies of their mass function (e.g. Henry &Arnaud 1991; Reiprich & Bohringer 2002), mass-to-light ratio (e.g. Bahcall Lubin,& Dorman; Carl-berg et al. 1996) and baryon fraction (e.g. White& Frenk 1991; Allen, Schmidt & Fabian 2002) canprovide constraints on key cosmological parame-ters, like the mass density parameter, ΩM , thebias, and on the power-spectrum amplitude andshape parameter (Lacey & Cole 1994; Bahcall &Fan 1998).
Galaxy clusters are complex systems that holdtogether galaxies, hot gas and dark matter. Thesecomponents are governed by different physicalmechanisms and their study requires the use ofdifferent observational techniques. Imaging in vis-ible light, reveals the cluster through their mem-ber galaxies which we know now that contributeonly a small fraction of the cluster total mass.But, if these galaxies are in virial equilibrium, thedepth of the cluster potential well can be accessedthrough their velocity dispersion, although thecontinuous accretion of field galaxies can bias themass measurements to higher values (e.g. Sodre etal. 1989). The thin hot gas– mainly hydrogen–that permeates the cluster gravitational poten-tial is found to be at temperatures of the order
1Based on observations collected with ESO Very LargeTelescope Antu (UT1)
of 107 − 108 K, thus fully ionized and emittingX-rays via thermal bremsstrahlung process (seeSarazin 1988, for a more complete discussion).The emission in the X-ray band provides an effi-cient method to find galaxy clusters, and estimatesof the cluster masses if the hypothesis that the gasis in hydrodynamical equilibrium is adopted. Theadvantage of using the hot intracluster gas ratherthan the member galaxies for mass determinationsis that it has a much shorter relaxation time dueto its self-interactivity (Sarazin 1988). Neverthe-less, there is evidence, that many clusters presentsignificant departures from dynamical relaxation(e.g. Geller & Beers 1982; Sodre et al. 2001). Pre-sumably the clusters that are in the top or themass function will achieve last their formation pro-cess, so we expect to find some degree of correla-tion between the departures from equilibrium andthe mass of the clusters.
The development of gravitational lensing tech-niques, for both the strong and weak regimes, haspresented a new way of measuring masses regard-less the nature or dynamical state of the matter(Fort & Mellier 1994; Mellier 1999). Strong lens-ing, that relies on the modeling of systems of mul-tiply lensed background galaxies, has proved to bean accurate method, mainly when the number ofgravitational arcs is large (e.g. Kneib et al. 1996).However, this technique can probe only the verycentral regions of the clusters, and is limited to themost massive and concentrated objects. On theother hand, the statistical analysis of the weak dis-tortion caused by the cluster shear field on imagesof faint background galaxies allows the mapping ofthe matter distribution to much larger radius; be-sides, this gravitational distortion is detectable inalmost all clusters when large telescopes with cur-rent instrumentation are used. After the seminalwork of Tyson, Valdes & Wenk (1990), the weak-lensing technique started to be used for the studyof some clusters having special interest because ofextreme values in some of their measured proper-ties, and new methodologies were established (seeMellier 1999, for a review).
With the development of wide field cameras andthe increase in the number of large telescopes, it isnow possible to study large samples of galaxy clus-ters selected using well defined criteria, ideally ob-served under similar conditions, and analyzed withthe same technique. Dahle et al. (2002) studied 38
2

Northern X-ray luminous clusters using data col-lected with 2-meter class telescopes and selected tobe representative of the most massive clusters inthe 0.15 < z < 0.35 redshift range. However, theclusters in this sample were not all observed withthe same instruments and, sometime, with varyingatmospheric conditions. In this paper we present aweak-lensing analysis of a sample of 24 X-ray lu-minous southern clusters with 0.05 < z < 0.31,based on imaging observations with the ESO-VLT telescope taken under sub-arcsecond condi-tions. The clusters were selected from the X-rayBright Abell Cluster Survey (XBACS Ebeling etal. 1996), with −50 < δ < 15, 12 h ≤ α < 1 h,LX > 5 × 1044 erg s−1. Similar observations havebeen done of a complementary sample of 27 X-rayclusters, with 1 h ≤ α < 12 h , whose weak-lensinganalysis is underway. Hereafter, and due to therather rare choice of a lower-z limit of 0.05, we willrefer to our whole VLT survey as the Low-z Lens-ing Survey of X-ray Luminous Clusters (LZLS),and the sample presented here is its Part I. Thedata used in this paper derive from observationsprimarily designed for detection of strong-lensingfeatures but conceived for weak-lensing measure-ments also; the service observing mode at ESO wasessential to insure the high quality and homogene-ity of the images. The statistics of the occurrenceof bright arcs for the whole LZLS survey will bepresented in a separate paper (Campusano et al.2003), together with its implications with respectto the clusters inner mass radial profile. In futurepapers, we will address the combined evaluation ofthe mass distribution we will use both weak andstrong lensing in those LZLS clusters with gravi-tational arcs focusing on those involving arcs withredshift determinations.
In this paper we determine the mass distribu-tions for the galaxy clusters in our sample andtheir total masses using weak-lensing techniques,and investigate their dynamical state throughcomparison of the weak-lensing masses with al-ready published virial and X-ray mass estimates.In Section 2 we describe the sample selection andthe observations. In Section 3 we present theprocedures adopted in the weak-lensing analysis,including galaxy shape measurements and the re-construction of cluster density maps, as well asthe results obtained. The discussion of the resultsis presented in Section 4 together with the com-
parison with dynamical, X-ray and weak-lensingmasses taken from the literature. In Section 5,we summarize our main conclusions. In the Ap-pendix, we display images, mass and light maps,and weak-shear profiles for the cluster sample.
Throughout this paper we adopt ΩM = 0.3, ΩΛ
= 0.7 and H0 = 70 km s−1 Mpc−1.
2. Observations
2.1. Sample Selection
The galaxy clusters investigated in this workwere selected based on their high X-ray luminosi-ties (LX). Initially, we selected clusters in theX-Ray Brightest Abell Cluster Catalog (XBAC)(Ebeling et al. 1996) with LX ≥ 5 × 1044erg s−1
in the 0.1-2.4 keV band, which constitutes a goodthreshold to identify real, massive clusters (e.g.Luppino et al. 1999). We then restricted the sam-ple to clusters that could be reached with ESOVLT (−50 ≤ δ < +15). A low-z limit of 0.05was chosen, because for lower redshifts the angularsize of the clusters is too large compared with thefield of the imaging camera. For z < 0.05, possiblegravitational arcs would appear projected deep in-side the central galaxy image and the angular sizeof cluster galaxies in the camera field would bevery high, making hard to find a suitable num-ber of background galaxies (without strong lightcontamination) for a weak-lensing analysis. ESOVLT was considered a very good choice becausethe observations could be completed with some10 hours of service observing and the homogene-ity and image quality of the observations could beoptimally achieved. These criteria produced 27targets within 12 h ≤ α < 1 h. Three of theseclusters (A68, A1689 and A1835) have been al-ready observed with HST and CFHT by one of us(JPK) and the results will be published elsewhere(Smith et al. 2003; Bardeau et al. 2003). The re-maining 24 rich galaxy clusters that are studied inthis paper are presented in Table 1. This sampleconstitutes the Part I of the VLT Low-z LensingSurvey of X-ray Luminous Clusters (LZLS).
2.2. Imaging and Data Reduction
All clusters were observed in service mode us-ing VLT Antu (Unit Telescope 1), from April toJuly 2001 (ESO program 67.A-0597), with the
3
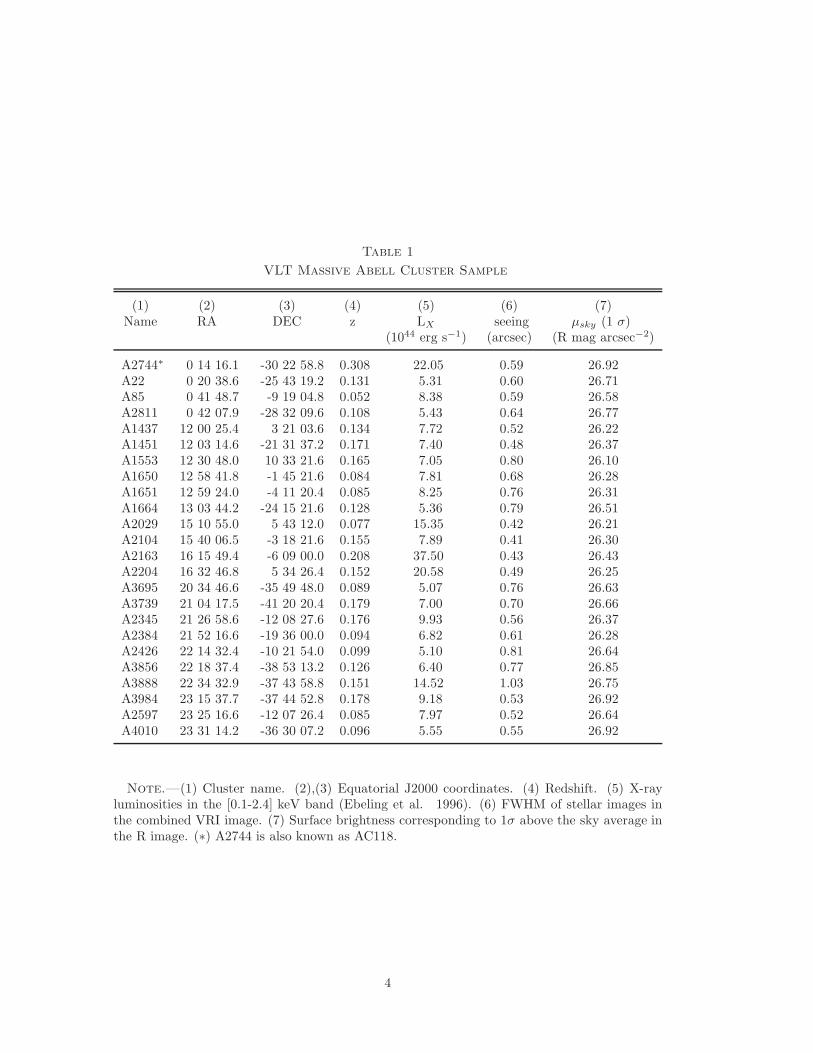
Table 1
VLT Massive Abell Cluster Sample
(1) (2) (3) (4) (5) (6) (7)Name RA DEC z LX seeing µsky (1 σ)
(1044 erg s−1) (arcsec) (R mag arcsec−2)
A2744∗ 0 14 16.1 -30 22 58.8 0.308 22.05 0.59 26.92A22 0 20 38.6 -25 43 19.2 0.131 5.31 0.60 26.71A85 0 41 48.7 -9 19 04.8 0.052 8.38 0.59 26.58A2811 0 42 07.9 -28 32 09.6 0.108 5.43 0.64 26.77A1437 12 00 25.4 3 21 03.6 0.134 7.72 0.52 26.22A1451 12 03 14.6 -21 31 37.2 0.171 7.40 0.48 26.37A1553 12 30 48.0 10 33 21.6 0.165 7.05 0.80 26.10A1650 12 58 41.8 -1 45 21.6 0.084 7.81 0.68 26.28A1651 12 59 24.0 -4 11 20.4 0.085 8.25 0.76 26.31A1664 13 03 44.2 -24 15 21.6 0.128 5.36 0.79 26.51A2029 15 10 55.0 5 43 12.0 0.077 15.35 0.42 26.21A2104 15 40 06.5 -3 18 21.6 0.155 7.89 0.41 26.30A2163 16 15 49.4 -6 09 00.0 0.208 37.50 0.43 26.43A2204 16 32 46.8 5 34 26.4 0.152 20.58 0.49 26.25A3695 20 34 46.6 -35 49 48.0 0.089 5.07 0.76 26.63A3739 21 04 17.5 -41 20 20.4 0.179 7.00 0.70 26.66A2345 21 26 58.6 -12 08 27.6 0.176 9.93 0.56 26.37A2384 21 52 16.6 -19 36 00.0 0.094 6.82 0.61 26.28A2426 22 14 32.4 -10 21 54.0 0.099 5.10 0.81 26.64A3856 22 18 37.4 -38 53 13.2 0.126 6.40 0.77 26.85A3888 22 34 32.9 -37 43 58.8 0.151 14.52 1.03 26.75A3984 23 15 37.7 -37 44 52.8 0.178 9.18 0.53 26.92A2597 23 25 16.6 -12 07 26.4 0.085 7.97 0.52 26.64A4010 23 31 14.2 -36 30 07.2 0.096 5.55 0.55 26.92
Note.—(1) Cluster name. (2),(3) Equatorial J2000 coordinates. (4) Redshift. (5) X-rayluminosities in the [0.1-2.4] keV band (Ebeling et al. 1996). (6) FWHM of stellar images inthe combined VRI image. (7) Surface brightness corresponding to 1σ above the sky average inthe R image. (∗) A2744 is also known as AC118.
4
FORS1 instrument (FOcal Reducer/low disper-sion Spectrograph) working in its imaging mode.FORS1 employs a TK2048EB4-1 backside illumi-nated thinned CCD, with 2048×2048 pixels, eachwith 24×24µ2 area. The employed imaging modeof FORS1 results in a pixel scale of 0′′.2 and asquare field of view of 6′.8 on a side, correspond-ing to 0.4, 0.9 and 1.8 Mpc at the smaller, me-dian and greater redshifts of the clusters of oursample, which are 0.05, 0.126 and 0.305 respec-tively. The imaging was chosen to be centered onthe clusters cores and done through the V, R, andI-bands with exposure times of 330s in each filter,ensuring a good detection of faint galaxies in allbands. The color information is essential to dis-criminate elongated objects belonging to the clus-ter from the background sources needed for theweak-lensing measurements. All the observationswere conducted under good sky transparency andand an excellent image quality characterized by amedian seeing of 0′′.6, ranging from 0′′.4 to 1′′.0.
The data reduction were done in a standard wayusing IRAF packages. For each cluster we com-bined the images in the three filters, normalizingby their modes, to produce a high signal-to-noise“VRI” image that was used for the weak-lensinganalysis. The images in each band were used forthe photometry of the objects in each cluster field.Comparing stellar shapes measured in the VRI im-ages with the single-band ones, we concluded thatthe combination process did not introduce biases.Tests on galaxies revealed that the use of the com-bined VRI image improves the precision in theshape measurements in comparison to single-bandmeasurements.
Zero-point magnitudes, extinction, and colorcoefficients for transformations from instrumentalto standard magnitudes were provided by the ESOpipeline. Almost all data have been collected un-der photometric sky conditions or nearly so. Ta-ble 1 contains, besides general informations abouteach cluster in our sample, the seeing (FWHM)derived from stellar images in the combined VRIimage. The table also includes the surface bright-ness corresponding to a 1σ fluctuation above thesky background in the R image, which is a measureof the quality and depth of these images.
3. Weak-Lensing Analysis
3.1. Construction of the Catalog
The detection of objects in the images and theextraction of their main parameters were madewith SExtractor (Bertin & Arnouts 1996). Werun this program separately for the single bandimages and for the combined one. The four cata-logs obtained were then combined by matching theCartesian position of the objects, with a toleranceof 0′′.6.
Magnitudes (Sextractor’s MAG BEST) weremeasured in the single band images, and the colorswere computed using 4′′ diameter apertures. As-trometric and morphological data were obtainedfrom the VRI image.
We have produced three sub-samples of de-tected objects: stars, cluster galaxies, and othergalaxies. Stars have been selected using two dif-ferent criteria. For unsaturated objects (R>∼ 20.0mag) we have used the FWHM of their light pro-files. In Figure 1 we show an example of the distri-bution of this parameter as a function of R mag-nitude, which shows that stars can be easily sepa-rated from galaxies down to very faint magnitudes.For brighter objects, we have used the SExtrac-tor neural network classifier.
In the absence of spectroscopic redshifts formost of the galaxies in the clusters, the clustergalaxies were selected from the color-magnitudediagram (V −I)×I for each cluster (Figure 2). Inthis type of diagram, the early-type cluster galax-ies occupy a well defined locus, the so called redcluster sequence, with almost the same color. Af-ter determining the typical color of the ellipti-cals in each cluster, we selected as cluster galax-ies those with colors within a strip of width 0.2mag matching the red sequence of each cluster.This selection procedure naturally will not includethe bluer galaxies belonging to a particular clus-ter and having colors outside the color range de-fined by the strip in the cluster color-magnitudediagram. These bluer galaxies not recognized ascluster members cannot be distinguished from thebackground galaxies needed for the weak-lensinganalysis and thus may introduce a certain level of“noise”. We will return to this issue later.
5

Fig. 1.— Magnitude - FWHM diagram for objectsin the field of A1451. Filled squares represent ob-jects classified as point-like sources, following thecriteria described in the text. The continuous lineis the threshold FWHM adopted for star/galaxyseparation of objects fainter than R=20. The starsequence for unsaturated objects is clearly identi-fiable below the line.
3.2. Shape Measurements
Weak-lensing analysis needs careful measure-ments of the ellipticity of background galaxies ob-served in the field of a cluster of galaxies.
We made galaxy shape measurements, includ-ing the correction of the seeing circularisation andPSF anisotropies, using the im2shape software(Bridle et al. 2002). Following a proposition byKuijken (1999), this software models astronomi-cal objects with a sum of Gaussians with ellipticalbase. Let x be a position on a CCD image. Theintensity of a galaxy as a function of position ismodeled as
I(x) =∑
i
Ai
2π|Ci|e−(x−xi)
T Ci(x−xi)/2 (1)
where the xi, Ai, and Ci are, respectively, the cen-ter of each Gaussian, its amplitude, and its covari-ance matrix. The components of Ci can be writ-ten is terms of the ellipse parameters a, b, and θ,that are its semi-major and semi-minor axes and
Fig. 2.— Color-magnitude diagram for galaxies inthe field of A1451. Galaxies belonging to the redcluster sequence are shown as filled squares. Thevertical lines shows the range of magnitude for thegalaxies used for the lensing analysis.
the position angle of the major axis, respectively.The ellipticity, following the convention usuallyadopted in lensing studies, is defined as
ǫ =a − b
a + b(2)
At this point it is convenient to define the el-lipticity projected tangentially to the direction ofa predefined cluster mass center,
ǫt = ǫ cos [2(θ − φ)] (3)
where φ is the azimuthal coordinate of the galaxy.
im2shape uses a Bayesian approach to deter-mine these parameters, with carefully calculateduncertainty estimates. It also deconvolves themeasured shape using a PSF that is also givenas a sum of Gaussians, so that the deconvolutionprocess can then be done in a fully analytical way.
The steps actually performed in measuringgalaxy shapes on our images can be summarized asfollows. First, im2shape is used to model imagesof the unsaturated stellar objects as single Gaus-sians. These stars (in fact stellar-like objects)are divided in four sets, following their positions
6
regarding the CCD quadrants. Stars with ǫ, θor base area unrepresentative of their respectivequadrant averages are removed through a 2-sigmaclipping process. This cleaned star catalog is usedto map the PSF along the field. After, the sameprogram is applied to the galaxies in the CCD im-age. Each galaxy image is modeled as a sum of twoGaussians, which is adequate for exponential andde Vaucouleurs profiles, given typical galaxy sizes,CCD pixel-sizes and PSFs (see Kuijken 1999, fora discussion). The parameters x, y, ǫ, and θ areforced to be the same for both Gaussians. Usingthe five nearest stars, a local PSF is calculated forthe position of each galaxy and a deconvolutionof their images is performed. The result of thisprocedure is a list with the elliptical parametersof the galaxies in a cluster field.
3.3. Weak-Lensing Sample Selection
A key step in weak-lensing analysis is the se-lection of galaxies that will be used as probes ofthe gravitational field of the lensing cluster. Thesegalaxies must be behind the cluster and we shouldbe able to measure their shapes with good accu-racy. For this, it is necessary to have distanceestimates for all objects in the field. It is possibleto select background galaxies through photometricredshifts (e.g. Athreya et al. 2002), but an efficientapplication of this technique requires more abun-dant color information than what we have. In theabsence of redshift information, we proceeded bybuilding a master catalog of putative backgroundgalaxies, selected by flux in the non-cluster galaxycatalog. We selected only galaxies with absoluteR-band magnitude fainter than -16.6 at the clusterdistance (roughly M∗+5; Goto et al 2002).
The final catalog is obtained after removal ofa number of objects, obeying the following crite-ria. Initially, all objects inside a radius of 1 arcminaround the cluster center were excluded from thelensing sample (following, for example, Hoekstraet al. 2002). The reason for this is twofold. First,in these regions (mainly the inner 30′′) mass den-sities are closer to the critical value, and then theweak-lensing regime is no longer a good approxi-mation. Second, in central regions there is a highsurface density of low luminosity cluster compo-nents and diffuse light, that can contaminate theweak-lensing sample and bias the shape measure-ments.
Relevant cases of light contamination by lumi-nous neighbors were detected by comparing dif-ferences in the object center estimated by SEx-tractor and by im2shape, because the first hasa deblending procedure, while the second does not.Thus, objects with differences between center es-timates greater than 3 pixels were also removedfrom the sample. Finally, all galaxies with uncer-tainties in ǫt larger than 0.35 were also removed.We found that this value is a good compromisebetween the total number of galaxies in the finalsample and the accuracy of shape measurements.It should be stressed, however, that the resultspresented here depends only weakly on this value,since in the whole analysis the inverse of the squareof the uncertainties are used as statistical weights(see for example Section 3.5).
The total number of galaxies useful for shearmeasurements is presented in column (2) of Ta-ble 2. Their surface density ranges from 4.7 to17.8 gal/arcmin2. This broad range are due tocosmic variance, almost unavoidable differences inthe deepness of the images, (see the values of theseeing and µsky in Table 1) and also to the dif-ferent bright apparent magnitude cutoffs for thegalaxy lensing samples.
3.4. Mass and Light Maps
In the weak-lensing regime, the mass distribu-tion can be obtained from the pattern of distortionof galaxy shapes at a position x, 〈ǫt(x)〉, that de-pends only of the reduced shear g = γ/(1 − κ),where γ and κ are the shear modulus and conver-gence at x. The latter is proportional to the massdensity and is defined as:
κ =Σ(x)
Σc, (4)
where the critical surface density Σc is given by
Σc =c2
4πG
Ds
DlDls(5)
and Dl, Ds, and Dls are the angular diameterdistances from the observer to the lens, from theobserver to the source, and from the lens to thesource.
We have reconstructed the two-dimensionalmass density distributions from distortion mapsusing the LensEnt software (Bridle et al. 1998;
7
Marshall et al. 2002). This software computes κmaps using a maximum-entropy method, takingeach background galaxy image shape as an in-dependent estimator of the reduced shear field.This map is smoothed by a Gaussian function,called intrinsic correlation function (ICF), whoseFWHM is determined by Bayesian methods. Theprogram avoids any binning of the data and allowsthe reconstruction of complex mass distributions.We present in column (3) of Table 2 the optimalICF-FWHM for the smoothing function found byLensEnt.
The resultant mass maps for all clusters, with64 × 64 pixels across, can be seen in Appendix A.In order to minimize edge effects, LensEnt pro-duces maps in a grid twice as big as the data re-gion. Here we only show the part of a map corre-sponding to the field actually observed.
It should be noted that since this method takesinto account only galaxy distortions and ignorestheir amplifications, the convergence determinedthis way will suffer from the “mass sheet degener-acy”: the distortion pattern can be reproduced byany mass distributions that obeys the transforma-tion κ → λκ + (1 − λ), where λ is a real number.
To estimate the significance of the featuresfound in mass maps we have also performed 100bootstrap realizations for each cluster, adding togalaxy ellipticities Gaussian noise with amplitudeequal to their observational errors. From the massmaps produced in the simulations, we computeda standard deviation (σ) map and, by dividingthe mass map by the σ-map, we obtained a sig-nificance map. The significance maps show thatmost clusters presents individual pixel signal-to-noise ratios ranging between 1 and 3, with valuesas high as 8 being found in some cases.
We have also computed light maps (also shownin Appendix A) of the light distribution of galaxiesin the red sequence. The field is divided in 32×32pixels and the smoothed light density of each pixelis estimated as
L ∝∑
i
Li e−d2i
2σ2 (6)
where Li is the luminosity of the i-th galaxy, anddi is its angular distance to the pixel center. Thevalue of σ is chosen to have the same FWHM ofthe ICF of the mass map.
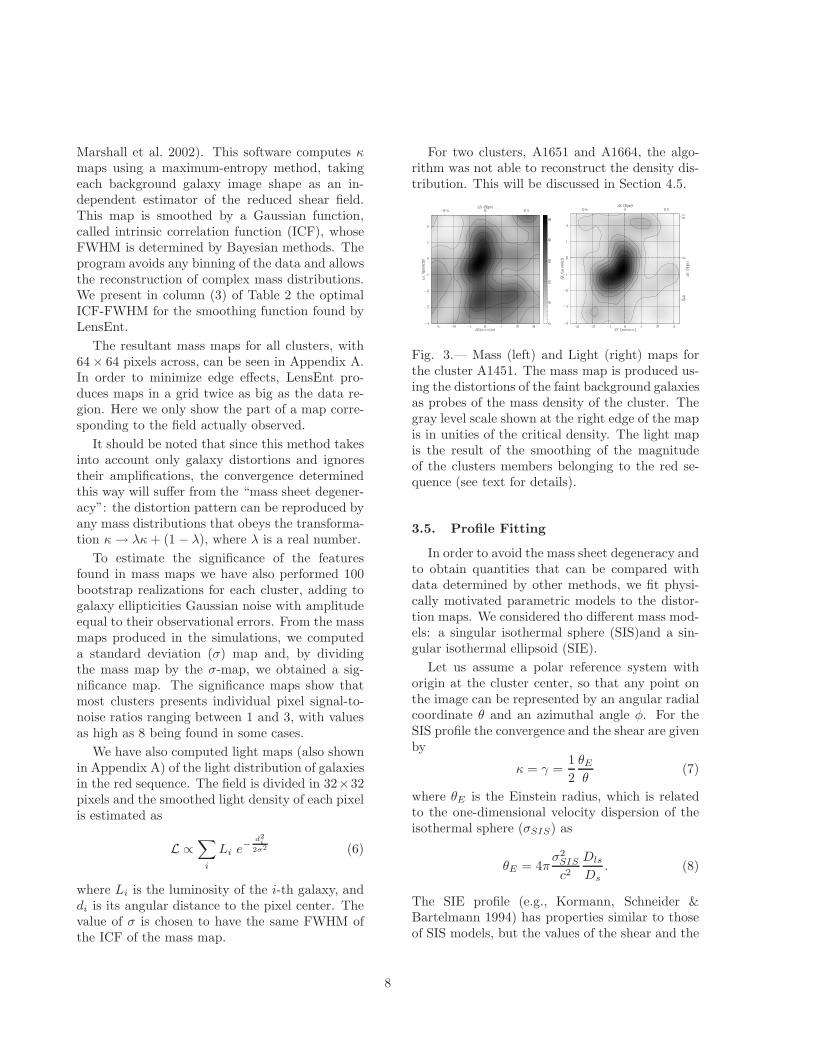
For two clusters, A1651 and A1664, the algo-rithm was not able to reconstruct the density dis-tribution. This will be discussed in Section 4.5.
Fig. 3.— Mass (left) and Light (right) maps forthe cluster A1451. The mass map is produced us-ing the distortions of the faint background galaxiesas probes of the mass density of the cluster. Thegray level scale shown at the right edge of the mapis in unities of the critical density. The light mapis the result of the smoothing of the magnitudeof the clusters members belonging to the red se-quence (see text for details).
3.5. Profile Fitting
In order to avoid the mass sheet degeneracy andto obtain quantities that can be compared withdata determined by other methods, we fit physi-cally motivated parametric models to the distor-tion maps. We considered tho different mass mod-els: a singular isothermal sphere (SIS)and a sin-gular isothermal ellipsoid (SIE).
Let us assume a polar reference system withorigin at the cluster center, so that any point onthe image can be represented by an angular radialcoordinate θ and an azimuthal angle φ. For theSIS profile the convergence and the shear are givenby
κ = γ =1
2
θE
θ(7)
where θE is the Einstein radius, which is relatedto the one-dimensional velocity dispersion of theisothermal sphere (σSIS) as
θE = 4πσ2
SIS
c2
Dls
Ds. (8)
The SIE profile (e.g., Kormann, Schneider &Bartelmann 1994) has properties similar to thoseof SIS models, but the values of the shear and the
8
convergence are now given by
κ = γ =1
2
θE
θf [cos (φ − α) + f2 sin (φ − α)]−1/2
(9)where f < 1 is the axial ratio b/a, α is the po-sition angle of the ellipsoidal matter distributionand φ the azimuthal coordinate. For this model,in the weak-lensing regime (κ << 1), the shear isoriented tangentially to the direction to the masscenter.
The SIS model has only one free parameter, θE ,whereas the SIE has three free parameters: θE , f ,and α. In both cases the position of the clustercenter were defined in advance with the help ofthe mass maps. For each model, the best-fit pa-rameters were obtained through minimization ofthe χ2 statistic, defined as:
χ2 =∑
i
(ǫt,i − gt,i)2
σ2ǫt,i
+ σ2ǫ
, (10)
where ǫt,i and σǫt,i are the tangential ellipticityand its error for the i-th galaxy, σǫ = 0.3 (Mel-lier 1999) is the dispersion associated with galaxyintrinsic shapes, and gt,i is the tangential reducedshear at the position of this galaxy, which quan-tifies the ellipticity induced by the lensing distor-tion. For all models we consider here it may beassumed that, in the weak lensing regime, |~g| = gt
This method of profile fitting is similar to the onedeveloped by King & Schneider (2001) and has theadvantage of avoiding data binning.
The mass center was defined in general as thecenter of the mass map. When there is consistencybetween the peak of the mass map and a brightcluster galaxy (the dominant one in most cases),the latter one was used as the center position. Insome cases (A2104, A3739 and A3888) the maxi-mum of the mass map and therefore the adoptedmass center, is in a position between bright clus-ter members, and in other cases (A85, A2811 andA1650) in a position uncorrelated with the clustergalaxies.
The best-fit parameters of SIS and SIE mod-els are also shown in Table 2. We have estimatedσSIS (σSIE for the elliptical model) from θE us-ing for each cluster an average value of Dls/Ds
obtained in a way analogous to that adopted byDahle et al. (2002). Considering the minimumand average values of I magnitudes in our weak-lensing sample, we selected sub-samples of HDF
galaxies (Fernandez-Soto, Lanzetta & Yahil 1999)and, from their photometric redshifts, the meanvalue of the distance ratio above was calculated.In this table we also show the average redshiftof the galaxies used in the lensing analysis withtheir respective uncertainties (that are not takeninto account on the estimate of the uncertaintiesin σSIS).
When fitting noisy data or clump mass distri-butions with the SIE profile, one often obtain un-realistic low values of the axial ratio (f < 0.3).Clusters where this happened have an empty en-try in Table 2. We dealt with it adopting a con-stant value of f = 0.3 when the fit gives valuessmaller than this one. On the other hand, thevalue obtained for the position angle is quite ro-bust, being rather insensitive to f . Soft core (i.e.non singular) and Navarro, Frenk & White (1997)profiles have parameters, such as the core radius orthe NFW concentration parameter, whose deter-mination depends critically on information fromthe inner parts of the cluster. Since we do nothave useful data in the central arcmin, or even atlarger radius, (that are important for NFW pro-files), we are unable to fit properly our data usingthese models.
Another point that deserves mention in Table2 are the small values of χ2
red. This happens dueto the large value of the intrinsic shape dispersionσǫ.
4. Discussion
4.1. Mass and Light Distributions
Although each galaxy cluster of our sample hasparticular features, as can be seen in the displayof the mass and light distributions provided inthe Appendix, there are some general trends andcorrelations that can be drawn from these maps.A detailed and more quantitative comparison ofthese distributions will be addressed in a futurepaper.
In most cases (17 out of 22), the center of massof the cluster (nearly) coincides with the positionof the brightest cluster galaxy (BCG) or the maingalaxy clump. We are including in this categorythe clusters A22, A1437, and A2163, where themass maps show peaks near the position of thecentral galaxy, despite the presence of more promi-nent peaks near the edges of the frame (see rele-
9
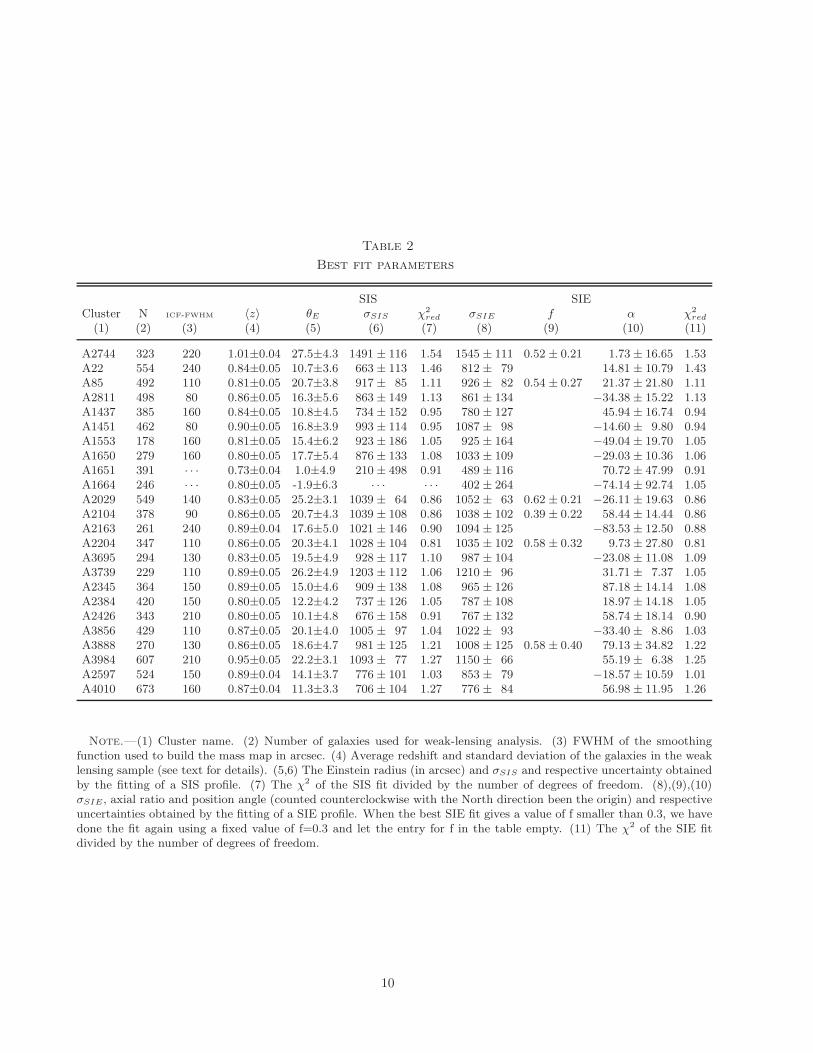
Table 2
Best fit parameters
SIS SIECluster N ICF-FWHM 〈z〉 θE σSIS χ2
red σSIE f α χ2
red
(1) (2) (3) (4) (5) (6) (7) (8) (9) (10) (11)
A2744 323 220 1.01±0.04 27.5±4.3 1491 ± 116 1.54 1545 ± 111 0.52 ± 0.21 1.73 ± 16.65 1.53A22 554 240 0.84±0.05 10.7±3.6 663 ± 113 1.46 812 ± 79 14.81 ± 10.79 1.43A85 492 110 0.81±0.05 20.7±3.8 917 ± 85 1.11 926 ± 82 0.54 ± 0.27 21.37 ± 21.80 1.11A2811 498 80 0.86±0.05 16.3±5.6 863 ± 149 1.13 861 ± 134 −34.38 ± 15.22 1.13A1437 385 160 0.84±0.05 10.8±4.5 734 ± 152 0.95 780 ± 127 45.94 ± 16.74 0.94A1451 462 80 0.90±0.05 16.8±3.9 993 ± 114 0.95 1087 ± 98 −14.60 ± 9.80 0.94A1553 178 160 0.81±0.05 15.4±6.2 923 ± 186 1.05 925 ± 164 −49.04 ± 19.70 1.05A1650 279 160 0.80±0.05 17.7±5.4 876 ± 133 1.08 1033 ± 109 −29.03 ± 10.36 1.06A1651 391 · · · 0.73±0.04 1.0±4.9 210 ± 498 0.91 489 ± 116 70.72 ± 47.99 0.91A1664 246 · · · 0.80±0.05 -1.9±6.3 · · · · · · 402 ± 264 −74.14 ± 92.74 1.05A2029 549 140 0.83±0.05 25.2±3.1 1039 ± 64 0.86 1052 ± 63 0.62 ± 0.21 −26.11 ± 19.63 0.86A2104 378 90 0.86±0.05 20.7±4.3 1039 ± 108 0.86 1038 ± 102 0.39 ± 0.22 58.44 ± 14.44 0.86A2163 261 240 0.89±0.04 17.6±5.0 1021 ± 146 0.90 1094 ± 125 −83.53 ± 12.50 0.88A2204 347 110 0.86±0.05 20.3±4.1 1028 ± 104 0.81 1035 ± 102 0.58 ± 0.32 9.73 ± 27.80 0.81A3695 294 130 0.83±0.05 19.5±4.9 928 ± 117 1.10 987 ± 104 −23.08 ± 11.08 1.09A3739 229 110 0.89±0.05 26.2±4.9 1203 ± 112 1.06 1210 ± 96 31.71 ± 7.37 1.05A2345 364 150 0.89±0.05 15.0±4.6 909 ± 138 1.08 965 ± 126 87.18 ± 14.14 1.08A2384 420 150 0.80±0.05 12.2±4.2 737 ± 126 1.05 787 ± 108 18.97 ± 14.18 1.05A2426 343 210 0.80±0.05 10.1±4.8 676 ± 158 0.91 767 ± 132 58.74 ± 18.14 0.90A3856 429 110 0.87±0.05 20.1±4.0 1005 ± 97 1.04 1022 ± 93 −33.40 ± 8.86 1.03A3888 270 130 0.86±0.05 18.6±4.7 981 ± 125 1.21 1008 ± 125 0.58 ± 0.40 79.13 ± 34.82 1.22A3984 607 210 0.95±0.05 22.2±3.1 1093 ± 77 1.27 1150 ± 66 55.19 ± 6.38 1.25A2597 524 150 0.89±0.04 14.1±3.7 776 ± 101 1.03 853 ± 79 −18.57 ± 10.59 1.01A4010 673 160 0.87±0.04 11.3±3.3 706 ± 104 1.27 776 ± 84 56.98 ± 11.95 1.26
Note.—(1) Cluster name. (2) Number of galaxies used for weak-lensing analysis. (3) FWHM of the smoothingfunction used to build the mass map in arcsec. (4) Average redshift and standard deviation of the galaxies in the weaklensing sample (see text for details). (5,6) The Einstein radius (in arcsec) and σSIS and respective uncertainty obtainedby the fitting of a SIS profile. (7) The χ2 of the SIS fit divided by the number of degrees of freedom. (8),(9),(10)σSIE, axial ratio and position angle (counted counterclockwise with the North direction been the origin) and respectiveuncertainties obtained by the fitting of a SIE profile. When the best SIE fit gives a value of f smaller than 0.3, we havedone the fit again using a fixed value of f=0.3 and let the entry for f in the table empty. (11) The χ2 of the SIE fitdivided by the number of degrees of freedom.
10
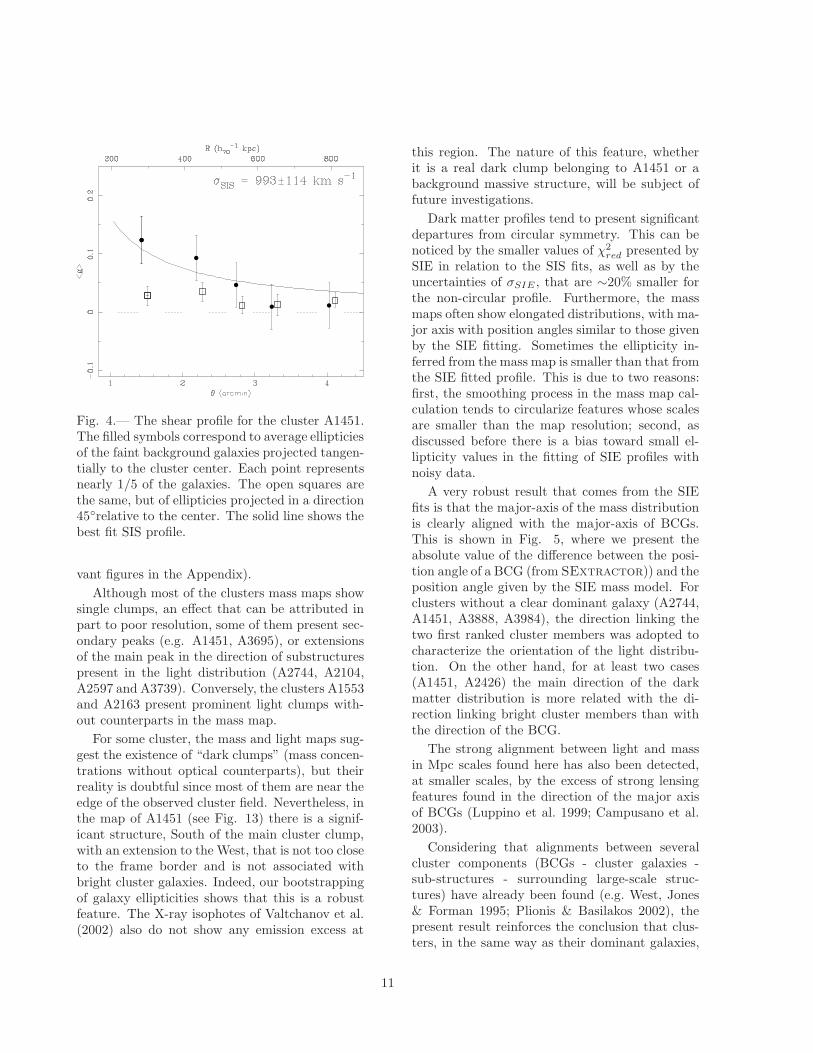
Fig. 4.— The shear profile for the cluster A1451.The filled symbols correspond to average ellipticiesof the faint background galaxies projected tangen-tially to the cluster center. Each point representsnearly 1/5 of the galaxies. The open squares arethe same, but of ellipticies projected in a direction45relative to the center. The solid line shows thebest fit SIS profile.
vant figures in the Appendix).
Although most of the clusters mass maps showsingle clumps, an effect that can be attributed inpart to poor resolution, some of them present sec-ondary peaks (e.g. A1451, A3695), or extensionsof the main peak in the direction of substructurespresent in the light distribution (A2744, A2104,A2597 and A3739). Conversely, the clusters A1553and A2163 present prominent light clumps with-out counterparts in the mass map.
For some cluster, the mass and light maps sug-gest the existence of “dark clumps” (mass concen-trations without optical counterparts), but theirreality is doubtful since most of them are near theedge of the observed cluster field. Nevertheless, inthe map of A1451 (see Fig. 13) there is a signif-icant structure, South of the main cluster clump,with an extension to the West, that is not too closeto the frame border and is not associated withbright cluster galaxies. Indeed, our bootstrappingof galaxy ellipticities shows that this is a robustfeature. The X-ray isophotes of Valtchanov et al.(2002) also do not show any emission excess at
this region. The nature of this feature, whetherit is a real dark clump belonging to A1451 or abackground massive structure, will be subject offuture investigations.
Dark matter profiles tend to present significantdepartures from circular symmetry. This can benoticed by the smaller values of χ2
red presented bySIE in relation to the SIS fits, as well as by theuncertainties of σSIE , that are ∼20% smaller forthe non-circular profile. Furthermore, the massmaps often show elongated distributions, with ma-jor axis with position angles similar to those givenby the SIE fitting. Sometimes the ellipticity in-ferred from the mass map is smaller than that fromthe SIE fitted profile. This is due to two reasons:first, the smoothing process in the mass map cal-culation tends to circularize features whose scalesare smaller than the map resolution; second, asdiscussed before there is a bias toward small el-lipticity values in the fitting of SIE profiles withnoisy data.
A very robust result that comes from the SIEfits is that the major-axis of the mass distributionis clearly aligned with the major-axis of BCGs.This is shown in Fig. 5, where we present theabsolute value of the difference between the posi-tion angle of a BCG (from SExtractor)) and theposition angle given by the SIE mass model. Forclusters without a clear dominant galaxy (A2744,A1451, A3888, A3984), the direction linking thetwo first ranked cluster members was adopted tocharacterize the orientation of the light distribu-tion. On the other hand, for at least two cases(A1451, A2426) the main direction of the darkmatter distribution is more related with the di-rection linking bright cluster members than withthe direction of the BCG.
The strong alignment between light and massin Mpc scales found here has also been detected,at smaller scales, by the excess of strong lensingfeatures found in the direction of the major axisof BCGs (Luppino et al. 1999; Campusano et al.2003).
Considering that alignments between severalcluster components (BCGs - cluster galaxies -sub-structures - surrounding large-scale struc-tures) have already been found (e.g. West, Jones& Forman 1995; Plionis & Basilakos 2002), thepresent result reinforces the conclusion that clus-ters, in the same way as their dominant galaxies,
11
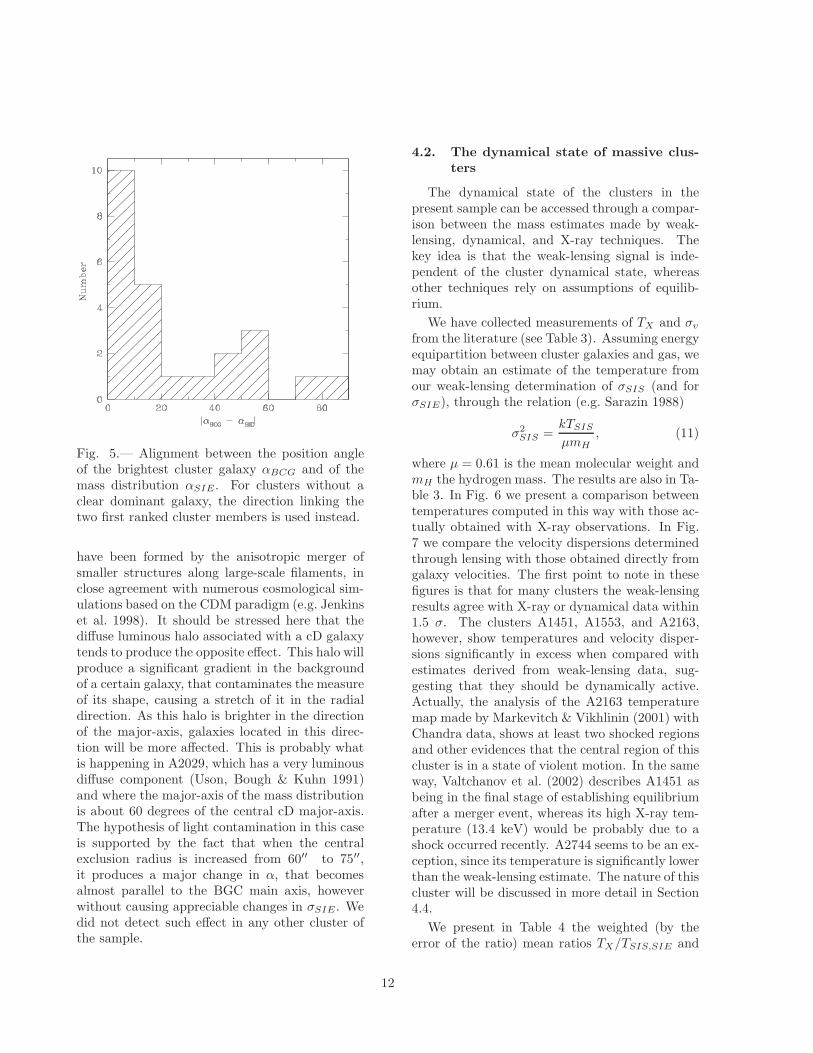
Fig. 5.— Alignment between the position angleof the brightest cluster galaxy αBCG and of themass distribution αSIE . For clusters without aclear dominant galaxy, the direction linking thetwo first ranked cluster members is used instead.
have been formed by the anisotropic merger ofsmaller structures along large-scale filaments, inclose agreement with numerous cosmological sim-ulations based on the CDM paradigm (e.g. Jenkinset al. 1998). It should be stressed here that thediffuse luminous halo associated with a cD galaxytends to produce the opposite effect. This halo willproduce a significant gradient in the backgroundof a certain galaxy, that contaminates the measureof its shape, causing a stretch of it in the radialdirection. As this halo is brighter in the directionof the major-axis, galaxies located in this direc-tion will be more affected. This is probably whatis happening in A2029, which has a very luminousdiffuse component (Uson, Bough & Kuhn 1991)and where the major-axis of the mass distributionis about 60 degrees of the central cD major-axis.The hypothesis of light contamination in this caseis supported by the fact that when the centralexclusion radius is increased from 60′′ to 75′′,it produces a major change in α, that becomesalmost parallel to the BGC main axis, howeverwithout causing appreciable changes in σSIE . Wedid not detect such effect in any other cluster ofthe sample.
4.2. The dynamical state of massive clus-
ters
The dynamical state of the clusters in thepresent sample can be accessed through a compar-ison between the mass estimates made by weak-lensing, dynamical, and X-ray techniques. Thekey idea is that the weak-lensing signal is inde-pendent of the cluster dynamical state, whereasother techniques rely on assumptions of equilib-rium.
We have collected measurements of TX and σv
from the literature (see Table 3). Assuming energyequipartition between cluster galaxies and gas, wemay obtain an estimate of the temperature fromour weak-lensing determination of σSIS (and forσSIE), through the relation (e.g. Sarazin 1988)
σ2SIS =
kTSIS
µmH, (11)
where µ = 0.61 is the mean molecular weight andmH the hydrogen mass. The results are also in Ta-ble 3. In Fig. 6 we present a comparison betweentemperatures computed in this way with those ac-tually obtained with X-ray observations. In Fig.7 we compare the velocity dispersions determinedthrough lensing with those obtained directly fromgalaxy velocities. The first point to note in thesefigures is that for many clusters the weak-lensingresults agree with X-ray or dynamical data within1.5 σ. The clusters A1451, A1553, and A2163,however, show temperatures and velocity disper-sions significantly in excess when compared withestimates derived from weak-lensing data, sug-gesting that they should be dynamically active.Actually, the analysis of the A2163 temperaturemap made by Markevitch & Vikhlinin (2001) withChandra data, shows at least two shocked regionsand other evidences that the central region of thiscluster is in a state of violent motion. In the sameway, Valtchanov et al. (2002) describes A1451 asbeing in the final stage of establishing equilibriumafter a merger event, whereas its high X-ray tem-perature (13.4 keV) would be probably due to ashock occurred recently. A2744 seems to be an ex-ception, since its temperature is significantly lowerthan the weak-lensing estimate. The nature of thiscluster will be discussed in more detail in Section4.4.
We present in Table 4 the weighted (by theerror of the ratio) mean ratios TX/TSIS,SIE and
12

Table 3
Nome kTSIS kTSIE kTX Refs. σv N Refs.(keV) (keV) (keV) (km s−1)
(1) (2) (3) (4) (5) (6) (7) (8)
A2744 14.13+2.28−2.11 15.17+2.26
−2.10 11.04+0.49−0.45 (a) 1777+151
−125 55 (g)A22 2.79+1.03
−0.87 4.26+0.78−0.73 · · · 693±251 7 (h)
A85 5.34+1.04−0.94 5.45+1.00
−0.92 6.51+0.16−0.23 (b) 1097+76
−63 305 (i)A2811 4.73+1.78
−1.49 4.76+1.55−1.33 5.31+0.17
−0.16 (c) 695+200−108 13 (j)
A1437 3.42+1.56−1.27 3.87+1.30
−1.11 · · · · · · · · ·A1451 6.27+1.52
−1.36 7.47+1.40−1.28 13.40+1.9
−1.5 (d) 1338+130−90 37 (d)
A1553 5.42+2.40−1.96 5.37+2.00
−1.69 9.16+1.02−0.64 (c) · · · · · ·
A1650 4.88+1.60−1.37 7.25+1.54
−1.39 5.68+0.30−0.27 (b) · · · · · ·
A1651 0.28+2.90−0.25 1.85+1.61
−1.11 6.22+0.45−0.41 (b) 695+200
−108 62 (k)A1664 · · · 1.58+1.29
−2.32 · · · · · · · · ·A2029 6.86+0.87
−0.83 7.03+0.87−0.82 7.93+0.39
−0.36 (b) 1164+98−78 93 (k)
A2104 6.86+1.50−1.35 6.85+1.41
−1.28 9.13+0.69−0.45 (c) 1201±200 51 (l)
A2163 6.63+2.03−1.76 7.55+1.78
−1.60 12.3 +1.3−1.1 (e) 1698 (m)
A2204 6.72+1.49−1.29 6.81+1.41
−1.28 6.38±0.23 (b) · · · · · ·A3695 5.50+1.47
−1.30 6.17+1.38−1.24 6.67+2.84
−1.99 (b) 779+67−49 96 (k)
A3739 9.20+1.79−1.63 9.41+1.51
−1.40 · · · · · · · · ·A2345 5.25+1.72
−1.47 5.93+1.62−1.42 · · · · · · · · ·
A2384 3.45+1.28−1.08 4.02+1.11
−0.97 · · · · · · · · ·A2426 2.90+1.52
−1.20 3.85+1.36−1.15 · · · 846±100 15 (n)
A3856 6.37+1.34−1.21 6.74+1.24
−1.14 · · · 729±142 22 (h)A3888 6.12+1.66
−1.46 6.46+1.70−1.50 8.46+3.6
−2.53 (b) 1102+137−107 50 (g)
A3984 7.59+1.11−1.03 8.30+1.02
−0.96 · · · · · · · · ·A2597 3.83+1.06
−0.93 4.56+0.82−0.75 4.40+0.4
−0.7 (f) · · · · · ·A4010 3.17+1.00
−0.87 3.88+0.81−0.74 · · · 625+127
−95 36 (k)
Note.—(1) Cluster name. (2),(3) X-ray temperatures inferred from the SIS/SIEmodeling of the shear data. (4) X-ray temperature with 66% uncertainties from theliterature. (5) References for TX . (6) Velocity dispersions found in the literature.(7) Number of galaxies used to determine σv. (8) References for σv.
References.—(a) Allen (2000) (b) Ikebe et al. (2002) (c) White (2000) (d)Valtchanov et al. (2002) (e) Markevitch & Vikhlinin (2001) (f) Markevitch et al.(1998) (g) Girardi & Mezzeti (2001) (h) Alonso et al. (1999) (i) Durret et al. (1998)(j) Collins et al. (1995) (k) Fadda et al. (1996) (l) Liang et al. (2000) (m) Squires etal. (1997) (n) Mazure et al. (1996)
13

Table 4
Weighted means and errors of the ratio between cluster temperatures (X-ray anddynamical) and weak-lensing inferred values.
All TX < 8.0 keV TX > 8.0 keVσv < 1122 km s−1 σv > 1122 km s−1
(1) (2) (3) (4)
TX/TSIS 1.27 ± 0.09 1.14 ± 0.03 1.55 ± 0.19TX/TSIE 1.17 ± 0.08 1.04 ± 0.05 1.42 ± 0.15
(σv/σSIS)2 1.20 ± 0.13 1.01 ± 0.14 1.54 ± 0.20(σv/σSIE)2 1.11 ± 0.12 0.90 ± 0.13 1.41 ± 0.15
Fig. 6.— Comparison between the ICM tempera-tures inferred by the fitting of isothermal profilesto the shear data, TSIS and TSIE , and from X-ray measurements, TX . The squares correspondto the spherical model and triangles to the ellipti-cal. The error bars of the latter were suppressedfor clarity. The solid line is defined by TSIS,SIE
= TX . The dotted and long dashed lines showthe best obtained by the SIS and SIE models, re-spectively, when the origin is kept constant. Theshort dashed line indicate TX = 8 keV. Clusterswith higher temperatures show signals of dynamicactivity.
(σv/σSIS,SIE)2 for both SIS and SIE mass models,as well as their errors of the mean. These quanti-ties are proportional to the ratio between the masscomputed from the X-ray emission or cluster dy-namics and the mass inferred from weak-lensing.For the clusters in our sample for which this anal-ysis is possible, we verify that the temperatureinferred from the lensing analysis is 17% to 27%lower than that determined by X-ray observations;the squared velocity dispersions determined fromgalaxy velocities are also larger than that obtainedfrom lensing, by a factor between 8% and 20%.These factors are smaller for the elliptical models.Other comparisons between dynamical and weak-lensing mass estimates have been made by Irgenset al. (2002) and Smail et al. (1997). Whereas thelatter work has found values of σSIS ∼50% greaterthan σv, the former has found a broad consistencybetween these two quantities.
Dividing the sample in clusters colder and hot-ter than TX = 8.0 keV (or, equivalently, σv largeror smaller than 1122 km s−1), the first set presentsratios consistent with unity within the errors,whereas the second set shows excess (relative tolensing results) of 40-50%; see Table 4. Not sur-prisingly, all clusters that we have already iden-tified as dynamically active belong to this secondset.
These results find a natural explanation inthe hierarchical scenario, where the most massivestructures are being formed at this very moment.If this is the case, higher ICM temperatures areexpected (compared to an equilibrium state), be-
14
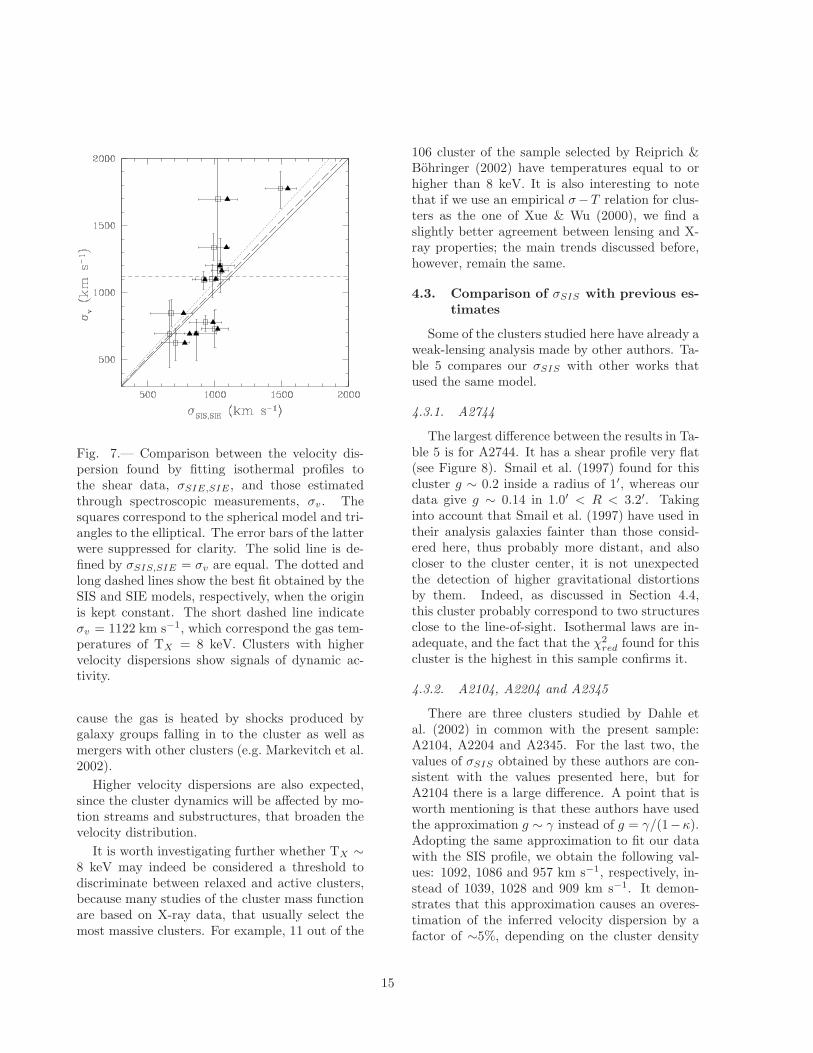
Fig. 7.— Comparison between the velocity dis-persion found by fitting isothermal profiles tothe shear data, σSIE,SIE , and those estimatedthrough spectroscopic measurements, σv. Thesquares correspond to the spherical model and tri-angles to the elliptical. The error bars of the latterwere suppressed for clarity. The solid line is de-fined by σSIS,SIE = σv are equal. The dotted andlong dashed lines show the best fit obtained by theSIS and SIE models, respectively, when the originis kept constant. The short dashed line indicateσv = 1122 km s−1, which correspond the gas tem-peratures of TX = 8 keV. Clusters with highervelocity dispersions show signals of dynamic ac-tivity.
cause the gas is heated by shocks produced bygalaxy groups falling in to the cluster as well asmergers with other clusters (e.g. Markevitch et al.2002).
Higher velocity dispersions are also expected,since the cluster dynamics will be affected by mo-tion streams and substructures, that broaden thevelocity distribution.
It is worth investigating further whether TX ∼8 keV may indeed be considered a threshold todiscriminate between relaxed and active clusters,because many studies of the cluster mass functionare based on X-ray data, that usually select themost massive clusters. For example, 11 out of the
106 cluster of the sample selected by Reiprich &Bohringer (2002) have temperatures equal to orhigher than 8 keV. It is also interesting to notethat if we use an empirical σ−T relation for clus-ters as the one of Xue & Wu (2000), we find aslightly better agreement between lensing and X-ray properties; the main trends discussed before,however, remain the same.
4.3. Comparison of σSIS with previous es-
timates
Some of the clusters studied here have already aweak-lensing analysis made by other authors. Ta-ble 5 compares our σSIS with other works thatused the same model.
4.3.1. A2744
The largest difference between the results in Ta-ble 5 is for A2744. It has a shear profile very flat(see Figure 8). Smail et al. (1997) found for thiscluster g ∼ 0.2 inside a radius of 1′, whereas ourdata give g ∼ 0.14 in 1.0′ < R < 3.2′. Takinginto account that Smail et al. (1997) have used intheir analysis galaxies fainter than those consid-ered here, thus probably more distant, and alsocloser to the cluster center, it is not unexpectedthe detection of higher gravitational distortionsby them. Indeed, as discussed in Section 4.4,this cluster probably correspond to two structuresclose to the line-of-sight. Isothermal laws are in-adequate, and the fact that the χ2
red found for thiscluster is the highest in this sample confirms it.
4.3.2. A2104, A2204 and A2345
There are three clusters studied by Dahle etal. (2002) in common with the present sample:A2104, A2204 and A2345. For the last two, thevalues of σSIS obtained by these authors are con-sistent with the values presented here, but forA2104 there is a large difference. A point that isworth mentioning is that these authors have usedthe approximation g ∼ γ instead of g = γ/(1−κ).Adopting the same approximation to fit our datawith the SIS profile, we obtain the following val-ues: 1092, 1086 and 957 km s−1, respectively, in-stead of 1039, 1028 and 909 km s−1. It demon-strates that this approximation causes an overes-timation of the inferred velocity dispersion by afactor of ∼5%, depending on the cluster density
15
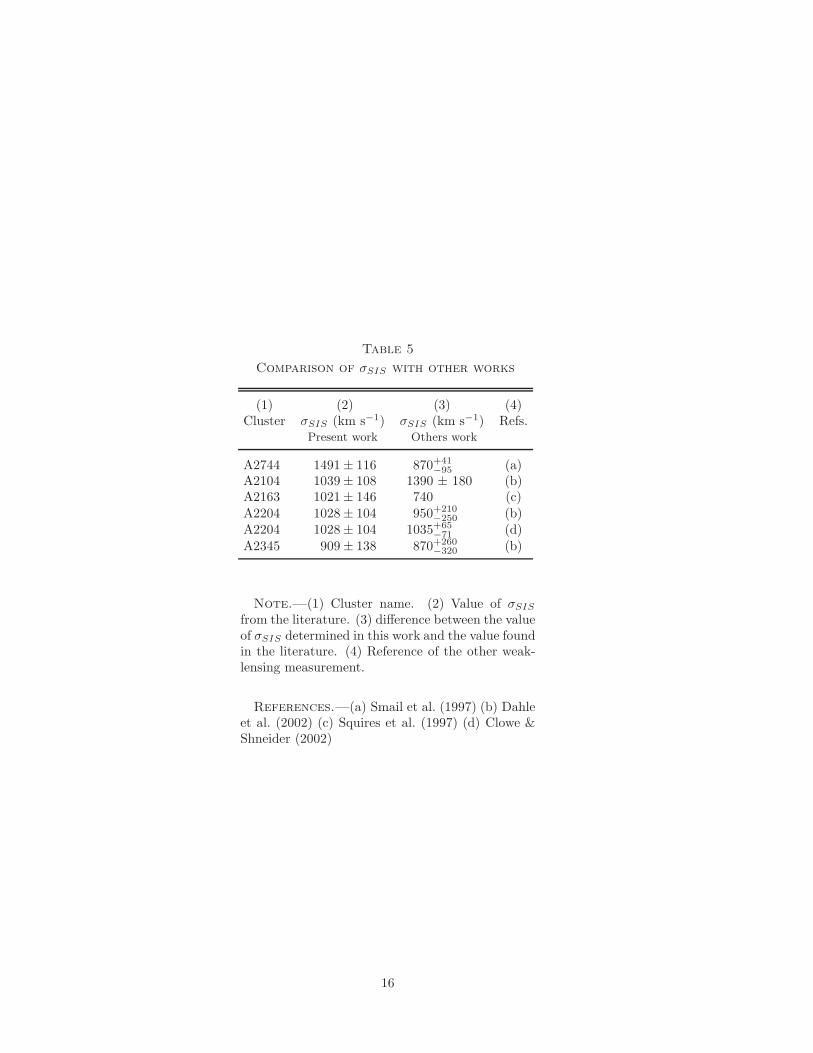
Table 5
Comparison of σSIS with other works
(1) (2) (3) (4)Cluster σSIS (km s−1) σSIS (km s−1) Refs.
Present work Others work
A2744 1491 ± 116 870+41−95 (a)
A2104 1039 ± 108 1390 ± 180 (b)A2163 1021 ± 146 740 (c)A2204 1028 ± 104 950+210
−250 (b)A2204 1028 ± 104 1035+65
−71 (d)A2345 909 ± 138 870+260
−320 (b)
Note.—(1) Cluster name. (2) Value of σSIS
from the literature. (3) difference between the valueof σSIS determined in this work and the value foundin the literature. (4) Reference of the other weak-lensing measurement.
References.—(a) Smail et al. (1997) (b) Dahleet al. (2002) (c) Squires et al. (1997) (d) Clowe &Shneider (2002)
16
and of the field size, but this is not the cause ofthis difference. In fact, Dahle et al. (2002) re-port problems with their images of A2104. Fortheir weak-lensing analysis they used only one Iband image, obtained with 1 hour integration witha seeing (FWHM) of 0.7′′ at the University ofHawaii 2.24 m telescope. Our data for A2104, onthe other hand, has been collected in one of thebest nights at VLT in that semester, when theseeing was 0.41′′. This makes us very confident ofour results.
Our A2104 mass map is also very different fromthe one obtained by these authors. Accordinglyto them, the mass distribution is nearly perpen-dicular to the major-axis of the central D galaxy,which is also along the direction of the two bright-est galaxies, and is the direction where the gravi-tational arcs are seen. However, our mass map aswell as the fitting of SIE models show that A2104has an elliptical mass distribution aligned with thecentral galaxy major-axis, as expected if the BCGlight is a good tracer of the cluster potential (seefor example Mellier, Fort & Kneib 1993).
4.3.3. A2163
Our estimate of the velocity dispersion of A2163is also much higher than that reported by Squireset al. (1997). These authors have observed thiscluster in V and I with total expositions of onehour at the 3.6 CFH telescope, under seeing of∼0.8′′. They have used ∼ 700 galaxies fainter thanI=20.5 mag or V=22.0 mag for the lensing analy-sis, in a field of 7 × 7 arcmin.
Here, we have used a much smaller sample ofbackground galaxies, in a field of comparable size,because we have considered only galaxies fainterthan 23.3 R mag, that is roughly 2.0 mag fainterthan the bright end limit used by Squires and col-laborators. The images of this cluster were takenin the same night as those of A2104, when the see-ing was exceptional. A2163 is at a moderately highredshift (z = 0.2) and lies in a region of the sky nottoo far from the galactic plane (b=30.5), wherethe star field is dense and the galactic absorption isnot negligible (AV = 1.74; Schlegel, Finkbeiner &Davis 1998), so the weak-lensing sample of Squireset al. (1997) may be more affected by contamina-tion by stars and foreground and cluster galaxiesthan the present one. This might be the cause for apossible dilution of the lensing signal measured by
them. Indeed, adopting a comparable magnitudecutoff, R > 21.5 mag, we obtain σSIS =887±145km s−1, that is much closer to the Squires et al.(1997) result.
4.3.4. A2204
Table 5 shows that our results for A2204 arein very close agreement with those from Clowe &Shneider (2002). This work is based on imagestaken with the wide-field camera of the ESO/MPI2.2m telescope (34′× 34′), indicating that whenthe data are well described by an isothermal massprofile, as is the case of A2204, the small fieldof the FORS1 camera does not introduce relevantsystematic errors.
4.4. The peculiar case of A2744
This cluster, also known as AC118, is inter-esting for several reasons. It is the most distant(z = 0.308) and apparently the most massive clus-ter in our sample. It is also the only cluster wherewe have found gravitational radial arcs (see Cam-pusano et al. 2003), and has a flat shear profilewhich is very poorly fitted by isothermal mod-els. Furthermore, its weak-lensing mass is smallerthan the virial mass but, surprisingly, significantlylarger than the X-ray estimate. We should havein mind that the use of an isothermal profile tofit a shallow mass distribution tends to underes-timate the cluster mass, since the shear dependsmore on the density gradient than on the densityactual value. But an important clue for the inter-pretation of this cluster comes from the dynamicalanalysis of Girardi & Mezzeti (2001), who found avelocity distribution with two superposed peaks,produced by two structures along the line of sight,with velocity dispersions of 1121 and 682 km s−1.Weak-lensing, in this case, is sensitive to the to-tal mass, but single isothermal mass models areclearly inadequate for this system. On the otherside, the mass inferred from the X-ray analysis willbe dominated by the luminous and hotter struc-ture; for σv = 1121 km s−1 a value of TX = 8.0keV is expected, somewhat smaller than the X-raymeasurement(see Table 3). In this scenario the X-ray luminosity is the sum of the luminosities ofboth structures. The value of LX for A2744 is ac-tually very high (22.05 × 1044 erg s−1), ranked insecond place in this sample. Of course, both TX
and LX may be increased with respect to their
17

equilibrium values by shocks between these twosubstructures and, therefore, all these results areconsistent with the hypothesis that A2744 is actu-ally two close structures along the line of sight oreven a pair of clusters in process of merging.
4.5. Negative weak-lensing detections: A1651
and A1664
For only 2 out of 24 clusters (8.3%) we wereunable to reconstruct the two-dimensional massdistribution. This number is comparable to thatobtained by Dahle et al. (2002), who failed to de-tect weak-lensing in 1 cluster out of 39 (2.5%).These authors have adopted a sample thresholdof LX = 1045 erg s−1, two times larger than ours.Our two failure cases are clusters with luminositiesbelow this threshold.
For A1664 we were unable to reconstruct themass density distribution and to fit a SIS profile,and we have got a very marginal detection whenfitting a SIE profile. This cluster is at z = 0.13 andhas a X-ray luminosity very close to our threshold.Neither the X-ray temperature nor the velocitydispersion is available in literature for this object.Moreover only 246 galaxies were used for the weaklensing analysis (the third smaller number of thesample). It seems that we were unable to detectthe weak-shear because its signal is small and isdominated by the noise in its distortion map.
The case of A1651 is less clear, since this clusterseems to be more massive than A1664 (see Table3). In fact, the SIS fit resulted in a very small valuefor σSIS , but the SIE fit led to a significant detec-tion, resulting in a value of σSIS = 539 ± 198 kms−1, consistent with the dynamical velocity disper-sion found in literature, 695+200
−108km s−1 (Fadda etal. 1996). The position angle of the SIE model isalmost coincident with that of the BCG major-axis, as found for most of the clusters in oursample. However, the lensing signal is still toolow to allow a successful mass reconstruction byLensEnt.
Another common factor for these two casesis that seeing conditions during the observationswere within the worst quartile of the sample. Thisputs in evidence how critical seeing conditions arefor ground-based, weak lensing studies.
5. Conclusions
We analyzed the mass content of galaxy clustersbelonging to a well defined sample of 24 Abell clus-ters brighter than LX =5 × 1044 erg s−1 (0.1-2.4keV Ebeling et al. 1996), spanning over the red-shift range 0.05-0.31, using current techniques ofweak- lensing analysis and homogeneous observ-ing material of subarsecond image quality. Theresulting catalog of mass maps determined for 22of these clusters, together with the correspond-ing light maps, have been put together in the Ap-pendix. Our main conclusions may be summarizedas follows:
1. We were able to detect significant weak-lensing signal in 22 out of 24 clusters. Thishigh success rate shows the feasibility ofweak-lensing studies with 8m-class tele-scopes using service mode observations andrelatively short exposure times. It also in-dicates that the X-ray luminosity is indeeda good way to select massive clusters. Non-detections in A1651 and A1664 are probablydue to a combination of poorer observingconditions with low mass content.
2. The center of the mass and light distribu-tions of the clusters are coincident for ∼77%of the sample (17 out of 22).
3. Few clusters present massive substructures,what can be due, in part, to small fields (0.4to 1.8 Mpc on a side) and the relatively lowresolution of the mass maps. When signifi-cant substructures are seen, they are gener-ally associated with bright cluster members.However, at least in one cluster (A1451)there seems to exist a substructure withouta clear optical counterpart.
4. The clusters analyzed here present impor-tant departures from spherical symmetry, ascan be verified by the better fits obtainedwith elliptical profiles.
5. We have found, for the first time in an sta-tistically significant sample, that the darkmatter and brightest cluster galaxy major-axes are strongly aligned: for 62.5% of theclusters (15 out of 24) the difference betweentheir position angle is smaller than 20.
18
6. Most clusters are in or near a state of dy-namical equilibrium. This diagnosis derivesfrom the agreement between their velocitydispersions and the temperature of theirICM, directly measured and/or inferredfrom weak-lensing data. Except for A2744,A1451 and A2163, which also present evi-dence of substructures or other complexities,the other clusters show agreement betweenthese quantities at a 1.5 σ level.
7. Clusters in our sample with TX > 8 keV (orσv > 1120 km s−1) show signal of dynami-cal activity. A2163 and A1451 present largedifferences between lensing and dynamicalmass estimates and seem to be far from equi-librium. In both cases, this conclusion cor-roborates previous X-ray analysis.
8. Abell 2744 is the single cluster in this samplethat has X-ray measured temperature morethan 1 σ below the value inferred by weak-lensing. Taking also into account the com-plex dynamics of this cluster, we may explainthis discrepancy by assuming that A2744 is asuperposition of two clusters along the line ofsight, near each other or in process of merg-ing.
Most of these conclusions supports a hierarchi-cal scenario where massive bodies are formed bythe agglomeration of smaller ones, and the depar-tures of equilibrium described above are indeed anevidence that some clusters that are at the top ofthe mass function are still in the process of activeevolution.
This work is based on observations collected atthe European Southern Observatory, Chile (ESOP67.A-0597). ESC and LS acknowledges sup-port by by Brazilian agencies FAPESP, CNPq andPRONEX, and ESC is grateful to the Latin Amer-ican Astronomy Network/UNESCO for fundingtraveling to Chile. JPK acknowledges supportfrom CNRS and Caltech. ESC also thanks thehospitality of the Department of Astronomy ofthe the University of Chile and of the Labo-ratoire d’Astrophysique of the the ObservatoireMidi-Pyrenees. We are also grateful to GastaoLima Neto and Ronaldo de Souza for useful dis-cussions and Sarah Bridle and Phil Marshall for
making their softwares, im2shape and LensEntavailable to us.
19

A. Mass and Light Maps
In this appendix we present figures referent to the weak-lensing analysis. In each figure there are 4 panels.In the first panel (from left to right) we show the cluster image with superimposed sticks that represent theaverage ellipticities and position angles of the background galaxies. The size of the stick is proportional tothe ellipticity. The horizontal stick in the upper right corner of this panel represents an ellipticity of 0.1.We also present an ellipse with the axial ratio and position angle of the best fit SIE profile. In the secondpanel, we show the mass maps, that is, the surface density distribution reconstructed from the shear data, inunities of the critical surface density. The contour are in intervals of 8× 10¹¹ M⊙ Mpc−2. In the third panelthe distribution of light coming from cluster members that belong to the cluster red sequence, in arbitraryunities, smoothed with a Gaussian similar to the one used to produce the mass map. The countour are inintervals of 1× 10¹¹ L⊙ Mpc−2 in the V band. The fourth panel presents the radial shear profile, where thefilled circles represent the average ellipticities projected tangentially to the direction to the cluster center,and the open squares show the ellipticities project in a direction 45 of the tangential one. The solid linerepresents the best-fit SIS profile.
A version of this paper with all figures can be found athttp://www.astro.iag.usp.br/∼eduardo/shear.ps.gz
REFERENCES
Abell, G. O., Corwin, H. G., JR., & Olowin, R. P. 1989, ApJS, 70, 1
Allen, S. W. 1998 MNRAS, 296, 392
Allen, S. W. 2000 MNRAS, 315, 269
Allen, S. W., Schmidt, R. W. & Fabian, A. C. 2002, MNRAS, 334, 11
Alonso, M. V., Valotto, C., Lambas, D. G. & Muriel, H. 1999 MNRAS, 308, 618
Athreya, R. M., Mellier, Y., van Waerbeke, L., Pell, R., Fort, B., Dantel-Fort, M. 2002, a, 384, 743
Bahcall, N. A., Fan, X. 1998, ApJ, 504, 1
Bahcall, N. A., Lubin, L. M., Dorman, V. 1995, ApJ, 447, 81
Bardeau, S.,Kneib,J.-P., Czoske, O., Richard, J.,Soucail, G.,Smail, I., Ebeling, H. et al. 2003,a, in preparationet al 2003, a, in preparation
Bertin, E. & Arnouts, S. 1996, A&AS, 117, 393
Bridle, S. L., Hobson, M. P., Lasenby, A. N. & Saunders, R. 1998, MNRAS, 299, 895
Bridle, S., Kneib, J.-P., Bardeau, S., Gull, S.F., 2002, in ’The shapes of Galaxies and their Dark Halos’ YaleCosmology workshop, 28-30 May 2001, World Scientific.
Campusano, L. et al. 2003, ApJ
Carlberg, R. G., Yee, H. K. C., Ellingson, E., Abraham, R., Gravel, P., Morris, S., Pritchet, C. J. 1996, ApJ,462, 32
Clowe, D. & Schneider, P. 2002, A&A, 395, 385
20

Collins, C. A., Guzzo, L., Nichol, R. C., Lumsden, S. L. 1995, MNRAS, 274, 1071
Dahle, H., Kaiser, N., Irgens, R. J., Lilje, P. B. & Maddox, S. J. 2002, ApJS, 139, 313
Durret, F., Felenbork, P., Lobo, C., & Slezak, E. 1998, A&AS, 129, 281
Ebeling, H., Voges, W., Bohringer, H., Edge, A. C., Huchra, J. P. & Briel, U. G. 1996, MNRAS, 281, 799
Fadda, D., Girardi, M., Giuricin, G., Mardirossian, F., Mezzetti, M. 1996, ApJ,473, 670
Fernandez-Soto, A., Lanzetta, K. M. & Yahil, Amos 1999, ApJ, 513, 34
Fort, B. & Mellier Y. 1994, A&A Rev., 5, 239
Geller, M. J., Beers, T. C., PASP, 94,421
Girardi, M & Mezzeti, M. 2001, ApJ, 548, 79
Goto et al. 2002, PASJ, 54, 515
Henry, J. P., Arnaud, K. A. 1991, ApJ, 372, 410
Hoekstra, H., Franx, M., Kuijken, K., van Dokkum, P. G. 2002, MNRAS, 333, 911
Ikebe, Y, Reiprich, T. H., Bohringer, H., Tanaka, Y. & Kitayama, T 2002, A&A, 383, 773
Irgens, R. J., Lilje, P. B., Dahle, H., Maddox, S. J. 2002, ApJ, 579, 227
Jenkins, A., Frenk, C. S., Pearce, F. R., Thomas, P. A., Colberg, J. M., White, S. D. M., Couchman, H. M.P., Peacock, J. A., Efstathiou, G. & Nelson, A. H. (The Virgo Consortium) 1998, ApJ, 499, 20.
Kormann, R., Schneider, P. & Bartelmann, M. 1994, a, 284, 285
King, L. J. & Schneider, P. 2001, A&A, 369, 1
Kauffmann, G., Colberg, J. M., Diaferio, A., White, S. D. M. 1999, MNRAS, 303, 188
Kneib, J.-P., Ellis, R. S., Smail, I., Couch, W. J., Sharples, R. M. 1996 ApJ, 471, 643
Kuijken, K. 1999, A&A, 352, 355
Lacey, C., Cole, S. 1994, MNRAS, 271, 676
Liang, H., Lemonon, L., Valtchanov, I., Pierre, M. & Soucail G. 2000, A&A, 363, 440
Luppino, G. A., Gioia, I. M., Hammer, F., Le Fevre, O., Annis, J. A. 1999, A&AS, 136, 117
Mahdavi, A. & Geller, M. J. 2001, ApJ, 554, 129
Marshall, P. J., Hobson, M. P., Gull, S. F., Bridle, S. L. 2002, MNRAS, 335, 1037
Markevitch, M., Forman, W. R., Sarazin, C. L. & Vikhlinin, A. 1998, ApJ, 503, 77
Markevitch, M. & Vikhlinin, A. 2001, ApJ, 563, 95
Markevitch, M., Gonzalez, A. H., David, L., Vikhlinin, A., Murray, S., Forman, W., Jones, C. & Tucker, W.2002, ApJ, 567, 27
Mazure, A., Katgert, P., den Hartog, R., Biviano, A., Dubath, P., Escalera, E., Focardi, P., Gerbal, D.,Giuricin, G., Jones, B., Le Fevre, O., Moles, M., Perea, J., Rhee, G. 1996, A&A, 310, 31
21

Mellier, Y. 1999, ARA&A, 37, 127
Mellier, Y., Fort, B. & Kneib, J.-P. 1993, ApJ, 407, 33
Navarro, J. F., Frenk, C. S. & White, S. D. M. 1997, ApJ, 490, 493
Plionis, M. & Basilakos, S. 2002, MNRAS, 329, L47
Press, W. H., Schechter, P. 1974, ApJ, 187, 425
Reiprich, T. H. & Bohringer, H. 2002, ApJ, 567, 716
Sarazin, C. L. 1998, X-ray emission from clusters of galaxies, Cambridge University Press
Schlegel, S., Finkbeiner, D. P. & Davies, M. 1998, ApJ, 500, 525
Sodre, L., Jr., Capelato, H. V., Steiner, J. E., Mazure, A. 1989, AJ, 97, 1279
Sodre, L., Jr., Proust, D., Capelato, H. V., Lima Neto, G. B., Cuevas, H., Quintana, H., Fouque, P. 2001,A&A, 377, 428
Smail, I., Ellis, R. S., Dressler, A., Couch, W. J., Oemler, A., Sharples, R. M. & Butcher, H. 1997 ApJ, 479,70
Smith, G. P., Edge, A. C., Eke, V. R., Nichol, R. C., Smail, I.; Kneib, J.-P. 2003, ApJ, 590, 79
Squires, G., Neumann, D. M., Kaiser, N., Arnaud, M, Babul, A. & Bohringer, H. 1997, ApJ, 482, 648
Tyson J. A., Valdes F. & Wenk R. A. 1990, ApJ, 349, 1
Uson, J. M., Bough, S. P. & Kuhn, J. R. 1991 ApJ, 369, 46
Valtchanov, I., Murphy, T., Pierre, M., Hunstead, R. & Lemonon, L. 2002, A&A, 392, 795
West, M. J., Jones, C. & Forman, W. 1995, ApJ, 451, 5
White, D. A. 2000, MNRAS, 312, 663
White S. D. M., Frenk C. S., 1991, ApJ, 379, 52
Xue, Y.-J. & Wu X.-P. 2000, ApJ, 538, 65
This 2-column preprint was prepared with the AAS LATEX macros v5.0.
22

Fig. 8.— A2744
Fig. 9.— A0022
Fig. 10.— A0085
Fig. 11.— A2811
Fig. 12.— A1437
Fig. 13.— A1451
Fig. 14.— A1553
Fig. 15.— A1650
Fig. 16.— A1651
Fig. 17.— A1664
Fig. 18.— A2029
Fig. 19.— A2104
Fig. 20.— A2163
Fig. 21.— A2204
Fig. 22.— A3695
Fig. 23.— A3739
Fig. 24.— A2345
Fig. 25.— A2384
Fig. 26.— A2426
Fig. 27.— A3856
Fig. 28.— A3888
Fig. 29.— A3984
Fig. 30.— A2597
Fig. 31.— A4010
23