The Kinetic Sunyaev‐Zel’dovich Effect from Radiative Transfer Simulations of Patchy Reionization
Upload
khangminh22Category
view
0download
0
Mon. Not. R. Astron. Soc. 348, 361–367 (2004)
SPH simulations of Shakura–Sunyaev instability at intermediateaccretion rates
V. Teresi,� D. Molteni and E. ToscanoDipartimento di Fisica e Tecnologie Relative, Universita di Palermo, Viale delle Scienze, Palermo, 90128, Italy
Accepted 2003 November 4. Received 2003 October 15; in original form 2003 April 17
ABSTRACTWe show that a standard Shakura–Sunyaev accretion disc around a black hole with an accretionrate M lower than the critical Eddington limit does show the instability in the radiation pressuredominated zone. We obtain this result performing time-dependent simulations of accretiondiscs for a set of values of α and M . In particular we always find the occurrence of the collapseof the disc: the instability develops always towards a collapsed gas pressure dominated discand not towards the expansion. This result is valid for all the initial configurations we tested.We find significant convective heat flux that increases the instability development time, butis not strong enough to inhibit the disc collapse. A physical explanation of the lack of theexpansion phase is proposed considering the role of the radial heat advection. Our finding isrelevant since it excludes the formation of the hot Comptonizing corona – often suggested tobe present – around the central object by the mechanism of the Shakura–Sunyaev instability.We also show that, in the ranges of α and M values we simulated, accretion discs are crossedby significant amplitude acoustic waves.
Key words: accretion, accretion discs – black hole physics – hydrodynamics – instabilities.
1 I N T RO D U C T I O N
This work concerns the possibility of occurrence, stated by Shakuraand Sunyaev (Shakura & Sunyaev 1976), of an instability in theα-discs when the radiation pressure dominates, i.e. in the so-called‘A zone’. Shakura & Sunyaev demonstrated the existence of ther-mal instabilities connected with a difference between Q− and Q+,i.e. the energy emitted per unit area of the disc and the rate ofenergy-generation in the disc. The problem of the existence andoutcome of the Shakura–Sunyaev instability is important in accre-tion disc physics because it affects the model of the origin of theComptonization cloud around some compact objects whose spec-tra contain a significant part in the X-ray band. The idea of a hotgas cloud, called the ‘Comptonization cloud’, around the disc re-gion close to the compact object, where photons are pushed towardshigh frequencies by the Compton scattering with electrons, is oneof the most common ways to explain the spectral behaviour in theX band (Sunyaev & Titarchuk 1980). In general, the outcome ofthe Shakura–Sunyaev instability is guessed to be the formation of ahot cloud around the internal disc region, in which Comptonizationcould happen (Shapiro, Lightman & Eardley 1976).
Some authors already studied the problem of the α-disc time-evolution. In 1984, Taam & Lin found that the local Shakura &Sunyaev stability analysis is confirmed by global time-dependentsimulations of the canonical disc. The instability appears and givesrise to luminosity fluctuations or bursts (Taam & Lin 1984). Taam
�E-mail: [email protected]
& Lin’s result is similar to ours despite the one-dimensional featureof their simulations (whereas we perform two-dimensional axisym-metric simulations). In 1987, Eggum et al. found that an α-disc,at sub-Eddington accretion rates, develops the Shakura–Sunyaevinstability and, as a consequence of that, collapses in a cold thinsheet (Eggum, Coroniti & Katz 1987). In 1998, Fujita & Okudasimulated a radiation pressure dominated α-disc in the subcriticalaccretion rate regime and found that it is thermally stable (Fujita& Okuda 1998). They analyzed the disc structure and found that itcorresponds to the configuration of the slim accretion disc model(Abramowicz et al. 1988). In this model, even if the disc is radiationpressure and electron-scattering dominated, the equilibrium struc-ture is thermally stable, as a consequence of an advective radial heatflux that is dominant with respect to the vertical radiative heat flux.The cases we present are different, as the structure of the discs wesimulated is close to the α-model configuration, rather than to theslim accretion disc structure.
In all the mentioned two-dimensional works, the evolution ofthe system has been simulated only for short time-scales, so theirauthors cannot exclude they detect only a transient behaviour.
In 2001, Agol et al., by performing local two-dimensional hy-drodynamic simulations, showed that the thermal instability de-velops for a vertically integrated dissipation rate proportional tothe vertically integrated total pressure, i.e. in the Shakura–Sunyaevmodel hypothesis (Agol et al. 2001). The result of this instability isgenerally the disc collapse. Only if a strong enough initial increaseof the local radiation energy density is given to the disc, there is anexpansion, that the authors cannot follow because a large amount ofmatter is pushed out of the simulation region.
C© 2004 RAS
Dow
nloaded from https://academ
ic.oup.com/m
nras/article/348/1/361/1415728 by guest on 19 September 2022

362 V. Teresi, D. Molteni and E. Toscano
In our simulations we confirm the results obtained by Eggumet al. (1987) and by Agol et al. (2001). Furthermore, our studiescan follow the system evolution on a much larger time-scale andtherefore give stronger relevance to the collapse result. We can alsosay that the post collapse phase is very long, at least 4.5 × 10⁵ Rg/c(where Rg is the Schwartzschild gravitational radius of the blackhole and c is the light speed). We also suggest that the convective(in z and r directions) energy transport in the disc may have a twofoldrole: (ii) to increase the time-scale of the collapse instability; and(ii) to inhibit the expansion instability.
2 T H E P H Y S I C A L M O D E L
The time-dependent equations describing the physics of accretiondiscs are well known. They include:
(i) mass conservationDρ
Dt= −ρ divv, (1)
(ii) radial momentum conservation
ρDvr
Dt= −ρ
λ2
r 3+ gr + (divσ)r + fr , (2)
(iii) vertical momentum equation
Dvz
Dt= − 1
ρ
dP
dz− gz + fz, (3)
(iv) and energy balance
ρD
Dt
(E + 1
2v2
)= v · Fρ + div(vσ) − divF. (4)
Here D/Dt is the comoving derivative, F is the radiation flux, givenby
F = − c
3ρ(k + σT)∇Erad, (5)
k and σ T are the free–free absorption and Thomson scattering co-efficients, respectively. E rad is the radiation energy per unit volume,f is the radiation force, given by
f = ρk + σT
cF, (6)
λ is the angular momentum per unit mass, E = ε + Eradρ
is the totalinternal energy per unit mass, including gas and radiation terms andσ is the viscosity stress tensor. The component ofσ that is importantin accretion discs is the r–φ one, given by
σrφ = νρrdω
dr. (7)
ν = αv sH is the kinematic viscosity, α is the viscosity parameter ofthe Shakura–Sunyaev model, v s is the local sound speed, H is thedisc vertical thickness, ω is the local angular velocity and the otherterms have the usual gas dynamic meaning.
The gravitational force produced by the black hole is given bythe well-known pseudo-Newtonian formula by Paczynski & Wiita(1980):
F = − G M
(R − Rg)2
RR
(8)
where Rg is the Schwartzschild gravitational radius of the blackhole, given by
Rg = 2G M
c2(9)
and M is the black hole mass.
We adopt the local thermal equilibrium approximation for the ra-diation transfer treatment. However, this assumption does not affectour conclusions.
3 T H E N U M E R I C A L M E T H O D A N DT H E S I M U L AT I O N S P E R F O R M E D
We set up a new version of the smoothed particle hydrodynamics(SPH) code in cylindrical coordinates, for axisymmetric problems.We remind that SPH is a Lagrangean interpolating method. Recentlyit has been shown it is equivalent to finite elements with sparse gridnodes moving along the fluid flow lines (Dilts 1996). For a detailedaccount of the SPH algorithm see Monaghan (1985). For cylindricalcoordinates implementation see Molteni et al. (1998); Chakrabarti &Molteni (1993). Our code includes viscosity and radiation treatment.Let us note that – in general – a Lagrangean code is better suitedto capture convective motions than Eulerian codes. With the samespatial accuracy (cell size equal to particle size), the SPH particlemotion is tracked with great accuracy, i.e. the particle size may belarge but its trajectory can be still determined ‘exactly’. To integratethe energy equation, we adopted the splitting procedure. In the localthermodynamic equilibrium (LTE) condition, the radiation energydensity changes according to the well known diffusion equationgiven by
∂Erad
∂t= −divF = ∇ ·
(c
3ρκtot∇Erad
), (10)
where k tot = k + σ T.In cylindrical coordinates r, z:
∂Erad
∂t= c
r
∂
∂r
(r
3ρκtot
∂Erad
∂r
)+ c
r
∂
∂z
(r
3ρκtot
∂Erad
∂z
). (11)
The SPH version of the radiation transfer term is given following thecriteria by Brookshaw (1994). The cylindrical coordinate version isgiven by(
∂E
∂t
)i
= 1
ri
N∑j=1
m j
r j
(Ei − E j
ρ j
)Di j
Ri j
R2i j
· ∇i Wi j , (12)
where, for clarity, we did not put the subscript rad in E rad, and where
Di j =(
cri
3ρiκtoti
+ cr j
3ρ jκtot j
), Ri j = (ri − r j , zi − z j ). (13)
This formula can be obtained by the same procedure explained byBrookshaw (1994), but taking into account that – in cylindrical co-ordinates – the particles masses are defined as mk = 2πρ krk�rk�zk
explains the further division by rj in the term mj/rj.The reference units we use are Rg, for length values, and Rg/c for
time values.We performed several simulations; the ones commented here had
the following parameter values:
(i) α = 0.01, M = 0.7, domain R1–R2 = 3–300, h = 0.3;(ii) α = 0.1, M = 0.3, domain R1–R2 = 3–200, h = 0.5;(iii) α = 0.01, M = 0.7, domain R1–R2 = 42–58, h = 0.04;
where M is in units of M E and M E is the critical accretion rate.For all cases the central black hole mass is M = 10 M� The spatialresolution we adopt is h. In case ‘(i)’ we have N = 29 704 particlesat time t = 0.
We used a variable h procedure (Nelson & Papaloizou 1994).The h values above reported are the initial ones. In our procedure,in order to have a not too small particle size (and therefore not too
C© 2004 RAS, MNRAS 348, 361–367
Dow
nloaded from https://academ
ic.oup.com/m
nras/article/348/1/361/1415728 by guest on 19 September 2022

SPH simulations of Shakura–Sunyaev instability 363
-25
-20
-15
-10
-5
0
5
10
15
20
25
0 50 100 150 200 250 300
Z
radius
Figure 1. The r–z profile of the disc of case ‘(i)’ is shown at the time t =282 Rg/c. Every SPH particle is represented by a small dot. On the x-axisthe r values in units of Rg are represented. On the y-axis the z values in unitsof Rg are represented.
great CPU integration times), we put a floor for the h values: h ischosen as the maximum between the value given by the variable hprocedure itself and 1/10 of the disc vertical half thickness. Thiswe have nearly 10 particles along the disc half-thickness even in thecollapsed region. This floor was not adopted for case ‘(iii)’ becausewe already have a good resolution with a not exceeding number ofparticles (N = 67 518).
The boundary conditions of the simulations are not fixed: as theSPH particles move around, the simulation region follows the formassumed by the disc and the values of the physical variables at theboundary of the disc are the values that characterize the boundaryparticles at a certain time.
The spatial extension of the initial configuration is decided by es-tablishing a radial range of physical interest and a vertical extensiongiven by the disc thickness of the Shakura–Sunyaev model.
For radiation, the boundary conditions we used are based onthe assumption of the blackbody emission and particularly on theBrookshaw approximation (Brookshaw 1994). At every time-stepboundary particles are identified by geometrical criteria [the particlehaving the maximum |z| in a vertical strip of radial width given byh is a boundary particle]. The boundary particle loses its thermalenergy according to the formula given by Brookshaw (that is anapproximation of the diffusion equation at the single particle level),that states the particle cooling rate proportional to
QT
h2(14)
where
Q = 4acT 3
3ρκtot(15)
In all our simulations the boundary particles never reach an opticalthickness lower than 10.
Let us now comment the results of our study referring to thefigures of the simulation data.
Fig. 1 shows the disc structure for case ‘(i)’ at the adimensionaltime t = 282. The disc profile shows the Z height of the disc, constantalong the A zone. In this figure it is evident an initial large convectivemotion in the disc in a region close to the black hole.
Fig. 2 shows the same disc at the larger time t = 12 000. Thecollapsed zone is clearly shown.
-25
-20
-15
-10
-5
0
5
10
15
20
25
0 50 100 150 200 250 300 350
Z
radius
Figure 2. The r–z profile of the same disc case ‘(i)’ at the time t = 12 000Rg/c is shown.
0
2
4
6
8
10
0 50 100 150 200 250 300 350
Pra
d/P
gas
radius
Figure 3. The ratio Prad/Pgas at the times t = 282 and t = 12 000 is shown.On the x-axis the r values in units of Rg are represented. The configurationat the later time, collapsed, exhibits a gas pressure dominated zone up to r =70 Rg, whereas the other configuration, at a earlier time, shows that, up to150 Rg, the disc is radiation pressure dominated.
In Fig. 3, the ratio Prad/Pgas at the times t = 282 and t = 12 000is shown, exhibiting evidence of the collapse.
Fig. 4 shows that the disc luminosity is steadily decreasing fromthe initial theoretical value to much lower values due to the lowertemperature reached by the collapsed A zone.
Case ‘(ii)’ has a larger h and a lower number of particles and itwas possible to follow on the simulation up to the large time t =680 000. The r–z distribution of the disc particles is very similar tocase ‘(i)’.
We show in Fig. 5 the luminosity of this disc versus time. It isapparent that the luminosity has a large decrease during the col-lapse going down from a peak at L = 6.5 × 1037 erg s−1 to L =8.5 × 1035 erg s−1. After the collapse the disc luminosity has aslow increase. Nearly after the time t = 4.8 × 10⁵ (correspond-ing to physical time t = 48 s, for our parameters) the luminosityreached an average value of L = 3 × 1036 erg s−1 and starts to showa strong flaring activity with luminosity reaching values up to L =1.6 × 1037 erg s−1. Obviously the possibility of a ‘recharge’ of theinner zone is to be expected and has been guessed by Eggum et al.(1987) and Agol et al. (2001), but – up to now – it was not givenany estimate of the time-scale involved. It has to be noted that the
C© 2004 RAS, MNRAS 348, 361–367
Dow
nloaded from https://academ
ic.oup.com/m
nras/article/348/1/361/1415728 by guest on 19 September 2022
364 V. Teresi, D. Molteni and E. Toscano
1e+036
1e+037
1e+038
1e+039
0 5000 10000 15000 20000 25000 30000
Lum
inos
ity
time
Figure 4. The time-behaviour of the disc luminosity is shown. On the x-axisthe time values in units of Rg/c are represented. On the y-axis the luminosityvalues in units of erg s−1 are represented.
1e+035
1e+036
1e+037
1e+038
0 100000 200000 300000 400000 500000 600000 700000
Lum
inos
ity
time
Figure 5. The time-behaviour of the disc luminosity is shown for the discof case ‘(ii)’.
refilling time-scale is definitely shorter than the radial viscous drifttime-scale tdrift = r2/ν as derived from the canonical disc structure.
In the ‘(iii)’ case we simulated a small sector of the disc in theradiation pressure dominated zone with a very accurate spatial res-olution. This case is similar to the Agol’s case 1 (Agol et al. 2001),with nearly the same disc parameters and numerical resolution (thefinest grid used for their case 1 is a 256 × 256 one, we have 67 518particles). We also obtained a vertical collapse instability of the discand no expansion.
Fig. 6 shows the r–z profiles at times t = 20 000 and t = 22 400of the collapsing disc, compared with the disc profile in the initialconfiguration. The collapsed structure is completely gas pressuredominated. In the figure is also apparent the fact that there are wavestravelling along the disc.
During the simulations, we also calculate the z-averaged convec-tive and advective heat fluxes at different values of r. By ‘convec-tive flux’ we mean the heat flux along the z-direction due to thevertical motion of the gas, whereas by ‘advective flux’ we meanthe heat flux along the r-direction due to the radial motion of thegas. The main time-scales involved in our problem are defined asfollows.
The mean convection time-scale is tconv = εH/Fconv, where Fconv
is the z-averaged convective heat flux and ε is the total energy
-5
-4
-3
-2
-1
0
1
2
3
4
5
35 40 45 50 55 60 65
Z
radius
Figure 6. The border particles of the disc case ‘(iii)’ are shown at the timest = 0 (vertical crosses), t = 20 000 Rg/c (diagonal crosses) and t = 22 400Rg/c (asterixes).
0.001
0.01
0.1
1
10
100
1000
10000
10 20 30 40 50 60 70 80 90 100 110
time-
scal
es
radius
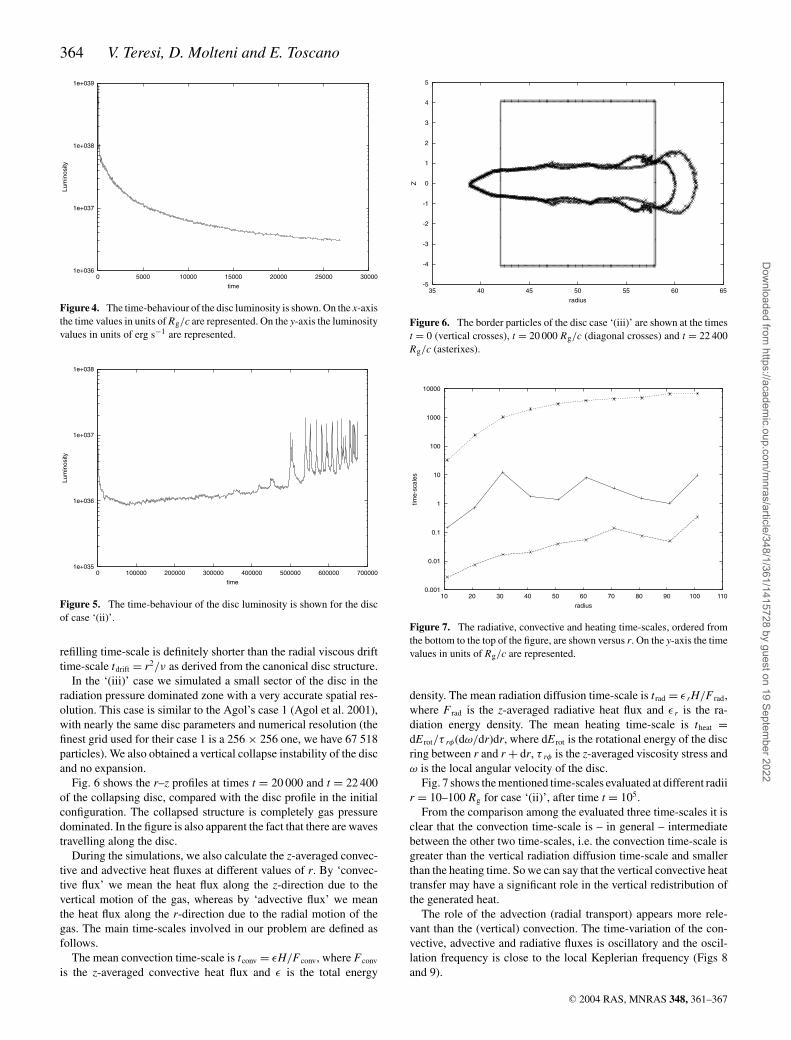
Figure 7. The radiative, convective and heating time-scales, ordered fromthe bottom to the top of the figure, are shown versus r. On the y-axis the timevalues in units of Rg/c are represented.
density. The mean radiation diffusion time-scale is trad = ε rH/F rad,where F rad is the z-averaged radiative heat flux and ε r is the ra-diation energy density. The mean heating time-scale is theat =dE rot/τ rφ(dω/dr)dr, where dE rot is the rotational energy of the discring between r and r + dr, τ rφ is the z-averaged viscosity stress andω is the local angular velocity of the disc.
Fig. 7 shows the mentioned time-scales evaluated at different radiir = 10–100 Rg for case ‘(ii)’, after time t = 105.
From the comparison among the evaluated three time-scales it isclear that the convection time-scale is – in general – intermediatebetween the other two time-scales, i.e. the convection time-scale isgreater than the vertical radiation diffusion time-scale and smallerthan the heating time. So we can say that the vertical convective heattransfer may have a significant role in the vertical redistribution ofthe generated heat.
The role of the advection (radial transport) appears more rele-vant than the (vertical) convection. The time-variation of the con-vective, advective and radiative fluxes is oscillatory and the oscil-lation frequency is close to the local Keplerian frequency (Figs 8and 9).
C© 2004 RAS, MNRAS 348, 361–367
Dow
nloaded from https://academ
ic.oup.com/m
nras/article/348/1/361/1415728 by guest on 19 September 2022

SPH simulations of Shakura–Sunyaev instability 365
-1e+019
-8e+018
-6e+018
-4e+018
-2e+018
0
2e+018
4e+018
6e+018
8e+018
1e+019
585000 585500 586000 586500 587000 587500 588000 588500 589000
fluxe
s
time
Figure 8. The convective and advective fluxes at r = 30 Rg are shownversus time. On the y-axis the fluxes values in units of erg s−1 cm−2 are rep-resented. The dashed line represents the convective flux behaviour, whereasthe continuous one refers to the advective flux.
-1e+019
-5e+018
0
5e+018
1e+019
1.5e+019
2e+019
2.5e+019
580000 582000 584000 586000 588000 590000 592000 594000
fluxe
s
time
Figure 9. The convective and advective fluxes at r = 80 Rg are shownversus time. On the y-axis the fluxes values in units of erg s−1 cm−2 are rep-resented. The dashed line represents the convective flux behaviour, whereasthe continuous one refers to the advective flux.
The approximate equality between the flux oscillation and Ke-plerian rotation frequencies is explainable if one assumes that theflux oscillation is due to the propagation of an acoustic wave inthe disc. Milsom & Taam already showed that accretion discs arecrossed by acoustic waves (Milsom & Taam 1996, 1997). In thelimit of negligible viscosity and advection and for propagation di-rection perpendicular to the disc rotation axis, it is possible to havean analytical formula for the wave frequency. The dispersion rela-tion for these waves is given by ω2 = k2 + K2v2
s (Chandrasekhar1961), where ω is the angular frequency of the wave, K is the wavenumber and k is the so-called local epicycle frequency, given byk2 = 2(�/r) (d/dr)(r2 �), where � is the local angular velocity ofthe disc. k is in general close to the local Keplerian angular veloc-ity. Therefore, the fact that the waves frequencies and the Keplerianangular velocities are close is a suggestion of the acoustic origin ofsuch waves in accretion discs.
Finally, the waves we obtain have amplitudes that remain roughlyconstant in time. No other kind of disc structure variability is present.
We may add that the wave phenomenon appears – at differentintensity levels – in all cases we examined. We never obtained
a monotonic regular radial speed as the Shakura–Sunyaev modelpredicts.
4 D I S C U S S I O N
Here we discuss two items: the absence of the expansion instabilityand the refilling of the inner zone of the disc.
The origin of the instability in radiation pressure dominated zoneis clear, but it is not clear why the preferred evolution is towardsthe collapsed state and not towards the expanded one. At subcriticalaccretion rates, i.e. in our accretion rate regimes, the expansioninstability never occurs. We suggest that this result can be due totwo effects: the enhanced cooling in the expansion branch and thesignificant role of advection.
If the disc evolved towards the expansion instability, the discdensity would go down and therefore so would its optical thick-ness. The basic LTE approximation, under which the disc modelis built, breaks down; the disc can then radiate its energy contentmore quickly than it is heated by its viscosity. In our view the roleof convection and advection may also contribute to reduce the ex-pansion instability, but not the collapse instability. This mechanismhas been considered capable to reduce the Shakura–Sunyaev insta-bility. It is known that such a transfer should be present in accretiondiscs (Bisnovatyi-Kogan & Blinnikov 1977; Fujita & Okuda 1998;Shakura, Sunyaev & Zilitinkevich 1978), as a result of the entropygradient associated with the radiation field in thermal equilibriumwith the gas in the accretion disc. This gradient assumes a very largevalue when the temperature distribution is determined only by theradiative heat transfer and the viscous energy production rate. Fol-lowing Bisnovatyi-Kogan & Blinnikov (1977) analysis, the verticalconvective motion and the consequent vertical heat transfer have,therefore, the role of producing an isentropic z structure. If we indi-cate with Fconv the vertical convective heat flux, the equation of thevertical heat transfer is, in presence of convection,
− d
dz(Frad + Fconv) + η
(r
dω
dr
)2
= 0, (16)
where F rad is the standard radiative flux. Thus we have a heat fluxwhose value has been enhanced from F rad to
Ftot = Frad + Fconv = Frad
(1 + Fconv
Frad
)= f Frad, (17)
where
f = 1 + Fconv
Frad. (18)
It has been demonstrated that this enhancement of the vertical heatflux by a factor f produces an increase of the instability developmenttime by the same factor f (Shakura et al. 1978). From our simulationswe obtain that, in the parameter range we explored, f is always lessthan 2. Such a small value of f does not significantly increase theinstability development time. However, the advected radial heat isnot taken into account in the calculations of Bisnovatyi-Kogan &Blinnikov (1977), Shakura et al. (1978).
Figs 10 and 11 show the radial and vertical speeds of the discparcels versus r. It is clearly apparent from Figs 8, 9, 10 and 11 thatthe radial flux is greater than the vertical one.
As the radial heat flux assumes a significant value, the heat pro-duced at a certain radius is carried away from that point of the discwhere it had the possibility to produce the expansion instability.Furthermore, this advection helps the cooling of the disc towardsthe collapsed configuration of the instability.
C© 2004 RAS, MNRAS 348, 361–367
Dow
nloaded from https://academ
ic.oup.com/m
nras/article/348/1/361/1415728 by guest on 19 September 2022

366 V. Teresi, D. Molteni and E. Toscano
-0.002
-0.0015
-0.001
-0.0005
0
0.0005
0.001
0.0015
0.002
0 50 100 150 200 250 300
radi
al s
peed
radius
Figure 10. The radial speed of the disc parcels is shown versus r. On they-axis the speed values in adimensional units are represented.
-0.002
-0.0015
-0.001
-0.0005
0
0.0005
0.001
0.0015
0.002
0 50 100 150 200 250 300
vert
ical
spe
ed
radius
Figure 11. The vertical speed of the disc parcels is shown versus r. On they-axis the speed values in adimensional units are represented.
We obtain values of the radial heat flux that are large with respectto the vertical convective flux. Therefore, we propose that the ab-sence of the disc expansion may be due also to the role of the radialadvective heat transfer.
As regards the collapse instability development times, we havecompared the theoretical values with the ones calculated from theluminosity time-behaviour: we see that, when the disc collapses,its luminosity decreases very quickly and the time on which theluminosity reduction occurs can be assumed as the instability de-velopment time. As an example, we can see the comparison betweenthe two times in case ‘(ii)’. The theoretical instability developmenttime, t th, can be calculated from the instability development rate �th,given by �th = αω [ 6(5β r − 3)/A(β r)], with A(β r) = 8 + 51β r
− 3β2r and ω equal to the angular velocity of the disc at the radius
considered (Shakura & Sunyaev 1976). With this expression for �th
we can calculate the instability development time t th as t th = 1/�th.The value of t th at the innermost radii is of the order of 10−1 s. Fromthe luminosity time-behaviour we deduce similar values.
Fig. 12 shows the ratio of the radiation pressure to the gas pressureversus the radial distance for case ‘(ii)’ when the disc was in theinitial configuration, in the collapsed state (time t = 1 × 10⁵) andwhen it was in the refilled state (time t = 6 × 10⁵). It is clear that, in
0.1
1
10
100
1000
0 10 20 30 40 50 60 70
Pra
d/P
gas
radius
Figure 12. The ratio Prad/Pgas in the initial configuration (asterixes) andat the times t = 105 (diagonal crosses) and t = 6 × 10⁵ (vertical crosses)is shown. The initial configuration, in the shown radial range, is radiationpressure dominated. At the intermediate time (t = 105) the disc, collapsed,is gas pressure dominated. The configuration at the later time (t = 6 × 10⁵),refilled, shows again a radiation pressure dominated zone up to r = 60 Rg.
the A zone, the refilled state has a Prad/Pgas value larger than 1, butsmaller than the very initial value, at time t = 0. The presence of thiszone with Prad > Pgas also in the refilled configuration suggests thatthe Shakura–Sunyaev instability may be again operating to producethe recurrent flaring activity.
The refilling time-scale computed from the simulation data isabout 5 × 10⁵, that is, shorter than the theoretical drift time-scaledue to the viscosity. We argue that the refilling is driven not onlyby the viscosity: the wave phenomenon may also play significantrole. Indeed, the plain theoretical model predicts a time-scale tdrift =r2/ν = 1.8 × 10⁷. This fact should be taken into account developingtheoretical models of recurrent flaring disc activity due to refilling.
5 C O N C L U S I O N S
The results of our simulations of the time-evolution of αPtot discs,with a large portion in radiation pressure dominating conditions,show definitely that the Shakura–Sunyaev collapse instability de-velops. After a long time the disc partially recovers its luminos-ity, and furthermore it exhibits a flaring-like activity. The recoverytime-scale is shorter than the viscous drift time-scale. We attributeto the advective–convective heat transfer a significant role to de-termine both the recovery and the not occurence of the expansioninstability.
We suggest that the reason that do not we see any expansioninstability is the presence of a radial convective motion, which isnot considered in the Shakura & Sunyaev analysis, but is naturallysimulated by our code. In such conditions, the radial heat trans-fer due to the advection of matter (and thermal energy) carries theexcess of energy produced by viscosity (that would cause the ther-mal expansion) away from the disc element at that r. These resultsimply some problem for the model of the formation of the Comp-tonization cloud supposed to exist in many disc configurations toexplain the observed radiation spectra. From the canonical disc itseems impossible to produce that Comptonization cloud via theplain Shakura–Sunyaev instability.
Another relevant aspect of our simulations is the presence ofacoustic waves; they can cause a kind of periodical variability of
C© 2004 RAS, MNRAS 348, 361–367
Dow
nloaded from https://academ
ic.oup.com/m
nras/article/348/1/361/1415728 by guest on 19 September 2022

SPH simulations of Shakura–Sunyaev instability 367
the radiation spectrum and intensity that could be related, from theobservational point of view, with the phenomenon of quasi-periodicoscillations (QPOs: Psaltis 2001). Oscillation frequencies of the ra-diative flux we calculated are compatible with some QPOs. It is truethat the total disc luminosity takes into account the contributionsfrom the whole disc and so the wave phenomenon may not appear.However, one should take also into account the possibility that thereflection of the radiation coming from inner disc zones by outerzone waves could produce an enhanced oscillation in the total lumi-nosity. Such a study requires an accurate treatment of the interactionbetween the emitted radiation and the disc itself and of the radiationtransfer in the outermost layers of the disc, which is beyond thiscontribution.
The flaring activity could be also responsible of QPO phenomena.We are planning to confirm and study its characteristics by numericalsimulations with increased spatial resolution.
R E F E R E N C E S
Abramowicz M. A., Czerny B., Lasota J. P., Szuszkiewicz E., 1988, ApJ,332, 646
Agol E., Krolik J., Turner N. J., Stone J. M., 2001, ApJ, 558, 543Bisnovatyi-Kogan G. S., Blinnikov S. I., 1977, A&A, 59, 111Brookshaw L., 1994, Mem. Soc. Aston. Italy, 65, 1033
Chakrabarti S. K., Molteni D., 1993, ApJ, 417, 671Chandrasekhar S., 1961, Hydrodynamic and Hydromagnetic Stability.
Clarendon Press, OxfordDilts G. A., 1996, Los Alamos Natl. Lab. Report LA-UR, 96-134Eggum G. E., Coroniti F. V., Katz J. I., 1987, ApJ, 323, 634Fujita M., Okuda T., 1998, PASJ, 50, 639Milsom J. A., Taam R. E., 1996, MNRAS, 283, 919Milsom J. A., Taam R. E., 1997, MNRAS, 286, 358Molteni D., Gerardi G., Valenza M. A., Lanzafame G., 1998, in Chakrabarti
S. K., ed., Observational Evidence for Black Holes in the Universe.Kluwer, Dordrecht
Monaghan J. J., 1985, Comp. Phys. Repts., 3, 71Nelson R. P., Papaloizou J. C. B., 1994, MNRAS, 270, 1Paczynski B., Wiita P. J., 1980, A&A, 88, 23Psaltis D., 2001, Adv. Space Res., 28, 481Shakura N. I., Sunyaev R. A., 1973, A&A, 24, 337Shakura N. I., Sunyaev R. A., 1976, MNRAS, 175, 613Shakura N. I., Sunyaev R. A., Zilitinkevich S. S., 1978, A&A, 62,
179Shapiro S. L., Lightman A. L., Eardley D. M., 1976, ApJ, 204, 187Sunyaev R. A., Titarchuk L., 1980, A&A, 86, 121STaam R. E., Lin D. N. C., 1984, ApJ, 287, 761
This paper has been typeset from a TEX/LATEX file prepared by the author.
C© 2004 RAS, MNRAS 348, 361–367
Dow
nloaded from https://academ
ic.oup.com/m
nras/article/348/1/361/1415728 by guest on 19 September 2022
Copyright © 2022 FDOKUMEN