Sulphur-gas concentrations in volcanic and geothermal areas in Italy and Greece: Characterizing...
14
This article appeared in a journal published by Elsevier. The attached copy is furnished to the author for internal non-commercial research and education use, including for instruction at the authors institution and sharing with colleagues. Other uses, including reproduction and distribution, or selling or licensing copies, or posting to personal, institutional or third party websites are prohibited. In most cases authors are permitted to post their version of the article (e.g. in Word or Tex form) to their personal website or institutional repository. Authors requiring further information regarding Elsevier’s archiving and manuscript policies are encouraged to visit: http://www.elsevier.com/authorsrights
-
Upload
independent -
Category
Documents
-
view
1 -
download
0
Transcript of Sulphur-gas concentrations in volcanic and geothermal areas in Italy and Greece: Characterizing...
This article appeared in a journal published by Elsevier. The attachedcopy is furnished to the author for internal non-commercial researchand education use, including for instruction at the authors institution
and sharing with colleagues.
Other uses, including reproduction and distribution, or selling orlicensing copies, or posting to personal, institutional or third party
websites are prohibited.
In most cases authors are permitted to post their version of thearticle (e.g. in Word or Tex form) to their personal website orinstitutional repository. Authors requiring further information
regarding Elsevier’s archiving and manuscript policies areencouraged to visit:
http://www.elsevier.com/authorsrights

Author's personal copy
Sulphur-gas concentrations in volcanic and geothermal areas in Italy and Greece:Characterising potential human exposures and risks
W. D'Alessandro a,⁎, A. Aiuppa a,b, S. Bellomo a, L. Brusca a, S. Calabrese b, K. Kyriakopoulos c,M. Liotta a, M. Longo a
a Istituto Nazionale di Geofisica e Vulcanologia ‐ Sezione di Palermo, via U. La Malfa 153, 90146 Palermo, Italyb Università di Palermo, Dipartimento DiSTeM, via Archirafi 36, 90123 Palermo, Italyc National and Kapodistrian University of Athens, Faculty of Earth Sciences, Department of Geology and Geoenvironment, Panepistimioupolis 157 84, Ano Ilisia, Greece
a b s t r a c ta r t i c l e i n f o
Article history:Received 2 January 2012Accepted 13 August 2012Available online 5 September 2012
Keywords:Sulphur dioxideHydrogen sulphideVolcanic risksGas hazard
Passive samplers were used to measure the atmospheric concentrations of SO2 naturally emitted at threevolcanoes in Italy (Etna, Vulcano and Stromboli) and of H2S naturally emitted at three volcanic/geothermalareas in Greece (Milos, Santorini and Nisyros). The measured concentrations and dispersion patterns variedwith the strength of the source (open conduits or fumaroles), the meteorological conditions and the areatopography. At Etna, Vulcano and Stromboli, SO2 concentrations reach values that are dangerous to peopleaffected by bronchial asthma or lung diseases (>1000 μg m−3). H2S values measured at Nisyros also exceedthe limit considered safe for the same group of people (>3000 μg m−3). The data obtained using passivesamplers represent time-averaged values over periods from a few days up to 1 month, and hence concentra-tions probably reached much higher peak values that were potentially also dangerous to healthy people. Thepresent study provides evidence of a peculiar volcanic risk associated with tourist exploitation of activevolcanic areas. This risk is particularly high at Mt. Etna, where the elderly and people in less-than-perfecthealth can easily reach areas with dangerous SO2 concentrations via a cableway and off-road vehicles.
© 2012 Elsevier B.V. All rights reserved.
1. Introduction
Volcanoes are not only one of the most-impressive expressions ofgeodynamic activity but also important tourist destinations. Activevolcanoes such as Kilauea on Hawai'i island (USA), Santorini (Greece)and Mt. Aso (Japan) attract millions of both domestic and foreigntourists per year (Erfurt-Cooper and Cooper, 2010; Ng'Walali et al.,1999), while the tourism industry in Iceland is mainly based on itsnatural environment, with active volcanoes constituting an importantfeature (Bird et al., 2010).
Many areas associated with a relatively high risk due to activevolcanoes offer access to adventure activities and outstanding views,but their tourist exploitation requires assessments of the safety ofvisitors. The summit crater area ofMt. Etna is a clear example of a highlydangerous area. At least two lethal episodes have involved tourists in
this area. A phreatic explosion from the Bocca Nuova crater during aperiod of volcanic quiescencewas responsible for the death of 9 touristsand 22 injuries on 12 September 1979 (Kieffer, 1979), and 2 othertourists died in similar circumstances in April 1987. It is thereforeessential that risk mitigation strategies in active volcanic areas includethe tourism sector, not only to protect operators, their clients andstaff, but also to protect economic interests. Furthermore, recent stud-ies have highlighted the importance of providing information abouthazards to tourists, with an increased knowledge giving them a more-accurate risk perception and consequently a lower risk-taking attitudeand lower probability of ignoring possible prohibitions and limitations(Bird et al., 2010; Nomura et al., 2004).
Volcanic and geothermal areas are major natural sources ofvolatiles to the atmosphere. Although volcanic systems such as Etnaare the largest point sources of environmentally relevant gaseouscompounds, total anthropogenic emissions are generally overwhelm-ingly larger (Gerlach, 1991). Volcanic activity is also one of the largestnatural sources of a large variety of toxic sulphur gases (e.g. COS andCS2), of which sulphur dioxide (SO2) and hydrogen sulphide (H2S)are the main species. The former is released in huge quantities from
Journal of Geochemical Exploration 131 (2013) 1–13
⁎ Corresponding author. Tel.: +39 091 6849409; fax: +39 091 6849449.E-mail address: [email protected] (W. D'Alessandro).
0375-6742/$ – see front matter © 2012 Elsevier B.V. All rights reserved.http://dx.doi.org/10.1016/j.gexplo.2012.08.015
Contents lists available at SciVerse ScienceDirect
Journal of Geochemical Exploration
j ourna l homepage: www.e lsev ie r .com/ locate / jgeoexp

Author's personal copy
volcanoes characterised by open-conduit activity, while the latter istypical of hydrothermal systems.
While many of the risks in volcanic/geothermal areas have beenrecognised for a long time, the gas hazard, which is a more subtle risk,is often disregarded (D'Alessandro, 2006; Hansell and Oppenheimer,2004). Deadly events due to volcanic gases are almost never related toparoxysmal volcanic activity, and since they typically occur sporadicallythey almost never receive widespread public attention and seldomreach the peer-reviewed literature. The onlywell-known incident relat-ed to volcanic gases occurred at Lake Nyos (Cameroon), where on 21August 1986 about 1700 people were killed and 850 injured by therelease of a massive amount of carbon dioxide (CO2) from the lake,which was not related to any paroxysmal volcanic activity (Baxter etal., 1989). Witham (2005) reported a database of volcanic disastersand incidents of the 20th century. Of the 491 reported events, 11% re-ferred to volcanic gases and accounted for 2016 (2% of the total) and2860 (18%) of the killed and injured people, respectively. As the authorherself stated, this database is incomplete. For example, only one of themany incidents due to volcanic gases that occurred in Italy (Chiodini etal., 2007) is included in Witham's database. Moreover, it is highlysignificant that the Lake Nyos disaster ranks only in eighth place forthe number of fatalities and in fifth place for the number of injured inthis database.
While CO2 has been responsible for most of the lethal incidents,both SO2 and H2S also cause many fatalities in volcanic areas (Hanselland Oppenheimer, 2004; McDougall and Garland, 1954; Witham,2005). Sulphur dioxide concentrations of up to thousands of micro-grams per cubic metre can easily be achieved close to active volcaniccraters (Aiuppa et al., 2004, 2005; Allen et al., 2002; Michaud et al.,2005; Ng'Walali et al., 1999; Stephenson et al., 1991). Six fatalities dueto SO2 have been documented among tourists visiting Mt. Aso volcano(Japan) in the period 1989–1997, while another 59 persons werehospitalised in the period 1980–1995 (Ng'Walali et al., 1999). Hanselland Oppenheimer (2004) reported on four deaths due to volcanicgases in the period 1983–2003 at Kilauea volcano, Hawaii.
The passive-sampler technique has long been used in environmen-tal studies to monitor the dispersion of gaseous compounds such ascombustion products (e.g. SO2 and NOx), reduced gases (e.g. H2S andNH3), ozone and volatile organic compounds. Diffusive samplers mea-sure time-integrated gas concentrations. They take samples at a ratecontrolled by molecular diffusion through an entrapped volume of air(or permeation through a membrane) without active movement of airthrough the device. The samplers are passive, but since there are severaltypes of passive samplers, the word “diffusive” is more precise (howev-er, both terms are used herein). A sorbent (usually an impregnatedfilter) is placed in one end of a tube that entraps a volume of air andthereby creates a constant transport resistance to target moleculesbefore they reach the sorbent, which should trap all target gas mole-cules reaching its surface. This sorption creates a concentration gradientinside the tube and a net flux of the adsorbed gas that is proportional tothe ambient concentration andwhich can be calculated using Fick'sfirstlaw of diffusion (Ferm et al., 2002).
In this study the atmospheric concentrations and dispersion patternof naturally emitted SO2 were measured at three volcanoes of southernItaly (Etna, Vulcano and Stromboli), and those of H2S were measuredat three volcanic/geothermal areas of Greece (Milos, Santorini andNisyros). These two sulphur gases are especially important becausethey are quantitatively the third-most-prevalent gas species emittedfrom active volcanic/geothermal systems after H2O and CO2, and theiratmospheric concentrations in these areas are normally the most dan-gerous to human health.
The health risks have been analysed at some of the studied sys-tems, but only using numerical models (Klose, 2007; Pareschi et al.,1999); in the present study, atmospheric concentrations were mea-sured by a network of passive samplers positioned about 2 m abovethe ground, which gave time-integrated values for periods from a
few hours to about 2 months. Most of the studied volcanic areas aresignificant tourist destinations, and hence samplerswere placed aroundthe main gas-emitting vents including all of the zones frequented bytourists.
2. Study areas and methods
2.1. Study areas
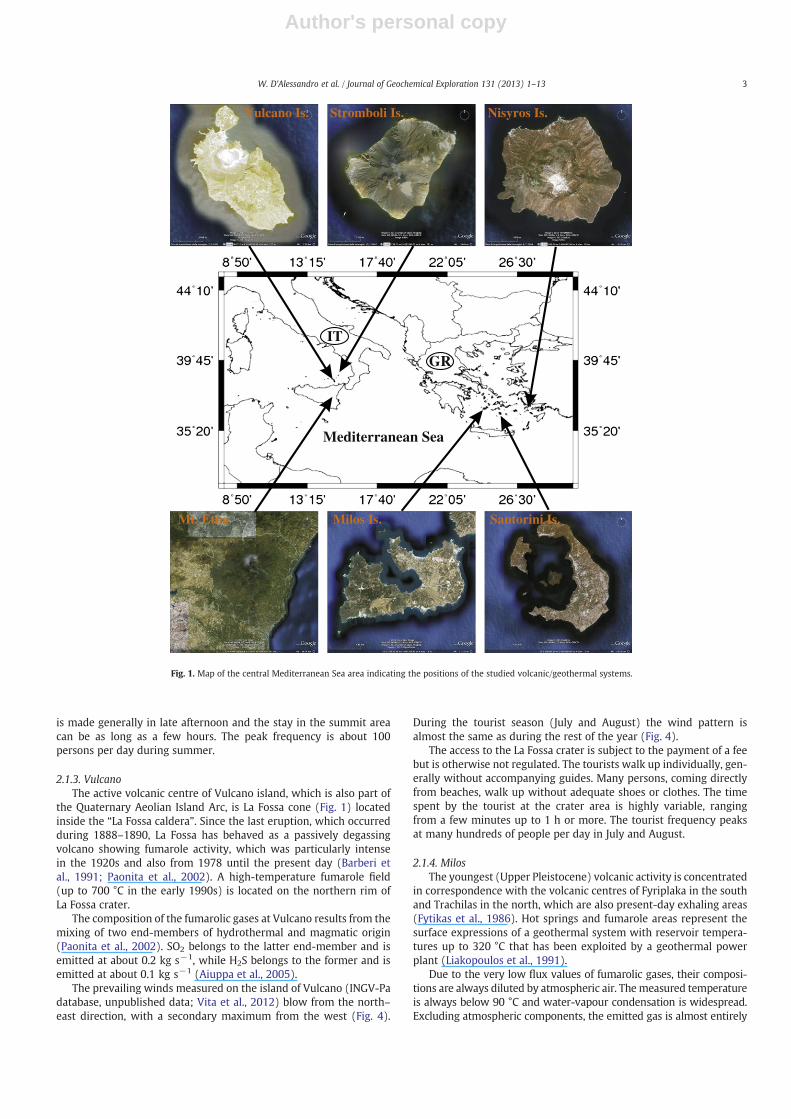
The positions of the investigated volcanic systems within theMediterranean area are shown in Fig. 1. Vulcano and Stromboli islands(Italy) belong to the Aeolian volcanic arc, while Milos, Santorini andNisyros islands (Greece) are part of the South Aegean volcanic arc.
2.1.1. Mt. EtnaMt. Etna is a large (1200 km2), high (>3300 masl), 0.6-Ma old
stratovolcano (Bonaccorso et al., 2004) located on the Ionian easterncoast of Sicily (Fig. 2). The most-striking feature of Etna's recent activ-ity has been the uninterrupted passive emissions of magmatic vola-tiles from the summit craters, which have made the volcano theworld's most-active point-source emitter of many environmentallyrelevant volatiles and heavy metals (Bagnato et al., 2007; Calabreseet al., 2011; Gauthier and Le Cloarec, 1998).
The volcano is one of the largest known point sources of SO2, withits contribution to the atmosphere (50 kg s−1; Caltabiano et al.,2004) being even larger than the estimated anthropogenic releasesfrom the whole of Italy (average emission of 15 kg s−1 in the period2000–2009; EMEP, 2011). Etna's plume is generally dispersed bywinds at the same altitude as the emission point (>3200 masl), butsometimes it is forced by the prevailing westerly winds to flowdown the slope at ground level, leading to fumigation of its uppereastern flank (Aiuppa et al., 2004).
Most of the tourists that visit Mt. Etna area come to within 6–7 kmof the summit craters, at Rifugio Sapienza and Piano Provenzana onthe southern and north-eastern flanks, respectively, at about 1800 masl.These sites are the starting stations to reach the volcano's summit areavia either a cableway or off-road vehicles, which is typically performedin groups of 20–50 persons accompanied by a guide. The end stationsfor tourists are at an altitude of nearly 2900 m, one on the north-eastern flank (Pizzi Deneri) and one on the southern flank (Torre delFilosofo) at distances from the summit craters of 1.8 and 2.4 km, respec-tively. The latter is the most-frequented high-altitude area, with peaks ofaround 1000 tourists per day during July and August. Each tourist typical-ly spends about 1 h in this area. Only a small fraction of the tourists reachthe summit area by walking with or without an accompanying guide. Afew walk up to the crater rims, thereby ignoring the warning signalsthat prohibit such access.
2.1.2. StromboliStromboli, the north-easternmost island of the Quaternary Aeolian
volcanic arc, is a stratovolcano that rises from a depth of approxi-mately 2000 m in the Tyrrhenian Sea. Its subaerial part is a steepcone with base diameters of 4.25 and 3 km, and an elevation of924 m. Gaseous emissions from Stromboli, although approximatelyone order of magnitude lower than at Mt. Etna, are also important(SO2 ~5 kg s−1; Allard et al., 2000).
The prevailing winds at the summit of the volcano (INGV-Pa data-base, unpublished data) blow from the south and south–south–eastdirections, with a secondary maximum from the north–west (Fig. 3).The wind pattern is similar during the tourist season, with the prevail-ing wind shifted towards the south–east and the secondary maximumto the west (Fig. 3).
The continuous Strombolian activity at the summit craters is amajor tourist attraction. The access to the summit crater area hasbeen regulated in recent years, and tourists now have to walk up onfoot in groups of up to 25 persons accompanied by a guide. The ascent
2 W. D'Alessandro et al. / Journal of Geochemical Exploration 131 (2013) 1–13
Author's personal copy
is made generally in late afternoon and the stay in the summit areacan be as long as a few hours. The peak frequency is about 100persons per day during summer.
2.1.3. VulcanoThe active volcanic centre of Vulcano island, which is also part of
the Quaternary Aeolian Island Arc, is La Fossa cone (Fig. 1) locatedinside the “La Fossa caldera”. Since the last eruption, which occurredduring 1888–1890, La Fossa has behaved as a passively degassingvolcano showing fumarole activity, which was particularly intensein the 1920s and also from 1978 until the present day (Barberi etal., 1991; Paonita et al., 2002). A high-temperature fumarole field(up to 700 °C in the early 1990s) is located on the northern rim ofLa Fossa crater.
The composition of the fumarolic gases at Vulcano results from themixing of two end-members of hydrothermal and magmatic origin(Paonita et al., 2002). SO2 belongs to the latter end-member and isemitted at about 0.2 kg s−1, while H2S belongs to the former and isemitted at about 0.1 kg s−1 (Aiuppa et al., 2005).
The prevailing winds measured on the island of Vulcano (INGV-Padatabase, unpublished data; Vita et al., 2012) blow from the north–east direction, with a secondary maximum from the west (Fig. 4).
During the tourist season (July and August) the wind pattern isalmost the same as during the rest of the year (Fig. 4).
The access to the La Fossa crater is subject to the payment of a feebut is otherwise not regulated. The tourists walk up individually, gen-erally without accompanying guides. Many persons, coming directlyfrom beaches, walk up without adequate shoes or clothes. The timespent by the tourist at the crater area is highly variable, rangingfrom a few minutes up to 1 h or more. The tourist frequency peaksat many hundreds of people per day in July and August.
2.1.4. MilosThe youngest (Upper Pleistocene) volcanic activity is concentrated
in correspondence with the volcanic centres of Fyriplaka in the southand Trachilas in the north, which are also present-day exhaling areas(Fytikas et al., 1986). Hot springs and fumarole areas represent thesurface expressions of a geothermal system with reservoir tempera-tures up to 320 °C that has been exploited by a geothermal powerplant (Liakopoulos et al., 1991).
Due to the very low flux values of fumarolic gases, their composi-tions are always diluted by atmospheric air. Themeasured temperatureis always below 90 °C and water-vapour condensation is widespread.Excluding atmospheric components, the emitted gas is almost entirely
IT
Vulcano Is. Stromboli Is. Nisyros Is.
Santorini Is.Milos Is.Mt. Etna
Mediterranean Sea
GR
Fig. 1. Map of the central Mediterranean Sea area indicating the positions of the studied volcanic/geothermal systems.
3W. D'Alessandro et al. / Journal of Geochemical Exploration 131 (2013) 1–13
Author's personal copy
composed of CO2, with significant amounts of H2 and CH4 (up to 1%)and low concentrations of H2S (b0.2%) (Kyriakopoulos, 2010; INGV-Padatabase, unpublished data). The gas fluxes have not been estimatedpreviously.
The predominant wind direction at Milos is from the north, with asecondary maximum from the south–west (data from the National
Observatory of Athens). In summer the secondary maximum disap-pears and the wind blows almost exclusively from the north (Fig. 5).
Milos is not one of the major tourist destinations in Greece andonly few of the visitors are interested in the active exhaling areas.Nevertheless, some of the monitored features are close to inhabitedareas (Adamas) or frequented beaches (Paleochori and Kalamos).
3000
SE
NE
BN
VOR
2750
2050
2250
2000
2 km
9
10
1112
13
14
151617
188
7
6
5 4 32 N
3000
2500
2000
1500
2002
2004
2007
2005
2003
5 km
1
Aug. 2005Aug. 2004Oct. 2003Jun. 2002
N
NE
E
SE
S
SW
W
NW
N
NE
E
ES
S
SW
W
NW
N
NE
E
SE
S
SW
W
NW
N
NE
E
SE
S
SW
W
NW
30
2010
30
2010
30
2010
30
2010
Jun-Aug 2007
N
NE
E
SE
S
SW
W
NW
30
2010
SO2 µg m-3
30 - 200200 - 700> 700
5 - 30< 5
N
NE
E
SE
S
SW
W
NW
18
126
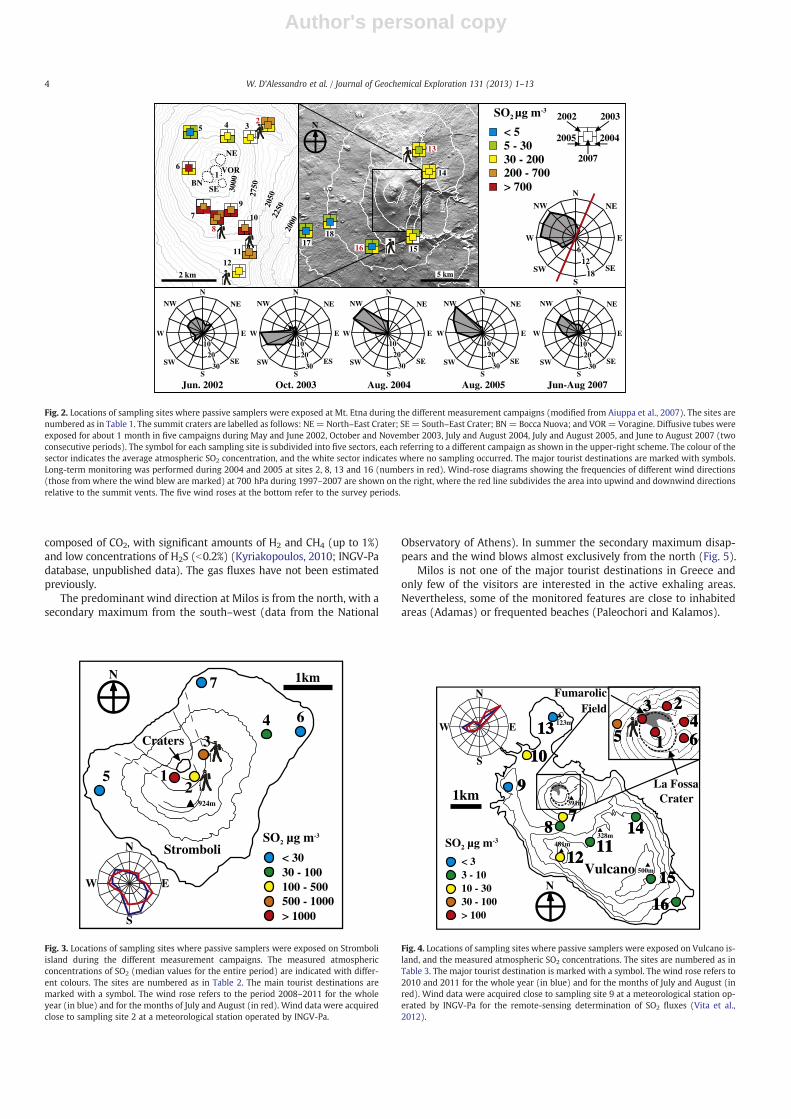
Fig. 2. Locations of sampling sites where passive samplers were exposed at Mt. Etna during the different measurement campaigns (modified from Aiuppa et al., 2007). The sites arenumbered as in Table 1. The summit craters are labelled as follows: NE=North–East Crater; SE= South–East Crater; BN= Bocca Nuova; and VOR=Voragine. Diffusive tubes wereexposed for about 1 month in five campaigns during May and June 2002, October and November 2003, July and August 2004, July and August 2005, and June to August 2007 (twoconsecutive periods). The symbol for each sampling site is subdivided into five sectors, each referring to a different campaign as shown in the upper-right scheme. The colour of thesector indicates the average atmospheric SO2 concentration, and the white sector indicates where no sampling occurred. The major tourist destinations are marked with symbols.Long-term monitoring was performed during 2004 and 2005 at sites 2, 8, 13 and 16 (numbers in red). Wind-rose diagrams showing the frequencies of different wind directions(those from where the wind blew are marked) at 700 hPa during 1997–2007 are shown on the right, where the red line subdivides the area into upwind and downwind directionsrelative to the summit vents. The five wind roses at the bottom refer to the survey periods.
12
34
5
6
7
924m
Stromboli
Craters
1kmN
SO2 µg m-3
100 - 500500 - 1000> 1000
30 - 100< 30
N
E
S
W
Fig. 3. Locations of sampling sites where passive samplers were exposed on Stromboliisland during the different measurement campaigns. The measured atmosphericconcentrations of SO2 (median values for the entire period) are indicated with differ-ent colours. The sites are numbered as in Table 2. The main tourist destinations aremarked with a symbol. The wind rose refers to the period 2008–2011 for the wholeyear (in blue) and for the months of July and August (in red). Wind data were acquiredclose to sampling site 2 at a meteorological station operated by INGV-Pa.
123m
391m
328m481m
500mVulcano
La FossaCrater1km
FumarolicField
11
223344
55 66
7788
99
101010
131313
111111121212
141414
151515
161616
SO2 µg m-3
10 - 3030 - 100> 100
3 - 10< 3
N
N
E
S
W
Fig. 4. Locations of sampling sites where passive samplers were exposed on Vulcano is-land, and the measured atmospheric SO2 concentrations. The sites are numbered as inTable 3. The major tourist destination is marked with a symbol. The wind rose refers to2010 and 2011 for the whole year (in blue) and for the months of July and August (inred). Wind data were acquired close to sampling site 9 at a meteorological station op-erated by INGV-Pa for the remote-sensing determination of SO2 fluxes (Vita et al.,2012).
4 W. D'Alessandro et al. / Journal of Geochemical Exploration 131 (2013) 1–13

Author's personal copy
2.1.5. SantoriniSantorini consists of a group of islands of which Nea Kameni
represents the volcanically active part. These islands were formedby eruptions during the last 2 Ma, some of which were large caldera-forming events (Druit et al., 1999). Nea Kameni formed in historictimewithin the caldera created after the Minoan eruption (17th centu-ry BC), and last erupted in 1950.
Fumarolic emissions at Nea Kameni have also very low flux valuesand suffer the same atmospheric dilution and condensation processesas those at Milos. Excluding atmospheric components, the emittedgas is almost entirely composed of CO2, with significant amounts of H2
(up to 3%) and very low H2S concentrations (b0.01%) (D'Alessandro etal., 2010; INGV-Pa database, unpublished data). Considering a CO2
output of about 0.2 kg s−1 (Chiodini et al., 1998), the H2S output fromNea Kameni can be estimated to be less than 2×10⁻⁵ kg s−1.
The predominant wind directions at Santorini are from the north–north–west and north, with secondary maxima from the south–south–west or west and south–east (data from the National Observa-tory of Athens). In summer the latter secondary maximum (from thesouth–east) disappears and the former (from the south–south–westor west) is attenuated (Fig. 6).
Santorini is one of the major tourist destinations in Greece, andmany tourists also visit the islet of Nea Kameni. Tourists are broughtto the islet in large boats, and their visits generally comprise a walkto and a short stay in the fumarole field at the summit of the island.The tourist frequency in summer peaks at many hundreds of peopleper day.
2.1.6. NisyrosNisyros volcano is located at the eastern end of the South Aegean
volcanic arc. Historical volcanic activity was limited to hydrothermalexplosions at the end of the 19th century, but ongoing activity isdocumented by the occurrence of several fumarole fields (Chiodiniet al., 2002).
The discharging gases are rich in H2O (91–99%) and lack acidcomponents such as SO2 and HCl, indicating that the rising magmaticgases interact intensively with a biphase hydrothermal system,whose deep temperature of ~340 °C has been assessed by geothermaldrilling (Brombach et al., 2003). Fumaroles have temperatures thatare indistinguishable from that of boiling water (99 °C) and, in con-trast to Milos and Santorini, H2S is highly abundant and accounts for8–26% of the released dry gas phase (Brombach et al., 2003). Three
main active areas can be recognised: from east to west (and fromthe oldest to the youngest) these are Kaminakia crater, Stefanoscrater and the area comprising Phlegeton, Polybotes Megalos andPolybotes Micros craters and Lofos Dome (Fig. 7). Considering a CO2
output of about 1 kg s−1 (Caliro et al., 2005), the H2S output can beestimated to be less than 0.3 kg s−1.
No wind data are available for Nisyros, but the wind rose for theadjacent island of Kos shows that the predominant wind directionsare from the east–north–east to the north, with secondary maximafrom the south–east and south–south–east directions (data from theNational Observatory of Athens). The secondary maximum at Kosalso disappears in summer, when the prevailing winds blow fromthe north–east (Fig. 7).
The tourist access to the active fumarole area of Nisyros sharesmany similarities with Vulcano island. In fact, the access is unregulated(other than the payment of a fee), there are no warning signals andmost visitors are not properly dressed for the short but potentiallydangerous walk. Also, the number of visitors and the period of highesttourist frequency are comparable to those at Vulcano island.
2.2. Methods
This study detected SO2 using in-house-made IVL-type diffusivesamplers (Ayers et al., 1998; Ferm et al., 2002). The samplers werepolypropylene tubes with a sorbent-impregnated filter inside theclosed end and a thin membrane installed at the open end. The sor-bent (sodium hydroxide or sodium bicarbonate in glycerol) reactsquantitatively with strong acids (e.g. HCl), moderately strong acids(e.g. HF) and oxides that form moderately strong acids with water(e.g. SO2). However, the sorbent does not react quantitatively withweak acids such as H2S, and it generally interferes negligibly withSO2 determinations even when it is present at similar concentrations.After exposure, the filter is leached in deionised water and, afteroxidation with hydrogen peroxide, SO2 is determined by measuringthe amount of sulphate using ion chromatography.
In the field, samplers were placed 1.5–2.5 m above the ground,sheltered from rain and exposed for periods ranging from 1 to60 days. For 1-month sampling the lower and upper detection limits
Milos island
Fyriplaka (1-4) Paleochori (7, 8)
Adamas (5, 6)NN
N
E
S
W
754m
4km
Fig. 5. Locations of sampling sites where passive samplers were exposed on Milosisland. The sites are numbered as in Table 4. The wind data (from the National Obser-vatory of Athens) are long-term averages and refer to the whole year (in blue) and themonths of July and August (in red).
1 km
H2 S µg m-3
1 - 10
0.2 - 1< 0.2
Nea Kameni islet
Santorini Is.
N
N
E
S
W
Fig. 6. Locations of sampling sites where passive samplers were exposed on NeaKameni islet, Santorini island, and the atmospheric concentrations of H2S. The sitesare numbered as in Table 4. The major tourist destinations are marked with symbols.The wind data (from the National Observatory of Athens) are long-term averagesand refer to the whole year (in blue) and the months of July and August (in red).
5W. D'Alessandro et al. / Journal of Geochemical Exploration 131 (2013) 1–13
Author's personal copy
were about 1 and 800 μg m−3, respectively; these limits were inverselyproportional to the sampling time.
Radial-type (Radiello®) passive samplers were chosen for detectingH2S. The cylindrical geometry results in a higher uptake rate andtherefore a lower detection limit. H2S is adsorbed by zinc acetateand transformed into stable zinc sulphide, which is extracted withwater and analysed by visible spectrometry (methylene blue meth-od; Fondazione Maugeri, 2007). The detection limits of this methodare 50 and 2 μg m−3 for 1- and 24-hour exposures, respectively,while the uncertainty at 2σ is 8.7% over the allowed exposure range(1 h to 30 days) (Fondazione Maugeri, 2007).
3. Results
3.1. Mt. Etna
Five field campaigns were conducted on the flanks of Etna in 2002(May and June), 2003 (16 October to 13 November), 2004 (29 July to20 August), 2005 (25 July to 23 August) and 2007 (12 June to 11 Julyand 11 July to 6 August). This network of diffusive samplers installedon Etna's flanks aimed at evaluating the atmospheric dispersion ofvolcanic SO2 at the local scale. Most of the sampling sites werecommon to the five campaigns, and they were selected to providecomprehensive information on the spatial variability in ambient SO2
levels. The results of the 2002–2005 campaigns have been previouslydiscussed with a focus on the atmospheric chemistry of the detectedgases (Aiuppa et al., 2007) and on their implications in volcanicsurveillance (Aiuppa et al., 2004), and are here re-evaluated andaugmented with 2007 data with the focus on human exposures.
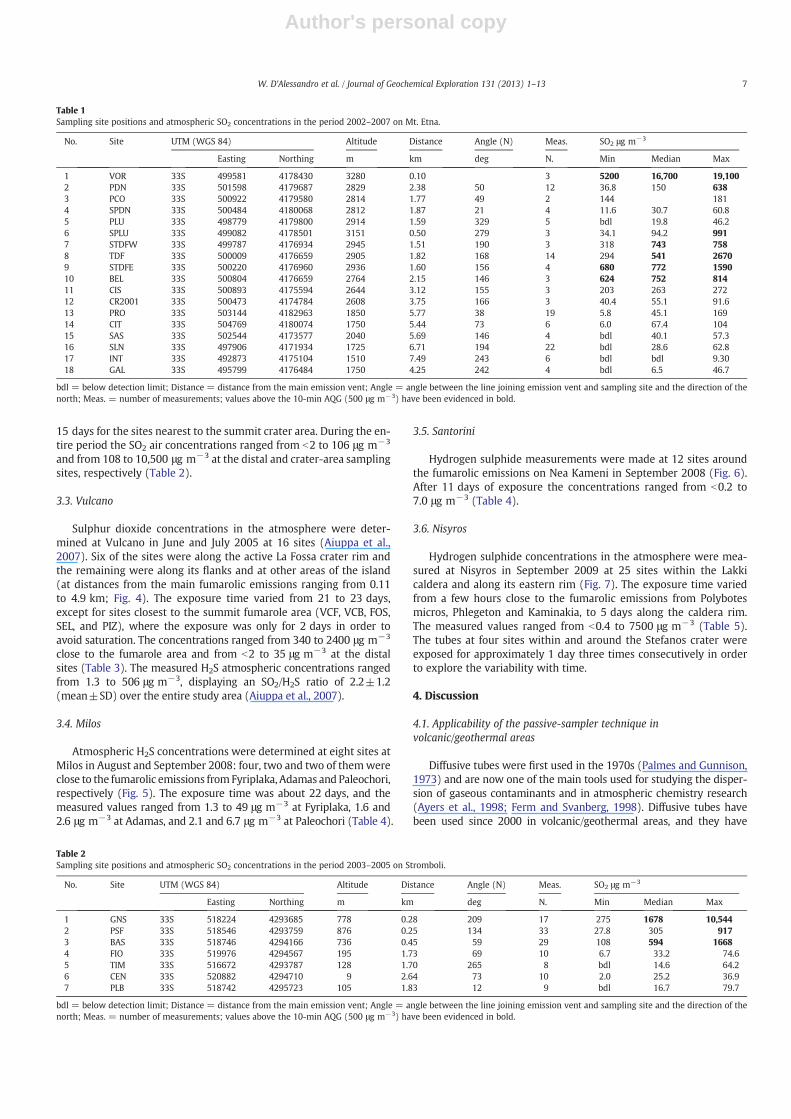
In each campaign, diffusive tubes were simultaneously exposed22–29 days around the volcano (Fig. 2). The sampling sites were0.5 to ~8 km from the summit craters. The overall measured SO2
concentrations ranged from b1 to 1590 μg m−3 (Table 1), with thepattern of them decreasing with increasing distance from the summitcraters being similar in all five campaigns.
In the last three campaigns diffusive tubes were also exposed onthe rim of one of the exhaling summit craters about 0.1 km fromthe vent (VOR; Fig. 2) for periods of 1–2 days, at which values inthe range from 5200 to 19,100 μg m−3 were recorded.
Furthermore, atmospheric SO2 concentrations were monitored forconsecutive periods during 2004 and 2005 at four sites chosen basedon their closeness to areas that were highly frequented by tourists(Fig. 2). Measurements were not made at the two sites closest tothe summit craters during the wintertime, because in this periodthey are difficult to reach due to considerable snow cover; touristsdo not frequent these sites during winter for the same reason. Sam-pling tubes were exposed for periods ranging from 16 to 37 days.Considering also the values measured in sampling campaigns of2002, 2003 and 2007, the four sites showed variable concentrations(Table 1). These ranged from 294 to 2670 μg m−3 (median value541 μg m−3) at the site closest to the summit craters (site 8; 1.9 km),and decreased at the other sites according to their increasing distancesfrom the emission vents.
3.2. Stromboli
Sulphur dioxide measurements were carried out at Strombolifrom May 2003 to June 2005. A network of seven sites includedthree sites close to the crater area (GNS, PSF and BAS) with distancesfrom the craters between 0.25 and 0.45 km, and four distal sites onthe flanks of the volcano (FIO, PLB, GNV and TIM) with distancesfrom the craters between 1.7 and 2.6 km (Fig. 3). Diffusive tubeswere periodically exposed at the above seven sites, with exposuretimes varying from 24 to 60 days for the distal sites, and from 7 to
1
20
21
22
23
24 25
1415
16
Emporeio
ProfitisIlias
Lakkiplain
Nikia
17 1819
13
12
1110
98
7
6
54
3
PM
Ph
SK
2
1 km
H2S µg m-3
> 1000
Nisyros island
100 - 100010 - 1001 - 10< 1
589m
698m
N
E
S
W
200m300m400m
500m
600m
N
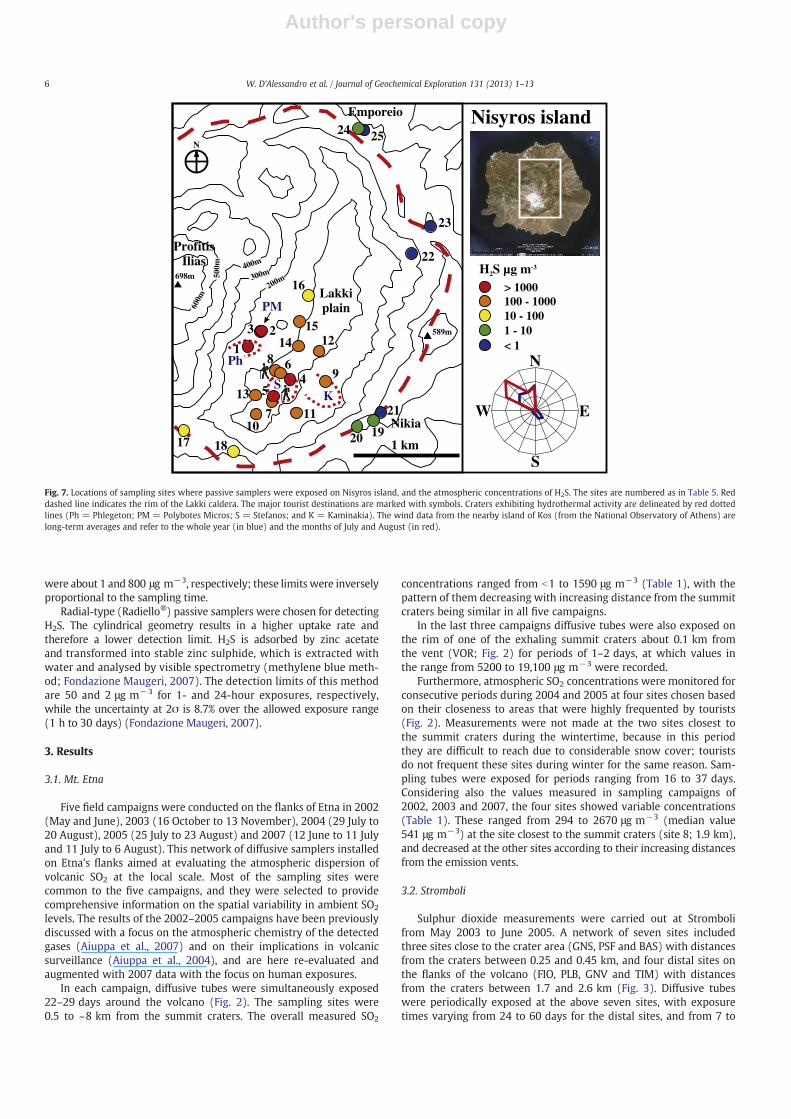
Fig. 7. Locations of sampling sites where passive samplers were exposed on Nisyros island, and the atmospheric concentrations of H2S. The sites are numbered as in Table 5. Reddashed line indicates the rim of the Lakki caldera. The major tourist destinations are marked with symbols. Craters exhibiting hydrothermal activity are delineated by red dottedlines (Ph = Phlegeton; PM = Polybotes Micros; S = Stefanos; and K = Kaminakia). The wind data from the nearby island of Kos (from the National Observatory of Athens) arelong-term averages and refer to the whole year (in blue) and the months of July and August (in red).
6 W. D'Alessandro et al. / Journal of Geochemical Exploration 131 (2013) 1–13
Author's personal copy
15 days for the sites nearest to the summit crater area. During the en-tire period the SO2 air concentrations ranged from b2 to 106 μg m−3
and from 108 to 10,500 μg m−3 at the distal and crater-area samplingsites, respectively (Table 2).
3.3. Vulcano
Sulphur dioxide concentrations in the atmosphere were deter-mined at Vulcano in June and July 2005 at 16 sites (Aiuppa et al.,2007). Six of the sites were along the active La Fossa crater rim andthe remaining were along its flanks and at other areas of the island(at distances from the main fumarolic emissions ranging from 0.11to 4.9 km; Fig. 4). The exposure time varied from 21 to 23 days,except for sites closest to the summit fumarole area (VCF, VCB, FOS,SEL, and PIZ), where the exposure was only for 2 days in order toavoid saturation. The concentrations ranged from 340 to 2400 μg m−3
close to the fumarole area and from b2 to 35 μg m−3 at the distalsites (Table 3). The measured H2S atmospheric concentrations rangedfrom 1.3 to 506 μg m−3, displaying an SO2/H2S ratio of 2.2±1.2(mean±SD) over the entire study area (Aiuppa et al., 2007).
3.4. Milos
Atmospheric H2S concentrations were determined at eight sites atMilos in August and September 2008: four, two and two of themwereclose to the fumarolic emissions fromFyriplaka, Adamas and Paleochori,respectively (Fig. 5). The exposure time was about 22 days, and themeasured values ranged from 1.3 to 49 μg m−3 at Fyriplaka, 1.6 and2.6 μg m−3 at Adamas, and 2.1 and 6.7 μg m−3 at Paleochori (Table 4).
3.5. Santorini
Hydrogen sulphide measurements were made at 12 sites aroundthe fumarolic emissions on Nea Kameni in September 2008 (Fig. 6).After 11 days of exposure the concentrations ranged from b0.2 to7.0 μg m−3 (Table 4).
3.6. Nisyros
Hydrogen sulphide concentrations in the atmosphere were mea-sured at Nisyros in September 2009 at 25 sites within the Lakkicaldera and along its eastern rim (Fig. 7). The exposure time variedfrom a few hours close to the fumarolic emissions from Polybotesmicros, Phlegeton and Kaminakia, to 5 days along the caldera rim.The measured values ranged from b0.4 to 7500 μg m−3 (Table 5).The tubes at four sites within and around the Stefanos crater wereexposed for approximately 1 day three times consecutively in orderto explore the variability with time.
4. Discussion
4.1. Applicability of the passive-sampler technique involcanic/geothermal areas
Diffusive tubes were first used in the 1970s (Palmes and Gunnison,1973) and are now one of the main tools used for studying the disper-sion of gaseous contaminants and in atmospheric chemistry research(Ayers et al., 1998; Ferm and Svanberg, 1998). Diffusive tubes havebeen used since 2000 in volcanic/geothermal areas, and they have
Table 2Sampling site positions and atmospheric SO2 concentrations in the period 2003–2005 on Stromboli.
No. Site UTM (WGS 84) Altitude Distance Angle (N) Meas. SO2 μg m−3
Easting Northing m km deg N. Min Median Max
1 GNS 33S 518224 4293685 778 0.28 209 17 275 1678 10,5442 PSF 33S 518546 4293759 876 0.25 134 33 27.8 305 9173 BAS 33S 518746 4294166 736 0.45 59 29 108 594 16684 FIO 33S 519976 4294567 195 1.73 69 10 6.7 33.2 74.65 TIM 33S 516672 4293787 128 1.70 265 8 bdl 14.6 64.26 CEN 33S 520882 4294710 9 2.64 73 10 2.0 25.2 36.97 PLB 33S 518742 4295723 105 1.83 12 9 bdl 16.7 79.7
bdl = below detection limit; Distance = distance from the main emission vent; Angle = angle between the line joining emission vent and sampling site and the direction of thenorth; Meas. = number of measurements; values above the 10-min AQG (500 μg m−3) have been evidenced in bold.
Table 1Sampling site positions and atmospheric SO2 concentrations in the period 2002–2007 on Mt. Etna.
No. Site UTM (WGS 84) Altitude Distance Angle (N) Meas. SO2 μg m−3
Easting Northing m km deg N. Min Median Max
1 VOR 33S 499581 4178430 3280 0.10 3 5200 16,700 19,1002 PDN 33S 501598 4179687 2829 2.38 50 12 36.8 150 6383 PCO 33S 500922 4179580 2814 1.77 49 2 144 1814 SPDN 33S 500484 4180068 2812 1.87 21 4 11.6 30.7 60.85 PLU 33S 498779 4179800 2914 1.59 329 5 bdl 19.8 46.26 SPLU 33S 499082 4178501 3151 0.50 279 3 34.1 94.2 9917 STDFW 33S 499787 4176934 2945 1.51 190 3 318 743 7588 TDF 33S 500009 4176659 2905 1.82 168 14 294 541 26709 STDFE 33S 500220 4176960 2936 1.60 156 4 680 772 159010 BEL 33S 500804 4176659 2764 2.15 146 3 624 752 81411 CIS 33S 500893 4175594 2644 3.12 155 3 203 263 27212 CR2001 33S 500473 4174784 2608 3.75 166 3 40.4 55.1 91.613 PRO 33S 503144 4182963 1850 5.77 38 19 5.8 45.1 16914 CIT 33S 504769 4180074 1750 5.44 73 6 6.0 67.4 10415 SAS 33S 502544 4173577 2040 5.69 146 4 bdl 40.1 57.316 SLN 33S 497906 4171934 1725 6.71 194 22 bdl 28.6 62.817 INT 33S 492873 4175104 1510 7.49 243 6 bdl bdl 9.3018 GAL 33S 495799 4176484 1750 4.25 242 4 bdl 6.5 46.7
bdl = below detection limit; Distance = distance from the main emission vent; Angle = angle between the line joining emission vent and sampling site and the direction of thenorth; Meas. = number of measurements; values above the 10-min AQG (500 μg m−3) have been evidenced in bold.
7W. D'Alessandro et al. / Journal of Geochemical Exploration 131 (2013) 1–13

Author's personal copy
provided valuable information on the atmospheric dispersion of vol-canic and fumarolic gases (Aiuppa et al., 2004; Allen et al., 2002;D'Alessandro et al., 2009; Delmelle et al., 2002; Horwell et al., 2004,2005). Comparisons with other techniques have confirmed that thistechnique is also suitable in that environment (Aiuppa et al., 2004,2007).
Diffusive samplers give only values that represent the time-integratedconcentration during the exposure time, and so information aboutshort-term variations can only be obtained by continuously readinginstrumentation. However, as in studies of the dispersion of pollutants,diffusive samplers can also be used to delimit volcanic/geothermal areaswith elevated atmospheric concentrations that are potentially dangerousto human health.
4.2. Human health issues
Sulphur dioxide is a strong-irritant gas. In healthy persons, SO2 at5 to 10 ppm (~13,000–26,000 μg m−3) causes eye, nose and throatirritation, while at 30 to 40 ppm (~79,000–105,000 μg m−3) it canlead to respiratory failure (WHO, 2006). The likelihood of an adverseresponse to an inhaled toxicant depends not only on the degree ofexposure to the toxicant but also the specific susceptibility characteristics
of the exposed person. For example, during the “Great London Smog”of 1952, in which SO2 and its oxidation products played a dominantrole, the mortality rate was particularly high among infants, the elderlyand those with cardiac and respiratory diseases (Brimblecombe, 1987).Laboratory exposure studies suggest that people with asthma or coro-nary artery disease experience adverse effects from exposure to SO2 atlower concentrations than healthy persons, and that exposure to SO2
at 0.25–0.5 ppm (~650–1300 μg m−3) could be life-threatening (Utelland Frampton, 1998). Furthermore, Amdur (1986) demonstrated thatthe effects of SO2 may be enhanced by simultaneous exposure to theultrafine particles that are widespread in volcanic environments.
Various national and international agencies have issued guidelinesfor ambient SO2 concentrations. These guidelines refer to the periodof exposure, with higher values being permissible for shorter periods.Guideline values typically vary over a wide range, sometimes spanningorders of magnitude; for example, for a 1-hour exposure the valueranges from 150 μg m−3 in China up to 2620 μg m−3 in Argentina.Considering that this study was focussed on tourists whose exposureperiod is rather short, the figures include the WHO guideline valuesfor 10 min (500 μg m−3) and 24 h (125 μg m−3) (WHO, 2006).
Concentrations of up to thousands of micrograms per cubic metrecan easily be achieved close to active volcanic craters (Aiuppa et al.,2004, 2005; Allen et al., 2002; Michaud et al., 2005; Ng'Walali et al.,1999; Stephenson et al., 1991). Indeed, six fatalities due to SO2 havebeen documented at Mt. Aso volcano, Japan in the period 1989–1997, while other 59 persons were hospitalised in the period 1980–1995 (Ng'Walali et al., 1999). Five of the dead and 29 of the injuredsuffered from chronic lung diseases, indicating that the risk is higheramong this population. Also, one of the victims of volcanic gases onKilauea, Hawaii suffered from asthma (Stephenson et al., 1991).
Hydrogen sulphide is a neurotoxic and irritant gas that has beenreported to be of immediate danger to healthy people at concentra-tions of about 700 ppm (~980,000 μg m−3) (WHO, 2003) or 100 ppm(~150,000 μg m−3) (U.S. Occupational Safety and Health Administra-tion). However, as for SO2, H2S could have dangerous consequences in
Table 3Sampling site positions and atmospheric SO2 concentrations on Vulcano.
No. Site UTM (WGS 84) Altitude Distance Angle (N) SO2 μg m−3
Easting Northing m km deg
1 VCF 33S 496657 4250689 236 0.18 189 18812 FOS 33S 496791 4251042 231 0.21 31 9783 VCB 33S 496611 4250880 266 0.11 281 24364 SEL 33S 496988 4250787 303 0.31 105 13705 SEN 33S 496165 4250780 186 0.53 261 35.26 PIZ 33S 496990 4250575 371 0.42 134 3457 PAL 33S 496672 4249798 114 1.07 181 15.18 FAG 33S 496549 4249566 200 1.31 186 8.09 LEN 33S 495252 4251069 154 1.45 278 bdl10 VCC 33S 495814 4252077 6 1.49 324 13.611 PIA 33S 497075 4249200 292 1.71 167 7.012 SAR 33S 496574 4248760 423 2.11 183 12.713 VLN 33S 496657 4253131 71 2.26 359 bdl
bdl = below detection limit; Distance = distance from the main emission vent; Angle= angle between the line joining emission vent and sampling site and the direction ofthe north; values above the 10-min AQG (500 μg m−3) have been evidenced in bold.
Table 4Sampling site positions and atmospheric H2S concentrations on Milos and Santorini.
Site UTM WGS 84 H2S μg m−3
Easting Northing
Milos 1 35S 275923 4060987 49Milos 2 35S 275971 4061014 1.3Milos 3 35S 275915 4060861 7.4Milos 4 35S 276019 4060846 2.0Milos 5 35S 277770 4061717 2.7Milos 6 35S 277790 4061707 1.6Milos 7 35S 272157 4068098 6.8Milos 8 35S 272143 4068055 2.1Santorini 1 35S 356176 4030022 0.63Santorini 2 35S 356107 4030063 bdlSantorini 3 35S 356109 4030023 0.21Santorini 4 35S 356101 4029992 0.23Santorini 5 35S 356063 4029956 0.41Santorini 6 35S 356110 4029909 bdlSantorini 7 35S 356162 4029933 bdlSantorini 8 35S 356233 4030005 1.1Santorini 9 35S 356236 4030015 7.0Santorini 10 35S 356236 4030181 0.32Santorini 11 35S 356216 4030181 0.31Santorini 12 35S 356241 4030301 0.37
bdl = below detection limit.
Table 5Sampling site positions and atmospheric H2S concentrations on Nisyros.
No. Site UTM WGS 84 H2S μg m−3
Easting Northing
1 Phlegeton 35S 514702 4048514 74732 Polybotes bottom 35S 514847 4048684 22383 Polybotes rim 35S 514833 4048679 10134 Stefanos 1 35S 514975 4047988 20175 Stefanos 2 35S 515146 4048165 10526 Stefanos 3 35S 515047 4048233 4077 Stefanos 4 35S 514955 4047929 8058 Volcano cafe 35S 514991 4048258 2899 Kaminakia 35S 515519 4048142 31210 Caldera base 1 35S 514788 4047796 17811 Caldera base 2 35S 515211 4047808 21212 Caldera base 3 35S 515450 4048470 14813 Caldera base 4 35S 514782 4047998 25414 Caldera road 1 35S 515237 4048522 14415 Caldera road 2 35S 515243 4048787 10816 Caldera road 3 35S 515340 4049062 3617 Mon. Stavros 35S 514030 4047618 2718 Caldera rim 2 35S 514553 4047392 5619 Nikia 1 35S 515851 4047661 2.320 Nikia 2 35S 516023 4047728 6.421 Ag. Theologos 35S 516101 4047815 bdl22 Bend 35S 516427 4049511 bdl23 Caldera rim 1 35S 516623 4049804 0.524 Emporeio 1 35S 515867 4050845 1.325 Emporeio 2 35S 515924 4050831 bdl
bdl = below detection limit; values above 3000 μg m−3 have been evidenced in bold.
8 W. D'Alessandro et al. / Journal of Geochemical Exploration 131 (2013) 1–13

Author's personal copy
asthmatic individuals at concentrations as lowas 2 ppm(~3000 μg m−3)(WHO, 2003). In contrast to SO2 there are few guideline values for H2S,and most of them are very low—although they are generally intendedonly to protect populations from the smell nuisance. Hydrogen sulphideis widespread in geothermal systems and in volcanic systems withlow-temperature (~100 °C) fumarole fields. Many fatal accidents couldhave been attributed to lethal H2S concentrations in volcanic/geothermalareas (Hansell and Oppenheimer, 2004; Witham, 2005 and referencestherein). Due to this gas being denser than air, many lethal episodeshave been due to gas accumulation in poorly ventilated places below orimmediately above ground. Moreover, olfactory paralysis when H2S ispresent at above ~150,000 μg m−3 hinders the detection of its character-istic smell, further increasing the exposure risk (WHO, 2003).
4.3. Factors affecting atmospheric concentrations
As reported by Aiuppa et al. (2004, 2007), the most-striking featureof the dispersion pattern at the studied Italian volcanic areas is theexponential decrease of the measured atmospheric SO2 concentrationswith increasing distance from the emission vents (Fig. 8). Volcanic gasconcentrations around the emission vents depend on many variables.
The first one is of course the source strength. For example, asmentionedin Sections 3.1–3.3, the average SO2 emissions from the three studiedItalian volcanoes differ by orders of magnitude. This is reflected inatmospheric concentrations that decay below 500 μg m−3 beyondabout 2 km fromMt. Etna, but at distances of 0.5 kmor less fromStrom-boli and Vulcano (Fig. 8). Also, the emissions from each volcanic sys-tem are highly variable. At Mt. Etna, where SO2 emissions have beenmeasured regularly since 1987, the fluxes have ranged from 5 to300 kg s−1 (Caltabiano et al., 2004). During the five sampling cam-paigns involving passive samplers, Mt. Etna's plume fluxes were alwaysbelow the median value of 50 kg s−1 (9–23 kg s−1; Salerno et al.,2009). Nevertheless, atmospheric SO2 concentrations above the10-min air-quality guideline of 500 μg m−3 (WHO, 2006) were mea-sured repeatedly in areas frequented by tourists. At Stromboli andVulcano, where the SO2 flux ismeasured less frequently, the concentra-tions also span at least one order of magnitude.
The geographic dispersion pattern of H2S at the three Hellenicvolcanic geothermal areas is much less defined. At these sites theemission vents are relatively scattered, making it difficult to define asingle originating point. In the case of Milos and Santorini, emissionvents are represented by several (sometimes poorly defined) low-flux fumarole orifices. It is possible that the atmospheric H2S concen-trations were highest close to the most-active vents, but this cannotbe confirmed due to the lack of flux values for the individual fumaroles.
At Nisyros the emission vents are essentially high-flux fumarolesgrouped within well-defined areas that generally correspond tohydrothermal eruption craters. The highest atmospheric H2S concen-trations (>1000 μg m−3) have been measured at distances of tens ofmetres from the most-active fumaroles, inside the youngest craters(Stefanos, Phlegeton and Polybotes Micros). It is likely that thesecraters are connected more directly to the deep geothermal system,while fumarolic gases at the oldest crater (Kaminakia) may be subjectto subsurface steam condensation processes that scavenge water-soluble gases such as H2S (Brombach et al., 2003). Evidence for thiscomes from themuch lower atmospheric H2S concentrationsmeasuredat this crater (300 μg m−3). Passive samplers placed within ~100 mfrom the most-active fumarole areas display values ranging from 100to 1000 μg m−3; while the concentrations decrease down to about1 μg m−3 along the caldera rim at distances of about 500 m (Fig. 7).
The second factor that affects the dispersion of volcanic gases isthe wind pattern of the area. At Mt. Etna the emission vents (beingat about 3000 m altitude) are well above the planetary boundarylayer in the free troposphere, where there is a nearly steady-stateatmospheric circulation that, at the latitude of the area, comes fromthe western sectors; 47% of the winds come from the west to thenorth–west (Bellomo et al., 2007). As reported by Aiuppa et al.(2004, 2007), the sites of the passive samplers can be subdivided inthose that were up- and downwind with respect to the summitcraters (Fig. 2). The much lower probability of plume dispersal inthe upwind direction is reflected in the atmospheric SO2 concentra-tions measured by passive samplers being up to an order of magni-tude lower at upwind sites than at downwind sites (Fig. 8).
At Stromboli and Vulcano the emission vents are at much loweraltitudes (about 800 and 250 masl, respectively), and although windsfrom the westerly sectors still prevail the difference between up- anddownwind sites is not so clear-cut.
The four sites on Mt. Etna, where atmospheric SO2 was measuredfor consecutive periods from January 2004 to September 2005, showedvariable concentrations (Fig. 9). It is worth noting that atmospheric SO2
concentrations at TDF, the site closest to the crater area, often exceedthe 10-min air-quality guideline of 500 μg m−3 (WHO, 2006). Thisthreshold is also occasionally exceeded at PDN, which is only a slightlyfurther from the crater. Values measured at these two sites do not showa clear correlationwith the volcano's SO2 flux emissions (Fig. 9). It shouldbe remembered that we have no data from periods characterised by highemissions—all of the data obtained from the two sites located close to
SO2
(µg
m-3
)SO
2 (µ
g m
-3)
SO2
(µg
m-3
)
1
10
100
1000
10000
100000
0 1 2 3 4 5 6 7 8
Mt. Etna
Stromboli
Vulcano
upwind
downwind
1
10
100
1000
10000
100000
0 1 2 3
1
10
100
1000
10000
100000
0 1 2 3 4 5distance (km)
Fig. 8. Relationships between atmospheric SO2 concentrations and distance of thesampling site from the emission vents at Mt. Etna, Stromboli and Vulcano. The dashedline represents the approximate detection limit (~2 μg m−3). The grey and black linesare respectively the 24-hour-average and 10-min-average atmospheric SO2 standardsof the WHO for human exposure (125 and 500 μg m−3, respectively). The grey circlesand the black dashes in the graph for Stromboli represent the measured values and themedian values of the entire measurement period, respectively.
9W. D'Alessandro et al. / Journal of Geochemical Exploration 131 (2013) 1–13

Author's personal copy
the summit craters correspond to low plume fluxes (below the medianvalue of 50 kg s−1). However, even in periods of very lowplume fluxes,as in April and May 2002 (9 kg s−1), high SO2 values were measuredat TDF (720 μg m−3), and the highest value observed at that site(2670 μg m−3) corresponds to an SO2 flux of 13.9 kg s−1. Unfortunate-ly no measurements were made in January and February 2005, whenvalues above the median value (with peak flux values of >200 kg s−1)were observed. No increases in atmospheric SO2 concentration wererecorded at the two distal sites (SLN and PRO) forwhich there is a contin-uous record during this period of high plume fluxes.
The factor that probably influences the measured values the mostis the prevailing wind direction during sampler exposure. This couldbe confirmed by obtaining opposite records at the two closest sites.Being located on opposite flanks of the summit craters, when theplume is mainly directed towards one of the sites it will increasethe concentrations measured there and reduce those measured atthe other one. The two distal sites show similar behaviour, althoughthis is less defined.
The long-term measurements at Stromboli over a period of about2 years also show considerable variations in the concentrations(Fig. 10). As at Mt. Etna, the site closest to the crater area oftenexceeds the 10-min guideline value of 500 μg m−3 and the winddirection is probably the most-important factor affecting the SO2
dispersion. But at Stromboli the topography of the summit area alsoplays a role. The concentrations are not highest at the site closest tothe crater area (PSF), which is probably due to it being about 100 mhigher than the craters. The volcanic plume is generally dispersed atthe same altitude as the emission vents, and so the volcanic gaseshave a higher probability of reaching the other two proximal sites
(GNS and BAS) that are about at the same altitude than reachingsite PSF at the top of a cliff.
The influence of wind direction on measured concentrations wasalso evident at Nisyros, where passive samplers were exposed for afew days consecutively for approximately 24-hour periods at foursites (Fig. 11). The four sites were positioned in the Stefanos craterarea, with one site at its bottom and the other three at or close toits rim. The values were higher at the site at its bottom, reflectingboth its closeness to the fumarole vents and a lower dispersion ofthe fumarolic gases due to the topography. The wind direction changeddramatically at the beginning of 4 September. Therefore, on the follow-ing day the concentrations had increased at sites on the north-westernside of the crater but decreased at those on the south-western side.
4.4. Risk reduction measures
The data obtained in the present study indicate that sulphur-gasconcentrations that could be life-threatening to sensitive personsare present in areas frequented by tourists at all of the three studiedItalian volcanic systems (SO2>1000 μg m−3) and also at Nisyros inGreece (H2S>3000 μg m−3). Moreover, considering that these valuesrepresent time-integrated values over periods as long as 1 month,concentrations that are even dangerous to healthy people over muchshorter periods cannot be ruled out. The role of wind conditions iscrucial to the accumulation of highly dangerous gases. In the case ofopen-conduit crater emissions, like those of Mt. Etna and Stromboli,strong winds can channel the poorly diluted plume along the flanks ofthe volcanic edifice to areas that are easily reached by tourists. Incontrast, at volcanic systems with intense fumarolic emissions, such as
1
10
100
1000
10000
0
50
100
150
2002002 2003
1-A
pr
1-Ju
n
1-Ju
l
1-Ju
l
1-Ju
l
1-O
ct
1-O
ct
1-O
ct
1-O
ct
1-A
pr
1-A
pr
2004 2005 2007
SO2
(kg
s-1)
SO2
(µg
m-3
)
1-Ja
n
1-Ja
n
SLN PROPDN TDF
plume
Fig. 9. Atmospheric SO2 concentrations measured at four sampling sites during the five sampling campaigns on Mt. Etna with high tourist frequencies during 2004 and 2005. SO2
emission rates (plume) are also shown (values refer to the right axis); the black thin line is the measured values and the thick red line is the median values corresponding to theexposure period of the passive samplers. The WHO 125- and 500-μg m−3 24-hour- and 10-min-average guidelines are indicated by dashed lines.
1
10
100
1000
10000
2003
SO
2 (µ
g m
-3)
2004 2005
PSF GNS BAS CENFIO PLB TIM
1-Ja
n
1-M
ar
1-M
ay
1-M
ay
1-M
ar
1-Ja
n
1-Ju
l
1-Se
p
1-N
ov
1-N
ov
1-Se
p
1-Ju
l
Fig. 10. Atmospheric SO2 concentrations measured at all sampling sites on Stromboli during 2004 and 2005. The WHO 125- and 500-μg m−3 24-hour- and 10-min-average guide-lines are indicated by dashed lines.
10 W. D'Alessandro et al. / Journal of Geochemical Exploration 131 (2013) 1–13

Author's personal copy
Vulcano and Nisyros, strong winds help to rapidly disperse fumarolicgases. In these areas the fumarole vents constitute significant attrac-tions, and strong and constant winds allow them to be reached fromthe upwinddirectionwithout being exposed to high gas concentrations.However, the absence ofwind could result in a dangerous accumulationof sulphur gas close to the fumaroles.
A preliminary comparative risk evaluation has been performedtaking into account both the measured gas concentrations and thenumber of visitors that reach dangerous areas. Considering only thegas hazard to the tourist population, the risk can be considered negli-gible at Milos and Santorini, moderate at Stromboli, high at Vulcanoand Nisyros, and very high at Mt. Etna.
Visitors to the studied enhanced-risk volcanic systems are notcurrently provided with specific warnings about the danger repre-sented by volcanic or fumarolic gases. Moreover, as in the case ofNisyros, no warning is given despite other risks also being present(e.g. boiling water and slippery trails).
Fatalities at Mt. Aso have resulted in the setting up of an atmo-spheric SO2 monitoring system in the crater area, with visitors beinginformed through leaflets and signals about the risks associatedwith volcanic gases. Measurements at Mt. Aso started in 1996, andthe access to the area was regulated; no one could enter the areawhen the SO2 level exceeded 5 ppm (~13,000 μg m−3), while anadvisory discouraging visits to the crater was given when it exceeded0.2 ppm (~500 μg m−3) for more than 5 min. People suffering fromrespiratory and cardiovascular diseases were asked to vacate thearea when SO2 exceeded 2.5 ppm (~6500 μg m−3) for more than5 min. But such precautions were not strict enough to prevent thedeaths of two persons on 23 November 1997, after which more-rigorous criteria were applied—forbidding the access if SO2 exceeded0.2 ppm (~500 μg m−3) formore than 1 min orwhen it instantaneouslypeaked above 5 ppm (~13,000 μg m−3) (Ng'Walali et al., 1999).
Two SO2 monitoring sites integrated within a larger monitoringnetwork were implemented by the Department of Health of theState of Hawaii throughout Hawai'i island (including Kilauea volcano)in the 1980s. These stations are used to monitor air quality close tothe summit crater area, which is frequented by tourists. All data are freelyavailable in real time through the web (http://www.hawaiiso2network.com/ and http://www.hiso2index.info/), and access to the summit areaof Kilauea is forbidden when SO2 is present at dangerous concentrations.The SO2 emissions at Kilauea increased sharply in 2008 and 2009, withtheunhealthy concentrationsmeasured in the summit area of the volcanoresulting in repeated access prohibitions.
The development of a prediction model that integrates the volca-nic SO2 output data with the atmospheric circulation model to predictSO2 and sulphate aerosol concentrations is underway at the Universi-ty of Hawaii (Businger et al., 2011; VMAP, 2011). The model will beable to forecast the concentrations of both pollutants two days inadvance with time intervals of 3 h.
At the four studied enhanced-risk areas, the first step would be todistribute leaflets describing the gas hazard as well as the other risks
of the area. This would be straightforward since access by tourists toall four areas is regulated and subject to the payment of a fee. Suchleaflets would need to be written in at least the local language andEnglish, and other languages should also be considered based ontourist frequency statistics. Furthermore, the most-dangerous areasshould have multilingual signs describing the gas hazard. Anotherimportant step would be to educate the guides that nearly alwaysaccompany tourists in the dangerous areas to quickly recognisepotentially dangerous conditions. At least at Mt. Etna and Stromboli,the guides have considerable professional experience and would beable to forecast weather changes that could dramatically increasethe risk of being exposed to the concentrated volcanic plume.
An atmospheric SO2 monitoring system like those on Mt. Aso andKilauea should be implemented at Mt. Etna, since this has the highesttourist frequency and the provision of a cableway and off-road vehi-cles makes it easy for even children, the elderly and unhealthy peopleto access the summit area. Such a network should cover at least thetwo high-altitude tourist destinations of Torre del Filosofo (site 8 inFig. 2) and Pizzi Deneri (site 2 in Fig. 2), although it would be wiseto also include the upper cableway station (close to site 12 in Fig. 2). Fur-thermore, the development of a prediction model like that for Kilaueacould take advantage of the high acquisition frequency of SO2 emissiondata through the automatic FLAME network operated by INGV-Ct(Salerno et al., 2009).
5. Conclusions
Volcanoes are increasingly popular tourist destinations worldwide(Erfurt-Cooper and Cooper, 2010). The potential risks of visitinggeodynamically active areas probably add to their attraction, butawareness of the potential risks will surely improve the ability ofpeople to look after themselves. Nevertheless, as pointed out byHansell and Oppenheimer (2004), “the risks for the tourists are notwell characterized, and volcanic airborne chemical hazards are poten-tially a greater threat than direct physical hazards”. The potential risksassociatedwith volcanic and/or fumarolic gases are never considered inemergency plans and, apart from the noteworthy exceptions of Mt. Aso(Japan) and Kilauea (Hawaii), generally not recognised at all.
The present study shows the results of a series of atmosphericsulphur-gas concentration measurement campaigns and is the firstto provide objective evidence of the potential gas hazards at thesevolcanoes due to elevated sulphur-gas concentrations. Sulphur diox-ide, which is the main sulphur species emitted by Mt. Etna, Stromboliand Vulcano, shows average concentrations (>500 μg m−3) that arepotentially life-threatening for sensitive people in areas normallyreached by tourists at all three volcanic systems. In contrast, H2S, whichis the main sulphur species released by the volcanic/hydrothermal sys-tems of Milos, Santorini and Nisyros, is present at dangerous averageconcentrations (>3000 μg m−3) only at Nisyros. However, it is crucialto remember that the measured values represent the average concen-trations over periods as long as 1 month. Factors such as volcanic/
0
600
1200
1800
2400
1-sep 2-sep 3-sep 4-sep 5-sep 6-sep
H2S
µg
m-3
Stefanos 1Stefanos 3Stefanos 4Volcano Cafe
Stefanoscrater
200 m
2009
Fig. 11. Atmospheric H2S concentrations measured at four sampling sites at the Stefanos crater in Nisyros during 1–5 September 2009. The positions of the measuring sites areshown in the inset. Colours of the circles (sampling sites) correspond to those of the lines showing ambient H2S concentrations. The dashed line indicates the rim of the crater.Orange symbols indicate the main areas of fumarolic emissions.
11W. D'Alessandro et al. / Journal of Geochemical Exploration 131 (2013) 1–13
Author's personal copy
hydrothermal emission fluxes and the wind pattern and topography ofthe area could lead to strong temporal variations of the atmospheric con-centrations. Such variations, evident also at the volcanic systems wherecontinuous monitoring systems are installed (Mt. Aso and Kilauea), canrange over many orders of magnitude. This means that concentrationsthat are very dangerous to even healthy people could be reached overshorter time periods.
A preliminary assessment of this peculiar risk to the tourist popu-lation, considering both the measured concentrations and the num-bers of tourists exposed to elevated gas levels, led us to concludethat the risk is negligible at Milos and Santorini, moderate at Strom-boli, high at Vulcano and Nisyros, and very high at Mt. Etna.
At the studied volcanic systems with elevated gas concentrations,such risks have never been taken in account by either the publicauthorities or the tourist operators that manage the access to thedangerous areas. Both of these bodies have a moral obligation toinform visitors about the potential hazards, but they also should notalarm the clients of tourist operators with unjustifiably dire warnings.Important measures that need to be undertaken for risk reductioninclude (i) distributing leaflets describing the gas hazard alongwith the other risks of the area, and the possible countermeasures,(ii) installing multilingual signals at the most-dangerous areas, (iii)educating the tourist operators and (especially) the guides abouthow to recognise potentially dangerous conditions in the area andfirst-aid procedures, and (iv) at least at Mt. Etna, implementing anatmospheric SO2 monitoring network and developing a model thatconsiders both plume fluxes measured for volcanic surveillancepurposes and atmospheric circulation models in order to forecastSO2 concentrations at the most-frequented sites.
Acknowledgements
Piero Bonfanti, Jens Fiebig, Angela Franco and Roberto Maugeri areacknowledged for their support in the field and in the laboratory, andSalvatore Inguaggiato and Fabio Vita for making available the winddata for Stromboli and Vulcano. Our colleagues from INGV-Ct arekindly acknowledged for providing SO2 emission data for Mt. Etna.The insightful comments of two anonymous referees helped us toimprove the manuscript.
References
Aiuppa, A., D'Alessandro, W., Federico, C., Ferm, M., Valenza, M., 2004. Volcanic plumemonitoring at Mount Etna by diffusive (passive) sampling. Journal of GeophysicalResearch 109/D21, D21308 http://dx.doi.org/10.1029/2003JD004481.
Aiuppa, A., Inguaggiato, S., McGonigle, A.J.S., O'Dwyer, M., Oppenheimer, C., Padgett,M.J., Rouwet, D., Valenza, M., 2005. H2S fluxes from Mt. Etna, Stromboli, andVulcano (Italy) and implications for the sulfur budget at volcanoes. Geochimicaet Cosmochimica Acta 69/7, 1861–1871 http://dx.doi.org/10.1016/j.gca.2004.09.018.
Aiuppa, A., Franco, A., von Glasow, R., Allen, A.G., D'Alessandro, W., Mather, T.A., Pyle,D.M., Valenza, M., 2007. The tropospheric processing of acidic gases and hydrogensulphide in volcanic gas plumes as inferred from field and model investigations.Atmospheric Chemistry and Physics 7, 1441–1450 http://dx.doi.org/10.5194/acp-7-1441-2007.
Allard, P., Aiuppa, A., Loyer, H., Carrot, F., Gaudry, A., Pinte, G., Michel, A., Dongarrà, G., 2000.Acid gas and metal emission rates during long-lived basalt degassing at Strombolivolcano. Geophysical Research Letters 27 (8), 1207–1210 http://dx.doi.org/10.1029/1999GL008413.
Allen, A.G., Oppenheimer, C., Ferm, M., Baxter, P.J., Horrocks, L.A., Galle, B., McGonigle,A.J.S., Duffell, H.J., 2002. Primary sulfate aerosol and associated emissions fromMasaya Volcano, Nicaragua. Journal of Geophysical Research 107/D23, 4682 http://dx.doi.org/10.1029/2002JD002120.
Amdur, M.O., 1986. Air pollutants, In: Klaassen, C.D., Amdur, M.O., Doull, J. (Eds.),Casarett and Doull's Toxicology: The Basic Science of Poisons, 3rd ed. Macmillan,London, New York, Toronto, pp. 801–824.
Ayers, G.P., Keywood, M.D., Gillet, R.W., Manins, P.C., Malfroy, H., Bardsley, T., 1998.Validation of passive diffusion samplers for SO2 and NO2. Atmospheric Environ-ment 32, 3593–3600.
Bagnato, E., Aiuppa, A., Parello, F., Calabrese, S., D'Alessandro, W., Mather, T.A., McGonigle,A.J.S., Pyle, D.M., Wängberg, I., 2007. Degassing of gaseous (elemental and reactive)and particulate mercury from Mount Etna volcano (Southern Italy). AtmosphericEnvironment 41 (35), 7377–7388 http://dx.doi.org/10.1016/j.atmosenv.2007.05.060.
Barberi, F., Neri, G., Valenza, M., Villari, L., 1991. 1987–1990 unrest at Vulcano. ActaVulcanologica 1, 95–106.
Baxter, P.J., Kapila, M., Mfonfu, D., 1989. Lake Nyos disaster, Cameroon, 1986: the med-ical effects of large scale emissions of carbon dioxide. British Medical Journal 298,1437–1441.
Bellomo, S., Aiuppa, A., D'Alessandro, W., Parello, F., 2007. Environmental impact ofmagmatic fluorine emission in the Mt. Etna area. Journal of Volcanology andGeothermal Research 165, 87–101http://dx.doi.org/10.1016/j.jvolgeores.2007.04.013.
Bird, D.K., Gisladottir, G., Dominey-Howes, D., 2010. Volcanic risk and tourism in south-ern Iceland: implications for hazard, risk and emergency response education andtraining. Journal of Volcanology and Geothermal Research 189, 33–48 http://dx.doi.org/10.1016/j.jvolgeores.2009.09.020.
Etna volcano laboratory. In: Bonaccorso, A., Calvari, S., Coltelli, M., Del Negro, C.,Falsaperla, S. (Eds.), AGU Geophysical Monography Series, vol. 143. AmericanGeophysical Union, Washington, DC.
Brimblecombe, P., 1987. The Big Smoke: A History of Air Pollution in London sinceMedieval Times. Methuen, London.
Brombach, T., Caliro, S., Chiodini, G., Fiebig, J., Hunziker, J., Raco, B., 2003. Geochemicalevidence for mixing of magmatic fluids with seawater, Nisyros hydrothermal sys-tem, Greece. Bulletin of Volcanology 65 (7), 505–516 http://dx.doi.org/10.1007/s00445-003-0278-x.
Businger, S., Huff, R., Sutton, A.J., Elias, T., Horton, K.A., 2011. The Vog Measurement andPrediction (VMAP) project. Abstract V44C-05 Presented at 2011 Fall Meeting, AGU,San Francisco, Calif., 5–9 Dec.
Calabrese, S., Aiuppa, A., Allard, P., Bagnato, E., Bellomo, S., Brusca, L., D'Alessandro, W.,Parello, F., 2011. Atmospheric sources and sinks of volcanogenic elements in a ba-saltic volcano (Etna, Italy). Geochimica et Cosmochimica Acta 75/23, 7401–7425http://dx.doi.org/10.1016/j.gca.2011.09.040.
Caliro, S., Chiodini, G., Galluzzo, D., Granieri, D., La Rocca, M., Saccorotti, G., Ventura, G.,2005. Recent activity of Nisyros volcano (Greece) inferred from structural, geo-chemical and seismological data. Bulletin of Volcanology 67, 358–369 http://dx.doi.org/10.1007/s00445-004-0381-7.
Caltabiano, T., Burton, M., Giammanco, S., Allard, P., Bruno, N., Murè, F., Romano, R.,2004. Volcanic gas emissions from the summit craters and flanks of Mt. Etna,1987–2000. In: Bonaccorso, A., Calvari, S., Coltelli, M., Del Negro, C., Falsaperla, S.(Eds.), Etna volcano laboratory: AGU Geophysical Monography Series, 143, pp.111–128.
Chiodini, G., Cioni, R., Guidi, M., Raco, B., Marini, L., 1998. Soil CO2 flux measurements involcanic and geothermal areas. Applied Geochemistry 13, 543–552.
Chiodini, G., Brombach, T., Caliro, S., Cardellini, C., Marini, L., Dietrich, V., 2002. Geo-chemical evidences of an ongoing volcanic unrest at Nisyros Island (Greece). Geo-physical Research Letters 29 http://dx.doi.org/10.1029/2001GL014355.
Chiodini, G., Valenza, M., Cardellini, C., 2007. Results of INGV-DPCV5 Project: TheCatalogue of Italian Gas Emissions. http://googas.ov.ingv.it/.
D'Alessandro, W., 2006. Gas hazard: an often neglected natural risk in volcanic areas.In: Martin-Duque, J.F., Brebbia, C.A., Emmanouloudis, D.E., Mander, U. (Eds.),Geo-Environment & Landscape Evolution II. WIT Press, Southampton, UK, pp.369–378. http://www.earth-prints.org/handle/2122/2589.
D'Alessandro, W., Brusca, L., Kyriakopoulos, K., Michas, G., Papadakis, G., 2009. Hydro-gen sulphide as a natural air contaminant in volcanic/geothermal areas: the case ofSousaki, Corinthia (Greece). Environmental Geology 57 (8), 1723–1728 http://dx.doi.org/10.1007/s00254-008-1453-3.
D'Alessandro, W., Brusca, L., Martelli, M., Rizzo, A., Kyriakopoulos, K., 2010. Geochemi-cal characterization of natural gas manifestations in Greece. Proceedings of the12th International Congress of the Geological Society of Greece, Patras, May,2010. Bulletin of the Geological Society of Greece 43 (5), 2327–2337.
Delmelle, P., Stix, J., Baxter, P.J., Garcia-Alvarez, J., Barquero, J., 2002. Atmosphericdispersion, environmental effects and potential health hazard associated withthe low-altitude gas plume of Masaya volcano, Nicaragua. Bulletin of Volcanology64, 423–434 http://dx.doi.org/10.1007/s00445-002-0221-6.
Santorini volcano. In: Druit, T.H., Edwards, L.,Mellors, R.M., Pyle, D.M., Sparks, R.S.J., Lanphere,M., Davies, M., Barriero, B. (Eds.), Geological Society of London, Memoir n. 19, p. 165.
EMEP, 2011. Transboundary Air Pollution by Main Pollutants (S, N, O3) and PM: Italy.available online http://emep.int/publ/reports/2011/Country_Reports/report_IT.pdf.
Volcano and geothermal tourism. In: Erfurt-Cooper, P., Cooper, M. (Eds.), Earthscan,London, Washington D.C., p. 378.
Ferm, M., Svanberg, P.A., 1998. Cost-efficient techniques for urban and backgroundmeasurements of SO2 and NO2. Atmospheric Environment 32, 1377–1381.
Ferm, M., Karlsson, A., Galle, B., 2002. A multi-component diffusive sampler for acidicgases. Diffusive Monitoring 13, 3.
Fondazione Maugeri, 2007. Instruction Manual for Radiello Sampler. http://www.radiello.com/english/index_en.html.
Fytikas,M., Innocenti, F., Kolios, N., Manetti, P., Mazzuoli, R., Poli, G., Rita, F., Villari, L., 1986.Volcanology and petrology of volcanic products from the island of Milos andneighbouring islets. Journal of Volcanology and Geothermal Research 28, 297–317.
Gauthier, P.J., Le Cloarec, M.F., 1998. Variability of alkali and heavy metal fluxesreleased by Mt. Etna volcano, Sicily, between 1991 and 1995. Journal of Volcanol-ogy and Geothermal Research 81, 311–326.
Gerlach, T.M., 1991. Etna's greenhouse pump. Nature 315, 352–353.Hansell, A., Oppenheimer, C., 2004. Health hazard from volcanic gases: a systematic
literature review. Archives of Environmental Health 59, 628–639.Horwell, C.J., Allen, A.G., Mather, T.A., Patterson, J.E., 2004. Evaluation of a simple pas-
sive sampling technique for monitoring volcanogenic hydrogen sulphide. Journalof Environmental Monitoring 6, 630–635 http://dx.doi.org/10.1039/b710583p.
Horwell, C.J., Patterson, J.E., Gamble, J.A., Allen, A.G., 2005. Monitoring and mapping ofhydrogen sulphide emissions across an active geothermal field: Rotorua, New
12 W. D'Alessandro et al. / Journal of Geochemical Exploration 131 (2013) 1–13
Author's personal copy
Zealand. Journal of Volcanology and Geothermal Research 139, 259–269 http://dx.doi.org/10.1016/j.jvolgeores.2004.08.010.
Kieffer, G., 1979. L'explosion meurtriere du 12 septembre 1979 de l'Etna. ComptesRendus Academie Science Paris Serie D 289, 1013–1016.
Klose, C.D., 2007. Health risk analysis of volcanic SO2 hazard on Vulcano Island (Italy).Natural Hazards 43 (3), 303–317 http://dx.doi.org/10.1007/s11069-007-9115-4.
Kyriakopoulos, K., 2010. Natural degassing of carbon dioxide and hydrogen sulphideand its environmental impact at Milos Island, Greece. Proceedings of the 12thInternational Congress of the Geological Society of Greece, Patras, May, 2010.Bulletin of the Geological Society of Greece 43 (5), 2361–2372.
Liakopoulos, A., Katerinopoulos, A., Markopoulos, T., Boulegue, J., 1991. A mineralogicalpetrogaphic and geochemical study of samples from wells in the geothermal fieldof Milos island (Greece). Geothermics 20, 237–256.
McDougall, J.W.G., Garland, T.O., 1954. Hydrogen sulphide gas poisoning at Rotorua.The New Zealand Medical Journal 53, 471–475.
Michaud, J.-P., Krupitsly, D., Grove, J.S., Anderson, B.S., 2005. Volcano related atmospherictoxicants in Hilo and Hawaii volcanoes national park: implications for human health.NeuroToxicology 26, 555–563 http://dx.doi.org/10.1016/j.neuro.2004.12.004.
Ng'Walali, P.M., Koreeda, A., Kibayashi, K., Tsunenari, S., 1999. Fatalities by inhalation ofvolcanic gas at Mt. Aso crater in Kumamoto, Japan. Legal Medicine 1, 180–184.
Nomura, K., Yamaoka, K., Okano, T., Yano, E., 2004. Risk perception, risk-taking attitude,and hypothetical behavior of active volcano tourists. Human and Ecological RiskAssessment 10, 1–10 http://dx.doi.org/10.1080/10807030490452214.
Palmes, E.D., Gunnison, A.F., 1973. Personal monitoring device for gaseous contami-nants. American Industrial Hygiene Association Journal 34, 78.
Paonita, A., Favara, R., Nuccio, P.M., Sortino, F., 2002. Genesis of fumarolic emissions as in-ferred by isotopemass balances: CO2 andwater at Vulcano Island, Italy. Geochimica etCosmochimica Acta 66, 759–772 http://dx.doi.org/10.1016/S0016-7037(01)00814-6.
Pareschi, M.T., Ranci, M., Valenza, M., Graziani, G., 1999. The assessment of volcanic gashazard by means of numerical models: an example from Vulcano island (Sicily).
Geophysical Research Letters 26 (10), 1405–1408 http://dx.doi.org/10.1029/1999GL900248.
Salerno, G.G., Burton, M.R., Oppenheimer, C., Caltabiano, T., Randazzo, D., Bruno, N.,Longo, V., 2009. Three-years of SO2 flux measurements of Mt. Etna using an auto-mated UV scanner array: comparison with conventional traverses and uncer-tainties in flux retrieval. Journal of Volcanology and Geothermal Research 183,76–83 http://dx.doi.org/10.1016/j.jvolgeores.2009.02.013.
Stephenson, R., Burr, G., Kawamoto, M., Hills, B., 1991. Exposures to volcanic emissionsfrom the Hawaiian volcanoes: a NIOSH health hazard evaluation. Applied Occupa-tional and Environmental Hygiene 6/6, 408–410.
Utell, M.J., Frampton, M.W., 1998. Sulfur dioxide and sulfuric acid aerosols. In: Rom, W.M.(Ed.), Environmental and Occupational Medicine. Little, Brown & Co., Boston, MA.
Vita, F., Inguaggiato, S., Bobrowski, N., Calderone, L., Galle, B., Parello, F., 2012. Contin-uous SO2 flux measurements for Vulcano Island, Italy. Annals of Geophysics 55,301–308 http://dx.doi.org/10.4401/ag-5759.
VMAP, 2011. Vog Measurement and Prediction Project. School of Ocean and Earth Sci-ence and Technology at the University of Hawaii, Manoa . (http://mkwc.ifa.hawaii.edu/vmap/index.cgi).
WHO, 2003. Hydrogen sulphide: human health aspects. Concise International ChemicalAssessment Document 53. World Health Organization, Geneva, p. 26.
WHO, 2006. Air Quality Guidelines, Global Update 2005 — Particulate Matter, Ozone,Nitrogen Dioxide and Sulfur Dioxide. World Health Organization — Regional Officefor Europe, Copenhagen, Denmark, p. 484.
Witham, C.S., 2005. Volcanic disasters and incidents: a new database. Journal of Volca-nology and Geothermal Research 148, 191–233 http://dx.doi.org/10.1016/j.jvolgeores.2005.04.017.
13W. D'Alessandro et al. / Journal of Geochemical Exploration 131 (2013) 1–13