Study of deterioration of historical parchments by various thermal analysis techniques complemented...
11
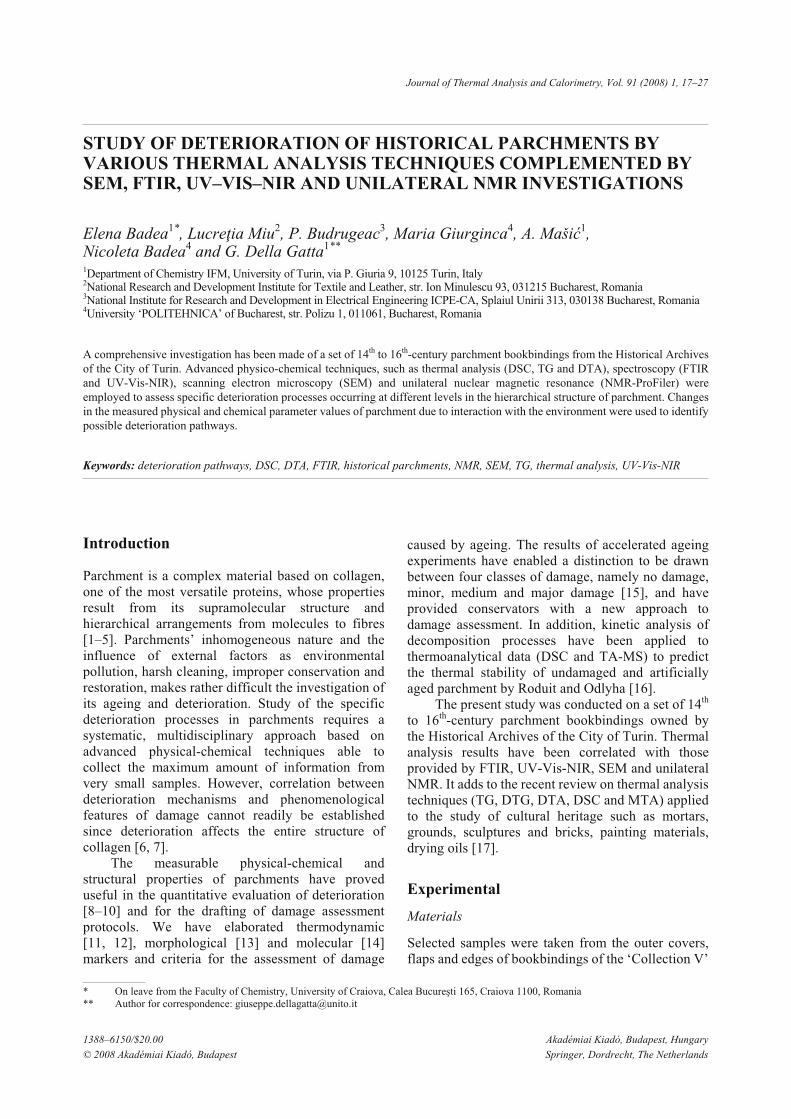
Introduction Parchment is a complex material based on collagen, one of the most versatile proteins, whose properties result from its supramolecular structure and hierarchical arrangements from molecules to fibres [1–5]. Parchments’ inhomogeneous nature and the influence of external factors as environmental pollution, harsh cleaning, improper conservation and restoration, makes rather difficult the investigation of its ageing and deterioration. Study of the specific deterioration processes in parchments requires a systematic, multidisciplinary approach based on advanced physical-chemical techniques able to collect the maximum amount of information from very small samples. However, correlation between deterioration mechanisms and phenomenological features of damage cannot readily be established since deterioration affects the entire structure of collagen [6, 7]. The measurable physical-chemical and structural properties of parchments have proved useful in the quantitative evaluation of deterioration [8–10] and for the drafting of damage assessment protocols. We have elaborated thermodynamic [11, 12], morphological [13] and molecular [14] markers and criteria for the assessment of damage caused by ageing. The results of accelerated ageing experiments have enabled a distinction to be drawn between four classes of damage, namely no damage, minor, medium and major damage [15], and have provided conservators with a new approach to damage assessment. In addition, kinetic analysis of decomposition processes have been applied to thermoanalytical data (DSC and TA-MS) to predict the thermal stability of undamaged and artificially aged parchment by Roduit and Odlyha [16]. The present study was conducted on a set of 14 th to 16 th -century parchment bookbindings owned by the Historical Archives of the City of Turin. Thermal analysis results have been correlated with those provided by FTIR, UV-Vis-NIR, SEM and unilateral NMR. It adds to the recent review on thermal analysis techniques (TG, DTG, DTA, DSC and MTA) applied to the study of cultural heritage such as mortars, grounds, sculptures and bricks, painting materials, drying oils [17]. Experimental Materials Selected samples were taken from the outer covers, flaps and edges of bookbindings of the ‘Collection V’ 1388–6150/$20.00 Akadémiai Kiadó, Budapest, Hungary © 2008 Akadémiai Kiadó, Budapest Springer, Dordrecht, The Netherlands Journal of Thermal Analysis and Calorimetry, Vol. 91 (2008) 1, 17–27 STUDY OF DETERIORATION OF HISTORICAL PARCHMENTS BY VARIOUS THERMAL ANALYSIS TECHNIQUES COMPLEMENTED BY SEM, FTIR, UV–VIS–NIR AND UNILATERAL NMR INVESTIGATIONS Elena Badea 1* , Lucreïia Miu 2 , P. Budrugeac 3 , Maria Giurginca 4 , A. Maëiº 1 , Nicoleta Badea 4 and G. Della Gatta 1** 1 Department of Chemistry IFM, University of Turin, via P. Giuria 9, 10125 Turin, Italy 2 National Research and Development Institute for Textile and Leather, str. Ion Minulescu 93, 031215 Bucharest, Romania 3 National Institute for Research and Development in Electrical Engineering ICPE-CA, Splaiul Unirii 313, 030138 Bucharest, Romania 4 University ‘POLITEHNICA’ of Bucharest, str. Polizu 1, 011061, Bucharest, Romania A comprehensive investigation has been made of a set of 14 th to 16 th -century parchment bookbindings from the Historical Archives of the City of Turin. Advanced physico-chemical techniques, such as thermal analysis (DSC, TG and DTA), spectroscopy (FTIR and UV-Vis-NIR), scanning electron microscopy (SEM) and unilateral nuclear magnetic resonance (NMR-ProFiler) were employed to assess specific deterioration processes occurring at different levels in the hierarchical structure of parchment. Changes in the measured physical and chemical parameter values of parchment due to interaction with the environment were used to identify possible deterioration pathways. Keywords: deterioration pathways, DSC, DTA, FTIR, historical parchments, NMR, SEM, TG, thermal analysis, UV-Vis-NIR * On leave from the Faculty of Chemistry, University of Craiova, Calea Bucureêti 165, Craiova 1100, Romania ** Author for correspondence: [email protected]
Transcript of Study of deterioration of historical parchments by various thermal analysis techniques complemented...
Introduction
Parchment is a complex material based on collagen,
one of the most versatile proteins, whose properties
result from its supramolecular structure and
hierarchical arrangements from molecules to fibres
[1–5]. Parchments’ inhomogeneous nature and the
influence of external factors as environmental
pollution, harsh cleaning, improper conservation and
restoration, makes rather difficult the investigation of
its ageing and deterioration. Study of the specific
deterioration processes in parchments requires a
systematic, multidisciplinary approach based on
advanced physical-chemical techniques able to
collect the maximum amount of information from
very small samples. However, correlation between
deterioration mechanisms and phenomenological
features of damage cannot readily be established
since deterioration affects the entire structure of
collagen [6, 7].
The measurable physical-chemical and
structural properties of parchments have proved
useful in the quantitative evaluation of deterioration
[8–10] and for the drafting of damage assessment
protocols. We have elaborated thermodynamic
[11, 12], morphological [13] and molecular [14]
markers and criteria for the assessment of damage
caused by ageing. The results of accelerated ageing
experiments have enabled a distinction to be drawn
between four classes of damage, namely no damage,
minor, medium and major damage [15], and have
provided conservators with a new approach to
damage assessment. In addition, kinetic analysis of
decomposition processes have been applied to
thermoanalytical data (DSC and TA-MS) to predict
the thermal stability of undamaged and artificially
aged parchment by Roduit and Odlyha [16].
The present study was conducted on a set of 14th
to 16th-century parchment bookbindings owned by
the Historical Archives of the City of Turin. Thermal
analysis results have been correlated with those
provided by FTIR, UV-Vis-NIR, SEM and unilateral
NMR. It adds to the recent review on thermal analysis
techniques (TG, DTG, DTA, DSC and MTA) applied
to the study of cultural heritage such as mortars,
grounds, sculptures and bricks, painting materials,
drying oils [17].
Experimental
Materials
Selected samples were taken from the outer covers,
flaps and edges of bookbindings of the ‘Collection V’
1388–6150/$20.00 Akadémiai Kiadó, Budapest, Hungary
© 2008 Akadémiai Kiadó, Budapest Springer, Dordrecht, The Netherlands
Journal of Thermal Analysis and Calorimetry, Vol. 91 (2008) 1, 17–27
STUDY OF DETERIORATION OF HISTORICAL PARCHMENTS BYVARIOUS THERMAL ANALYSIS TECHNIQUES COMPLEMENTED BYSEM, FTIR, UV–VIS–NIR AND UNILATERAL NMR INVESTIGATIONS
Elena Badea1*, Lucre�ia Miu2, P. Budrugeac3, Maria Giurginca4, A. Ma�i�1,Nicoleta Badea4 and G. Della Gatta1**
1Department of Chemistry IFM, University of Turin, via P. Giuria 9, 10125 Turin, Italy2National Research and Development Institute for Textile and Leather, str. Ion Minulescu 93, 031215 Bucharest, Romania3National Institute for Research and Development in Electrical Engineering ICPE-CA, Splaiul Unirii 313, 030138 Bucharest, Romania4University ‘POLITEHNICA’ of Bucharest, str. Polizu 1, 011061, Bucharest, Romania
A comprehensive investigation has been made of a set of 14th to 16th-century parchment bookbindings from the Historical Archives
of the City of Turin. Advanced physico-chemical techniques, such as thermal analysis (DSC, TG and DTA), spectroscopy (FTIR
and UV-Vis-NIR), scanning electron microscopy (SEM) and unilateral nuclear magnetic resonance (NMR-ProFiler) were
employed to assess specific deterioration processes occurring at different levels in the hierarchical structure of parchment. Changes
in the measured physical and chemical parameter values of parchment due to interaction with the environment were used to identify
possible deterioration pathways.
Keywords: deterioration pathways, DSC, DTA, FTIR, historical parchments, NMR, SEM, TG, thermal analysis, UV-Vis-NIR
* On leave from the Faculty of Chemistry, University of Craiova, Calea Bucure�ti 165, Craiova 1100, Romania
** Author for correspondence: [email protected]
(Finances, Land Registers, etc.) in the Historical
Archives of the City of Turin. Some samples
(Table 1) were regarded as representative of the state
of conservation of the entire collection.
The parchments used as reference were from
goatskin, in accordance with the type of our samples,
and were prepared by traditional methods at the
National Research and Development Institute for
Textile and Leather of Bucharest.
Methods
Differential scanning calorimetry
(i) DSC measurements on ‘as received’ samples were
performed in the temperature range 20 to 280°C, at
10°C min–1 heating rate in both static air atmosphere
and dry nitrogen flow (20 mL min–1) in open
aluminium crucibles. Samples were analysed in a dry
condition after a few days’ storage in a controlled
environment (approximately 20°C and 50% RH).
Measurements were made in the laboratories of
ICPE-CA, Bucharest, and Department of Chemistry
IFM, Torino, with a NETZSCH DSC 204 F1 Phoenix
and a Setaram DSC 111 calorimeter, respectively.
(ii) DSC measurements on ‘wet’ samples were made
from 25 to 110°C, at 10°C min–1 heating rate with the
NETZSCH calorimeter. Following the addition of
35 �L water, the aluminium crucibles were herme-
tically sealed and left for 24 h at room temperature to
assure reproducible swelling conditions.
(iii) DSC measurements in ‘excess water’ were
performed with a SETARAM MicroDSC III calori-
meter, from 5 to 95°C, at 0.5°C min–1 heating rate.
Samples were first kept in 0.5 M acetate buffer
solution (pH=5.0) in the calorimetric cell for 2 h at
5°C to assure reproducible hydration conditions.
Simultaneous TG, DTG and DTA analysis
TG, DTG and DTA plots were simultaneously
recorded with a NETZSCH STA 409PC apparatus
from 20 to 900°C, at 10°C min–1 heating rate. Meas-
urements were made in static air atmosphere using
�-Al2O3 crucibles.
The sample masses were 2 to 4�10–3 g, and 4 to
6�10–3 g for DSC and simultaneous TG-DTG-DTA,
respectively.
Micro Hot Table
Parchment fibre shrinkage temperatures were
determined by the Micro Hot Table (MHT) method as
described in [18]. A Caloris micro hot table controlled
by a temperature processor coupled with a stereo
microscope Wild Heergbrugg (magnification ×50)
assisted by a home-made software was used.
FTIR and UV-Vis-NIR analysis
FTIR spectra in the 4000–400 cm–1 wavenumber
range were recorded with a Jasco FTIR-620 spectro-
photometer equipped with a DLATGS detector and a
KBr beam splitter. Samples were prepared by
grinding about 1 mg parchment with KBr and
pressing the mixture into very thin disks. The maxi-
mum resolution of measurements was 1 cm–1 [14].
UV-Vis-NIR spectra in the 200–2000 nm wave-
length range were obtained with a Jasco V570
double-beam spectrophotometer using diffuse
reflection technique and 2 nm resolution.
Changes in sample colour by comparison with a
reference new parchment were also evaluated with
the CIE-Lab software (CIE-Lab.DIN 6174-976.
Testing the chromatic characteristics).
Scanning electron microscopy
SEM observations were made at 5 to 30 kV accele-
rating voltage with a Leica 420 Stereoscan apparatus
equipped with a tungsten filament as described in
[12, 13]. Samples were short-pulse coated with
graphite to avoid damage due to overheating and
analysed on their flesh side at increasing magnifi-
cations (×250–×2000).
Unilateral nuclear magnetic resonance
Water 1H nuclear spin relaxation time measurements
were performed with a mobile NMR device
(NMR ProFiler, Bruker BioSpin) [19]. The peculiar
18 J. Therm. Anal. Cal., 91, 2008
BADEA et al.
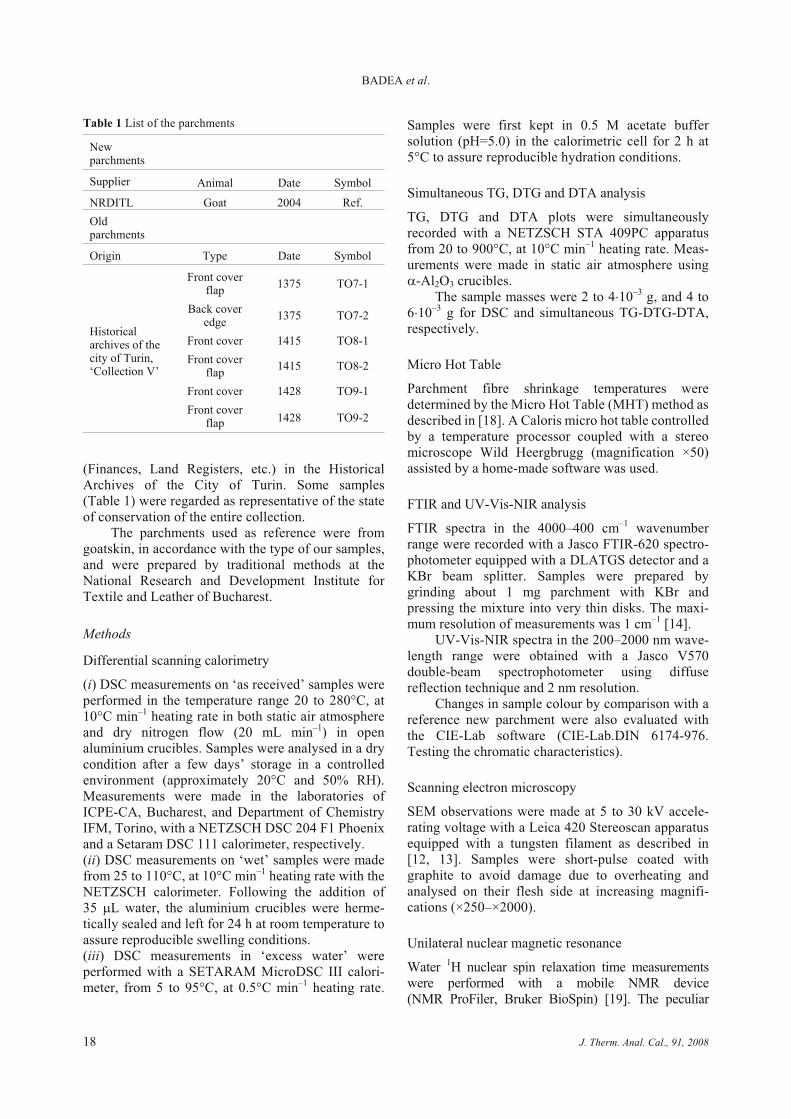
Table 1 List of the parchments
Newparchments
Supplier Animal Date Symbol
NRDITL Goat 2004 Ref.
Oldparchments
Origin Type Date Symbol
Historicalarchives of thecity of Turin,‘Collection V’
Front coverflap
1375 TO7-1
Back coveredge
1375 TO7-2
Front cover 1415 TO8-1
Front coverflap
1415 TO8-2
Front cover 1428 TO9-1
Front coverflap 1428 TO9-2
features of this device (permanent magnet of 0.5 T,
radio frequency field spread a few millimeters from the
surface) allow the acquisition of NMR relaxometric data
by simply placing the magnet on a parchment. The
spin-lattice relaxation time (T1) was measured because
of its higher sensitivity to the water collagen interactions
that depend on the deterioration of collagen. The experi-
mental signal intensity was exponentially fitted to derive
T1 values. A 4-hour measurement allows a fitting
uncertainty of about �1 ms.
Results and discussion
Thermal analysis of historical collagen-based
materials has not yet been systematically attempted,
even though much has been learned about the thermal
denaturation of molecular collagen from various
biological tissues. Few studies have been made on
fibrous collagen within parchments [11–16, 18–20].
Parchment, in fact, mostly (�90%) consists of fibrillar
collagen embedded in a hydrated matrix of proteo-
glycans, mucopolysaccharides, elastin, salts and
lipids. This complexity makes it hard to understand
how all these components interact and influence one
another during the physical and chemical alterations
induced by ageing. Since hydration plays a significant
rôle in regulating a parchment’s response to heating
[21–23], we have performed DSC measurements on
‘as received’ and ‘wet’ samples, and in ‘excess
water’. ‘As received’ samples were also analysed by
simultaneous TG, DTG and DTA.
Differential scanning calorimetry
Parchments ‘as received’
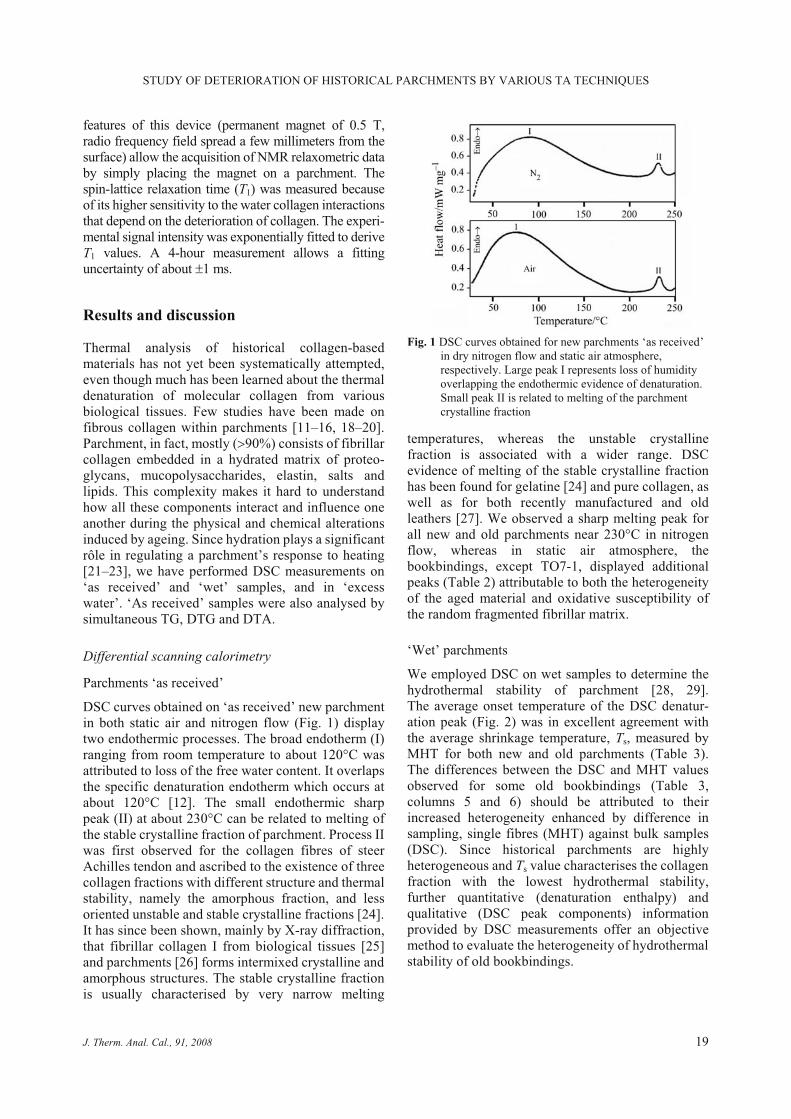
DSC curves obtained on ‘as received’ new parchment
in both static air and nitrogen flow (Fig. 1) display
two endothermic processes. The broad endotherm (I)
ranging from room temperature to about 120°C was
attributed to loss of the free water content. It overlaps
the specific denaturation endotherm which occurs at
about 120°C [12]. The small endothermic sharp
peak (II) at about 230°C can be related to melting of
the stable crystalline fraction of parchment. Process II
was first observed for the collagen fibres of steer
Achilles tendon and ascribed to the existence of three
collagen fractions with different structure and thermal
stability, namely the amorphous fraction, and less
oriented unstable and stable crystalline fractions [24].
It has since been shown, mainly by X-ray diffraction,
that fibrillar collagen I from biological tissues [25]
and parchments [26] forms intermixed crystalline and
amorphous structures. The stable crystalline fraction
is usually characterised by very narrow melting
temperatures, whereas the unstable crystalline
fraction is associated with a wider range. DSC
evidence of melting of the stable crystalline fraction
has been found for gelatine [24] and pure collagen, as
well as for both recently manufactured and old
leathers [27]. We observed a sharp melting peak for
all new and old parchments near 230°C in nitrogen
flow, whereas in static air atmosphere, the
bookbindings, except TO7-1, displayed additional
peaks (Table 2) attributable to both the heterogeneity
of the aged material and oxidative susceptibility of
the random fragmented fibrillar matrix.
‘Wet’ parchments
We employed DSC on wet samples to determine the
hydrothermal stability of parchment [28, 29].
The average onset temperature of the DSC denatur-
ation peak (Fig. 2) was in excellent agreement with
the average shrinkage temperature, Ts, measured by
MHT for both new and old parchments (Table 3).
The differences between the DSC and MHT values
observed for some old bookbindings (Table 3,
columns 5 and 6) should be attributed to their
increased heterogeneity enhanced by difference in
sampling, single fibres (MHT) against bulk samples
(DSC). Since historical parchments are highly
heterogeneous and Ts value characterises the collagen
fraction with the lowest hydrothermal stability,
further quantitative (denaturation enthalpy) and
qualitative (DSC peak components) information
provided by DSC measurements offer an objective
method to evaluate the heterogeneity of hydrothermal
stability of old bookbindings.
J. Therm. Anal. Cal., 91, 2008 19
STUDY OF DETERIORATION OF HISTORICAL PARCHMENTS BY VARIOUS TA TECHNIQUES
Fig. 1 DSC curves obtained for new parchments ‘as received’
in dry nitrogen flow and static air atmosphere,
respectively. Large peak I represents loss of humidity
overlapping the endothermic evidence of denaturation.
Small peak II is related to melting of the parchment
crystalline fraction

Parchment in ‘excess water’ condition
DSC of dry parchments, in fact, only provides a bulk
response concerning the fibrous tissue also dependent
on the moisture content while wetting gives rise to
randomly swollen fibres whose denaturation occurs in
a broad temperature range with an onset temperature
that practically coincides with the shrinkage
temperature. An excess water milieu ensures full and
reproducible hydration of samples and provides more
comprehensive and accurate values of the
thermodynamic parameters associated to thermal
denaturation. In excess water, impairment of the
fibrillar structure is enhanced and the DSC peaks give
more detailed information about damage processes
and their features (Fig. 3) [12]. Table 4 sets out the
values of these parameters, namely maximum peak
temperature, Td, peak half width, �T1/2, maximum
peak height, Cp(max)
ex , and enthalpy of denaturation,
�dH, for new and old parchments. As shown in
Fig. 3a, thermal denaturation of new parchments in
excess water displays sharp peaks with a smoothed
shoulder on their descending part. This feature has
been attributed to the presence of collagen fractions
with dissimilar thermal stability [30, 31]. Collagen
fibrils inhomogeneously structured with a relatively
hard shell and softer, less dense core observed by
atomic force microscopy have been attributed to a
higher crosslink level near their surface [32]. We have
found that artificial ageing induces specific alteration
of these two components of collagen and makes the
multiple features of DSC curves more evident [33].
Due to the collagen inhomogeneous structure and
cooperative character of its breakdown ageing may be
expected to result in a progressively lower and
broader energy distribution of its components with
different thermal, mechanical and organisation
features. In fact, old parchments have frequently
displayed widely distributed denaturation temper-
atures and small endothermic deviations in the range
20 to 40°C (Fig. 3b, curve 2), as well as just before the
denaturation peak due to differences in the quality of
their collagen fractions provoked by ageing [34]. The
DSC curves of the old bookbindings (Fig. 4)
displayed different responses to heating and indicated
that ageing of external covers (TO8-1 and TO9-1),
flaps (TO7-1, TO8-2 and TO9-2) and an edge
(TO7-2) has followed different patterns. DSC
denaturation peaks of flaps were rather narrow, but
very short by comparison with the reference one and
displayed higher Td values (Table 4). Moreover, the
20 J. Therm. Anal. Cal., 91, 2008
BADEA et al.
Table 2 Thermodynamic parameter values for the melting of the stable crystalline fraction measured by DSC using opencrucibles
SampleStatic air atmosphere Nitrogen flow
N Tmax/°C �H/J g–1 N Tmax/°C �H/J g–1
Reference* 1 230�3* 7�2* 1 230�4* 6�2*
TO7-1 1 230.7 10.5 1 232.1 6.4
TO7-2 3 137.6 0.5 1 230.4 6.2
162.8 0.3
228.4 8.8
TO8-1 2 161.4 0.8 1 236.8 7.4
238.1 3.4
TO8-2 3 98.5 1.0 2 97.5 1.0
159.0 0.4 231.9 5.8
231.7 2.3
TO9-1 2 166.3 1.1 2 129.8 1.7
228.9 1.7 228.1 4.9
TO9-2 2 157.8 0.2 1 232.0 8.0
232.4 5.7
*Average values calculated for eight new manufactured parchments (uncertainties are twice standard deviations of the mean).
N=number of DSC peaks corresponding to melting
Fig. 2 DSC curve obtained for a new parchment in ‘wet’
condition and static air atmosphere. The onset
temperature, Tonset, is practically coincident with the
temperature of shrinkage, Ts, measured by MHT

peak shoulder is spread over a wider temperature
range and its contribution to �dH is increased by
comparison with the reference. Very small
endothermic deviations were detected both before
40°C and DSC peak onset. TO8-2 displayed a clear
and broad endotherm in the 20 to 40°C range.
The sample taken from the back cover edge, TO7-2,
gave an even broader and lower peak with an evident
and broad endotherm in the range 20 to 40°C. DSC
peaks for the two external covers, TO8-1 and TO9-1,
were further broader and lower with �dH values less
than 50% by comparison to the reference (Table 4).
Td values higher than the reference are rather frequent
for old bindings, and are probably due to a cross-link
formation prior to deterioration through polypeptide
chain cleavage [12, 15]. �T1/2 values, in fact, which
are directly correlated with the structural hetero-
geneity of parchment, increased by comparison with
the reference from 120 (flaps) to 150 (edge) and
700% (covers).
The study of artificially aged parchments showed
that dampness combined with a relatively high
temperature results in a progressively greater
contribution of the shoulder to the enthalpy of
denaturation, �dH [15]. On the other hand, the
presence of acid species, such as HNO2
� and HNO3
�
and HSO3
� produced by exposure to NOx and SO2,
promotes hydrolysis of the stable fraction (i.e. that
giving the shoulder) and reduces this contribution
[15, 33]. The occurrence of small and broad endo-
J. Therm. Anal. Cal., 91, 2008 21
STUDY OF DETERIORATION OF HISTORICAL PARCHMENTS BY VARIOUS TA TECHNIQUES
Table 3 Comparison between Ts values determined by both DSC on ‘wet samples’ and MHT for new (samples N-1 to N-8) andold parchments (RO-1 and RO-2 are 16th-century Romanian documents)
New parchmentsTs/°C Old parchments Ts/°C
MHT DSC MHT DSC
N-1 55.4 56.3 TO7-1 43.7 46.8
N-2 56.4 58.3 TO7-2 51.5 49.4
N-3 59.9 58.4 TO8-1 56.4 54.4
N-4 56.5 57.8 TO8-2 55.5 59.1
N-5 54.7 52.8 TO9-1 58.7 59.9
N-6 61.2 60.8 TO9-2 52.5 53.8
N-7 57.4 56.6 RO-1 52.5 53.8
N-8 61.1 63.0 RO-2 56.3 57.0
Average 57.8�2.6 58.0�3.0
Fig. 3 a – DSC curve for new parchment in ‘excess water’ and
the derived thermodynamic parameter values; b – DSC
curves of two historical parchments: (1) bookbinding
damaged by the 1966 flood from the State Archive of
Florence; (2) single sheet document dated 1832 from
the National Archives of Stirling
Table 4 Thermodynamic parameter values for thermaldenaturation measured by DSC ‘in excess water’
SampleTd/°C
�dH/J g–1
�T1/2/°C
Cp(max)
ex /J K–1 g–1
Ref.* 52.7�0.9 48�4 4.0�0.6 8.3�1.4
TO7-1 55.7 30.2 4.8 3.0
TO7-2 53.2 25.8 6.3 1.9
TO8-1 50.7 22.8 29.1 1.1
TO8-2 53.8 29.3 6.0 1.9
TO9-1 53.0 22.1 12.3 1.3
TO9-2 55.6 26.9 4.8 2.6
*Average values calculated for eight new manufactured
parchments (uncertainties are twice standard deviations
of the mean)

therms in the range 20 to 40°C was related to collagen
gelatinisation and the less sharp onset of the DSC peak
was assigned to the transition of a disordered fraction
of collagen [12]. All these features are present in the
DSC peaks of old bookbindigs and their intensity
depends on the type (cover, flap or edge) of sample.
Simultaneous TG, DTG and DTA analysis
Figure 5 shows typical TG, DTG and DTA curves of a
new parchment displaying a four-step thermal degra-
dation in air where each step is accompanied by
specific mass loss [11, 27, 35–39]. In the first
endothermic step (I) at around 100°C, the moisture
content of parchments is lost. The next two steps are
exothermic and consist in the thermo-oxidation (II)
and pyrolytic decomposition (III) at about 300 and
550°C, respectively. The last step (IV) was attributed
to the decomposition of the small quantity of CaCO3
usually present in parchments.
The average values of the temperatures corres-
ponding to the maximum reaction rate, Tmin
DTG , for
steps II and III, and mass loss evaluated from TG and
DTG curves, are presented in Table 5. New parch-
ments always displayed average Tmin
DTG and %�m values
higher than old parchments. Since the temperature
corresponding to the maximum rate of step II was in
the range 309.8 to 328.4°C, we have compared the
dm/dt values of new and old parchments at 310, 315,
320 and 325°C (Table 6). New parchments always
displayed higher dm/dt values than old parchments. A
similar thermal behaviour observed for new and old
leather was attributed to the presence of reactive sites
introduced by tanning and progressively lost on ageing
[11, 39]. The lower thermo-oxidation rate of old
bookbindings could be attributable to their high
heterogeneity caused by the splitting off and
consequent oxidative breakdown of fibrils.
FTIR and UV–Vis–NIR analysis
FTIR analysis was employed to investigate the
secondary structure of collagen since marker bands
explored in detail by mid-IR spectroscopy permit the
identification and quantification of ageing-induced
changes at the molecular level of collagenous
materials [14, 15, 33]. NIR spectroscopy is also useful
22 J. Therm. Anal. Cal., 91, 2008
BADEA et al.
Fig. 4 DSC curves in ‘excess water’ for old bookbindings
displaying denaturation peaks and further endothermic
evidences at temperatures lower than Td
Fig. 5 TG, DTG and DTA curves showing the four-step
non-isothermal degradation in air for a new parchment
for the qualitative analysis of a complex material such
as parchment. Nonetheless, spectrum-structure
correlations have not been well established for
collagenous materials in the NIR region.
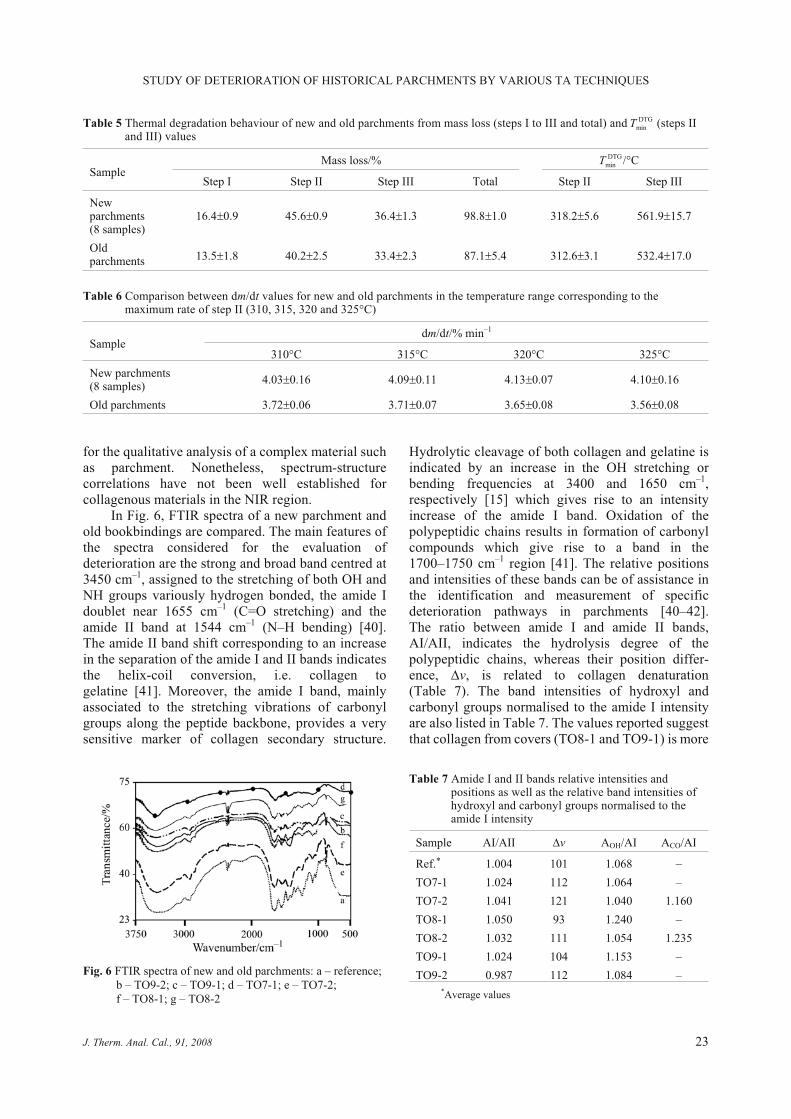
In Fig. 6, FTIR spectra of a new parchment and
old bookbindings are compared. The main features of
the spectra considered for the evaluation of
deterioration are the strong and broad band centred at
3450 cm–1, assigned to the stretching of both OH and
NH groups variously hydrogen bonded, the amide I
doublet near 1655 cm–1 (C=O stretching) and the
amide II band at 1544 cm–1 (N–H bending) [40].
The amide II band shift corresponding to an increase
in the separation of the amide I and II bands indicates
the helix-coil conversion, i.e. collagen to
gelatine [41]. Moreover, the amide I band, mainly
associated to the stretching vibrations of carbonyl
groups along the peptide backbone, provides a very
sensitive marker of collagen secondary structure.
Hydrolytic cleavage of both collagen and gelatine is
indicated by an increase in the OH stretching or
bending frequencies at 3400 and 1650 cm–1,
respectively [15] which gives rise to an intensity
increase of the amide I band. Oxidation of the
polypeptidic chains results in formation of carbonyl
compounds which give rise to a band in the
1700–1750 cm–1 region [41]. The relative positions
and intensities of these bands can be of assistance in
the identification and measurement of specific
deterioration pathways in parchments [40–42].
The ratio between amide I and amide II bands,
AI/AII, indicates the hydrolysis degree of the
polypeptidic chains, whereas their position differ-
ence, �v, is related to collagen denaturation
(Table 7). The band intensities of hydroxyl and
carbonyl groups normalised to the amide I intensity
are also listed in Table 7. The values reported suggest
that collagen from covers (TO8-1 and TO9-1) is more
J. Therm. Anal. Cal., 91, 2008 23
STUDY OF DETERIORATION OF HISTORICAL PARCHMENTS BY VARIOUS TA TECHNIQUES
Table 5 Thermal degradation behaviour of new and old parchments from mass loss (steps I to III and total) and Tmin
DTG (steps IIand III) values
SampleMass loss/% Tmin
DTG/°C
Step I Step II Step III Total Step II Step III
Newparchments(8 samples)
16.4�0.9 45.6�0.9 36.4�1.3 98.8�1.0 318.2�5.6 561.9�15.7
Oldparchments 13.5�1.8 40.2�2.5 33.4�2.3 87.1�5.4 312.6�3.1 532.4�17.0
Table 6 Comparison between dm/dt values for new and old parchments in the temperature range corresponding to themaximum rate of step II (310, 315, 320 and 325°C)
Sampledm/dt/% min–1
310°C 315°C 320°C 325°C
New parchments(8 samples)
4.03�0.16 4.09�0.11 4.13�0.07 4.10�0.16
Old parchments 3.72�0.06 3.71�0.07 3.65�0.08 3.56�0.08
Fig. 6 FTIR spectra of new and old parchments: a – reference;
b – TO9-2; c – TO9-1; d – TO7-1; e – TO7-2;
f – TO8-1; g – TO8-2
Table 7 Amide I and II bands relative intensities andpositions as well as the relative band intensities ofhydroxyl and carbonyl groups normalised to theamide I intensity
Sample AI/AII �v AOH/AI ACO/AI
Ref.* 1.004 101 1.068 –
TO7-1 1.024 112 1.064 –
TO7-2 1.041 121 1.040 1.160
TO8-1 1.050 93 1.240 –
TO8-2 1.032 111 1.054 1.235
TO9-1 1.024 104 1.153 –
TO9-2 0.987 112 1.084 –
*Average values
hydrolysed, whereas collagen from the cover edge
(TO7-2) is mainly affected by oxidation and
denaturation. The amide II shift towards lower
frequencies observed for the flap TO7-1 is also a
marker of denaturation.
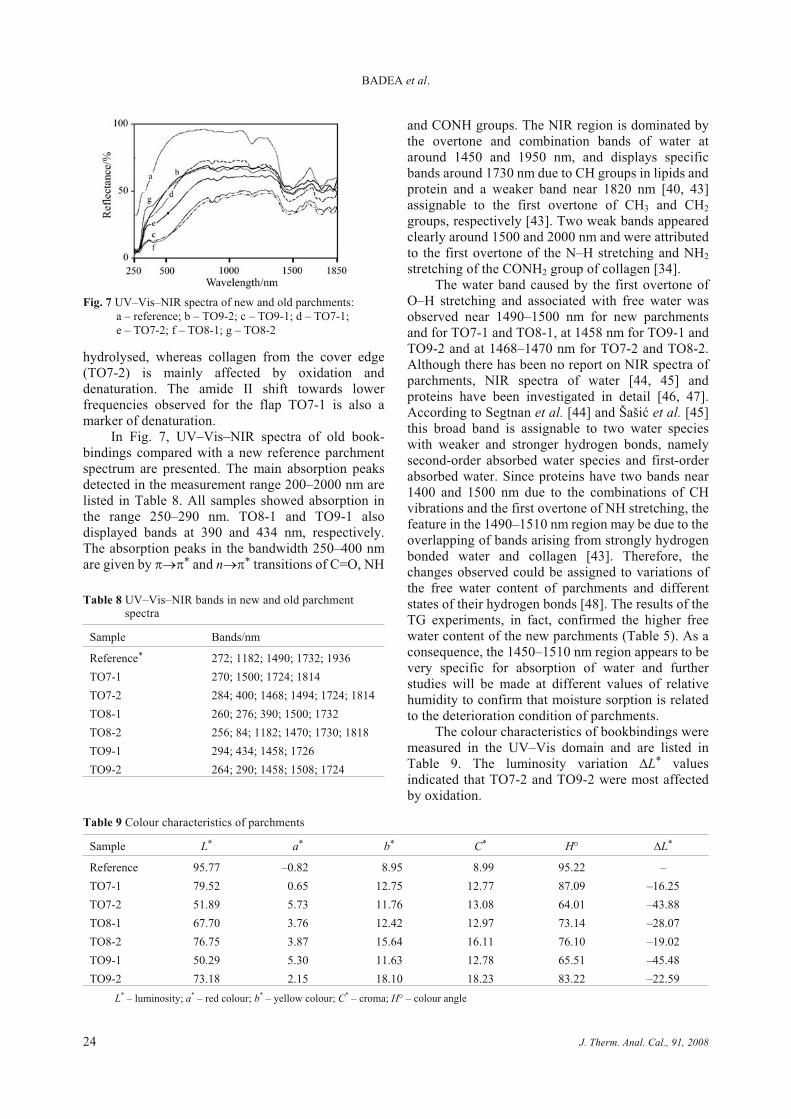
In Fig. 7, UV–Vis–NIR spectra of old book-
bindings compared with a new reference parchment
spectrum are presented. The main absorption peaks
detected in the measurement range 200–2000 nm are
listed in Table 8. All samples showed absorption in
the range 250–290 nm. TO8-1 and TO9-1 also
displayed bands at 390 and 434 nm, respectively.
The absorption peaks in the bandwidth 250–400 nm
are given by * and n* transitions of C=O, NH
and CONH groups. The NIR region is dominated by
the overtone and combination bands of water at
around 1450 and 1950 nm, and displays specific
bands around 1730 nm due to CH groups in lipids and
protein and a weaker band near 1820 nm [40, 43]
assignable to the first overtone of CH3 and CH2
groups, respectively [43]. Two weak bands appeared
clearly around 1500 and 2000 nm and were attributed
to the first overtone of the N–H stretching and NH2
stretching of the CONH2 group of collagen [34].
The water band caused by the first overtone of
O–H stretching and associated with free water was
observed near 1490–1500 nm for new parchments
and for TO7-1 and TO8-1, at 1458 nm for TO9-1 and
TO9-2 and at 1468–1470 nm for TO7-2 and TO8-2.
Although there has been no report on NIR spectra of
parchments, NIR spectra of water [44, 45] and
proteins have been investigated in detail [46, 47].
According to Segtnan et al. [44] and �a�i� et al. [45]
this broad band is assignable to two water species
with weaker and stronger hydrogen bonds, namely
second-order absorbed water species and first-order
absorbed water. Since proteins have two bands near
1400 and 1500 nm due to the combinations of CH
vibrations and the first overtone of NH stretching, the
feature in the 1490–1510 nm region may be due to the
overlapping of bands arising from strongly hydrogen
bonded water and collagen [43]. Therefore, the
changes observed could be assigned to variations of
the free water content of parchments and different
states of their hydrogen bonds [48]. The results of the
TG experiments, in fact, confirmed the higher free
water content of the new parchments (Table 5). As a
consequence, the 1450–1510 nm region appears to be
very specific for absorption of water and further
studies will be made at different values of relative
humidity to confirm that moisture sorption is related
to the deterioration condition of parchments.
The colour characteristics of bookbindings were
measured in the UV–Vis domain and are listed in
Table 9. The luminosity variation �L* values
indicated that TO7-2 and TO9-2 were most affected
by oxidation.
24 J. Therm. Anal. Cal., 91, 2008
BADEA et al.
Fig. 7 UV–Vis–NIR spectra of new and old parchments:
a – reference; b – TO9-2; c – TO9-1; d – TO7-1;
e – TO7-2; f – TO8-1; g – TO8-2
Table 8 UV–Vis–NIR bands in new and old parchmentspectra
Sample Bands/nm
Reference* 272; 1182; 1490; 1732; 1936
TO7-1 270; 1500; 1724; 1814
TO7-2 284; 400; 1468; 1494; 1724; 1814
TO8-1 260; 276; 390; 1500; 1732
TO8-2 256; 84; 1182; 1470; 1730; 1818
TO9-1 294; 434; 1458; 1726
TO9-2 264; 290; 1458; 1508; 1724
Table 9 Colour characteristics of parchments
Sample L* a* b* C* H° �L*
Reference 95.77 –0.82 8.95 8.99 95.22 –
TO7-1 79.52 0.65 12.75 12.77 87.09 –16.25
TO7-2 51.89 5.73 11.76 13.08 64.01 –43.88
TO8-1 67.70 3.76 12.42 12.97 73.14 –28.07
TO8-2 76.75 3.87 15.64 16.11 76.10 –19.02
TO9-1 50.29 5.30 11.63 12.78 65.51 –45.48
TO9-2 73.18 2.15 18.10 18.23 83.22 –22.59
L* – luminosity; a* – red colour; b* – yellow colour; C* – croma; H° – colour angle

Scanning electron microscopy
SEM has provided a large collection of local high
resolution images of the surface morphology of
parchments for assessment of their surface state. For
new undamaged parchment, a network of integral
collagen fibres with distinct contours and sharp
edges (Fig. 8a) was clearly observed on the flesh
side, whereas ageing/deterioration resulted in
alteration of shape, dimensions and aspect until
partial or complete loss of the fibrous network
characteristics (Figs 8b to f) [12, 13, 19]. SEM
images reported here are solely concerned with the
surface of samples and their evaluation is based on
our morphological criteria for ranking damage in
historical parchments [12, 13, 15, 19]. Nonetheless,
SEM observations correlate well with DSC results
which essentially refer to bulk properties, e.g. the
bundling of collagen fibrils displayed by TO7-1
(Fig. 8e), its high Td value (Table 4) and single
melting peak (Table 2) all assign its high crystal-
linity and cross-linkage. Moreover, gelatinisation
process observed for TO9-1 (glassy layer) and
TO7-2 (swollen fibres) is underscored by the pres-
ence of small, broad DSC peaks in the range 20 to
40°C (Fig. 4). The information obtained with SEM
correlates well with molecular data from spectro-
scopic analysis, too, e.g. the very fragmented surface
observed for TO8-1 sample agrees with its high
hydrolysis level indicated by the IR markers.
Unilateral nuclear magnetic resonance with anNMR ProFiler
Unilateral NMR is a nondestructive technique used
for in situ qualitative measurements of alteration of
the water environment which can be applied to water
within parchments. As a first step, the independency
of T1 values (around 45 ms) on the origin of the new,
undamaged parchments was assessed. We have
previously found that humid heating results in T1
shortening, consistent with water interacting with
partially gelatinised collagen [15]. Conversely,
treatments in atmospheres polluted with NOx or SO2
brought out higher T1 values, as a result of water
mobility increase due to the acid hydrolytic cleavage
of collagen polypeptide chains [15]. Since the
H-bonding ability of a parchment varies with its
structural and organisational integrity, aged and
deteriorated samples are expected to give rise to
proton fractions with different spin-lattice relaxation
times. Various T1 values indicative of different water
environments were, in fact, obtained for the old
bookbindings (Table 10), in fair agreement with the
deterioration pathways deduced from the DSC, SEM
and IR results [49].
Correlations between the thermal analysis resultsand data obtained by spectroscopy, SEM andunilateral NMR
It should be stressed that damage to collagen may be
variously distributed throughout its hierarchical
organisation. The techniques used in this paper give
information on specific alterations at different
structural levels of parchment whose correlation can
account for the progress of deterioration from
molecular to fibre level. For example, gelatinisation,
frequently found in historical parchments, occurs
when the triple helix of collagen molecules unravels
to form a random coil. The evolution of deterioration
from a fibrous into a gelatine-like state generally
J. Therm. Anal. Cal., 91, 2008 25
STUDY OF DETERIORATION OF HISTORICAL PARCHMENTS BY VARIOUS TA TECHNIQUES
Fig. 8 High magnification SEM images showing typical
morphology of old bookbindings by comparison with a
new undamaged parchment: a – intact fibre network
(flesh side); b – bundled-up fibres; c – swollen and
spaced fibres; d – fragmented surface; e – fibres
beneath melt-like layer; f – glassy surface
Table 10 NMR longitudinal relaxation time, T1, for oldbookbindings
Sample
T1/ms
Gelatinizedcollagen
Swollencollagen
Hydrolyzedcollagen
TO7-1 32.5
TO7-2 * 19.1
TO8-1 * 18.4 �
TO8-2 * 27.1
TO9-1 * 15.7
TO9-2 31.8
*Short T1 component revealed. �Long T1 component
revealed
leads to irreversible damage. While the macroscopic
assessment of parchment does not detect the
occurrence and progress of gelatinisation, our
techniques distinguish and localise the level where it
manifests. The presence of disordered structures is
indicated by high values of IR denaturation marker
�v, by the low �dH and high �T1/2 values, as well as
by low spin-lattice relaxation time T1. Moreover, the
glassy surface observed by SEM can be regarded as
an early sign of gelatinisation.
Hydrolytic processes are individuated by high
AI/AII and AOH/AI ratio values, low hydrothermal
stability and high T1 value. Furthermore, the decrease
of hydrothermal stability accompanied by the
formation of carbonyl compounds, presence of
methionine oxidation derivatives and concomitant
reduction of CH2 and CH3 stretching contribu-
tions [15] should be considered as arising from
chemical changes in the peptide chain produced by
oxidative breakdown. On the other hand, a high
hydrothermal stability, an increased contribution of
the DSC peak shoulder to the enthalpy of denatur-
ation and a high degree of crystallinity suggest form-
ation of cross links within the collagen structure. It
has been shown that in some cases lipids appear to
evince a great degree of crystallinity [50]. Thus, when
oxidation markers are also present, specific collagen-
lipid interactions may be presumed.
Conclusions
In summary, thermal analysis, and especially DSC
measurements, and the other physical-chemical
techniques we used examined a number of micro-,
meso- and molecular features in parchment. These
techniques were employed to evaluate deterioration
due to ageing for a series of bookbindings from the
Historical Archives of the City of Turin. A number of
thermodynamic, chemical and structural markers
were proposed to describe the main deterioration
pathways.
TO7-2 (back cover edge) has a more heterogenous
structure than TO7-1 (flap) as indicated by the melting
behaviour of its crystalline fraction (2–3 peaks). DSC
peaks shape and parameter values suggested a lower
hydrothermal stability for TO7-2 and IR markers
indicated its oxidation and denaturation. Earlier
gelatinisation of TO7-2 was revealed by DSC in excess
water and by SEM, while crosslink formation could be
invoked for the more stable TO7-1 sample.
TO8-1 (front cover), appears to be seriously
degraded in the light of its very low hydrothermal
stability, very high value of DSC peak half-width,
low crystallinity and high degree of hydrolysis.
TO8-2 (flap) has shown higher level of oxidation and
cross-links, but lower denaturation and hydrolysis
and appears less deteriorated.
TO9-1 (front cover) has shown a higher degree
of hydrolysis and heterogeneity by comparison with
TO9-2 (flap) which, on the other hand, has displayed
a more extensive denaturation process. Gelatinisation
was observed by SEM for TO9-1 and cross-link
formation can be supposed for TO9-2, as from its high
thermal stability and crystallinity.
In conclusion, our findings pointed to deduce a
strong loss and randomisation of the helical structure for
outer covers, a higher crosslink formation for flaps and a
significant oxidation and gelatinisation for edges.
Acknowledgements
This research was funded by European Union Fifth
Framework project EVK4-2001-00067, Improved Damage
Assessment of Parchment (IDAP) and by the Italian Piedmont
Region project D39, Old Parchment: Evaluating Restoration
and Analysis (OPERA). The enthusiastic collaboration of
Stefano Benedetto and Anna Braghieri from the Historical
Archives of the City of Turin is warmly acknowledged.
References
1 A. Rich and F. H. C. Crick, J. Mol. Biol., 3 (1961) 483.
2 R. D. B. Fraser, T. P. MacRae and E. Suzuki, J. Mol.
Biol., 129 (1979) 463.
3 B. Brodsky and E. F. Eikenberry, Method Enzymol.,
82 (1982) 127.
4 J. Bella, M. Eaton, B. Brodsky and H. M. Barman,
Science, 266 (1994) 75.
5 C. A. Miles and A. J. Bailey, Micron, 32 (2001) 325.
6 T. J. Wess, M. Drakopoulos, A. Snigirev, J. Wouters,
O. Paris, P. Fratzl, M. Collins, J. Hiller and K. Nielsen,
Archaeometry, 43 (2001) 117.
7 C. J. Kennedy and T. J. Wess, Restaurator, 24 (2003) 61.
8 E. Mannucci, R. Pastorelli, G. Zerbi, C. E. Bottani and
A. Facchini, J. Raman Spectrosc., 31 (2000) 1089.
9 A. E. Aliev, Biopolymers, 77 (2005) 230.
10 C. A. Maxwell, T. J. Wess and C. J. Kennedy,
Biomacromolecules, 7 (2006) 2321.
11 P. Budrugeac, L. Miu, V. Bocu, F. J. Wortman and
C. Popescu, J. Therm. Anal. Cal., 72 (2003) 1057.
12 G. Della Gatta, E. Badea, R. Ceccarelli, T. Usacheva,
A. Ma�i� and S. Coluccia, J. Therm. Anal. Cal.,
82 (2005) 637.
13 A. Ma�i�, E. Badea, R. Ceccarelli, G. Della Gatta and
S. Coluccia, in ‘Lo Stato dell’Arte 2’, Proceedings II
Congresso Nazionale IGIIC, Il Prato, Padova 2004,
ISBN 88-87243-94-8, pp. 52–57.
14 A. Meghea, M. Giurginca, N. Iftimie, L. Miu, V. Bocu and
P. Budrugeac, Mol. Cryst. Liq. Cryst., 418 (2004) 285.
15 G. Della Gatta, E. Badea, A. Ma�i� and R. Ceccarelli,
in ‘Improved Damage Assessment of Parchment (IDAP)
Collection and Sharing of Knowledge.’ Ed. R. Larsen,
Directorate-General for Research, Directorate
26 J. Therm. Anal. Cal., 91, 2008
BADEA et al.

Environment, European Communities 2007,
ISBN 987-92-79-05378-8, pp. 51–60.
16 B. Roduit and M. Odlyha, J. Therm. Anal. Cal.,
85 (2006) 157.
17 J. Pires and A. J. Cruz, J. Therm. Anal. Cal.,
87 (2007) 411.
18 R. Larsen, D.V. Poulsen and M. Vest, in ‘Microanalysis of
Parchment’, Ed. R. Larsen, Archetype Publications Ltd.,
London 2002, pp. 55–62.
19 A. Ma�i�, Doctoral Dissertation: Applicazione di tecniche
innovative nello studio dei processi di degrado dei
manufatti di interese artistico-culturale, University of
Turin, Turin, 2006.
20 D. Fessas, M. Signorelli and A. Schiraldi, Thermochim.
Acta, 447 (2006) 30.
21 C. E. Weir, J. Am. Leather Chem. Assoc., 44 (1949) 108.
22 C. Delisi and M. H. Shamos, J. Polym. Sci.,
10 (1972) 673.
23 M. Luescher, M. Rueff and P. Schindler, Polymers,
13 (1974) 2489.
24 Y. Okamoto and K. Saeki, Kolloid-Z., Z. Polym.,
194 (1964) 124.
25 D. J. Hulmes, T. J. Wess, D. J. Prockop and P. Fratzl,
Biophys. J., 68 (1995) 1661.
26 C. J. Kennedy, K. Nielsen, L. Ramsay and T. J. Wess,
Fibre Diffr. Rev., 11 (2003) 117.
27 P. Budrugeac, L. Miu and M. Souckova, J. Therm. Anal.
Cal., 88 (2007) 693.
28 W. K. Loke and E. Khor, Biomaterials, 16 (1995) 251.
29 C. Chahine, Thermochim. Acta, 365 (2000) 101.
30 P. Kronick, B. Maleeff and R. Carroll, Connect. Tissue
Res., 18 (1988) 123.
31 D. G. Wallace, R. A. Condell, J. W. Donovan, A. Paivinen
and W. M. Rhee, Biopolymers, 25 (1986) 1875.
32 T. Gutsmann, G. E. Fantner, M. Venturoni,
A. Ekani-Nkodo, J. B. Thompson, J. H. Kindt, D. E.
Morse, D. Kuchnir Fygenson and P. K. Hansma, Biophys.
J., 84 (2003) 2593.
33 R. Larsen, D. V. Poulsen, F. Juchauld, H. Herosch,
M. Odlyha, J. de Groot, T. Wess, J. Hill, C. Kennedy,
G. Della Gatta, E. Badea, A. Ma�i�, S. Boghosian and
D. Fessas, in Preprints of ICOM Committee for
Conservation 14th Triennial Meeting, The Hague,
James and James Ed., London 2005, ISBN 1-84407-253-3,
Vol. 1, pp. 199–208.
34 E. Badea, A. Ma�i�, L. Miu, C. Laurora, A. Braghieri,
V. E. Marinescu, S. Coluccia and G. Della Gatta, in
‘Lo Stato dell’Arte 5’, Nardini Editore, Firenze 2007,
ISBN 978-88-404-4156-6, pp. 101–108.
35 J. J. Lim and M. H. Shannon, Biopolymers, 13 (1974) 1791.
36 G. de Simone, B. Naviglio, M. Tomaselli, L. Bianchi,
D. Sannino and P. Ciambelli, XXIII IULTCS Congress,
Friedrichshafen 1995, Part 1, Paper 21.
37 A. Kaminska and A. Siokowska, Polym. Degrad. Stab.,
51 (1996) 15.
38 L. F. Lozano, M. A. Pena-Rico, A. Hereira,
J. Ocotlan-Flores, A. Gomez-Cortes, R. Velazquez,
I. A. Belio and L. Bucio, J. Mater. Sci., 38 (2003) 4777.
39 P. Budrugeac, L. Miu, C. Popescu and F. J. Wortmann,
J. Therm. Anal. Cal., 79 (2004) 975.
40 B. Brodsky-Doyle, E. G. Bendit and E. R. Blout,
Biopolymers, 14 (1975) 937.
41 M. Derrick, Book and Paper Group Annual, The American
Institute for Conservation, Vol. 10, Washington D.C.,
1991.
42 A. T. Balaban, M. Banciu and I. Pogany, ‘Application of
physics methods in organic chemistry’, Ed. �tiin�ific�� i
Enciclopedic�, Bucure�ti, 193.
43 H. M. Heise, In Infrared and Raman Spectroscopy of
Biological Materials; H. U. Gremlich, B. Yan Eds; Marcel
Dekker: New York 2000.
44 V.H. Segtnan, S. �a�i�, T. Issaksson and Y. Ozaki, Anal.
Chem., 73 (2001) 3153.
45 S. �a�i�, V. H. Segtnan and Y. Ozaki, J. Phys. Chem. A,
106 (2002) 760.
46 Y. Wang, K. Murayama, Y. Myojo, R. Tsenkova,
H. Hayashi and Y. Ozaki, J. Phys. Chem. B,
102 (1998) 6655.
47 Y. Wu, B. Czarnik-Matsusewicz, K. Murayama and
Y. Ozaki, J. Phys. Chem. B, 104 (2000) 5840.
48 M. Egawa, T. Fukuhara, M. Takahashi and Y. Ozaki,
Appl. Spectrosc., 57 (2003) 473.
49 A. Ma�i�, E. Badea, G. Martra and S. Coluccia,
Nanoletters, submitted.
50 C. J. Kennedy, J. C. Hiller, D. Lammie, M. Drakopolos,
M. Vest, M. Cooper, W. P. Adderley and T. J. Wess,
Nanoletters, 4/8 (2004) 1373.
DOI: 10.1007/s10973-007-8513-x
J. Therm. Anal. Cal., 91, 2008 27
STUDY OF DETERIORATION OF HISTORICAL PARCHMENTS BY VARIOUS TA TECHNIQUES