Structure of Self-Aggregated Alamethicin in ePC Membranes Detected by Pulsed Electron-Electron...
13
Structure of Self-Aggregated Alamethicin in ePC Membranes Detected by Pulsed Electron-Electron Double Resonance and Electron Spin Echo Envelope Modulation Spectroscopies Alexander D. Milov, † Rimma I. Samoilova, † Yuri D. Tsvetkov, † Marta De Zotti, ‡ Fernando Formaggio, ‡ Claudio Toniolo, ‡ Jan-Willem Handgraaf, § and Jan Raap { * † Institute of Chemical Kinetics and Combustion, Novosibirsk, 630090 Russian Federation; ‡ Institute of Biomolecular Chemistry, CNR, Padova Unit, Department of Chemistry, University of Padova, 35131 Padova, Italy; § Culgi B.V., Leiden, The Netherlands; and { Leiden Institute of Chemistry, Gorlaeus Laboratories, Leiden University, Leiden, The Netherlands ABSTRACT PELDOR spectroscopy was exploited to study the self-assembled super-structure of the [Glu(OMe) 7,18,19 ]alame- thicin molecules in vesicular membranes at peptide to lipid molar ratios in the range of 1:70–1:200. The peptide molecules were site-specifically labeled with TOAC electron spins. From the magnetic dipole-dipole interaction between the nitroxides of the monolabeled constituents and the PELDOR decay patterns measured at 77 K, intermolecular-distance distribution functions were obtained and the number of aggregated molecules (n z 4) was estimated. The distance distribution functions exhibit a similar maximum at 2.3 nm. In contrast to Alm16, for Alm1 and Alm8 additional maxima were recorded at 3.2 and ~5.2 nm. From ESEEM experiments and based on the membrane polarity profiles, the penetration depths of the different spin-labeled positions into the membrane were qualitatively estimated. It was found that the water accessibility of the spin-labels follows the order TOAC-1 > TOAC-8 z TOAC-16. The geometric data obtained are discussed in terms of a penknife molecular model. At least two peptide chains are aligned parallel and eight ester groups of the polar Glu(OMe) 18,19 residues are suggested to stabilize the self-aggregate superstructure. INTRODUCTION Alamethicin is a peptide containing 19 amino acid residues and a 1,2-aminoalcohol (phenylalaninol) at the C-terminus. Interest in this antibiotic molecule (1) is generated by its ability to change the permeability of biological membranes by forming voltage-gated conductive channels (2). From studies on the concentration dependence of the conductances, it is known that 2–11 alamethicin molecules are involved in the transport of small metal cations through the membrane barrier (3,4). It is generally believed that the conducting state consists of amphipathic helical molecules that are associated in a transmembrane array forming the lining of an aqueous pore through which ions permeate. It is also assumed that the observation of multiple conductance states is related to changes in the size of the aggregate. The process of opening and closing the channels has been suggested to be based on the electric macro-dipole-dipole interactions between the individual helical peptide molecules in the closed channel and the effect of the membrane potential on the reorientation of the peptide dipoles to a parallel bundle of helices in the open channel. In the absence of charged peptide side chains, the helix dipole is the only source of electrostatic interaction with the membrane potential (4). The dipole moment of 75 Debye corresponds to a net charge of þ1/2 charge at the N and a 1/2 charge at the C-terminus of the helix. Three main models have been proposed to explain the molecular mechanism of the voltage gating. The peptide undergoes a voltage dependent reorientation either from a surface to a transmembrane orientation (3,5,6) or from an antiparallel to a parallel type of association (7). The peptide might also associate with the N-terminal helical domain inserted into the membrane as a barrel stave array, thereby leaving the nonhelical C-terminus outside the membrane, whereas the voltage-dependent step is thought to force the peptide bundle further into the membrane by extension of the helical conformation to the whole peptide chain (8–10). In the absence of a membrane voltage, alamethicin is also capable to induce a liposomal leakage of carboxy fluorescein loaded vesicles (11). It was shown that water-membrane partition and aggregation phenomena are major determinants of the membrane activity of antimicrobial peptides. Even the transport of bulkier organic ions, like N a -benzoyl-L-arginine- para-nitroanilide, was found to be induced by the membrane perturbing activity of alamethicin (12). In contrast to the transport of metal ions through multimeric peptide channels, the transport of N a -benzoyl-L-arginine-para-nitroanilide is facilitated by monomeric alamethicin molecules. Submitted September 22, 2008, and accepted for publication January 15, 2009. *Correspondence: [email protected] Abbreviations used: Aib, a-aminoisobutyric acid; Alm-n, [Glu(OMe) 7,18,19 ]- TOAC spin-labeled alamethicin F50/5 at the nth position of the peptide sequence; cw, continuous wave; diPhPC, diphytanoylphosphocholine; DOPC, 1,2-dioleoyl-sn-glycero-3-phosphocholine; ePC, egg L-a-phosphati- dylcholine; ESR, electron spin resonance; ESEEM, electron spin echo enve- lope modulation; Glu(OMe), g-methyl ester of glutamic acid; LMV, large multilamellar vesicle; PELDOR, pulsed electron-electron double resonance; Phl, phenylalaninol; P/L, peptide to lipid; POPC, 1-palmitoyl-2-oleoyl-sn- glycero-3-phosphocholine; TOAC, 2,2,6,6-tetramethylpiperidine-1-oxyl-4- amino-4-carboxylic acyl; VMD, visual molecular dynamics. Editor: David D. Thomas. Ó 2009 by the Biophysical Society 0006-3495/09/04/3197/13 $2.00 doi: 10.1016/j.bpj.2009.01.026 Biophysical Journal Volume 96 April 2009 3197–3209 3197
-
Upload
independent -
Category
Documents
-
view
1 -
download
0
Transcript of Structure of Self-Aggregated Alamethicin in ePC Membranes Detected by Pulsed Electron-Electron...
Biophysical Journal Volume 96 April 2009 3197–3209 3197
Structure of Self-Aggregated Alamethicin in ePC Membranes Detectedby Pulsed Electron-Electron Double Resonance and Electron SpinEcho Envelope Modulation Spectroscopies
Alexander D. Milov,† Rimma I. Samoilova,† Yuri D. Tsvetkov,† Marta De Zotti,‡ Fernando Formaggio,‡
Claudio Toniolo,‡ Jan-Willem Handgraaf,§ and Jan Raap{*†Institute of Chemical Kinetics and Combustion, Novosibirsk, 630090 Russian Federation; ‡Institute of Biomolecular Chemistry, CNR, PadovaUnit, Department of Chemistry, University of Padova, 35131 Padova, Italy; §Culgi B.V., Leiden, The Netherlands; and {Leiden Institute ofChemistry, Gorlaeus Laboratories, Leiden University, Leiden, The Netherlands
ABSTRACT PELDOR spectroscopy was exploited to study the self-assembled super-structure of the [Glu(OMe)7,18,19]alame-thicin molecules in vesicular membranes at peptide to lipid molar ratios in the range of 1:70–1:200. The peptide molecules weresite-specifically labeled with TOAC electron spins. From the magnetic dipole-dipole interaction between the nitroxides of themonolabeled constituents and the PELDOR decay patterns measured at 77 K, intermolecular-distance distribution functionswere obtained and the number of aggregated molecules (n z 4) was estimated. The distance distribution functions exhibita similar maximum at 2.3 nm. In contrast to Alm16, for Alm1 and Alm8 additional maxima were recorded at 3.2 and ~5.2 nm.From ESEEM experiments and based on the membrane polarity profiles, the penetration depths of the different spin-labeledpositions into the membrane were qualitatively estimated. It was found that the water accessibility of the spin-labels followsthe order TOAC-1 > TOAC-8 z TOAC-16. The geometric data obtained are discussed in terms of a penknife molecular model.At least two peptide chains are aligned parallel and eight ester groups of the polar Glu(OMe)18,19 residues are suggested tostabilize the self-aggregate superstructure.
doi: 10.1016/j.bpj.2009.01.026
INTRODUCTION
Alamethicin is a peptide containing 19 amino acid residues
and a 1,2-aminoalcohol (phenylalaninol) at the C-terminus.
Interest in this antibiotic molecule (1) is generated by its
ability to change the permeability of biological membranes
by forming voltage-gated conductive channels (2). From
studies on the concentration dependence of the conductances,
it is known that 2–11 alamethicin molecules are involved in
the transport of small metal cations through the membrane
barrier (3,4). It is generally believed that the conducting state
consists of amphipathic helical molecules that are associated
in a transmembrane array forming the lining of an aqueous
pore through which ions permeate. It is also assumed that
the observation of multiple conductance states is related to
changes in the size of the aggregate. The process of opening
and closing the channels has been suggested to be based on
the electric macro-dipole-dipole interactions between the
Submitted September 22, 2008, and accepted for publication January 15,
2009.
*Correspondence: [email protected]
Abbreviations used: Aib, a-aminoisobutyric acid; Alm-n, [Glu(OMe)7,18,19]-
TOAC spin-labeled alamethicin F50/5 at the nth position of the peptide
sequence; cw, continuous wave; diPhPC, diphytanoylphosphocholine;
DOPC, 1,2-dioleoyl-sn-glycero-3-phosphocholine; ePC, egg L-a-phosphati-
dylcholine; ESR, electron spin resonance; ESEEM, electron spin echo enve-
lope modulation; Glu(OMe), g-methyl ester of glutamic acid; LMV, large
multilamellar vesicle; PELDOR, pulsed electron-electron double resonance;
Phl, phenylalaninol; P/L, peptide to lipid; POPC, 1-palmitoyl-2-oleoyl-sn-
glycero-3-phosphocholine; TOAC, 2,2,6,6-tetramethylpiperidine-1-oxyl-4-
amino-4-carboxylic acyl; VMD, visual molecular dynamics.
Editor: David D. Thomas.
� 2009 by the Biophysical Society
0006-3495/09/04/3197/13 $2.00
individual helical peptide molecules in the closed channel
and the effect of the membrane potential on the reorientation
of the peptide dipoles to a parallel bundle of helices in the
open channel. In the absence of charged peptide side chains,
the helix dipole is the only source of electrostatic interaction
with the membrane potential (4). The dipole moment of
75 Debye corresponds to a net charge of þ1/2 charge at the
N� and a �1/2 charge at the C-terminus of the helix.
Three main models have been proposed to explain the
molecular mechanism of the voltage gating. The peptide
undergoes a voltage dependent reorientation either from a
surface to a transmembrane orientation (3,5,6) or from an
antiparallel to a parallel type of association (7). The peptide
might also associate with the N-terminal helical domain
inserted into the membrane as a barrel stave array, thereby
leaving the nonhelical C-terminus outside the membrane,
whereas the voltage-dependent step is thought to force the
peptide bundle further into the membrane by extension of
the helical conformation to the whole peptide chain (8–10).
In the absence of a membrane voltage, alamethicin is also
capable to induce a liposomal leakage of carboxy fluorescein
loaded vesicles (11). It was shown that water-membrane
partition and aggregation phenomena are major determinants
of the membrane activity of antimicrobial peptides. Even the
transport of bulkier organic ions, like Na-benzoyl-L-arginine-
para-nitroanilide, was found to be induced by the membrane
perturbing activity of alamethicin (12). In contrast to the
transport of metal ions through multimeric peptide channels,
the transport of Na-benzoyl-L-arginine-para-nitroanilide is
facilitated by monomeric alamethicin molecules.
3198 Milov et al.
To understand the mechanism of ion channel and
membrane leakage activities it is thus of interest not only
to study the process of self-aggregation of alamethicin
molecules in phospholipid bilayers, but also to determine
the relative orientation of the peptide helices in the aggre-
gate. In addition, the nature of self-association of helical
peptides may provide information on the factors governing
helix-helix association in membrane proteins. However,
despite extensive research, our current understanding of the
process of channel formation at the molecular level remains
far from complete.
Solid-state NMR shed light on the 3D-structure of
individual peptide molecules in the membrane-bound state
(13–16). X-ray and neutron diffraction techniques have given
information about the structure factor of the pore fluid,
the influence of peptide on the phase and thickness of the
membrane (17–24). Continuous wave ESR, together with
paramagnetic spin-labeling techniques, has been used to
study the molecular characteristics of alamethicin in lipid
membranes (25–28). Above the lipid melting temperature,
the transmembrane oriented alamethicin molecules were
found not to be aggregated (26). However, below the transition
temperature, the molecules appear to self-assemble. It was
suggested that at room temperature ionic conductances arise
from transient or voltage-induced molecular associations.
PELDOR is a reliable technique to measure interspin
distances in the range of 1.5–8.0 nm. This technique allows
one to obtain information about the length and the length-
related secondary structure of a peptide from the magnetic
dipole-dipole interaction between the nitroxide electrons of
a double labeled peptide (29,30). A recent application of
PELDOR to membrane-bound aggregated alamethicin mole-
cules, each of them spin-labeled at both positions 1 and 16,
allowed us to extract an intramolecular distance of 2.1 nm,
which agrees with the distance in an approximately regular
a-helical conformation, at least for the segment 1–16 (31).
However, if a monolabeled peptide is used, this technique
provides information about the number of molecules as well
as the intermolecular distances between the labels of the
aggregate in hydrophobic solvents, which are assumed to
mimic the interior of the lipid bilayer (32,33). The success
of the latter approach was also shown in a preliminary
PELDOR study of TOAC-labeled Alm in ePC membranes
at 77 K (34). The number of molecules in the aggregate
was determined and the intermolecular distance distribution
function between the nitroxide radicals of the aggregated
molecules was obtained.
The goal of this study is to elucidate the supramolecular
structure of the alamethicin aggregate, in particular the
relative orientations of the self-associated helical molecules
and their orientation relative to the membrane surface, in
membranes of LMV in the absence of an applied transmem-
brane voltage. This goal is achieved by site-specific
spin-labeling of [Glu(OMe)7,18,19] alamethicin F50/5: Ac-
Aib–Pro-Aib-Ala-Aib-Ala-Glu(OMe)-Aib-Val-Aib-Gly-Leu-
Biophysical Journal 96(8) 3197–3209
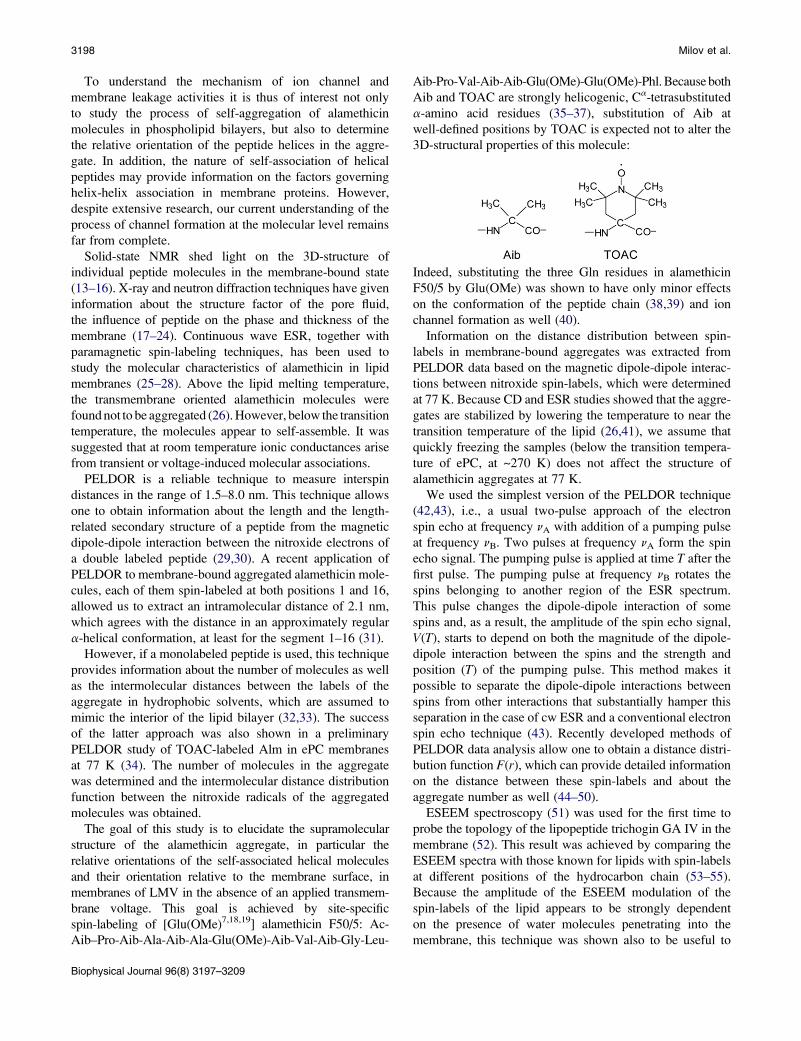
Aib-Pro-Val-Aib-Aib-Glu(OMe)-Glu(OMe)-Phl. Because both
Aib and TOAC are strongly helicogenic, Ca-tetrasubstituted
a-amino acid residues (35–37), substitution of Aib at
well-defined positions by TOAC is expected not to alter the
3D-structural properties of this molecule:
Indeed, substituting the three Gln residues in alamethicin
F50/5 by Glu(OMe) was shown to have only minor effects
on the conformation of the peptide chain (38,39) and ion
channel formation as well (40).
Information on the distance distribution between spin-
labels in membrane-bound aggregates was extracted from
PELDOR data based on the magnetic dipole-dipole interac-
tions between nitroxide spin-labels, which were determined
at 77 K. Because CD and ESR studies showed that the aggre-
gates are stabilized by lowering the temperature to near the
transition temperature of the lipid (26,41), we assume that
quickly freezing the samples (below the transition tempera-
ture of ePC, at ~270 K) does not affect the structure of
alamethicin aggregates at 77 K.
We used the simplest version of the PELDOR technique
(42,43), i.e., a usual two-pulse approach of the electron
spin echo at frequency nA with addition of a pumping pulse
at frequency nB. Two pulses at frequency nA form the spin
echo signal. The pumping pulse is applied at time T after the
first pulse. The pumping pulse at frequency nB rotates the
spins belonging to another region of the ESR spectrum.
This pulse changes the dipole-dipole interaction of some
spins and, as a result, the amplitude of the spin echo signal,
V(T), starts to depend on both the magnitude of the dipole-
dipole interaction between the spins and the strength and
position (T) of the pumping pulse. This method makes it
possible to separate the dipole-dipole interactions between
spins from other interactions that substantially hamper this
separation in the case of cw ESR and a conventional electron
spin echo technique (43). Recently developed methods of
PELDOR data analysis allow one to obtain a distance distri-
bution function F(r), which can provide detailed information
on the distance between these spin-labels and about the
aggregate number as well (44–50).
ESEEM spectroscopy (51) was used for the first time to
probe the topology of the lipopeptide trichogin GA IV in the
membrane (52). This result was achieved by comparing the
ESEEM spectra with those known for lipids with spin-labels
at different positions of the hydrocarbon chain (53–55).
Because the amplitude of the ESEEM modulation of the
spin-labels of the lipid appears to be strongly dependent
on the presence of water molecules penetrating into the
membrane, this technique was shown also to be useful to

Alamethicin Channel Structure 3199
estimate the membrane immersion depths of the spin-labels
at different positions along the peptide chain.
In this study, the PELDOR study provides, to our knowl-
edge, the first piece of experimental evidence for an approx-
imately parallel alignment of ~4 aggregated alamethicin
molecules in frozen ePC membranes. We report on the water
accessibility of the same set of alamethicin analogs in ePC
membranes. The geometrical results will be discussed
according to a plausible penknife model.
MATERIALS AND METHODS
Materials
The solution synthesis and characterization of the TOAC spin-labeled
[Glu(OMe)7,18,19] alamethicins studied in this study are described elsewhere
(56). The lipid extracted from egg-yolk (a mixture of phosphocholine lipids
composed of C16:0/18:1 lipids as the major components) was purchased
from Sigma (St. Louis, MO). Samples of LMV were prepared as described
in Szoka and Papahadjopoulos (57). The complete sequences of the three
peptides are:
Alm1: Ac-TOAC–Pro-Aib-Ala-Aib-Ala-Glu(OMe)-Aib-Val-Aib-Gly-
Leu-Aib-Pro-Val-Aib-Aib-Glu(OMe)-Glu(OMe)-Phl;
Alm8: Ac-Aib–Pro-Aib-Ala-Aib-Ala-Glu(OMe)-TOAC-Val-Aib-Gly-
Leu-Aib-Pro-Val-Aib-Aib-Glu(OMe)-Glu(OMe)-Phl; and
Alm16: Ac-Aib-Pro-Aib-Ala-Aib-Ala-Glu(OMe)-Aib-Val-Aib-Gly-
Leu-Aib-Pro-Val-TOAC-Aib-Glu(OMe)-Glu(OMe)-Phl.
Sample preparation
Lipid and peptide mixtures at chosen P/L molar ratios were dissolved in
chloroform. The solvent was removed by flush-drying with argon gas fol-
lowed by high vacuum pumping at room temperature for 30 min. Note that
at this stage alamethicin does not aggregate (32). After addition of the buffer
[20 mM Tris$HCl buffer containing 140 mM NaCl and 1 mM EDTA (pH
7.0)] to the lipid film, the dispersion was equilibrated under argon at 4�Sduring 12 h for complete lipid hydration. A milky suspension of LMVs
formed by a three-stage procedure of freezing, thawing and vortexing the
hydrated lipid. To find the dependence of the V(T) decay on the concentration
of the spin-labeled sample, each of them was studied at different P/L ratios
(1:70–1:200). The samples in ampules of 5 mm diameter containing ~80 ml
of suspension were quickly frozen in liquid nitrogen and then used in the ESR
and PELDOR measurements. Salnikov et al. (52) showed that the results of
similar experiments do not depend on the speed of freezing. Three sets of
experiments, which were carried out at different peptide concentrations,
showed reproducible results.
ESR, PELDOR, and ESEEM spectroscopies
Continuous wave ESR spectra were recorded on an ESP-380 Bruker spec-
trometer. PELDOR studies were carried out using the PELDOR spectrometer
that is described elsewhere (42,43). The durations of the first and the second
pulses forming the spin echo signal were 40 and 70 ns, respectively. The dura-
tion of the pumping pulse was 30 ns. The position of the pumping pulse
corresponded to the maximum amplitude in the ESR spectrum. The frequency
difference nA-nB was 65 MHz. The intensity of the echo signal as a function of
the T time interval between the first pulse and the pumping pulse [the
PELDOR signal decay V(T)] was recorded. These decays were normalized
to the magnitude of the echo signal in the absence of a pumping pulse. The
other conditions for the measurement followed the protocols described in
Milov et al. (34). ESEEM experiments were carried out at 77 K using an
ELEXSYS E 580 spectrometer, which was equipped with a homemade
low-Q resonator and a quartz Dewar filled with liquid nitrogen. This technique
was carried out using a conventional three-pulse stimulated electron spin echo.
The duration of the microwave pulses was 16 ns. The time delay between the
second and the third pulses was incremented from 60 ns by 550 steps of 16 ns
each, while maintaining the separation between the first and second pulses
constant at 200 ns. Unwanted echoes were eliminated using the Bruker (Karls-
ruhe, Germany) Pulse Spel software, applying a four-step phase cycling
programþ(0, 0, 0),�(0, p, 0),�(p, 0, 0), andþ(p, p, 0) (50). The D2O modu-
lation effects for peptide membrane systems were analyzed as described in
Marsh (53) and Bartucci et al. (54,58). The spectrometer magnetic field was
set to the maximum amplitude of the TOAC ESR spectrum.
Molecular modeling
A molecular model of the spin-labeled [Glu(OMe)7,18,19, TOAC1,8,16]-alame-
thicin F50/5 was derived from the x-ray diffraction structure of
[Glu(OMe)7,18,19, TOAC16]-alamethicin F50/5 (39) using the HyperChem
software (Hypercube, Gainesville, FL). For the computational details of the
construction of the Alm F50/5 molecular model and the force field parametri-
zation, we refer to our recent work on alamethicin (33). Four peptides (i.e.,
the aggregate) were aligned parallel according to a square arrangement and
with the polar groups located at the inside of the peptide aggregate using
the XMakemol software tool (version 5.16, copyright M. P. Hodges, 2007,
free download at http://www.nongnu.org/xmakemol/WelcomePage.html).
The peptide aggregate was placed in a periodic cubic box with edges of 10
nm, large enough to ensure that the periodic images do not interact. A series
of constraint energy minimizations were carried out using the OPLSAA force
field (59,60), where the force field parameters for TOAC molecular moiety
were obtained from Parsegian et al. (61). The long-range interactions were
computed up to 2.0 nm using a simple cut-off scheme. The constraints were
simple square-well potentials with a variable well range. We constrained
the intermolecular distances between the exocyclic oxygen atoms of the 1,
8, and 16 TOAC alamethicin analogs. For each peptide, we had 3 � 2 � 1
¼ 6 constraints, and hence a total of 18 constraints for the aggregate. We
started with a minimum well value (rmin) of 1.5 nm and a maximum (rmax)
of 3.5 nm. We kept rmax fixed and increased rmin in steps of 0.1 nm, i.e.,
1.5, 1.6, 1,7, etc. After every update of rmin, we minimized the geometry up
to a target gradient of 0.01 kcal/mol A. In this way we found a minimum of
the potential energy at rmin ¼ 1.8 nm. The resulting structure was used for
further analysis. Note that the potential energy increase due to the constraints
was never larger than a few kcal/mol. The dimensions of the supramolecular
model structure were compared to those of the gel phase ePC membrane
(3.5 nm for the hydrophobic core and 4.7 nm for the total thickness). These
latter values were obtained from the x-ray diffraction data of ePC fluid
membranes (62), which were corrected to the gel phase dimensions by a
conversion factor of 1.34 and 1.24, respectively (63).
RESULTS
Continuous wave ESR spectra
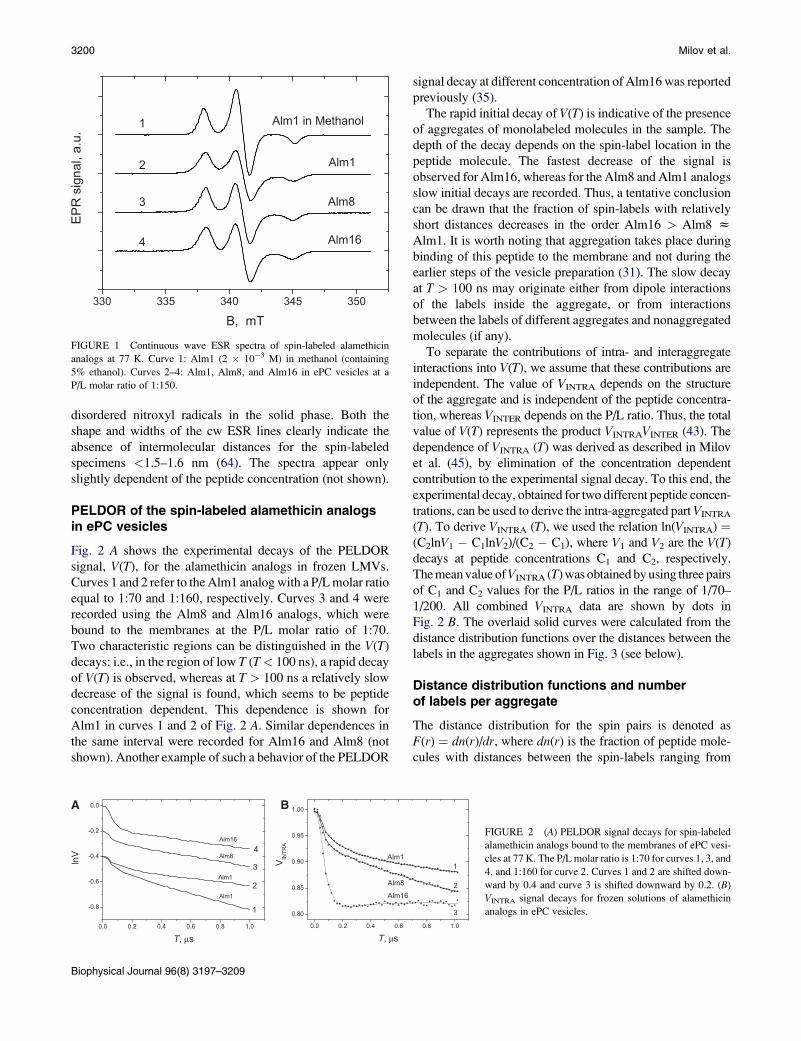
Fig. 1 shows the cw ESR spectra of the spin-labeled analogs
of alamethicin bound to membranes of the ePC vesicles,
which were frozen at 77 K. For comparison, the ESR spec-
trum of Alm1 (2 � 10�3 M) in frozen glassy methanol/
ethanol solution is also shown. In the latter case the
dipole-dipole interaction of the spin-labels is weak and no
broadening is shown in the ESR lines, whereas the lines of
the ESR spectra 2-4 of Alm in ePC vesicles are remarkably
broadened. This effect can be attributed to aggregation of
Alm in the vesicles. Furthermore, it should be noted that the
shape of the spectra is indicative of the occurrence of
Biophysical Journal 96(8) 3197–3209
3200 Milov et al.
disordered nitroxyl radicals in the solid phase. Both the
shape and widths of the cw ESR lines clearly indicate the
absence of intermolecular distances for the spin-labeled
specimens <1.5–1.6 nm (64). The spectra appear only
slightly dependent of the peptide concentration (not shown).
PELDOR of the spin-labeled alamethicin analogsin ePC vesicles
Fig. 2 A shows the experimental decays of the PELDOR
signal, V(T), for the alamethicin analogs in frozen LMVs.
Curves 1 and 2 refer to the Alm1 analog with a P/L molar ratio
equal to 1:70 and 1:160, respectively. Curves 3 and 4 were
recorded using the Alm8 and Alm16 analogs, which were
bound to the membranes at the P/L molar ratio of 1:70.
Two characteristic regions can be distinguished in the V(T)
decays: i.e., in the region of low T (T< 100 ns), a rapid decay
of V(T) is observed, whereas at T > 100 ns a relatively slow
decrease of the signal is found, which seems to be peptide
concentration dependent. This dependence is shown for
Alm1 in curves 1 and 2 of Fig. 2 A. Similar dependences in
the same interval were recorded for Alm16 and Alm8 (not
shown). Another example of such a behavior of the PELDOR
FIGURE 1 Continuous wave ESR spectra of spin-labeled alamethicin
analogs at 77 K. Curve 1: Alm1 (2 � 10�3 M) in methanol (containing
5% ethanol). Curves 2–4: Alm1, Alm8, and Alm16 in ePC vesicles at a
P/L molar ratio of 1:150.
Biophysical Journal 96(8) 3197–3209
signal decay at different concentration of Alm16 was reported
previously (35).
The rapid initial decay of V(T) is indicative of the presence
of aggregates of monolabeled molecules in the sample. The
depth of the decay depends on the spin-label location in the
peptide molecule. The fastest decrease of the signal is
observed for Alm16, whereas for the Alm8 and Alm1 analogs
slow initial decays are recorded. Thus, a tentative conclusion
can be drawn that the fraction of spin-labels with relatively
short distances decreases in the order Alm16 > Alm8 zAlm1. It is worth noting that aggregation takes place during
binding of this peptide to the membrane and not during the
earlier steps of the vesicle preparation (31). The slow decay
at T > 100 ns may originate either from dipole interactions
of the labels inside the aggregate, or from interactions
between the labels of different aggregates and nonaggregated
molecules (if any).
To separate the contributions of intra- and interaggregate
interactions into V(T), we assume that these contributions are
independent. The value of VINTRA depends on the structure
of the aggregate and is independent of the peptide concentra-
tion, whereas VINTER depends on the P/L ratio. Thus, the total
value of V(T) represents the product VINTRAVINTER (43). The
dependence of VINTRA (T) was derived as described in Milov
et al. (45), by elimination of the concentration dependent
contribution to the experimental signal decay. To this end, the
experimental decay, obtained for two different peptide concen-
trations, can be used to derive the intra-aggregated part VINTRA
(T). To derive VINTRA (T), we used the relation ln(VINTRA) ¼(C2lnV1 � C1lnV2)/(C2 � C1), where V1 and V2 are the V(T)
decays at peptide concentrations C1 and C2, respectively.
The mean value of VINTRA (T) was obtained by using three pairs
of C1 and C2 values for the P/L ratios in the range of 1/70–
1/200. All combined VINTRA data are shown by dots in
Fig. 2 B. The overlaid solid curves were calculated from the
distance distribution functions over the distances between the
labels in the aggregates shown in Fig. 3 (see below).
Distance distribution functions and numberof labels per aggregate
The distance distribution for the spin pairs is denoted as
F(r) ¼ dn(r)/dr, where dn(r) is the fraction of peptide mole-
cules with distances between the spin-labels ranging from
A B
FIGURE 2 (A) PELDOR signal decays for spin-labeled
alamethicin analogs bound to the membranes of ePC vesi-
cles at 77 K. The P/L molar ratio is 1:70 for curves 1, 3, and
4, and 1:160 for curve 2. Curves 1 and 2 are shifted down-
ward by 0.4 and curve 3 is shifted downward by 0.2. (B)
VINTRA signal decays for frozen solutions of alamethicin
analogs in ePC vesicles.
Alamethicin Channel Structure 3201
r to r þ dr. The F(r) form was obtained by comparing the
experimental and calculated VINTRA decays. According to
Milov et al. (34), the expression for VINTRA in the case of
N spin-labels per aggregate, can be given as
VCALC ¼ 1� ðN � 1Þpb
Zr2
r1
FðrÞð1� f ðr; TÞÞdr; (1)
where T is the delay between the first pulse and the pumping
pulse, r is the distance between the labels, the function f(r,T)
describes the signal oscillations due to the dipole-dipole
interaction between two labels, and the pb value refers to
the probability of the spin flip induced by the pumping pulse.
From Eq. 1, at large T values the function f(r,T) / 0 and the
following relation between N and VINTRA(T / N) holds:
(N � 1)pb ¼ 1 � VINTRA(T / N). Under these conditions
the value (1 � N) can be determined experimentally. The
integration limits r1 and r2 define a physically reasonable
range of distances between the spin-labels in the aggregates.
Equation 1 is valid if pb is independent of r, which holds for
r > 1.6 nm. For such distances, the broad line of the ESR
spectrum is of minor importance.
As follows from Fig. 3, VINTRA(T) displays a significant
decay of the PELDOR signal at T values <100 ns, i.e., at
times comparable with the duration of the mw pulses. This
result indicates that for Eq. 1 one should take the effects of
both the duration of the mw pulses and the location of the
spin-label frequencies in the ESR spectrum into account.
Thus, in our subsequent analysis, the values of V(0), pb,
and f(r,T) were calculated from the relations derived in Mar-
yasov and Tsvetkov (65). In this case, the duration of the
pulses was taken into account and the averaging was carried
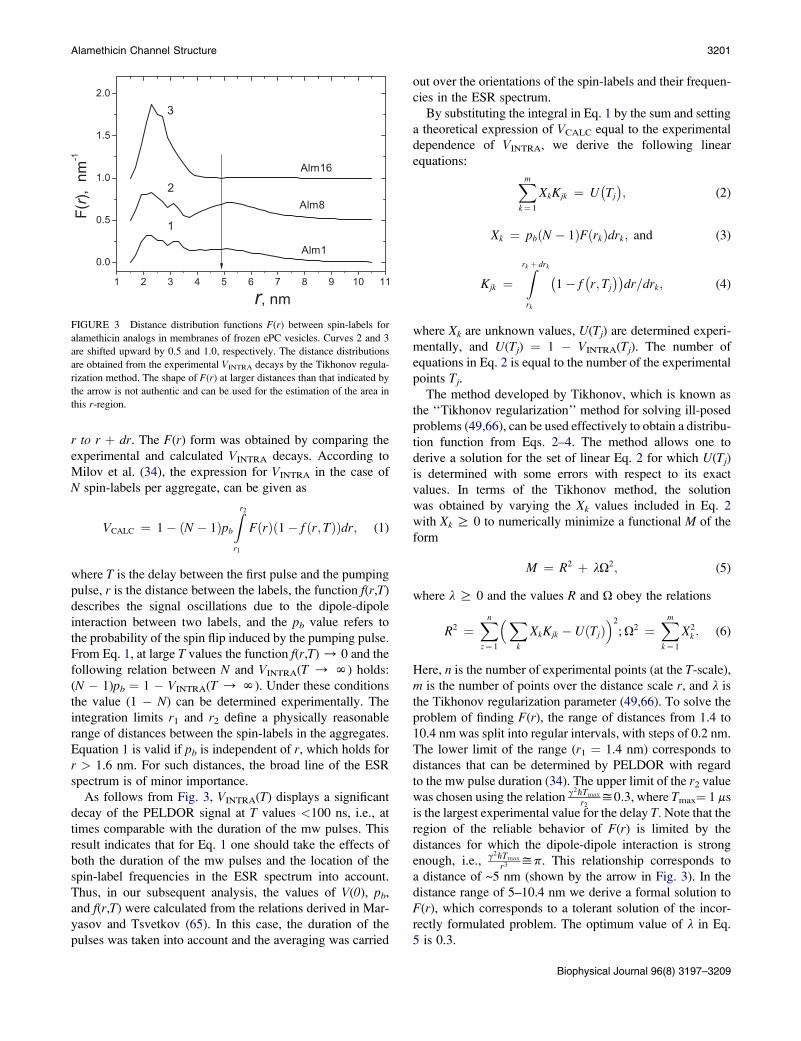
FIGURE 3 Distance distribution functions F(r) between spin-labels for
alamethicin analogs in membranes of frozen ePC vesicles. Curves 2 and 3
are shifted upward by 0.5 and 1.0, respectively. The distance distributions
are obtained from the experimental VINTRA decays by the Tikhonov regula-
rization method. The shape of F(r) at larger distances than that indicated by
the arrow is not authentic and can be used for the estimation of the area in
this r-region.
out over the orientations of the spin-labels and their frequen-
cies in the ESR spectrum.
By substituting the integral in Eq. 1 by the sum and setting
a theoretical expression of VCALC equal to the experimental
dependence of VINTRA, we derive the following linear
equations:
Xm
k¼ 1
XkKjk ¼ U�Tj
�; (2)
Xk ¼ pbðN � 1ÞFðrkÞdrk; and (3)
Kjk ¼Zrk þ drk
rk
�1� f
�r; Tj
��dr=drk; (4)
where Xk are unknown values, U(Tj) are determined experi-
mentally, and U(Tj) ¼ 1 � VINTRA(Tj). The number of
equations in Eq. 2 is equal to the number of the experimental
points Tj.
The method developed by Tikhonov, which is known as
the ‘‘Tikhonov regularization’’ method for solving ill-posed
problems (49,66), can be used effectively to obtain a distribu-
tion function from Eqs. 2–4. The method allows one to
derive a solution for the set of linear Eq. 2 for which U(Tj)
is determined with some errors with respect to its exact
values. In terms of the Tikhonov method, the solution
was obtained by varying the Xk values included in Eq. 2
with Xk R 0 to numerically minimize a functional M of the
form
M ¼ R2 þ lU2; (5)
where l R 0 and the values R and U obey the relations
R2 ¼Xn
z¼ 1
�Xk
XkKjk � UðTjÞ�2
; U2 ¼Xm
k¼ 1
X2k : (6)
Here, n is the number of experimental points (at the T-scale),
m is the number of points over the distance scale r, and l is
the Tikhonov regularization parameter (49,66). To solve the
problem of finding F(r), the range of distances from 1.4 to
10.4 nm was split into regular intervals, with steps of 0.2 nm.
The lower limit of the range (r1 ¼ 1.4 nm) corresponds to
distances that can be determined by PELDOR with regard
to the mw pulse duration (34). The upper limit of the r2 value
was chosen using the relation g2ZTmax
r2y0:3, where Tmax¼ 1 ms
is the largest experimental value for the delay T. Note that the
region of the reliable behavior of F(r) is limited by the
distances for which the dipole-dipole interaction is strong
enough, i.e., g2ZTmax
r3 yp. This relationship corresponds to
a distance of ~5 nm (shown by the arrow in Fig. 3). In the
distance range of 5–10.4 nm we derive a formal solution to
F(r), which corresponds to a tolerant solution of the incor-
rectly formulated problem. The optimum value of l in Eq.
5 is 0.3.
Biophysical Journal 96(8) 3197–3209

3202 Milov et al.
Fig. 3 shows the F(r) functions for all three spin-labeled
analogs of alamethicin in the frozen LMV suspension,
obtained by the described method. The PELDOR signal
decays, calculated from these distribution functions, are
shown in Fig. 2 b by solid lines. The curves 1, 2, and 3 in
Fig. 2 B show that the distribution functions are in a good
agreement with the experimental data (shown by dots).
Characteristic properties of the distributionfunctions
The distance distributions, shown for Alm1 and Alm8 in
Fig. 3, exhibit two groups of lines. The first one is situated
in the region of short distances (r< 3.5 nm) with a maximum
at 2.3 nm and the second one is in the region of longer distances
(r> 3.5 nm) with a maximum of ~5.2 nm. Only the first group
of lines, with a maximum at 2.3 nm, is observed for Alm16.
Therefore, the distance distributions observed are a superposi-
tion of two groups of lines with different relative intensities de-
pending on the spin-label position in the alamethicin analog.
The maxima of these groups of lines, together with the ratio
between the areas of those lines, are the main parameters
that determine the possible structures of the aggregates of
the alamethicin analogs in ePC vesicles. It is necessary to
keep in mind that, due to the special features of the Tichonov
solution, the shape of F(r) at long distances (r > 5 nm, indi-
cated by the arrow in Fig. 3) is not authentic and can be used
only for estimating the area in this region of distances.
It should be noted that for Alm8 the two groups of lines do
not overlap. After integration, a ratio of ~2:3 was obtained for
the areas of the first and the second group of lines. The
distance distribution function shown for Alm1 (Fig. 3, curve1), however, shows some overlap of these groups. Neverthe-
less, estimation of the areas can be obtained if we take the
similarity of the different line shapes for Alm1 and Alm8
into account. The estimated ratio of the areas for Alm1 also
appears to be ~2:3.
Estimation of the number of spin-labelsin the aggregates
To estimate the number of spin-labels we assumed that all
aggregates contain the same number of Alm molecules.
This value was derived by the following two methods:
Biophysical Journal 96(8) 3197–3209
1. By solving Eq. 2 to obtain the value of (N � 1) pb, from
which the aggregate number N can be estimated. Taking
into account thatP
k
FðrkÞdrk ¼ 1, from Eq. 3 we derive
N ¼ 1pb
Pk
Xk . The pb value was calculated by using the
relations given in Maryasov and Tsvetkov (65). This
method for the estimation of the aggregate number was
already described (34). As a result, N was calculated to be
3.5, 4.4, and 4.3 for Alm1, Alm8, and Alm16, respectively.
These values indicate that the aggregate number is close to
four. Note that the value of N estimated by this method
includes experimental errors and a systematic error (that
is difficult to take into account) originated by the choice
of the optimal parameter in the Tikhonov regularization.
2. By calculating N directly from the experimental asymp-
totic value of VINTRA at large T for Alm16. According
to Eq. 1, at large T the value of VINTRA tends to Vp ¼ 1
� (N � 1) pb. Fig. 2 B shows that this estimation can
only be carried out for Alm16, for which VINTRA tends
to the limiting value VP¼ 0.82� 0.02. From the resulting
value pb ¼ 0.054 � 0.002, we derive N ¼ (1 � VP)/pb ¼4.3 � 0.6. Thus, the value of N obtained by both methods
is close to four. One possible reason for underestimating
the number of subunits in the aggregate, namely peptide
underlabeling, is not operative here because none of the
steps used for the synthesis in solution of these peptides
involves the acidic chemical conditions undermining the
nitroxide label survival.
ESEEM experiments of spin-labeled alamethicinanalogs in ePC: the interaction of spin-labels withthe nuclei of deuterated water
Curve 1 of Fig. 4 A, shows the three-pulse spin echo decay
for a frozen sample of Alm1 in fRS vesicles that were
hydrated in D2O buffer. The data are presented with regard
to the delay t between the second and the third pulses form-
ing the echo signal. In this case, the delay between the first
and the second pulses, t, remained constant. An increase
in t results in the decay of the stimulated echo signal with
a strong modulation. The oscillation frequency of this modu-
lation is close to the resonance frequency of the deuterons in
the magnetic field of the spectrometer (~2 MHz). Similar
dependences, but with smaller modulation amplitudes,
A BFIGURE 4 (A) ESEEM decays for Alm1 bound to
membranes of D2O-hydrated ePC vesicles. The stimulated
echo signal (V) dependence pn the delay between the first
and the third pulses, t, is shown in curve 1. Curve 2 is
smoothed by a six-order polynomial. (B) The normalized
spin echo dependence on the delay time t for spin-labeled
alamethicin analogs in ePC vesicles hydrated in D2O
buffer. The P/L molar ratio is 1:70. The spin echo signal
Vn is normalized.

Alamethicin Channel Structure 3203
were also obtained for Alm8 and Alm16 (not shown). In
previous data published in Marsh (53), Bartucci et al. (54),
and Erilov et al. (55), the modulation induced by the deute-
rium nuclei was observed in stimulated ESE for spin-labels
in phospholipid vesicles prepared in the D2O buffer. In this
case, the modulation amplitude was substantially dependent
on the accessibility of the labels for the D2O molecules.
The spin echo signal decay, depending on t, is determined
by the processes of relaxation that are independent of the
modulation phenomena, and thus can be eliminated. Accord-
ing to Bartucci et al. (54,58) and Erilov et al. (55), the modu-
lation effects can be distinguished by using a normalized
echo signal Vn(t):
Vn ¼ VðtÞ=hVðtÞi � 1;
wherein hV(t)i is the smoothed dependence V(t). Curve 2 in
Fig. 4 A is lnhV(t)i, obtained by the smoothing of curve 1 by
a six-order polynomial. This procedure removes the mono-
tonic component of the decay from the time trace of the
echo decay function.
Fig. 4 B shows the normalized echo signals for different
spin-labeled alamethicin analogs bound to ePC membranes.
The largest amplitude of the deuterium modulation is
observed for Alm1. For the Alm8 and Alm16 analogs, the
deuterium modulation is smaller and close to the amplitude
with a high-frequency (y14.6 MHz) modulation, induced
by protons. The data allow a qualitative conclusion that the
aggregates of the alamethicin analogs are oriented in the
ePC bilayer so that the spin-labels at the first position are
closer to the water-lipid interface than those at positions 8
and 16.
DISCUSSION
Aggregate number of molecules estimated fromPELDOR spectroscopy
To construct the structure of the membrane bound peptide
aggregate, it was necessary to know the number of peptide
building blocks. Thanks to our previous PELDOR investiga-
tion of aggregates of the lipophilic peptide trichogin GA IV
(32) and the study of structurally semirigid and well-defined
bi-, tri-, and tetraradicals (50), the method to analyze the
aggregate number is well established. In the latter study it
was shown that dimers, trimers, and tetramers can be distin-
guished readily. In this study, the aggregate numbers were
estimated by using two different methods to analyze the
VINTRA decays (shown in Fig. 2 B). From the Alm1, Alm8,
and Alm16 samples the number of N peptide monomers
was estimated to N ¼ 4.1 � 0.4, respectively, whereas N¼ 4.3 � 0.6 was obtained from Alm16 by using an indepen-
dent method.
At this point the question should be addressed whether this
variability is due to an error of analysis or to the presence of
a heterogeneous assembly of aggregates built from a mixture
of three, four, and five molecules. In patch clamp studies the
variation of multiconductances, dependent on the lipid chain
length and P/L ratio was indeed interpreted in terms of a vari-
able N (3,4). Unfortunately, a quantitative comparison of the
aggregate numbers is complicated by the fact that in the latter
studies the kinetics of the voltage-gated opening and closing
of alamethicin channels were investigated, whereas in our
work the thermodynamically stable structure of the closed
state of the aggregate is studied. Nevertheless, the interpreta-
tion in terms of an average value of N due to the presence of
a mixture of trimer/tetramer/pentamer aggregates seems
very unlikely in view of a molecular dynamics study of alame-
thicin barrels of different sizes (67). The latter study showed
that their stabilities follow the order: tetramer < pentamer <hexamer. By following this trend it might thus be anticipated
that trimers are less stable than tetramers and consequently the
concentration of trimer would be much less than the amount of
pentamer. Thus, the assumption of the presence of the same
amounts of trimers and pentamers (at P/L values ranging
from 1:70 to 1:160), equally contributing to the mean aggre-
gate number (hNi ¼ 4), does not seem reasonable.
Structural information from PELDOR
We used the PELDOR technique to obtain geometric infor-
mation about the self-assembled supramolecular structure of
the pore forming alamethicin analogs. An important observa-
tion of the distance distribution curves shown in Fig. 3 is
that, independent of the label position, similar distance distri-
butions are found ~2.3 nm. This finding agrees with a simple
model of a parallel alignment of a face-to-face type of helix-
helix association with the polar groups oriented to the inside
and with the spin-labels located at the outside, but disagrees
with an antiparallel orientation. In the latter case the theoret-
ical distance between the TOAC-16 labels would be 3.4 nm,
which is at the extreme side of the experimental distance
distribution curve 3 (Fig. 3).
To further study the helix-helix interactions in more detail,
a molecular modeling study was carried out. In this investiga-
tion a set of distance restraints was used that was taken from
the intermolecular PELDOR distances between the TOAC
labels. For convenience, but in contrast to the actual experi-
ments, each peptide molecule was labeled threefold, at the
1, 8, and 16 positions (see the ‘‘Molecular modeling’’ para-
graph in the Materials and Methods section for details). In
Fig. 5 the computed gas-phase energy minimized structure
shows a peptide complex that is built from four parallel, but
slightly tilted a-helices. A more detailed examination of the
aggregate structure shows that all peptide helices are more
or less perturbed due to the missing hydrogen bonds at the
helix breaking region Gly11-Pro14 (the bending angles of
the blue, red, cyan, and yellow colored chains are 151�,150�, 130�, and 125�). It is worth noting that bending of the
peptide helix has also been found in a 1H-NMR study of
micelle-associated alamethicin (68).
Biophysical Journal 96(8) 3197–3209
3204 Milov et al.
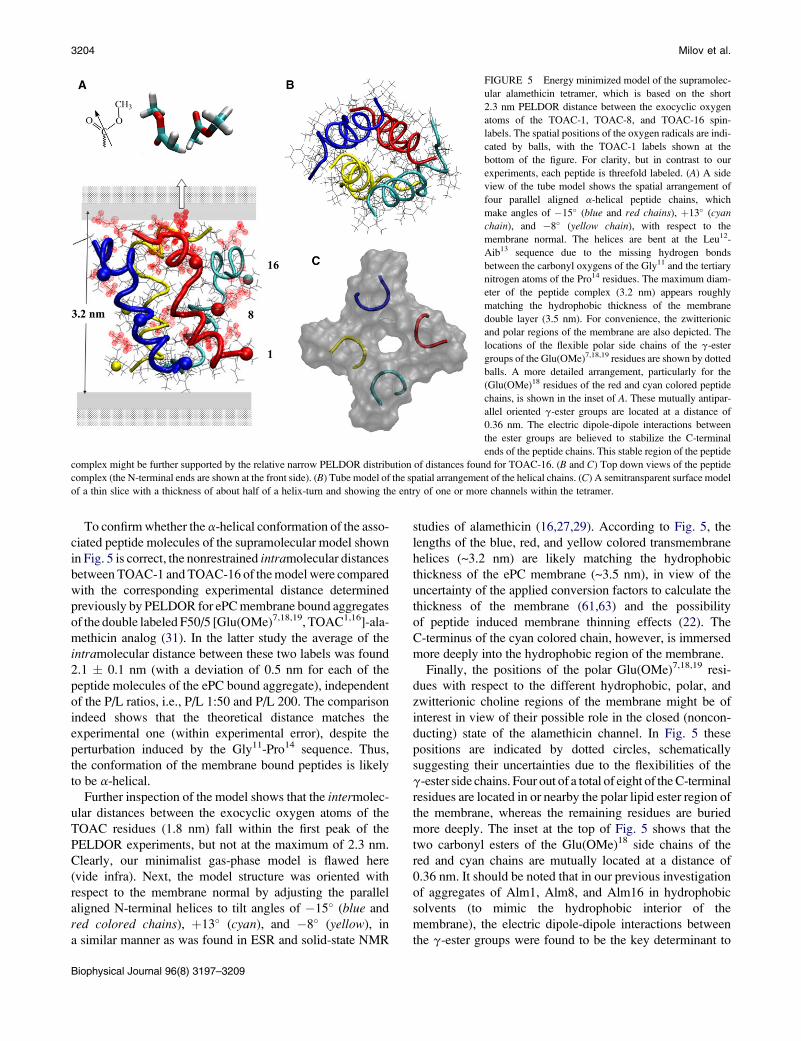
FIGURE 5 Energy minimized model of the supramolec-
ular alamethicin tetramer, which is based on the short
2.3 nm PELDOR distance between the exocyclic oxygen
atoms of the TOAC-1, TOAC-8, and TOAC-16 spin-
labels. The spatial positions of the oxygen radicals are indi-
cated by balls, with the TOAC-1 labels shown at the
bottom of the figure. For clarity, but in contrast to our
experiments, each peptide is threefold labeled. (A) A side
view of the tube model shows the spatial arrangement of
four parallel aligned a-helical peptide chains, which
make angles of �15� (blue and red chains), þ13� (cyanchain), and �8� (yellow chain), with respect to the
membrane normal. The helices are bent at the Leu12-
Aib13 sequence due to the missing hydrogen bonds
between the carbonyl oxygens of the Gly11 and the tertiary
nitrogen atoms of the Pro14 residues. The maximum diam-
eter of the peptide complex (3.2 nm) appears roughly
matching the hydrophobic thickness of the membrane
double layer (3.5 nm). For convenience, the zwitterionic
and polar regions of the membrane are also depicted. The
locations of the flexible polar side chains of the g-ester
groups of the Glu(OMe)7,18,19 residues are shown by dotted
balls. A more detailed arrangement, particularly for the
(Glu(OMe)18 residues of the red and cyan colored peptide
chains, is shown in the inset of A. These mutually antipar-
allel oriented g-ester groups are located at a distance of
0.36 nm. The electric dipole-dipole interactions between
the ester groups are believed to stabilize the C-terminal
ends of the peptide chains. This stable region of the peptide
complex might be further supported by the relative narrow PELDOR distribution of distances found for TOAC-16. (B and C) Top down views of the peptide
complex (the N-terminal ends are shown at the front side). (B) Tube model of the spatial arrangement of the helical chains. (C) A semitransparent surface model
of a thin slice with a thickness of about half of a helix-turn and showing the entry of one or more channels within the tetramer.
To confirm whether the a-helical conformation of the asso-
ciated peptide molecules of the supramolecular model shown
in Fig. 5 is correct, the nonrestrained intramolecular distances
between TOAC-1 and TOAC-16 of the model were compared
with the corresponding experimental distance determined
previously by PELDOR for ePC membrane bound aggregates
of the double labeled F50/5 [Glu(OMe)7,18,19, TOAC1,16]-ala-
methicin analog (31). In the latter study the average of the
intramolecular distance between these two labels was found
2.1 � 0.1 nm (with a deviation of 0.5 nm for each of the
peptide molecules of the ePC bound aggregate), independent
of the P/L ratios, i.e., P/L 1:50 and P/L 200. The comparison
indeed shows that the theoretical distance matches the
experimental one (within experimental error), despite the
perturbation induced by the Gly11-Pro14 sequence. Thus,
the conformation of the membrane bound peptides is likely
to be a-helical.
Further inspection of the model shows that the intermolec-
ular distances between the exocyclic oxygen atoms of the
TOAC residues (1.8 nm) fall within the first peak of the
PELDOR experiments, but not at the maximum of 2.3 nm.
Clearly, our minimalist gas-phase model is flawed here
(vide infra). Next, the model structure was oriented with
respect to the membrane normal by adjusting the parallel
aligned N-terminal helices to tilt angles of �15� (blue and
red colored chains), þ13� (cyan), and �8� (yellow), in
a similar manner as was found in ESR and solid-state NMR
Biophysical Journal 96(8) 3197–3209
studies of alamethicin (16,27,29). According to Fig. 5, the
lengths of the blue, red, and yellow colored transmembrane
helices (~3.2 nm) are likely matching the hydrophobic
thickness of the ePC membrane (~3.5 nm), in view of the
uncertainty of the applied conversion factors to calculate the
thickness of the membrane (61,63) and the possibility
of peptide induced membrane thinning effects (22). The
C-terminus of the cyan colored chain, however, is immersed
more deeply into the hydrophobic region of the membrane.
Finally, the positions of the polar Glu(OMe)7,18,19 resi-
dues with respect to the different hydrophobic, polar, and
zwitterionic choline regions of the membrane might be of
interest in view of their possible role in the closed (noncon-
ducting) state of the alamethicin channel. In Fig. 5 these
positions are indicated by dotted circles, schematically
suggesting their uncertainties due to the flexibilities of the
g-ester side chains. Four out of a total of eight of the C-terminal
residues are located in or nearby the polar lipid ester region of
the membrane, whereas the remaining residues are buried
more deeply. The inset at the top of Fig. 5 shows that the
two carbonyl esters of the Glu(OMe)18 side chains of the
red and cyan chains are mutually located at a distance of
0.36 nm. It should be noted that in our previous investigation
of aggregates of Alm1, Alm8, and Alm16 in hydrophobic
solvents (to mimic the hydrophobic interior of the
membrane), the electric dipole-dipole interactions between
the g-ester groups were found to be the key determinant to
Alamethicin Channel Structure 3205
stabilize the peptide complex. Thus, it seems that the associ-
ation of the C-termini of the peptide cluster in the ePC
membrane is stabilized in a similar manner. One might also
speculate about the role of the g-ester groups of the
Glu(OMe)19 residues to anchor the aggregate to the polar
region of the membrane by dipole-dipole interactions with
the surrounding lipid ester groups.
In view of our interest in the functioning of the alamethi-
cin-induced ion channels, Fig. 5 (insets B and C) is relevant
to discuss. Further inspection of thin slices of the model
along the z axis shows indeed the presence of one or more
microchannels. In Fig. 5 C of the transparent surface model
of a thin slice (at a thickness of about half of an a-helical
turn) the entry of the N-terminus of the aggregate is shown.
It should be recalled, however, that the intermolecular
OR-OR ester distances (1.8 nm) in our model are slightly
shorter than the rmax (2.3 nm) values observed by PELDOR.
Thus, in the membrane-bound aggregate the distances
between the helices might be extended by ~0.5 nm and, as
a result, the actual size of the microchannels might be
slightly larger than those in our model. It is worth noting
here that water filled pores were also found in neutron and
x-ray diffraction studies of alamethicin incorporated into
fluid planar membranes, but at higher peptide concentrations
as those used in our study (17,23,24).
Four Glu(OMe)7 side chains are shown at the center of the
hydrophobic core of the membrane. It should be emphasized,
however, that the current model has not been simulated in
a lipid environment and for this reason the accurate positions
of the flexible polar ester side chains, in particular those at
positions 7, are still uncertain.
At this point of the discussion, it is important to note that
the experimental distance distributions exhibit multiple (2.3,
3.2, and 5.2 nm) distances for Alm1 and Alm8, whereas for
Alm16 only a relative short distance (2.3 nm) was found.
Due to the application of 2.3 nm distance restraints during
our energy minimization, it is not surprising that the
distances of ~3.2 and 5.2 nm observed by PELDOR for
Alm1 and Alm8 are not reproduced during the molecular
modeling. Because distances of the order of 3.2 and 5.2 nm
are not observed experimentally for the TOAC-16 labels, the
possibility of aggregates located at opposite leaflets of the
membrane can be readily discarded. Other options, like for
instance peptide induced nanorafts, local phase transitions
of the membrane or extending the peptide aggregate struc-
ture from one bilayer to another in a multilayered vesicle
(18–20), seem also not reasonable.
Further inspection of the distance distribution curve of
Alm8 shows that the short and long distances are separated
by a minimum at 3.7 nm. This finding indicates that the
N-termini of the chains are not randomly unordered. To
propose a structure that would be consistent with both short
and long distances between the TOAC-8 and TOAC-1
labels, we examined two different structures according to
a penknife model (Fig. 6). First, the option a ¼ 180� was
considered. However, the energy minimized structure, ob-
tained by using 5.2 nm distance restraints for two TOAC-1
labels of chains oppositely situated in the aggregate struc-
tures, turns out not to be realistic for a membrane bound
aggregate. The distance of 5 nm is apparently too long to
match also the total thickness of the membrane. Furthermore,
in such a structure the eight polar Glu(OMe)18,19 residues
would be at the center of the peptide complex, a situation
that seems to be very unlikely.
Next, we examined the option a ¼ 90�, i.e., a T-shaped
model, built started from standard a-helical molecules by
using the VMD software and keeping the distances between
all TOAC-16 labels constant (2.3 nm). The T-shaped struc-
ture might be formed by a transmembrane dimer in associa-
tion with an in-plane associated dimer. The long-range
distances of 4.8–6.4 nm between TOAC-1 and 4.0–4.4 nm
between TOAC-8 labels are qualitatively in agreement
with the PELDOR distances. Although this structure seems
rather fragile, the joint between the transmembrane dimer
and the surface associated dimer might be stabilized by
the electric dipole-dipole interactions between the g-ester
groups of the Glu18,19 residues as well as by stacking of
the phenyl rings and hydrogen bonding of the alcohol groups
of the C-terminal Phl residues20. However, in the absence of
a reliable starting structure for a T-shaped-like structure,
a molecular dynamics simulation would be extremely diffi-
cult. For this reason, we decided to carry out ESEEM exper-
iments to get a better insight into the possibility of different
(co-existing) quaternary structures.
Membrane-related topology of the aggregatesof alamethicin analogs from ESEEM
The experiments were carried out by using Alm1, Alm8, and
Alm16 in membranes of ePC vesicles, which were prepared
in D2O. Because the amplitude of the ESEEM modulation of
the spin-labels seems to be strongly dependent on the water
profile of the membrane, this technique was used to investi-
gate the immersion depths of the different spin-labels of the
aggregate with respect to the membrane surface. An analysis
of the modulation amplitudes shown in Figs. 4, A and B,
revealed that the water accessibility of the spin-labels situ-
ated in the ePC membrane follows the order Alm1 >>Alm8 z Alm16, which is in agreement with experiments re-
ported previously with mono-unsaturated (POPC) lipid
membranes at 77K (18). The simplest interpretation of this
observation is that the labels at the N-terminal positions
are situated more closely to the lipid-water interface, whereas
the labels at positions 8 and 16 are more buried. However, in
the aggregate model shown in Fig. 5 the TOAC-1, TOAC-8,
and TOAC-16 labels are separated from the membrane
surface on the average by ~0.5 nm, 1.4 nm, and 0.9 nm,
respectively. Thus, from this information one would expect
the order of water accessibility to be TOAC-1 > TOAC-16
> > TOAC-8. However, if we take the water molecules
Biophysical Journal 96(8) 3197–3209
3206 Milov et al.
α
α
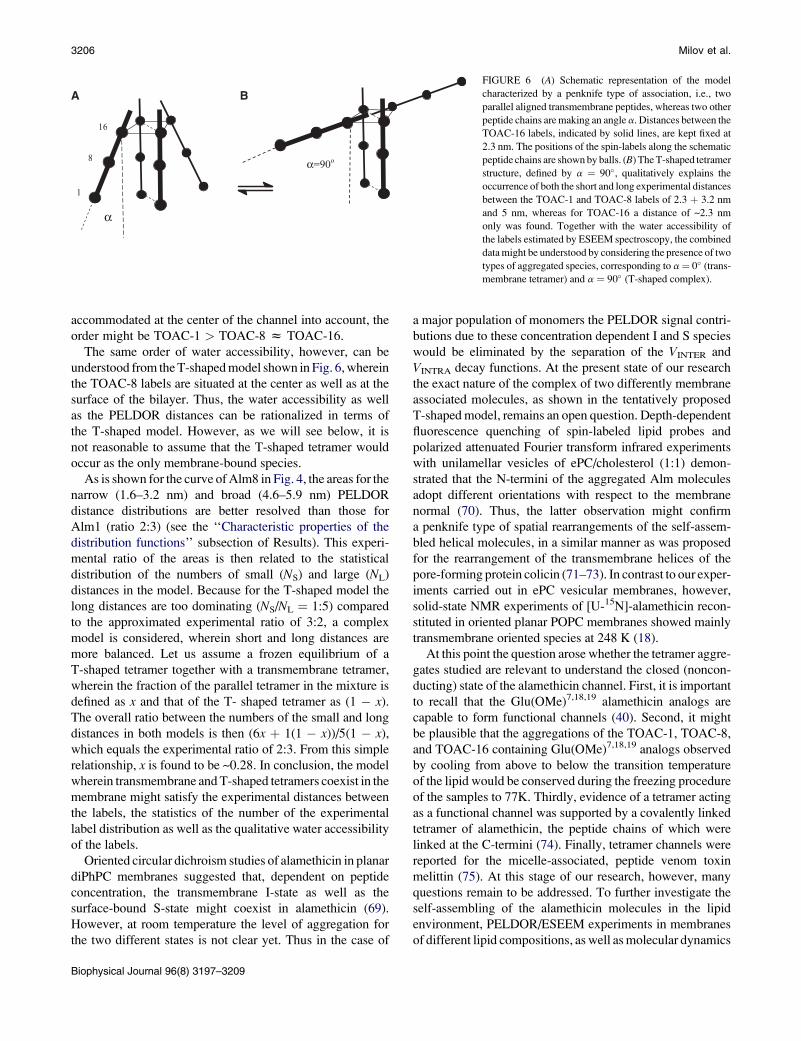
A BFIGURE 6 (A) Schematic representation of the model
characterized by a penknife type of association, i.e., two
parallel aligned transmembrane peptides, whereas two other
peptide chains are making an angle a. Distances between the
TOAC-16 labels, indicated by solid lines, are kept fixed at
2.3 nm. The positions of the spin-labels along the schematic
peptide chains are shown by balls. (B) The T-shaped tetramer
structure, defined by a ¼ 90�, qualitatively explains the
occurrence of both the short and long experimental distances
between the TOAC-1 and TOAC-8 labels of 2.3 þ 3.2 nm
and 5 nm, whereas for TOAC-16 a distance of ~2.3 nm
only was found. Together with the water accessibility of
the labels estimated by ESEEM spectroscopy, the combined
data might be understood by considering the presence of two
types of aggregated species, corresponding to a¼ 0� (trans-
membrane tetramer) and a ¼ 90� (T-shaped complex).
accommodated at the center of the channel into account, the
order might be TOAC-1 > TOAC-8 z TOAC-16.
The same order of water accessibility, however, can be
understood from the T-shaped model shown in Fig. 6, wherein
the TOAC-8 labels are situated at the center as well as at the
surface of the bilayer. Thus, the water accessibility as well
as the PELDOR distances can be rationalized in terms of
the T-shaped model. However, as we will see below, it is
not reasonable to assume that the T-shaped tetramer would
occur as the only membrane-bound species.
As is shown for the curve of Alm8 in Fig. 4, the areas for the
narrow (1.6–3.2 nm) and broad (4.6–5.9 nm) PELDOR
distance distributions are better resolved than those for
Alm1 (ratio 2:3) (see the ‘‘Characteristic properties of the
distribution functions’’ subsection of Results). This experi-
mental ratio of the areas is then related to the statistical
distribution of the numbers of small (NS) and large (NL)
distances in the model. Because for the T-shaped model the
long distances are too dominating (NS/NL ¼ 1:5) compared
to the approximated experimental ratio of 3:2, a complex
model is considered, wherein short and long distances are
more balanced. Let us assume a frozen equilibrium of a
T-shaped tetramer together with a transmembrane tetramer,
wherein the fraction of the parallel tetramer in the mixture is
defined as x and that of the T- shaped tetramer as (1 � x).
The overall ratio between the numbers of the small and long
distances in both models is then (6x þ 1(1 � x))/5(1 � x),
which equals the experimental ratio of 2:3. From this simple
relationship, x is found to be ~0.28. In conclusion, the model
wherein transmembrane and T-shaped tetramers coexist in the
membrane might satisfy the experimental distances between
the labels, the statistics of the number of the experimental
label distribution as well as the qualitative water accessibility
of the labels.
Oriented circular dichroism studies of alamethicin in planar
diPhPC membranes suggested that, dependent on peptide
concentration, the transmembrane I-state as well as the
surface-bound S-state might coexist in alamethicin (69).
However, at room temperature the level of aggregation for
the two different states is not clear yet. Thus in the case of
Biophysical Journal 96(8) 3197–3209
a major population of monomers the PELDOR signal contri-
butions due to these concentration dependent I and S species
would be eliminated by the separation of the VINTER and
VINTRA decay functions. At the present state of our research
the exact nature of the complex of two differently membrane
associated molecules, as shown in the tentatively proposed
T-shaped model, remains an open question. Depth-dependent
fluorescence quenching of spin-labeled lipid probes and
polarized attenuated Fourier transform infrared experiments
with unilamellar vesicles of ePC/cholesterol (1:1) demon-
strated that the N-termini of the aggregated Alm molecules
adopt different orientations with respect to the membrane
normal (70). Thus, the latter observation might confirm
a penknife type of spatial rearrangements of the self-assem-
bled helical molecules, in a similar manner as was proposed
for the rearrangement of the transmembrane helices of the
pore-forming protein colicin (71–73). In contrast to our exper-
iments carried out in ePC vesicular membranes, however,
solid-state NMR experiments of [U-15N]-alamethicin recon-
stituted in oriented planar POPC membranes showed mainly
transmembrane oriented species at 248 K (18).
At this point the question arose whether the tetramer aggre-
gates studied are relevant to understand the closed (noncon-
ducting) state of the alamethicin channel. First, it is important
to recall that the Glu(OMe)7,18,19 alamethicin analogs are
capable to form functional channels (40). Second, it might
be plausible that the aggregations of the TOAC-1, TOAC-8,
and TOAC-16 containing Glu(OMe)7,18,19 analogs observed
by cooling from above to below the transition temperature
of the lipid would be conserved during the freezing procedure
of the samples to 77K. Thirdly, evidence of a tetramer acting
as a functional channel was supported by a covalently linked
tetramer of alamethicin, the peptide chains of which were
linked at the C-termini (74). Finally, tetramer channels were
reported for the micelle-associated, peptide venom toxin
melittin (75). At this stage of our research, however, many
questions remain to be addressed. To further investigate the
self-assembling of the alamethicin molecules in the lipid
environment, PELDOR/ESEEM experiments in membranes
of different lipid compositions, as well as molecular dynamics
Alamethicin Channel Structure 3207
simulations in a lipid environment, are in progress. In
any case, we believe that our research has opened new
perspectives on the characterization of peptide self-aggre-
gated species in membranes at the nm structural level.
CONCLUSIONS
The PELDOR technique, combined with the availability of
a set of synthetic alamethicin analogs with spin-labels at
well defined positions, has provided quantitative information
about the geometry of the supramolecular assembly of this
channel-forming antimicrobial molecule. According to two
different methods, the relative small number of peptide mole-
cules forming the aggregate was estimated to be ~4. Distance
distributions at the nm scale were obtained for three different
positions of the peptide chain. For the label position at residue
16, thus located close to the C-terminus of the aggregated
peptide, a relatively sharp interspin distance distribution
was seen around 2.3 nm. Interestingly, the distances observed
for the labels at positions 1 and 8 show distribution maxima at
2.3, 3.2, and 5.2 nm. The intermolecular PELDOR distance of
2.3 nm, independent of the label position, is most likely
related to a parallel alignment of the helical molecules. The in-
tramolecular distances between the TOAC-1 and TOAC-16
labels calculated from the molecular model, which was based
on the intermolecular PELDOR distances, were found in
agreement, within experimental error, with the intramolecular
PELDOR distances. The water accessibility of the different
spin-label positions qualitatively estimated by the ESEEM
experiments was found to follow the order TOAC-1 >>TOAC-8 z TOAC-16. This information, along with the
PELDOR and molecular modeling data, might support
a model, wherein the C-ends of the aggregated peptide mole-
cules are important to stabilize the aggregate, whereas the
membrane topology of the N-terminal segments is less well
defined. In conclusion, we have shown that the combination
of PELDOR, ESEEM, and molecular modeling represents
an important tool to investigate the supramolecular structure
of a self-assembled spin-labeled peptide aggregate in the lipid
membrane-bound state.
We are grateful to Dr. Marco Crisma for providing the coordinates of the
x-ray diffraction structure of [TOAC16, Glu(OMe)7,18,19] alamethicin.
This work was supported by the Russian Grant for Scientific Schools
(551-2008.3), the Russian Foundation for Basic Research (RFBR grant
06-04-48021-a), the Netherlands Organization of Scientific Research
(NWO/RFBR 0.47.017.034), and the Italian Ministry of Foreign Affairs.
REFERENCES
1. Leitgeb, B., L. Szekeres, L. Manczinger, C. Vagvolgyi, and L. Kredics.2007. The history of alamethicin: a review of the most extensivelystudied peptaibol. Chem. Biodivers. 4:1027–1051.
2. Mueller, P., and P. O. Rudin. 1968. Action potentials induced in biomo-lecular lipid membranes. Nature. 217:713–719.
3. Boheim, G. 1974. Statistical analysis of alamethicin in a lipidmembrane. J. Membr. Biol. 19:277–303.
4. Sansom, M. S. P. 1993. Alamethicin and related peptaibols—model ionchannels. Eur. Biophys. J. 22:105–124.
5. Baumann, G., and P. Mueller. 1974. A molecular model of membraneexcitability. J. Supramol. Struct. 2:538–577.
6. Huang, H. W., and Y. Wu. 1991. Lipid-alamethicin interactions influ-ence alamethicin orientation. Biophys. J. 60:1079–1087.
7. Boheim, G. W., W. Hanke, and G. Jung. 1983. Alamethicin pore forma-tion: voltage-dependent flip-flop of a-helix dipoles. Biophys. Struct.Mech. 9:181–191.
8. Fox, R. O., and F. M. Richards. 1982. A voltage-gated ion channelmodel inferred from the crystal structure of alamethicin at 1.5 A resolu-tion. Nature. 300:325–330.
9. Hall, J. E., I. Vodyanov, T. M. Balasubramanian, and G. R. Marshall.1994. Alamethicin, a rich model for channel behavior. Biophys. J.45:233–247.
10. Cascio, M., and B. A. Wallace. 1988. Conformation of alamethicin inphospholipid vesicles: implications for insertion models. ProteinsStruct. Funct. Genet. 4:889–898.
11. Pispisa, B., L. Stella, C. Mazzuca, and M. Venanzi. 2006. Reviews inFluorescence. C. D. Geddes and J. R. Lakowicz, editors. Springer,New York.
12. Kropacheva, T. N., and J. Raap. 2007. Enzymatic reaction in a vesicularmicroreactor: peptaibol-facilitated substrate transport. Chem. Biodivers.4:1388–1394.
13. Dempsey, C. E., and L. J. Handcock. 1996. Hydrogen bond stabilities inmembrane-reconstituted alamethicin from amide-resolved hydrogen-exchange measurements. Biophys. J. 70:1777–1788.
14. Bechinger, B., D. A. Skladnev, A. Ogrel, X. Li, E. V. Rogozhkina, et al.2001. 15N and 31P Solid-state NMR investigations on the orientation ofzervamicin II and alamethicin in phosphatidylcholine membranes.Biochemistry. 40:9428–9437.
15. Bak, M., R. P. Bywater, M. Hohwy, J. K. Thomsen, K. Adelhorst, et al.2001. Conformation of alamethicin in oriented phospholipid bilayersdetermined by 15N solid-state nuclear magnetic resonance. Biophys. J.81:1684–1698.
16. Salnikov, E. S., H. Friedrich, X. Li, P. Bertani, S. Reissmann, et al.2008. Structure and alignment of the membrane-associated peptaibolsampullosporin A and alamethicin by oriented 15N and 31P solid-stateNMR spectroscopy. Biophys. J. 113:3034–3042.
17. He, K., S. J. Ludtke, H. W. Huang, and D. L. Worcester. 1995. Antimi-crobial peptide pores in membranes detected by neutron in-planescattering. Biochemistry. 34:15614–15618.
18. Salnikov, E. S., M. De Zotti, F. Formaggio, X. Li, C. Toniolo, et al.2009. Alamethicin topology in phospholipid membranes by orientedsolid-state NMR and EPR spectroscopies: a comparison. J. Phys.Chem. B. 113:3034–3042.
19. Keller, S. L., S. M. Gruner, and K. Garwisch. 1996. Small concentra-tions of alamethicin induce a cubic phase in bulk phosphatidylethanol-amine mixtures. Biochim. Biophys. Acta. 1278:241–246.
20. Angelova, A., R. Ionov, M. H. J. Koch, and J. Rapp. 2000. Interactionof the peptide antibiotic alamethicin with bilayer- and non-bilayer-forming lipids: influence of increasing alamethicin concentration onthe lipid supramolecular structures. Arch. Biochem. Biophys. 378:93–106.
21. Spaar, A., C. Munster, and T. Salditt. 2004. Conformation of peptides inmembranes studied by X-ray grazing incidence scattering. Biophys. J.87:396–407.
22. Li, C., and T. Salditt. 2006. Structure of magainin and alamethicin inmodel membranes studied by X-ray reflectivity. Biophys. J. 91:3285–3300.
23. Constantin, D., G. Brotons, A. Jarre, C. Li, and T. Salditt. 2007. Inter-action of alamethicin pores in DMPC bilayers. Biophys. J. 92:3978–3987.
24. Qian, S., W. Wang, L. Yang, and H. W. Huang. 2008. Structure of thealamethicin pore reconstructed by X-ray diffraction analysis. Biophys. J.94:3512–3522.
Biophysical Journal 96(8) 3197–3209
3208 Milov et al.
25. Archer, S. J., J. F. Ellena, and D. S. Cafiso. 1991. Dynamics and aggre-gation of the peptide ion channel alamethicin. Biophys. J. 60:389–398.
26. Marsh, D., M. Jost, C. Peggion, and C. Toniolo. 2007. TOAC spin-labels in the backbone of alamethicin: EPR studies in lipid membranes.Biophys. J. 92:473–481.
27. Marsh, D., M. Jost, C. Peggion, and C. Toniolo. 2007. Lipid chainlength dependence for incorporation of alamethicin in membranes:EPR studies on TOAC-spin-labeled analogues. Biophys. J. 92:4002–4011.
28. Bartucci, R., R. Guzzi, M. De Zotti, C. Toniolo, L. Sportelli, et al. 2008.Backbone dynamics of alamethicin bound to lipid membranes: spin-echo electron paramagnetic resonance of TOAC-spin-labels. Biophys.J. 94:2698–2705.
29. Milov, A. D., Yu. D. Tsvetkov, F. Formaggio, M. Crisma, C. Toniolo,et al. 2001. The secondary structure of a membrane-modifying peptidein a supramolecular assembly studied by PELDOR and CW-ESR spec-troscopies. J. Am. Chem. Soc. 123:3784–3789.
30. Milov, A. D., Yu. D. Tsvetkov, E. Y. Gorbunova, L. G. Mustaeva, T. V.Ovchinnikova, et al. 2007. Solvent effects on the secondary structure ofthe membrane-active zervamicin determined by PELDOR spectros-copy. Chem. Biodivers. 4:1243–1255.
31. Milov, A. D., R. I. Samoilova, Yu. D. Tsvetkov, M. De Zotti, C. To-niolo, et al. 2008. PELDOR conformational analysis of bis-labeled ala-methicin aggregated in phospholipid vesicles. J. Phys. Chem. B. 112:13469–13472.
32. Milov, A. D., Yu. D. Tsvetkov, F. Formaggio, M. Crisma, C. Toniolo,et al. 2000. Self-assembling properties of membrane-modifyingpeptides studied by PELDOR and CW-ESR spectroscopies. J. Am.Chem. Soc. 122:3843–3848.
33. Milov, A. D., M. I. Samoilova, Yu. D. Tsvetkov, M. Jost, C. Peggion,et al. 2007. Supramolecular structure of self-assembling alamethicinanalog studied by ESR and PELDOR. Chem. Biodivers. 4:1275–1298.
34. Milov, A. D., R. I. Samoilova, Yu. D. Tsvetkov, F. Formaggio,C. Toniolo, et al. 2007. Self-aggregation of spin-labeled alamethicinin ePC vesicles studied by pulsed electron-electron double resonance.J. Am. Chem. Soc. 129:9260–9261.
35. Toniolo, C. 1989. Structure of conformationally constrained peptides:from model compounds to bioactive peptides. Biopolymers. 28:247–257.
36. Toniolo, C., M. Crisma, F. Formaggio, and C. Peggion. 2001. Controlof peptide conformation by the Thorpe-Ingold effect (Ca-tetrasubstitu-tion). Biopolymers. 60:396–419.
37. Toniolo, C., M. Crisma, and F. Formaggio. 1998. TOAC, a nitroxidespin-labeled, achiral, Ca-tetrasubstituted a-amino acid, is an excellenttool in materials science and biochemistry. Biopolymers. 47:153–158.
38. Peggion, C., M. Jost, W. M. de Borggraeve, M. Crisma, F. Formaggio,et al. 2007. Conformational analysis of TOAC-labeled alamethicin F50/5 analogues. Chem. Biodivers. 4:1256–1274.
39. Crisma, M., C. Peggion, C. Baldini, E. J. MacLean, N. Vedovato, et al.2007. Crystal structure of a spin-labeled, channel-forming, alamethicinanalogue. Angew. Chem. Int. Ed. 46:2047–2050.
40. Vedovato, N., C. Baldini, C. Toniolo, and G. Rispoli. 2007. Pore-form-ing properties of alamethicin F50/5 inserted in a biological membrane.Chem. Biodivers. 4:1338–1346.
41. Woolley, G. A., and B. A. Wallace. 1993. Temperature dependence ofthe interaction of alamethicin helices in membranes. Biochemistry.32:9819–9825.
42. Milov, A. D., K. M. Salikhov, and M. D. Shirov. 1981. Application ofELDOR in electron-spin echo for paramagnetic center space distribu-tion in solids. Fiz. Tverd. Tela. 23:975–982.
43. Milov, A. D., A. G. Maryasov, and Yu. D. Tsvetkov. 1998. Pulsed elec-tron double resonance (PELDOR) and its applications in free-radicalsresearch. Appl. Magn. Reson. 15:107–143.
44. Jeschke, G., A. Koch, U. Jonas, and A. Godt. 2002. Direct conversion ofEPR dipolar time evolution data to distance distributions. J. Magn.Reson. 155:72–82.
Biophysical Journal 96(8) 3197–3209
45. Milov, A. D., Yu. D. Tsvetkov, F. Formaggio, S. Oancea, C. Toniolo,
et al. 2003. Aggregation of spin-labeled trichogin GA IV dimers:distance distribution between spin-labels in frozen solutions by
PELDOR data. J. Phys. Chem. B. 107:13719–13727.
46. Jeschke, G., G. Panek, A. Godt, A. Bender, and H. Paulsen. 2004. Dataanalysis procedures for pulse ELDOR measurements of broad distance
distributions. Appl. Magn. Reson. 26:223–244.
47. Bowman, M. K., A. G. Maryasov, N. Kim, and V. J. DeRose. 2004.Visualization of distance distribution from pulsed double electron-elec-
tron resonance data. Appl. Magn. Reson. 26:23–40.
48. Milov, A. D., B. D. Naumov, and Yu. D. Tsvetkov. 2004. The effect of
microwave pulse duration on the distance distribution function betweenspin-labels obtained by PELDOR data analysis. Appl. Magn. Reson.26:587–599.
49. Chiang, Y. W., P. P. Borbat, and J. H. Freed. 2005. The determinationof pair distributions by pulsed ESR using Tikhonov regularization.
J. Magn. Reson. 172:279–295.
50. Bode, B. E., D. Margraf, J. Plackmeyer, G. Durner, T. F. Prisner, et al.2007. Counting the monomers in nanometer-sized oligomers by pulsed
electron-electron double resonance. J. Am. Chem. Soc. 129:6736–
6745.
51. Dikanov, S. A., and Yu. D. Tsvetkov. 1992. Electron Spin Echo Enve-
lope Modulation (ESEEM) Spectroscopy. CRC Press, Boca Raton, FL.
52. Salnikov, E. S., D. A. Erilov, A. D. Milov, Yu. D. Tsvetkov, C. Peg-
gion, et al. 2006. Location and aggregation of the spin-labeled peptidetrichogin GA IV in a phospholipid membrane as revealed by pulsed
EPR. Biophys. J. 91:1532–1540.
53. Marsh, D. 2001. Polarity and permeation profiles in lipid membranes.Proc. Natl. Acad. Sci. USA. 98:777–782.
54. Bartucci, R., R. Guzzi, D. Marsh, and L. Sportelli. 2003. Intramembrane
polarity by electron spin echo spectroscopy of labeled lipids. Biophys. J.84:1025–1030.
55. Erilov, D. A., R. Bartucci, R. Guzzi, A. A. Shubin, A. G. Maryasov,
et al. 2005. Water concentration profiles in membranes measured byESEEM of spin-labeled lipids. J. Phys. Chem. B. 109:12003–12013.
56. Peggion, C., M. Jost, C. Baldini, F. Formaggio, and C. Toniolo. 2007.
Total synthesis in solution of TOAC-labeled alamethicin F50/5
analogues. Chem. Biodivers. 4:1183–1199.
57. Szoka, Jr., F., and D. Papahadjopoulos. 1980. Comparative properties
and methods of preparation of lipid vesicles (liposomes). Annu. Rev.Biophys. Bioeng. 9:467–508.
58. Bartucci, R., D. A. Erilov, R. Guzzi, L. Sportelli, S. A. Dzuba, et al.
2006. Time-resolved electron spin resonance studies of spin-labeled
lipids in membranes. Chem. Phys. Lipids. 141:142–157.
59. Jorgensen, W. L., D. S. Maxwell, and J. Tirado-Rives. 1996. Develop-ment and testing of the OPLS all-atom force field on conformational
energetics and properties of organic liquids. J. Am. Chem. Soc.117:11225–11236.
60. Maxwell, D. S., J. Tirado-Rives, and W. L. Jorgensen. 1995. A compre-
hensive study of the rotational energy profiles of organic systems by abinitio MO theory, forming a base for peptide torsional parameters.
J. Comput. Chem. 16:984–1010.
61. Parsegian, V. A., N. Fuller, and R. P. Rand. 1979. Measured work of
deformation and repulsion of lecithin bilayers. Proc. Natl. Acad. Sci.USA. 76:2750–2754.
62. Murzyn, K., T. Rog, W. Blicharski, M. Dutka, J. Pyka, et al. 2006.
Influence of the disulfide bond configuration on the dynamics of thespin-label attached to cytochrome c. Proteins. 62:1088–1100.
63. Rinia, H. A., R. A. Kik, R. A. Demel, M. M. E. Snel, J. A. Killian, et al.
2000. Visualization of highly ordered striated domains induced bytransmembrane peptides in supported phosphatidylcholine bilayers.
Biochemistry. 39:5852–5858.
64. Eaton, S. S., and G. R. Eaton. 2000. Biological Magnetic Resonance,Vol. 19 L. J. Berliner, S. S. Eaton, and G. R. Eaton, editors. Kluwer,
New York.

Alamethicin Channel Structure 3209
65. Maryasov, A. G., and Yu. D. Tsvetkov. 2000. Formation of the pulsed
electron-electron double resonance signal in the case of a finite ampli-
tude of microwave fields. Appl. Magn. Reson. 18:583–605.
66. Tikhonov, A. N. 1995. Numerical Methods for the Solution of Ill-Posed
Problems. Dordrecht, The Netherlands.
67. Tieleman, D. P., B. Hess, and M. S. P. Sansom. 1998. Analysis and
evaluation of channel models. Biophys. J. 83:2393–2407.
68. North, C. L., M. Barranger-Mathays, and D. S. Cafiso. 1995. Membrane
orientation of the N-terminal segment of alamethicin determined by
solid-state 15N NMR. Biophys. J. 69:2392–2397.
69. Chen, F.-Y., M.-T. Lee, and H. W. Huang. 2003. Sigmoidal concentra-
tion dependence of antimicrobial peptide activities: a case study on ala-
methicin. Biophys. J. 84:3751–3758.
70. Stella, L., M. Burattini, C. Mazzuca, A. Palleschi, M. Venanzi, et al.
2007. Alamethicin interaction with lipid membranes: a spectroscopic
study on synthetic analogues. Chem. Biodivers. 4:1299–1312.
71. Parker, M. W., J. P. M. Postma, F. Pattus, A. D. Tucker, and D. Tser-
noglou. 1992. Refined structure of the pore-forming domain of colicin
A at 2.4 A resolution. J. Mol. Biol. 224:639–657.
72. Lakey, J. H., D. Duche, J.-M. Gonzalez-Manas, D. Baty, and F. Pattus.
1993. Fluorescence energy transfer distance measurements. The hydro-
phobic helical hairpin of colicin A in the membrane bound state. J. Mol.Biol. 230:1055–1067.
73. Savitsky, A., M. Kuhn, D. Duche, K. Mobius, and H.-J. Steinhoff.
2004. Spontaneous refolding of the pore-forming colicin A toxin
upon membrane association as studied by X-band and W-band
high-field EPR spectroscopy. J. Phys. Chem. B. 108:9541–9548.
74. Futaki, S., M. Fukuda, M. Omote, K. Yamauchi, T. Yagami, et al. 2001.
Alamethicin-leucine zipper hybrid peptide: a prototype for the design of
artificial receptors and ion channels. J. Am. Chem. Soc. 123:12127–
12134.
75. Brown, L. R., J. Jauterwein, and K. Wuthrich. 1980. High-resolution1H-NMR studies of self-aggregation of melittin in aqueous solution.
Biochim. Biophys. Acta. 622:231–244.
Biophysical Journal 96(8) 3197–3209