Upland interfluve (Doab) deposition: Alternative model to muddy overbank deposits
Upload
wageningen-urCategory
view
0download
0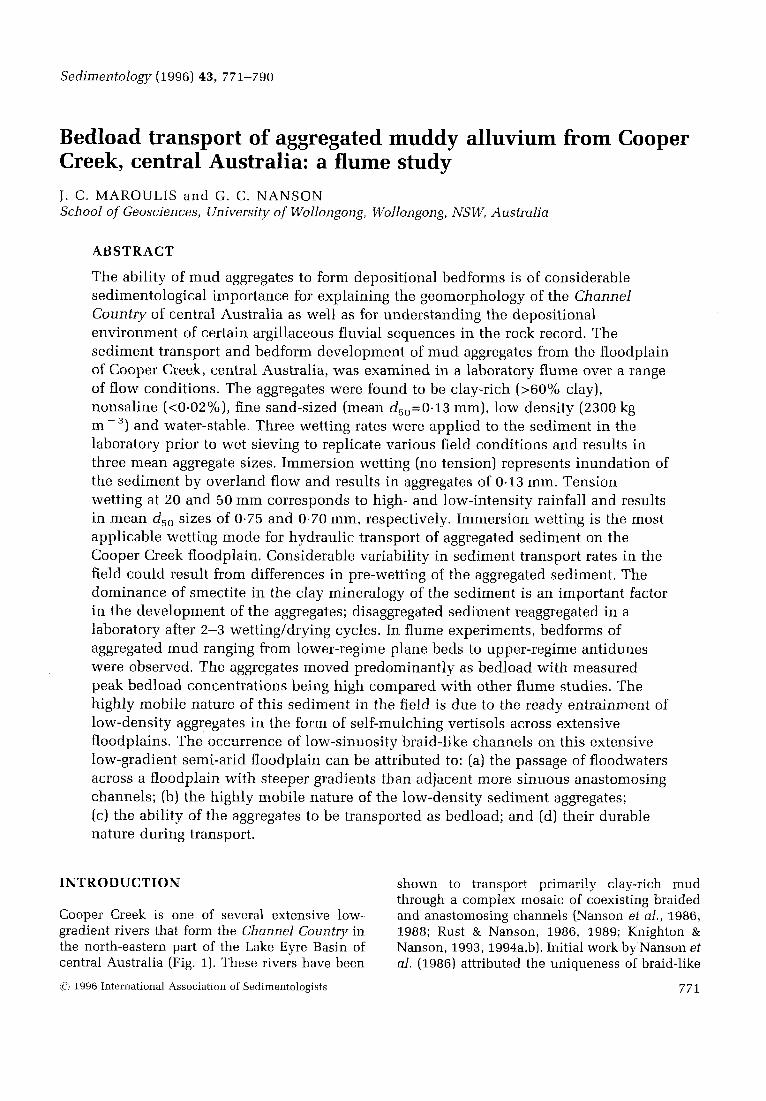
Sedimentology (1996) 43, 771-790
Bedload transport of aggregated muddy alluvium from Cooper Creek, central Australia: a flume study J . C. MAROULIS a n d G. C. NANSON School of Geosciences, University of Wollongong, Wollongong, NS W, Australia
ABSTRACT
The ability of mud aggregates to form depositional bedforms is of considerable sedimentological importance for explaining the geomorphology of the Channel Country of central Australia as well as for understanding the depositional environment of certain argillaceous fluvial sequences in the rock record. The sediment transport and bedform development of mud aggregates from the floodplain of Cooper Creek, central Australia, was examined in a laboratory flume over a range of flow conditions. The aggregates were found to be clay-rich ( > 6 O % clay), nonsaline (<0-02%), fine sand-sized (mean d,,=0.13 mm), low density (2300 kg m - ') and water-stable. Three wetting rates were applied to the sediment in the laboratory prior to wet sieving to replicate various field conditions and results in three mean aggregate sizes. Immersion wetting (no tension) represents inundation of the sediment by overland flow and results in aggregates of 0.13 mm. Tension wetting at 20 and 50 mm corresponds to high- and low-intensity rainfall and results in mean d,, sizes of 0.75 and 0.70 mm, respectively. Immersion wetting is the most applicable wetting mode for hydraulic transport of aggregated sediment on the Cooper Creek floodplain. Considerable variability in sediment transport rates in the field could result from differences in pre-wetting of the aggregated sediment. The dominance of smectite in the clay mineralogy of the sediment is an important factor in the development of the aggregates; disaggregated sediment reaggregated in a laboratory after 2-3 wetting/drying cycles. In flume experiments, bedforms of aggregated mud ranging from lower-regime plane beds to upper-regime antidunes were observed. The aggregates moved predominantly as bedload with measured peak bedload concentrations being high compared with other flume studies. The highly mobile nature of this sediment in the field is due to the ready entrainment of low-density aggregates in the form of self-mulching vertisols across extensive floodplains. The occurrence of low-sinuosity braid-like channels on this extensive low-gradient semi-arid floodplain can be attributed to: (a) the passage of floodwaters across a floodplain with steeper gradients than adjacent more sinuous anastomosing channels; (b) the highly mobile nature of the low-density sediment aggregates; (c) the ability of the aggregates to be transported as bedload; and (d) their durable nature during transport.
INTRODUCTION shown to transport primarily clay-rich mud through a complex mosaic of coexisting braided
Cooper Creek is one of several extensive low- and anastomosing channels (Nanson et a]., 1986, gradient rivers that form the Channel Country in 1988; Rust & Nanson, 1986, 1989; Knighton & the north-eastern part of the Lake Eyre Basin of Nanson, 1993, 1994a,b). Initial work by Nanson et central Australia (Fig. 1). These rivers have been al. (1986) attributed the uniqueness of braid-like
:c", 1996 International Association of Sedimentologists 771

772 J . C. Maroulis and G. C. Nanson
! LAKE EMlE BASIN Currarev;
A N
0 10 20 30 40
km
Sandhill, dune
W Waterhole
0 Gauging station
A Sediment sampling sites
DURHAM DOWN
< 'h \k&cowlah No.1
wlah South
WILSON RIVER
Fig. 1. Map of the middle reaches of Cooper Creek in south-west Queensland depicting the primary anastomosing channels and waterholes plus the location of sites where surface sediment was collected for this study. Inset: Cooper Creek and the other major river systems draining the Lake Eyre Basin.
0 1996 International Association of Sedimentologists, Sedirnentology, 43, 771-790

Bedload transport of muddy alluvium 773
Creek drainage area is extremely erratic. Conse- quently, Lake Eyre fills only several times each century. Mean annual discharge (Q,J at Currareva is 96.7 m3 s - ' and the mean maximum discharge (Qmm) is 476.91 m3 s - l with a maxi- mum daily recorded flood discharge (Q,,,) of 24 974 m3 s - l . At Nappa Merrie, 420 km down- stream (Fig. l), the Q,, is 40.0m3 s-', Q,, is 363-71 m3 s- ' and Q,,, is 5812m3 s - l (Knighton & Nanson, 1994a). Discharges in the Cooper decrease markedly downstream due mainly to seepage and evaporation that exists in the maze of distributary channels, ephemeral lakes, clay pans, aeolian dunes and floodbasins between Windorah and Lake Eyre (Knighton & Nanson, 1993, 1994a,b).
In this study, sediment was collected from the floodplain of Cooper Creek between Durham Downs and Naccowlah Waterhole (Fig. 1) where preliminary work has been done on the sedimen- tary and stratigraphic character and chronology of this extensive river system (Rust, 1981; Rust & Nanson, 1986, 1989; Nanson et al., 1986, 1988, 1992; Maroulis, in progress).
channels formed of mud on the floodplain to the transport of clay-rich sediment as fine sand-sized pedogenic aggregates with densities lower than equivalent-sized quartz grains. To date, however, there exist no quantitative data to explain the sediment transport and resultant landforms of this semi-arid environment. Such information has important implications for understanding the sedimentary stratigraphy in the rock record elsewhere (Rust & Nanson, 1989; Gierlowski- Kordesch & Rust, 1994) as well as contemporary processes that control sediment transport and erosion in these extensive areas of inland Australia (Nanson et al., 1988).
This paper has three aims: (1) to observe and quantify the sediment transport characteristics and bedform development of mud-aggregates in a laboratory flume; (2) to determine the mech- anisms responsible for the transformation of dis- aggregated mud into sand-sized aggregates in a semi-arid fluvial depositional environment; and (3) to explain on the basis of this information the processes responsible for the development of a number of unique fluvial features on the Channel Country of central Australia (Fig. 1).
PHYSICAL SETTING OF COOPER CREEK FLOODPLAIN
Cooper Creek stretches some 800 km from its inception at the junction between the Thompson and Barcoo Rivers north of Windorah in Western Queensland, flowing through a mud-rich environ- ment of increasing aridity to its terminus at Lake Eyre (Fig. 1). It is characterized by very low channel gradients (<0.0002 m m - *), a flood- plain of highly variable width (ranging between 60km at Lake Yamma Yamma and <200m at Innamincka). A vast and complex array of river landforms include coexisting, narrow anastomos- ing channels inset within the floodplain and wide shallow braid-like channels separated by broad, low-relief bars over the surface of a highly vari- able clay-rich, heavily cracked, floodplain sur- face. The predominant soil type on the Cooper floodplain is a vertisol; dark, self-mulching, very deep, heavy grey clay (Northcote, 1965; Stace et al., 1968); with deep wide cracks when dry, exhibiting gilgai patterning (Dawson & Ahern, 1974).
Rainfall in the Lake Eyre Basin ranges from 400 to 500 mm yr - ' in the headwaters of the Cooper to less than 100 mm yr-' in the Simpson Desert (Fig. 1). Flooding in the >300000 km2 Cooper
FLOODPLAIN SEDIMENTS
The Cooper floodplain is characterized by clay- rich mud aggregates (or pellets) that exist over a vast area along the river valleys of the eastern part of the Lake Eyre Basin of central Australia (Nanson et al., 1986, 1988; Rust & Nanson, 1989). Similar aggregates have been reported in fluvial sediments elsewhere by Williams (1970, 1971), in lacustrine sediments by Butler (1956, 1974), Bowler (1973) and Dare-Edwards (1982), and in agricultural soils by Loch & Donnollan (1989), Loch et al. (1989) and Loch & Silburn (1993). Bowler (1973) has proposed a mechanism in saline lakes but to date there have been no detailed observations on the specific conditions required for aggregates to form in this nonsaline environment.
Mechanisms for aggregate development
While various theories have been put forward, the origin of the aggregates in semi-arid environments has been a contentious issue (Rust & Nanson, 1989). Butler (1956, 1974) and Bowler (1973) observed clay aggregates (pellets) in playa lakes in central Australia. They suggested that the highly saline lake waters helped to aggregate fine clays washed in during flooding. Saline groundwater
0 1996 International Association of Sedimentologists, Sedimentology, 43, 771-790

774 J. C. Maroulis and G. C. Nanson
evaporating from the dry playa floor breaks the clays into sand-sized mud aggregates which are transported by aeolian processes onto lee-side lunettes, and possibly further afield onto adjacent floodplains.
In contrast, Nanson et al. (1986, 1988) and Rust & Nanson (1989) argue that salt is unimportant in the Cooper Creek floodplain. In this nonsaline environment, total solute concentrations in the waterholes and surface floodplain soils are of the order of 100ppm (parts per million) or less, insufficient to be a major factor in the develop- ment of aggregates (Nanson et al., 1986). Nanson et al. (1988) suggested that pedogenic mud aggregates are formed during the weathering of argillaceous rocks in the headwaters of the basin. Transported downstream, the aggregates con- tinue to form as a result of pedogenesis in the floodplain soils.
Rust & Nanson (1986) proposed that the aggre- gates could be either biogenic (such as with faecal pellets) or formed in situ on the floodplain by pedogenesis. The biogenic theory is unlikely given the aridity of the environment and the vast area over which the aggregates are found (Rust & Nanson, 1989). Nanson et al. (1988) observed pelleted mud in regolith overlying weathered shales in the upper catchment and reasoned that frequent wetting and drying cycles and the pres- ence of expanding clays aided the aggregation process both in the regolith soils and on the extensive floodplains downstream. They also suggested that rain or flooding, followed by intense baking under a hot subtropical sun appears to be a sufficient mechanism to develop and maintain the aggregated form of the sediment (Nanson et al., 1988; Rust & Nanson, 1989).
With clay contents typically >50%, these alluvial soils are referred to as vertisols (Northcote, 1965; Stace et al., 1968; Loch & Silburn, 1993) and commonly contain smectite (an expandable clay) which gives them shrink- swell characteristics. The tendency for soils which contain smectite to self-mulch, swell and crack, disperse, readily reaggregate and be trans- ported as rolling bedload is typical of vertisillic soils. With the hot daytime and summer tempera- tures in this region these alluvial soils develop deep, wide cracks which assists the self-mulching process. Loose soil falls down the cracks and is compressed when the soil is wetted by rainfall or flooding. As the clay expands, the soil heaves forming mounds at the surface. With drying the soil shrinks and the cracks reform. By this process, the soil is ‘stirred’ or self-mulched
(Coughlan, 1984), and churned within a zone of mixing to a depth of about 0.5 m from the surface.
Coughlan (1984) noted that self-mulching requires ‘low stability to immersion wetting, lack of dispersion and high shrink-swell capacity’ (p. go), conditions that are an exact description of aggregated alluvium in the Channel Country floodplains. The resulting aggregate stability is mainly due to large electrostatic interaction between the clay sheets (Norrish & Tiller, 1976). The presence of calcium ions (Rust & Nanson, 1989) would also assist in the aggregation process of this sediment.
EXPERIMENTAL PROCEDURES
Previous studies
A comprehensive synthesis of flume studies using fine-grained sediment composed of quartz grains in the range of 0.045-0.150 mm is given by Baas (1994). However, there are no reported studies in which primary bedform structures were observed with an aggregated alluvium. Only the flume study of Jopling & Forbes (1979), on a fine non- aggregated quartz silt of glaciofluvial origin, closely approximates the experiment reported here.
Flume apparatus
The flume study was carried out at the University of Wollongong using a 10-m-long, 0-45-m-wide and 0.30-m-deep flume with Perspex sidewalls and adjustable slope which recirculates both water and sediment. This was used to obtain measurements for sediment transport, bedform development and bedform migration rates.
can be generated by the flumes Ajax 150 x 125-200 pump with an impellor diameter of 219 mm which is driven by a 960-r.p.m. 2.2-kW electric motor. Baffles located at the headbox of the flume decreased turbulence and enabled steady flow conditions to be achieved. A 3-m working section which exhibited uniform flow characteristics free of excessive tur- bulence generated in the headbox or draw-down at the outlet was used to collect all hydraulic and sediment transport data.
Flow velocities up to 2 m s
Hydraulic measurements
Velocities were measured using a Nixon 403 ‘Streamflo’ current-meter with an impellor
0 1996 International Association of Sedimentologists, Sedimentology, 43, 771-790

Bedload transport of m u d d y alluvium 775
both sides of the flume at 0.5-m intervals over the 3-m workable reach.
Using a manometer and point gauges, Jopling & Forbes (1979) acknowledged that water surface slope is the most difficult variable to quantify in small-scale flume experiments. In this study slope was measured by using a manometer but because air or sediment could obstruct the manometer tube at times, these values were checked with dumpy-level surveys of the water surface.
Fig. 2. Small transverse/linguoid ripples extending to the Perspex sidewalls of the flume showing no effects of sidewall drag. Flow is from top of figure. Flume width=@45 m.
diameter of 5 m m enabling it to detect small changes in flux in the range of 0.02-1.5 m s ~ '. The current-meter probe was placed on a mobile gantry above the flume; six velocity measure- ments were taken per run to obtain an average flow rate.
Two of the most difficult variables to measure in the flume experiment were flow depth and slope. In particular, flow depth was problematic due to bedform undulations and the difficulty of accurately detecting the surface of the soft muddy bed using a metal probe beneath the opaque water. Consequently, depth of flow was observed through the transparent perspex sidewalls of the flume, a technique adopted by Jopling & Forbes (1979) and Baas (1994). Sidewall corrections were not necessary in this study given that the depth of flow in the flume did not exceed the limit at which wall effects would become significant (Vanoni & Brooks, 1957; Baas, 1994). Figure 2 shows that the bedforms and bed elevations exhibit no deformation towards the sidewalls. Flow depths taken through the Perspex sidewalls of the flume are therefore representative of flow depths across the entire section. To ensure a reasonable estimate of flow depth, a total of 1 2 sidewall observations were recorded during each experimental run. Measurements were made from
Sediment preparation and sampling The sediment used in the flume required no elaborate pre-run preparation. It was poured directly on to the dry base of the flume. As would occur on the floodplain, irregularly shaped blocks of aggregated soil were left intact and the surface was roughly levelled in order to have an even layer of dry sediment on the bed prior to intro- ducing water to the flume. Water was allowed to enter the flume and to flow over the sediment on its own accord in much the same way as overbank flow might leave the anastomosing channels of Cooper Creek and inundate the floodplain. Once a predetermined depth of water had been reached, the pump was started and the flow allowed to equilibrate before data were collected.
Suspended load Using a standard DH 48 suspended sediment sampler, a depth-integrated sample was taken from the centre of the flume in the middle of the test reach. Suspended sediment samples were filtered, dried and weighed. The product of sedi- ment concentration (g L - I) and flow discharge (L s - ') provides an estimate of the transport rate of suspended sediment per unit time (g h - I) and per unit flow area (g h - l m-').
Bedload transport Unlike suspended load, bedload is difficult to sample accurately. In this study, the problem is accentuated since low-density, relatively fragile muddy sediment cannot be trapped as easily as quartz sand. The latter can be caught in sieves but, in this study, there is a problem in determin- ing the transport rates since the sediment is comprised of clay-rich aggregates. Although the aggregates are water stable (Nanson et al., 1986), prolonged soaking and vibration in a sieve would cause some of them to break down and be lost, resulting in an underestimate of bedload.
((3 1996 International Association of Sedimentologists, Sedirnentology, 43, 771-790

776 J . C. Maroulis and G. C. Nunson
Fig. 3. Bedload trap, containing compartmented 1-cm2 aluminium mesh, was set into the bed of the flume at the end of the 3-m working reach.
Furthermore, organic litter in suspension would rapidly clog the sieves and distort the results. As a consequence, bedload was measured using a sampler tray (Fig. 3). Set at the end of the 3-m working reach and extending the width of the flume, the tray was divided into 45 by 35 aluminium cubic mesh 10-mm x 10-mm compart- ments 10mm deep. The sampler was set below the bed of the flume so that it did not adversely affect the flow hydraulics. Sediment moving as bedload fell into the tray, most of it remaining trapped within the mesh compartments during the majority of runs.
Bedload measurements were taken for each experimental run. The sampling time was con- trolled by the rate of infilling of the sediment trap, largely a function of the flow velocity. Little or no sediment was lost at low to moderate flow rates. At higher discharge, where sediment transport rates and flow turbulence were greater, some sediment loss was expected. However, the con- sistent results obtained using this method suggest that the tray sampler provides a useful index of bedload transport, even if the values obtained at high discharges may underestimate the actual transport at these flows.
Sediment collected after each run was oven dried and weighed to give a bedload transport rate (kg h-’) and transport rate per unit channel width (kg h - ’ m - ’).
Bedforms and migration rates
Bedform dimensions, like depth measurements, were determined from sidewall observations. In addition to rates of bedform movement, the wavelengths and amplitudes of bedforms were
recorded over the 3-m working section by taking measurements through both sides of the flume; these were averaged to obtain characteristic bed- form dimensions and rates of movement for each run.
LABORATORY ANALYSES
Determination of the characteristic size distri- bution of the Cooper Creek sediment was difficult due to the aggregated nature of the sediment. The size distribution of the individual clasts (the primary size distribution consisted largely of individual mineral grains) was examined by settling dispersed samples in water and taking measurements with a hydrometer and a pipette. The size distribution of aggregated particles was obtained by wet sieving.
Wet sieving
Wet sieving was employed to assess soil aggregate size distribution with minimal disturbance of the aggregate sizes. This involved the gentle agitation of sediment in a nest of sieves immersed in a cylinder filled with deionized water. The sedi- ment was agitated for 15 min, after which the sieves were separated and the sediment retained in each was washed into containers to be oven dried and weighed.
Prior to sieving, the option exists to ‘pre-wet’ the sediment at a designated tension so as to simulate various rates of water application prior to transport (i.e. high tension replicates low- intensity rains and vice versa). Wetting rates can dramatically affect the size distribution obtained by wet sieving of aggregated sediment (Loch & Donnollan, 1983a,b; Loch & Silburn, 1993). It is therefore important prior to commencing wet sieving to apply a wetting rate appropriate to the antecedent conditions experienced by the sedi- ment in the field. For instance, immersion wetting (no tension) is achieved by placing sediment directly into water. This simulates overland flow over the dry floodplain. Sediment wetting at 20 and 50mm tension replicates intense and gentle rainfall, respectively (Loch & Donnollan, 1983a,b).
Immersion wetting (no tension) was used in this experiment. As noted earlier, floodwaters from the headwaters of the Cooper system can take several weeks to pass over the floodplains from which this sediment was sampled. Given the arid nature of the region (<250 mm of rainfall per
0 1996 International Association of Sedimentologists, Sedimentology, 43, 771-790

Bedload transport of muddy alluvium 777
Table 1. Cooper Creek sediment analysis. Naccowlah Durham
Waterhole Downs (Batches A-C) (Batches D-G)
Deaggregated particle size analysis (YO) Coarse and medium sand 3.5 4.1 Fine and very fine sand 24.9 23.7 Silt 8.9 8.8 Clay 62.7 63.4
Salinity levels (ppm) 150-200 (<0.02%) Density (aggregates) (kg m ~ ”) 2310 2270
year), the possibility of wetting by natural rainfall prior to transport is less likely than total immer- sion. More often than not, the arrival of a flood wave long after local rainfall has ceased results in the immersion of a dry floodplain surface.
Salinity and density measurements Salinity levels were determined by employing a HACH salinity meter probe. Salinity measure- ments were collected for each sediment batch used in the flume. In addition, a salinity sample was taken of water from one of the anastomosing channels of the Cooper on the falling stage of a flood in August 1990.
Two techniques were used to measure sediment density: the standard kerosene method and an alternative using distilled water; however, there was no discernible difference in the values obtained using the two methods.
Wetting/drying investigation
A simple laboratory investigation was conducted to examine the development of aggregates from dispersed sediment. The experiment involved simulating microclimatic conditions on the flood- plain of Cooper Creek to determine how rapidly and under what conditions the floodplain soils will aggregate.
A sample of the original aggregated sediment was mixed with distilled water and dispersed using an ultrasonic bath (Norrish & Tiller, 1976; Walker & Hutka, 1976). It was then transferred to a Petri dish and dried under an infra-red lamp (to simulate drying and heating by the sun) before being immersed in distilled water (to simulate rainfall or flooding). This wetting and drying process was repeated several times and changes in sediment structure were observed under the microscope.
Previous work by Smith (1984) has shown that aggregates dispersed by puddling of clay soils
reaggregated after three wetting-drying cycles and this was most effective for soils which con- tained abundant smectite. In this study, 2-3 wetting-drying cycles were sufficient to regener- ate dispersed Cooper Creek floodplain sediment.
The sediment sample taken near Naccowlah (Fig. 1) was analysed by XRD to determine clay composition. The sample was initially glycolated so that expandable clays were clearly distinguish- able. Results revealed the dominance of mont- morillonitic (smectite) clays with only minor amounts of kaolinite. This is in contrast to the findings of Nanson et al. (1988) and Rust & Nanson (1989, 1991) that kaolinite is the domi- nant clay in the middle reaches of Cooper Creek and swelling clays dominate in proximal reaches. The question of the relative proportion of smectite needed to generate aggregates is still problematic and awaits future research. Rust & Nanson (1991) noted that only minor amounts of swelling clays are required to develop mud aggregates but the proportion needed to develop vertisol struc- ture remains unclear. Determining the relative proportion of smectite in a sample using XRD can be unreliable (B. Chenhall, personal com- munication) and therefore further work is required to establish the link between smectite concentration, the process of aggregation and vertisol development.
SEDIMENT CHARACTERISTICS
Sediment size
About 63% of the nonaggregated size composition of the sediment is clay with the remainder being mostly fine and very fine sand with some silt and coarse sand (Table 1). This contrasts with the aggregated size composition, which indicates that only 25% of the sediment is silt and clay, 57% very fine and fine sand, and 18% medium to coarse sand (Fig. 4). Additional size distributions
0 1996 International Association of Sedimentologists, Sedimentology, 43, 771-790

778 J . C. Maroulis and G. C. Nanson
Particle Size (mm) - Naccowlah#l --+e-- Naccowlah#l Rep 1 (MC=2.8%) Rep 2 (MC=2.9%) - Naccowlah#2 -ti- Naccowlah#2 Rep 1 (MC=5.1%)
Naccowlah South#l ---t- Naccowlah South #1 Rep 1 (MC=4.5%)
Tanu Tanu Rep 1 (MC=2.2%)
Rep 2 (MC=3.2%)
Rep 2 (MC=3.4%)
Rep 2 (MC=2.4%)
Mean dm = 0.13t~11 MC=Moisture Content (%)
Fig. 4. Aggregated size distribution of Cooper Creek floodplain sediment using immersion wetting.
of the aggregated sediment (as shown in Figs 4 & 5) were derived using floodplain sediment obtained from various sites (Fig. 1) subsequent to the initial study (Maroulis, 1992).
The significant effects of wetting rates on median aggregate size are clearly evident (Fig. 5) . Immersion wetting results in an ~ 8 0 % reduction in median aggregate diameter relative to various rates of tension wetting (Table 1). There is no discernible difference in the size distributions for samples at 20 and 50mm tension. This may suggest that the floodplain aggregates are rela- tively stable at mean d,,=0-13 mm (immersion wetting) and 0.70-0.75 mm (tension wetting). Slower rates of tension wetting may produce larger stable aggregate dimensions but this was not pursued in this study.
Variability in aggregate dimensions has import- ant ramifications for modelling the transport of aggregated sediment in settings as varied as large- scale, semi-arid, fluvial environments and the shallow overland flows typical of numerous soil erosion studies in agricultural settings (Loch
2 + 8
Particle Size (mm)
3
Immersion Wetting Mean d50 (mm): Reps 1-4 0.13 Immersion Wetting 0.75 Tension Wetting at 20 mm __O_ Tension at 2cms 0.70 Tension Wetting at 50 mm Reps 1-4 - Tension at 5cms
Reps 1-4
Fig. 5. Effects of wetting rates on aggregated size distri- butions of Cooper Creek floodplain sediment.
et al., 1989; Loch & Silburn, 1993). Therefore, care must be taken to select the most applicable form of wetting if the median aggregate diameter is to be used as a parameter in sediment transport modelling. The use of immersion wetting in this study (Fig. 4) is justified because the Cooper Creek floodplain sediments are transported predominantly by the passage of infrequent floodwaves over a dry floodplain surface. How- ever, sediment transport over a rain-affected floodplain does occur and presents an interest- ing situation to be investigated at some later stage.
Sediment aggregate densities of 2270 and 2310 kg m - 3 were determined for the samples from Naccowlah and Durham Downs, respect- ively (Table I), the difference not considered significant. Nanson et al. (1986) reported an aggregate density of 2310 kg m - 3 for sediment collected at Naccowlah. In this study, a value of 2300 kg m- was used for calculations employing aggregate density. This is 15% lower than the density of quartz sand (2660 k g m P 3 ) and has important implications for the transport behav- iour of these sediments in the flume and in the field.
0 1996 International Association of Sedimentologists, Sedimentology, 43, 771-790

Bedload transport of m u d d y alluvium 779
sufficient to be regarded as a significant variable. Viscosity and density changes due to varying suspended sediment concentration have not been included in the analyses and, although not large, may account for some variability in the results.
Salinity
Salinity (NaCI) levels for the sediment were very low (<0.02 wt%; Table l), a result consistent with other independent reports on sediment from the Cooper Creek floodplain (Ogilvie, 1948; Dawson & Ahern, 1974; Nanson et al., 1986). Given the arid nature of the Eyre Basin, the prevalence of saline lakes in the region and the abundance of calcrete and gypcrete in the subsoil at most locations (below about 2 m; Nanson et al., 1988), the low solute content of the surface 0.5-1.0m of the floodplain is perhaps surprising; however, rain- fall and flooding probably flush the surface sedi- ments clean of soluble salts. This virtual absence of salt in the aggregated sediment has important implications for the way aggregates in this en- vironment are formed (Bowler, 1973; cf. Nanson et a] . , 1988).
A water sample taken during the falling stage of a recent flood event on the Cooper was found to have a salt concentration of only 85ppm. The lack of flocculation in any of the waterholes (both flowing and stagnant) is further evidence of the very low salt concentrations present.
FLUME RESULTS
A total of 33 flume runs were performed during this study using seven separate batches of sedi- ment. Sediment changes were necessary as turbu- lence from the pump's impellor assisted in disaggregating sediment during prolonged trans- port runs of 5-12 h. During each flume run, results were collected promptly once equilibrium flow conditions were attained, thereby minimiz- ing the degree of comminution of the aggregated sediment due to prolonged immersion in water and/or prolonged transport.
The flume was capable of simulating a wide range of flow conditions. Discharges ranged between 1.8 and 30.2 L s - l , mean velocities between 4 and 69 cm s - ', flow depths between 4 and 12cm and slopes between 0.0002 and 0.0041 m m - l . Table 2 presents the basic flow data obtained for the 33 runs while computed flow parameters using data from Table 2 are given in Table 3.
Calculations presented in Table 3 assume the fol- lowing: gravitational acceleration g= 9-81 m s ', kinematic viscosity u = ~ O - ~ k g m - l s p l at 20°C and fluid density p = 1000 kg m at 20 "C. Vari- ations in water temperature occurred between and during each experimental run but were not
Sediment transport and bedform migration Measured transport rates for suspended load (Table 4) ranged between zero and nearly 3916 kg h - l while bedload transport rates (Table 5) ranged between zero and 277.2 kg h p l . Measured peak bedload concentrations were high in comparison with other flume studies in the literature (Brownlie, 1981) which is attributed to the lower aggregate density of the sediment.
As with nonaggregated clastic sediments, recognizable relations exist between the transport rates obtained here (bedload and suspended load) and the flow parameters (velocity and unit stream-power). However, because of changes in aggregate size and suspended load concentration resulting from the comminution of mud aggre- gates during transport, these relationships are not stable through time. Closer examination revealed that the relationship within an individual sedi- ment batch was much better defined than for the total data set. One cause of this is that fine suspended load produced from the breakdown of the aggregated sediment settles on the bed and increases the entrainment threshold for the remaining bedload aggregates.
Comparison with established bedform diagrams The clay aggregates from the Cooper floodplain developed primary bedform structures typical of sedimentary structures formed by sand-sized quartz grains. Bedforms developed include plane bed (with no bedload movement), ripples (Figs 6 & 7), plane bed (transitional) and antidunes (Tables 2 and 6) with measured maximum bed- form migration rates of 3.5 and 3.9 m h - ' also being recorded (Table 6).
Bedform development of fine-grained sedi- ment in upper-regime flow has previously been observed only in a few studies (Baas, 1994). Ripples of varying scales formed readily in the aggregated muds of this study (Figs 6 & 7). Since the aggregated sediment behaved as fine sand- sized grains, the resulting bedforms are similar to those formed of sand in the classic study by Simons & Richardson (1966).
A number of bedform stability diagrams have been published to describe the relationships
xi) 1996 International Association of Sedimentologists, Sedirnentology, 43, 771-790

780 J . C. Maroulis and G. C. Nanson
Table 2. Basic Bow and sediment discharge data.
Water Flow Mean Mean surface
discharge depth velocity slope Temperature Suspended (L s - l ) (cm) (cm s - l ) (m m p l ) ("C) Bedload load
Run no. Bedform Q d LI S T (g s - l ) (g L - l )
Batch A 1 2
Batch B 3 4
Batch C 5 6 7 8 9
10 Batch D
11 12 1 3 14 1 5 16 17 18 19
Batch E 20 21
Batch F 22 23 24 25 26 27
Batch G 28 29 30 31 32 33
Ripples Ripples
Ripples Ripples
Ripples Ripples Ripples Ripples Ripples
Plane bed (LR)
Plane bed (LR) Ripples Ripples Ripples Ripples Ripples Ripples Ripples
Antidunes
Plane bed (UR) Plane bed (UR)
Ripples Ripples Ripples Ripples Ripples Ripples
Ripples Ripples Ripples Ripples Ripples
Plane bed (UR)
20.4 30.2
3.8 18.6
2.7 3.8 5.7
13.5 17.1 2.1
1.8 3.1 4.3
13-4 4-3 3.4 5.0 9.9
14.6
14.9 19.1
4.7 7.1 9.8 9.8
11.2 5.5
8.0 6.9
11.3 10.8 11.0 17.2
8.7 12.0
6.5 6.0
9.8 10.5 10.5 10.7 10.0 11.4
9.8 9.7 9.5 8-3 5.6 4.5 4.0 4.7 5.4
5.5 5.5
6.5 6.6 7.5 5-9 5.8
10.2
9.3 8.5 9.3 8.6 5.7 6.7
52.0 56.1
13.0 69.0
6.2 8.0
12.3 28.0 37.8 4.1
4.3 7.2
10.2 36.0 16.9 17.1 28.3 47.4 59.9
60.2 77.1
16.0 24.2 29.4 37-2 43.0 12.3
18.9 18.1 27.0 28.3 42.8 57.0
0.002 0.001
0.002 0.002
0.002 0.002 0.002 0.002 0.001 0.001
0.001 0.001 0.001 0.001 0-001 0.002 0.001 0.002 0.004
0.003 0.003
0.002 0.002 0.001 0.002 0.004 0.001
0.001 0.001 0.001 0.001 0.002 0.003
23.0 20.0
23.0 23.0
20.0 20.0 20.5 21.0 21.0 20.5
21.0 21.0 21.0 22.0 24.0 24.0 25.0 22.0 24.0
22.0 22.0
15.5 16.5 17.5 16.0 17.0 15.5
16.0 17.5 18.0 20.5 16.0 16.5
nla nla
0.00 nia
0.00 0.00 0.10 0.10 0.33 0.00
0.00 0.00 0.23 0.89 4.50 2.41 1.29
11.35 15.18
18.00 24.04
7.97 15.62 30.05 63-26 63.64
0.00
0.32 0.78 3.35 5.13
37.07 90.69
nla nla
0.06 42.60
0.46 0.43 0.28 3.00 8.40 0.00
0.30 0.55 0.77 8.81 5.30 nla nla 7.34 8.51
8.42 16.92
9.78 33.63 54.59
121.71 230.90
0.21
0.72 1.40 3.43
24.47 24.04 63.24
Note: flume width=0.45 m; UR=upper regime, LR=lower regime, nia=not available.
between flow conditions and associated bed- forms. Figure 8 is one such bedform stability diagram (Southard & Boguchwal, 1990). This presents the relations between flow velocity and grain size for three ranges of flow depth (stand- ardized to 10 "C). The lines on the graphs repre- sent boundaries between various bed states developed from an extensive database involving 39 other flume studies of steady, unidirectional flows. Data for the 33 flume runs using aggregated
Cooper Creek sediment in the present study are plotted in Fig. 8 to examine their correspondence with the bed phases established previously for quartz sands.
The majority of points in this study lie within the boundaries demarcating the bedform types for equivalent-sized quartz grains. Upper-regime plane beds and antidunes in general plot in the appropriate regions of the diagram (Fig. 8). All ripple bedforms conform to the bed phases shown
0 1996 International Association of Sedimentologists, Sedirnentology, 43, 771-790

Bedload transport of m u d d y alluvium 781
Table 3. Parameters derived from basic flow data.
Cross- Darcy- Bed sectional Hydraulic Weisbach shear Stream
area radius friction stress power Reynold’s Froude (cmZ) (4 factor (kg rn-’ s -” ) (N m - l s - l ) number number
Run no. A r f t t. U Re Fr
Batch A 1 2
Batch B 3 4
Batch C 5 6 7 8 9
10 Batch D
11 1 2 13 1 4 15 16 17 18 19
Batch E 20 2 1
Batch F 22 23 24 25 26 27
Batch G 2 8 29 30 31 32 33
391.5 540.0
292.5 2 70.0
441.0 472.5 472.5 481.5 450.0 513.0
441.0 436.5 427-5 373.5 252.0 202.5 180.0 211.5 243.0
247.5 247.5
292.5 297.0 337.5 265.5 261.0 459-0
418.5 387.0 418.5 387.0 256.5 301.5
6.3 7.8
5.0 4.7
6.8 7.2 7.2 7.3 6.9 7.6
6.8 6.8 6-7 6.1 4.5 3.8 3.4 3.9 4.4
4.4 4.4
5.0 5.1 5.6 4.7 4.6 7.0
6.6 6.2 6.6 6.2 4.6 5.2
0.05 0.04
0.69 0.02
0.40 0.26 0.11 0.02 0.06 1.60
0.83 0.29 0.14 0.01 0.15 0.28 0.04 0.04 0.05
0.04 0.02
0.40 0.18 0.07 0.08 0.09 0-16
0.06 0.14 0.10 0.06 0.05 0.04
1.71 1.41
1.47 1.18
0.19 0-21 0.21 0.21 0.98 0.34
0.19 0.19 0.19 0.16 0.55 1.01 0.39 1.06 2.17
1-62 1.62
1.27 1.29 0.74 1.33 2.10 0.30
0.27 0.58 0.91 0.59 1.12 1.71
0.89 0.79
0.19 0.81
0.01 0.01 0.03 0.06 0.37 0.01
0.01 0.01 0.02 0.06 0.09 0.17 0.11 0.50 1.30
0.97 1.25
0.20 0.31 0.22 0.50 0.91 0.04
0.05 0.11 0.25 0.17 0.48 0.97
32 760 43 758
6500 32 430
4216 5 760 8856
20 440 26 082
3116
2924 4896 6834
2 1 960 7605 6498 9622
18 486 26 356
26 488 33 924
8000 1 2 342 16 464 17 484 19 780
8610
1 2 474 11 222 17 820 17 546 19 688 29 640
0.56 0.52
0.16 0.90
0.06 0.08 0.12 0.27 0.38 0.04
0.04 0.07 0.11 0.40 0.23 0.26 0.45 0.70 0.82
0.82 1.05
0.20 0.30 0.34 0.49 0.57 0.12
0.20 0.20 0.28 0.31 0.57 0.70
Note: specific gravity of sediment=2300 kg m - 3 .
but no information is given about the transition between the ripple bed state and the lower-regime plane bed (no motion).
shown to be inappropriate for this study as con- siderable errors in determining slopes in the flume are introduced into the dimensionless shear stress expression (Jopling & Forbes, 1979).
An alternative method which relies on the more Entrainment Of aggregated sediment easily and accurately measured variables of With aggregates of lower relative density than depth and velocity was used for comparison with similar sized quartz sands, it is plausible that the other data. Figure 9 presents a depth-velocity entrainment threshold of the material would also diagram (standardized to 10 “C) for sediment be quite low. Initially, the Shield’s entrainment sizes in the range 0-10-0.14 mm (Southard & curve (Allen, 1985a) was considered, but it was Boguchwal, 1990). Data from some of the 39
0 1996 International Association of Sedimentologists, Sedirnentology, 43, 771-790

782 J. C. Maroulis and G. C. Nanson
Table 4. Suspended sediment transport rates. Table 5. Bedload transport rates.
Gross transport Unit transport Run no. rate (kg h - ') rate (kg h p l m p z ) * Run no.
Gross transport rate (kg h ')
1 2 3 4 5 6 7
9 10 11 12 13 14 15 16 17 18 19 20 21 22 23 24 25 26 27 28 29 30 31 32 33
a
~
n/a n/a 0.06
220.10 0.35 0.45 0.44
11.25 39.90 0.00 0.37 0.47 0.92
32.79 6.33
nla nla 20.19 34.51 34.85 89.77 12-77 66.33
148,61 331.32 718.36
0.32 1.60 2.68
10.77 73.41 73.46
3916
~
n/a n/a
2.05
7.94 9.52 9.31
233.64
0.00
10.77 21.52
877.91 251.19
8151.85
886.67
3.85
nla n/a 954.61
1420.16 1408.08 3627.07 436.58
2267.69 4403.26
12 479.10 27 523.37
6.97 38.23 69.25
257.35 1896.90 2863.94
12 9884
1 2 3 4 5 6 7
9 10 11 12 13 14 15 16 17 1 8 19 20 21 22 23 24 25 26 27
29 30 31 32 33
a
28
nla nla 0.00 nla 0.00 0.00 0.11 0.38 1.56 0.00 0.00 0.00
3.32 5.37
1.79 2.28
61.57 74.54
127.55 10.40
0.28
2.28
30.80
198.00
81.80 172.20
0.00 0.70 1.50
10.50 15.40
17740 277.15
*Transport rate per unit cross-sectional flow area (kg h - m - '); n/a=not available.
other flume studies are shown along with the established boundaries between the various bed phases. Data for all 33 experimental flume runs undertaken here were standardized to 10 "C and plotted (Fig. 9).
Using Southard & Boguchwal's (1990) bedform stability diagram based on directly measured flow velocity and depth (Fig. 9), all points representing upper flow regime and antidunes generally agree with the bed phases shown. Of particular interest however are the points depicting lower-regime flows. The majority of ripple bedforms do plot as expected in both the ripple (R) bed-phase and the no motion (NM) zones of the diagram, but it is the prevalence of points (over 44% of the observed ripple runs) in the NM zone that is of consider- able interest (Fig. 9). Very few studies have reported bedforms developing at flow velocities
Unit transport rate (kg h - ' m- ' )*
n/a n/a 0.00 nla 0-00 0.00 0.24
3.47 0.00 0.00 0.00 0.62
0.84
7.38
3.98
11.93 5.07
5.07 136.82 165.64 283.44
68-44 181.77 382.67
23.11
440.00 0.00 1.56 3.33
23.33 34.22
393.56 615.78
*Transport rate per unit channel width (kg h - m - '); n/a = not available.
below 0.35 m s - ' (Southard & Boguchwal, 1990) yet velocities of <O-1 m s - were sufficient in this flume study to generate small-scale ripples (Fig. 91, implying that ripples and therefore sediment transport can occur at significantly lower flow velocities and stream powers than for equivalent sized quartz grains. This is due primarily to the lower density of the aggregated sediment, allowing it to be readily transported at much lower flow rates than for similar sized clastic sediment. This finding has important implications to the transport of aggregated sediment on the floodplain surface.
Some unusual bedform features observed in the flume Observations highlighting the unique and distinc- tive behaviour of the aggregated sediment in the
0 1996 International Association of Sedirnentologists, Sedimentology, 43, 771-790

Bedload transport of m u d d y alluvium 783
Fig. 6. Asymmetrical ripples (Run 23) showing well-developed foreset laminae. Flow is from left. Scale: 1 unit=l cm.
Fig. 7. Ripple showing primary form-discordant or composite structure (Run 26). Flow is from left. Scale: 1 unit=l cm.
flume are shown in Figs 10 & 11. Several deep scour holes (20-30 mm deep) were observed through the sidewalls in Run 3, illustrating the cohesive nature of the aggregated sediment - a feature not evident in quartz sands. These scour holes are probably caused by turbulence in the lee of the rippled bedform (Fig. 10). There is con- siderable similarity between these scour features and those observed by Jopling & Forbes (1979, p. 81) for a glaciofluvial silt.
During Run 17, a small-scale, low-amplitude (8 mm) asymmetrical ripple was trapped and encased by a larger ripple (Fig. 11). This occurred towards the end of the run when the sediment had been exposed to the flow for 14h after which the flow rate was suddenly increased. During extended periods of transport some of the sediment disaggregated, thereby placing higher concentrations of clay into suspension. With
fluctuating flow conditions, some of this sus- pended load coated the bed with a cohesive skin or 'clay-armour'. This resistant skin of fine sedi- ment is visible in Fig. 11 draped over the original cross-laminae bedding planes and the loosely deposited aggregates of the encased ripple. As a result of the comminution of the aggregates through time, the larger enclosing ripple was more compacted, composed of better-sorted, finer-grained sediment, and showed no obvious bedding planes while the smaller, encased ripple maintained its original form with the undispersed aggregates clearly evident (Fig. 11).
In Run 31, a velocity of 28 cm s- ' (flow dis- charge of 1043 L s-') was maintained for 28 h. During this period ripples developed and migrated downstream at a rate of 0.42 m h - l . In the first 18-22 h the ripples appeared hummocky as rounding of the upstream and downstream
C) 1996 International Association of Sedirnentologists, Sedimentology, 43, 771-790

784 J. C. Maroulis and G. C. Nanson
Table 6. Bedform dimensions and migration rates. Mean bedform dimensions
Migration rate Amplitude Wavelength 1/H
Run no. (m h-’) (m (cm) (4 (cm) (-4 Bedform
- 1 2 3 40.0 4 30.0 5 <0.5 6 <0.5 7 0-5 8 11.1 9 49.6
10 0.3 11 <0.5 12 <0*5 13 <0.5 14 <0.5 15 1.2 16 6.8 17 13.8 18 19 20 2 1 22 72.1 23 102.2 24 138.0 25 139.9 26 130.2 27 3.7 28 39.0 29 21.0 30 42.3 31 42-1 32 347.8 33 394.4
-
- - - -
- - 2.5 10.0 2.0 20.3 1.5 25.0 0.1 0.5 0.2 3.0 0.2 11.0 1.4 8.5 - -
<0.1 - <0.1 - <0.1 - <0.1 -
0.3 4.0 2.6 16.1 1.8 9.9 2.0 10.5 - - - - - - - - 1.9 15.0 1.9 12.9 2.2 15.1 1.6 14.1 2.3 22-0 0.2 2.3 1.7 9.4 2.8 14.8 2.1 12.4 2.0 13.9 1.6 11.8 1.3 12.2
- 4.0
10-2 16.7 5-0
15.0 55.0 6.1 - - - - -
13.3 6.2 5.5 5.3 - - - - 7.9 6.8 6.9 8.8 9-6
11.5 5.5 5.3 5.9 7.0 7.4 9.4
Ripples Ripples Ripples Ripples Ripples Ripples Ripples Ripples Ripples
Plane bed (LR) Plane bed (LR)
Ripples Ripples Ripples Ripples Ripples Ripples Ripples
Antidunes Plane bed (UR) Plane bed (UR)
Ripples Ripples Ripples Ripples Ripples Ripples Ripples Ripples Ripples Ripples Ripples Ripples
sides of the ripples took place. The bed then became more compacted, reducing the proportion of loosely packed aggregates and entrapped air pockets. After 22 h, a very resistant grey-coloured clay layer with an average thickness of 8 m m formed over the entire surface of the bed. This clay layer draped a gently undulating surface, making it very resistant to changes in flow con- ditions. The clay drape was very smooth, required force to penetrate and acted as a ‘clay-armour’ protecting the coarser aggregates beneath. This feature was similar in appearance to the bedforms shown in Fig. 11.
In all cases in which the flow velocity was varied early in a run, the bedforms changed read- ily in response to the altered hydraulic con- ditions. Therefore, it was important to collect the necessary data before significant comminution of sediment occurred and before a ‘clay-armour’ had a chance to form.
SUMMARY AND DISCUSSION
Factors involved in the development of the aggregated sediment Butler (1956, 1974), Bowler (1973) and Dare- Edwards (1982) observed the development of clay pellets and concluded that salt is the important ingredient in the aggregation process in semi-arid central Australia. However, measured salt con- centrations of the aggregated sediment of the Cooper floodplain varied between 150 and 200ppm or <0.02% of the sample (Table 11, a level insufficient to be a controlling factor in the aggregation process as noted by Nanson et al. (1986, 1988) and Rust & Nanson (1989, 1991).
In addition, that aggregates can be regenerated from disaggregated alluvium after only 2-3 wetting-drying cycles provides clear evidence that the aggregates can be developed in situ on the floodplains and under nonsaline conditions due
0 1996 International Association of Sedimentologists, Sedimentology, 43, 771-790
Bedload transport of m u d d y alluvium 785
sunlight and hot winds produces a light ‘fluffy’ soil structure with a very high void ratio. The surface soil exhibits very well-developed aggre- gates that are easily entrained by floodwaters and are subject to rill erosion during heavy rain- storms. As more alluvial mud accumulates at the surface, the subsoil becomes compacted, increas- ingly so with depth, and the pelleted structure disappears (Nanson et al., 1988). At depths of 1-2 m the original pelleted aggregates are com- pressed into a uniform clay matrix with grains of quartz sand (Fig. 12).
primarily to the physical properties of the clays in the soil. Aggregates appear to be formed at the floodplain surface. Flooding and rainstorms cause puddling of the soil, and drying in intense
0.2 - cn . E z 3 x 0 0
>
-
4- .-
5 1.0
- 2
f
c
C m
r C
m > 1 0- a, I
a, 0.2 .-
4
1 I I1 I I I 1 , 1 1 1 1 , , , 1 I I l l
i + A
0 0 + A
1.0
0.2
0.05 0.13mm 1.0 8.0
Mean Grain Size (mm)
* 100 C-equivalent mean
KEY: This study:
flow depth dlo (rn)
0 ANTIDUNE (A1
4 UPPER REGIME PLANE BED (UP1
5 RIPPLES (R)
LOWER REGIME PLANE BED (LP)
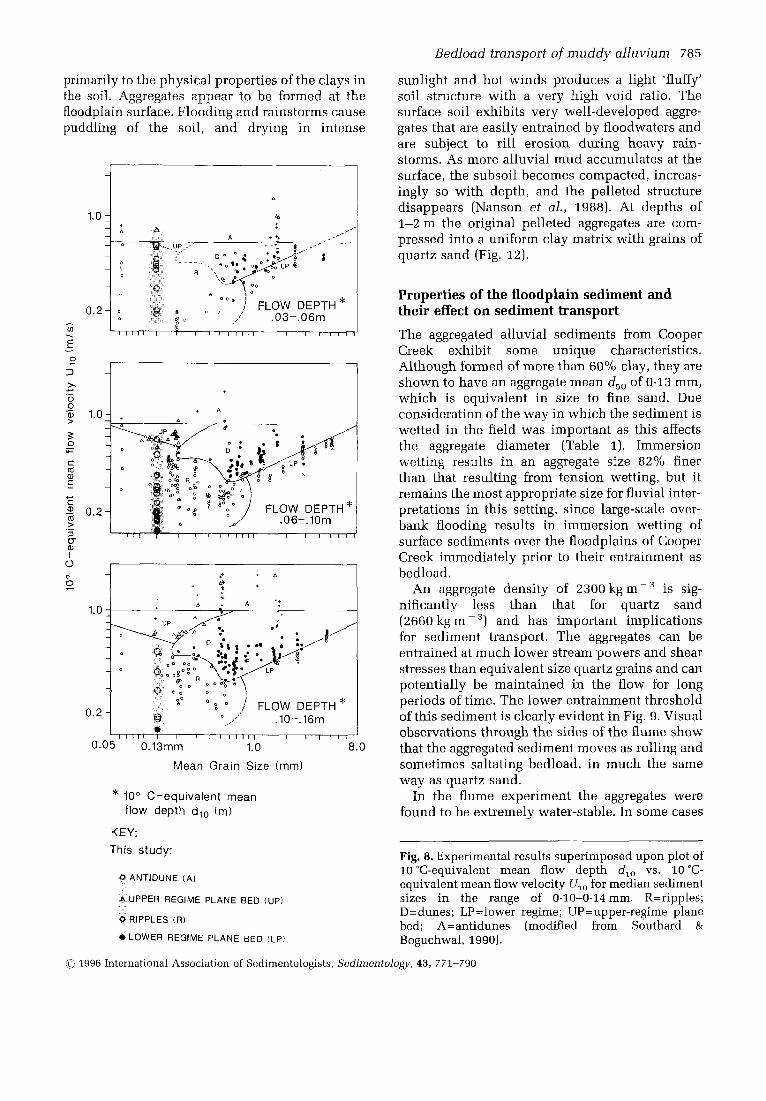
Properties of the floodplain sediment and their effect on sediment transport
The aggregated alluvial sediments from Cooper Creek exhibit some unique characteristics. Although formed of more than 60% clay, they are shown to have an aggregate mean d,, of 0.13 mm, which is equivalent in size to fine sand. Due consideration of the way in which the sediment is wetted in the field was important as this affects the aggregate diameter (Table 1). Immersion wetting results in an aggregate size 82% finer than that resulting from tension wetting, but it remains the most appropriate size for fluvial inter- pretations in this setting, since large-scale over- bank flooding results in immersion wetting of surface sediments over the floodplains of Cooper Creek immediately prior to their entrainment as bedload.
An aggregate density of 2300 kg m P 3 is sig- nificantly less than that for quartz sand (2660 kg m ~ ’) and has important implications for sediment transport. The aggregates can be entrained at much lower stream powers and shear stresses than equivalent size quartz grains and can potentially be maintained in the flow for long periods of time. The lower entrainment threshold of this sediment is clearly evident in Fig. 9. Visual observations through the sides of the flume show that the aggregated sediment moves as rolling and sometimes saltating bedload, in much the same way as quartz sand.
In the flume experiment the aggregates were found to be extremely water-stable. In some cases
Fig. 8. Experimental results superimposed upon plot of 10°C-equivalent mean flow depth d,, vs. 10°C- equivalent mean flow velocity U,, for median sediment sizes in the range of 0.10-0.14 mm. R=ripples; D=dunes; LP=lower regime; UP=upper-regime plane bed; A=antidunes (modified from Southard & Boguchwal, 1990).
0 1996 International Association of Sedimentologists, Sedimentology, 43, 771-790

786 J. C. Maroulis and G. C. Nanson
0.6
1.0 -I I I I
I I
0.14 0.2 0.4 0.6 0.8 1.0 2:o Velocity (m/s)
KEY: This studv:
UPPER PLANE BED (UP) Median Size Range .lo-.14mm
ANTIDUNES (A)
RIPPLES (R) NO MOVEMENT (NM)
Fig. 9. Experimental results superimposed upon bed- form existence diagram of depth vs. velocity showing the various bed-phases, especially NM and R bed states for a median sediment size range of 0.10-0.14mm. NM=no movement; R=ripples; D=dunes; LP=lower regime; UP=upper-regime plane bed; A=antidunes (modified from Southard & Boguchwal, 1990).
the flume was operated continuously for 24 h before significant disaggregation of the clay aggre- gates occurred. Due to turbulence in both the return pipe and the impeller of the pump, the
amount of disaggregation that occurred in the flume would probably be much higher than would occur under natural field conditions. Therefore, preservation and maintenance of the soil aggregates is probably more effective in the field than in the highly turbulent laboratory flume. In a major flood event, given that they are water-stable, the aggregates may be transported many hundreds of metres or even several kilo- metres before being deposited. Furthermore, since they are not completely broken down by transport (Norrish & Tiller, 1976), clay pellets in the field may require only one wetting-drying cycle before being available for transport again. The result is an abundance of aggregated sediment available for transport, some formed or reformed in situ from disaggregated sediment but most transported intact from upstream localities. However, on the floodplain, the sediment would be subjected to long periods of inundation due to slow moving flood waters typical of the low-gradient interior drainage network of central Australia, and there- fore most of the active transport would occur during the passage of the leading edge of the floodwave (Nanson et a]., 1986) and could be over in a matter of hours. It is envisaged that the sediment will through time disaggregate due to prolonged wetting but the rate of disaggregation is probably lower than in the highly turbulent flume. Disaggregated muds have been observed by us as a surface coating over bedforms in the field following prolonged periods of overbank flow.
In the flume, bedload transport of aggregates was the dominant mode of sediment transport at high flow rates while suspended-load transport dominates at lower flow rates. Given the low
Fig. 10. Deep scourhole located behind a small climbing ripple (centre) which trails a larger ripple (Run 3). Air bubbles trapped at the sidewall are also visible. Flow is from left. Scale: 1 unit=l cm.
0 1996 International Association of Sedirnentologists, Sedimentology, 43, 771-790

Bedload transport of m u d d y alluvium 787
Fig. 11. Small low-amplitude ripple encased by a larger, compacted ripple (Run 17). Aggregates are clearly evident in the smaller ripple but not in the larger ripple. Flow is from left. Scale: 1 unit=l cm.
entrainment threshold of the aggregated sedi- ment, it is not surprising that initial transport rates are very high. Compared with a compilation of flume and river data over the last 100 years (Brownlie, 1981), peak bed and suspended material concentrations presented in this study are significantly higher. Transport rates up to 129 884 kg h m - for suspended load and 615.8 kg h- ' m ~ for bedload recorded in the flume may have major implications for large-scale sediment transport in the field. However, given the infrequent nature of overland flow, the break- down of pedogenic aggregates during periods of prolonged immersion, the increasing aridity downstream (Fig. l), the very low gradients and the vast widths of the Cooper floodplain (about 16 km wide at Durham Downs and >50 km south of Windorah; Fig. 1) which effectively dissipate flow energy, the total sediment yield per decade or century may be relatively small.
Development of bedforms
The aggregated sediment of the Cooper floodplain is readily transported as rolling bedload of fine- sand size; it is water stable. Therefore, it is not surprising that bedforms develop. While there are little detailed data on bedforms for sedi- ments with median diameters less than 0.2 mm, especially for aggregated sediment, the infor- mation obtained here for the transport and deposition of aggregates with a mean d,, of 0.13 mm shows that they have similar transport and depositional properties to clastic sands (Figs 8 & 9). However, the observed bedforms and incipient motion generally occurred at lower
stream powers (Simons et al., 1965) and shear stresses than for equivalent sized quartz sand (Fig. 9).
The identification of bedform development in nonsaline muddy sediments has important geological implications (Ekes, 1993; Gierlowski- Kordesch & Rust, 1994). Sedimentologists have in the past attributed bedform structures in mudrock sequences to saline depositional environments on oceanic continental margins where turbidity currents prevail (Allen, 1968, 1985a,b) and in arid areas where extensive halite deposits are present (Karcz & Zak, 1987). In this study, an aggregated clay-rich sediment developed bedforms under conditions similar to those that generate bedforms from quartz grains of similar size. To date, only Rust & Nanson (1989) and Gierlowski-Kordesch & Rust (1994) have proposed fluvial transport conditions similar to those described here to explain ancient mud units in the stratigraphic record.
Channel planform development
The observations by Nanson et al. (1986) of the coexistence of two distinct yet contemporary channel planforms (braided and anastomosing) and the presence of braided channels formed in mud are especially noteworthy. The phenomenon of mud braids as flood conduits over the flood- plain they attributed to the transport of clay-rich sediment as fine sand-sized pedogenic aggregates with densities lower than quartz grains.
Braid channels normally require relatively steep channel gradients to form (Schumm, 1981); however, the abundant light-weight mud
JJ 1996 International Association of Sedimentologists, Sedirnentology, 43, 771-790

788 J. C. Maroulis and G. C. Nanson
Fig. 12. Floodplain sediment from Naccowlah in vari- ous stages of compaction resulting from floodplain accretion. (a) Loose surface mud showing mud pellets (black) and quartz sand grains. (b) Thin section from 1 in beneath floodplain surface. (c) Thin section at 2 m depth. With depth the mud compacts to an almost structureless matrix around the quartz grains.
aggregates in the Channel Country result in shallow braid-like channels forming at slopes of about 0.0002 during overbank flow across exten- sive floodplains (Nanson et al., 1986). During low to moderate (in-channel) flows, water and sedi- ment are transported in the numerous relatively deep and narrow anastomosing channels. In these highly sinuous channels, gradients can be par- ticularly low (<04J002). At high flows, flood- waters overtop the floodplain and take a more
(, 1996 Iiiternationa
direct course downstream, developing a steeper braid-like channel system eroded into the loose friable aggregated sediments on the floodplain surface. The relatively low density of the sedi- ment aggregates means that initially large quan- tities of this material can be entrained as bedload at relatively low stream powers. However, during the course of these prolonged flood events, the aggregates do eventually breakdown. They bind together to form a surface that is relatively co- hesive and resistant to transport, a form of ‘mud armouring’. This surface is reworked to sand- sized mud aggregates again during only a few subsequent wetting and drying cycles.
CONCLUSION
This study has examined the fluvial transport of aggregated clay-rich mud in a laboratory flume. The aggregates of median diameter 0.13 mm behave in a manner analogous to fine sand in that they develop lower, transitional and upper- regime bedforms in response to varying stream power.
At higher flow rates, most of the sediment was transported as bedload at rates that were found to be very high when compared with those for quartz sand (Brownlie, 1981). The high rates of transport are attributed to the more mobile nature of the aggregates with lower densities and therefore lower entrainment thresholds than equivalent sized quartz grains.
Aggregate formation is believed to be largely a function of the clay mineralogy of the sediment, especially the presence of expandable clays such as smectite (Rust & Nanson, 1989). The impor- tance of salt (NaCI) in the formation of these aggregates is insignificant, as demonstrated by their low salt content and development in the laboratory after only 2-3 wetting-drying cycles using distilled water.
Given the clay-rich nature of sediment in Cooper Creek, the presence of anastomosing channels is to be expected. However, the coexist- ence of both high-sinuosity anastomosing and low-sinuosity braid-like channels is not (Nanson et al., 1986). Braids are normally present where sediment load is coarse, slopes are steep and flow depths are shallow (Leopold & Wolman, 1957). The braid-like features on Cooper Creek flood- plain can be attributed to: (a) steeper channel gradients produced by downvalley flow over the floodplain during the passage of a flood; (b) the initially highly mobile nature of the sediment
11 Association of Sedimentologists, Sedimentology, 43. 771-790

Bedload transport of m u d d y alluvium 789
Ekes, C. (1993) Bedload-transported pedogenic mud aggregates in the Lower Old Red Sandstone in southwest Wales. J. Geol. Soc., Lond., 150, 469-471.
Gierlowski-Kordesch, E. and Rust, B.R. (1994) The Jurassic East Berlin Formation, Hartford Basin, Newark Supergroup (Connecticut and Massachusetts): a saline lake-playa-alluvial plain system. In: Sedimentology and Geochemistry of Modern and Ancient Saline Lakes (Ed. by R. W. Renaut & W. M. Last), Spec. Publ. SOC. Econ. Paleont. Miner., 50, 249-265.
Jopling, A.V. and Forbes, D.L. (1979) Flume study of silt transportation and deposition. Geogr. Ann., 61,
Karcz, I. and Zak, I. (1987) Bedforms in salt deposits of the Dead Sea brines. J. sedim. Petrol., 57, 723-735.
Knighton, A.D. and Nanson, G.C. (1993) Anastomosis and the continuum of channel pattern. Earth Surf. Process. Landforms, 18, 613-625.
Knighton, A.D. and Nanson, G.C. (1994a) Flow transmission along an arid-zone anastomosing river, Cooper Creek, Australia. Hydrol. Process., 8,
Knighton, A.D. and Nanson, G.C. (1994b) Waterholes and their significance in the anastomosing channel system of Cooper Creek, Australia. Geomorphology,
Leopold, L.B. and Wolman, M.G. (1957) River channel patterns-braided, meandering and straight. Prof. Pap. US Geol. Surv., 282B.
Loch, R.J. and Donnollan, T.E. (1983a) Field rainfall simulator studies on two clay soils of the Darling Downs, Queensland. I. The effects of plot length and tillage orientation on erosion processes and runoff and erosion rates. Aust. J . Soil Res., 21, 33-46.
Loch, R.J. and Donnollan, T.E. (1983b) Field rainfall simulator studies on two clay soils of the Darling Downs, Queensland. 11. Aggregate breakdown, sedi- ment properties and soil erodibility. Aust. J. Soil Res., 21, 47-58.
Loch, R.J. and Donnollan, T.E. (1989) Rill erosion of a self-mulching black earth. I. Effects of tillage treatment. Aust. J. Soil Res., 27, 525-534.
Loch, R.J., Maroulis, J.C. and Silburn, D.M. (1989) Rill erosion of a self-mulching black earth. 11. Comparison of sediment transport equations. Aust. J . Soil Res., 27,
Loch, R.J. and Silburn, D.M. (1993) Erosion processes and contaminant transport. In: Environmental Soil Science (Ed. by I. F. Fergus & K. J. Coughlan), pp. 77-106. Australian Society of Soil Science Inc., Qld. Branch, Brisbane, Australia.
Maroulis, J.C. (1992) Sediment transport of fine grained alluvium from Cooper Creek, Central Australia. MSc (Hons) thesis, University of Wollongong.
Nanson, G.C., Price, D.M. and Short, S.A. (1992) Wetting and drying of Australia over the past 300 ka. J. Geol., 20, 791-794.
Nanson, G.C., Rust, B.R. and Taylor, G. (1986) Coexist- ent mud braids and anastomosing channels in an arid zone river: Cooper Creek, Central Australia. Geology,
67-85.
13 7-1 54.
9, 311-324.
53 5-542.
14, 175-178.
with low entrainment thresholds aided by the low density of the sediment and its highly dispersed fluffy nature when dry; (c) the ability of the sediment to be transported as bedload aggregates; and (d) the durability of the sediment aggregates during the early stages of a flood.
ACKNOWLEDGMENTS
This research was funded by the Australian Research Council and the University of Wollongong. The authors would like to acknowl- edge Dr R. J. Loch for assistance in sediment analysis, Dr B. Chenhall for XRD analysis and Dr Martin Gibling for constructive comments on an earlier manuscript. Logistical support was provided by SANTOS Ltd. (Aust.).
REFERENCES
Allen, J.R.L. (1968) Current Ripples: Their Relation to Patterns of Water and Sediment Motion. North Holland Publ. Co., Amsterdam.
Allen, J.R.L. (1985a) Principles of Physical Sedimen- tology. George Allen and Unwin Ltd, London.
Allen, J.R.L. (1985b) Loose-boundary hydraulics and fluid mechanics: selected advances since 1961. In: Sedimentology: Recent Developments and Applied Aspects (Ed. by P. J. Brenchley and B. P. J. Williams), Geol. SOC. Spec. Publ., 18, 7-28.
Baas, J.H. (1994) A flume study on the development and equilibrium morphology of current ripples in very fine sand. Sedimentology, 41, 185-209.
Bowler, J.M. (1973) Clay dunes: their occurrence, formation and enviromental significance. Earth Sci. Rev., 9, 315-338.
Brownlie, W.R. (1981) Compilation of alluvial channel data. Laboratory and Field. Rept. KH-R-43B, California Institute of Technology, Pasadena.
Butler, B.E. (1956) Parna - an aeolian clay. Aust. J. Sci.,
Butler, B.E. (1974) A contribution towards the better specification of parna and some other aeolian clays in Australia. Z. Geomorphol., 20, 106-116.
Coughlan, K.J. (1984) The structure of Vertisols. In: The Properties and Utilisation of Cracking Clay Soils (Ed. by J. McGarity, P. Hault & K. So), Reviews in Rural Science, 5, pp. 87-96. Uni. of New England.
Dare-Edwards, A.J. (1982) Clay pellets of clay dunes: types, mineralogy, origin and effect of pedogenesis. In: Quaternafy Dust Mantles of China, New Zealand and Australia (Ed. by R. J. Wasson), pp. 179-189. Aast. Nat. Uni.
Dawson, N.M. and Ahern, C.R. (1974) Soils. In: Western Arid Region: Land Use Study-Part 1. Department of Primary Industries, Queensland. Technical Bulletin,
18, 145-151.
12, 18-46.
0 1996 International Association of Sedimentologists, Sedirnentology, 43, 771-790

790 J. C. Maroulis and G. C. Nanson
Nanson, G.C., Young, R.W., Price, D.M. and Rust, B.R. (1988) Stratigraphy, sedimentology and Late Quaternary chronology of the Channel Country of Western Queensland. In: Essays in Australian Fluvial Geomorphology (Ed. by R. F. Warner), pp. 151-175. Academic Press, Sydney.
Norrish, K. and Tiller, K.G. (1976) Subplasticity in Australian Soils. V. Factors involved and techniques of dispersion. Aust. J . Soil Res., 14, 273-289.
Northcote, K.H. (1965) A Factual Key for the Recog- nition of Australian Soils, 2nd edn. C.S.I.R.O., Aust. Div. Soils, Divl. Rept., 2/65.
Ogilvie, C. (1948) The hydrology of Cooper’s Creek. Bureau of Investigations, Tech. Bull., 1, 36-70.
Rust, B.R. (1981) Sedimentation in arid-zone anastomo- sing fluvial system: Cooper Creek, Central Australia. J. sedim. Petrol., 51, 745-755.
Rust, B.R. and Nanson, G.C. (1986) Contemporary and palaeochannel patterns and the Late Quaternary stratig- raphy of Cooper Creek, southwest Queensland, Australia. Earth Sud. Process. Landforms, 11, 581-590.
Rust, B.R. and Nanson, G.C. (1989) Bedload transport of mud as pedogenic aggregates in modern and ancient rivers. Sedimentology, 36, 291-306.
Rust, B.R. and Nanson, G.C. (1991) Reply. Sedimentol-
Schumm, S.A. (1981) Evolution and the response of the fluvial system, sedimentological implications. Spec. Publ. SOC. Econ. Paleont. Miner., 31, 19-29.
Simons, D.B. and Richardson, E.V. (1966) Resistance to flow in alluvial channels., Prof. Pap. US Geol. Surv.,
Simons, D.B., Richardson, E.V. and Nordin, C.F., Jr. (1965) Sedimentary structures generated by flow in
ogy, 38, 157-160.
422-J.
alluvial channels. Spec. Publ. SOC. Econ. Paleont. Miner., 12, 34-52.
Smith, G.D. (1984) Soil constituent and prehistory effects on aggregate porosity in cracking clays. In: The Properties and Utilisation of Cracking Clay Soils (Ed. by, J. McGarity, P. Hault & K. So), Reviews in Rural Science, 5, pp. 87-96. Uni. of New England,
Southard, J.B. and Boguchwal, L.A. (1990) Bed con- figurations in steady unidirectional water flows. Part 2. Synthesis of flume data. 1. sedim. Petrol., 60,
Stace, H.C.T., Hubble, G.D., Brewer, R., Northcote, K.H., Sleeman, J.R., Mulcahy, M.J. and Hallsworth, E.G. (1968) A Handbook of Ausfralian Soils. Glenside, S.A., C.S.I.R.O.
Vanoni, V.A. and Brooks, N.H. (1957) Laboratory studies of the roughness and suspended load of alluvial streams. Rept. E-68, Sedimentation Laboratory, California Inst. Technology, Pasadena.
Walker, P.H. and Hutka, J. (1976) Subplasticity in Australian Soils. 111. Particle-size properties of soil materials of varying plasticity. Aust. /. Soil Res., 14,
Williams, G.E. (1970) Piedmont sedimentation and late Quaternary chronology in the Biskra region of the northern Sahara. Z. Geomorphol., 10, 40-63.
Williams, G.E. (1971) Flood deposits of the sand- bed ephemeral streams in central Australia. Sedimentology, 17, 1-40.
658-679.
24 9-2 60.
Manuscript received 16 March 1995; revision accepted 15 January 1996.
0 1996 International Association of Sedimentologists, Sedirnentology, 43, 771-790
Copyright © 2022 FDOKUMEN