Relationships between hydraulic variables and bedload transport in a subalpine channel, Colorado...
13
ELSEVIER Geomorphology 22 (1998) 359-371 Relationships between hydraulic variables and bedload transport in a subalpine channel, Colorado Rocky Mountains, U.S.A. Clifford R. Blizard, Ellen E. Wohl 1,, Department of Earth Resources, Colorado State University, Ft. Collins, CO 80523 USA Received 10 January 1997; revised 27 May 1997; accepted 9 June 1997 Abstract This study used three cross-sections along a subalpine channel to examine associations between flow and sand and gravel bedload transport in a cobble-bed channel. At each section, velocity was measured at 0.2, 0.4, 0.6, and 0.8 of flow depth for ten increments across the section. At each increment, velocity measurements were immediately followed by 10-min bedload samples with a 7.6 crn Helley-Smith sampler. Linear regressions between bedload and flow variables suggest that grain shear stress, stream power, near-bed velocity, average velocity, and the Froude number are the most relevant indicators of bedload transport, particularly when regressed against the D~ or Ds4 of the bedload grain-size distribution. No significant relationships, however, were constant at all three cross-sections. Inconsistency in relationships between bedload discharge and hydraulic variables is at least in part the result of the extreme temporal and spatial variability present in East St. Louis Creek. Photographs and observations made throughout the field season suggest the importance of random events, such as tree-fall and log-jam formation, in regulating bedload discharge. The data from East St. Louis Creek suggest equal mobility for sand and gravel transport. © 1998 Elsevier Science B.V. Keywords: bedload transport; subalpine channel; equal mobility I. Introduction Relatively little is known of flow hydraulics and sediment transport in high-gradient, subalpine streams (Grant et al., 1990). Large boundary rough- ness and steep bed gradients promote extreme turbu- lence (Chin, 1989). When applied to high-gradient channels, the equations for bedload transport devel- oped for lower gradient streams greatly overpredict the actual quantity of sediment transported (Blizard, * Corresponding author. 1 E-mail: [email protected] 1994). In regions such as the Colorado Rocky Moun- tains, however, flow in these high-gradient channels is increasingly being diverted for agricultural and municipal use. To assess, and eventually minimize, the impacts of present and future flow diversion from such channels, studies to assess the relations between flow and sediment discharge in these com- plex systems have been undertaken. One of the most basic questions is whether or not predicting the effect of flow diversion on bedload transport in a given channel using physical parameters that are relatively easy to measure, such as flow depth and velocity, channel slope, and grain-size distribution, is possible. The research summarized here addresses 0169-555X/98/$19.00 ~ 1998 Elsevier Science B.V. All fights reserved. PII S0169-555X(97)00055-X
Transcript of Relationships between hydraulic variables and bedload transport in a subalpine channel, Colorado...

E L S E V I E R Geomorphology 22 (1998) 359-371
Relationships between hydraulic variables and bedload transport in a subalpine channel, Colorado Rocky Mountains, U.S.A.
Clifford R. Blizard, Ellen E. Wohl 1,, Department of Earth Resources, Colorado State University, Ft. Collins, CO 80523 USA
Received 10 January 1997; revised 27 May 1997; accepted 9 June 1997
Abstract
This study used three cross-sections along a subalpine channel to examine associations between flow and sand and gravel bedload transport in a cobble-bed channel. At each section, velocity was measured at 0.2, 0.4, 0.6, and 0.8 of flow depth for ten increments across the section. At each increment, velocity measurements were immediately followed by 10-min bedload samples with a 7.6 crn Helley-Smith sampler. Linear regressions between bedload and flow variables suggest that grain shear stress, stream power, near-bed velocity, average velocity, and the Froude number are the most relevant indicators of bedload transport, particularly when regressed against the D ~ or Ds4 of the bedload grain-size distribution. No significant relationships, however, were constant at all three cross-sections. Inconsistency in relationships between bedload discharge and hydraulic variables is at least in part the result of the extreme temporal and spatial variability present in East St. Louis Creek. Photographs and observations made throughout the field season suggest the importance of random events, such as tree-fall and log-jam formation, in regulating bedload discharge. The data from East St. Louis Creek suggest equal mobility for sand and gravel transport. © 1998 Elsevier Science B.V.
Keywords: bedload transport; subalpine channel; equal mobility
I . I n t r o d u c t i o n
Relatively little is known of flow hydraulics and sediment transport in high-gradient, subalpine streams (Grant et al., 1990). Large boundary rough- ness and steep bed gradients promote extreme turbu- lence (Chin, 1989). When applied to high-gradient channels, the equations for bedload transport devel- oped for lower gradient streams greatly overpredict the actual quantity of sediment transported (Blizard,
* Corresponding author. 1 E-mail: [email protected]
1994). In regions such as the Colorado Rocky Moun- tains, however, flow in these high-gradient channels is increasingly being diverted for agricultural and municipal use. To assess, and eventually minimize, the impacts of present and future flow diversion from such channels, studies to assess the relations between flow and sediment discharge in these com- plex systems have been undertaken. One of the most basic questions is whether or not predicting the effect of flow diversion on bedload transport in a given channel using physical parameters that are relatively easy to measure, such as flow depth and velocity, channel slope, and grain-size distribution, is possible. The research summarized here addresses
0169-555X/98/$19.00 ~ 1998 Elsevier Science B.V. All fights reserved. PII S0169-555X(97)00055-X
360 C.R. Blizard, E.E. Wohl / Geomorphology 22 (1998) 359-371
that question for East St. Louis Creek in Fraser Experimental Forest, Colorado.
This study builds upon the research of Adenlof and Wohl (1994), who used cross-sectional averages of bedload and hydraulic variables. Adenlof and Wohl (1994) concluded that the resolution of their data may have been insufficient to permit an ade- quate examination of the relation between bedload transport and hydraulic variables. The goal of the research summarized here was to use a more de- tailed, site-specific approach than that of Adenlof and Wohl (1994), to assess whether or not associa- tions at the cross-sectional scale may be found be- tween bedload transport and aspects of flow. This study focused on whether or not bedload discharges and size distributions are responsive to changes in flow, either at-a-point or across a section. Because of the limitations of the Helley-Smith sampler used in this study, we focused on the movement of the sand and gravel-size fractions of bedload.
2. Site description
106"W
,o
L ~,X" ~ \ ~ East St. Louis Creek
t g/~de Colorado ~,
~,. ~'~",,- ~-"~ _ \"- .L J .1 / I <'* :;' 0 \ - / (
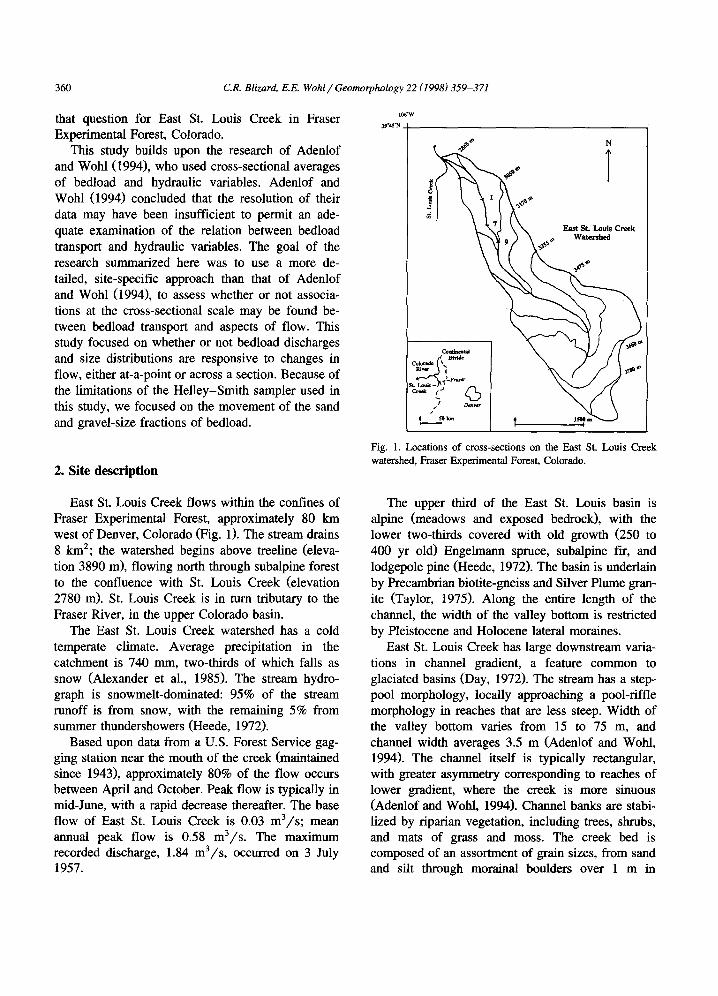
Fig. 1. Locations of cross-sections on the East St. Louis Creek watershed, Fraser Experimental Forest, Colorado.
East St. Louis Creek flows within the confines of Fraser Experimental Forest, approximately 80 km west of Denver, Colorado (Fig. 1). The stream drains 8 km2; the watershed begins above treeline (eleva- tion 3890 m), flowing north through subalpine forest to the confluence with St. Louis Creek (elevation 2780 m). St. Louis Creek is in turn tributary to the Fraser River, in the upper Colorado basin.
The East St. Louis Creek watershed has a cold temperate climate. Average precipitation in the catchment is 740 mm, two-thirds of which falls as snow (Alexander et al., 1985). The stream hydro- graph is snowmelt-dominated: 95% of the stream runoff is from snow, with the remaining 5% from summer thundershowers (Heede, 1972).
Based upon data from a U.S. Forest Service gag- ging station near the mouth of the creek (maintained since 1943), approximately 80% of the flow occurs between April and October. Peak flow is typically in mid-June, with a rapid decrease thereafter. The base flow of East St. Louis Creek is 0.03 ma/s; mean annual peak flow is 0.58 m3/s. The maximum recorded discharge, 1.84 ma/s, occurred on 3 July 1957.
The upper third of the East St. Louis basin is alpine (meadows and exposed bedrock), with the lower two-thirds covered with old growth (250 to 400 yr old) Engelmann spruce, subalpine fir, and lodgepole pine (Heede, 1972). The basin is underlain by Precambrian biotite-gneiss and Silver Plume gran- ite (Taylor, 1975). Along the entire length of the channel, the width of the valley bottom is restricted by Pleistocene and Holocene lateral moraines.
East St. Louis Creek has large downstream varia- tions in channel gradient, a feature common to glaciated basins (Day, 1972). The stream has a step- pool morphology, locally approaching a pool-riffle morphology in reaches that are less steep. Width of the valley bottom varies from 15 to 75 m, and channel width averages 3.5 m (Adenlof and Wohl, 1994). The channel itself is typically rectangular, with greater asymmetry corresponding to reaches of lower gradient, where the creek is more sinuous (Adenlof and Wohl, 1994). Channel banks are stabi- lized by riparian vegetation, including trees, shrubs, and mats of grass and moss. The creek bed is composed of an assortment of grain sizes, from sand and silt through morainal boulders over 1 m in
C.R. Blizard, E.E. Wohl / Geomorphology 22 (1998) 359-371 361
diameter. The valley, banks, and channel contain abundant large organic debris, which often forms dams or log steps. Woody debris in the channel often traps wedges of sand- and gravel-sized sediment upstream. Cobbles and boulders in the stream also form bed-steps. Coarse sediment traps finer material along the creek edge, while also contributing to turbulence further out in the channel where velocities are greater. Logs and boulders alike are often sites of hydraulic jumps and locally supercritical flow.
3. Field methods
In the East St. Louis Creek investigation of Adenlof and Wohl (1994), hydraulic and bedload data were collected at twelve cross-sections located at elevations of 2909 to 3090 m along the stream channel. Adenlof (19'92) divided the twelve sections into three groups on the basis of channel gradient: (1) a low elevation group with moderate streambed gradient (average 10%); (2) an intermediate eleva- tion group with a high gradient (average 18%); and (3) the highest elevation group, with a low gradient (average 7%). For this project, a representative cross-section was selected from each gradient group. These three sections (1, 7, and 9; Table 1) corre- spond to cross-sections 2, 7, and 9 of Adenlof's study. Section 1 is located at the downstream end of a pool in a pool-riffle sequence, Section 7 is at the base of a low step in a step-pool sequence, and Section 9 is on a pool in a step-pool sequence (Fig. 2).
At the start and end of the field season, and using a laser theodolite, we surveyed the cross-sectional morphology of the channel from 6 m upstream from each cross-section to 6 m downstream from the section. During the field season, each section was sampled 24 times. At the beginning of each sampling event, water-surface height was surveyed with a 10 × hand level at each section, and 0.5 m, 1 m, and 5 m above and below the section. The channel cross-section was then divided into 10 equally spaced increments on the basis of flow width at time of sampling. At each increment, flow depth was mea- sured first. Then, using a Marsh-McBirney current meter, velocity was measured at 20, 40, 60 and 80% of depth (as taken from the surface down). To obtain
the closest possible correspondence between instan- taneous velocity and bedload movement, bedload was sampled immediately after velocity at each in- crement. Bedload was collected for 10 min with a Helley-Smith bedload sampler which had a square 7.6 cm orifice, 0.25 mm mesh bag, and no tailfins or frame. Velocity and bedload measurements were col- lected by wading. Photographs throughout the field season provided evidence of scour and fill episodes that do not appear to have been clearly documented by the bedload samples.
Most bedload transport data are collected discon- tinuously with a hand-held device such as the Hel- ley-Smith sampler (Emmett, 1980; Andrews and Erman, 1986; Ashworth and Ferguson, 1989; Kuhnle, 1992; Glysson, 1993; Adenlof and Wohl, 1994). Efficiency ratings for the Helley-Smith sampler have been calculated in two manners: sampler efficiency and hydraulic efficiency. Sampler efficiency is a ratio of sediment collected to sediment that would have passed the nozzle area without the sampler present (Glysson, 1993). In a field calibration of the Helley-Smith sampler, Emmett (1980) found that sampler efficiencies were between 90 and 100% for particles between 0.5 nun and 16 nun. Sampler efficiencies dropped below 70% for particles above 16 mm, although the reduction may have been due to the small number of particles in motion (Emmett, 1980). A less commonly mentioned measure of the sampler performance of the Helley-Smith is the hydraulic efficiency, a ratio of water discharge through the sampler orifice to discharge through the same area with the sampler removed (Kuhnle, 1992). Hubbell (1987) calculated a hydraulic efficiency of 1.5 for the Helley-Smith, and Kuhnle (1992) ob- tained values between 1.43 and 1.53. In other words, sampling width is greater than the sampler width by a factor of about 1.5 (Kuhnle, 1992). Because it does not manifest itself in a sampler efficiency greater than 100%, this concentration of flow through the sampler orifice does not appear to be a problem. According to U.S. Geological Survey protocol, in order to account for instantaneous transport varia- tions while avoiding the risk of clogging the sampler bag, sampling time with a Helley-Smith is typically between 30 and 60 s (Glysson, 1993). Emmett (1980) has found that sampler efficiencies drop off after the sampler is 40% full. Sampling times up to 10 min,

362 C.R. Blizard, E.E. Wohl / Geomorphology 22 (1998) 359-371
o
r~
~g
.r~ o
= o
I
©
~1- ee t '~ IF
¢q ,~- ¢,
0
R
¢~. r-I r,- ~o
.o
o~
. - . ~ . <

C.R. Blizard, E.E. Wohl / Geomorphology 22 (1998) 359-371 363
Fig. 2. Site photograpl:Ls. (a) Cross-section 1, looking upstream, 16 June 1993. Channel is approximately 2.5 m wide, discharge is approximately 0.8 ma/s. (b) Cross-section 7, looking upstream, 30 May 1993. Channel is approximately 3 m wide, discharge is 0.32 m3/s. (c) Cross-section 9, looking upstream, 30 May 1993. Channel is approximately 2.9 m wide, discharge is 0.32 m3/s.

364 C.R. Blizard, E.E. Wohl / Geomorphology 22 (1998) 359-371
though, have been used under low-flow conditions (Ashworth and Ferguson, 1989).
4. Data analysis
Bedload size distribution and hydraulic data were evaluated quantitatively by means of a series of linear regressions. The Din, x for each bedload sam- ple had been recorded during sieve analysis, and skewness and kurtosis of the distributions were cal- culated. The D16 , Ds0 , and D84 of the distributions were obtained graphically from cumulative percent curves (Fig. 3). Bedload discharge was calculated as a volume per unit width of channel (m 3 s-1 m - l ) .
The weights of individual samples of bedload were converted to volumes by assuming a sediment den- sity of 2.65 g / c m 3.
The following hydraulic parameters were used in regression analyses: (1) near-bed velocity, approxi- mated by the velocity at 80% of flow depth, as measured from the surface; (2) water-surface slope (over 10 m of channel); (3) flow depth; (4) discharge (m3/s); (5) grain shear stress; (6) stream power; and (7) the Froude number. Because previous studies of channels of higher and lower gradients have not yet shown a consensus of which hydraulic variable may be most effectively related to bedload transport, we chose to test a wide array of hydraulic parameters (Bathurst et al., 1987; Beschta, 1987).
Water discharge was calculated for each incre- ment, and channel discharge was obtained by sum- ming the individual increments. Grain shear stress was estimated by means of the Laursen R' method:
u = (21R'2/3S '/2)/k~/~ (1)
where u is the mean velocity, k, is roughness pa- rameter considered equal to the pavement /)50 (as determined graphically from cumulative percent curves), and S is slope (Laursen, 1958). R' is the contribution of the hydraulic radius due solely to grain resistance. The R' value can then be inserted into the DuBoys equation to yield an estimation of grain shear stress at each increment (Knighton, 1984). To calculate average channel shear stress, individual grain shear stresses were summed and averaged. Stream power was calculated as a product of average
7/, o 5 lb 1~ 2b ~ ab a~ 4b 45 sb ~ 6b Grain size (ram)
100
80 1~7
0
'2L. 0 5 10 15 20 25 30 35 40 45 50 55 60 65
Grain size (ram)
100.
90 c
80 St=e9
~ 5o
0 5 10 15 20 25 30 35 40 45 50 55 60 65 Grain size (ram)
Fig. 3. Examples of cumulative percent curves (freer by weight) for bedload samples from each cross-section.
velocity and grain shear stress. Finally, the Froude number (F ) was calculated via the equation:
F = Oavg / / (gd ) 0"5 (2)

C.R. Blizard, E.E. Wohl / Geomorphology 22 (1998) 359-371
Table 2 At-a-point l inear regression p-values, p < 0.05, East St. Louis Creek data
365
Q Shear Power Depth v 8o vavg Froude
log Qs 1 :0 .047 9 :0 .0038 9 :0 .0019 1 :0 .039
9 :0 .0038 9 :0 .016
log Dma x 1:0 .0047 1:0 .0022 1:0.0025 1 :0 .020 1:0 .0028 1:0 .0032 1:0 .0026
7 :0 .0015 7 :0 .0007 7:0.0001 7 :0 .0014 9:0 .011 7 :0 .0017
9 :0 .0007 9 :0 .0007 9 :0 .0004 9 :0 .0052
log D84 1 :0 .0016 1:0 .0013 1:0.0015 1:0 .0076 1:0 .0017 1:0 .0012
7: 9.0" 10 -6 7 :2 .6 • 10 -6 7 :3 .1 • 10 -6 7 :8 .2 • 10 -6 7 :9 .2 " 10 -6
9 :0 .0084 9:0.0061 9:0.0061 9 :0 .048
log Ds0 1:0 .0067 7 :2 .5 • 10 -6 7 :9 .2 • 10 -6 1 :0 .016 7 :1 .9 • 10 -5 1:0 .0062 1:0 .0066
9 :0 .025 9 :0 .015 7 :4 .2 • 10 -6 9 :0 .018 7 :0 .0035 7 :9 .2 • 10 -6
log DI6 1:0 .0085 1 :0 .020 1:0 .019 1 :0 .016 1:0 .018 1:0 .0097 1:0 .012
7 :7 .5 • 10 -5 7 :1 .7 • 10 -5 7:1.1 • 10 -5 7: 6.0" 10 -5 7 :0 .018 7 :0 .0002
skewness 7 :0 .0002 7 :0 .0003 7:0 .0001 7 :7 .6 • 10 -5 7 :6 .7 - 10 -5
kurtosis 7:0.0001 7 :0 .0004 7 :0 .037 7:0 .0001 7 :1 .3 • 10 -5 7 :5 .4 • 10 -6
First number denotes cross-section; second number is p-value. Underl ining indicates that regression was against the log of the hydraulic variable. The hydraulic variable water-surface slope is not shown as it yielded no significant regressions.
where Vavg is average velocity, g is acceleration due to gravity, and d is flow depth (Knighton, 1984).
Regressions were performed with at-a-point data only for cases of nc,nzero bedload. Using averaged values of bedload and flow parameters, full channel regressions were also performed. Except for cases of zero or negative skewness or kurtosis values for grain-size distributions, a logarithmic conversion was applied to all bedload parameters. The log of each bedload variable was then regressed against each
hydraulic parameter and, when possible, also against the log of the hydraulic parameter.
5. Results
5.1. Linear regressions
Significant linear regressions were defined as those with p-values less than 0.05. Table 2 provides
Table 3 Mean channel l inear regression p-values, p < 0.05, East St. Louis Creek data
Q Shear Power Depth v 8o Vav, Froude
1:5 .3 • 10 -6 1:9.1 • 10 -5 1 :4 .8 • 10 -5 1 :3 .3 • 10 -5 1 :4 .7 • 10 -6 1 :1 .7 • 10 -6 1 :5 .5 • 10 -6
9:0 .0051 9 :0 .0017 9 :0 .0018 9 :2 .3 • 10 - s 9 :3 .2 - 10 -5
1 :0 .0002 1 :0 .0026 1:0.0021 1:0.0001 1:0 .0023 1:0 .0006 1 :0 .0044
9 :0 .038 9 :0 .023 9 :0 .0006 9:0 .0011
1:0 .033 1 :0 .020 1 :0 .022 1 :0 .042 1:0 .029 7 :0 .032 7 :0 .012
9 :0 .042 9 :0 .019
log Ds0 7 :0 .024 7 :0 .014
log DI6 9 :0 .017 9 :0 .0053 9 :0 .018 9 :0 .047 9 :0 .038 log skew 7 :0 .0029 7 :0 .0010 7 :0 .0042
kurtosis 7 :0 .018 7 :0 .023 7 :0 .030
log Qs
log Dma x
log D84
7 :0 .0043 7 :0 .0054
First number denotes cross-section; second number is p-value. Underl ining indicates that the regression was against the log of the hydraulic variable. The hydraulic wa'iable water-surface slope is not shown because it yielded no significant regressions.

366 C.R. Blizard, E.E. Wohl / Geomorphology 22 (1998) 359-371
p-values for all significant at-a-point relationships. Table 3 provides p-values for significant mean chan- nel relationships. Linear regressions using at-a-point bedload data and hydraulic parameters appear to be more consistent between sites than those relation- ships obtained with mean channel parameters. For example, regressions of both log Dma x and log 0 8 4
against shear stress, stream power, v80, Vavg, and the Froude number yield significant relationships at all three cross-sections. Fig. 4 shows the relationship between log D84 and stream power. Graphs of the regression lines indicate that Site 7 is anomalous: log D84 decreases with increasing stream power, but the opposite holds true at Sites 1 and 9. This inconsis- tency occurs with comparisons of all other signifi- cant at-a-point relationships between sites.
The step at Site 7 appears to respond differently than do the pools at Sites 1 and 9. Site 7 has considerably more and stronger relationships be- tween bedload and hydraulic variables at-a-point than the other two sites. Additionally, some of the most significant relationships at Site 7 are counter-intui- tive, indicating decreasing bedload size with increas- ing shear stress and stream power. One hypothesis for these inverse correlations is that bedload dis- charge is so highly supply-limited that the coarsest material was already mobilized under low flow con- ditions during the rising limb of the hydrograph. This idea is not supported by the at-a-point data, however. The c o a r s e s t D84 and Ds0 particles are not restricted to the rising limb of the hydrograph. Alternatively, as hydraulic variables such as shear stress and stream power increase, less energy may be expended on sediment transport and more on turbulence. At-a- point values of the Froude number are much higher at Site 7 than at the other two sites. Although turbulence intensity is physically independent of the Froude number, the presence of large boulders at Site 7 enhances turbulence and increases the Froude number.
Several at-a-point regressions yielded significant p-values only at Site 7. Some of these results are
Fig. 4. Log D84 versus stream power, at-a-point (nonzero bedload only) for all sites, East St. Louis Creek data. Linear regression results are as follows: (a) Site 1 (log power) - p = 0.0015, R 2 = 0.071; (b) Site 7 - p = 2 . 6 × 10 -6, R 2 = 0.253; (c) Site 9 - p = 0.0061, R 2 = 0.095.
a
2
1 . 5
o ~ 0.5 . J
0
- 0 . S
- 3
Site 1 At-a-Point: Log 084 vs. Log Stream Power
..................................................... ! ............... . . . . ¢ : . . . . .
.
. . . . . . . . . . . . . . . . . . . . . . . . . . . . . . ~,t= ' _ ' a , " e ~ ..... I l l i i m
............................. . . _ ~ . ' . . : . . . . . . .... . . . . ~ - - - -~ , . ~ . . . . . , f n , . ~
= ~ - " - '1 " " ~ = - = = = = ! = ' - =='-
- 2 . 1 0 1
Log Stream Power (watts/mA2)
h Site 7 At-a-Point: Log D84 vs. Stream Power
2 ,
i
i. TUg
IN I n a I a l a 8 I I iN
I • 0 . 5 '. ~ ~ ~ , , i ! J J 1 - . ! . . i J , ,
0 2 0 4 0 6 0 8 0 1 0 0 1 2 0
Stream Power (watteJmA2}
C Site 9 At-a-Point: Log 084 vs. Stream Power
2
1 . 5
- 0 . 6
o
0 . 5 . .A
.= . .= . ......... =. ...................... = = ~ .................... ~ .........
r 8 w m n
m w m m a ~m
:Iiii - n atom
Wm
• L i L i . t J . i • • ~ . q J . i a I , ; ; : '. ; ; ; : .
S 1 0 I S 2 0 2 $ 3 0
Stream Power (watteJm^2}

=
i '
N~
io o
¢B
~ g
~g ~ g
am ~ a
-4.5
1.2
zB ~
Q l
I i l I i I I i I I I I I i 1 i I I I I I i
0.2 0.4 o.6 o.a 1 Froude Number
100-
90-
80-
6 7 0 . : =
• ~_ 8 0 .
:0 50.
0 _
20 ̧
Fig . 5. G r a i n s ize d i s t r i b u t i o n s k e w n e s s v e r s u s F r o u d e n u m b e r ,
Si te 7 a t - a - p o i n t ( n o n z e r o b e d l o a d on ly ) , E a s t St . L o u i s C r e e k da t a . R e g r e s s i o n R E = 0 . 1 9 0 ; p = 6 .7 X 10 - 5 .
more readily explicable. Log skewness, for example, was inversely correlated with the Froude number (Fig. 5), shear stress, stream power, vs0, and V~g. This inverse relationship indicates, quite reasonably,
-5
-7
,E-5.5 W
a
O -6.5
. J
9 10 11 12 13
Site I Channel Mean: Bedload Discharge vs. Average Velocity
.o = . / ~ "
.Y j?. Ill
O
-7.5 '. : : : ', ' : '. ' ', : : : : ', : : : : ', : : ~ r
-o.6 -o.s .6.4 -o.3 -0.2 -o.1 Log Avg. Velocity (m/s)
Fig . 6. L o g v o l u m e t r i c s e d i m e n t d i s c h a r g e v e r s u s log a v e r a g e
ve loc i t y , Si te 1 en t i r e c r o s s - s e c t i o n w i t h m e a n h y d r a u l i c p a r a m e -
ters , E a s t St . L o u i s C r e e k da t a . L i n e a r r e g r e s s i o n R 2 = 0 . 6 5 4 ; p = 1 . 7 X 10 - 6 .
that bedload grain-size distributions become less pos- itively skewed (i.e., less of an excess of fine parti- cles) with increasing stream power. Also, kurtosis
'il 4°-il
7 ' 8 ' 9 ' 1 0 ' 1 1 ' 1 2 ' 1 3 ' 1 4 ' 1 5 ' 1 6 ' 1 7 GrNn shear stress (N/m2)
10
. . . . . , , , , , , , , , ,
7 8 9 10 11 12 1914 15 16 17 18 19 20 21 22 Grain shear stress (N/m2)
Site 7 At-a-Point: Skewness vs. Froude Number
8011 'oll
5 6 7 8
C.R. Blizard, E.E. Wohl l Geomorphology 22 (1998) 359-371 3 6 7
Grain shear stress (N/m2)
I m m < l m m [---71-4mm p'-jZ/J4-16mm [2~[~>16mm
Fig . 7. M e a n c h a n n e l v a l u e o f g r a i n s h e a r s t ress ( N / m 2) p lo t t ed
a g a i n s t g r a i n - s i z e d i s t r i b u t i o n b r o k e n in to f o u r s ize c l a s s e s ( a f t e r
W a t h e n et al . , 1995 , f ig . 3). (a) D a t a f o r S i te 1, (b) Si te 7, a n d (c)
Si te 9.

368 C.R. Blizard, E.E. Wohl / Geomorphology 22 (1998) 359-371
was inversely correlated with the Froude number, shear stress, stream power, depth, v80, and Vavg. The kurtosis of the grain size distribution decreases with increasing hydraulic parameters. A tendency exists for a less peaked grain size distribution with increas- ing shear stress and stream power. Both this smooth- ing of the grain size distribution curve and the decrease in positive skewness may represent a trend toward conditions of equal mobility.
Linear regressions with mean channel parameters yielded relationships that were less significant or numerous. No regression relationships were found to be significant at all three sites. However, a few new relationships emerged with mean data that were not significant with at-a-point values. An example is a relationship between log Qs and the log of the average velocity at Site 1, with an R 2 of 0.654 (Fig. 6). By graphing grain shear stress against grain-size distribution, mean channel parameters may also be used to indicate an apparent trend toward equal mobility (Fig. 7). Under the range of flow conditions measured, the lack of consistent coarsening in grain- size distribution under increasing shear stress sug- gests that sand and gravel up to approximately 20 mm may be equally mobile at the cross-sections.
Considering the most relevant (i.e., successful) bedload and flow parameters provides another means of examining the results of regression. Of the bed- load variables used, the most relevant, based on number of significant regressions obtained, appear to be Dma x and D84. The most relevant hydrologic variables were found to be shear stress, stream power, v80, vavg, and the Froude number. The great number of hydraulic variables involved in defining bedload transport suggests the underlying complexity of flow hydraulics and sediment transport in subalpine cob- ble-bed channels.
5.2. Photograph and survey results
Stream cross-sections for each site, as surveyed at the beginning and end of the field season, indicate that scour and fill occurred at all three locations on East St. Louis Creek (Fig. 8). Many of the erosion and sedimentation episodes in East St. Louis Creek may relate to the sudden formation and collapse of in-channel sediment storage sites. One of these events occurred at Site 9 and was documented with pho-
(a) 50
30
2 -lo
~ -3O •
..c --~-50 '
-70 •
Site 1 Cross-section Profiles
10 ~ -
50 100 150 200 250 300 350 400 450 500 Distance (cm)
[ - - 5-27-1993 Survey - - 7-14-1993 Survey I i
(b) Site 7 Cross-sectional Profiles 50-
E o 3o
-° -lo
~ -30 - -
. ~ -50 " r
-70 , : : : : : : : : : : : : : : : : : : : : : : : : : : : : : : : : : : : : : : : : : : : : : : : : : : : : : : :
50 100 150 200 250 300 350 400 450 500 Distance (cm)
I - - 5-28-1993 Survey - - 7-15-1993 Survey ,I
(C) Site 9 Cross-sectional Profiles
t m~ 30 . . . . . . . . . . . . . . . . . . . . . . . . . . . . . . . . . . . . . . . . . . . . .
~ ~ lo . ~ ~
-10 .>_
~ -30
• ~ -50
Z
-7O , ' . :~ : ' , : : : : ' , : : : : ' , : : : : ' , ' , ' , : : ' , : : : : :=: ' , ' , : : : : : ' , : : : :=: : : : , , 50 100 150 200 250 300 350 400 450 500
Distance (cm)
I - - 5-26-1993 Survey ~ 7-I 5-1993 Survey I
Fig. 8. Cross-sectional profile at start and end of 1993 field season. Vertical exaggeration = 3 ×. (a) Site 1. (b) Site 7. (c) Site 9.

C.R. Blizard, E.E. Wohl / Geomorphology 22 (1998) 359-371 369
tographs. A single log only a few centimeters in diameter dislodged from along the side of the chan- nel just upstream from the cross-section, and was deposited in a pre--existing debris dam just down- stream from Site 9. That single log lessened the local water-surface gradient in the vicinity of the section (from 0.06 over 2 m before the event, on 28 June, to -0 .01 after the event, two days later). This reduc- tion in gradient in turn led to the deposition of nearly 30 cm of sediment in the section. Also, the rein- forced debris dam caused the stream to overflow its right bank, widening the channel by almost a meter. Had this depositional event occurred upstream from Site 9, it might have been reflected in a decrease in bedload discharge. Because it took place in and downstream from the section, it does not appear to be documented clearly in the bedload transport data. This lack of documentation may be a function of the small number of s,unples and the discontinuous na- ture of the sampling procedure.
6. Discussion
Because field observations and data from bedload samples provide no evidence of mobilization at even the highest disch~trges, if the mobilization of the pavement took place along East St. Louis Creek during the study season, it was most likely on an extremely local scale. This conclusion is consistent with the findings of Adenlof and Wohl (1994), who found that the bed of East St. Louis Creek remains stable during the peak flow of average years. Thus, this discussion focuses on sand and gravel transport over a largely inmlobile cobble and boulder bed, a situation analogous to that discussed by Lisle (1995).
The number of regression p-values that were significant indicated relationships between bedload transport and hydraulic variables on East St. Louis Creek. Although this is not always the case, at-a-point data tend to provide more and better relationships between bedload transport and flow conditions. Based upon the regression results, it is also possible to isolate the most relevant variables involved: the bed- load variables Dr~ax and D84 , and the hydraulic variables shear stress, stream power, Vs0, Vavg, and the Froude number. Although these variables are the most important, all parameters except water-surface
slope over 10 m yielded several significant relation- ships.
No clearly consistent relationship describes the bedload response to flow at all sites on East St. Louis Creek. Some at-a-point regressions involving Dma x and Ds4 are significant at all three cross-sec- tions; Site 7 data, however, show trends opposite to those of Sites 1 and 9. With only three cross-sections in the study, the unique trends at one site cast some doubt on generalizations based on relationships at the other two.
The question remains of why the data from Sites 1 and 9 result in similar linear regressions, whereas Site 7 showed an entirely different set of significant relationships. Sites 1 and 9 are both positioned in pools, specifically on pool-exit slopes as shown by locally negative water-surface gradients. Site 7, how- ever, is positioned at the base of a step, with ele- ments of protruding roughness and locally supercriti- cal flow. Flow is also far more turbulent at Site 7, as demonstrated in the field by greater instantaneous variation in flow velocity. This turbulence suggests an explanation for some of the anomalies in bedload transport and flow relationships at Site 7. With more energy dissipated on flow turbulence, less energy would be available for sediment transport.
The lack of consistent relations between bedload transport and flow hydraulics is perhaps not surpris- ing. Local bedload transport depends on the sur- rounding velocity and stress fields, including the effects of the divergence of the transport vector (Carson and Griffiths, 1987). The hydraulic measure- ments made for this study provide a very simplistic, at-a-point representation of the velocity and stress fields. The results of this study suggest that such simple measurements suffice only for gross approxi- mations of bedload transport, as indicated by the degree of scatter in Figs. 4-6.
The possibility of equal mobility of sand and gravel has been examined in relatively few field studies. Working in pool-riffle channels, Church et al. (1991) and Kuhnle (1992) found that sand mobi- lized at lower values of shear stress than did gravel. Equal mobility was, however, approximated at the higher measured values of shear stress and when bedload transport was integrated over longer times- pans. Wathen et al. (1995) determined that gravel transport in a pool-riffle channel was slightly size-

370 C.R. Blizard, E.E. Wohl / Geomorphology 22 (1998) 359-371
selective, whereas sand transport was close to equal mobility. The East St. Louis Creek data (Fig. 7) suggest that at discharges of 0 .1-1.0 m a / s equal mobility most adequately describes sand and gravel transport along this step-pool channel.
Although bedload transport is at least partly the result of a complex mixture of flow variables, flow alone is not sufficient to describe bedload transport variability. Photographs provide evidence that the production of sediment sources and sinks is an ongo- ing process in the catchment. Over the course of less than two months, four trees fell into the channel within 5 m of the three cross-sections. At Site 9, the addition of a single log about 12 cm in diameter to a preexisting debris dam led to the deposition of close to 30 cm of sediment. These random events could easily be visualized as wavelike phenomena, leading to net deposition or scour in a reach during a particu- lar field season. Equal bedload discharge through multiple cross-sections on East St. Louis Creek may only be true on the scale of years, or perhaps decades.
7. Conclusions
The purpose of this investigation was to assess, on a cross-sectional scale, using minimal technology and a low-cost, low-impact procedure, the relations between hydraulic variables and sand and gravel bedload transport on East St. Louis Creek. Adeniof and Wohl (1994) concluded that sediment movement at the channel cross-sectional scale on East St. Louis Creek does not exhibit strong correlations with hy- draulic variables other than discharge. One of the primary conclusions of our study is that bedload discharge appears to be partly a function of a number of hydraulic variables. In fact, discharge is one of the least relevant parameters, yielding significant corre- lations with bedload variables only at Site 1. The most significant hydraulic variables are shear stress, stream power, near-bed velocity, average velocity, and the Froude number, particularly when regressed against bedload discharge and the Dma x and D84 of the grain-size distribution of the bedload.
Bedload discharge and flow relationships show a high degree of background noise. This scatter is demonstrated by linear regressions yielding R E Val-
ues no higher than 0.654. Also, no significant rela- tionships exist with consistent trends at all three sites, highlighting the problem of examining bedload discharge under flow conditions that are transport- limited. The importance of sediment supply in defin- ing bedload transport is indicated by cross-sectional surveys and photographs, which demonstrate the role of random events such as tree fall in causing local scour and deposition. Studies of bedload transport in supply-limited channels may more appropriately em- phasize supply rates and sediment sources, whereas studies focusing on flow should concentrate on chan- nels where transport is truly power-limited.
Acknowledgements
This project was partly supported by the USDA Forest Service Rocky Mountain Forest and Range Experiment Station and the Fraser Experimental For- est. Peter Pendrak assisted with data collection and analysis, and Stanley Schumm, Deborah Anthony, Eugene Kelly, and two anonymous reviewers pro- vided helpful comments on an earlier draft of the manuscript. The final draft benefited from comments by Carrie McDowell and two anonymous reviewers.
References
Adenlof, K.A., 1992. Controls on Channel Morphology in a Subalpine Stream. Unpublished M.S. thesis, Colorado State University, Ft. Collins, 124 pp.
Adenlof, K.A., Wohl, E.E., 1994. Controls on bedload movement in a subalpine stream of the Colorado Rocky Mountains. U.S.A. Arct. Alpine Res. 26, 77-85.
Alexander, R.R., Troendle, C.A., Kaufmann, M.R., Sheppard, W.O., Crouch, G.L., Watkins, R.K., 1985. The Fraser Experi- mental Forest, Colorado: Research Program and Published Research 1937-1985. USDA Forest Service General Techni- cal Report RM-118, 43 pp.
Andrews, E.D., Ennan, D.C., 1986. Persistence in the size distri- bution of surficial bed material during an extreme snowmelt flood. Water Resour. Res. 22, 191-197.
Ashworth, P.J., Ferguson, R.I., 1989. Size-selective entrainment of bed load in gravel bed streams. Water Resour. Res. 25, 627-634.
Bathurst, J.C., Graf, W.H., Cao, H.H., 1987. Bed load discharge equations for steep mountain rivers. In: Thome, C.R., Bathurst,

C.R. Blizard, E.E. Wohl / Geomorphology 22 (1998) 359-371 371
J.C., Hey, R.D. (Exls.), Sediment Transport in Gravel-Bed Rivers. John Wiley and Sons, Chiehester, pp. 453-491.
Beschta, R.L., 1987. Conceptual models of sediment transport in streams. In: Thome, C.R., Bathurst, J.C., Hey, R.D. (Eds.), Sediment Transport in Gravel-Bed Rivers. John Wiley and Sons, Chichester, pp 387-419.
Blizard, C.R., 1994. Hydraulic Variables and Bedload Transport in East St. Louis Cr~k, Rocky Mountains, Colorado. Unpub- lished MS thesis, Colorado State University, Ft. Collins, 175
PP. Carson, M.A., Griffiths, G.A., 1987. Bedload transport in gravel
channels. N. Z. J. Hydrol. 26, 1-151. Chin, A., 1989. Step pools in stream channels. Progr. Phys.
Geog. 13, 391-407. Church, M., Wolcott, J.!F., Fletcher, W.K., 1991. A test of equal
mobility in fluvial sediment transport: behavior of the sand fraction. Water Resour. Res. 27, 2941-2951.
Day, T.J., 1972. The channel geometry of mountain streams. In: Slaymaker, H.O., McPherson, H.J. (Eds.), Mountain Geomor- phology: Geomorphological Processes in the Canadian Cordillera. Tantalus Research, Vancouver, pp. 141-149.
Emmett, W.W., 1980. A field calibration of the sediment-trapping characteristics of the Helley-Smith bedload sampler. USGS Prof. Pap. 1139, 44 I?P.
Glysson, G.D., 1993. U.S. Geological Survey bedload sampling policy. In: Shen, H.W., Su, S.T., Wen, F. (Eds.), Hydraulic Engineering '93. ASCE, Vol. 1, pp. 701-706.
Grant, G.E., Swanson, F.J., Wolman, M.G., 1990. Pattern and origin of stepped-bed morphology in high-gradient streams, Western Cascades, Oregon. Geol. Soc. Am. Bull. 102, 340- 352.
Heede, B.H., 1972. Flow and channel characteristics of two high mountain streams. USDA For. Serv. Res. Pap. RM-96, 12 pp.
Hubbell, D.W., 1987. Bed load sampling and analysis. In: Thorne, C.R., Bathurst, J.C., Hey, R.D. (Eds.), Sediment Transport in Gravel-Bed Rivers. John Wiley and Sons, Chichester, pp. 89-118.
Knighton, D., 1984. Fluvial Forms and Processes. Edward Arnold, New York, 218 pp.
Kuhnle, R.A., 1992. Fractional transport rates of bedload on Goodwin Creek. In: Billi, P., Hey, R.D., Thorne, C.R., Tac- coni, P. (Eds.), Dynamics of Gravel-Bed Rivers. John Wiley and Sons, New York, pp. 141-155.
Laursen, E.M., 1958. The total sediment load of streams. J. Hydraul. Div. ASCE 1530, 36 pp.
Lisle, T.E., 1995. Particle size variations between bed load and bed material in natural gravel bed channels. Water Resour. Res. 31, 1107-1118.
Taylor, R.B., 1975. Geologic map of the Bottle Pass Quadrangle, Grand County, Colorado. U.S. Geological Survey map GQ- 1244, Scale 1:24,000.
Wathen, S.J., Ferguson, R.I., Hoey, T.B., Werritty, A., 1995. Unequal mobility of gravel and sand in weakly bimodal river sediments. Water Resour. Res. 31, 2087-2096.