
Structure Determination (HADH), Inhibition (P4H), and ... - CORE
227
i Metalloproteins: Structure Determination (HADH), Inhibition (P4H), and Biomimetic Systems (P-1[Ru(NO)(Cl)]) By Timothy M. Reed Submitted to the Department of Chemistry and the Faculty of the Graduate School of the University of Kansas in partial fulfillment of the requirements for the degree of Doctor of Philosophy. _Dr. Minae Mure ___________ Chairperson Committee Members* _Dr. Andrew Borovik ________* _Dr. Paul Hanson __________* _Dr. Richard Schowen ______* _Dr. Emily Scott ___________* Date defended: Dec. 8 th 2008
-
Upload
khangminh22 -
Category
Documents
-
view
5 -
download
0
Transcript of Structure Determination (HADH), Inhibition (P4H), and ... - CORE

i
Metalloproteins: Structure Determination (HADH), Inhibition (P4H), and Biomimetic Systems (P-1[Ru(NO)(Cl)])
By
Timothy M. Reed
Submitted to the Department of Chemistry and the Faculty of the Graduate School of the University of Kansas in partial fulfillment of the requirements for
the degree of Doctor of Philosophy.
_Dr. Minae Mure___________ Chairperson Committee Members* _Dr. Andrew Borovik________* _Dr. Paul Hanson__________*
_Dr. Richard Schowen______*
_Dr. Emily Scott___________*
Date defended: Dec. 8th 2008

ii
The Dissertation Committee for Timothy M. Reed certifies that this is the approved version of the following dissertation
Metalloproteins: Structure Determination (HADH), Inhibition (P4H), and Biomimetic Systems (P-1[Ru(NO)(Cl)])
Dissertation Committee: _Dr. Minae Mure___________ Chairperson Committee Members* _Dr. Andrew Borovik________* _Dr. Paul Hanson__________*
_Dr. Richard Schowen______*
_Dr. Emily Scott___________*
Date defended: Dec. 8th 2008

iii
Abstract
Timothy Michael Reed
Department of Chemistry, University of Kansas
Histamine dehydrogenase from Nocardioides simplex (HADH) is a flavoprotein that converts histamine to imidazole acetaldehyde and is highly specific for histamine. Chapter one describes the development of overexpression and purification a recombinant form of HADH (rHADH) and its basic biochemical characterization. Chapter two describes X-ray structure determination of rHADH. Diffraction data were collected to 2.7 Å resolution with 99.7% completeness. The histamine binding motif of HADH are very similar to those in the other histamine binding proteins. Prolyl-4-hydroxylase (P4H) belongs to a family of αketoglutarate-dependent non-heme iron oxygenases. Selective inhibitors of P4H can be potential therapeutics for fibrosis. Chapter three discusses the design of inhibitors that target P4H in the ER using the signal peptide KDEL, which is specific to the ER. Phenanthroline-GKDEL demonstrates a 100-fold increase in potency in inhibiting P4H produced in the cultured human fibroblast cells versus isolated enzyme. Fluorescent microscopy using a fluorescently tagged inhibitor demonstrates uptake of the phen-E(EDANS)VKDEL inhibitor into the ER. Nitric oxide (NO) is an important signaling molecule in the body, and the site-specific timed release NO could be utilized in the treatment of various medical conditions. Chapter four discusses the photorelease of NO from a ruthenium salen complex immobilized within a porous material. This material transfers NO to myoglobin within 20 minutes. NO is released from this material in the presence of light; however, during periods of darkness, the release of NO was not observed. This is the first system where NO is photoreleased from an immobilized polymer support.

iv
Acknowledgements
In the time that I have spent at KU and in my journey through graduate school, I have many people to thank. I would first like to thank my family who are so proud of me and have supported my work from the beginning. My parents have made numerous trips up to Lawrence to visit me and help me. Either moving me around or just walking up and down Mass Street, they were there for me. My brother, who I would visit in Tulsa or he would come up and visit me in Lawrence, we would always have a great time together. I am very proud of the man that he is becoming. I always enjoyed talking with my sister. She had a great way of making me smile and laugh. I love my family very much and appreciate all their help and support. I would also like to thank the 20s30s group of Grace EPC. They were my home away from home. I remember numerous holidays and weekend activities with them. They were always supportive and constantly praying for me. Their encouragement and wisdom would always help comfort me whenever I needed it. I would also like to thank the individuals that helped train and develop my skills as a scientist. I was always appreciative of Dr. Limburg and the training and respect he gave me as a scientist. As a fourth year student, he gave me the freedom and respect usually given to post-doctoral students. His mentorship and guidance gave me the confidence and preparation I need to begin the next phase of my life. He was always willing to discuss results and made sure that I was prepared for anything that came my way. Dr. Limburg and Dr. Mure also formed my interest for chemical biology, which is the field of my new position. I would also like to thank Dr. Mure for all of here help and guidance through the HADH project. Discussion included all three of us discussion the implications of recent data. She also worked very hard on editing my dissertation and making sure that I was ready for my defense. I would also like to thank Andy for his training and guidance in my first for years of graduate school. I always admired his emphasis on good science and good presentation of ones science. His words of wisdom also ring in my ear. I remember times when I hear Andy’s voice “the worst experiment you can do is not to do it at all” right before a big experiment. I thank all of my advisors for the training and preparation they gave me for the continuation of my scientific career, what ever it may be. In my x-ray crystallography collaboration, I would like to thank Dr. Scott and all her hard work in solving the crystal structure of HADH. Her time, dedication, and sacrifice meant a lot for me. Dr. Schowen also demonstrated the same character by helping me with my P4H chapter and my slide presentation. I learned a great deal of science from them. I would also like to thank Dr. Hanson for his time and commitment to my defense committee. The group members of all three labs were an incredible support. I made some great friends, who I wish the best in their career as they leave graduate school.

v
Table of Contents
page
Abstract iii
Acknowledgements iv
List of Figures vii
List of Schemes xii
List of Tables xiii
List of Equations xiv
List of Abbreviation xv
Chapter 1 Introduction 1
Expression, Purification and Characterization 2 of Histamine Dehydrogenase
Materials and Methods 47
Results 51 Discussion 59
Conclusion 61
Chapter 2 Crystal Structure Determination of Histamine 67 Dehydrogenase from Nocardioides Simplex
Materials and Methods 69
Results 71
Discussion 96
Conclusion 116

vi
Chapter 3 Targeting the Endoplasmic Reticulum for 121 Inhibition of Collagen Production by Prolyl 4-Hydroxylase Materials and Methods 142
Results 155
Discussion 172
Conclusion 176
Chapter 4 Photolytic Release of Nitric Oxide 181 from an Immobilized Ruthenium Complex Materials and Methods 191
Results and Discussion 195
Conclusion 202
Conclusion 206
Appendix 210

vii
List of Figures
page
Figure 1.1. Biogenic amines and polyamines 3 Figure 1.2. Structures of A) 6-S-Cysteinly-flavin mononucleotide 6 and B) [4Fe-4S] iron sulfur cluster found in TMADH,
DMADH, and HADH Figure 1.3. Sequence Alignment of HADH and TMADH 7 Figure 1.4. UV/Vis Spectrum of oxidized and reduced forms of A) 8 HADH and B) TMADH Figure 1.5. EPR Spectrum of A) HADH and B) TMADH 9 Figure 1.6. The plot of pH dependence on kcat/Km and kcat for the
oxidation of histamine by HADH. 12 Figure 1.7. Possible mechanism for C-H bond cleavage in 16 flavoproteins A) polar nucleophilic attack B) electron
transfer C) hydride transfer Figure 1.8. TMADH aromatic bowl 31 Figure 1.9. Basic residues in TMADH that may contribute to 31 the observed ionization Figure 1.10. Proposed mechanism for TMADH for 0/2 and 1/3
cycle 46 Figure 1.11. Sequence Alignment of native-HADH with rHADH 55 Figure 1.12. Optimization of HADH expression in Terrific Broth. 56 Figure 1.13. SDS-PAGE showing each stage of purification A) 56 DEAE B) Butyl-Sepharose C) Size exclusion
chromatography

viii
Figure 1.14. UV/Vis spectra of fractions collected after A) DEAE B) 57 butyl-Sepharose C) size exclusion column. Figure 1.15. HADH coupled Assay with histamine 59 Figure 2.1. Screening hits for Emerald Biosciences Crystal Kit #1 73 Figure 2.2. Homemade solution of Emerald Biosciences Crystal Kit 73 Figure 2.3. Hampton Research Crystal Screen Kit 1 #39 74 Figure 2.4. Hampton Research Crystal Screen Kit 1 #39 76 Figure 2.5. Mass spectrum (MALDI-TOF) of A) unsubstituted 78 rHADH and B) SeMet incorporated rHADH. Figure 2.6. Mass spectra (MALDI-TOF) of A) unsubstituted rHADH 79 B) SeMet incorporated rHADH. Figure 2.7. X-ray diffraction pattern of SeMet-rHADH at SSRL 81 Figure 2.8. Overview of rHADH structure. 84 Figure 2.9. Individual domains of each subunit in rHADH. 85 Figure 2.10. HADH large domain rainbow colored demonstrating 87 the TIM barrel Figure 2.11. HADH subunit overlaid with TMADH. 89 Figure 2.12. The prosthetic groups, 6-S-Cys-FMN and [4Fe-4S], in 91 HADH are involved in the oxidation of histamine Figure 2.13. Butterfly bend structure of 6-S-Cys-FMN. 93 Figure 2.14. Putative histamine binding site in rHADH. 95 Figure 2.15. Model study on histamine binding in the active site of 96 rHADH. Figure 2.16. Data collection of HADH crystal hanging out of the 100 loop

ix
Figure 2.17. The spatial arrangement of Arginine in HADH and 103 TMADH suggests similar mechanism of 6-S-Cys-FMN
biogenesis Figure 2.18. Conserved Tyr in the Active Site Contributes to the 105 Spin-interaction States of HADH and TMADH Figure 2.19. Proposed Oxidation of Histamine by HADH 111 Figure 2.20. Proposed Electron Transfer of HADH 114 Figure 3.1. Damage to the tissue elicits a cascade immune 123 response Figure 3.2. Proposed catalytic cycle of human type I prolyl 4- 127 hydroxylase Figure 3.3. Mechanism of retrieval of the KDEL-signal peptide 136 secreted proteins is the binding of the tetrapeptide
sequence to the KDEL receptor located in the Gogli apparatus
Figure 3.4. Structure of Inhibitors A) Phen-2-GKDEL B)Phen-2 157 -E(EDANS)VKDEL Figure 3.5. Dipsi spectrum of phen-2-GKDEL on Bruker 500 MHz 158 NMR Figure 3.6. Dipsi spectrum of phen-2-E(EDANS)VKDEL on Bruker 159 500 MHz NMR Figure 3.7. Fluorescence imaging of HFF incubated with A) phen- 161 E(EDANS)VKDEL B) ER tracker. Figure 3.8. Co-localization and intensity correlation analysis of A) 163 phen-E(EDANS)VKDEL and B) ER Tracker Figure 3.9. IC50 curve of phen-GKDE inhibition of the recombinant 164 human-P4H. Figure 3.10. Collagen production by HFF cells with no inhibitor (red 166 boxes) and phen-GKDEL (green diamonds).

x
Figure 3.11. The chemical structure of the dye that covalently links 167 to collagen types I through V in the Sircol Assay. Figure 3.12. Sircol assay of pepsin digested collagen from HFF 168 cells. Figure 3.13. IC50 curve of phen-2-GKDEL (green diamonds) with 168 pepsin digested collagen. Figure 3.14. IC50 curve of inhibition of recombinant human-P4H 169 with phen. Figure 3.15. Inhibition of collagen with 0.2 mM phen-GKDEL 171 (green diamonds), 0.2 mM phen (blue circles), and no
inhibitor control (red boxes). Figure 3.16. IC50 curve of phen (blue circles) and phen-GKDEL 172 (green diamonds) with pepsin digested collagen. Figure 3.17. phen-5-GKDEL inhibitor, with the phenanthroline 176 couple to the N terminus at the 5 position Figure 4.1. NO donors drugs approved for medical use 182 Figure 4.2. Structures and time release of selective 184 diazeniumdiolates Figure 4.3. Photochemical release of NO from ruthenium salen 187 complex Figure 4.4. The process of template copolymerization 189 Figure 4.5. The storage and release of NO from P-1[CoII]. 190 Figure 4.6. EPR spectra (77K) for P-1[Ru(NO)(Cl)] (dashed line) 198 and P-1[RuIII1(Cl)] (solid line). Figure 4.7. Mb peak at 435 nm shifts to 420 nm upon the binding 199 of NO from P-1 [Ru(NO)(Cl)]. Mb concentration 3.0
mM in 50 mM phosphate buffer, pH 7.2.

xi
Figure 4.8. Time release curve of P-1[Ru(NO)(Cl) with continuous 200 release (black dots) and stop time release (red dots).
Stop time release is demonstrated with continuous irradiation (solid line) and no irradiation (dashed line).
Figure 4.9. Detection of NO through nitrite concentration by the 201 Griess Reaction Figure A.1. Dose dependent indirect ELISA detecting collagen 210 production with a concentration range of 100 mM to
0.01 mM in the presence of phen (blue circles) and in the presence of phen-GKDEL (green diamonds)
Figure A.2. Dose dependent indirect ELISA of collagen 211 production with a concentration range of 100 mM to
0.01 mM for phen (blue circles) and phen-2-GKDEL (green diamonds)

xii
List of Schemes
page
Scheme 1.1. Proposed mechanism of HADH under single reaction 8 Scheme 1.2 Proposed mechanism for formation of 6-OH-FMN 28
(R2 = hydroxyl) or 6-S-cysteinyl FMN (R2=cysteine) Scheme 1.3. Control of rate of reduction of FMN by protonation 34
of substrate Scheme 1.4. Proposed oxidation reaction mechanism for TMADH. 36 Scheme 3.1. The solid phase synthesis of the GKDEL retention signal 153 Scheme 4.1. Synthesis of [Ru1(NO)(Cl)], P-1[Ru(NO)(Cl)], and 193
P-1[Ru(Cl)]. AIBN = azobisisobutyronitrile, DCB = 1,2-dichlorobenzene

xiii
List of Tables
Page
Table 1.1. Substrate specificity of HADH 11 Table 1.2. Redox potentials of the cofactor 19 Table 1.3. rHADH and native HADH comparison 58 Table 2.1. X-ray data collection statistics for SeMet-rHADH. 80
Values in parentheses are for the last shell Table 2.2. Refinement Statistics 82 Table 3.1. The deleterious effects of fibrosis on human population 121 Table 3.2. IC50 values for the inhibition of P4H by N-oxalylglycine 129 and its derivatives against isolated P4H enzyme and
in vitro with chick-tendon cells Table 3.3. Inhibition of avian P4H by pyridine-2,5-dicarboxylate 131 and its derivatives. Table 3.4. Inhibition of isolated P4H and HFF cells by 134 phenanthrolinones derivatives. Table 3.5. Quantitative analysis of the co-localization of ER tracker 162 Red and phen-2-E(EDANS)VKDEL as performed with
Image J plugin JACoP

xiv
List of Equations
page
Equation 1.1. HADH oxidative deamination of histamine to 7 imidazole acetaldehyde Equation 3.1. Pearson's coefficient 148
Equation 3.2. Overlap coefficient 148
Equation 3.3. k1 and k2 coefficients 148
Equation 3.4. M1 & M2 coefficient 148
Equation 3.5. IC50 curve 151

xv
List of Abbreviations
AIBN azodiisobutyronitrile DMA Dimethylamine DMADH Dimethylamine Dehydrogenase EB Emerald Biosciences EGF Epidermal growth factor ELISA Enzyme Linked ImmunoSorbent Assay ER Endoplasmic Reticulum ETF Electron Transferring Flavoprotein FMN Flavin Mononucleotide HADH Histamine Dehydrogenase HBP Histamine Binding Protein HFF Human fibroblast cells HR Hampton Research Hyp Hydroxylproline IL6 Interleukin-6 KDEL human retention signal peptide for the ER consists
of four amino acids, lysine, aspartic acid, glutamic acid, and leucine
L1 Interleukin-1 MADH Methylamine Dehydrogenase NLS Nuclear localization signals NO Nitric Oxide NONOates Diazeniumdiolates NOS Nitric Oxide Synthase P4H prolyl 4-hydroxylase PDGF Platelet-derived growth factor PDI protein disulfide isomerase Phen 1,10 phenanthroline Phen-2-GKDEL 1,10 Phenanthroline-2-Glycine-Lysine-Aspartic
Acid-Glutamic-Acid-Leucine Phen-2-E(EDANS)VKDEL 1,10 Phenanthroline-2-Glutamic acid - γ - [2 - (1 -
sulfonyl - 5 - naphthyl) - aminoethylamide]-Valine-Lysine-Aspartic Acid-Glutamic-Acid-Leucine
SeMet Selenium Methionine TGF-β Transforming growth factor beta TMA Trimethylamine TMADH Trimethylamine Dehydrogenase TNF-α Tumor necrosis factor alpha TGN trans-Golgi network SNP Sodium Nitroprusside H21 Bis[2-hydroxy-4-(4-
vinylbenzyloxy)benzaldehyde]ethylenediimine
1
Chapter 1
Introduction
Metalloproteins are proteins with cofactors that involve a metal center
and are involved various important roles in biological system.1 The list of
roles and functions of metalloproteins is exhaustive but includes the following:
oxygen transport (iron-hemoglobin),2 the reduction and oxidation of toxic
radical species (manganese-superoxide dismutase),3 or stereospecific
reactions (cobalt-glutamate mutase).4 Understanding the structure and
function of these metalloproteins often begins with the x-ray crystallographic
structure of the enzyme. There are close to 44,000 protein x-ray
crystallographic structures in the Protein Data Bank.5 The 3-D crystal
structures provide information about the metalloprotein’s active site, including
important metal-coordinating residues, location, and void space.
Metalloproteins are also important targets for drug design due to their
importance in biological processes. The design of inhibitors that chelate of
metal centers in metalloproteins could be used for various illness including
cancer, arthritis, and fibrosis.6-8 The study and understanding of the structure
and function of metalloproteins provides inspiration into design of materials
and devices.9 Metalloproteins found in nature contain ideal chemical
properties such as sight isolation, stereospecific reactions, formation of highly
reactive species, and catalyzed reactions all at ambient temperature and

2
pressure. Scientist and engineers look to these processes to improve
systems and provide inspiration towards the new design of materials and
devices.
Expression, Purification and Characterization of Histamine
Dehydrogenase
1.1. Background
1.1.1. Physiological Importance of Histamine
Histamine is an important biogenic amine (Figure 1.1) that performs
various physiological roles in allergic reaction, cell proliferation and as a
neurotransmitter.10 Histamine is stored in the granules of mast cells, which
are located near the nose, mouth, and blood vessels and function in the
immune response at potential sites of injury.2,3 Histamine is also located in
the histaminergic neurons within the brain, where it functions as a
neurotransmitter.11 In the stomach, histamine regulates the release of gastric
acid, which is stored in enterochomaffin-like cells.12 Between regulating the
immune response and stomach acid secretion, the roles histamine plays in
the body are vital for homeostasis. The physiological binding of histamine
within the human histamine receptors continues to gain understanding.13-15
The structures of human histamine receptors have not yet been determined.

3
Figure 1.1. Biogenic amines and polyamines10
In the absence of this information, histamine binding proteins, which are
selective towards histamine as a substrate provide an understanding of the
physiological binding of histamine.16 Elevated histamine levels in humans
have been linked to several deleterious conditions, including gastric
disorders, mastocytosis, and cancer.10 The high levels of histamine that
accumulate in fish as it begins to spoil cause scombroid food poisoning,
leading to symptoms of headache and diarrhea.17 The development of a
histamine sensor has been sought-after for food-safety regulations as well as
understanding histamine’s role in cancer.18-20

4
1.1.2. Histamine Dehydrogenase Background
Histamine dehydrogenase (HADH) was first discovered by the Yorifuji
group by screening the extracts of bacteria grown on histamine as a sole
nitrogen source.21 The extract of a soil bacterium, Nocardioides Simplex, was
able to metabolize histamine. Subsequently, the enzyme was isolated and
annotated as HADH. HADH is a homodimer, where each subunit was found
to be 84 KDa. Early studies suggested a narrow range of substrate
selectivity. In addition to histamine, only putrescine was oxidized by HADH. 22
HADH was originally thought to contain the tryptophan tryptophyl (TTQ)
cofactor found in methylamine dehydrogenase22 because of the similarity in
the UV/vis absorbance spectrum and the positive staining in the quinone-
dependent redox cycling.22
There are two major families of amine-oxidizing enzymes:
quinoproteins13-15 and flavoproteins.23 Quinoproteins are a class of enzymes
that contain covalently-linked quinones as their cofactors, derived either from
a tyrosine or tryptophan residue.14,16-18 Interestingly, amine oxidases (copper
amine oxidases and lysyl oxidases) contain tyrosine-derived quinone
cofactors and amine dehydrogenases (methylamine dehydrogenase,
aromatic amine dehydrogenase, butylamine dehydrogenase) contain
tryptophan-derived quinone cofactors. Flavoproteins are subdivided into
oxidases or dehydrogenases and contain flavin adenine dinucleotide (FAD) or
flavin mononucleotide (FMN) as redox active cofactors.23 FAD-dependent

5
monoamine oxidase, is vital in the metabolism of the neurotransmitters
serotonin, dopamine and norepinephrine.19,20 Trimethylamine dehydrogenase
(TMADH)21 catalyzes the demethylation of trimethylamine to formaldehyde
and dimethylamine. FMN-dependent dehydrogenases are trimethylamine
dehydrogenase (TMADH) and dimethylamine dehydrogenase (DMADH)
where the C6-isoalloxazine ring of the 6-S-Cys-FMN is crosslinked through
the thioether bond of a Cys residue.7,12 These enzymes also have an [4Fe-
4S] cluster, which is involved in the redox active cycle by transporting
electrons (Figure 1.2). 7,12 Limburg et al. further characterized the
biochemical properties of HADH in order to define whether HADH is a TTQ-
dependent amine dehydrogenase.24
Limburg et al. cloned the 2.1 kb gene coding the full-length HADH from
the genomic DNA of N. simplex.24 A BLAST search uncovered sequence
identity with several flavoproteins such as trimethylamine dehydrogenase
(TMADH) (40% identity, 56% similarity) and dimethlyamine dehydrogenase
(DMADH) (37% identity and 51% similarity).24 The crystal structure of
TMADH has been determined to 2.2 Å, and it is known to contain the redox
active cofactors 6-S-Cys-FMN (6-S-Cys-FMN) and an [4Fe-4S] cluster.22
Sequence analysis revealed the Cys residue in TMADH involved in the
covalent cross-link of FMN to yield 6-S-Cys-FMN is conserved in HADH
(Figure 1.3).24 HADH also has the C(2X)C(2X)C(11-12X)C motif that is

6
Figure 1.2. Structures of A) 6-S-Cysteinly-flavin mononucleotide and B) [4Fe-4S] iron sulfur cluster found in TMADH, DMADH, and HADH7,12
characteristic of proteins with an [4Fe-4S]. In this motif, 2X and 11-12X
represent residues in between the cysteines that are coordinated to the iron-
sulfur cluster.24 These results strongly suggest that HADH belongs to the
same family as TMADH with 6-S-Cys-FMN and an [4Fe-4S] cluster as the
redox-active cofactors.24
HADH catalyzes the oxidative deamination of histamine to imidazole
acetaldehyde (Equation 1.1). Reduction of HADH occurs with addition of
excess histamine, and the enzyme undergoes single turnover (Scheme 1.1).24
Histamine binds to the active site and reacts with 6-S-Cys-FMN. Histamine is
oxidized to imidazole acetaldehyde concomitant with the 2e--reduction of 6-S-
Cys-FMN(6-S-Cys-FMNR) . After another molecule of histamine binds to the
active site, the disproportionation reaction between the 6-S-Cys-FMNR and
[Fe4-S4] cluster occurs to produce the semiquinone form of 6-S-Cys-FMN
and one electron reduced [Fe4-S4]. The semiquinone of 6-S-Cys-FMN in
HADH shows a UV/Vis spectrum with an absorbance maximum at 362 nm
(Figure 1.4). TMADH undergoes the same reaction under single turnover

7
Equation 1.1.
Figure 1.3. Sequence Alignment of HADH and TMADH24
conditions, with the flavin semiquinone absorbance at 366 nm.23,24
Comparison of the UV/Vis spectra of HADHox and HADHred, with TMADHox
and TMADHred reveals almost identical spectral characteristics.24

8
Scheme 1.1. Proposed reaction mechanism of HADH under single reaction. Once substrate binds there is disportionation between 6-S-Cys-FMNH2 and [4Fe-4S]2+ with the flavin oxidized to the semiquinone and the [4Fe-4S]2+ in the +1 state24
Figure 1.4. UV/Vis Spectrum of oxidized and reduced forms of A) HADH and B) TMADH24
The EPR spectra of the unpaired electrons on the [4Fe-4S] cluster and
the semiquinone of both enzymes gave further evidence of the similarities in
redox active cofactors (Figure 1.5).24 The electrons on the semiquinone and
[4Fe-4S]+ couple antiferromagnetically, which causes strong, specific EPR
features. HADHred has an EPR signal at g = 2.00 and features at g = 2.15
and 1.88 (Figure 1.5A).24 This g = 2.00 was believed to arise from the radical

9
Figure 1.5. EPR Spectrum of A) reduced HADH and B) reduced TMADH24
on the semiquinone, while the electron on the [4Fe-4S]+ demonstrates
features at g = 2.15, g =2.00, and g = 1.88. TMADHred also has a strong EPR
signal, with the semiquinone and [4Fe-4S]+ peaks at similar values (Figure
1.5B).7,25 Unlike HADHred, TMADHred gives a half-field signal, which is due to
the coupling of electrons on the [4Fe-4S]+ and the 6-S-Cys-FMN
semiquinone. The EPR spectrum for HADHred does not contain a half- field
signal, which suggests that environment of the two cofactors might be
different.24 The spatial position of the cofactors or the arrangement of amino
acids around the cofactors could affect the spin coupling of the electrons.24
This could affect the coupling of the two unpaired electrons, as the distance
between the two electrons in HADH may be too far for spin-spin interactions.
Overall, comparison of the sequence analysis and spectroscopic data

10
demonstrates similarities between TMADH and HADH, again supporting the
presence of the 6-S-Cys-FMN and iron-sulfur containing active site, but with
possible difference in environment between the two redox sites.24
1.1.3. Substrate Specificity of HADH
HADH is only able to oxidize a narrow range of amines, as
demonstrated in Table 1.1.7 HADH does not oxidize trimethylamine (TMA) or
dimethylamine (DMA), even with the high sequence identity of HADH with
TMADH and DMADH. The biogenic amines dopamine and tyramine are also
not substrates for HADH. The products of amino acid metabolism (histamine,
agmatine, and putrescine) are all substrates, with histamine demonstrating
the highest catalytic efficiency [kcat/Km=2.1 (± 0.4) x 105 M-1 s-1] and lowest Km
value (31 ± 11 µM). HADH demonstrates substrate inhibition at high
concentrations of histamine or agmatine. As will be discussed further in the
text, the substrate inhibition is thought to arise from a stable complexation of
substrate with 6-S-Cys-FMNsq-[4Fe-4S]+, analogous that observed in
TMADH.25 The selectivity of HADH for histamine provides evidence for its
potential use in a histamine biosensor.
1.1.4. pH Effect on kcat/Km and kcat
Limburg et al. determined the pH dependence of kcat/Km and kcat.24 The
graph of kcat/Km vs. pH was best fit with a double ionization (pKa = 5.6 ± 0.3,

11
Substrate kcat (s-1) Km (µM) kcat/Km (M-1s-1)
Histamine
6.6 ± 2.3
31 ± 11
213000 ± 37000
Agmatine
2.2 ± 0.1
37 ± 6
59800 ± 6000
Putrescine
1.9 ± 0.1
1280 ± 240
1480 ± 190
Trimethylamine - - -
Methylamine - - -
Table 1.1. Substrate specificity of HADH24
pKa = 5.4 ± 0.2) with the fastest rate observed at pH below 6.0 (Figure 1.6).24
The pKa for imidazole in solution is 6.04 and most likely contributes to one of
the ionizations, which suggests the mono-protonated form of histamine binds
to the active site. The effect of ionizations in kcat/Km also suggested
involvement of amino acid residues in substrate binding or stability, as
observed with TMADH.26 Two possible residues are Glu79 and Asp358, as
they can provide ionic interactions to stabilize the positively charged amino
group of histamine.7,30 pH values above 9.3 were not linear enough to obtain
kinetic data, so it was not able to determined if the deprotonated amine (pKa

12
Figure 1.6. The plot of pH dependence on kcat/Km and kcat. The solid dots represent the values of pH dependence on kcat/km. The graph fits best to a double ionization (pKa = 5.6 ± 0.3, pKa = 5.4 ± 0.2) represented by the dashed opposed to the solid line that represents the a single ionization (pKa = 6.2 ± 0.2). The open circles represent the effect of pH on kcat. The graph first best to a single ionization (pKa = 5.6 ± 0.1)24 9.75) affected the rate. The neutral amines have been proposed to be the
reactive species for MAO and TMADH.27 28 A single ionization (pKa = 5.6 ±
0.1) has also been observed for kcat, but this could be attributed to the
electron acceptor DCPIP (pKa = 5.8) or an amino acid residue found in the
active site.24 Further studies such as site-directed mutation of Glu79 and
Asp358 as well as using agmatine as a substrate were proposed to assign
the pKas.24
1.1.5. Deuterium Isotope Effect

13
The mechanism of C-H bond cleavage for flavoproteins has still much
been debated. Efforts to understand the mechanism of histamine oxidation
by HADH were recently undertaken by Limburg et al. by examining the
isotope effect.24 Studies with deuterated histamine demonstrated a partial
rate limiting step with C-H bond cleavage with a D(kcat/Km) of 7.0 (± 1.8)under
subsaturating concentrations. Under saturation conditions, the rate-
determining step seems to involve the electron transfer step, analogous to
TMADH.25 This observed isotopic effect for HADH is close to the semi-
classical maximum. This involves the H-tunneling and transfer that occur
through the energy barrier separating reactant from product; therefore, it falls
below the classical transition state. This process has been observed for
copper amine oxidase from bovine serum.29 Tunneling has also been
suggested for TMADH, as a temperature-dependant KIE was seen at high pH
values.28 Scrutton et al. also observed a large kinetic isotopic effect for
TMADH and purposed a nucleophilic addition for substrate oxidation.28
Correlation of KIE of HADH and TMADH suggested a similar mechanism of
substrate oxidation of HADH.24
The understanding of the structure and function of HADH would benefit
from the development of a recombinant expression of HADH. This will
provide large quantity of enzyme for crystallography and sensor development.
Spectroscopic and mechanistic studies including mutant protein would also
benefit from an overexpression system of HADH. Solving the crystal

14
structure of HADH will aid towards the fundamental understanding how
histamine binds in this enzyme. Understanding the binding motif in HADH,
could provide understanding towards the binding of histamine in the human
histamine receptor. This could possibly aid in the design of antihistamines.16
The crystal structure will also provide further interpretation and understanding
of Limburg et al. research on C-H bond cleavage and substrate binding. The
C-H bond cleavage mechanism is still unclear for many flavoproteins.30
Further kinetic studies and substrate co-crystallization of HADH could
potentially led to understanding of C-H bond cleavage in HADH and
flavoproteins. Also, with HADH’s selectivity for histamine as a substrate,
development of a biosensor for histamine will further help in understanding of
this biogenic amine and move towards regulating histamine levels in humans
and fish products.
1.1.6. C-H Bond Cleavage in Flavoproteins
The mechanism of C-H bond cleavage in flavoproteins is not fully
understood. Techniques such as KIE, quantitative structure-activity
relationships (QSAR), and radical and substrate inhibitors have been
employed to understand the mechanism of C-H bond cleavage in monoamine
oxidase (MAO),32-34 TMADH,28,31 and D-amino acid oxidase (DAAO).31 The
three different mechanisms shown below have been proposed:
1) polar nucleophilic attack
2) electron transfer

15
3) hydride transfer
Figure 1.7 demonstrates these possible mechanisms of substrate oxidation.
9,32
1.1.6.1 Polar Nucleophilic Attack The polar nucleophilic attack follows the mechanism described in
Figure 1.7A. The free amine attacks the isoalloxazine ring at the C4a
position. This is followed by proton abstraction at the Cα position. Oxidation
of substrate forms the imine, which is then hydrolyzed to the product
aldehyde and ammonium ion. The reactivity of the flavin was confirmed by
model36,37 and computation studies 22 of the isoalloxazine ring. Further QSAR
studies of MAOA were performed with para- and meta-substituted
benzylamines.32 These studies demonstrate that the negative charge build-
up at the benzyl carbon position, suggesting a proton abstraction mechanism
as the mode of C-H bond cleavage. The results of mutagenesis and
substrate inhibition studies on TMADH support polar nucleophilic attack,
which will be discussed later on in the chapter.
1.1.6.2. Electron Transfer
The electron transfer mechanism involves the single electron transfer
(SET) from the lone pair of the amine nitrogen to the flavin to yield an aminyl
radical cation and flavin semiquinone (Figure 1.7B).33 SET has been
observed in electrochemical and chemical oxidation of amines, with the
possibility of occurring in flavoproteins.33 Radical formation in the active site

16
Figure 1.7. Possible mechanism for C-H bond cleavage in flavoproteins A) polar nucleophilic attack B) electron transfer C) hydride transfer9,32 is also supported by highly reactive inhibitors, which upon radical formation in
the active site, perform a ring opening mechanism that irreversibly inactivate
the enzyme.34 Studies on MAO with 1-phenylcyclopropylamine and 1-
phenylcyclobutylamine showed that the enzyme underwent the one-electron
reduction and the resulting radical reaction lead to the irreversible inactivation
of the enzyme.30 Recent efforts have been made to observe the radical
formation in the active site by EPR spectroscopy.32,33 The radical formed by a
single electron donation to MAO A on the FAD may exist in equilibrium with a
stable tyrosyl radical, as observed by EPR spectroscopy.35 Further evidence
for radical formation includes an observed anionic flavin radical on the
isoalloxazine ring in MAO A.36 The difficultly in observing the SET mechanism

17
is the lifetime of the radical that is short-lived and proves to be very difficult to
observe in the substrate oxidation.
1.1.6.3. Hydride Transfer
KIE and QSAR results for D-amino acid oxidase were compatible with
transfer of a hydride from substrate to FAD.31 The linear free energy
correlation demonstrated little, if any, development of charge in the transition
state. The isotope effect and solvent effect were consistent with a highly
concerted process and a symmetric transition state. There was also little
effect for steric parameters, which negates the polar nucleophilic attack
mechanism and the following mechanism for DAAO was proposed (Figure
1.7C).
1.1.7. pH Dependence of the Redox Properties of HADH
The recent discovery of HADH’s cofactor and possible mechanism of
C-H bond cleavage24 has encouraged the Kano group to probe the pH
dependence of the redox properties towards the reductive-half reaction of
HADH.26,40 Stoichiometric titration of HADH with dithionite showed a
disappearance of 6-S-Cys-FMN absorbance and the appearance of the 6-S-
Cys-FMN semiquinone (6-S-Cys-FMNS) at the beginning of the titration. The
6-S-Cys-FMNS gradually decreased as the reduced 6-S-Cys-FMN (6-S-Cys-
FMNHR) formed. Plotting absorbance change as a function of dithionite
concentration revealed three moles of dithionite reacting with one mole of
HADH.40 This was consistent with the reduction of TMADH with dithionite.37

18
Reductive titration with histamine revealed a two to one mole ratio of
histamine to enzyme, which is also seen in TMADH with trimethylamine.23,40
Redox potentials were measured using a spectroelectrochemical method at
pH 7.0.40 Similar results were observed for HADH and TMADH (Table
1.2).40,41
When the pH dependence of the redox potentials was examined, little
pH dependency was found for the 6-S-Cys-FMN oxidized to 6-S-Cys-FMN
semiquinone couple (6-S-Cys-FMNO/S).40 The 6-S-Cys--FMNS to 6-S-Cys-
FMNR couple (6-S-Cys-FMNS/R) exhibited pH dependence towards the
negative potential with a slope of -60 mV pH-1, which suggests the single-
electron transfer was coupled with single-proton transfer. The redox potential
of the [4Fe-4S] cluster was observed by cyclic voltammetry. It is relatively
free from pH dependency at pH < 9, but at pH > 9, the potential drops with a
slope of -180 mV pH –1.40 The enzymatic activity of HADH is pH dependent
with regards to acid-base equilibrium.40 The potential for 6-S-Cys-FMNS/R
decreases (pH<9) with respect to FeSO, suggesting an increased driving force
of intermolecular transfer from the 6-S-Cys-FMNS to the [4Fe-4S] with
increasing pH. This data is also supported by the EPR spectra, which
indicates an increase in the semiquinone radical at g = 2 as pH increases.
This could play a role in the observed increased rate constant of HADH as it
approaches pH 9. The redox potential of the cofactors gives insight into the
reaction mechanism and the reductive half reaction of HADH.

19
Table 1.2. Redox potentials of the cofactor40,41
1.1.8. Model Systems of Histamine Binding
One of the great interests of HADH is the substrate selectivity for
histamine.24 There are a few enzymes that have been either crystallized with
histamine or a derivate of histamine.16 These histamine binding proteins
could provide insist into the binding of histamine in HADH and also the
physiological histamine receptor. Understand the binding of histamine could
have implications in drug design of antihistamines.16 Many antihistamines
have been designed for the treatment of various physiological disorders.38,39
Commercially available drugs provide allergy relief by targeting the histamine
H1-receptor in the body,44,45 while another line of histamine antagonists
targets the H2-receptor and suppresses excess stomach acid. Antihistamines
are widely prescribed for various ailments, and the design of these drugs
requires selectivity and specificity. Model systems of proteins that specifically

20
bind histamine have contributed to the understanding of how histamine binds
to its receptor and could potentially help in designing specific and effective
pharmaceutical drugs.16 All four membrane-bound histamine receptor
proteins have been sequenced, but the three dimensional structures have yet
to be determined.46-49 As previously mentioned, each histamine receptor (H1,
H2, H3, H4) has distinct pharmacological roles and requires careful analysis.
Various histamine binding proteins have been helpful in understanding both
the mode of histamine binding and the pharmacological and toxicological
profiles of certain antihistamines.16 These proteins vary in function and
structure but all provide insight into the binding of histamine, which is broken
down into two aspects. The first involves the imidazole ring of histamine as
the major mode for binding, while the second binds histamine through the
aliphatic amine for stabilization in the active site. In histidinal dehydrogenase,
the imidazole group is stabilized by hydrogen bonding to a glutamic acid side
chain and coordination to the zinc atom.40 Carbonic anhydrase also binds
histamine primarily through its imidazole ring; histamine hydrogen bonds with
asparagine and glutamic acid residues and shares π−π interactions with
histidine and phenylalanine.41 Histamine binding proteins (HBP), however,
which are found in found blood sucking insects, are examples of proteins that
stabilize the free amine of histamine.52 In HBP, the aliphatic amine of
histamine forms a salt bridge with the glutamic acid and aspartic acid
residues. In HBP, however, the imidazole ring of histamine is also involved in

21
binding; imidazole has ionic interactions with glutamic acid and aspartic acid
residues and is within π-stacking distances with phenylalanine and
tryptophan.52 The polar, internal binding pocket of HBP is ideal for histamine
and mimics what is known about how histamine binds to histamine receptors
within the body. Through model studies and site directed mutagenesis, it was
determined that the primary ligand binding pocket in the H1 and H2 receptors
have aspartic acid, serine, and threonine residues that interact with the amine
group of histamine via electrostatic interactions in a predominantly polar
pocket.48,53,54 The conserved aspartic acid in human H1, H2 and H4
receptors is essential for binding histamine.48 The imidazole ring is stabilized
by both hydrogen bonding with two glutamic acid residues and also π-
stacking with a tyrosine residue. The histamine binding pocket in human H1,
H2, and H3 receptors may be regulated by the bulkier residues tyrosine,
tryptophan and phenylalanine, as the H4 receptor does not contain these
residues, which could explain the difference in histamine interaction.48
Proteins that are selective for histamine will allow research towards the
understanding of the physiological binding of histamine.48 In addition, these
proteins will potentially allow for the development of specific antihistamine
drugs.
1.1.9. Detection of Histamine with a Biosensor
One application of HADH is the potential design of a histamine
biosensor. Amperometric detection of histamine could be used to understand

22
the physiological role of histamine, in regulating histamine levels in humans
and histamine concentrations in fish. Reports suggest that histamine could
play a significant role in cancer.1,55 One example of this is the possibility that
histamine acts as a mediator of proliferation in breast cancer.56-59 Mast cells
are responsible for the release of histamine and they are found in large
quantities around the edge of solid tumors.42 At normal concentrations
histamine is an immunostimulant, but it is believed to be an
immunosuppressant at high concentrations.43 One study examined the
involvement of histamine in breast cancer and found elevated levels of
histamine in the cancerous breast tissue with respect to the adjacent
noncancerous breast tissue.42 Elevated histamine levels are also associated
with colon cancer.55,61 The specific role histamine plays in cancer remains
unclear.62,63 Detection methods with improved sensitivity and specificity could
further the understanding of histamine’s involvement in cancer.
The methods of histamine detection in the cancer studies include
either radioenzymatic assay44 or an HLPC-based derivatization assay.55 The
official method for the determination of histamine in fish and fermented food,
as recognized by the Association of Official Analytical Chemists (AOAC),
involves the derivatization of histamine with the fluorophore .65,66 This method
requires the time-intensive procedure of isolating pure histamine by removing
impurities. These methods have been proven to detect histamine; however,
the detection of contaminants67,68 and the multi-step purification of histamine

23
are both problematic.55 A number of histamine detection kits are
commercially available. These kits are performed by ELISA,45 but the
expense and time requirements (30 min to 2h) are not ideal.46 An enzymatic,
real-time biosensor that is specific for histamine would further our
understanding of histamine and its involvement in cancer, as well as help
prevent scombroid food poisoning.
Histamine accumulates in spoiled fish due to the microbial
decarboxylation of histidine.17 This elevated level of histamine is the main
toxic agent in scombroid food poisoning, which is one of the most common
illnesses that occur due to the consumption of fish. The symptoms of this
acute illness include sweating, rash, flushing of the face, diarrhea, and
abdominal cramps. In severe cases, symptoms can include respiratory
distress and swelling of the tongue and throat, which require sudden medical
attention. Most cures include a dose of antihistamines to reverse the effects
of excess histamine consumption.17
1.1.10. Understanding HADH through TMADH
1.1.10.1. Crystal Structure of TMADH
The high structural homology (40% identity, 56% similarity) of HADH
and TMADH and the spectroscopic evidence supporting similar redox
chemistry of HADH and TMADH, suggest TMADH is a good model for
HADH.24 The crystal structure of TMADH has been determined at 2.2 Å
resolution, showing two identical subunits with a molecular mass of 83 kDa

24
each.22 The structure of TMADH consists of three distinct domains: a small
domain (residues 495-648), a large domain (residues 1-383), and a medium
domain (residues 384-494 and 649-733). The large domain contains the 6-S-
Cys-FMN and [Fe4-S4] cluster and is comprised of an 8 parallel β-barrel
enclosed with 8 parallel α-helices. The covalently linked 6-S-Cys-FMN is
located in the first parallel β-barrel. Large excursions of the chain are found
at the ends of several β-strands, which give enough mass to the large domain
to bury the 6-S-Cys-FMN. The entire structural motif of TMADH contains 16
α-helices and 18 β-strands. The two redox cofactors are located near the
center of the large domain and are separated by a center-to-center distance
of 12 Å. The cysteines of the iron-sulfur cluster are contained in a short helix
located at the end of the β-barrel. The [Fe4-S4] cluster is found
approximately 20 Å from the surface of the protein. The 8α−methyl of the 6-
S-Cys-FMN is only 4 Å from the closest cysteinyl sulfur atom and 6 Å from the
nearest iron atom. The close proximity of the 6-S-Cys-FMN and [Fe4-S4]
cluster could give rise to the electron coupling seen in the EPR spectrum. It
is proposed that upon reduction of the 6-S-Cys-FMN, electrons are passed
from the 6-S-Cys-FMN to the closest cysteine ligand of the [Fe4-S4] cluster
via the 8α−methyl on the 6-S-Cys-FMN. The electron transfer is consistent
with the reaction of various other flavoproteins that undergo electron transfer
reactions.

25
The 6-S-Cys-FMN is not planar and contains a high degree of bending
(called a butterfly bend) in the active site.22 Computational studies were
performed in attempt to understand the role of the butterfly bend in 6-S-Cys-
FMN.71,72 Calculations were conducted on the energetically favored planar
flavin versus the unfavorable nonplanar flavin. Results suggest that the
energetically unfavored bend of the isoalloxazine ring raises its reduction
potential from -220 mV to -10 mV in lumiflavin and from -174 mV to +17 mV in
C6—methylsulfanyllumiflavin.71,72 The data suggest that the butterfly bend
also raises the reduction potential in TMADH. These structural characteristics
will aid in the understanding of HADH and its structural properties.
1.1.10.2. Covalent Linkage of 6-S-Cys-FMN
Mutagenesis studies on Cys30 and Trp335 in TMADH have aided in
the understanding of the 6-S-Cys-FMN crosslinking.21,22,73 TMADH, DMADH,
and HADH are the only enzymes known to contain the unusual 6-S-Cys-FMN.
7,12 Cys30 is known to form a C6-covalent link with 6-S-Cys-FMN through
nucleophilic attack by the thiolate group on cysteine.47 However, when Cys30
was mutated to alanine in TMADH, the enzyme retained similar quantities of
6-S-Cys-FMN compared to the recombinantly expressed TMADH (26 and 30
% mol equivalent flavin: rTMADH to C30A TMADH, respectively).48 The Km of
C30A was raised by a factor of two and kcat was reduced by a factor of two
with respect to the recombinantly expressed wild-type protein. The C30 bond
was not required for the oxidative deamination of trimethylamine, although

26
inactivation of the enzyme mutant was seen with the addition of excess
substrate or after approximately 10 turnovers. Inactivation of the enzyme was
caused by formation of 6-hydroxy (6-OH) FMN with the C30A species. Thus,
the C30 crosslink was thought to prevent the formation of the inactive 6-OH
FMN. The inactive 6-OH FMN was characterized spectroscopically by
observing the disappearance of the 440 nm peak and the appearance of a
new peak at 400 nm. The C30A mutant species was treated with perchloric
acid21 to remove the 6-OH FMN, which was then titrated and the peak at 600
nm was observed.49 These spectra show a single ionization with a pKa of
~7.0, which is the known value for 6-OH FMN.49 When the flavin isolated
from the C30A mutant TMADH was analyzed by MALDI-MS, it was found to
have a mass of 472.2 +/- 0.1 Da,48 which is within experimental error for the
known 6-OH-FMN value of 472.3 Da.49 Since 6-OH FMN was only recovered
after substrate was added, while the as-isolated enzyme was devoid of 6-OH,
it was thought that the 6-OH FMN forms by an hydroxide attack on the flavin
substrate intermediate.50 This theory on 6-OH FMN formation held until one
of the three residues in the “aromatic bowl,” which is involved in cation – π
bonding of substrate in the active site, was mutated.48 Upon isolation and
characterization of W355L, however, spectroscopic data showed a species
similar to 6-OH FMN C30A. Isolation of the cofactor by perchloric acid
revealed a single ionization with a pKa of approximately 7.0 and an exact
mass of 472.2 +/- 0.1, allowing it to be identified as 6-OH FMN.48 The unique

27
characteristic of the 6-OH FMN formation in W355L was the fact that it formed
in the absence of substrate. Only 8-21% of the isolated W355L TMADH
contained 6-S-Cys-FMN, while 38-65% contained 6-OH FMN and 54-14%
was in the deflavo form. (The different reported values are from two separate
preparation of the enzyme.) This is different than the isolated C30A species,
which only contained 6-OH FMN after the addition of substrate. After 6-OH
FMN was found in W355L TMADH, both the native and recombinant forms
were examined for this species. Native TMADH was found to contain 1.5% 6-
OH FMN, while the recombinant form had 3%. The observation of 6-OH FMN
formation in the wild type enzyme suggested that TMADH has the ability to
derivatize the flavin without the use of substrate. The following mechanism of
flavin derivatization in the absence of substrate was then proposed. (Scheme
1.2).48 The hydroxylation proceeds through a flavin iminoquinone methide
tautomeric form. An increase in electrophilicity at the C6 position is seen in
the methide tautomeric form. Nucleophilic attack by either hydroxide or
cysteine at the C6 position is followed by re-oxidation, which re-aromatizes
the flavin to give either 6-OH or 6-S FMN. The methide tautomeric form has a
negative charge between the N1 atom and the C2 carbonyl that is stabilized
by the positively charged Arg222. Mutation of Arg222 to lysine compromised
the formation of the 6-S-Cys-FMN link while mutation of Arg222 to valine
completely abolished flavinylation of the enzyme.51 These results suggest
that the mechanism of crosslink formation in flavoproteins involves a methide

28
Scheme 1.2. Proposed mechanism for formation of 6-OH-FMN (R2= hydroxyl) or 6-S-Cys-FMN (R2=cysteine)48 tautomer, which creates an electrophilic position at the C6 or 8α−methyl
position on the isoalloxazine ring in flavoproteins.48
1.1.10.3. Kinetics of Substrate Oxidation
One area of great interest for HADH is the reaction mechanism for the
oxidation of substrate within the active site. The conserved residues and
similar spectroscopic characteristics of TMADH and HADH suggest possible

29
similarities in the reaction mechanism.24 Extensive enzyme kinetic studies on
both wild-type and mutant forms of TMADH have been performed by Scrutton
and coworkers.28,29,31,78 Cleavage of the C-H bond in flavoproteins is not well
defined within the family of amine oxidizing enzymes. The four proposed
mechanisms28 of C-H bond cleavage in TMADH are the following:
(1) Active base involved in proton abstraction, generating a carbainon
species.52
(2) Formation of an ammonium cation radical followed by H-atom
abstraction.53
(3) External radical involved in H-atom abstraction.54
(4) Nucleophilic attack of free base substrate, followed by proton
abstraction by an active site base.55
Kinetic studies on wild-type and mutant forms of TMADH were performed to
discover whether the TMADH reaction pathway would fit one of these
models.28,29,31,78,81
1.1.10.3.1. TMADH Reaction Mechanism
Experiments with recombinant TMADH with the deuterated native
substrate trimethylamine over the pH range 6.0 – 11.0 exhibited two
ionizations in the Michaelis complex, with pKa values of 6.5 and 8.5 and
maximal activity seen in the alkaline region.26 Mutations of TMADH were
made to define the two ionization points and to further gain understanding of
the reaction mechanism. The crystal structure of TMADH reveals several

30
residues involved in the active site, with an “aromatic bowl,” comprised of
residues Tyr60, Trp264, and Trp355, that is involved in cation-π bonding of
the substrate (Figure 1.8).22,82 Also in the active site are several basic
residues (Tyr169, Tyr60, Try174, and His172) that possibly contribute to the
observed ionization (Figure 1.9).22 Mutagenesis of these residues was
performed, and plots of rate vs. pH were prepared to determine whether
TMADH still exhibited ionization.28,29,78,82 The mutants Y169F and Y174F
were cloned and expressed, but no change in the observed ionization or pH-
dependent kinetic behavior occurred.56 Mutation of Y169 to phenylalanine
showed unique spectroscopic characteristics.28,78 In the crystal structure,22
Tyr169 is shown to have van der Waals interactions with the flavin cofactor
and is hydrogen bonded to His172.56 In the EPR spectrum of the Y169F
mutant, the intense half field signal of g ~4 that was seen in the wild-type was
not observed. This signal is attributed to the spin-spin interaction of the
unpaired electron on the flavin semiquinone with the unpaired electron on the
[4Fe-4S]+.56 Both wild-type and mutant spectra have a signal at g ~ 2 that
accounts for both the axial signal of the semiquinone and the rhombic signal
of the [4Fe-4S]+. The Y169 is located next to the C(2) = O group which is on
the opposite side of the flavin ring from the [4Fe-4S]. The loss of the spin-
spin interaction was rationalized by negative charge that develops due to the
hydroxyl group, creating an electrostatic repulsion of the unpaired electron on
the 6-S-Cys-FMN that pushes it towards the [Fe4-S4] cluster.56 This would

31
Figure 1.8. TMADH aromatic bowl22 All structures in the chapter were generated with pymol57
Figure 1.9. Basic residues in TMADH that possibly contribute to the observed ionization22

32
reduce the spin-spin distance and therefore cause an increased spin-spin
interaction.
Tyr60 is one of the three residues found in the “aromatic bowl” of the
active site.58 The Y60F mutant exhibits differences from the wild type
TMADH. The Y60F data was fit to a double ionization which suggests little
influence in the ionization observed; however, the Y60F mutant was shown to
destabilize the basic form of the Michaelis complex by ~1.3 kJ mol-1, as the
ionization shifted to a pKa of 8.8. When His172 was mutated to Gln, the pKa
was 8.4 +/- 0.1, and the upper ionization was lost.26 In the enzyme-substrate
complex, this represents the ionization of the imidazolium side-chain of
histidine that is necessary to control the rate of flavin reduction and maximal
activity is observed following deprotonation of His172. A double mutant of
Y60F and H172Q further reduced the stability of the trimethylamine base. As
demonstrated by the double mutant, these residues contribute to the stability
of the trimethylamine base by ~2 kJ mol-1 and over 3 pH units. This
stabilization of the free trimethylamine (pKa 9.8) is a result of both an amino-
aromatic interaction between substrate and the hydroxyl group of Tyr60, as
well as the imidazolium side chain of His172. These mutations demonstrate
that both Y60 and H172 are important to the reaction mechanism, and the
ionization of H172 is necessary for the rate of flavin reduction.
1.1.10.3.2. TMADH Active Base Determination

33
Since all of the possible ionizable residues were mutated, and only
His172 influenced the upper ionization in the enzyme-substrate complex, the
lower ionization remained undefined.26 The oxidation of substrate by both
wild-type and mutant TMADH has a large isotope effect (>7).28,29 In this
study, His172 was mutated to simplify the observation of the lower ionization.
In the case of H172Q, ionization of the protonated trimethylamine occurs at a
pKa of 6.8 +/- 0.1; however, this valve is shifted to pKa of 7.4 +/-0.1 when the
trimethylamine substrate is deuterated.28,29 This shift indicates that the
deprotonation of the trimethylamine base corresponds to the lower ionization
in the enzyme-substrate complex from moving from low to high pH. In the
deuterated trimethylamine, the C-D bond contains a larger charge density and
the N-H bond is more stable with respect to the C-H bond. 28,29 The elevated
pKa value in the presence of deuterated substrate is therefore attributed to the
N-H bond of the protonated trimethylamine dissociating easier than the
deuterated trimethylamine. Scheme 1.328 demonstrates the controlled rate of
flavin reduction based on protonation of substrate. The dissociation steps are
in thermodynamic equilibrium based on the relatively slow conversion of ES
complex to EP.28 The buildup of unreactive ESH+ complex that is seen in the
deuterated substrate is caused by the increased pKa. At pH 9.5 and above,
the rates of reduction of the deuterated substrate and protonated substrate
are equal, which means the substrate only exists in the S form and not in the
SH+ form.28 This kinetic data suggest the deprotonation of substrate is

34
Scheme 1.3. Control of rate of reduction of 6-S-Cys-FMN by protonation of substrate28
responsible for the lower ionization in the enzyme complex while the upper
ionization is attributed to His-172 with the stability of substrate.28
1.1.10.3.3. 6-S-Cys-FMN as an Active Base
Once characterization of the two ionizations in the Michaelis complex
was accomplished, it was of interest to determine the active site base
involved in the oxidation of trimethylamine.28 All of the possible active site
basic residues were examined by point mutations to identify their role in the
substrate oxidation mechanism. 28,29 Tyr169, Try60 and His172 are the
potential active site bases, so these were mutated to observe their catalytic
influence. As mentioned previously, two ionizations were observed in the
Y169F and Y60F species.28,31,78 The H172Q TMADH mutant exhibited a 10%
reduction in rate constant and loss of the upper ionization.26 Therefore, the
ionization of this residue influences the rate of reaction, but it is not the active
site base. The mechanism of the enzyme monoamine oxidase A32 and D-

35
amino acid oxidase59 demonstrate how the N-5 atom of the flavin can act as a
base for C-H bond cleavage. This mechanism also suggests nucleophilic
attack of the free amine on the C4 atom of the flavin isoalloxazine ring
(Scheme 1.4).28
Computational studies on lumiflavin and C6-methylsulfanyllumiflavin
were performed in order to calculate the energies associated with the
reduction of the 6-S-Cys-FMN.71,72 Both were analyzed as part of the wild
type structure and part of a Cys30 mutant species, which is involved in the
covalent crosslinking of the flavin within the enzyme. The wild-type structure
exhibits an area of negative charge on both the C6 sulfur involved in the
crosslink and on the N5 of the flavin that is believed to deprotonate the
trimethylamine, suggesting the N5 atom possesses the nucleophilic
properties necessary for the mechanism.22 Examination of the lowest
unoccupied molecular orbital (LUMO) demonstrates significant orbital density
on the N5 and C4 of the flavin. The N5 atom has a negative charge of < -0.5
e, which again supports the mechanism of deprotonation.22 The C4 atom has
a positive charge of >0.0 e, which supports the mechanism of nucleophilic
attack on the electrophilic C4a atom.22
The reaction of phenylhydrazine also supports the mechanism of
nucleophilic attack at the C4 position.60 When the enzyme is incubated with
phenylhydrazine, the 440 nm band attributed to the flavin is lost, and a new
band grows in at 360 nm.60 This new species at 360 nm was tested for

36
Scheme 1.4. Proposed oxidation reaction mechanism for TMADH28
activity and was found to be 94% inactive. Isolation of this new species from
proteolytic digests led to the discovery of the flavin being arylated at the C4
position.60 This supports the theory of the C4 position of the flavin being the
site of nucleophilic attack by substrate.31,84
The data suggest the following mechanism for the oxidative
deamination of trimethylamine by TMADH (Scheme 1.4).28 The free
trimethylamine base is deprotonated by the N5 atom of the flavin, and
subsequently the deprotonated trimethylamine nucloephilically attacks the C4
atom. N-methyl-N-methylenemethanaminium is released from the flavin

37
before water oxidizes the substrate to form formaldehyde and dimethylamine.
HADH is known to have a KIE > 7, butterfly bend in the 6-S-Cys-FMN, and
react with phenylhydrazine which is reasonably to assume similarities within
the reaction mechanism.24
1.1.11. Reductive Half-Reaction of TMADH
There is spectroscopic evidence of a single unpaired electron on the
[4Fe-4S] and on the semiquinone for both HADH and TMADH during the
reductive half-reaction.7,81 The reductive half-reaction of TMADH with its
natural substrate trimethylamine (TMA) was studied over the pH range 6.0 –
11.0.61 This reaction exhibits three resolved kinetic phases,23,24,26,81 which
include a fast, intermediate, and slow phase.61 The reductive half-reaction
begins with the fast phase, which is a two electron reduction of the flavin.
The intermediate phase, follows with intramolecular electron transfer to the
iron sulfur cluster from the dihydroflavin. The slow phase consists of product
release and involves spin-spin interaction of the unpaired electrons on the
[4Fe-4S]+ and the flavin semiquinone. The kinetic information of these three
phases was determined by stopped-flow spectroscopy of the observable
changes at 450 nm, 365 nm, and 520 nm at pH 8.0 and 10 oC. 61 A reduced
temperature was used because reduction of TMADH at elevated
temperatures is very fast and prohibits detailed analysis. The rate constants
from the spectroscopic data for each step are as follows: kfast = 500 s-1; kint =
17 s-1; and kslow = 1.6 s-1.61 The data were collected at pH 8.0, since below

38
pH 7.0, the intermediate phase is difficult to resolve due to the small spectral
change. Above pH 9.5, the rate constant for the slow phase and
intermediate phase approach each other at high substrate concentration. The
rate constants of both the slow and intermediate phases show a dependence
on substrate concentration, where rate decreases as the substrate
concentration increases. The degree of substrate inhibition increases with
pH. A 50 % reduction in activity is seen for the intermediate phase, going
from ~ 2 mM substrate at pH 7.5 to ~ 0.3 mM substrate at pH 9.5.61 The slow
phase sees a reduction from ~ 20 mM substrate at pH 6.0 to ~ 1 mM
substrate at pH 8.0.
1.1.12. Oxidative-Half Reaction
Reoxidation of HADH is known to occur by an external electron
acceptor, but the identity of this electron carrier is unknown. The oxidative
half-reaction of TMADH has been well characterized by mutagenesis and
kinetic studies.62,63 As mentioned earlier, the reductive half-reaction of
TMADH involves three kinetic phases.61 The fast phase involves the two
electron reduction of 6-S-Cys-FMN, followed by the intermediate phase of
intramolecular electron transfer from the reduced 6-S-Cys-FMN to the [4Fe-
4S] center. Upon the release of product and binding of substrate, the slow
phase involves the spin-spin interaction of the flavin-semiquinone and
reduced [4Fe-4S] center. The [4Fe-4S] is reoxidized by the intermolecular
transfer of electrons to the external electron acceptor.50 The physiological

39
electron acceptor for the reoxidation of TMADH is an electron transferring
flavoprotein (ETF),50 but the physiological electron acceptor of HADH has yet
to be determined.
Studies on the oxidative half-reaction of TMADH could aid in
determining the mechanism of electron transfer from HADH to the electron
acceptor. Residues involved in the intermolecular transfer from the [4Fe-4S]
of TMADH to the surface of the protein were believed to be Tyr422 and
Val344.41 The crystal structure of TMADH reveals a small groove by the
[4Fe-4S], by which the FAD of the ETF could potentially bind.85 Y422 and
V344 are located in this small groove, with V344 providing the shortest
pathway from the Cys-345, one of the cysteines that coordinates the [4Fe-
4S], to the surface of TMADH.62 Y422 is involved the second pathway, which
proceeds from C345 to Glu-439 then to Y442. Several mutations of Y422 and
V344 were performed in order to either increase or decrease the side chain
volume at these two positions.41 Ferricenium ions and ETF were both
employed for the kinetic analysis of the Y422 and V344 mutants.41 In ensure
that the mutant did not affect the oxidation of substrate, steady-state kinetics
were examined to compare the reductive half reaction of the wild type to the
mutants species. The mutants caused very little perturbation of binding and
oxidation of substrate.62
To understand how the mutations affected the electron transfer of
TMADH, the mutants underwent steady-state kinetics with the artificial

40
electron acceptor Fc+.62 The mutants V344C, V344A, and V344G caused an
increase in reaction rate of electron transfer to Fc+. Likewise, the larger,
bulkier side chains of isoleucine and tyrosine caused slower electron transfer
to Fc+. The Y442 mutants had little to no effect on the rate of electron
transfer to Fc+. Evidence suggests that V344 represents the shortest route
from the [4Fe-4S] to the surface.62 The shorter the side chains on the
residues, the shorter and quicker the electron transfer to Fc+. Similarly, larger
residues have longer and slower electron transfer, consistent with shorter and
quicker route.
The oxidative half reaction of these mutations on TMADH was also
examined with ETF.62 The V344 mutants had little effect on electron transfer,
but mutations at the Y422 position perturbed the electron transfer
significantly. The Y442G mutant had the greatest increase in dissociation
constant for the ETF-TMADH complex and had a 10-fold decrease in rate
constant compared with the wild type. Y442C also had a decrease in rate
constant, though not as significant. This rate reduction in the Y442 mutants
changed the geometrical alignment of the TMADH-ETF complex making
electron transfer more difficult and less efficient. While the residue Y442 is
more involved with the electron transfer from TMADH to the ETF, the role of
V344 in the electron transfer to ETF was seen as minimal. This study shows
the transfer of electrons to the ETF proceeds through Y442, while V344 plays
a minimal role in this process.62

41
1.1.13. Substrate Selectivity
The substrate selectivity that HADH has for histamine represents one
of the unique properties of this enzyme. The substrates for which HADH is
selective include histamine (Km = 31 µM, kcat/Km = 2.1 x 10⁵ M-1s-1), agmatine
(Km = 37 µM, kcat/Km = 6.0 x 10⁴ M-1s-1), and putrescine (Km = 1280 µM,
kcat/Km = 1500 M-1s-1).24 As mentioned previously, HADH shares 40% identity
and 56% similarity with TMADH and 37% identity and 51% similarity with
DMADH.24 Observation on substrate selectivity of these two protein could
provide insight into the histamine selectivity of HADH.58 TMADH and
DMADH, which are selective for tertiary and secondary amines respectively,
share a 63.5% sequence identity.58 When comparing the active site residues
of TMADH with DMADH, most are conserved. There are three residues
which are not conserved (Tyr60 to Gln, Ser74 to Thr, and Trp105 to Phe,
TMADH numbering) that could contribute to the selectivity of tertiary amines
in TMADH verses secondary amines in DMADH.58 As described above in
TMADH, Y60 is one of the three residues involved in the aromatic bowl region
for cation-π binding of the alkylammonium ion substrate. Cation-π interactions
within the proteins have been observed in very diverse structures, from
aceylcholinesterase64 to the SH2 domain of the v-src oncogene.65 The
cation-π interaction of the alkylammonium ion with the aromatic bowl in
TMADH represents the largest group of biologically relevant organic cation
ligand binding. In DMADH, the Y60 residue is changed to glutamine and

42
modeling studies suggest that the change to glutamine in DMADH provides
hydrogen bonding with the N-H of the dimethylammonium substrate.66 The
other two non-conserved residues pack against the Y60, and model studies of
DMADH suggest that these residues influence the position of Gln60, giving it
the ability to hydrogen bonding to the substrate; thus, the difference in
substrate specificity would depend on these three residues.58
Mutagenesis studies on TMADH were performed (Y60Q, S74T, and
W105F) in attempt to switch its substrate specificity from TMA to DMA.58 In
wild type TMADH, DMA is a poor substrate where the ratio of selectivity
coefficients for TMA to DMA is about 4000. The Km value for TMA is 13.7
µM, verses 2.3 mM for DMA. The value of kcat for substrate is 0.67 s-1 for
TMA and 15.6 s-1 for DMA. Upon the triple mutation of TMADH (Y60Q, S74T,
and W105F) an increase in Km and an 800-fold decrease in kcat were
observed with TMA as a substrate. Reaction of triple mutated TMADH with
DMA did not show a significant change in Km or kcat. Even though both
substrates bind in the same location, the mutations seemed to only impair the
binding of TMA. The effects of the TMADH mutations on the reductive half
reaction were also examined. Flavin reduction is monitored
spectroscopically by the decrease in absorbance at 443 nm, along with the
growth of a peak at 365 that corresponds to the formation of the 6-S-Cys-
FMNsq-[4Fe-4S]+ species that results from the intramolecular electron transfer
from the dihydroflavin. When triply mutated TMADH is reacted with TMA, the

43
rate of flavin reduction is reduced around 4000-fold, while minimal reduction
in rate was observed with DMA as substrate. In contrast to wild-type, the
specificity of the overall reductive half reaction favors DMA by 82,000-fold.
An Absorbance change at 365 nm for the mutant TMADH reacting with TMA
was monophasic and displayed no tendencies for substrate inhibition, in
contrast with the biphasic wild type enzyme, in which each phase is controlled
by substrate concentration. The reaction of mutant TMADH with DMA was
biphasic and exhibited faster intramolecular electron transfer from the
reduced 6-S-Cys-FMN to [4Fe-4S].58
The enzymes TMADH and DMADH have active sites that contain
highly conserved residues.58 Mutation of TMADH residues Y60 (aromatic
bowl) and S74 and W105 (interaction with Y60) was performed in order to
change substrate specificity towards that of DMADH.58 These residues are
not conserved within the active sites of the two enzymes. These mutants
greatly diminish substrate TMA from binding and decrease the reduction of 6-
S-Cys-FMN. Of the three residues in the aromatic bowl, only Y60 (Gln60 in
DMADH) is not conserved, which signifies the selectivity of TMADH for the
trimethylammonium ion instead of the dimethylammonium ion.58
1.1.14. Substrate Inhibition
HADH exhibits substrate inhibition at high concentrations of substrate,
which is likewise seen in TMADH.24 The steady-state reaction of TMADH has
been studied in attempt to understand the substrate inhibition. As mentioned

44
above, TMADH and HADH exhibit similar spectroscopic properties upon
reaction with substrate;24 therefore, a similar mechanism of substrate
inhibition would be expected to be seen in both of these enzymes. The redox
cycle of TMADH was studied under steady-state conditions with the artificial
electron acceptor ferricenium hexafluorophosphate (Fc+).25 Fc+ was used
since it does not interfere with the spectroscopic region used for analyzing the
rate of reduction of TMADH, and it is shown to be comparable to the electron
flow that is seen with physiological redox acceptor, ETF.
Stopped-flow studies monitored the decrease in absorbance at 443 nm
(6-S-Cys-FMN) for the reduction of TMADH by substrate and increase in
absorbance at 365 nm (anionic flavin semiquinone) and 440 nm (oxidation of
the iron-sulfur cluster).25 TMADH turnover was observed at a constant
concentration of Fc+ (100 µM) and varied concentration of TMA (20 µM – 2
mM). At lower TMA concentration, the peak at 365 nm is not observed, while
the peak for oxidized 6-S-Cys-FMN at 443 nm is observed, which suggests
the oxidized 6-S-Cys-FMN is the dominant species at low substrate
concentrations. At high substrate concentration, the absorbance at 365 nm
grows in, while the peak at 443 nm is lost, indicating that the semiquinone of
6-S-Cys-FMN is the predominant species. The peak at 440 nm, which
represents oxidized [Fe4-S4] cluster, is observed at high substrate
concentrations. Spectral analysis at intermediate concentration of TMA (55
and 100 µM) demonstrated both a semiquinone peak at 365 nm and oxidized

45
6-S-Cys-FMN peak at 443 nm, indicating both species are present at
intermediate substrate concentrations. Concentrations of Fc+ were also
varied to observe substrate inhibition. The oxidized enzyme at 443 nm was
seen at high concentrations of Fc+ while low Fc+ concentrations caused the
semiquinone to be the predominant species. When the Fc+ concentration is
lowered to 50 µM and concentration of TMA is varied (20 µM – 2 mM), the
oxidized 6-S-Cys-FMN is not observed and the semiquinone and oxidized
[Fe-S] cluster are present.25
A proposed branching mechanism for TMADH was constructed with
two paths in the 0/2 cycle and 1/3 cycle (Figure 1.10).25 At low TMA and high
electron acceptor concentrations, the 0/2 cycle predominates with the two-
electron reduction of the enzyme in the catalytic cycle. At high TMA and
lower Fc+ concentrations the 1/3 cycle will predominate, where substrate
binds to the one-electron reduced enzyme, leading to substrate inhibition.
The binding of substrate stabilizes the semiquinone, shifting the potential of
the [Fe-S] cluster from +102 mV to +50 mV. The potential of the
quinone/semiquinone couple increases from +44 mV to +240 mV and the
semiquinone/hydroquinone couple decreases from +36 mV to -50 mV. This
effect stabilizes the semiquinone oxidation state of 6-S-Cys-FMN and shifts
the equilibrium of the oxidation-reduction potential towards the semiquinone
and oxidized [Fe-S] cluster. The bound substrate is not able to reduce the

46
Figure 1.10. Proposed mechanism for TMADH for 0/2 and 1/3 cycle25
enzyme when 6-S-Cys-FMN is in the semiquinone state, so catalysis is
inhibited.25
1.1.15. Expression and Purification of recombinant HADH
The selectivity and specificity of HADH for histamine makes it an
interesting protein of which to pursue structural determination. Understanding
the selectivity for histamine has the potential to improve antihistamine drug
design and will provide information on the binding of histamine to natural
histamine receptors. HADH is a recently discovered protein that has yet to be
crystallized. A high yield expression system and crystallographic
determination of HADH will aid in furthering the understanding this protein.

47
Native expression of HADH from N. simplex yields 0.5 mg L-1. For this
reason, a recombinant over expression system for HADH was desired in
order to conduct kinetic studies and X-ray crystallography. Discussed in this
chapter is the expression and purification of recombinant HADH (rHADH)
developed by Dr. Hirakawa used herein to generate the HADH protein for
crystallization. The SDS-PAGE and spectroscopic evidence support that
rHADH is comparable to native HADH.
1.2. Materials and Methods
1.2.1. Cloning and expression
The hadh gene was cloned from genomic DNA of N. simplex (ATCC
6946).24 PCR was performed on the HADH gene with the following primers:
Seq 5’ to 3’ GCTCTAGACATATGACCGAGCAGC
Seq 3’ to 5’ GGAATTCAAGCTTTCACGCCAGCTGGGTGA.
Due to the GC rich nature of the gene, 10 µL GC-Rich PCR system PCR
reaction buffer (Roche Applied Science) and 1 µL of GC-Rich PCR system
nucleotide mix (Roche Applied Science) were added to 50 µl of PCR reaction
solution. PCR was performed with the following conditions: an initial 95 oC for
5 min, then cycled between 95 oC for 1 min, 60 oC for 30s and 72 oC for 5min,
for a total running time of 5 hours. The primers were designed to amplify the
2.1 Kbp fragment and incorporate EcoRI (New England BioLabs) and XbaI
(New England BioLabs) flanking sites for subsequent insertion into pUC19.
The resulting hadh gene was sequenced with the following primers:

48
M13 and M13R
HSDHseq1 GAGCGCCCAGGCCTCGATGCGC HSDHseq2 TACAGCGGCGTCCACCACTTCC HSDHseq3 GCTCCACACGGCGGCCGCGATC HSDHseq4 CTGCGCGAGCAGCTCGGCCACGAC
in the forward and reverse directions and then subcloned between the NdeI
and EcoRI sites of pET21b (Novagen) in order to express the recombinant
protein without the C-terminal T7-tag or the N-terminal His-tag. The plasmid
was transformed into E. coli Rosetta 2 (DE3) cells (Novagen). The cells were
grown in 1 L of Terrific Broth media with 100 mg L-1 ampicillin at 37 °C and
shaken at 225 rpm to an OD600 of 0.7. Protein expression was induced with
0.1 mM isopropyl β-D-1-thiogalactopyranoside (IPTG). 250 mg L-1 Iron
sulfate and 50 mg L-1 riboflavin were also added at an OD600 of 0.7 to ensure
full incorporation of the [Fe4-S4] cluster and FMN cofactors. The
temperature was reduced to 20 °C and the cultures were allowed to shake at
225 rpm overnight. The cells were harvested by centrifugation at 4°C.
HADH was also grown in selenomethionine rich media in order to
obtain selenomethionine-substituted protein for multiwave anomalous
dispersion (MAD) data set. The same plasmid was transformed into the
methionine-auxotrophic E. coli strain B834 (DE3) (Novagen). 67 The cells
were grown in SelenoMet Medium Base (AthenaES) where 21.6 g SelenoMet
Medium Base was dissolved in 1 L of deionized water. The media was

49
autoclaved and allowed to cool. 5.1 g SelenoMet mix was dissolved in 50 mL
of deionized water and the solution was sterile filtered. The resulting
SelenoMet solution, 100 mg L-1 ampicillin, and 30 µg/mL L-SeMet were added
to the selenomet medium base. 5 mL of media was removed and LB was
added to 5% concentration to grow the starter culture. The starter culture
was allowed to grow overnight and was used to inoculate the 1 L base media.
Induction and expression of HADH protein followed previous methods.
Efforts for higher incorporation of selenomethionine into the protein were
made by increasing the amount of L-SeMet added to the selenomethionine
medium to 60 µg/mL. In addition, the starter culture was spun down and
washed twice with SeMet media before inoculation and induction with IPTG.
1.2.2. Purification
Cells (10 g) were resuspended in 20 mM potassium phosphate buffer
(pH = 7.4) containing 0.1 M KCl. Cells were lysed by ultrasonication, and
centrifuged at 40 000 g for 30 min. The supernatant was loaded onto a 100
mL Toyopearl-DEAE column pre-equilibrated with 20 mM potassium
phosphate (pH = 7.4) containing 0.1 M KCl, and proteins were eluted with a
300 mL linear gradient increasing from 0.1 to 0.3 M KCl (20 mM potassium
phosphate buffer, pH 7.4). Fractions exhibiting an Abs444/Abs382 ratio of 1.0 or
higher were pooled and (NH4)2SO4 was added to a final concentration of 0.8
M. The protein solution was then loaded on to a 100 mL Toyopearl Butyl-650
column (Tosoh Bioscience) pre-equilibrated with 50 mM potassium phosphate

50
buffer (pH = 7.4) containing 0.8 M (NH4)2SO4. Bound proteins were eluted
with a 300 mL gradient decreasing from 0.8 to 0 M (NH4)2SO4 (50 mM
potassium phosphate buffer, pH = 7.4). Fractions exhibiting an Abs444/Abs382
ratio of 1.2 or higher were pooled and concentrated to 1 mL using an Amicon
Ultra-30 centrifugal unit (Millipore). This protein was loaded onto a HiLoad
Superdex 200 sizing column (GE Biosciences) and eluted with 50 mM Tris-
HCl (pH 7.4) containing 0.15 M KCl. Fractions with an Abs444/Abs382 ratio of
1.38 or higher were concentrated to >20 mg/mL. The purity of HADH was
confirmed with SDS-PAGE and protein concentration was determined by a
BCA assay (Thermo Fisher Scientific).
Selenomethionine-substituted protein was purified as described with
around ~10 fold reduction in cell paste and protein expression. Flavination,
purity and activity were all in agreement with the recombinant expressed
HADH. The incorporation of selenomethionine was determined by MALDI-
TOF mass spectrometry at the KU Analytical Proteomics Lab.
1.2.3. HADH Coupled Assay
HADH coupled assay was measured using the electron acceptor
dichlorophenolindophenol (DCPIP) coupled to the redox mediator phenazine
methosulfate (PMS) according to published procedures with slight
modifications.22 0.5 µg of HADH was added to 0.1 M Tris buffer pH 7.0
containing 500 µM PMS, 50 µM DCPIP, and 0- 2 mM histamine. The
bleaching of the absorbance at 580 was observed on Cary UV/Vis

51
spectrophotometer with constant temperature (30oC). The activity rate of
enzyme was plotted against histamine concentration
1.3. Results
1.3.1. The Cloning of HADH gene in pET21b Vector Achieves
Expression of Soluble Protein.
The hadh gene of N. simplex was amplified with PCR and confirmed
by the presence of a 2.1 Kb band on a 1% agarose gel. The amplified gene
was extracted and purified (Quigen) and digested with EcoRI and XbaI for
ligation into pUC19. The size of the cloning vector pUC19 enables easier
sequencing and the confirmation that no undesired mutation was introduced
into the hadh gene. The plasmid was subjected for sequencing (UC
Berkeley) in a concentration of ~ 500 µg/mL with 0.5 µg DNA/5kb DS plasmid
with 3.2 pmol primer in 13 µl water. Sequencing results were in good
agreement with wild-type hadh (Figure 1.11). The plasmid was digested with
EcoRI and NdeI and ligated into the pET21b expression vector for the
purpose of transforming and expressing the protein in bacteria. Incorporation
of the hadh gene into the pET21b expression vector was confirmed on a DNA
agarose gel demonstrating a band for the hadh gene (2.1 Kb) and the
pET21b vector (5.4 Kb) after digestion with EcoRI and NdeI.
1.3.2. The Expression of Soluble HADH yields high yield (~20 mg/L
protein) and High Purity for Crystallography.

52
Starter cultures were prepared, and soluble protein was observed in a 1 L
culture grown expression in LB with a protein band at 76 kDa, which is in
good agreement with wild-type HADH. Optimization of soluble protein
expression was performed with TB, LB, and 2X YT media (Figure 1.12).
SDS-PAGE revealed that protein expression was highest in TB media based
on intensity of an anionic dye (coomassie blue) that binds non-specifically to
protein. The protein was purified as fully flavinated and purity of fractions
were examined after each step. Figure 1.13 shows the 12.5% SDS-PAGE
gel after each stage of purification. After each column, the SDS-PAGE gel
reveals the separation of unwanted protein. The major band seen in the
SDS-PAGE gel was in good agreement with the calculated molecular weight
(76 kDa) of HADH. Full flavination was confirmed based on the Abs444/Abs382
ratio of 1.4 indicating full incorporation of 6-S-Cys-FMN into the protein, as
seen in the native HADH.68 Figure 1.14 depicts the absorbance spectra and
the Abs444/Abs382 ratio after each stage of purification. The progressive
increase of the Abs444/Abs382 ratio after each purification step demonstrates
the removal of impurities. After the first column, DEAE column, the average
expected Abs444/Abs382 ratio is 1.15, where the butyl column increases the
average value of 1.25-1.30 column. Fractions from the size exclusion column
demonstrated an Abs444/Abs382 ratio of 1.38, indicating flavination is very

53
10 20 30 | | | HADH_Native MTEQPAVAAPYDVLFEPVQIGPFTTKNRFY rHADH MTEQPAVAAPYDVLFEPVQIGPFTTKNRFY 40 50 60 | | | HADH_Native QVPHCNGMGYRDPSAQASMRKIKAEGGWSA rHADH QVPHCNGMGYRDPSAQASMRKIKAEGGWSV 70 80 90 | | | HADH_Native VCTEQVEIHATSDIAPF IELRIWDDQDLPA rHADH VCTEQVEIHATSDIAPFVELRIWDDQDLPA 100 110 120 | | | HADH_Native LKRIADAIHEGGGLAGIELAHNGMNAPNQL rHADH LKRIADAIHEGGGLAGIELAHNGMNAPNQL 130 140 150 | | | HADH_Native SRETPLGPGHLPVAPDTIAPIQARAMTKQD rHADH SRETPLGPGHLPVAPDTIAPIQARAMTKQD 160 170 180 | | | HADH_Native IDDLRRWHRNAVRRSIEAGYDIVYVYGAHG rHADH IDDLRRWHRNAVRRSIEAGYDIVYVYGAHG 190 200 210 | | | HADH_Native YSGVHHFLSKRYNQRTDEYGGSLENRMRLL rHADH YSGVHHFLSKRYNQRTDEYGGSLENRMRLL 220 230 240 | | | HADH_Native RELLEDTLDECAGRAAVACRITVEEEIDGG rHADH RELLEDTLDECAGRAAVACRITVEEEIDGG 250 260 270 | | | HADH_Native ITREDIEGVLRELGELPDLWDFAMGSWEGD rHADH ITREDIEGVLRELGELPDLWDFAMGSWEGD

54
280 290 300 | | | HADH_Native SVTSRFAPEGRQEEFVAGLKKLTTKPVVGV rHADH SVTSRFAPEGRQEEFVAGLKKLTTKPVVGV 310 320 330 | | | HADH_Native GRFTSPDAMVRQIKAGILDLIGAARPSIAD rHADH GRFTSPDAMVRQIKAGILDLIGAARPSIAD 340 350 360 | | | HADH_Native PFLPNKIRDGRLNLIRECIGCNICVSGDLT rHADH PFLPNKIRDGRLNLIRECIGCNICVSGDLT 370 380 390 | | | HADH_Native MSPIRCTQNPSMGEEWRRGWHPERIRAKES rHADH MSPIRCTQNPSMGEEWRRGWHPERIRAKES 400 410 420 | | | HADH_Native DARVLVVGAGPSGLEAARALGVRGYDVVLA rHADH DARVLVVGAGPSGLEAARALGVRGYDVVLA 430 440 450 | | | HADH_Native EAGRDLGGRVTQESALPGLSAWGRVKEYRE rHADH EAGRDLGGRVTQESALPGLSAWGRVKEYRE 460 470 480 | | | HADH_Native AVLAELPNVEIYRESPMTGDDIVEFGFEHV rHADH AVLAELPNVEIYRESPMTGDDIVEFGFEHV 490 500 510 | | | HADH_Native ITATGATWRTDGVARFHTTALPIAEGMQVL rHADH ITATGATWRTDGVARFHTTALPIAEGMQVL 520 530 540 | | | HADH_Native GPDDLFAGRLPDGKKVVVYDDDHYYLGGVV rHADH GPDDLFAGRLPDGKKVVVYDDDHYYLGGVV

55
550 560 570 | | | HADH_Native AELLAQKGYEVSIVTPGAQVSSWTNNTFEV rHADH AELLAQKGYEVSIVTPGAQVSSWTNNTFEV 580 590 600 | | | HADH_Native NRIQRRLIENGVARVTDHAVVAVGAGGVTV rHADH NRIQRRLIENGVARVTDHAVVAVGAGGVTV 610 620 630 | | | HADH_Native RDTYASIERELECDTVVMVTARLPREELYL rHADH RDTYASIERELECDAVVMVTARLPREELYL 640 650 660 | | | HADH_Native DLVARRDAGEIASVRGIGDAWAPGTIAAAV rHADH DLVARRDAGEIASVRGIGDAWAPGTIAAAV 670 680 690 | | | HADH_Native WSGRRAAEEFDAVLPSNDEVPFRREVTQLA rHADH WSGRRAAEEFDAVLPSNDEVPFRREVTQLA
Figure 1.11. Sequence Alignment of native-HADH with rHADH

56
M.W. kDa
95
66
45
30
P S P S P S P S P S P S
+ - + - + -
TB LB 2X YT
Figure 1.12. Optimization of HADH expression in Terrific Broth (TB), Luria-Bertani Media (LB), and 2X Yeast Extract Trypton (2X YT) with (+) and without (-) Isopropyl ß-D-1-thiogalactopyranoside (IPTG). Highest expression was seen in TB media. P = Pellet, S = Supernatant
M.W. kDa
95
66
45
30
A B C
Figure 1.13. SDS-PAGE showing each stage of purification A) DEAE B) Butyl-Sepharose C) Size exclusion chromatography

57
close to 100%. The protein concentration was quantified with the BCA assay
(Pierce) for a final yield of 10-20 mg/L protein. This expression system
results in the highest yield of HADH in the literature and gives an ~ 40 fold
increase from the native HADH. HADH activity was examined by the rate of
reduction of DCPIP at 580 nm, with the specific activity of recombinant HADH
being 40 mmol . min-1. mg-1 compared to 45 mmol . min-1. mg-1 of the native
HADH.
Figure 1.14. UV/Vis spectra of fractions collected after A) DEAE B) butyl-Sepharose C) size exclusion column. Ratios were calculated based on A444/A382 for determination of complete flavinylation

58
1.3.3. HADH Coupled Assay demonstrate activity of recombinant HADH
(rHADH) is comparable as native HADH
It is necessary to prove the recombinant HADH behavior the same as
the native HADH (Table 1.3). A coupled assay was employed to test the
activity of the recombinant HADH against the native HADH. In the coupled
assay, as HADH turns over histamine, the electrons are transferred to the
redox mediator phenazine methosulfate, which transfers electrons to the
DCPIP. The reduction of DCPIP demonstrates a bleaching effect at 580 nm
and the rate of enzymatic activity is calculated. The Km value obtained from
the rHADH (38 µM) is in good agreement with native HADH (31 µM) (Figure
1.14). Table 1.3. demonstrates the similarities of rHADH with the native
HADH.
rHADH Native HADH
hadh gene 2.1 Kb 2.1 Kb
SDS-PAGE gel 76 kDa 76 kDa
Specific Activity 40 mmol . min-1. mg-1 45 mmol . min-1. mg-1
Km 38 µM 31 µM
Table 1.3. rHADH and native HADH comparison

59
Figure 1.15. HADH coupled Assay with histamine
1.4. Discussion
1.4.1. The Cloning of HADH in pET21b Vector Achieves Expression of
Soluble Protein.
Previous efforts in the Limburg lab to establish a recombinant
expression for HADH produced mostly insoluble protein. Attempts were
made with the hadh gene in pDEST expression vector transfected into E. coli
for soluble protein. Inoculation with and without IPTG and glucose only led to
insoluble protein. The amplification of the hadh gene proved to be
challenging as the GC-rich nature of the gene increased the melting point.
Longer run time and the addition of GC-rich PCR system reaction buffer and
nucleotide mix successfully amplified the hadh gene. The amplified gene was

60
ligated into pUC19 with restriction enzymes XbaI and EcoRI. The sequence
alignment with the native HADH demonstrated excellent agreement with only
three polymorphism (Val60, Val78, and Ala615). These three amino acid
residues are not involved in the active site. Difficulty followed with inserting
the hadh gene into the expression vector pET21b. Several different
restriction enzymes were employed for ligation into the vector. NdeI and XbaI
both prove unsuccessful as demonstrated by 1% agarose gel, along with
NdeI and HindIII. The restriction enzymes, NdeI and EcoRI, were able to
properly ligate the gene into pET21b. The pET21b/hadh construct was
transformed into E.coli Rosetta cells. The protein expression was optimized
with TB media. This result correlates well with the growth conditions found in
the initial screening of N. simplex.22 The cell growth in histamine-glycerol
media expressed the highest HADH activity.
1.4.2. The Expression of Soluble rHADH yields high yield (~20 mg/L
protein) and High Purity for X-ray Crystallography.
The prerequisite of kinetic and crystallographic studies on rHADH are
high expression of pure and fully flavinated protein. The induction of
pET21b/hadh construct in Rosetta cells produced soluble protein in high yield
of 10-20 mg/L. The rHADH protein was purified with anion exchange (DEAE),
hydrophobic (butyl), and size exclusion column chromatography. After each
column purification, fractions were collected and the extent of flavination was
evaluated. Each fraction was plotted against the Abs444/Abs382 ratio, which

61
demonstrated a bell shaped curve. Fractions were usually collected at the
beginning to the end of the bell shaped curve. Most of the fractions after the
size exclusion column chromatography showed full flavination and gave high
purity with the Abs444/Abs382 ratio greater than 1.35.
1.4.3. HADH Activity Assay demonstrate activity of rHADH is the same
as native HADH
The activity assay revealed the activity of rHADH is identical to the
native HADH, assuring that the kinetic study on rHADH represents that of
native HADH. The activity assay was performed on rHADH and the Km and
specific activity were in good agreement with the native HADH. The assay
also demonstrated substrate inhibition of rHADH, which is also seen with the
native HADH.
1.5. Conclusion
Expression and purification of rHADH resulted in highest yield reported
in literature with ~ 100 % flavination. HADH is highly selective for histamine,
and solving the crystal structure will further the understanding how the
enzyme active site recognizes histamine specifically. The activity assay
demonstrated that the rHADH behaves the same as the native enzyme. The
recombinant expression of HADH should be able to be employed for
mechanistic studies on electron transfer, substrate selectivity, and oxidative
turnover. The crystal structure analysis of rHADH was pursued in hopes of
understanding the structure/function correlation of HADH, in particular the

62
histamine selectivity of HADH. The following chapter will discuss
crystallization, structural determination, and the structural analysis of rHADH.

63
References
(1) Harrison, P. Metalloproteins; Houndmills, Basingstoke, Hampshire : Macmillan, 1985. (2) Liddington, R., Derewenda, Z., Dodson, E., Hubbard, R., Dodson, G. J. Mol. Biol. 1992, 228, 551-579. (3) Borgstahl, G. E., Parge, H.E., Hickey, M.J., Beyer Jr., W.F., Hallewell, R.A., Tainer, J.A Cell 1992, 71, 107. (4) Reitzer, R., Gruber, K., Jogl, G., Wagner, U.G., Bothe, H., Buckel, W., Kratky, C. Structure Fold. Des. 1999, 7, 891-902.
(5) "http://www.rcsb.org/pdb/home/home.do", P. D. B. (6) Whittaker, M., Floyd, C., Brown, P., Gearing, A., Chem. Rev.
1999, 99, 2735. (7) Overall, C., Lopez-Otin, C., Nat. Rev. Cancer 2002, 2, 657. (8) Coussens, L., Fingleton, B., Marisian, L., Science 2002, 295,
2387. (9) Mann, S. Biomimetic materials chemistry; VCH: New York, 1996. (10) Medina, M. A.; Urdiales, J. L.; Rodriguez-Caso, C.; Ramirez, F. J.; Sanchez-Jimenez, F. Crit. Rev. Biochem. Mol. Biol. 2003, 38, 23-59. (11) Haas, H. L.; Wolf, P. Iontophoresis Transm. Mech. Mamm. Cent. Nerv. Syst., Proc. Satell. Symp. 1978, 444-6. (12) Barocelli, E.; Ballabeni, V. Pharmacological Research 2003, 47, 299-304. (13) Shin, N.; Coates, E.; Murgolo, N. J.; Morse, K. L.; Bayne, M.; Strader, C. D.; Monsma, F. J., Jr. Molecular Pharmacology 2002, 62, 38-47. (14) Ligneau, X.; Morisset, S.; Tardivel-Lacombe, J.; Gbahou, F.; Ganellin, C. R.; Stark, H.; Schunack, W.; Schwartz, J. C.; Arrang, J. M. Br. J. Pharmacol. 2000, 131, 1247-1250. (15) Gantz, I.; DelValle, J.; Wang, L. D.; Tashiro, T.; Munzert, G.; Guo, Y. J.; Konda, Y.; Yamada, T. Journal of Biological Chemistry 1992, 267, 20840-3. (16) Konkimalla, V. B.; Chandra, N. Biochemical and Biophysical Research Communications 2003, 309, 425-431. (17) Morrow, J. D.; Margolies, G. R.; Rowland, J.; Roberts, L. J., 2nd N. Engl. J. Med. 1991, 324, 716-20. (18) Loechel, C.; Basran, A.; Basran, J.; Scrutton, N. S.; Hall, E. A. H. Analyst 2003, 128, 889-898. (19) Bao, L.; Sun, D.; Tachikawa, H.; Davidson, V. L. Analytical Chemistry 2002, 74, 1144-1148.

64
(20) Zeng, K.; Tachikawa, H.; Zhu, Z.; Davidson, V. L. Analytical Chemistry 2000, 72, 2211-2215. (21) Siddiqui, J. A.; Shoeb, S. M.; Takayama, S.; Shimizu, E.; Yorifuji, T. Journal of Biochemistry, Molecular Biology and Biophysics 2001, 5, 37-43. (22) Siddiqui, J. A.; Shoeb, S. M.; Takayama, S.; Shimizu, E.; Yorifuji, T. FEMS Microbiology Letters 2000, 189, 183-187. (23) Mewies, M.; McIntire, W. S.; Scrutton, N. S. Protein Science 1998, 7, 7-20. (24) Limburg, J.; Mure, M.; Klinman, J. P. Archives of Biochemistry and Biophysics 2005, 436, 8-22. (25) Roberts, P.; Basran, J.; Wilson, E. K.; Hille, R.; Scrutton, N. S. Biochemistry 1999, 38, 14927-14940. (26) Basran, J.; Sutcliffe, M. J.; Hille, R.; Scrutton, N. S. Biochemical Journal 1999, 341, 307-314. (27) Dunn, R., Marshall, K., Munro, A., Scrutton, N., FEBS Journal 2008, 275, 3850-3858. (28) Basran, J.; Sutcliffe, M. J.; Scrutton, N. S. Journal of Biological Chemistry 2001, 276, 42887-42892.
(29) Grant, K. L.; Klinman, J. P. Biochemistry 1989, 28, 6597-605. (30) Scrutton, N. S. Natural Product Reports 2004, 21, 722-730. (31) Pollegioni, L.; Blodig, W.; Ghisla, S. Journal of Biological
Chemistry 1997, 272, 4924-4934. (32) Miller, J. R.; Edmondson, D. E. Biochemistry 1999, 38, 13670-13683. (33) Silverman, R. B.; Hoffman, S. J.; Catus, W. B., III Journal of the American Chemical Society 1980, 102, 7126-8.
(34) Silverman, R. B. Prog. Brain. Res. 1995, 106, 23-31. (35) Rigby, S. E. J.; Hynson, R. M. G.; Ramsay, R. R.; Munro, A. W.;
Scrutton, N. S. Journal of Biological Chemistry 2005, 280, 4627-4631. (36) Kay, C. W. M.; El Mkami, H.; Molla, G.; Pollegioni, L.; Ramsay, R. R. Journal of the American Chemical Society 2007, 129, 16091-16097.
(37) Rohlfs, R. J.; Hille, R. J. Biol. Chem. 1991, 266, 15244-52. (38) Pearlman, D. S. Drugs 1976, 12, 258-73. (39) Oppenheimer, J. J.; Casale, T. B. Expert Opin. Investig. Drugs
2002, 11, 807-817. (40) Barbosa, J. A. R. G.; Sivaraman, J.; Li, Y.; Larocque, R.; Matte, A.; Schrag, J. D.; Cygler, M. Proc. Natl. Acad. Sci. USA 2002, 99, 1859-1864. (41) Briganti, F.; Mangani, S.; Orioli, P.; Scozzafava, A.; Vernaglione, G.; Supuran, C. T. Biochemistry 1997, 36, 10384-10392. (42) Reynolds, J. L.; Akhter, J. A.; Magarey, C. J.; Schwartz, P.; Adams, W. J.; Morris, D. L. Br. J. Surg. 1998, 85, 538-41.

65
(43) Nielsen, H. J.; Kikuchi, Y. Adv. Biosci. 1993, 89, 319-34. (44) Henry, D. P.; Bowsher, R. R.; Verburg, K. M. Scand. J.
Gastroenterol. 1991, 180, 26-31. (45) Claeys-Bruno, M.; Vandenabeele-Trambouze, O.; Sergent, M.; Geffard, M.; Bodet, D.; Dobrijevic, M.; Commeyras, A.; Phan Tan Luu, R. Chemometrics and Intelligent Laboratory Systems 2006, 80, 176-185. (46) Pessatti, T. L. P.; Fontana, J. D.; Pessatti, M. L. Methods Mol. Biol. 2004, 268, 311-316. (47) Lim, L. W.; Shamala, N.; Mathews, F. S.; Steenkamp, D. J.; Hamlin, R.; Nguyen Huu, X. Journal of Biological Chemistry 1986, 261, 15140-6. (48) Mewies, M.; Basran, J.; Packman, L. C.; Hille, R.; Scrutton, N. S. Biochemistry 1997, 36, 7162-7168. (49) Massey, V.; Hemmerich, P. Biochemical Society Transactions 1980, 8, 246-57. (50) Huang, L.; Rohlfs, R. J.; Hille, R. Journal of Biological Chemistry 1995, 270, 23958-65. (51) Mewies, M.; Packman, L. C.; Mathews, F. S.; Scrutton, N. S. Biochemical Journal 1996, 317, 267-272.
(52) Rohlfs, R. J.; Hille, R. J. Biol. Chem. 1994, 269, 30869-79. (53) Silverman, R. B. Accounts of Chemical Research 1995, 28, 335-
42. (54) Edmondson, D. E. Xenobiotica 1995, 25, 735-53. (55) Kim, J. M.; Bogdan, M. A.; Mariano, P. S. Journal of the
American Chemical Society 1993, 115, 10591-5. (56) Basran, J.; Jang, M. H.; Sutcliffe, M. J.; Hille, R.; Scrutton, N. S. J.. Biol. Chem. 1999, 274, 13155-61.
(57) DeLano, W. L. T. P. M. G. S. D. S., San Carlos, CA, USA. (58) Basran, J.; Mewies, M.; Mathews, F. S.; Scrutton, N. S.
Biochemistry 1997, 36, 1989-1998. (59) Miura, R.; Setoyama, C.; Nishina, Y.; Shiga, K.; Mizutani, H.; Miyahara, I.; Hirotsu, K. Journal of Biochemistry (Tokyo) 1997, 122, 825-833. (60) Nagy, J.; Kenney, W. C.; Singer, T. P. J. Biol. Chem. 1979, 254, 2684-8. (61) Jang, M. H.; Basran, J.; Scrutton, N. S.; Hille, R. J. Biol. Chem. 1999, 274, 13147-54. (62) Basran, J.; Chohan, K. K.; Sutcliffe, M. J.; Scrutton, N. S. Biochemistry 2000, 39, 9188-9200. (63) Wilson, E., Huang, L., Sutcliffe, M., Mathews, S., Hille, R., Scrutton, N. Biochemistry 1997, 36, 41-48.

66
(64) Sussman, J. L.; Harel, M.; Frolow, F.; Oefner, C.; Goldman, A.; Toker, L.; Silman, I. Science FIELD Full Journal Title:Science (New York, N.Y.) 1991, 253, 872-9. (65) Waksman, G.; Kominos, D.; Robertson, S. C.; Pant, N.; Baltimore, D.; Birge, R. B.; Cowburn, D.; Hanafusa, H.; Mayer, B. J.; et al. Nature 1992, 358, 646-53. (66) Raine, A. R. C.; Yang, C.-C.; Packman, L. C.; White, S. A.; Mathews, F. S.; Scrutton, N. S. Protein Science 1995, 4, 2625-8.
(67) Doublie, S. Methods Enzymol. 1997, 276, 523-530. (68) Fujieda, N., Tsuse, N., Satoh, A., Ikeda, T., Kano. Biosci.
Biotechnol. Biochem. 2005, 69, 2459-2462.

67
Chapter 2
Crystal Structure Determination of Histamine Dehydrogenase from
Nocardioides Simplex
2.1. Introduction
At stated in the previous chapter histamine dehydrogenase (HADH) is
an amine oxidizing enzyme first isolated from cultures of Nocardioides
simplex.1 Limburg et al. pursued the cloning of the full length hadh gene
from N. simplex in order to gain insight into the nature of the redox active
cofactors in the native HADH. Through sequence alignment, HADH showed
high similarity with several flavoproteins, most notably TMADH.2 Further
spectroscopic studies confirmed an [4Fe-4S] and 6-S-Cys-FMN as the
cofactors involved in oxidation of histamine.2 HADH is known to have high
substrate selectivity towards histamine and bind histamine in the mono-
protonated form.2 Kinetic isotope effect also demonstrated that C-H bond
cleavage is partly rate limiting. To understand the narrow substrate selectivity
and oxidation reaction, structural studies were performed on rHADH. The
crystal structure of rHADH could provide an opportunity to define how the
enzyme active site contributes to the histamine selectivity. Modeling of
histamine in the active site of rHADH suggests important residues involved in
the binding of histamine in rHADH. Such a knowledge could also provide a
better understanding of the physiological binding of histamine within human

68
histamine receptors (HHR). The sequence of all four HHR is known, but none
of the crystal structures have been determined.3-7 Modeling studies of HHR,
along with other histamine binding proteins, have helped provide insight into
how histamine binds within its natural receptor, which could aid in the design
of antihistamines. The active site structure of rHADH may provide information
for the mechanism of C-H bond cleavage, which remains unclear for many
flavoproteins.8 One important enzyme where the mechanism of C-H bond
cleavage is uncertain is the FAD containing flavoprotein monoamine oxidase
(MAO).9-11 This enzyme is involved in the breakdown of important biogenic
amines in the body including, dopamine, serotonin, and norepinephrine. The
substrates of MAO and HADH are very similar in chemical structure. Probing
the mechanism of HADH could potentially reveal a clearer understanding of
substrate oxidation in MAO and other flavoproteins.
In addition, the histamine selectivity of HADH may allow it to be used
in a histamine biosensor.2 When considering biosensor design, several
conditions must be met.12-14 The first is exclusive selectivity for the substrate
of analytical interest. The second is the ability of the enzyme to facilitate
electron transfer between the enzyme and the electrode. Dehydrogenases
are preferred over oxidase as they can be used under O2 limited conditions.
The determination of the rHADH crystal structure can be used to
evaluate and confirm the presence of the redox active cofactors, the residues
involved in binding of substrate, and mechanism of substrate oxidation

69
presented by Limburg et al.2 In this study, we were able to solve the crystal
structure of HADH to 2.7 Å . Structural similarities and differences that
distinguish HADH from TMADH will be discussed, with emphasis on the
histamine binding site. Modeling studies of neutral and mono-protonated
histamine were performed to gain insight into how the active site is arranged
to gain selectivity for histamine.
2.2. Materials and Methods
2.2.1. Crystallization
Prior to crystallization, protein was concentrated to 20 mg/mL in 50 mM
Tris-HCl buffer (pH 7.4) containing 0.15 M KCl. Screening of crystallization
conditions was performed by the hanging-drop vapor-diffusion method using
commercially available sparse matrix screening kits (Hampton Research and
Emerald Biosystems). Equal volumes of protein and reservoir solution (1 µL
+ 1 µL) were mixed and equilibrated against 750 µL reservoir solution at 293
K. After 5 days, yellow crystals appeared in the three following conditions: 0.4
M NaH2PO4,1.6 M K2HPO4, 0.1 M imidazole pH 8.0, and 0.2 M NaCl
(Emerald Biosystems #20); 2.0 M (NH4)2SO4, 0.1 M CAPS, pH 10.5, and 0.2
M Li2SO4 (Emerald Biosystems #33); and 2.0 M (NH4)2SO4, 0.1 M Hepes pH
7.5, and 2% PEG (Hampton Research #39). Each of these commercial
solutions were replicated from reagents in the, but only #33 was able to
reproduce crystals. Sharp needles and square box shaped crystals were
mostly observed with the Hampton Research #39 crystallization condition

70
solution. Concentrations of protein from 20 to 5 mg/mL were screened for
optimization of crystal growth. Initial testing and handling of these crystals
proved difficult, exposure to the atmosphere with opening the well and the
addition of various cryoprotectants would dissolve the crystals or the crystal
lattice would crack, resulting in poor diffraction patterns. Crystals were then
grown in 2.0 M (NH4)2SO4, 0.1 M Hepes pH 7.5, and 2% PEG (Hampton
Research #39) with the addition of 2%-4% glycerol (v/v) to aid in the addition
of the cryoprotectant. Crystals were frozen in liquid nitrogen in a solution of
mother liquor (2.0 M (NH4)2SO4, 0.1 M Hepes pH 7.5, and 2% PEG (Hampton
Research #39)) and 25% glycerol as a cryoprotectant.
2.2.2. Data collection and processing
Initially unsubstituted HADH crystals were screened for X-ray
diffraction in-house on an R-AXIS IV++ detector with Cu Kα X-rays generated
by a Rigaku RU-H3RHB rotating-anode generator and focused using an
Osmic confocal optical system (Rigaku, Japan) at the KU Protein Structure
Laboratory. A full data set was collected, but initial attempts at molecular
replacement using the TMADH structure (PDB 1DJN) 15 as a search model
were not successful due to the complexity of the screw axis in the crystal
lattice. Subsequently, SeMet-HADH crystals which were generated with
HADH grown in the presence of L-SeMet, were screened, and a complete
MAD data set was collected at beamline BL9-2 at the Stanford Synchrotron
Radiation Laboratory (SSRL) using the Stanford Automated Mounting (SAM)

71
system.16 Data collection was performed at 100 K using an oscillation angle
of 1° per frame over a total of 270° to yield a highly redundant data set. The
diffraction data was processed with MOSFLM 17 and scaled with SCALA from
the CCP program suite.18
2.2.3. Refinement and Validation
The model was refined using the data set to 2.7 Å resolution using
iterative round of refinement with REFMAC 20 and model building performed
with COOT.21 The structure was validated using PROCHECK22 and
WHATIF. 23 All figures were prepared using PyMOL.24
2.2.4. Histamine Modeling
The ligands were sketched in SYBYL 25 and refined via molecular
mechanics optimization using the Tripos Force Field 26 and Gasteiger-Marsili
electrostatics.27 The ligands were docked into the HADH receptor via
FlexX 28 retaining for explicit consideration all residues and
crystallographically resolved heteroatomic moieties within 8.0 Å of the
receptor center. All other docking controls were left at default setting.
2.3. Results
2.3.1. The Screening of Crystal Growth Conditions for HADH Reveals
Three Different Conditions that Produce HADH Crystals.
The process of protein crystallization for an new protein requires the
screening of many conditions to produce well-ordered single 3-D crystals.
HADH protein in 50 mM Tris-HCl buffer pH 7.4 containing 0.15 M KCl with a

72
concentration of 20 mg/mL was screened against possible crystallization
solutions from Hampton Research Screening Crystal Screen Kits I and II (HRI
and HRII) and Emerald Biosystems Screening Wizard Kits I and II (EBI and
EBII). After a period of five days, crystals were obtained in EBI #20, EBI #33,
and HRI #39. All crystals were yellow due to the 6-S-Cys-FMN, which made
distinguishing protein from salt crystals very easy. Both EBI #20 and EBI #33
yielded small crystals with small two-dimensional plates growing in EBI #33
(Figure 2.1). Both were well separated with slight birefringence but were too
small for preliminary diffraction. Homemade solutions of both EBI #20 and
EBI #33 were prepared in attempt to improve crystal quality. Small, 2-D,
urchin-like crystals were observed in EBI #33 (Figure 2.2), but further efforts
were focused on HRI #39 because these crystals produced 3-D chunky
yellow crystals and long needle like crystals (Figure 2.3). After 11 days of
growth, the crystals had good birefringence with a regular surface on many
crystals. When protein concentrations were screened from 20 mg/mL to 2
mg/mL, crystals of similar morphology were observed.
2.3.2. The Screening of Cryoprotectants for X-ray Data Collection
Reveals the Need to Grow Crystal in 2-5% Glycerol for Stability.
The benefit of collecting an X-ray data set with a crystal flash cooling in
a cryoprotectant is to avoid the formation of ice crystals in the flash cooling
process. Various cryoprotectants were tested to optimize the diffraction
quality. Both 30% glycerol and 25% PEG 400 were initially tested since these

73
A) B)
Figure 2.1. Screening hits for Emerald Biosciences Crystal Kit #1 A) #20 - 0.4 M NaH2PO4/1.6 M K2HPO4, 0.1 M Imidazole pH 8.0, 0.2 M NaCl B) #33 2.0 M (NH4)2SO4, 0.1 M CAPS, pH 10.5, 0.2 M Li2SO4
Figure 2.2. Homemade solution of Emerald Biosciences Crystal Kit #33 2.0 M (NH4)2SO4, 0.1 M CAPS, pH 10.5, 0.2 M Li2SO4.

74
Figure 2.3. Hampton Research Crystal Screen Kit 1 #39 2.0 M (NH4)2SO4, 0.1 M Hepes, pH 7.5, 2% PEG.
compounds are known to provide a glassy surface in the flash cooling
process, but many crystals appeared to visually dissolve or gave poor
diffraction patterns. Cryoprotectants containing the mother liquor with 30%
sucrose, 30% glucose, 30% ethylene glycol, and 30% 2-methyl-2,4-
pentanediol were tested with similar results. Efforts with capillary mount also
proved to give little diffraction due to the crystal drying and dissolving with

75
exposure to the atmosphere. Initial tests were performed with 25% PEG-400;
since the crystallization solution contained 2% PEG-400. It was reasoned
that the addition of higher concentration of PEG might minimize the damage
to the crystal lattice with PEG-400 already in solution, but this proved also to
dissolve the crystal. The growth of the crystal in another cryoprotectant was
then applied to glycerol, which demonstrated the best diffraction pattern
during cryoprotectant screening. rHADH protein solutions were grown in HRI
#39 with the addition of 2-6% glycerol. Within 2-3 days, crystal growth was
observed in the 2-4% glycerol and growth was seen in 5-6% glycerol 5-6 days
later. The crystals consisted of medium to large size crystals that were of two
morphologies: long and slender rods (walking stick) and flattened squares
(pizza box) (Figure 2.4). Freezing in 25% glycerol as a cryoprotectant resulted
in good diffraction and no observable dissolving of the crystal.
2.3.3. Expression of SeMet Incorporated rHADH for the Purpose of
Collecting MAD Data Set for Crystallography
Expression and purification of SeMet-incorporated rHADH was
performed in order to collect a MAD data set for phase determination. Cell
growth in SeMet media was stunted, with an additional 5-20 hours were
needed to reach OD600 = 0.7. Longer time was also needed for cell growth in
a second prep, which involved an additional 30 µg/mg L-SeMet and the
added step of spinning down and washing the starter culture cells with SeMet
media. Purity and flavination, as observed by SDS-PAGE and absorbance

76
Figure 2.4. Hampton Research Crystal Screen Kit 1 #39 2.0 M (NH4)2SO4, 0.1 M Hepes, pH 7.5, 2% PEG. Common crystal morphology of walking sticks and pizza boxes.
spectra closely resemble the expression of wild-type rHADH. A slight
decrease in Abs444/Abs382 ratio of 1.37 was observed in the SeMet-rHADH,
along with a 10-fold decrease in protein yield, though activity was found in
good agreement with the wild-type HADH. Incorporation of SeMet into
rHADH was observed with MALDI-TOF mass spectrometry. The first prep
incorporated 10 out the13 L-Met as L-SeMet (Figure 2.5). A second attempt
for full incorporation of SeMet into rHADH was performed by doubling the L-
SeMet concentration and removing the LB media before inoculation into
expression media. This resulted in slower growth of the cells and a reduced

77
incorporation of 5 out of 13 L-Met residues replaced by L-SeMet as observed
by MALDI-TOF mass spectrometry (Figure 2.6).
2.3.4. Complete Data Set Collected for the SeMet-rHADH at the Stanford
Synchrotron Radiation Laboratory (SSRL)
Initial SeMet-rHADH crystal screening was performed on the in house
X-ray diffraction. Crystal samples were grown in HRI #39 with 4% glycerol for
screening on the house source X-ray diffraction. Collection of the data set
suggested the crystals belong to the orthorhombic space group P212121 with
unit-cell parameters a = 101.1411, b = 107.0355 and c = 153.3517 (Table
2.1). Each asymmetric unit contained two molecules of HADH and had a
Matthews coefficient of 60%. Initial attempts with molecular replacement
were unsuccessful using the TMADH structure as a search model (PDB
1DJN).15 Efforts were subsequently directed towards solving the structure
with an muliwavelength anomalous diffraction (MAD) data set. Two SeMet-
HADH protein preps were generated yielding protein with partial incorporation
of 10/13 and 5/13 L-SeMet. L-SeMet-HADH crystals were grown in HRI #39
with 2-5% glycerol with no change in crystal morphology. A complete MAD
data set was collected at beamline 9-2 at the SSRL. The X-ray diffraction
data was collected with 99.7 completeness to 2.7 Å resolution (Figure 2.7)
and an Rsym value of 16% (Table 2.1). The data set was highly redundant
(9.7) with 451,076 points collected and 46,309 unique reflections. This data
set was high enough quality to solve the structure by molecular replacement

78
Figure 2.5. Mass spectrum (MALDI-TOF) of A) unsubstituted rHADH and B) SeMet incorporated rHADH. 10 of 13 Met were incorporated with SeMet

79
Figure 2.6. Mass spectra (MALDI-TOF) of A) unsubstituted rHADH B) SeMet incorporated rHADH. Within the second prep, 5 of 13 Met were incorporated with SeMet.

80
Average I/σ(I) 16.8 (6.3)
Table 2.1. X-ray data collection statistics for SeMet-rHADH. Values in parentheses are for the last shell.
Space group P212121
Unit-cell parameters (Å) a = 101.14 b = 107.03 c = 153.35
Resolution (Å) 84.5 – 2.70 (2.77 – 2.70)
No. of measurements 451,076
No. of unique reflections 46,309
Redundancy 9.7 (9.2)
Completeness (%) 99.7 (98.8)
Rsym (%) 16.0 (38.5)

81
Figure 2.7. X-ray diffraction pattern of SeMet-rHADH at SSRL
using TMADH structure as a search model (PDB 1DJN).15 The HADH crystal
structure was refined with Refmac and modeled with COOT.
2.3.5. rHADH Structure
Preparation of SeMet-rHADH followed previously described
procedures.19 Activity of rHADH maintained activity as seen in native HADH

82
as described in chapter 1. The SeMet HADH crystal was refined at 2.7 Å with
two molecules per asymmetric unit. The structure was validated using
PROCHECK22 and WHATIF. 23 The Ramachandran plot showed 87.1%
residues in most favored reigion, 12.4% in the additional allowed regions,
0.5% in the generously allowed and no residues in the disallowed region.
Data refinement statistics are described in Table 2.2.
Rwork/Rfree(%) 19.7/25.3
B-factors Protein 21.7
6-S-Cys-FMN 4.40
[4Fe-4S] 20.86
ADP 17.18
RMSD Bond lengths (Å) 0.012
Bond angles (o) 1.463
Table 2.2. Refinement Statistics
2.3.6. The Overall Structure of rHADH
rHADH was crystallized as a homodimer with two molecules per
asymmetric unit (Figure 2.8). Each subunit contains 690 residues with

83
molecule A modeled with residues 7-690 and molecule B modeled with
residues 7-689. Both contain [4Fe-4S] and 6-S-Cys-FMN as redox active
cofactors with the addition of a single ADP molecule per each subunit. Figure
2.9 shows the structure of each subunit of the homodimer with the prosthetic
groups colored in red. The root mean square deviation (RMSD) for the Cα
between molecules A and B for rHADH is 0.34 Å. With the high structural
similarity between both molecules, continued analysis will focus on molecule
A due to the complete modeling the C-terminus. The molecule is comprised
of four segments within three domains (Figure 2.9). The large domain
contains the first segment of residues 7-385. The medium domain is
comprised of the second segment of residues 386-491 and the last segment
of residues 622-690, while the small domain consists of third segment of
residues 492-621.
2.3.6.1. The Large Domain of HADH
The large domain contains an N-terminal TIM barrel (Figure 2.10)
common to other flavoproteins, with the eight parallel β-barrels covered by the
eight parallel α-helices. This domain contains the 6-S-cys-FMN and [4Fe-
4S].30 The 6-Scys-FMN is located at the opening of β-barrel and is
surrounded by the 8-fold α-helices and large excursions at the end of β-

84
Figure 2.8. Overview of rHADH structure. Ternary Structure of rHADH with one dimer in green and the other in blue. The prosthetic groups are colored red within the molecule.

85
Figure 2.9. Individual domains of each subunit. The large domain is colored in blue, the medium is colored in green, and the small domain is colored in purple. The prosthetic groups are colored red within the molecule.

86
stands 2,3,4,6, and 8 of the barrel that serve to cover and bury the 6-S-Cys-
FMN. The 6-S-Cys-FMN is covalently linked to Cys35 positioned after the
first parallel strand of the β-barrel. The cysteine is linked to the 6-S-Cys-FMN
through its C-6 atom, which is only known for two other flavoproteins.31 The
[4Fe-4S] cluster is positioned outside the β/α-barrel and connected after the
end of the parallel α-helix (helix 8) close to the medium domain. The [4Fe-
4S] is coordinated to four cysteine residues (Cys348, Cys351, Cys354, and
Cys366).
2.3.6.2. The Medium and Small Domains of rHADH
The medium domain is comprised of five α-helices that cover 3 parallel
β-sheets, with three of the α-helices on one side and two on the other. The
last 20 C-terminal residues of the fourth segment are in contact with the
adjacent subunit. The ADP is located in the medium domain, but it is not
covalently linked to any residue within the domain. The ADP is exposed to the
surface, next to the interface of the medium and small domains. The small
domain contains three α- helices that cover over five parallel β-sheets. Three-
stranded anti-parallel β-sheets cover the other face.
2.3.7. Structural Comparison of HADH with TMADH
HADH shares structural homology with a large family of flavoproteins
containing a TIM barrel domain.30,32-34 HADH is structurally most similar to
the 6-S-Cys-FMN and [4Fe-4S] containing flavoprotein, TMADH.34 The
enzyme TMADH catalyzes the oxidative demethylation of trimethylamine to

87
Figure 2.10. HADH large domain rainbow colored from N-terminus (blue) to C-terminus (red) demonstrating the TIM barrel. The prosthetic groups are also in red.

88
dimethylamine and formaldehyde.35 Both the enzymes are homodimer in
structure and are similar in size, 76 kDa and 82 kDa for HADH and TMADH
respectively.2,35 Molecule A of HADH demonstrates high structural similarity
with molecule A of TMADH based on the root mean square deviation of 1.15
Å for the Cα atoms. Figure 2.11 shows the overlay of each molecule of HADH
and TMADH. Both of the structures are comprised of four segments within
three domains.34 The large domain has the TIM barrel structural motif found in
TMADH and in other flavoproteins.32-34 The medium and small domain
secondary structures share similarities corresponding with the α helices and β
sheets.34 One main structural difference between HADH and TMADH is
found in the small domain. In TMADH, a long loop is connected to the three
anti-parallel β-sheets consisting of residues 606-631, which is not found in
HADH. This loop in TMADH extends over the large domain in the adjacent
molecule. This loop is also not found in the FMN and [4Fe-4S] E. coli 2,4-
dienoyl-CoA reductase, which shares a 30% identity with TMADH.30 The
redox active cofactors, 6-S-Cys-FMN and [4Fe-4S] cluster, are positionally
conserved in both HADH and TMADH, along with bound ADP in the medium
domain.34 The function of the bound ADP is unknown.2 The bound ADP is
spatially analogous with bound FAD in other flavoproteins, i.e. E. coli 2,4-
dienoyl-CoA reductase.30 In this flavoprotein, the FAD transfers electrons to
the FMN through the [4Fe-4S], which will reduce the substrate by two
electrons.

89
Figure 2.11. HADH subunit overlaid with TMADH. HADH molecule A (green) is overlaid with molecule B (blue) TMADH.

90
2.3.8. The Active Site of HADH
The prosthetic groups, 6-S-Cys-FMN and [4Fe-4S], in HADH are involved in
the oxidation of histamine.2 Both cofactors are found in the large domain of
HADH, with the 6-S-Cys-FMN covalently linked to Cys35 and the [4Fe-4S]
coordinated to four cysteine residues (Cys348, Cys351, Cys354, and
Cys366) 2 (Figure 2.12). The distance of the 8α-methyl of the 6-S-Cys-FMN
to the closest iron is around 6 Å, while the closest cysteine residue is 4 Å
away. The distances 8α-methyl of the 6-S-Cys-FMN to the closest iron and
cysteine are reasonably close to the distances of the 8α-methyl of the 6-S-
Cys-FMN to the closest iron and cysteine in TMADH based on overlay of both
cofactors.34 Within the active site, residues in HADH, Arg230, His179, and
Tyr176 (HADH numbering) are conserved in TMADH. In TMADH, these
residues are involved in substrate oxidation36,37 and in 6-S-Cys-FMN
biogenesis.38 Arg230 is positioned 2.70 Å from the O2 carbonyl of the 6-S-
Cys-FMN, while Arg222 in TMADH is 2.60 Å from the carbonyl.34 This
residue was found in TMADH to stabilize the negative charge buildup on the
N1 and C2 carbonyl during 6-S-Cys-FMN biogenesis in TMADH.38 In HADH,
Tyr176 is almost 1.0 Å further from the O2 carbonyl of 6-S-Cys-FMN, 3.72 Å
in HADH and 2.80 Å in TMADH, but both are within hydrogen bonding
distances to the Nδ atom of the imidazole ring of the neighboring histidine
(H179). The difference in Tyr and 6-S-Cys-FMN distance could influence the
extent of the spin-spin coupling and explain the differences observed in

91
Figure 2.12. The prosthetic groups, 6-S-Cys-FMN and [4Fe-4S], in HADH (red) are involved in the oxidation of histamine. The cofactor distances for TMADH (blue) and HADH (red) from the FMN to closest cysteine and iron center is the same. Overlap was performed with SSM superimpose in Coot based on cα chain of both proteins.
TMADH and in HADH.2,36 This tyrosine residue is also involved in hydrogen
bonding with histidine residue and is proposed to be essential to lower the
pKa of histidine residue for substrate oxidation based on the mutation studies
with TMADH.36 His179 is around 0.5 Å closer to the 6-S-Cys-FMN than
His172 is to the 6-S-Cys-FMN in TMADH. Through mutation studies, this
histidine residue is believed to influence the upper ionization in the enzyme-

92
substrate complex of TMADH.37 The 6-S-Cys-FMN in both HADH and
TMADH exhibit a butterfly bend centered at the N5 and N10 positions (Figure
2.13). The figure demonstrates the bend in the 6-S-Cys-FMN of HADH
(green) is not as extensive as the bend in TMADH (blue), while the purple 6-
S-Cys-FMN of HADH was under planar constraint within the refinement
process. The electron density of HADH suggests that the bend of the 6-S-
Cys-FMN lies between the planar 6-S-Cys-FMN in the constrained refinement
and the bend found TMADH. Experimentally, it was determined that the 6-S-
Cys-FMN bend increased the two electron reduction potential of the 6-S-Cys-
FMN.39-41 This increase is in good agreement with the findings in this work,
as the two-electron potential of TMADH is higher than HADH.42
One of the major differences between HADH and TMADH is the
substrate selectivity. The differences in substrate binding to TMADH and
HADH are due to differences within the active site. In TMADH, substrate
binds to the “aromatic bowl”.43 The binding of substrate in TMADH involves
cation-π bonding of the alkylammonium ion mediated by one tyrosine and two
tryptophan residues. Only one tryptophan is conserved between these two
enzymes in HADH, where the other two residues are substituted by glutamine
and aspartic acid. These residues may provide insight for the selectivity of
HADH for histamine versus TMADH and DMADH. Since the structure did not
contain histamine, docking studies of histamine were undertaken to assist in
understanding the enzyme’s selectivity.

93
Figure 2.13. Butterfly bend structure of 6-S-Cys-FMN. Electron density shown as 2 FO− FC map at 1.0 σ around the 6-S-Cys-FMN of strained refinement of HADH 6-S-Cys-FMN (purple), unstrained refinement of HADH 6-S-Cys-FMN (green), and TMADH (blue)
2.3.9. The Modeling of Histamine into the Active Site to Understand the
Mode of Binding
To gain understanding of the substrate selectivity of HADH, histamine
was modeled into the active site (Figure 2.14). The molecular model of
histamine was docked into the active site in both the neutral and protonated

94
forms, with the cation predicted to be substantially more energetically
favorable than the neutral species (-21.50 kcal/mol vs. -14.44 kcal/mol). The
binding of histamine is characterized by several interactions that stabilize the
enzyme-substrate complex. The histamine is positioned over the si face of
the isoalloxazine ring (Figure 2.15). The negative charge of the Asp358 and
Glu79 tightly binds the amino group of histamine. This salt bridge would
provide exceptional stabilization for the amino group. The imidazole group of
histamine forms π−π interactions with Tyr181 and Phe77. Tyr181 exhibits π-
stacking interaction, with Phe77 forming end-on interactions with the
imidazole group. Asn115 also contributes to the stabilization by hydrogen-
bonding to the nitrogen of the imidazole ring.
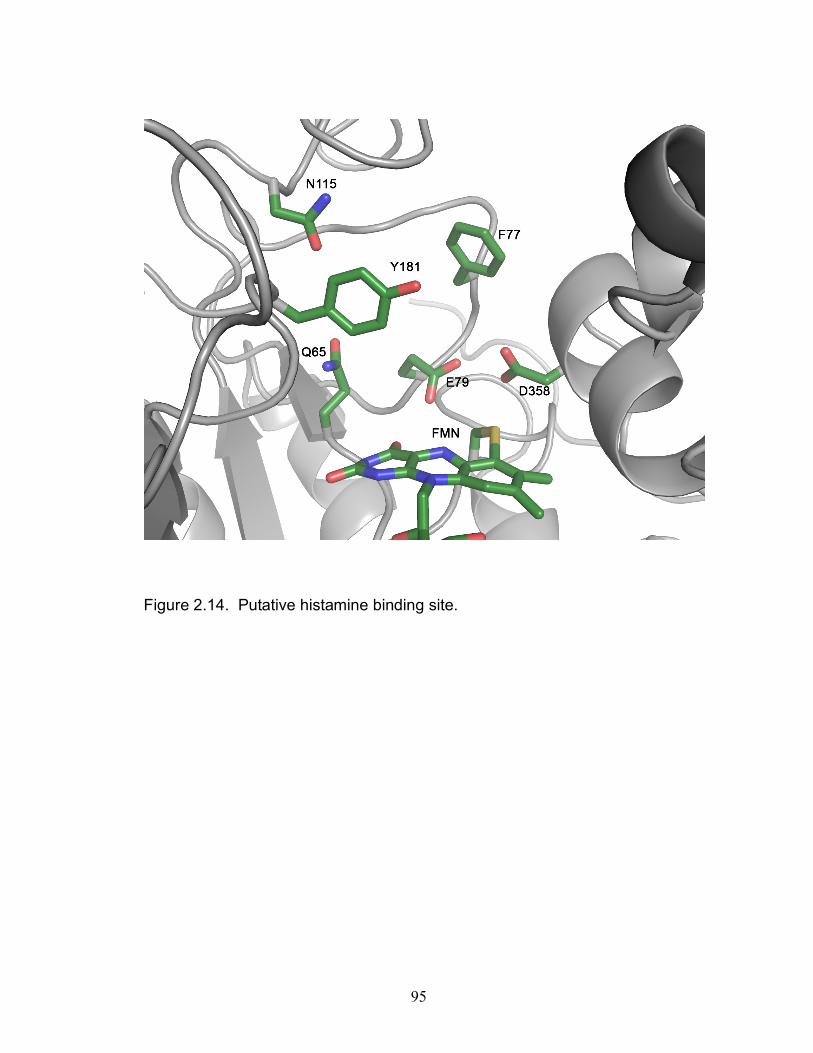
95
Figure 2.14. Putative histamine binding site.

96
Figure 2.15. Model study on histamine binding in the active site of rHADH.
2.4. Discussion
2.4.1. Screening of Crystal Growth Conditions for HADH Reveals Three
Different Conditions that Produce HADH Crystals
The process of protein crystallization requires the screening of many
different conditions to produce crystals if conditions are not known. Hampton
Research Screening Kits I and II (HRI and HRII) and Emerald Biosystems
Screening Kits I and II (EBI and EBII) were used to identify the conditions of

97
crystal growth. Three different conditions were found to grow crystals within
a week, EBI #20, EBI #33 and HRI #39. Minimal optimization of EBI #20 and
EBI #33 were pursued, since the crystal morphology of HRI #39 produced the
greatest potential for diffractable crystals in a short time period. Crystal
morphology of HRI #39 did not vary with protein concentration, as 5 mg/mL to
20 mg/mL produced similar long rods and flatten square boxes crystal
shapes. Initial HADH crystal screening was perform on the in house X-ray
diffraction.
2.4.2. Screening of Cryoprotectants for X-ray Data Collection Reveals
the Need to Grow Crystal in 2-5% Glycerol to Avoid Damaging the
Crystal
The exposure of the crystal to the atmosphere and the initial addition of
various cryoprotectants readily dissolved the crystal within minutes. Different
approaches where then pursued to obtain a crystal that could frozen and yield
well-ordered diffraction. Gradually increasing the concentration of glycerol in
5% increments to the final concentration of 25% proved unsuccessful as the
crystal would still dissolve in higher concentrations of the cryoprotectant.
Efforts then where made to collect a data set at room temperature without
cryoprotectant using a capillary mount. The challenge in this method is to
avoid drying out the crystal during manual manipulation to a sealed capillary.
The HADH crystals examined using this method did not yield a quality data
set from this method but unclear if this was due to the crystal or the

98
manipulation. The introduction of cryoprotectant while the crystal is forming
can reduce the damage to the crystal caused by the addition of
cryoprotectant. Thus, before crystallization 2 – 6 % glycerol was added to the
mother liquor. This did not change the crystal morphology of the walking
sticks or pizza boxes. These crystals grown in this manner appeared
unaffected when 25 % glycerol was added as a cryoprotectant. The crystals
were mounted at the home source X-ray diffraction and obtain good
diffraction data. Initial tests determined the HADH crystals belong to the
orthorhombic space group P212121 with unit-cell parameters a = 101.1411, b
= 107.0355 and c = 153.3517 (Table 2.1). Each asymmetric unit contained
two molecules of HADH. The Matthews coefficient VM of 2.79 Å3 Da-1 which
corresponds to a solvent content of 60%. Due to the high sequence identity
and homology with TMADH (PDB 1DJN)15 this structure was used to attempt
to solve the structure using molecular replacement. This method proved
difficult and while other programs of molecule replacement were being
pursued, SeMet HADH was prepared to obtain a MAD data set.
2.4.3. Expression of SeMet incorporated rHADH for the purpose of
collecting MAD data set for X-ray crystallography
Since molecular replacement proved to be more difficult than
expected, HADH protein was grown in SeMet rich media in which the heavy
atom selenium is incorporated into the protein by replacing normal amino acid
methionine with methionine in which the sulfur in the amino acid is substituted

99
with selenium. The anomalous scattering of the heavy atom can give the
corresponding phase angle, which is then used to solve the crystal
structure.44 The initial attempt at SeMet incorporated 10 out the13 L-Met as
L-SeMet into rHADH. A complete data collection was successfully collected
at the SSRL and phasing using the incorporated SeMet was attempted using
multiwavelength anomalous diffraction. It appeared that insufficient
incorporation of SeMet caused problems for determining phase information
although the number of SeMet was also high. A subsequent attempt at
higher SeMet incorporation by the addition of higher concentration of L-SeMet
during protein expression, only resulted in a reduction in the amount of SeMet
incorporated (5 out of 13). However, the first SeMet data was of significantly
higher quality compared to home source and was used for molecular
replacement.
2.4.4. Complete Data Set collected for the SeMet-rHADH at the Stanford
Synchrotron Radiation Laboratory (SSRL)
A complete MAD data set was collected at beamline 9-2 at the SSRL
at the remote, peak, and edge of the X-ray absorbance of selenium.
Screening of L-SeMet crystals showed higher order in longer, cuboid walking
sticks rather than the flat, square box crystals. It also appeared that the best
diffraction data could be collected with the crystal hanging out of the loop.
(Figure 2.16).

100
HADH crystals were also grown with substrate in order to understand
the binding of histamine with substrate bound (histamine) and inhibitor bound
(N-methyl-histamine) with a five fold increase of inhibitor concentration to
enzyme. The resulting crystals only consisted of pizza boxes, which we were
unable to obtain reasonable diffraction. In the future, seeding the crystal
solution of enzyme and histamine with microcrystals from the walking sticks
could be used to influence the crystal morphology towards the diffractable
walking sticks.
Figure 2.16. Data collection of HADH crystal hanging out of the loop

101
2.4.5. The Active Site of HADH
2.4.5.1. Active Site Comparison of HADH and TMADH
Many structural similarities exist between HADH and TMADH, but the
difference in substrate specificity suggests a unique aspect of the active site
of HADH. The crystal structure of HADH and modeling studies with histamine
were performed in order to gain understanding of the substrate specificity of
HADH. Only one of the residues in the aromatic bowl of TMADH (Trp267) is
conserved in HADH.45 With the polar residues Asp358, Glu79, Gln65,
Tyr181, and Gln115, the binding pocket of HADH resembles that of histamine
binding proteins (HBPs) and the proposed binding pocket of HHR3-7 rather
than TMADH, which consists of the aromatic side chains (Tyr60, Trp264, and
Trp355).45 A distinct difference between TMADH and HADH is the substrate
selectivity within the active site. The tertiary alkylammonium trimethylamine
(TMA) in TMADH is bound through the organic cation-π bonding of the
aromatic bowl, Tyr60, Trp264, and Trp355. Only one residue in HADH
(Trp267) is conserved from the aromatic bowl of the TMADH, and the Trp267
residue is not responsible for the stabilization of histamine in HADH. Gln65
and D358 are the two other residues spatially conserved with the aromatic
bowl. These polar residues stabilize the substrate through a salt bridge and
hydrogen bonding, as opposed to the cation-π stabilization found in the
aromatic bowl of TMADH with residues Tyr60 and Trp355.

102
2.4.5.2. The Mechanism Biogenesis of 6-S-Cys-FMN in HADH
Could Resemble TMADH Based on Spatially Conserved Arginine
Residue in the Active Site
Within the active site of HADH, Arg230 is spatially conserved with
Arg222 in TMADH (Figure 2.17). Mutation studies in TMADH38 have revealed
that Arg222 is involved in the 6-S-Cys-FMN biogenesis in which the Cys30 is
covalently linked to the C6 position on the flavin isoalloxazine ring. In the
proposed mechanism, the 6-S-Cys-FMN forms through flavin
tautomerization.38 In the flavin iminoquinone methide tautomer, the C6 atom
of the flavin is susceptible to nucleophilic attack.38 Arg222 in TMADH is
conserved with Arg230 in HADH and is important for the stability of negative
charge buildup in the N1 atom and C2 carbonyl region. Mutation studies of
Arg222 to lysine in TMADH show reduced flavination of the enzyme, while
R222V and R222Q prevent flavinylation altogether.38 Arg222 in TMADH is
conserved as Arg230 in HADH, suggesting the possible formation of 6-S-
Cys-FMN following the same mechanism. Similar mutation studies of HADH
would conclusively support the iminoquinone methide tautomeric mechanism.
2.4.5.3. The Two Electron Potential of the 6-S-cys-FMN may be
Influenced by the Butterfly Bend of 6-S-Cys-FMN in the Active Site
The 6-S-Cys-FMN of HADH has a unique bend along the N5-N10 axis
of the flavin isoalloxazine ring in the active site. The butterfly bend of 6-S-
Cys-FMN in TMADH was originally thought to be a result of the covalent

103
Figure 2.17. The spatial arrangement of Arginine in HADH (Red Arg230) and TMADH (Blue Arg222) suggests similar mechanism of 6-S-Cys-FMN biogenesis
linkage of the thioether bond of the cysteine and the isoalloxazine ring.46
However, mutation studies of C30A in TMADH resulted in a non-covalently
bound 6-S-Cys-FMN identical to native TMADH, suggesting this covalent
linkage is not responsible for the 25o butterfly bend.46 Computational studies
on both the planar and butterfly bend conformations were performed on
lumiflavin and C6-methylsulfanyllumiflavin, and these studies suggested that

104
the butterfly bend raises the two-electron reduction potential, making the 6-S-
Cys-FMN more reactive to substrate.40,41 Based on the electron density of
HADH, the bend of the 6-S-Cys-FMN is not as extensive as the bend in
TMADH. The redox potential of HADH for 6-S-Cys-FMNO/S and 6-S-Cys-
FMNS/R have been reported to be +34 mV and +30 mV, respectively, 42 while
the reported values of TMADH for 6-S-Cys-FMNO/S and 6-S-Cys-FMNS/R are
+44 mV and +36 mV, respectively.47 The slightly less positive redox
potentials of 6-S-Cys-FMN in HADH may be influenced by the slightly
flattened bend in the 6-S-Cys-FMN.
2.4.5.4 Conserved Tyr in the Active Site Contributes to the Spin-
interaction States of HADH and TMADH Tyr176 in HADH is conserved as Try169 in TMADH, but is almost 1.0
Å farther away from isoalloxazine ring (Figure 2.18). Mutation studies on
TMADH with Y169F revealed the loss of the spin couple of the semiquinone
and reduced [4Fe-4S].36 This phenomenon was observed by EPR as the loss
of feature at half-field. This same phenomenon of the loss of the feature at
half-field is observed native HADH.36 Limburg et al. suggested that either the
spatial arrangement of the two cofactors or the arrangement of the amino
acids could affect the spin coupling.2 The 6-S-Cys-FMN distance to [4Fe-4S]
are equal in HADH and TMADH with 4.0 Å from the 8α carbon to the nearest
cysteine residue and 5.7 Å from the 8α-methyl to the closest iron in the [4Fe-

105
Figure 2.18. Conserved Tyr in the Active Site Contributes to the Spin-interaction States of HADH (Red Tyr176) and TMADH (Blue 169)
4S] shows the spatial relationship of the cofactors is the same. In a mutation
study done by Scrutton substituting Tyr169 with phenylalanine, the complex
EPR signal associated with the spin-interaction state in the wild type is not
observed at high-field and the signal at g ~4 is greatly reduced.36 The mutant
forms the semiquinone and reduced [4Fe-4S], but the magnetic moments of
the two unpaired spins do not interact as strongly as wild type. The proposed

106
rationale behind this was that the negative charge on the hydroxyl group
develops and forces unpaired electron density on the 6-S-Cys-FMN towards
[4Fe-4S] and reduces the distance of the spin-interaction. The tyrosine in the
active site of HADH is almost an entire Å farther from the isoalloxazine ring
and likely does not assist in the spin coupling of the semiquinone and
reduced [4Fe-4S].
2.4.6. Histamine Binding In HADH
2.4.6.1. The Modeling of Histamine in the Active Site reveals
Important Residues for Selectivity
Limburg et al. proposed that the mono-protonated histamine binds to
the active based on the pH dependence on kcat/Km.2 Results of modeling
studies also suggest a more favorable binding of the mono-protonated over
the neutral histamine. Also predicted were the active site residues Glu79 and
Asp358 involved in histamine binding2, and could contribute to the ionization
observed in the pH dependence on kcat/Km. The involvement of these
residues in histamine binding are also consistent with modeling studies.
Histamine is also stabilized by Phe77 and Tyr181 through π−π stacking
interactions.
The binding of histamine in the active site of HADH explains the high
selectivity. Biogenic amines such as tyramine and dopamine, which have a
hydroxyl group on the aromatic ring would have a high degree of steric
hindrance with the asparagine residue (Asn115), which would not allow for

107
the binding of these substrates. Aliphatic amines, such as n-butylamine,
putrescine, and methylamine, do not benefit from the π−π interactions that are
observed with the imidazole group of histamine. Agmatine could take
advantage of both the interactions with the amino group and the π−π
interaction of the guanidine group, along with stabilization with the asparagine
residue. However, the π−π interaction would not be comparable to the
imidazole ring histamine, which alters its binding affinity.
2.4.6.2 Known Binding motif of Histamine Binding Proteins
Validates the Binding mode of Histamine in HADH.
There are a handful of proteins that have been crystallized with
histamine bound in the active site.48 These range from proteins found in
humans, histamine methyltransferase and histidine decarboxylase, to proteins
found in insects, nitrophorin and histamine binding proteins. Though the
residues involved in the binding of histamine differ, the stabilization of
histamine though either the imidazole ring or the amino group of histamine is
conserved throughout these proteins. When comparing HADH with the other
histamine binding proteins, the binding motif correlates most closely with
salivary proteins seen in blood sucking insects, commonly known as
histamine binding proteins (HBP), and histamine methyltransferase. In the
HBPs, the negatively charged residues of aspartic acid, glutamic acid, or
both stabilize the amino group of histamine. Stacking interactions with the
aromatic residues tyrosine, phenylalanine, and tryptophan help to stabilize the

108
imidazole ring of histamine. The HBPs found in these insects function to bind
histamine with high affinity during blood feeding, as this will suppress the
inflammation response. The role of histamine methyltransferase (HNMT) is to
inactivate histamine. This occurs by transferring a methyl group from S-
adenosyl-L-methionine to the imidazole ring. The binding of histamine in
HNMT involves the amino group of histamine interacting with glutamic acid,
glutamine, and asparagine residues. The aromatic residues tryptophan and
tyrosine provide π stacking with the imidazole. The binding of histamine in
HADH follows the motif of these two classes of proteins. HADH binds the
amino group of histamine through negatively charged aspartic acid and
glutamic acid residues, along with π−π stacking interactions with tyrosine and
phenylalanine. Even though the function and mechanism of HBPs, HNMT,
and HADH differ, the selectivity of histamine and the binding motif is clearly
consistent with these high-affinity histamine-binding proteins
2.4.6.3. Docking of Histamine in the Active Site of HADH has
Similarities with Human Histamine Receptor/ Histamine Model
The sequences of the human histamine receptors (HHR) are known,
but the crystal structures have yet to be determined.3-7 Modeling studies of
the HHR and other histamine binding proteins have provided some
understanding of the physiological binding of histamine. In all four HHR, a
salt bridge between a conserved aspartic acid and the amino group of
histamine has proven essential for histamine binding based on site-directed

109
mutagenesis studies.3-7 HADH also has an aspartic acid residue that forms
a salt bridge with the cationic amino group of histamine, exhibiting a similar
binding motif to all four HHRs, with a glutamic acid residue that also
contributes to the ion-pair interaction. HHR 1 and HHR 4 both contain an
asparagine residue that hydrogen bond to the imidazole nitrogen.3,49 In
HADH, Asn115 plays the same role as the asparagine in these two HHR,
stabilizing the imidazole ring. In HHR1, a tyrosine residue contributes to
imidazole binding by forming a π−π interaction3, while in HADH Tyr181 and
F77 provide the same stabilization of the imidazole group. The binding motif
of HADH demonstrates significant similarities with HHR, and especially the
binding motif of HHR1.
One of the most prescribed families of pharmacological drugs are
designed to target the H1 receptor within the body. Understanding how
histamine binds within this receptor could greatly increase selectivity and
specific pharmacological action. The important residues in the HHR 1 that
are essential for the binding of histamine are aspartic acid, tyrosine, and
asparagine. In HADH, the same residues interact to stabilize histamine
making HADH a great model for HHR1, for which the crystal structure has not
been solved.
2.4.7. The Possible Catalyst Mechanism for C-H Bond Cleavage and
Potential to Probe the Possible Mechanism.

110
The proposed mechanism of C-H bond cleavage for HADH involves
the nucleophilic attack amino group of histamine at the C4 position of the 6-S-
Cys-FMN with proton abstraction by the N5 atom of the 6-S-Cys-FMN.
Elimination and formation of the imine follows the nucleophilic attack and then
subsequent oxidation with water and the eventual formation of the reduced 6-
S-Cys-FMN. (Figure 2.19) This mechanism had been proposed by TMADH
and MAO.10,50,51 Limburg et al. determined the KIE of 7.0 indicating the C-H
bond cleavage was part of the rate determining step under subsaturating
conditions.2 They also observed the reaction of phenylhydrazine with HADH.
In TMADH, Scrutton et al. reacted phenylhydrazine and noticed that an
unusual spectrum was observed.52 After isolation of the isoalloxazine ring,
the phenylhydrazine was seen complexed to the ring. This electrophilic
position was also confirmed by experimental and computational studies on
the isoalloxazine.46,53 Quantitative structure-activity relationships (QSAR)
with MAO have been performed by Edmondson with para and meta-
substituted benzylamines.10 They observed negative charge build up that
supports proton abstraction mechanism for the substrate C-H bond and
suggests a polar nucleophilic mechanism as proposed here. Further
computational studies of the LUMO in both lumiflavin and C6-
methylsulfanyllumiflavin suggest significant orbital density on N5 and C4a.46
This could play a significant role in the mechanism of C-H bond cleavage of

111
Figure 2.19. Proposed Oxidation of Histamine by HADH

112
histamine. The positive electrostatic potential found at C4a suggests a
possible location of substrate adduct formation.46
Phenylhydrazine is known to react with 6-S-Cys-FMN in HADH and
TMADH. 2,52 The KIE found in HADH that shows the C-H bond cleavage is
rate limiting.2 These mechanistic similarities suggest that HADH undergoes
nucleophilic addition mechanism in the substrate oxidation.10,50,51
Other possible means of probing the mechanism of HADH could
involve the use of derivatized substrates.2 The use of mono or di-substituted
fluorohistamine creates an amino group that is harder to oxidize and
decreases the nucleophilicity of histamine. A decrease in the rate of the
reduction would suggest a covalent mechanism is involved in substrate
oxidation. Substrates with steric bulk at the amine position would affect the
rate of reduction if a covalent mechanism is employed. If the reduction rate is
constant with these derivatives there is a possibility of electron transfer, and
an increase in reaction rate with the difluorohistamine might suggest a
hydride transfer.2 This could possibly help in towards understanding
oxidation of substrate in flavoproteins.
2.4.8. The Possible Electron Transfer from Cofactors of HADH to the
External Electron Exceptor.
In the oxidative half-reaction, HADH transfers one electron from the
reduced [4Fe-4S] cluster to an external electron acceptor. The natural
electron acceptor for HADH is unknown. The physiological electron acceptor

113
for TMADH was found to be the electron transferring flavoprotein (ETF).54 In
TMADH, Tyr442 was shown to be the means of transferring electrons to
ETF.55 Mutation studies of Tyr442 and Val344 in TMADH demonstrate two
possible pathways for electron transfer.55 With ferricenium (Fc) as the
electron acceptor, the rate of electron transfer was greatly affected by
introduction of various mutations at Val344. Smaller side chains (Val344A,
Val344C, and Val344G) showed an increased rate, while longer side chains
(Val344I and Val344Y) reduced the rate of electron transfer to Fc+. Electron
transfer to native ETF was unaffected by mutations at Val344. In contrast,
mutations at Tyr442 had little effect on electron transfer to Fc+, while the
mutations Tyr442P, Tyr442L, Tyr442C, and Tyr442G showed major reduction
of electron transfer to ETF. The conclusion of this mutation study suggested
two modes of electron transfer: 1) electron transfer from the [4Fe-4S] to
Val344 is the shortest pathway, because small Fc+ is able to access through
a small groove. 2) ETF is not able to penetrate this small groove, and electron
transfer occurs on a longer pathway from Cys345 to Glu439 to Tyr442. The
physiological electron acceptor for HADH is not known, and ETF protein could
not be recovered in the purification process of HADH from N. simplex. Some
possible single-electron acceptors are ferredoxin, cytochrome c, and azurin.2
The residues of the electron transfer pathway found in TMADH are not
conserved within HADH (Figure 2.20). The longer pathway in HADH includes
Cys348 to Ala441 to Arg444, though electron transfer along this route is

114
Figure 2.20. Proposed Electron transfer of HADH
probably unlikely. The more probable route of electron transfer is from
Cys348 to Glu347. Glu347 is exposed to the surface and is directly adjacent
to Cys348. Mutations of this cysteine residues in HADH are currently in
progress to uncover the mechanism and residues involved in the oxidative
half-reaction. Further studies will decipher the specific route of electron
transfer in HADH.
2.4.9. Possible Design of a Histamine Sensor

115
In the design of an enzymatic sensor, the transfer of electrons from the
reduced enzyme to the electrode surface is vital for successful detection.
Charge transfer can occur through a mediator or by engineering the enzyme
to the electrode surface. Biosensor design has been pursued by several
groups. One means of creating an enzymatic biosensor is to immobilize the
enzyme in a polypyrrole film on the electrode surface. Potassium
ferricyanide was employed to mediate electrons from the reduced enzyme to
the electrode. HADH has demonstrated substrate inhibition based on the
substrate and external electron acceptor concentrations, so problems with the
sensitivity at high histamine concentration might arise if the external electron
acceptor is not present at sufficient concentrations to reoxidize HADH. A
better route to an enzymatic biosensor would be to genetically engineer the
protein to the sensor itself. This would allow for electrons to travel directly
from the [4Fe-4S] to the electrode. This concept was demonstrated with
TMADH, where the enzyme was wired to the electrode.14 In order for
electron transfer to occur, the wiring of the enzyme needs to be in close
proximity to the redox active cofactors. HADH has an ideal setup, with the
residue right next to the [4Fe-4S] exposed to the surface of the enzyme
(Glu347). This residue can be mutated to a cysteine residue, which can in
turn be immobilized onto the surface of the electrode. However, mutation
close to the [4Fe-4S] might cause a change in the reduction potential. Cyclic
voltammetry would need to be employed to test the redox potential of the

116
[4Fe-4S] to ensure no change had occurred. A design for a portable
enzymatic sensor for histamine detection could be applicable in the field of
cancer research and in FDA detection of contaminated fish.
2.5. Conclusion
HADH is known to have high substrate selectivity. To better
understand this narrow substrate selectivity, structural studies were
performed on histamine dehydrogenase.2 HADH crystallization conditions
were screened finding HRI #39 as optimal for crystal growth. Further
screening would be useful to obtain data with higher resolution or with
histamine bound. Overall, a complete data set was collected with HADH
crystals that contained 4% glycerol and a “walking stick” crystal morphology.
Although they grew readily, the diffraction of the square boxes yielded poor
diffraction quality. Shifting the equilibrium of crystal growth towards the
“walking sticks” could improve the resolution, especially when co-
crystallization of substrate is desired. Slight modifications in HRI #39, such
as pH, salt, or buffer concentration, should be explored. Also, slight
modification to EBI #20 and EBI#33 could produce desirable crystals. X-ray
diffraction data of HADH recombinantly expressed in E. coli has been
determined to 2.7 Å resolution. HADH shares the common TIM barrel motif
found in many flavoproteins along with prosthetic groups that are spatially
analogous to other FMN and [4Fe-4S] dependent flavoproteins. The docking
studies suggest that binding of histamine mimics the binding motif found in

117
histamine methyltransferase and HBP. These enzymes are selective for
histamine and bind histamine with high affinity. In these proteins, the amino
group is stabilized by the negative charge on the carboxylate group and π−π
interaction with aromatic residues. Histamine is proposed to have a similar
binding motif with human histamine receptors (HHR), especially human
histamine receptor 1, which is the target of pharmaceutical drug design. A
conserved aspartic acid found in all four HHR, stabilizes the amino group of
histamine though ion-pair interactions. HHR 1 also stabilizes the imidazole
ring of histamine with tyrosine and asparagine residues. Both the ion pair
interaction and the imidazole stabilization binding motifs are conserved in
HADH. HADH’s high selectivity towards histamine and its optimal electronic
properties make it an excellent choice for a biosensor for the detection of
histamine. The similar binding motif of HADH and HHR 1 could provide a
better understanding of histamine binding within the body, allowing the
development of highly specific and selectivity antagonists to HHR1.

118
Reference
(1) Siddiqui, J. A.; Shoeb, S. M.; Takayama, S.; Shimizu, E.; Yorifuji, T. FEMS Microbiology Letters 2000, 189, 183-187. (2) Limburg, J.; Mure, M.; Klinman, J. P. Archives of Biochemistry and Biophysics 2005, 436, 8-22. (3) Jongejan, A.; Leurs, R. Archiv. der Pharmazie. 2005, 338, 248-259. (4) Gantz, I.; Munzert, G.; Tashiro, T.; Schaffer, M.; Wang, L.; DelValle, J.; Yamada, T. Biochemical and Biophysical Research Communications 1991, 178, 1386-92. (5) Stark, H.; Sippl, W.; Ligneau, X.; Arrang, J. M.; Ganellin, C. R.; Schwartz, J. C.; Schunack, W. Bioorg. Med. Chem. Lett. 2001, 11, 951-4.
(6) Sippl, W.; Stark, H.; Holtje, H. D. Pharmazie 1998, 53, 433-7. (7) Oda, T.; Morikawa, N.; Saito, Y.; Masuho, Y.; Matsumoto, S.-I.
Journal of Biological Chemistry 2000, 275, 36781-36786. (8) Scrutton, N. S. Natural Product Reports 2004, 21, 722-730. (9) Kay, C. W. M.; El Mkami, H.; Molla, G.; Pollegioni, L.; Ramsay,
R. R. Journal of the American Chemical Society 2007, 129, 16091-16097. (10) Miller, J. R.; Edmondson, D. E. Biochemistry 1999, 38, 13670-13683. (11) Rigby, S. E. J.; Hynson, R. M. G.; Ramsay, R. R.; Munro, A. W.; Scrutton, N. S. Journal of Biological Chemistry 2005, 280, 4627-4631. (12) Lui, G., Paddon-Row, M., Gooding., J. Electrochem. Commun. 2007, 9, 2218-2223. (13) Loechel, C.; Basran, A.; Basran, J.; Scrutton, N. S.; Hall, E. A. H. Analyst 2003, 128, 166-172. (14) Loechel, C.; Basran, A.; Basran, J.; Scrutton, N. S.; Hall, E. A. H. Analyst 2003, 128, 889-898. (15) Trickey, P.; Basran, J.; Lian, L. Y.; Chen, Z. W.; Barton, J. D.; Sutcliffe, M. J.; Scrutton, N. S.; Mathews, F. S. Biochemistry 2000, 39, 7678-7688. (16) Cohen, A. E., Ellis, P. J., Miller, M. D., Deacon, A. M. & Phizackerley, R. P. J. Appl. Cryst. 2002, 35, 720-726. (17) Leslie, A. G. W. Acta Crystallographica Section D-Biological Crystallography 2006, 62, 48-57. (18) Collaborative Computational Project, N. Acta Cryst. 1994, D50, 760-763. (19) Reed, T. M.; Hirakawa, H.; Mure, M.; Scott, E. E.; Limburg, J. Acta Crystallogr. F 2008, F64, 785-787. (20) Murshudov, G. N.; Vagin, A. A.; Dodson, E. J. Acta Crystallogr. Sect. D Biol. Crystallogr. 1997, D53, 240-255.

119
(21) Emsley, P.; Cowtan, K. Acta Crystallogr. Sect. D: Biol. Crystallogr. 2004, D60, 2126-2132. (22) Laskowski, R. A.; MacArthur, M. W.; Moss, D. S.; Thornton, J. M. Journal of Applied Crystallography 1993, 26, 283-91.
(23) Vriend, G. Journal of Molecular Graphics 1990, 8, 52-6, 29. (24) DeLano, W. L. T. P. M. G. S. D. S., San Carlos, CA, USA. (25) SYBYL 8.0, T. T. A., St. Louis, MO, 2007. . (26) Clark, M.; Cramer, R. D., III; Van Opdenbosch, N. Journal of
Computational Chemistry 1989, 10, 982-1012. (27) Gasteiger, J.; Marsili, M. Tetrahedron 1980, 36, 3219-22. (28) Rarey, M.; Kramer, B.; Lengauer, T.; Klebe, G. Journal of
Molecular Biology 1996, 261, 470-489. (29) Lovell, S., Davis, I., Arendall III, W.B., de Bakker, P., Word, J., Prisant, M., Richardson, J., Richardson, D., Proteins: Structure, Function, and Genetics 2003, 50, 437-450. (30) Hubbard Paul, A.; Liang, X.; Schulz, H.; Kim Jung-Ja, P. J. Biol. Chem. 2003, 278, 37553-60. (31) Mewies, M.; McIntire, W. S.; Scrutton, N. S. Protein Science 1998, 7, 7-20. (32) Yang, C.-C.; Packman, L. C.; Scrutton, N. S. European Journal of Biochemistry 1995, 232, 264-71. (33) Lindqvist, Y.; Braenden, C. I.; Mathews, F. S.; Lederer, F. Journal of Biological Chemistry 1991, 266, 3198-207. (34) Lim, L. W.; Shamala, N.; Mathews, F. S.; Steenkamp, D. J.; Hamlin, R.; Nguyen Huu, X. Journal of Biological Chemistry 1986, 261, 15140-6.
(35) Colby, J.; Zatman, L. J. Biochem. J. 1974, 143, 555-67. (36) Basran, J.; Jang, M. H.; Sutcliffe, M. J.; Hille, R.; Scrutton, N. S.
J.. Biol. Chem. 1999, 274, 13155-61. (37) Basran, J.; Sutcliffe, M. J.; Hille, R.; Scrutton, N. S. Biochemical Journal 1999, 341, 307-314. (38) Mewies, M.; Basran, J.; Packman, L. C.; Hille, R.; Scrutton, N. S. Biochemistry 1997, 36, 7162-7168. (39) Hasford, J. J.; Kemnitzer, W.; Rizzo, C. J. Journal of Organic Chemistry 1997, 62, 5244-5245. (40) Zheng, Y.-J.; Ornstein, R. L. Journal of the American Chemical Society 1996, 118, 9402-9408. (41) Dixon, D. A.; Lindner, D. L.; Branchaud, B.; Lipscomb, W. N. Biochemistry 1979, 18, 5770-5. (42) Tsutsumi, M.; Fujieda, N.; Tsujimura, S.; Shirai, O.; Kano, K. Bioscience, Biotechnology, and Biochemistry 2008, 72, 786-796. (43) Bellamy, H. D.; Lim, L. W.; Mathews, F. S.; Dunham, W. R. Journal of Biological Chemistry 1989, 264, 11887-92.

120
(44) Rhodes, G. Crystallography Made Crystal Clear; Third ed.; Elsevier: New York, 2006. (45) Basran, J.; Mewies, M.; Mathews, F. S.; Scrutton, N. S. Biochemistry 1997, 36, 1989-1998. (46) Trickey, P.; Basran, J.; Lian, L. Y.; Chen, Z.; Barton, J. D.; Sutcliffe, M. J.; Scrutton, N. S.; Mathews, F. S. Biochemistry 2000, 39, 7678-88. (47) Pace, C. P.; Stankovich, M. T. Arch. Biochem. Biophys. 1991, 287, 97-104. (48) Konkimalla, V. B.; Chandra, N. Biochemical and Biophysical Research Communications 2003, 309, 425-431. (49) Shin, N.; Coates, E.; Murgolo, N. J.; Morse, K. L.; Bayne, M.; Strader, C. D.; Monsma, F. J., Jr. Molecular Pharmacology 2002, 62, 38-47. (50) Basran, J.; Sutcliffe, M. J.; Scrutton, N. S. Journal of Biological Chemistry 2001, 276, 42887-42892. (51) Basran, J.; Sutcliffe, M. J.; Scrutton, N. S. Journal of Biological Chemistry 2001, 276, 24581-24587. (52) Nagy, J.; Kenney, W. C.; Singer, T. P. J. Biol. Chem. 1979, 254, 2684-8. (53) Kim, J. M.; Bogdan, M. A.; Mariano, P. S. Journal of the American Chemical Society 1993, 115, 10591-5. (54) Huang, L.; Rohlfs, R. J.; Hille, R. Journal of Biological Chemistry 1995, 270, 23958-65. (55) Basran, J.; Chohan, K. K.; Sutcliffe, M. J.; Scrutton, N. S. Biochemistry 2000, 39, 9188-9200.

121
Chapter 3
Targeting the Endoplasmic Reticulum for Inhibition of Collagen
Production by Prolyl 4-Hydroxylase
3.1. Background
3.1.1. Fibrosis
Fibrosis is a disease characterized by the over production and
progressive accumulation of collagen.1 Fibrosis has been observed in many
tissues and organs including the heart, kidney, lungs, blood vessels, and
skin.1,2 Excessive collagen production results in the destruction of normal
function and structure of these organs. The most prevalent types of fibrosis
include pulmonary fibrosis, fibrosis of the liver, and rheumatoid arthritis.
Table 3.1 demonstrates the effects of fibrosis on people. In pulmonary
fibrosis, the air sacs in the lungs thicken from
Deleterious Effects Pulmonary Fibrosis 84,000 people die each year3
Liver Fibrosis 900,000 people have been diagnosed 26,000 people will die4
Rheumatoid Arthritis Millions of people affected with joint pain and discomfort5
Table 3.1. The deleterious effects of fibrosis on human population

122
the formation of scar tissue,6 making oxygen transfer from the lungs to the
blood very difficult. Fibrosis of the liver, or cirrhosis, involves the
development of scar tissue in place of normal tissue. This scar tissue blocks
the transfer of blood into the liver preventing the removal of poisons and
bacteria from the blood.7 Rheumatoid arthritis is an autoimmune disease that
causes inflammation of the joints and the surrounding connective tissue.5
The destruction of cartilage and ligaments triggers the inflammatory
response, which produces scar tissue.
While all types of fibrosis within these tissues are characterized by
excess collagen, the environmental triggers that cause fibrosis within these
tissues vary significantly. Pulmonary fibrosis is primary caused by smoking,
inhalation of inorganic dusts or chemicals, or viral infections.3 Liver fibrosis is
often caused by excessive alcohol consumption or viral hepatitis.8 In many
cases of fibrosis, the initial cause of inflammation is varied, but the deleterious
effect is the overproduction of collagen. Fibrotic diseases are chronic and
progressive in their injurious effect. A treatment able to cure or minimize
fibrosis could alleviate the pain and discomfort felt by many around the world.
3.1.2. Fibrosis – Pathway and Possible Prevention
Development of a cure to fibrosis is as varied as the disease itself.
Simply abstaining from alcohol or smoking will greatly reduce the risk of liver
fibrosis and slow its advancement within the body.8 The cellular response is
another target towards inhibiting fibrosis. The cellular involvement in the

123
pathway to fibrosis is described in Figure 3-1.9,10 After tissue is damaged, the
body responds to substances released from dead and dying cells by the
activation of macrophages. These macrophages activate cytokines, the most
notable being TNF-α and interleukins 1 and 6. The pathway continues with
the activation of the inflammatory response in the local environment,
Figure 3.1. Damage to the tissue elicits a cascade immune response. The persistent cell damage causes the sequence of events that lead to the developing of fibrosis.11

124
especially with EGF, PDGF and TGF-β.10 Eventually, the cytokines activate
fibroblast cells and elicit the production of collagen. Persistent tissue damage
leads to continued inflammatory response, which eventually causes the
overproduction of collagen and therefore fibrosis.
Many of the fibrosis drugs being developed target the immune
response with the hope of preventing the production of scar tissue. Anti-
inflammatory therapy and steroids have been successful in preventing the
inflammation response, causing a reduction of fibrosis.8,12 Steroids have had
a more prolonged effect on chronic fibrosis than non-steroidal anti-
inflammatory drugs.12 The increased expression of mRNA and protein levels
of TGF-β seen in rats with liver fibrosis and pulmonary fibrosis has lead to an
increased interest in targeting the TGF-β pathway.13 When TGF-β is directly
injected into test subjects, fibrogenic tissues are observed.14 Experiments
using antibodies to TGF-β have reduced scarring in rats without disrupting the
body’s wound healing response.15 However, using antibodies as a long term
therapeutic agent could prove difficult due to the need to minimize their ability
to stimulate an immune response.11 Low molecular weight inhibitors that
either block the interaction of TGF-β with its receptor or inhibit signal
transduction mechanism for TGF-β could provide a safe and cost effective
route to reduce fibrosis; however, the class of receptor that determines
fibrogenic activity (Type I, II, or III) and which isoform of TGF-β (TGF-β1 or
TGF-β2) is responsible for fibrogenic activity remains unclear.16 The cytokine

125
PDGF is also believed to be involved in fibrosis due to its location near tissue
damaged sites.8 Inhibitors know as tyrphostins inhibit PDGF-receptor
tyrosine kinases.17 These drugs have been shown to be potential therapeutic
agents against fibrosis and are progressing toward in vitro studies. All of
these possible therapeutic drugs target different proteins on the pathway
towards fibrosis.
3.1.3. Post-Translational Modification of Collagen by Prolyl 4-
Hydroxylase: A Possible Target for Fibrosis
Many different types of collagen exists in the extracellular matrix, with
types I and III being the most common, but these proteins all underwent the
same post-translational modifications. The enzyme responsible for one of the
key post-translational modifications is prolyl 4-hydroxylase (P4H).18 This
enzyme is located in the lumen of the endoplasmic reticulum (ER) and is
responsible for hydroxylation of peptidyl proline, which is crucial for the folding
and stability of the collagen triple helix. Each monomer of collagen consists
of a Gly-Xaa-Yaa repeat, where the Xaa residue is often proline and the Yaa
residues is often trans 4-hydroxyproline (Hyp). Hyp is formed from the post-
translational modification of proline by P4H and is essential for the stability of
the collagen triple helix. Under-hydroxylated collagen that occurs due to
inactive P4H, is not stable at room temperature and remains in the ER until
either 1) activity of P4H is restored and collagen undergoes hydroxylation or
2) it is broken down within the lysosomal compartments.18,19 The prevention

126
of Hyp formation by P4H would inhibit the production of collagen, making P4H
an attractive target for reducing fibrosis within the body.
3.1.4. Prolyl 4-Hydroxylase
P4H is a member of the α-ketoglutarate dependent non-heme iron
oxygenases super family.19 The type I isoform of P4H found in mammals is
an α2β2 tetramer where each α subunit contains a catalytic active site
responsible for the formation of Hyp as well as a peptide binding domain
where collagen binds. The β subunit is protein disulfide isomerase (PDI) and
is primarily responsible for enzyme solubility and the retention of the enzyme
in the ER through the peptide recognition sequence of KDEL at the C
terminus. The structure of human Type I P4H has yet to be solved but site-
directed mutagenesis has identified important residues in the catalytic cycle
(Figure 3-2).20 His412, Asp414, and His483 comprise the iron binding site.
These residues form a facial triad of ligands to the iron along with an 8-
stranded β-helix core fold in the α subunit.18,19,21 The peptide-substrate
binding domain is found between Gly138 through Ser244 and is unique to
human type I P4H.22 The hydroxylation of peptidyl proline by P4H requires
FeII, α ketoglutarate, O2, and ascorbate for catalysis.22,23 The iron in the
resting state is FeII that is in six-coordinate octahedral coordination sphere
with three water molecules and the His-Asp-His facial triad as ligands. Two
water molecules are displaced upon the bidentate binding of α-ketoglutarate.
Lys493 and His501 bind to the C-5 and C-1 carbonyl groups of α-

127
ketoglutarate to stabilize the cofactor. As substrate and O2 enter the active
site; O2 binds to iron in the axial position and oxidizes FeII to FeIII.
Nucleophilic attack of the α-ketoglutarate by O2 forms the FeIII-peroxo bridge.
Figure 3.2. Proposed catalytic cycle of human type I prolyl 4-hydroxylase20

128
α-ketoglutarate then undergoes oxidative decarboxylation to form succinate
and reactive FeIV-oxo species. This reactive oxygen species catalyzes H-
atom abstraction from the 4 position on proline, which is followed by a
rebound step to form trans 4-hydoxyproline. Loss of succinate returns iron to
its FeII resting state. During this process, succinate can accumulate and
inactivate the enzyme unless ascorbate is present to restore the enzyme to its
resting FeII state.
3.1.5. Current Iron Chelating P4H Inhibitors.
3.1.5.1. N-oxalylglycine Derivatives
Several inhibitors for P4H have been designed to mimic the binding of
α-ketoglutarate to FeII. This binding prevents the decarboxylation step
essential for catalytic turnover. Potential inhibitors of P4H have analogous
structures to 2-oxoglutarate and mimic the bidentate binding to the FeII resting
state. Franklin and coworkers designed chelators analogous to 2-
oxoglutarate and tested them against both isolated avian P4H enzyme and
collagen production in isolated chick-tendon cells (Table 3-2).23 These
inhibitors are proposed to bind to iron thereby preventing the oxidative
decarboxylation to inhibit P4H. When tested against isolated avian P4H, N-
oxalylglycine (1) demonstrated an IC50 value of 3 µM. A series of N-
oxalylglycine derivatives were prepared and screened. Simple substitutions
at the α-carbon atom of N-oxalylglycine (2) only raised the IC50 and reduced
activity of the derivatized N-oxalylglycine compounds. When the oxalyl C-

129
group was replaced with a heterocyclic cinnoline moiety (3), a 100-fold
decrease in the IC50 value was observed. It was proposed that the nitrogen
from the heterocyclic and the nitrogen from the amide group would coordinate
to the FeII complex. Methylation at the α-carbon (4) retained the same
stereochemical restriction observed in the methylated N-oxalylglycine (2).
Table 3.2. IC50 values for the inhibition of P4H by N-oxalylglycine and its derivatives against isolated P4H enzyme and in vitro with chick-tendon cells23

130
One of the difficulties in drug design is delivery of the drug across the
cytoplasmic membrane. N-oxalylglycine (1) has a 50-fold increased IC50
value when tested against P4H produced in chick tendon cells to compared to
the isolated P4H. Similarly, the IC50 of the cinnoline derivative (3) increased
from 0.02 µM for isolated P4H to 81 µM for the P4H produced in chick-tendon
cells, which was the highest concentration tested. These data demonstrate
the difficulty in drug design; an inhibitor maybe effective against isolated P4H
but may prove ineffective in cellular and in vivo studies. In order to derive a
more lipophilic inhibitor, the compound (5) was prepared and it resulted in a
4-fold decrease in IC50 value when tested against the P4H produced in chick-
tendon cells. This demonstrates the importance of inhibitors with the ability to
cross the intracellular membrane.
3.1.5.2. Pyridine-2,5 Dicarboxylic Acid Derivatives
Another common inhibitor of P4H is pyridine-2,5 dicarboxylic acid (6), which
has an IC50 value of 5.5 µM against isolated enzyme (Table 3-3A).24 The
nitrogen from the pyridine ring and the C-2 carboxylic acid group are believed
to chelate iron thereby preventing the oxidative decarboxylation. Increased
binding of this inhibitor to human P4H is seen because the C-5 carboxyl
group can also bind to the distal carboxylate binding site, which is comprised
of residues Lys493 and His501. Modifications of pyridine-2,5 dicarboxylic
acid were made in order to improve P4H inhibition against isolated enzyme
and investigate binding of the inhibitors (Table 3.3).24 Two main modifications

131
were made: one involved variation of the chain lengths at the C-5 carboxylate
position (Table 3.3A), while the second involved replacing the C-2 and C-5
carboxylic acid groups with acid mimics (Table 3.3B). Variations at the C-5
carboxyl position extended the length from a simple methyl group (7) to
ethyl/ethylene (8,9) and to a benzyl group (10). Small variations in the IC50
value were observed even with the large benzyl group (5-fold increase),
Table 3.3. Inhibition of avian P4H by pyridine-2,5-dicarboxylate and its derivatives. A) Variations of the distance between the C-5 carboxylic acid binding site and pyridine. B) The replacement of C-5 with acyl sulfonamides24

132
suggesting the distal binding of the C-5 carboxyl group is flexible and allows
various chain lengths to inhibit P4H. When the C-5 carboxyl group was
replaced with several different acyl sulfonamides, an increase in potency was
observed for most of the compounds tested (Figure 3.2B). The IC50 for the
alkyl (10,11) or aryl (12,13) sulfonamide derivatives all had similar IC50
values; however very large substitutions of 2-(4,5-dibromothienyl) (14) and
4,7-dichloro-2-p-tolylquinoline (15) increased IC50 values to 8.5 and 6.6 µM
respectively. When the 2-carboxyl group was replaced with acyl sulfonamide,
the IC50 value went up to 500 µM. The substitution on the C-5 position of the
pyridine 2,5-dicarboxylic acid is flexible and will allow for bulky phenyl groups
without much effect on the inhibition; however modifications on the C-2
carboxyl group affect its ability to bind to iron. The pyridine-2,4-dicaroxylic
acid compounds inhibit the activity of P4H by mimicking the binding of 2-
oxoglutarate and preventing oxidative decarboxylation.24 Results also
suggest that the presence of carboxyl group at the 5 position effects the
potency. Substituents at the 5 position do not influence the potency and
suggests a large range of possible derivatives at the 5 position.24
3.1.5.3. Phenanthroline Derivatives
Another type of inhibitor that mimics the binding of 2-oxoglutarate is a
series of phenanthroline derivatives.25 These phenanthroline compounds
have been tested against isolated P4H and human foreskin fibroblast (HFF)
cells for inhibition of collagen production (Table 3.4). The structures of the

133
positions in Table 3.3. An increased potency against isolated enzyme was
observed in the phenanthroline derivatives with carboxylic acid groups at the
R3 and R4 positions (16), as compared to derivatives with a single carboxyl
group (17,18). The increase may be due to the interaction of residues Lys493
and His501 with the inhibitor, as found to stabilize 2-oxoglutarate and N-
oxalylglycine. The most potent inhibitor against isolated P4H contained a
nitro group at the R3 position and carboxylic acid at the R4 position (19).
However, as seen in previous studies,23,24 inhibition of isolated enzyme may
not translate into potency with in vitro and in vivo studies. When the
dicarboxylic acid derivative (16) was tested against HFF cells, it had a notable
increase in IC50 (>20 µM), as did the nitro/carboxylic acid derivative
(R3=NO2, R4=CO2H) (19) (value not determined). When the carboxyl group
was replaced with a more lipophilic N-alkylamide group phenanthrolinone
derivatives are given with modifications at the R3 and R4 (20), improved IC50
values were observed within HFF cells (2.3 µM). The best phenanthrolinone
derivative against cells was the R3=NO2 (21) which had an observed IC50
value of 0.12 µM against chick-tendon cells (not shown) and 1.1 µM against
HFF cells. Unfortunately, this compound was too insoluble for use for in vivo
studies. Instead (R3=CO2H) (18) and (R3=CO2H, R4=CONEtBu) (20)
derivatives were both tested in vivo for inhibition of collagen production in
rats. Both compounds exhibited similar inhibition of collagen production, with
maximal inhibition observed within the first two hours and sustained over the

134
Table 3.4. Inhibition of isolated P4H and HFF cells by phenanthrolinones derivatives.25
next six hours until collagen production returned to normal after 22 hours.
This demonstrates how unprocessed collagen remaining in the ER until active
P4H returns. With an oral dose (50mg/kg) given to rats, the phenanthroline
derivative, collagen production was reduced, but it was not located in a
specific region, as the uterus, ear and tail all experienced a similar reduction
of collagen production. The low levels of toxicity and the in vivo and in vitro
studies that have performed on the phenanthroline derivatives make these
compounds a possible candidate for treating fibrosis.

135
3.1.6. Targeting the Endoplasmic Reticulum with the KDEL Receptor
Phenanthroline does not have any selectivity towards P4H, as it chelates any
source of iron in the environment. One possible means of selectively
targeting P4H would be drugs containing organelle-specific retention signal
peptides. As mentioned previously, the hydroxylation of collagen by P4H
occurs in the ER and is vital for the stability of collagen. Signal peptides are
important for sorting and directing post-translational transport of proteins.
The destination of proteins with a specific signal peptide can range from the
nucleus, peroxisomes, ER, the trans-Gogli network, or secretion to the
extracellular matrix. The human retention signal peptide for ER consists of
four amino acids, lysine, aspartic acid, glutamic acid, and leucine (KDEL).26,27
This KDEL tag is located at the C-terminus of the β-subunit of P4H and
retains the protein within the ER. The mechanism of retrieval of the KDEL-
signal peptide secreted proteins is the binding of the tetrapeptide sequence to
the KDEL receptor located in the Gogli apparatus (Figure 3.2).28,29 The KDEL
receptor is a 26-kDa membrane-bound protein. Based on site-directed
mutagenesis this protein has four known amino acids that are essential for
the binding of substrate.30,31 Arg5, Asp50, Tyr162, and Asn165 are all
involved in the formation of a hydrophilic binding pocket that binds KDEL
ligands. Mutation of these residues demonstrated decreased binding of
KDEL substrates with no difference in expression with respect to wild type.30
Various sizes of substrates were used with the bulkier reagent biotin

136
maleimide, demonstrating a greater decrease in binding in Tyr162 and
Asn165 as compared to Arg5 and Asp50.30 This indicates Tyr162 and
Asn165 are less accessible, and the locations of these residues are deeper
inside the hydrophilic binding pocket. The binding of the KDEL-tagged
proteins may also be pH-dependent. The KDEL receptor showed the highest
binding affinity at pH 5.0, which suggests the importance of pH in substrate
binding to the KDEL receptor.32 The ER is believed to have a pH similar to the
cytosol (pH 7.4), while the cis-Golgi and the trans-Golgi have a pH of 6.4 and
5.8, respectively.32 The idea is, the KDEL tag of the secreted protein will bind
Figure 3.3. Mechanism of retrieval of the KDEL-signal peptide secreted proteins is the binding of the tetrapeptide sequence to the KDEL receptor located in the Gogli apparatus28

137
to the receptor located on the trans-Golgi due to the low pH and be
transferred to the ER, while at higher pH (7.4) the KDEL tagged protein will be
released back into the ER.32 pH alone may not account for KDEL binding, but
it is one factor in substrate binding, as it binds the trans-Golgi receptor under
acidic conditions before transporting to the ER and releasing the substrate at
pH 7.4 within the ER.30,32 This mode of substrate retention within a specific
organelle could aid in drug design, as the retention signal will provide the
ability to target enzymes located inside these organelles.
3.1.7. BODIPY581/591 Targeting the Endoplasmic Reticulum.
The concept of directing small molecules to organelles using a peptide
retention signal was demonstrated by using signal peptide labeled
BODIPY581/591 compound.33 This fluorophore was covalently linked to several
different retention signals and the uptake was observed through fluorescence
microscopy.33 The retention signals observed includes AKL for the
peroxisome,33 KKKRK for the nucleus,33 and KDEL for the ER.33 The uptake
of the retention signal was very rapid, occurring in less then 1 minute, with
complete localization after 16 minutes. The process of targeting the ER was
confirmed with a co-localization study of the known ER maker concanavalin
A. Targeting the ER with cell permeability small molecules could potentially
be used in therapeutic drug delivery by targeting enzymes specific to the ER.
3.1.8. Literature Examples of Retention Signals Involved in Drug Design
3.1.8.1. HIV-1 Nuclear Import

138
Drug delivery based on these specific recognition signals has gained
much attention. Two major advantages are as follows: a) localization of the
drug at the same site as the protein it inhibits or b) blocking the protein from
interacting with its specific retention signal receptor and therefore preventing
the protein from reaching the proper organelle. The latter process could be
very useful in anti-HIV therapy, as drugs could be designed to target the
nuclear transport of mRNA.34 The nucleus contains a selectively-permeable
envelope for active transport of nuclear specific proteins by the nuclear
localization signals (NLS). The first peptide sequence identified for the
selective nuclear localization is a basic stretch of amino acids (KKKRK).35,36
The search for effective HIV drugs rapidly changes due to the process of HIV-
1 reverse transcriptase replication, which allows for continuous mutations
within its environment. A possible solution is inhibition of the viral integration
and transcription that occurs within the nucleus by drugs that target the
NLS.37 Arylene bis (methylketones) are small molecule inhibitors of nuclear
import and have been shown to reduce HIV-1 replication in primary
macrophages and peripheral blood mononuclear cell cultures.38,39 This has
the potential to stop viral integration and transcription by inhibiting the uptake
of the pre-integration complex by nuclear import. Also, simian
immunodeficiency virus in macaques has been used as a model for HIV.40
Studies show that the antibodies produced by the macaques prevent import
of the virus into the nuclear membrane.42,43 This process is still being studied,

139
but it demonstrates the potential for targeting the selective nuclear import,
which could be used in anti-HIV therapy.
3.1.8.2. Screening for Protease Inhibitors
Recognition signal peptides are also currently used for the
identification of inhibitors of trans-Golgi network (TGN) bound proteases.41
Proteases found in the TGN are involved in proteolytic processes of recently
formed protein secreted from the ER.42 These TGN proteases recognize and
cleave specific domains of proteins before the cleaved proteins enter
secretory vesicles and are sent out into the cytoplasm.43 Two families of TGN
proteases include prohormone convertase43 and β-site amyloid precursor
protein-cleaving enzyme.44 These proteases contribute to the development of
various diseases, including: Alzheimer’s disease, arthritis, propagation of
viruses, and proliferation of cancerous tumors.48-50 An assay to screen
protease inhibitors was developed for the quantification of protease activity.
The significance of this assay was the recombinant expression of a reporter
containing the TGN retention signal (SDYQRL) and a protease cleavage
sequence with alkaline phosphatase tag. The chimeric reporter was localized
in the TGN by the retention signal, then protease activity was monitored by
the cleavage of the reporter and secretion of the alkaline phosphatase tag
into the extracellular media. This assay has been used to screen nearly
39,000 compounds for inhibition of the protease furin, which is involved in
tumerigenesis, viral propagation of avian influenza, ebola and HIV, and

140
activation of anthrax. The protease involved in BACE cleavage, which leads
to Alzheimer’s disease, was also screened to identify potential inhibitors. The
use of the TGN retention signal allows for a real-time and noninvasive assay
of protease activity, which until to now has been difficult with the low pH and
high Ca2+ environment of the TGN.
3.1.8.3. Gene Therapy
The replacement of a defective human gene or the introduction of new
genes is known as gene therapy. Interest in gene therapy has increased in
recent years.46 One of the major barriers to the incorporation of exogenous
DNA is transportation through the extracellular matrix, the cell membrane,
and the nuclear envelope. One common solution to this problem has been
using viral machinery to transfer genetic information into the nucleus.
However, the linkage of a nuclear retention signal to therapeutic DNA could
provide a nonviral approach to gene therapy.51 DNA entry into the cell would
be enhanced by antibodies on the therapeutic gene that are specific to the
cell membrane or amphiphilic peptides. The final entry step, into the
nucleus, would be accomplished through utilization of the NLS. DNA injected
directly into the nucleus resulted in 50-100% transfection.45 When DNA was
injected directly into the cytoplasm, however, no transfection occurred,
displaying the selectively impermeable nature of the nuclear envelope. To
cross the nuclear barrier, DNA was attached to synthetic NLS peptides mostly
consisting of PKKKRKV retention sequence.46,47 The NLS could be linked to

141
DNA through a covalent linkage or noncovalent electrostatic interactions of
the cationic residues in the NLS with the negatively charged DNA. Unnatural
peptide backbones, known as peptide nucleic acids, also have advantages in
a sequence-specific nuclear retention site. A 150-fold increase in expression
was observed with a 3.4-kb linear fragment covalently linked to NLS-
containing peptides.47 Increased expression was also seen in plasmid DNA
noncovalently linked to NLS; a 10-fold increase of β-galactosidase reporter
gene expression was observed when noncovalently linked to NLS.50 Peptide
retention sequences used in assay development and in gene therapy display
the emerging therapeutic possibilities of signal recognition peptides.
3.1.9. Phenanthroline Derivate Targeting the ER for the Inhibition of
Collagen.
With the damaging effects of fibrosis reaching many people, an
effective treatment for this disease is critical. A treatment may be possible
with new techniques in drug design. Early reports describe the possible drug
targets that mimic 2-oxoglutarate binding to FeII.23-25 Many of these drugs
have IC50 values in the lower µM concentration, even in in vitro and in vivo
studies. These inhibitors demonstrate the importance of drug design and
considering cellular aspects of drug delivery; as many potent inhibitors were
not lipophilic enough to cross the cell membrane. This chapter describes the
synthesis and in vitro study of a phenanthroline derivative for the targeting the
endoplasmic reticulum for inhibition of collagen production by P4H. The

142
phenanthroline derivatives were coupled to the ER retention signal KDEL with
the hope of targeting within the ER. The phenanthroline derivatives were
promising as potential inhibitors for several reasons:
1) Both in vitro and in vivo studies have been performed with no toxic
effects.25
2) Modifications to both the C2 and C5 positions are known in the
literature, allowing phenanthroline to be coupled to the retention
peptide signal relatively easily.48-50
3) Hydrophobic aromatic rings on phenanthroline increase ability to
cross the cell membrane.25
This chapter also describes various collagen assays performed to optimize
the collagen production screening process.
3.2. Materials and Methods
Reagents involved with synthesis were purchased from Sigma-Aldrich
(Milwaukee, WI) or Fisher Scientific (Pittsburgh, PA) unless otherwise stated.
All amino acids and resin were purchased from Novabiochem (Gibbstown,
NJ) with the exception of Fmoc-Glu-OH, which was purchased from AnaSpec
(San Jose, CA).
3.2.1. Synthesis of 1,10-phenanthroline-1-oxide
Synthesis of 1,10-phenanthroline-1-oxide followed the published
procedure with minor modifications.51 1,10-phenanthroline monohydrate
(25.0 g, 0.125 mol) was dissolved into 40 mL of glacial acetic acid. 15 mL of

143
30% hydrogen peroxide was added dropwise and stirred for 3 hours at a
temperature of 72 oC. After the initial 3 hours, an additional 15 mL of 30%
hydrogen peroxide was added dropwise and the reaction was stirred for 3
more hours. The solution was removed from the heat, 15 mL of 30%
hydrogen peroxide was added, and the solution was allowed to stir for 18
hours. The solution was neutralized to pH ~ 10 with saturated potassium
hydroxide. The product was extracted with several portions of chloroform and
dried with anhydrous sodium sulfate. Solvent was removed under reduced
pressure to give a tan solid of 15 g. (60% yield) 1H NMR (δ/ppm, in CDCl3):
7.75 (m, 2H), 7.85 (m, 2H), 7.98 (m, 1H), 8.31 (m, 2H), 8.4 (d 1H), 9.32 (m,
2H). 13C NMR (δ/ppm, in CDCl3): 117.46, 124.20, 125.77, 126.34, 129.26,
129.85, 133.51, 136.35, 137.30, 145.36, 146.77, 151.31. ESI-MS: m/z =
197.1 (MH+).
3.2.2. Synthesis of 2-Cyano-1,10-Phenanthroline
Synthesis of 2-cyano-1,10-phenanthroline followed the published
procedure with minor modifications.56 1,10-phenanthroline-1-oxide (2.7 g,
13.4 mmol) and potassium cyanide (2.7 g) were dissolved in 50 mL of water.
Benzoyl chloride (3.76 g, 3.1 mL) was added dropwise via addition funnel,
and the reaction stirred for 2 hours. During that time, a brown precipitate
formed in solution. At the completion of 2 hours, the precipitate was collected
by suction filtration and dried to yield brown solid (1.5 g, 56% yield). 1H NMR
(δ/ppm, in CDCl3): 7.67 (m, 1H), 7.77 (m, 1H), 7.89 (d, 2H), 8.24 (m, 1H), 8.34

144
(d 1H), 9.21 (d, 1H). 13C NMR (δ/ppm, in CDCl3): 117.33, 124.16, 125.71,
126.24, 129.21, 129.86, 133.37, 136.45, 137.29, 145.18, 146.49, 151.18. ESI-
MS: m/z = 206.1 (MH+).
3.2.3. Synthesis of 2-Carboxy-1,10-Phenanthroline
Synthesis of 2-carboxy-1,10-phenanthroline followed the published
procedure with minor modifications.51 2-cyano-1,10-phenanthroline (2.63 g,
1.28 mmol) was dissolved in 15 mL of 95% ethanol, while sodium hydroxide
(2.10 g) was dissolved in 15 mL of water. The sodium hydroxide solution was
added to the 2-cyano-1,10-phenanthroline solution, and it was allowed to
reflux for 2 hours. The ethanol was removed under reduced pressure, and
the solution was made acidic with concentrated HCl solution, forming a brown
precipitate. The brown solid was filtered and dried to yield 1.7 g of the
desired product (65% yield). 1H NMR (δ/ppm, in CDCl3): 7.76 (m, 1H), 7.86
(m, 1H), 8.37 (m, 2H), 8.02 (t, 2H), 8.34 (d, 1H), 8.45 (d 1H), 9.31 (d, 1H).
13C NMR (δ/ppm, in CDCl3): 124.33, 124.97, 127.94, 128.30, 129.43, 130.57,
138.86, 142.55, 146.87, 147.72, 165.58. ESI-MS: m/z = 225.1 (MH+).
3.2.4. Synthesis of Peptide Inhibitor 1,10-Phenanthroline-2-Glycine-
Lysine-Aspartic Acid-Glutamic-Acid-Leucine (Phen-2-GKDEL)
All of the described peptide syntheses were performed with a
ChemGlass peptide synthesizer (Vineland, N.J.). All peptide synthesis
reactions were performed using the following procedure (Scheme 3-1). Wang
resin (0.25 mmol) was added to the peptide synthesizer and swelled with 4

145
mL dimethylformamide (DMF) by continuously bubbling air through the fritted
filter. DMF was removed and, in order to remove the Fmoc protecting group
from the resin, 20% piperidine in DMF (4 mL) was added to the resin and
stirred by bubbling for 30 min. Following deprotection, the solution was
removed and the resin was washed by bubbling with several portions of DMF.
Following DMF removal, 4 equivalents of Fmoc-protected amino acid (1
mmol) were added along with 4 equivalents of the activator O-Benzotriazole-
N,N,N’,N’-tetramethyl-uronium-hexafluoro-phosphate
(HBTU) (1 mmol), and dissolved in 4 mL of 8% N,N-diisopropylethylamine
(DIPEA) in DMF. The Fmoc-protected amino acid was stirred by bubbling air
through the fritted filter for 1 hour. After the amino acid was coupled to the
resin, the solution was removed, and the resin was washed and stirred with
several portions of DMF. 20% Piperidine in DMF (4 mL) was added to
deprotect the Fmoc group of the last amino acid coupled on the resin. The
procedure was repeated until the desired peptide chain was complete. The
P4H inhibitor 2-carboxyl-1,10-phenanthroline was coupled to the N-terminus
of the peptide resin using the same coupling technique. The resin was dried,
and peptides were cleaved from resin with 10 mL of 95/5% trifluoroaceatic
acid (TFA) in water. Cleavage conditions also removed protecting groups
from any side chains present. The TFA solution was removed with a gentle
flow of air, leaving a yellow oil product. Cold diethyl ether was added to
precipitate the peptide as an off-white solid. The crude product was purified

146
by HPLC (Shimadzu) on a Jupiter 4-Proteo prep column (Phenomenex) with
average yield of pure peptide of 30 -40 %. HPLC solvents were eluent A, 0.1
% TFA-H2O and eluent B, 0.1 % TFA- CH3CN with gradient conditions of 5 to
35 % B over 60 min.
The three step synthesis of the 2-carboxyl-1,10-phenanthroline from
1,10-phenanthroline was accomplished. Each step of this synthesis had
moderate to good yields of 40 – 80 %, and was confirmed with NMR and ESI
mass spectrometry. Standard peptide synthesis techniques allowed for easy
coupling to the peptide on Wang resin. The peptide retention signal was
synthesized on solid support, building from the C terminus to the N terminus
(Scheme 3-1). This process began with the deprotection of the Wang resin
with 20 % piperdine in DMF, followed by the addition of the first amino acid.
Each amino acid was then deprotected with 20 % piperdine in DMF before
the subsequent addition of the next amino acid. 2-Carboxy-phenanthroline
was coupled on the N-terminus and the peptide chain and protecting groups
(OtBu and Mtt) were cleaved from the resin with 95/5 % TFA/H2O. Dipsi 2-D
NMR (δ/ppm, DMSO-d6): glycine C-2 1H, 4.13, 4.27, leucine C-2 1H, 4.17,
lysine C-2 1H, 4.26, glutamic acid C-2 1H, 4.33, aspartic acid C-2 1H, 4.58.
3.2.5. Fluorescence Detection of 1,10-Phenanthroline-2-Glutamic acid-γ-
[2-(1-sulfonylnaphthyl)aminoethylamide]-Valine-Lysine-Aspartic Acid-
Glutamic-Acid-Leucine {Phen-2-E(EDANS)VKDEL} in ER

147
HFF cells were grown to 60 % confluency in Nunc Lab Tek chambered
cover glass 8 well plates (Fisher) with 0.3 mL of Iscove’s Modified Dulbecco’s
Medium (IMDM) with heat-inactivated fetal bovine serum (FBS), 100 units/mL
of penicillin and 50 µg/mL of streptomycin at 37 oC in an incubator containing
an atmosphere of air/CO2 (95:5). The media was replaced with 0.3 mL of
potassium buffered saline (PBS) buffer pH 7.4, at 37 oC for 30 min preceding
the experiment. During the experiment, cells were placed in temperature
controlled confocal microscope chamber set at 37 oC in the atmosphere of
air/CO2 (95:5). The PBS was removed, and 0.3 mL of fresh PBS containing
20 µg/ml of phen-E(EDANS)VKDEL was added and incubated for 20 min.
The fluorescence peptide probe solution was then removed, and the cells
were washed with 0.3 mL of PBS and imaged on the confocal microscope.
The cells were washed for a second time with 0.3 mL PBS before being
treated with 1 µM of ER Tracker Red (Invitrogen) in PBS and imaged on the
confocal microscope. Fluorescence imaging was performed at the
microscopy and analytical imaging lab at the University of Kansas on an
inverted laser scanning microscope with Olympus/3I spinning disk
confocal/TIRF inverted microscope. The two-channel fluorescence
excitation/emission ratio for the fluorescence labeled inhibitor was 341
nm/471 nm, and the ER Tracker Red excitation/emission was 587 nm/615
nm. Co-localization analysis studies were performed with the fluorescence
probe and the ER tracker to confirm the localization of the peptide probe into

148
the ER. The co-location study was performed using the Image J51 JACoP52
plug-in with the following equations:
rP= (Si ((Ai-a)x(Bi-b)))/…(Si (Ai-a)²x Si (Bi-b)²)
Equation 3.1 Pearson's coefficient52
r= (Si (AixBi))/…(Si (Ai-a)²x Si (Bi-b)²)
Equation 3.2 Overlap coefficient52
r²=k1xk2 with k1= (Si (AixBi))/ (Si (Ai)²) & k2= (Si (AixBi))/ (Si (Bi)²)
Equation 3.3 k1 and k2 coefficients52
k1= (Si (Ai, coloc))/ (Si Ai) & k2= (Si (Bi, coloc))/ (Si Bi)
With Ai, coloc being Ai if Bi>0 and 0 if Bi=0; and Bi, coloc being Bi if Ai>0 and 0 if
Ai=0
Equation 3.4 M1 & M2 coefficient52
3.2.6. Expression and Purification of Recombinant Human–P4H
Plasmid pBAD+ containing the human-p4h gene (cDNA of human P4H
a(I) subunit (UltimateTM ORF clone IOH26865, Invitrogen) was transformed
into origami DE3 cells (Novagen). Cells were inoculated into 1.5 L Luria-
Bertani (LB) media with 150 mg ampicillin and grown to an O.D.600 < 0.2 at 37
oC with agitation at 225 rpm. At O.D.600 < 0.2, isopropyl-1-thio-β-D-

149
galactopyranoside (IPTG) was added to a final concentration of 0.1 mM for
the induction of PDI. The temperature was reduced to 25 oC, and cell growth
was continued to O.D.600 = 0.6. This point, arabinose was added to a final
concentration of 0.02 mM for the induction of catalytic α-subunit of P4H.
Temperature was reduced to 20 oC cultures were allowed to grow overnight.
The cells were harvested by centrifugation (Beckman) at 4 oC and 6 000 x g
for 30 min and resuspended in a buffer (10 mM Tris, 100 mM glycine, and
100 mM sodium chloride, pH 7.8). Cell lysis was performed in an ice bath by
20 cycles of ultrasonication where each 20 cycle consists of 0.8 second
pulses with 0.5 second gaps in between. The solution was allowed to cool for
5 minutes between each cycle. Cell debris was removed by centrifugation
(Beckman) at 40,000 x g for 30 min. The supernatant was collected and
loaded on poly-L-proline affinity column53 and washed with 3 column volumes
of buffer (10 mM Tris, 100 mM glycine, 100 mM sodium chloride pH 7.8).
Protein was eluted from the column with the elution buffer (5 mg/mL poly –L-
proline, 10 mM Tris, 100 mM glycine, 100 mM sodium chloride, pH 7.8).
Fractions were collected and dialyzed with 3 batches of 4 L buffer (25 mM
sodium phosphate, 10 mM glycine, 50 mM sodium chloride, pH 7.8) first
every 2 hours and then overnight. Protein was loaded on a HiTrap QFF anion
exchange column (Amersham Biosciences), and washed three column
volumes of binding buffer (25 mM sodium phosphate, 10 mM glycine, 50 mM
sodium chloride, pH 7.8) then eluted with a linear gradient (50 mM NaCl to

150
430 mM NaCl) on an FLPC (Amersham Biosciences) . Fractions were
collected, concentrated to 1 mL and loaded on the FPLC size exclusion
column Hiload 16/60 Superdex 200 pg (Amersham Biosciences) and eluted
with buffer (10 mM Tris, 100 glycine, 100 mM NaCl, pH 7.8). Protein purity
was confirmed with SDS-PAGE, and concentration was determined using
bicinchoninic acid (BCA) assay.54
3.2.7. Preparation of (GPP)10
(GPP)10 was prepared using a thioredoxin fusion protein previously
expressed in the Limburg lab. Cleavage of thioredoxin from the fusion protein
was performed by adding 1 µL of enterokinase (Invitrogen) to 1 mL of 12
mg/mL of protein and incubating at 37oC (overnight). The cleaved protein
was purified by size exclusion chromatography Hiload 16/60 Superdex 200 pg
in 6 M urea. Urea was removed using a HiTrap desalting column (Amersham
Biosciences). Fractions were collected and protein concentration was
determined by the absorbance at 280 nm (ε = 5.5 mM-1cm-1).
3.2.8. Enzyme Activity Assay with Oxygen Electrode
The activity of the recombinant P4H was assayed with an Oxygraph
oxygen electrode (Hansatech Instruments). The electrode is a Clark type
polarographic oxygen sensor. The electrode is fitted at the bottom of the
reaction vesicle, which was covered with a thin oxygen permeable
polytetrafluoroethylene (PTFE) membrane. A polarizing voltage is applied

151
between the central platinum cathode and silver anode electrode. A small
current is generated as oxygen diffuses across the membrane.
The inhibitors were dissolved in dimethylsulfoxide (DMSO), and when
inhibitor was added to the enzyme/substrate mixture, the final DMSO
concentration was ~ 0.2 %. Reaction conditions are 50 mM Tris, 750 µM
ascorbate, 10 µM of FeII, 20 µM of GPP10, and 0.2 µM of P4H, to a final
volume of 500 µL. Concentration ranging from 5 - 60 µM phenanthroline and
100 – 5000 µM phen-2-GKDEL were added. Reaction rate was determined
by the consumption of O2, and plotted as rate of O2 consumption versus the
log of inhibitor concentration. The IC50 was determined with the following
equation:
y = Vmin + (Vmax – Vmin)/(1 + 10^(x-IC50))
with x being inhibitor concentration
Equation 3-5 IC50 curve55
3.2.9. Quantification of Collagen Production from Soluble Collagen in
Media
The hydroxylation of collagen was measured by the production of
soluble collagen in the media of HFF cells. HFF cells (ATCC) were grown to
confluency in 15 cm2 flasks in IMDM media (ATCC) with 10% FBS (Gibco),
100 units/mL of penicillin and 50 µg/mL of streptomycin, at 37 oC in an
incubator containing an atmosphere of air/CO2 (95:5). At the point of full
confluency, the media was removed and cells were incubated for 24 hours

152
with serum free medium (1 mL), 30 µg/mL ascorbate, penicillin, and
streptomycin. Following incubation, the medium was again removed and
replaced with fresh serum free media with ascorbate, penicillin, streptomycin
for another 24 hour incubation. At this point, inhibitors, which were dissolved
in DMSO, were added to the media. After 48 hours, the media was removed
and diluted with binding buffer (0.1 M NaHCO3, pH 10.0) and 100 µL of this
solution was incubated in an ELISA plate (4 HBX Immunlon Plates, Thermo
Scientific) overnight at 4 oC. Solution was removed, and the wells were
washed three times with PBS buffer. 200 µL of 2% Blocker BSA (Pierce) in
PBS buffer, pH 7.2, was added and incubated at room temperature for 1 hour.
The wells were washed three times with 200 µL PBS. 100 µL of a 1:5000
dilution of mouse anti-collagen type I monoclonal primary antibody,
unconjugated (abcam) was added to each well and incubated at room
temperature for 30 minutes. The antibody was then removed and washed
three times with 200 µL of PBS. Secondary antibody, donkey anti-mouse
conjugated horseradish-peroxidase (Jackson ImmunoResearch), was added
in a 1:1000 dilution in PBS, and 100 µL was added to each well and
incubated for 30 minutes at room temperature. The secondary antibody was
removed and the wells were washed with 200 µL PBS. The plate was
developed with 100 µL of 1 mM 2,2'-azino-bis(3-ethylbenzthiazoline-6-
sulphonic acid (ABTS) in citrate-phosphate buffer, pH 4.2, with 0.03% H2O2

153
monitoring at 415 nm absorbance on SpectraMax Plus plate reader
(Molecular Devices).
3.2.10. Sircol Detection of Collagen Production
Detection of collagen by Sircol (Biocolor) followed the same cellular
preparation procedure as the detection of collagen production with pepsin
digest. After centrifugation of the 2M NaCl precipitated collagen, the
supernatant discarded and 1 mL of sirius red dye was added to each tube.
The tubes were capped and gently mixed at room temperature for 30 min.
The tubes were centrifuged at 10,000 x g for 10 minutes to form a collagen-
dyed pellet. After centrifugation, the supernatant was discarded, and the
pellet was washed with 500 µL of 200 proof ethanol. Bound dye was
recovered with the addition of 1.0 mL of the Alkali reagent (Sircol). Samples
were capped and mixed by vortex until all of the dye was solublized. 100 µL
samples were plated on a 96 well plate and observed on SpectraMax Plus
plate reader (Molecular Devices) at 540 nm.
3.2.11. Detection of Collagen in Extracellular Matrix of HFF cells with
Polyclonal Antibodies Against Human Collagen Type I
The hydroxylation of collagen was measured by the production of
collagen in the extracellular matrix of HFF cells. HFF cells were grown to
95% confluency in a 6 well plate in IMDM media with 10% fetal-bovine serum,
100 units/mL of penicillin and 50 µg/mL of streptomycin, at 37 oC in an
incubator at the atmosphere of air/CO2 (95:5). At the point of full confluency,

154
the media was removed, and cells were incubated for 24 hours in serum free
medium (1 mL), 30 µg/mL ascorbate, penicillin, and streptomycin. Following
incubation, the medium was again removed and replaced with fresh serum
free media with ascorbate, penicillin, and streptomycin for another 24 hour
incubation. At this point, inhibitors dissolved in DMSO were added to the
media. After 48 hours, the media was removed and replaced with 5 mg/mL
pepsin from porcine gastric mucosa (Fisher) in 0.05 M acetic acid, pH 2.8.
The cells were harvested by scraping cells and transferred into 1 mL
eppendorf tubes with the pepsin solution and rocked overnight at 4 oC. The
eppendorf tubes were centrifuged at 10,000 x g for 10 minutes (Eppendorf
Centrifuge) to remove insoluble cell debris, and the supernatant was isolated.
The soluble collagen in the supernatant was precipitated with 2 M NaCl and
centrifuged at 10,000 x g for 10 min. The supernatant was discarded and the
soluble collagen was redissolved in 100 µL of 0.05 M acetic acid and coated
in ELISA plate (4 HBX Immunlon Plates, Thermo Scientific) and incubated
overnight at 4 oC. Solution was removed and washed three times with PBS
solution before 200 µL of 2% Blocker BSA (Pierce) in PBS buffer, pH 7.2, was
added and incubated at room temperature for 1 hour. The wells were washed
three times with 200 µl PBS. 100 µL of a 1:5000 dilution of mouse anti-
collagen type I monoclonal primary antibody, unconjugated (abcam) was
added to each well and incubated at room temperature for 30 minutes. The
antibody was then removed and the wells were washed three times with 200

155
µL PBS. 100 µL of the secondary antibody, donkey anti-mouse conjugated
horseradish-peroxidase (Jackson ImmunoResearch), in a 1:1000 dilution in
PBS, was added to each well and incubated for 30 minutes at room
temperature. The secondary antibody was removed and the wells were
washed with 200 µL PBS. The plate was developed with 100 µL of 1 mM
2,2'-azino-bis(3-ethylbenzthiazoline-6-sulphonic acid (ABTS) in citrate-
phosphate buffer, pH 4.2, with 0.03% H2O2 at 415 nm on SpectraMax Plus
plate reader (Molecular Devices).
3.3. Results
3.3.1 Synthesis of Inhibitors Containing the Fe-chelator Coupled to an
ER-Retention Signal Peptide as Potential in vivo P4H Inhibitors
Two agents useful in exploration of selective in vivo inhibition of human-
P4H were prepared by the method of Scheme 3.1. Their structures are
shown in Figure 3.4A (phen-2-GKDEL) and Figure 3.4B (The fluorescent
agent phen-2-E(EDANS)VKDEL). Each agent combines a chelating moiety,
capable of inhibiting P4H by removal of essential FeII, combined with a signal-
peptide moiety, capable of localizing the agents (and thus the inhibition) to the
ER where P4H is located. In addition phen-2-E(EDANS)VKDEL contains a
fluorescent moiety capable of visualization of the intracellular localization of
the agents. Both were obtained in 99 % pure form with a final yield of 30 %.
The peptide sequences in both inhibitors were confirmed with 2-D NMR and
ESI mass spectrometry (Figure 3.5,6).

156
Scheme 3.1. The solid phase synthesis of the GKDEL retention signal. Each amino acid is coupled onto the Wang resin, building C-terminus to N-terminus.

157
Figure 3.4. A) Phen-2-GKDEL B)Phen-2-E(EDANS)VKDEL

158
Figure 3.5. Dipsi spectrum of phen-2-GKDEL on Bruker 500 MHz NMR

159
Figure 3.6. Dipsi spectrum of phen-2-E(EDANS)VKDEL on Bruker 500 MHz NMR

160
3.3.2. Phen-2-VD(EDANS)KDEL Localizes in the ER of HFF Cells
To observe the localization of the KDEL-labelled inhibitor into the ER of
HFF cells, the EDANS fluorophore (AnaSpec)56 was coupled on to the
peptide chain, phen-2-E(EDANS)VKDEL. Localization of the KDEL
fluorophore was confirmed with commercially available ER tracker. This cell-
permeable agent utilizes two components, BODIPY fluorescent dye and
glibenclamide. The agent is visualized by BODIPY fluorescent dye and
localizes in the ER by glibenclamide. Glibenclamide is known to bind to the
sulphonylurea receptors of ATP-sensitive K+ channels which are prominent
on ER.57 Careful consideration was taken towards the overlap of excitation
and emission spectra to avoid bleed through. The excitation and emission for
E(EDANS) is λex = 341 and λex = 471,58 while the excitation and emission for
ER tracker red (Molecular Probes) is λex = 587 and λex = 615.
At first, the fluorescence labelled inhibitor was distributed throughout
the cell, but after 20 minute incubation and wash with PBS, the inhibitor was
localized within the ER (Figure 3.7A). The co-localization and
compartmentalization within the ER were confirmed with ER tracker Red
(Figure 3.7B). ER tracker Red was immediately taken up within the ER.
Analysis of subcellular co-localization was performed with Image J51 plug-in
JACoP52 to confirm the import of fluorescence-labelled inhibitor into the ER
(Table 3.5). Pearson’s coefficient measures the dependency of pixels in a
linear expression of the intensities of two images on each other.52 The range

161
of this value is centralized from 1 to -1, with complete positive correlation at 1,
negative correlation is at -1 and no correlation at 0.52 The linear
approximation of the two fluorophores and the goodness of fit were
determined by JACoP with a Pearson’s coefficient of 0.85.52 The Pearson’s
coefficient demonstrates good co-localization of the inhibitor fluorophore and
the ER tracker. The overlap coefficient is calculated with Pearson’s
coefficient and the average intensities of both fluorophores. The overlap
coefficient of 0.944 confirms good co-localization
A) B)
Figure 3.7. Fluorescence imaging of HFF incubated with A) phen-E(EDANS)VKDEL B) ER tracker.

162
Pearson’s coefficient 85%
overlap coefficient 94.4%
k1 intensity of ER tracker Red 4.337
K2 intensity of phen-2-E(EDANS)VKDEL
0.228
Table 3.5. Quantitative analysis of the co-localization of ER tracker Red and phen-2-E(EDANS)VKDEL as performed with Image J51 plugin JACoP52
of both fluorophores. k1 and k2 are two components that are included in the
overlap coefficient and are related to the total intensity of each fluorophore.52
The intensity of ER tracker was approximately 20 times more intense than the
inhibitor, with a k1 value of 4.337 versus a k2 value of 0.228. Co-localization
and intensity correlation analysis (ICA) was performed (Figure 3.8) which
helps for an interpretable representation of co-localization to determined
coincidental events with two different dyes.52 The x-value of the graph is
dependent on covariance of both fluorophores, while the y-value signifies the
intensities of the independent channel.52 The spread of the dots on the left
side of the are due to non-colocalization while the pixel clouds on the right
side of the graph indicate partial co-localization. The “c” shape curves of both
graphs indicate good co-localization of each fluorophore.52 Phen-2-

163
A) B)
Figure 3.8. Co-localization and intensity correlation analysis of A) phen-E(EDANS)VKDEL and B) ER Tracker
E(EDANS)VKDEL and ER tracker colocalization studies were performed to
prove that the inhibitor with the KDEL tag was being localized within the ER.
3.3.3. Phen-2-GKDEL demonstrates an IC50 value of 3.5 mM Inhibition
Against Recombinant Human-P4H
IC50 values for phen-2-GKDEL were measured against our
recombinant human-P4H. The recombinant P4H was produced to a yield of
1.0 mg/L, and its activity was determined to be the same as native P4H with a
Clark oxygen electrode. SDS-PAGE confirmed the purity with a band at 77
kDa as is seen and the IC50 was determined by the following Equation 3.5.

164
Figure 3.9. IC50 curve of phen-GKDE inhibition of the recombinant human-P4H.
Phen-2-GKDEL was tested from 100 – 8000 µM with an IC50 value of 3500
µM (Figure 3.9).
3.3.4. Phen-2-GKDEL Demonstrates 250 µM Inhibition in vitro with HFF
Cells
Soluble collagen excreted into the media and collagen in the ECM
were assayed to determine the inhibition of collagen by phen-2-GKDEL.
Soluble collagen excreted into the media and collagen within the ECM were
assayed with polyclonal antibodies towards human collagen type I or dye
which covalently adheres to collagen type I to type V.

165
The first attempt to probe the effect of phen-KDEL towards inhibiting
the collagen production was performed with ELISA to detect the soluble
collagen that is secreted into the media. The media with the soluble collagen
was removed after 48 hours of incubation with the inhibitor. The ELISA was
performed on samples with phen-2-GKDEL (2 µM) and control experiment
was performed on samples with no inhibitor. The media of both the control
and phen-2-GKDEL samples were diluted with a range of 80 % to 50 %
media/ binding buffer (0.1 M NaHCO3, pH 10.0) to determine the optimal
concentration of antigen. In the graph of diluted collagen versus absorbance
(Figure 3.10), both the control and the 2 µM phen-2-GKDEL samples follow a
linear expression. The control has approximately 1.5 –fold higher absorbance
than phen-2-GKDEL, which suggests that collagen production is inhibited by
phen-2-GKDEL.
Other method for collagen detection was employed to obtain higher
concentration of collagen. The Sircol Assay utilizes Sirius red, which is an
anionic dye with a sulphonic acid side chain (Figure 3.11), reacts with the
basic amino acid side chains present in collagen. The advantage with this
method is that mammalian collagen type I to type V can be all measured
while the previous assay used a primary polyclonal antibody for type I
collagen. Collagen was extracted from the extracellular matrix (ECM) and was
digested with pepsin. Pepsin cleaves collagen into soluble proteins, but
allows it to retain native triple helical structure that is necessary for detection.

166
Figure 3.10. Collagen production by HFF cells with no inhibitor (red boxes) and phen-GKDEL (green diamonds). Media samples were diluted with binding buffer (0.1 M NaHCO3, pH 10.0)
Once the collagen was solublized and isolated, the dye was added and
placed on rocker to allow for binding. The dye-collagen complex was pelleted
by centrifugation, and the dye was extracted with the Alkali reagent from the
Sircol kit. Absorbance readings were taken on 96-well plate reader Spectra
Max plus (Molecular Devices). We found that phen-2-GKDEL (20 µM) inhibits
collagen production, as compared to the cells without inhibitor (Figure 2.12).
IC50 curves for phen-2-GKDEL were obtained with inhibitor concentrations
ranging from 0.01-1000 µM. The collagen from the ECM was extracted and
pepsin digested in the similar manner as the Sircol Assay as described in the

167
previous paragraph. After the soluble collagen was isolated, it was
redissolved in 100 µL of 0.05 M acetic acid (pH 4.2), and the concentration of
collagen was determined using an indirect ELISA method. As shown in
Figure 3.13, IC50 values for phen-2-GKDEL were determined to be 250 µM.
Figure 3.11. The chemical structure of the dye that covalently links to collagen types I through V in the Sircol Assay.

168
Figure 3.12. Sircol assay of pepsin digested collagen from HFF cells. (The standards are displayed on the left of the graph.) 20 mM phen-GKDEL was incubated with HFF cells for 48 hours.
Figure 3.13. IC50 curve of phen-2-GKDEL (green diamonds) with pepsin digested collagen.

169
The control experiments using untagged 1,10-phenanthroline (phen) gave
IC50 value of 160 µM. These results clearly show that the production of
soluble and insoluble collagens are both inhibited by phen-2-GKDEL.
3.3.5. Phen is 100 Times More Potent than Phen-2-GKDEL for
recombinant P4H enzyme
IC50 values for phen were also measured against recombinant P4H in
comparison with Phen-2-GKDEL. Phen inhibition of recombinant P4H was
assayed at a concentration range of 5 – 60 µM (Figure 3.14). The IC50 for
phen was
Figure 3.14. IC50 curve of inhibition of recombinant human-P4H with phen.

170
calculated at 35 µM. At high concentrations of phen, a reddish precipitate
was present in the reaction mixture. This precipitate is likely an FeIII adduct
that was insoluble in the buffer solution. The comparison of phen with phen-
2-GKDEL demonstrated a 100 times more potency against isolated P4H
enzyme. Further experiments were performed to test the potency of phen
against phen-2-GKDEL with collagen production in HFF cells.
3.3.6. Phen-2-GKDEL IC50 Value of 250 µM is Similar to Phen IC50 value
of 160 µM in vitro with HFF cells
To evaluate the effect of phen-2-GKDEL for inhibiting the collagen
production in HFF cells, collagen production was compared to the unmodified
phenanthroline. Both soluble collagen excreted to the media and collagen in
the ECM were assayed.
Both phen-2-GKDEL and phen for soluble collagen excreted into the
media by HFF cells at a fixed concentration of 2 µM. Figure 3.15 shows the
linear slope for detecting the secreted soluble collagen in the media upon
dilution with a range of 80 % to 50 % media/ binding buffer (0.1 M NaHCO3
pH 10.0). The graph suggests that both phen and phen-2-GKDEL inhibit
collagen production where that latter is more effective to achieve ~ 30 %
inhibition (~ 25 % inhibition using phen).

171
Figure 3.14. Inhibition of collagen with 0.2 mM phen-GKDEL (green diamonds), 0.2 mM phen (blue circles), and no inhibitor control (red boxes).
Assay of collagen in the ECM was performed by pepsin digest followed
by indirect ELISA to determine collagen concentration. The IC50 value for
phen was determined with inhibitor concentrations ranging from 0.01-1000
µM. The IC50 value for phen-2-GKDEL was determined to be 250 µM (Figure
3.16) that is very similar to the IC50 value of phen (160 µM).
In both the soluble collagen secreted and collagen in the extracellular
matrix showed similar inhibition of collagen production in HFF cells. This is in
sharp contrast to the inhibition of P4H activity in which phen demonstrates
100 times more potency than phen-2-GKDEL

172
Figure 3.16. IC50 curve of phen (blue circles) and phen-GKDEL (green diamonds) with pepsin digested collagen.
3.4. Discussion
3.4.1. Synthesis of P4H Inhibitor Containing the Fe-chelator Coupled to
an ER-Retention Signal Peptide as Potential in vivo Inhibitors
2-Carboxyl 1,10 phenanthroline was coupled with the KDEL tagged
and designed to inhibit the production of collagen in the ER. The presence of
amino acid peptide was confirmed by dispi 2-D NMR (Figure 3.16). The
ability of phen derivatives to chelate to iron and inhibit production of collagen
in P4H has already been reported.25 The synthesis of the 2-carboxyl-phen is
well established, but the novelty is the coupling of the KDEL retention tag.
This will direct the iron chelation by phen to the ER for inhibition of P4H. As

173
there are other iron containing enzymes in the ER, addition of the sequence
for peptide binding domain for P4H could be implemented to select for P4H.
The sequence for the peptide binding domain is known and is specific for
P4H.22 The synthesis of phen-5-GKDEL also has the potential to reduce the
large IC50 value observed in phen-2-GKDEL when tested with isolated
enzyme. The steric interference of the KDEL tag next to the iron chelation
could be reduced by moving it on the opposite side of the iron chelation. The
phen-2-GKDEL synthesis was pursued due to the ease of synthesis of the 2-
carboxy-phen. The synthesis of the 5-carboxy-phen is also reported59,60and
is currently undertaken in the lab.
3.4.2. Phen-2-VD(EDANS)KDEL Localizes in the ER of HFF Cells
Phen-2-E(EDANS)VKDEL was successfully synthesized, and addition
of this agent with HFF cells demonstrated localization in the ER. Both have
good co-localization (85%) as determined by Pearson’s coefficient measured
by the dependency of pixels in a linear expression of the intensities of two
images on each other. The ER tracker demonstrated a more intense signal
than the inhibitor. The weaker intensity could be in part due to the quick
photobleaching of the phen-E(EDANS)VKDEL group observed when
collecting data or coupling on to the receptor may have shifted the
excitation/emission band. The subcellular co-localization analysis of both the
fluorescently labelled inhibitor and the ER tracker indicate transport into the

174
ER. This reflects the ability of the inhibitor to reach and localize in the ER
were P4H is know to reside.
3.4.3. Phen-2-GKDEL Demonstrates IC50 value of 3.5 mM Against
Isolated P4H Enzyme
The effect of phen-2-GKDEL inhibitor was tested against the
recombinant P4H. The phen-2-GKDEL inhibitor exhibited an unexpected high
IC50 value (3.5 mM). This could potentially be caused by steric hindrance of
the peptide chain at the C2 position on the phen next to the iron binding site.
The steric interaction could possibly be avoided by moving the KDEL to the
C5 position on the 1,10 phenanthroline ring and possible lowering the IC50
value to µM range.
3.4.4. Phen-2-GKDEL Demonstrates IC50 value of 250 µM Inhibition in
vitro with HFF Cells
Indirect ELISA was employed for the detection of collagen in the ECM.
The IC50 value for phen-2-GKDEL was prepared with inhibitor concentrations
ranging from 0.01-1000 µM, with an IC50 value of 250 µM. The scattering of
the plot points may be caused by many sample transfers during the assay.
Isolation of collagen under went many steps, in which each step had the
potential for losing some sample. The scattering of the plot points could be
minimized by assay of procollagen, RIA, or the extraction of cellular
proteins.23,25

175
3.4.5. Phen is 100 Times More Potent than Phen-2-GKDEL in Isolated
P4H Enzyme
Both phen and phen-2-GKDEL were tested with isolated P4H enzyme,
in which phen demonstrated a 100 fold potency than phen-2-GKDEL. The
reasoning behind the large difference in IC50 value could be attributed to the
addition of the GKDEL signal peptide to phen. The signal peptide might
sterically hinder the chelating capacity of phen. Future experiments are in
progress to synthesize the phen with a reactive coupling carboxyl group at the
C5 position away from the iron chelator motif (Figure 3.17). The signal
peptide will have an advantage at the five position, as it will interfere less with
iron chelation and could possible interact with Lys493 and His501 of human
P4H known to bind to the C-5 and C-1 carbonyls of α-ketoglutarate.
3.4.6. Collagen Inhibition by Phen-2-GKDEL and Phen Demonstrate
Similar IC50 values in cultured HFF Cells
Phen and phen-2-GKDEL were also tested in vitro for inhibiting
collagen production in HFF cells. The indirect ELISA results suggest that
both phen and phen-2-GKDEL inhibit collagen production with the similar
dose dependence manner. The IC50 values for both inhibitors are determined
to be in the range of 10 - 50 µM. For phen, this value is very similar to the
IC50 value obtained with the isolated enzyme. However, phen-2-GKDEL
demonstrates a 100-fold increase in potency in cultured HFF cells as
compared with isolated enzyme. These results show that having the KDEL

176
Figure 3.17. phen-5-GKDEL inhibitor, with the phenanthroline couple to the N terminus at the 5 position
retention tag is 100-fold effective than phen itself to support the idea of
targeting P4H in the ER. The IC50 value for inhibiting the collagen production
in the ECM was also similar between phen and phen-2-GKDEL. This
demonstrates the inhibition of the collagen production in the ECM by both
phen and phen-2-GKDEL and correlates with the results for the soluble
collagen extracted in the media.
5. Conclusion
The use of signal peptide for drug delivery is a powerful tool that is
quickly gaining interest. Phen-2-GKDEL discussed here is designed to
specifically target P4H in the ER to inhibit collagen production. Fluorescence
detection of the EDANS group coupled to the signal peptide demonstrates the
localization of the phen-E(EDANS)VKDEL into the ER within 20 min.
Detection with antibodies raised against collagen demonstrates the inhibition
of collagen production in cultured HFF cells by phen-2-GKDEL. Phen was

177
also tested with phen-2-GKDEL as a positive control against isolated P4H
and in vitro studies. Both have similar IC50 values in HFF cells. The
difference in the two inhibitors was observed against isolated P4H. Phen-2-
GKDEL had a 100-fold increase in the observed IC50 value as compared to
phen. The data suggest the peptide signal at the 2 position of phen is
interfering with iron chelation.
The GKDEL signal peptide could have a significant effect on the IC50
value in vitro and in vivo of phen derivatives if the observed IC50 value of
phen-2-GKDEL decrease by 100-fold from isolated enzyme to HFF cells. To
conclusively prove the effects of the signal peptide on decreasing the IC50,
more derivatives with the KDEL tag need to be synthesized. Currently, a new
inhibitor where the KDEL tag at the 5 position of phen to avoid steric effects
are undertaken. Other inhibitors are also being synthesized to target both the
peptide binding domain as well as the iron active site.

178
References:
(1) Fibrosis; Pitman: London, 1985. (2) Gunzler, E. H. a. V. J. Hepatol. 1991, 13 (Suppl 13), S1. (3) Pinheiro, G. A.; Antao, V. C.; Wood, J. M.; Wassell, J. T. Int J
Occup Environ Health 2008, 14, 117-123. (4) Tenth special report to the U.S. Congress on alcohol and health. Highlights from current research: From the Secretary of Health and Human Services, 2000.
(5) Majithia, V.; Geraci Stephen, A. Am. J. Med. 2007, 120, 936-9. (6) Strieter, R. M. Proceedings of the American Thoracic Society
2008, 5, 305-310. (7) Anthony, P. P.; Ishak, K. G.; Nayak, N. C.; Poulsen, H. E.; Scheuer, P. J.; Sobin, L. H. J. Clin. Pathol. 1978, 31, 395-414.
(8) Friedman, S. L. N. Engl. J. Med. 1993, 328, 1828-35. (9) Sporn, M. B.; Harris, E. D., Jr. Am. J. Med. 1981, 70, 1231-6. (10) Kovacs, E. J. Immunol. Today 1991, 12, 17-23. (11) Franklin, T. J. Biochem. Pharmacol. 1995, 49, 267-73. (12) Crystal, R. G.; Bitterman, P. B.; Rennard, S. I.; Hance, A. J.;
Keogh, B. A. N. Engl. J. Med. 1984, 310, 235-44. (13) Border, W. A.; Noble, N. A. Am. J. Kidney Dis. 1993, 22, 105-13. (14) Roberts, A. B.; Sporn, M. B.; Assoian, R. K.; Smith, J. M.; Roche, N. S.; Wakefield, L. M.; Heine, U. I.; Liotta, L. A.; Falanga, V.; et al. Proc. Natl. Acad. Sci. USA 1986, 83, 4167-71. (15) Shah, M.; Foreman, D. M.; Ferguson, M. W. Lancet 1992, 339, 213-4.
(16) Segarini, P. R. Biochim. Biophys. Acta 1993, 1155, 269-75. (17) Levitzki, A. FASEB Journal 1992, 6, 3275-82. (18) Myllyharju, J. Matrix Biology 2003, 22, 15-24. (19) Guzman, N. A.; Editor Prolyl Hydroxylase, Protein Disulfide
Isomerase, and Other Structurally Related Proteins, 1998. (20) Hanauske-Abel, H. M. G., V J. Theor. Biol. 1982, 94, 421-455. (21) Lamberg, A.; Pihlajaniemi, T.; Kivirikko, K. I. Journal of
Biological Chemistry 1995, 270, 9926-31. (22) Myllyharju, J.; Kivirikko, K. I. EMBO Journal 1999, 18, 306-312. (23) Franklin, T. J.; Hales, N. J.; Johnstone, D.; Morris, W. B.;
Cunliffe, C. J.; Millest, A. J.; Hill, G. B. Biochemical Society Transactions 1991, 19, 812-15.
(24) Dowell, R. I.; Hadley, E. M. J. Med. Chem. 1992, 35, 800-4. (25) Franklin, T. J.; Morris, W. P.; Edwards, P. N.; Large, M. S.;
Stephenson, R. Biochemical Journal 2001, 353, 333-338.

179
(26) Pelham, H. R. B.; Hardwick, K. G.; Lewis, M. J. EMBO Journal 1988, 7, 1757-62.
(27) Pelham, H. R. B. EMBO Journal 1988, 7, 913-18. (28) Lee, M. C. S.; Miller, E. A.; Goldberg, J.; Orci, L.; Schekman, R.
Annual Review of Cell and Developmental Biology 2004, 20, 87-123. (29) Yamamoto, K.; Fujii, R.; Toyofuku, Y.; Saito, T.; Koseki, H.; Hsu, V. W.; Aoe, T. EMBO Journal 2001, 20, 3082-3091. (30) Scheel, A. A.; Pelham, H. R. B. Journal of Biological Chemistry 1998, 273, 2467-2472.
(31) Scheel, A. A.; Pelham, H. R. Biochemistry 1996, 35, 10203-9. (32) Wilson, D. W.; Lewis, M. J.; Pelham, H. R. B. Journal of
Biological Chemistry 1993, 268, 7465-8. (33) Pap, E. H. W.; Dansen, T. B.; van Summeren, R.; Wirtz, K. W. A. Exp. Cell Res. 2001, 265, 288-293. (34) Gasiorowski, J. Z.; Dean, D. A. Adv. Drug. Deliv. Rev. 2003, 55, 703-716.
(35) Lanford, R. E.; Butel, J. S. Cell 1984, 37, 801-13. (36) Kalderon, D.; Richardson, W. D.; Markham, A. F.; Smith, A. E.
Nature 1984, 311, 33-8. (37) Dubrovsky, L.; Ulrich, P.; Nuovo, G. J.; Manogue, K. R.; Cerami, A.; Bukrinsky, M. Mol. Med. 1995, 1, 217-30. (38) Haffar, O. K.; Smithgall, M. D.; Popov, S.; Ulrich, P.; Bruce, A. G.; Nadler, S. G.; Cerami, A.; Bukrinsky, M. I. Antimicrobial Agents and Chemotherapy 1998, 42, 1133-1138. (39) Popov, S.; Dubrovsky, L.; Lee, M.-A.; Pennathur, S.; Haffar, O.; Al-Abed, Y.; Tonge, P.; Ulrich, P.; Rexach, M.; et al. Proc. Natl Acad. Sci. USA 1996, 93, 11859-11864. (40) Kestler, H.; Kodama, T.; Ringler, D.; Marthas, M.; Pedersen, N.; Lackner, A.; Regier, D.; Sehgal, P.; Daniel, M.; King, N. Science 1990, 248, 1109-12. (41) Coppola, J. M.; Hamilton, C. A.; Bhojani, M. S.; Larsen, M. J.; Ross, B. D.; Rehemtulla, A. Analytical Biochemistry 2007, 364, 19-29. (42) Neurath, H.; Walsh, K. A. Proc. Natl. Acad. Sci. USA 1976, 73, 3825-32. (43) Halban, P. A.; Irminger, J. C. Biochemical Journal 1994, 299, 1-18.
(44) Vassar, R. Adv. Drug Deliv. Rev. 2002, 54, 1589-1602. (45) Capecchi, M. R. Cell 1980, 22, 479-88. (46) Ludtke, J. J.; Zhang, G.; Sebestyen, M. G.; Wolff, J. A. Journal
of Cell Science 1999, 112, 2033-2041. (47) Zanta, M. A.; Belguise-Valladier, P.; Behr, J.-P. Proc. Natl. Acad. Sci. USA 1999, 96, 91-96.

180
(48) Sun, W.-H.; Jie, S.; Zhang, S.; Zhang, W.; Song, Y.; Ma, H.; Chen, J.; Wedeking, K.; Froehlich, R. Organometallics 2006, 25, 666-677.
(49) Shen, Y.; Sullivan, B. P. Inorganic Chemistry 1995, 34, 6235-6. (50) Higgins, B.; DeGraff, B. A.; Demas, J. N. Inorganic Chemistry
2005, 44, 6662-6669. (51) Rasband, W. S., ImageJ, U. S. National Institutes of Health, Bethesda, ; Maryland, U., http://rsb.info.nih.gov/ij/, 1997-2007. (52) Bolte, S.; Cordelieres, F. P. Journal of Microscopy 2006, 224, 213-232. (53) Lindberg, U., Schutt, C.E., Hellsten, E., Tjäder, A., and Hult T. Biochimi. Biophys. Acta 1988, 967, 391-400. (54) P. K. Smith, R. I. K., G. T. Hermanson, A. K. Mallia, F. H. Gartner, M. D. Provenzano, E. K. Fujimoto, N. M. Goeke, B. J. Olson and D. C. Klenk. Analytical Biochemistry 1985, 150, 76-85. (55) Lui, B., Li, S., Hu, J., Am. J. Phamacogenomics 2004, 4, 263-276. (56) ED Matayoshi, G. W., GA Krafft, and J Erickson Science 1990, 247, 954-958. (57) Zunkler, B., Wos-Maganga, M., Panten, U., Biochem Pharmacol 2004, 67, 1437-1444. (58) Matayoshi, E., Wang, G., Krafft, G., Erickson, J., Science 1990, 247, 954-958.

181
Chapter 4
Photolytic Release of Nitric Oxide from an Immobilized Ruthenium
Complex
4.1. Background
In the 1980’s, nitric oxide (NO) was found to cause vascular smooth
muscle relaxation by the activation of cGMP.1 Since then, NO has been
established as a critical mediator in various bioregulatory processes of the
cardiovascular, nervous, genitourinary, immune, and gastrointestinal
systems.1,2 Several diseases are related directly to over or underproduction
of NO, creating great interest in the design and development of NO donors for
NO delivery.3-5 These NO donors have potential for the treatment of heart
attacks, thrombosis, cancer, and restenosis.
4.1.1. Nitric Oxide
NO is a colorless gas with one unpaired electron, which causes it to be
highly reactive with other species within the body.1 Nitric oxide synthase
(NOS) is responsible for the product of nitric oxide within the body. This
dimeric enzyme contains both flavin adenine dinucleotide and flavin
mononucleotide cofactors. In a five electron process containing both
oxidation and reduction cycles, L-Arginine is converted to citruline, producing
one equivalent of NO. The enzymes location and effect on the body
distinguish the three isoforms of NOS; they include neuronal (nNOS),

182
inducible (iNOS), and endothelial (eNOS).1,2 Neuronal NOS is located in
nervous system and is involved in cell communication.6 Inducible NOS fights
pathogenic infections in the immune and cardiovascular systems.1
Endothelial NOS is found in the endothelial layer of blood vessels and
produces NO that causes vasodilatation of smooth muscles. As these
examples illustrate, NO is ubiquities throughout the body, causing the needed
to develop synthetic systems to delivery NO. Because of the diversity of NO
function, it is now recognized that are a variety of systems are necessary.3
4.1.2. Current NO Donors in Medical Practices
Several NO donors are currently employed in the medical practice, but
complications can arise from toxic byproducts or to tolerance to the drug.1,2,4
Nitrate esters, such as nitroglycerin, that release NO are known to relax blood
vessels and relieve chest pain due to angina (Figure 4.1a). Three electron
Figure 4.1. NO donors drugs approved for medical use a) Nitroglycerin - relief of angina and chronic heart failure. b) Sodium nitroprusside - lowering of blood pressure during hypertensive emergency. c) Molsidomine - treatment of hypertension.

183
reduction of nitrate ester generates NO, causing vasodilatation. Doctors have
found, though, that a patient’s body can develop a tolerance to nitroglycerin
and may require increasingly high dosages to elicit the same response.7
Sodium nitroprusside (SNP) is another NO donor that rapidly lowers blood
pressure (Figure 4.1b). SNP is administered during surgery when blood
pressure is fluctuating dangerously; however the byproducts of SNP are
problematic.8 Both free cyanide ion and iron center are generated during the
one-electron reduction of SNP. Molsidomine is used in Europe for the
treatment of hypertension (Figure 4.1c). Through ring opening metabolism,
Molsidomine releases one equivalent of NO along with peroxynitrite, which is
a highly toxic nitrogen species.9 All of these NO donors are currently used in
the medical field, but harmful byproducts or dose-related tolerance have
prompt the design of safer and more reliable NO donors for medical
treatments.
4.1.3. Controlled Release of NO by Diazeniumdiolates
The leading research on NO drug delivery has been the design of
diazeniumdiolates (NONOates), pioneered by Keefer and co-workers at the
National Cancer Institutes Laboratory of Comparative Carcinogenesis.3-5,10
NONOates are a possible treatment for medical disorders caused by NO
deprivation as they provide controlled delivery of NO without harmful
byproducts. NONOates have a chemical formulation of R1R2NN(O)=NOR3
and can be designed to target and control the release of NO (Figure 4.2).

184
Figure 4.2. Structures and time release of selective diazeniumdiolates
These prodrugs control the release of nitric oxide based on their structure.
The three R groups can be modified to control the location of delivery and
rate of release. R1 and modifications of R2 are usually associated with control
the release rate of NO, while R3 serves as a site to bind a cation. For
instance, when R1 and R2 were modified to the amino acid L-proline, the initial
reaction under basic condition yielded PROLI/NO. PROLI/NO is stable under
basic conditions, but at physiological pH has a half-life of 1.8 s, converting to
L-proline and two equivalents of NO with a half-life of 1.8s. PROLI/NO has
been shown to reduce platelet aggregation in baboon’s blood.11 When
infused into the right atrium of sheep, PROLI/NO proved to reduce the
pulmonary arterial pressure. When R1 and R2 are changed from proline to

185
longer alkyl chains, longer half lives are generally observed. One example of
a NONOate with a longer time release is DMAEP/NO, which has an observed
half-life of 135 min.12 The above examples involve R3 site ionically bound as
a cation; however, when R3 is covalently linked to the NONOate release of
NO is inhibited until the R3 group is cleaved off. Covalent linkers to the R3
group are specific to certain enzymes and could potentially control both the
release of NO as well as the desired location. For example, the NO group of
V-PYRRO/NO is specifically cleaved by cytochrome p450 and delivers NO to
the liver.13
Further modifications made for NO release comes from various
polymer support biomaterials that could potentially release NO from site-
specific locations and avoid the release of harmful byproducts into the body.
NONOates have demonstrated the ability to release NO from a solid support.
The need for a material that releases NO has been made evident by
restenosis after angioplasty. The buildup of atheromatous plaque in the
coronary artery can restrict blood flow, leading to heart attack and possibly
death. A process known as angioplasty can clear the blocked artery and
restore blood flow. In this process, a balloon is inflated at the site of plaque
build up, expanding the artery to allow blood flow. Complications include
overstretching the artery, leading to an overproduction of vascular smooth
muscle cells and the thickening of the vessel wall. Stents may be employed
to prevent the re-constriction of the blood vessels, but buildup of smooth

186
muscles is still observed. Kaul and coworkers designed a NO releasing gel
containing the NONOate SPER/NO to be placed at the site of restenosis; this
would inhibit smooth muscle accumulation and further thickening of the vessel
wall.14 When treated with the SPER/NO gels, the damaged artery had similar
appearance to normal and healthy arteries while the untreated artery still
appeared injured and damaged with the build up of smooth muscle.
Addition of foreign objects to the body causes excessive platelet
aggregation.15 NO is known to inhibit platelet aggregation. Smith and
coworkers demonstrated that objects implanted into the body that have been
coated with NONOate releasing material inhibit platelet aggregation.16
Biosensors coated with NONOates have improved accuracy due to the
inhibition of platelet aggregation. Blood oxygen sensing measurements were
taken with electrode with and without NONOate releasing material.17 The
accuracy of the sensor coated with NONOate was very close to standard
clinical chemistry methods while the non-coated sensor had diminished
readings. Materials with the ability to release NO at site specific locations
have proven useful in angioplasty procedures as well as in their ability to
inhibit platelet aggregation with reduced complications towards the biosensor.
4.1.4. Ruthenium Salen Nitrosyl Complex Release of Nitric Oxide
Another approach to NO delivery to site specific a location is the
photochemical release of NO. The photorelease of NO from metal- N,N'-
ethylenebis(salicylideneimine) (salen) complex could be applied to treating

187
thrombosis as seen previously. In addition site, delivery of NO could
potentially be an effective mediator of cytotoxic action of macrophages toward
tumor cells.18,19 The synthesis and characteristics of light activated ruthenium
salen nitrosyl complex (Ru(salen)(Cl)(NO)) have been described recently by
Ford and co-workers (Figure 4.3).20 These complexes are thermally stable
but photochemically release NO. Spectroscopic analysis of the
Ru(salen)(Cl)(NO) displayed a strong ligand-localized π−π* UV absorbance
band at 376 nm. The FTIR spectrum shows the nitrosyl stretching frequency
at 1844 cm-1. The photochemistry of Ru(salen)(Cl)(NO) was monitored by the
spectral changes that occur when an acetonitrile solution of the complex was
irradiated at λirr = 365 nm. Photolysis leads to the increased absorbance at
348 nm, and new bands were displayed at λ = 494 and 724 nm. Isosbestic
points were also seen at λi = 313, 392, and 448 nm. The absorbance at λ =
724 nm was assigned as a ligand (phen) to metal (RuIII) charge transfer band.
Disappearance of FTIR νNO band at 1844 cm-1 was also observed upon
Figure 4.3. Photochemical release of NO from ruthenium salen complex

188
photolysis of the complex at λirr = 365 nm. When photolysis was carried out
in aerated solutions, the observed spectral changes were permanent;
however, in deaerated solutions, the spectral characteristic went back to
those of the starting complex due to the absence of O2 unable to react with
NO. In nonpolar, deaerated solutions, the Ru(salen)(Cl)(NO) complex
displayed no spectral changes as the rate towards reformation of starting
complexes was solvent dependent, since solvent coordinates to the axial
position after NO leaves. Quantum yield for this complex was determined
based on spectral changes and calculated product extinction coefficients:
ΦΝΟ = 0.13 at λirr = 365 nm, ΦΝΟ = 0.09 at λirr = 436 nm, ΦΝΟ = 0.07 at λirr = 546
nm. The photoefficiency decreases at longer wavelengths but still continues
to release NO. A low barrier for NO dissociation could explain this observed.
It was anticipated that modification to the salen ligand would make it possible
to covalently link a Ru-NO complex to a polymeric support for the controlled
release of NO.
4.1.5. Immobilized Metal Salen Complexes for the Storage and Release
of NO
Borovik and co-workers have developed methods for the
immobilization of metal salen complexes into polymer material.21-23 In their
template copolymerization with metal complexes, the metal complex is
substitutionally inert to ensure that the various ligands remain coordinated.
These ligands contain a polymerizable vinyl group that will ultimately be

189
covalently link into a polymer host. The schematic representation of this
process is seen in Figure 4.4. The use of template copolymerization for the
storage and release of NO was first demonstrated by Padden and
Figure 4.4. In the process of template copolymerization, A) the metal ions are stabilized by ligands for a substitutionally inert complex. B) Crosslinking agents react with the vinyl groups and polymerize the metal complex. C) Ligands without vinyl groups are remove to provide space for reactivity.

190
co-workers.21 This process involved the polymerization of a CoII salen
complex into porous solids, having site-isolated cavities with channels that
connect the cavities to the polymer surface. This is a bio-inspired design, in
which site-isolation and channel structures are common structural features in
metalloproteins.24-26 In order to construct the desired environment around the
metal center, the metal complexes were prepared before insertion into the
organic polymer. A styrene-modified salen ligand allows covalent-
incorporation of polymerizable functional groups of the ligand into the organic
host. This material was one of few with the ability to bind and release NO
(Figure 4.5). Upon binding of NO, P-1[CoII] changes from an orange color to
a brown-green color characteristic of P-1[Co(NO)]. The release of NO and
conversion to the unbound orange polymer P-1[CoII] form was accomplished
in approximately one hour upon heating and under vacuum. Reversible
binding of NO was observed through EPR spectroscopy. Solid P-1[CoII]
exhibits an axial spectrum signal at g = 3.83 and g = 1.98, which is
Figure 4.5. The storage and release of NO from P-1[CoII].

191
characteristic of a CoII square planar geometry. Binding of NO to P-1[CoII]
quenches the EPR signal as a result of antiferromagnetic coupling of the CoII
center and the unpaired electron of the NO. The signal for P-1[CoII] was
observed when P-1[Co(NO)] was placed under vacuum; however, the signal
was again disappeared when additional NO was added to the system. Slow,
passive release of NO was also observed under conditions of ambient
temperature and pressure: 40% of the NO was release after 14 days. The P-
1[Co(NO)] demonstrates the possibility of NO release from a porous polymer
support.
The controlled release of NO through photolysis can potentially be
applied by immobilizing ruthenium nitrosyl (Ru-NO) complexes within a similar
material as used with P-1[Co(NO)]. This chapter describes the synthesis and
controlled release study of NO from a polymer support using a Ru-NO
complex. Providing polymerizable vinyl groups to salen Ru(NO) complex
allowed for covalent linkage to the solid support.20,27 The release of NO is
triggered by light, which allows the controlled transfer of NO from the polymer
to biologically relevant compounds. This material illustrates the controlled
release of NO without the formation of toxic and unwanted byproducts. The
potential medical applications of this system maybe treatment of angina
pectoris, myocardial infarction, congestive heart failure, and treatment for
different cancers.
4.2. Materials and Methods

192
Unless otherwise stated, all materials and solvents were obtained from
Aldrich (Milwaukee, WI) or Fisher (Pittsburgh, PA). All inert conditions were
performed with either Vacuum Atmospheres (Hawthorne, CA) drybox under
or a Schlenk-line under argon atmospheres.
4.2.1. Synthesis of Bis[2-hydroxy-4-(4-
vinylbenzyloxy)benzaldehyde]ethylenediimine. (H21) Synthesis was
performed as described by Borovik and co workers.28 2-Hydroxy-4-(4-
vinylbenzyloxy)benzaldehyde (2.00 g, 7.86 mmol), was suspended in 100 mL
of dry methanol and placed under an argon atmosphere. Ethylenediamine
(0.24 g, 3.90 mmol, 0.16 ml) was added with a syringe and the resulting
yellow solution was stirred for 4 hours, during which time a yellow precipitated
formed. The yellow product was isolated by suction filtration with a fritted-
glass filter and washed with 30 mL of chloroform to yield 1.83 g of product
(88% yield). 1H NMR (CDCl3): δ 3.86 (s, 4H), 5.05 (s, 4H), 5.26 (d, 2H), 5.75
(d, 2H), 6.46 (dd, 2H), 6.51 (d, 2H), 6.70 (dd, 2H), 7.08 (d, 2H), 7.11 (d, 2H),
7.41 (m, 4H), 8.21 (s, 2H), 13.62 (s, 2H).
4.2.2. Ru(NO)Cl3 Ru(NO)Cl3 was synthesized following published
procedures.29,30 RuCl3 x H2O (0.450 g, 2.17 mmol) was dissolved in 25 mL of
1 M HCl and the solution was degassed with N2 for 15 min. As the solution
was refluxing at 100oC, an aqueous solution (10 mL) of NaNO2 (0.452 g, 2.17
mmol) was added dropwise by addition funnel and allowed to reflux for 3 h.
At the completion of the reaction, solvent was removed under reduced

193
pressure. The resulting red compound was then washed in 5 mL of 100%
ethanol, 5 mL of 6 M HCl, and then washed three times with 3-5 mL aliquots
of H2O , removing solvent after each addition. The reddish product when
then dried under reduced pressure to yield 0.536 g (91%). FTIR (nujol, cm-1)
1897 (ν NO).
4.2.3. Ru1(NO)(Cl) Synthesis of ruthenium complexes followed the
procedure published by Ford and coworkers.30 Under inert atmosphere, a 30
mL DMF solution of H21 (0.250 g, 0.468 mmol) in DMF was treated with 2
equiv of solid KH (0.0375 g, 0.936 mmol). After gas release (H2) was
completed (~30 min) Ru(NO)Cl3 (0.113 g, 0.479 mmol) was added and the
mixture was refluxed for 2 h. Solvent was removed by rotoevaporation to give
a brown solid, which was purified using silica gel flash chromatography with a
mobile phase of 2% methanol/98% methylene chloride. Fractions containing
the desired Ru1(NO)(Cl) complex were collect and solvent was removed
under reduced pressure to yield 0.24 g of brown solid (45%). 1H NMR
(CDCl3): δ 3.92 (d, 2H), 4.30 (d, 2H) 5.07 (s, 4H), 5.28 (d, 2H), 5.30 (d, 2H),
5.77 (d, 2H), 6.40 (d, 2H), 6.73 (m, 2H), 6.88 (s, 2H), 7.15 (d, 2H), 7.42 (dd,
8H), 8.11 (s, 2H).
4.2.4. P-1[Ru(NO)(Cl)] Under an argon atmosphere, Ru1(NO)(Cl) (0.100 g,
0.144 mmol, 5 mol %), ethylene glycol dimethacrylate (EGDMA) (0.53 g, 2.7
mmol, 94 mol %), and azodiisobutyronitril (AIBN) (5 mg, 0.03 mmol, 1 mol %)
were added to a thick-wall polymerization tube (Ace Glass). Porogen DCB

194
(1.5 g) was added and the tube was sealed and wrapped in foil to prevent the
release of NO. The solution was heated at 60 ˚C for 24 h, after which the
polymer underwent continuous extraction, using a Soxhlet extractor, with
CH2Cl2 for another 24 h. The polymer was dried under reduced pressure to
yield 0.642 grams of product. The polymer was crushed and separated with
particle size smaller than 75 µM and between 0.5 and 1.0 mm with molecular
sieves.
4.2.5. NO Release Studies Particles of P-1[Ru(NO)(Cl)] (20mg) were
suspended with 2 mL of phosphate buffer solution (50 mM, pH 7.2) in Pyrex
test tubes. Samples were covered with parafilm and stored in the dark in a
Rayonet photochemical reactor. During five minutes intervals, the samples
were irradiated with light at λirr = 350 nm (~24 W) and then a 50 µL sample
was removed and added to 96-well microtiter plate. NO was detected by
nitrite concentration in water using the Griess reagent system (Promega), and
colorimetric absorbance at λ =520 nm was determined with a SpectraMax
190 plate reader.31,32
4.2.6. NO Transfer Studies A solution of 100 mg of metmyoglobin (metMb)
and known concentration of P-1[Ru(NO)(Cl)], in a typical experiment, was
prepared in a 1.00 cm Suprsail quartz cuvette and sealed under an inert
atmosphere with a rubber septum. Reduction of equine skeletal muscle
metMb was performed with 1.2 equiv of dithionite to obtain the reduced form
of myoglobin (Mb). The sample was irradiated with a Hg arc lamp, equipped

195
with a λirr = 370 nm wavelength bandpass filter (Omega Optical). Spectra
were collected on a Varian Cary 50 spectrophotometer at room temperature.
4.2.7. Physical Methods Proton nuclear magnetic resonance spectra were
collected on a 400 MHz Bruker spectrometer. UV/Visible spectra of all
samples were collected on a Varian Cary 50 spectrophotometer. Fourier
transform infrared spectra were collected on a Mattson Genesis Series FT-IR
spectrometer. Time release studies with the Griess reaction were performed
on SpectraMax 190 96-well plate reader. EPR spectra were collected on a
Bruker EMX spectrometer.
4.3. Results and Discussion
4.3.1. Synthesis of Ru1(NO)(Cl) and P-1[Ru(NO)(Cl)] Ru1(NO)(Cl) was
obtained in 45% yield and characterized with UV/vis, FT-IR and EPR
spectroscopies and compared to literature values.30 The absorbance
spectrum showed a band at λ = 367 nm for the monomeric complex, which
was assigned as a metal-to-ligand charge transfer (MLCT) band. The silent
EPR spectrum was observed presumably due to antiferromagnetic coupling
of the unpaired electron of the NO and unpaired electron of the low-spin d5
RuIII center.33 The FT-IR stretching at 1830 cm-1 was assigned to the nitrosyl
group.
The Ru(NO)(Cl3) monomer complex was stable under all the reaction
conditions, including polymerization, as long as light exposure was avoided.
The styryloxy groups provided polymerizable sites for immobilization within a

196
porous polymer. Scheme 4-1 illustrates the preparation of P-1[Ru(NO)Cl)],
including the monomer Ru1(NO)(Cl), EGDMA for the crosslinking agent,
AIBN as the radical initiator and 1,2-dichlorobeneze as the porogen. The
polymer was collected, dried, crushed and sieved to isolate the material as
particle, ranging in size from smaller than 75 µM to 1 mM.
Several spectroscopic analyses were performed to ensure P-1[Ru(NO)(Cl)]
was undisturbed during the synthesis and compared to [Ru1(NO)(Cl)]
monomer. EPR spectroscopy was silent at 77 K and 4 K due
Scheme 4.1. Synthesis of [Ru(1)(NO)(Cl)], P-1[Ru(1)(NO)(Cl)], and P-1 [Ru(Cl)]. AIBN = azobisisobutyronitrile, DCB = 1,2-dichlorobenzene

197
to the antiferromagnetic coupling between the unpaired electron of NO and
the unpaired electron of the low-spin d5 RuIII complex. The FT-IR (KBr plates)
stretching frequency spectrum of P-1[Ru(NO)(Cl)] exhibited a band at 1824
cm-1 that is characteristic of the NO stretching frequency. The UV/Vis
spectrum of the polymer suspended in toluene reveals a λmax of 373 nm.
These spectroscopic features are in agreement with the [Ru1(NO)(Cl)]
monomer.33
4.3.2. Photorelease of Nitric Oxide from P-1[Ru(NO)(Cl)] Photolytic
release of NO from [Ru1(NO)(Cl)] and P-1[Ru(NO)(Cl)] was performed by
broad-band irradiation with a Hg arc lamp. Upon photolysis, P-1[Ru(NO)(Cl)]
is converted to P-1[RuIII(Cl)], a process that was observed spectroscopically.
The EPR spectrum after photolysis of P-1[Ru(NO)(Cl)] showed a rhombic
signal with g value at 2.3, 2.1, and 1.8, which is characteristic of immobilized
ruthenium(III) complexes with S = ½ ground state (Figure 4.6). The unpaired
electron on the ruthenium that was antiferromagnetically coupled to radical
NO is observed after the release of NO. P-1[Ru(NO)(Cl)] was suspended in
CH2Cl2 and irradiated to obtain the electronic absorbance spectra revealing
the peak absorbances at λmax = 400 and 660 nm. Both of these values are
characteristic of other monomeric Ru complexes after the release of NO.
4.3.3. NO Transfer to Metalloporphyrin Previous efforts by Koch and
coworkers demonstrated the transfer of NO from P-1[Ru(NO)(Cl)] to cobalt(II)
tetraphenylporphyrin ([CoII(TPP)]).33 Irradiation of the suspended polymer

198
and [CoII(TPP)] at 370 nm demonstrated the transfer of NO from the polymer
to the metalloporphyrin. NO transfer appears to occur cleanly as shown by
the sharp isosbestic points at λmax = 397, 420 and 425 nm for the conversion
of [CoII(TPP)] to [CoII(TPP)(NO)]. Moreover, the transfer was complete in less
than 20 minutes. Transfer of NO to a biological metalloporphyrin were
performed with myoglobin (Mb), which has been shown to bind NO.34 Mb has
also been known to act as a NO scavenger, and has a high concentration in
cardiac cells and muscles.35 In a typical in vitro experiment, P-1[Ru(NO)Cl)]
Figure 4.6. EPR spectra (77K) for P-1[Ru(NO)(Cl)] (dashed line) and P-1[RuIII1(Cl)] (solid line).

199
was suspended in PBS buffer pH 7.2 and irradiated with λmax = 370 nm light.
Reduced Mb was converted to Mb(NO) within 20 minutes. NO transfer was
observed spectroscopically with the shift in the Mb band from λmax = 435 to
420 nm (Figure 4.7). The literature reports the same spectral shift for Mb and
Mb(NO). This transfer process has a first-order rate constant of 5.0 x 10⁻⁴ s-1.
4.3.4. Photorelease of NO The release of NO under physiological
conditions was investigated for potential medical applications. A suspension
of P-1[Ru(NO)Cl)] in PBS buffer pH 7.2 was irritated with λmax = ~350 nm
light, and aliquots of sample were removed at various time intervals.
Figure 4.7. Mb peak at 435 nm shifts to 420 nm upon the binding of NO from P-1 [Ru(NO)(Cl)]. Mb concentration 3.0 mM in 50 mM phosphate buffer, pH 7.2.

200
Samples of this solution were also collected for time periods in which no
irradiation occurred (denoted dark phase). The purpose of the latter
experiments was to demonstrate NO release was not observed during the
dark phase and thus light was the triggering mechanism for release. Figure
4.8 illustrates the release curve of NO from P-1[Ru(NO)Cl)], showing that
0.027 µmol NO were released after 45 min, corresponding to 2.7 µmol of
NO/g of polymer. Figure 4.9 also illustrates the time release with light and
Figure 4.8. Time release curve of P-1[Ru(NO)(Cl) with continuous release (black dots) and stop time release (red dots). Stop time release is demonstrated with continuous irradiation (solid line) and no irradiation (dashed line). dark phases. The polymer was irradiated with light for 15 min with
subsequent 10 min time period with no irradiated. Photolysis proceeded for

201
another 10 minutes followed by no irradiation for another 10 min. No release
of NO was observed during the dark phase, indicating the NO release is
controlled by photolysis alone. NO release was monitored indirectly by
Griess reaction,31,32 which analyzes the nitrite concentration by coupling nitrite
to sulfanilamide and NEDA for detection of azo complex at 520 nm (Figure
4.9).
Figure 4.9. Detection of NO through nitrite concentration by the Griess Reaction.

202
4.4. Conclusion
The chapter described the synthesis and transfer of NO from a porous
material. This is the first reported NO donor in polymer material where the
release of NO was controlled by light. As described in the introduction,
compounds and materials that release NO have been proven to elevate
restenosis after angioplasty, inhibit platelet aggregation (thrombus) on
implanted medical devices, and relieve hypertension.3,4,10,14,16,36,37 NO is
involved in numerous processes within the body, thus the release of highly
reactive NO would need to be controlled and site specific. P-1[Ru(NO)(Cl)]
provides both of these advantages with controlled release of NO with light
and site-directed release because NO is attached to the polymer support.
This chapter has illustrated the ability of P-1[Ru(NO)(Cl)] to release NO only
when it was irradiated with light, and no leaching of NO from the material has
been observed. A potential application of this materials is to attach the
Ru1(NO)(Cl) complex to a fiber optic to provide release of NO at site specific
locations. This could also potentially be useful in cancer treatment, as NO is
known to be involved in apoptosis. Materials coated with P-1[Ru(NO)(Cl)]
that are implanted in the body, such as stent medical devices, would not
prove useful as 380 nm irradiation will not penetrate the skin. Ford and
coworkers has developed a complex for the release of NO by single and two
photon excitation.38 The near-infrared wavelengths are optimal for tissue
transmission. Designing modification to P-1[Ru(NO)(Cl)] for release at single

203
and two photon excitations would allow the release of NO from the material at
desired materials implanted locations with the use of tissue penetrating
wavelengths. Medical stents, implanted devices, or other possible areas of
atherosclerosis would be coated with this material, and the scheduled release
of NO could be performed with one and two photon light excitation.

204
References
(1) Nitric Oxide: Biology and Pathology; Academic Press: New York, 2000. (2) J. Lincoln, C. H. V. H., G. Burnstock Nitric Oxide in Health and Disease; Cambridge University Press: New York, 1997.
(3) Keefer, L. K. Nature Materials 2003, 2, 357-358. (4) Keefer, L. K. Pharm. News 2000, 7, 27-32. (5) Keefer Larry, K. Annu. Rev. Pharmacol. Toxicol. 2003, 43, 585-
607. (6) Nitric oxide in the nervous system; Academic Press: London, 1995. (7) Fung, H. L.; Bauer, J. A. Cardiovasc. Drugs. Ther. 1994, 8, 489-99. (8) Wink, D. A.; Cook, J. A.; Pacelli, R.; DeGraff, W.; Gamson, J.; Liebmann, J.; Krishna, M. C.; Mitchell, J. B. Arch. of Biochem. Biophys. 1996, 331, 241-248.
(9) Schonafinger, K. Farmaco. 1999, 54, 316-320. (10) Keefer, L. K. Annual Review of Pharmacology and Toxicology
2003, 43, 585-607, 2 plates. (11) Saavedra, J. E.; Southan, G. J.; Davies, K. M.; Lundell, A.; Markou, C.; Hanson, S. R.; Adrie, C.; Hurford, W. E.; Zapol, W. M.; Keefer, L. K. J Med Chem FIELD Full Journal Title:Journal of medicinal chemistry 1996, 39, 4361-5. (12) Davies, K. M.; Wink, D. A.; Saavedra, J. E.; Keefer, L. K. J. Am. Chem. Soc. 2001, 123, 5473-81. (13) Inami, K.; Nims, R. W.; Srinivasan, A.; Citro, M. L.; Saavedra, J. E.; Cederbaum, A. I.; Keefer, L. K. Nitric Oxide 2006, 14, 309-315. (14) Kaul, S.; Cercek, B.; Rengstrom, J.; Xu, X. P.; Molloy, M. D.; Dimayuga, P.; Parikh, A. K.; Fishbein, M. C.; Nilsson, J.; Rajavashisth, T. B.; Shah, P. K. J. Am. Coll. Cardiol. 2000, 35, 493-501. (15) Vural, K. M.; Bayazit, M. Eur. J. Vasc. Endovasc. Surg. 2001, 22, 285-93. (16) Smith, D. J.; Chakravarthy, D.; Pulfer, S.; Simmons, M. L.; Hrabie, J. A.; Citro, M. L.; Saavedra, J. E.; Davies, K. M.; Hutsell, T. C.; Mooradian, D. L.; Hanson, S. R.; Keefer, L. K. J. Med. Chem. 1996, 39, 1148-56. (17) Zhang, H.; Annich, G. M.; Miskulin, J.; Osterholzer, K.; Merz, S. I.; Bartlett, R. H.; Meyerhoff, M. E. Biomaterials 2002, 23, 1485-1494. (18) Fukumura, D.; Kashiwagi, S.; Jain, R. K. Nat. Rev. Cancer 2006, 6, 521-534. (19) Mitchell, J. B.; Wink, D. A.; DeGraff, W.; Gamson, J.; Keefer, L. K.; Krishna, M. C. Cancer. Res. 1993, 53, 5845-8.

205
(20) Ford, P. C.; Bourassa, J.; Lee, B.; Lorkovic, I.; Miranda, K.; Laverman, L. Coord. Chem. Rev. 1998, 171, 185-202. (21) Padden, K. M.; Krebs, J. F.; MacBeth, C. E.; Scarrow, R. C.; Borovik, A. S. J. Am. Chem. Soc. 2001, 123, 1072-1079. (22) Padden, K. M.; Krebs, J. F.; Trafford, K. T.; Yap, G. P. A.; Rheingold, A. H.; Borovik, A. S.; Scarrow, R. C. Chem. Mater. 2001, 13, 4305-4313. (23) Sharma, A. C.; Borovik, A. S. J. Am. Chem. Soc. 2000, 122, 8946-8955. (24) Lu, Y.; Valentine, J. S. Curr. Opin. Struct. Biol. 1997, 7, 495-500.
(25) Regan, L. Trends Biochem. Sci 1995, 20, 280-5. (26) Armstrong, W. H., Metal Clusters in Proteins, ACS Symposium
Series 372. (27) Works, C. F.; Ford, P. C. J. Am. Chem. Soc. 2000, 122, 7592-7593.
(28) Krebs, J. F.; Borovik, A. S. Chem. Comm. 1998, 553-554. (29) Muller, J. G.; Takeuchi, K. J. Inorg. Chem. 1990, 29, 2185-8. (30) Works, C. F.; Jocher, C. J.; Bart, G. D.; Bu, X.; Ford, P. C.
Inorg. Chem. 2002, 41, 3728-3739. (31) Ignarro, L. J.; Fukuto, J. M.; Griscavage, J. M.; Rogers, N. E.; Byrns, R. E. Proc. Natl Acad Sci. USA 1993, 90, 8103-7. (32) H. H. H. W. Schmidt, M. K. Methods in Nitric Oxide Research; Wiley & Sons: New York, 1996. (33) Mitchell-Koch, J. T.; Reed, T. M.; Borovik, A. S. Angew. Chem. Int. Ed. 2004, 43, 2806-2809. (34) Moller, J. K. S.; Skibsted, L. H. Chem. Rev. 2002, 102, 1167-1178. (35) Garry, D. J.; Ordway, G. A.; Lorenz, J. N.; Radford, N. B.; Chin, E. R.; Grange, R. W.; Bassel-Duby, R.; Williams, R. S. Nature 1998, 395, 905-8. (36) Chakrapani, H.; Showalter, B. M.; Kong, L.; Keefer, L. K.; Saavedra, J. E. Org. Lett. 2007, 9, 3409-3412. (37) DeRosa, F.; Kibbe, M. R.; Najjar, S. F.; Citro, M. L.; Keefer, L. K.; Hrabie, J. A. J. Am. Chem. Soc. 2007, 129, 3786-3787.
(38) Ford, P. C. Acc. Chem. Res. 2008, 41, 190-200.

206
Conclusion
The expression system of rHADH has been optimized and purification
procedure yields ~ 20 mg/L of >99% pure, fully flavinylated protein. The
physical properties (molecular weight and sequence analysis) are in good
agreement with the native enzyme. The kinetic properties (specific activity,
Km) of rHADH are also in good agreement with the native enzyme. The
recombinant system of HADH behaves identical as native expression.
Crystal conditions of rHADH were optimized with screening conditions: 2.0 M
(NH4)2SO4, 0.1 M Hepes, pH 7.5, 2% PEG, 4% glycerol. Addition of glycerol
was needed for proper cryrofreezing of the crystal. The crystal structure of
HADH was defined to 2.7 Å with data collection obtained at the SSRL. The
structure validated the presence of 6-S-Cys-FMN and [4Fe-4S] redox active
cofactors. The presence of a bound ADP was also determined, but the
function of this prosthetic group is unknown. Continual refinement of the 6-S-
Cys-FMN suggested the presence of a bend in the isoalloxazine ring, which
modulates its redox potential. Docking studies of histamine demonstrate
interactions of Glu79 and Asp358 with the protonated amino group of
histamine. The imidazole ring of histamine is stabilized by π−π interaction of
Tyr181 and Phe77. Asn115 as provides hydrogen bonding to the nitrogen on
the imidazole ring. The binding motif demonstrated by the model is found in
other histamine binding proteins. Histamine transferase and histamine

207
binding proteins show a carboxylate residue stabilizing the amino group and
π−π interaction of either Phe or Tyr holding the imidazole group. The binding
motif of HADH is also similar to the human histamine receptor. This could
provide further understanding of the human histamine receptor along with
potential drug design.
Continued studies and mutant HADH studies would provide further
understanding of this enzyme. Arg230 is believed to stabilize intermediates in
the biogenesis of the 6-S-Cys-FMN. Mutations to R230V to observe the
formation of 6-S-Cys-FMN could confirm the role of Arginine in the 6-S-Cys-
FMN biogenesis. Further probing of the redox active [4Fe-4S] and discovery
the physiological external electron acceptor would provide understanding of
electron transport of the 6-S-Cys-FMN to outside the enzyme. The
implications of understanding the electron pathway would be useful in the
design of histamine biosensor.
The synthesis of the two agents of the iron-chelating phenanthroline
inhibitor was coupled to a retention signal (KDEL) to target the endoplasmic
reticulum to inhibitor prolyl 4-hydroxylase. Colocalization studies of the
fluorophore labeled phen-2-KDEL inhibitor with ER tracker demonstrated that
the inhibitor is localized in the ER. Good collocation (85%) and overlap (94%)
were shown with the fluorophore and the ER tracker. Phen-2-GKDEL
demonstrates an IC50 value of 3.8 mM against isolated human P4H. This
value is around 100-fold increase in IC50 value as compared to phen without

208
the KDEL tag. The peptide chain at the 2 position next to the iron chelation,
could be affecting the ability of the phenanthroline to chelate to the metal.
Synthesis of the KDEL at the 5 position could elevate this and provide better
iron chelation. Similarities in IC50 for phen-2-GKDEL (165 µM) and phen (160
µM) were observed in HFF cells. Experimental evidence suggests that phen-
2-GKDEL and phen are demonstrating similar potency in HFF cells. The
optimal design of a potent inhibitor with the KDEL tag would provide efficient
selectivity and inhibition of P4H
The controlled release of nitric oxide by P-1[Ru(NO)(Cl)] was designed
with a porous material. Sight isolated ruthenium salen complex allowed for
the storage and photolytic release of nitric oxide. Release of nitric oxide was
demonstrated spectroscopically by EPR. The bound Ru(NO) complex
demonstrates a slight EPR sign, but upon release of NO, the electron on the
RuIII complex is observed at g = 2.0. The transfer NO to biologically relevant
myoglobin within 20 minutes was observed with a spectroscopic shift of the
unbound Mb (435 nm) to the Mb(NO) form (420). The controlled release of
NO from the porous material was also shown. No is released from this
material in the presence of light; however, during periods of darkness, the
release of NO was not observed. This is the first system where NO is
photoreleased from an immobilized polymer support. Continued design of
Ru salen complex covalently linked to a fiber optic would provide the site
specific delivery of nitric oxide to a desired location. The release of NO by

209
two photon excitation from the polymer material could provide penetration
wavelengths through tissues for the release of NO.

210
Appendix
Soluble collagen secreted in the media was also assayed by varying the
concentration of phen-2-GKDEL from 0.01 µM to 100 µM in a dose
dependent experiment. Based on the pervious experiment, the media was
diluted to a concentration of 20 % binding buffer and 80 % media, as these
condition provided the highest absorbance. Figure A.1 exhibits the curve for
phen-2-GKDEL suggesting a dose dependence manner for this inhibitor.
Figure A.1. Dosage dependent indirect ELISA detecting collagen production with a concentration range of 100 mM to 0.01 mM in the presence of phen (blue circles) and in the presence of phen-GKDEL (green diamonds)

211
Phen and phen-2-GKDEL were both assayed for secreted soluble
collagen by varying the concentration of each inhibitor from 0.01 µM to
100 µM in a dose dependent experiment. The media was diluted to a
concentration of 20 % binding buffer and 80 % media, as these condition
provided the highest absorbance in previous experiments. Figure A.2 exhibits
the curve for each inhibitor, suggesting a similar dose dependence value for
both of these inhibitors. These results show that both phen and phen-2-
GKDEL are inhibiting collagen production with the similar dose dependence.
Figure A.2. Dosage dependent indirect ELISA of collagen production with a concentration range of 100 mM to 0.01 mM for phen (blue circles) and phen-2-GKDEL (green diamonds)

212
A dose dependent behaviour for the inhibition of collagen production
was also performed with phen-2-GKDEL. At lower concentration of inhibitor
the inhibition of collagen production was observed as very minimal, but at
higher concentration of inhibitor the collagen production was substantially
inhibited. The dose dependent curve exhibits a lower absorbance at 0.01 µM
as compared to 0.1 µM, which is not expected. This could an artefact of the
ELISA. At the outer edge of the plate the heat transfer of the outer samples is
not the same as the samples within the middle of the ELISA. This conclusion
may be validated as both samples were at the out edge and exhibited an
unusual decline in absorbance. Indirect ELISA assayed soluble collagen
secreted in the media and demonstrated inhibition is a dose dependent
behaviour.