Determination of the Abundance and Population Structure of ...
66
Determination of the Abundance and Population Structure of Buccinum undatum in North Wales Zara Turtle Marine Environmental Protection MSc Redacted version September 2014 School of Ocean Sciences Bangor University Bangor University Bangor Gwynedd Wales LL57 2DG
-
Upload
khangminh22 -
Category
Documents
-
view
4 -
download
0
Transcript of Determination of the Abundance and Population Structure of ...

Determination of the Abundance and Population Structure of Buccinum undatum in North
Wales
Zara Turtle
Marine Environmental Protection MSc
Redacted version
September 2014
School of Ocean Sciences
Bangor University
Bangor University Bangor
Gwynedd Wales
LL57 2DG

i
Declaration
This work has not previously been accepted in substance for any degree and is not being
currently submitted for any degree.
This dissertation is being submitted in partial fulfilment of the requirement of the M.Sc. in
Marine Environmental Protection.
The dissertation is the result of my own independent work / investigation, except where
otherwise stated.
Other sources are acknowledged by footnotes giving explicit references and a bibliography is
appended.
I hereby give consent for my dissertation, if accepted, to be made available for photocopying
and for inter-library loan, and the title and summary to be made available to outside
organisations.
Signed:
Date: 12/09/2014

ii
Determination of the Abundance and Population Structure of Buccinum undatum in North Wales
Zara Turtle
Abstract
A mark-recapture study and fisheries data analysis for the common whelk, Buccinum undatum,
was undertaken for catches on a commercial fishing vessel operating from The fishing location,
north Wales, from June-July 2014. Laboratory experiments were conducted on B.undatum to
investigate tag retention rates and behavioural responses after being exposed to a number of
treatments. Thick rubber bands were found to have a 100 % tag retention rate after four months.
Riddling, tagging and air exposure do not affect the behavioural responses of B.undatum. The
mark-recapture study was used to estimate population size and movement. 4007 whelks were
tagged with thick rubber bands over three tagging events. An overall recapture rate of 3.29 %
was achieved which yielded a mean population size of 11,319,410 over a 26 km2 area. The mean
minimum distance travelled by B. undatum over 24 hours was 111.3 m. The total shell length of
9041 whelks was measured during five sampling days. Total shell length was found to vary
significantly with pot colour, pot type, depth, and habitat. On average 3.16 kg of whelks were
landed per pot. Catch per unit effort varied significantly with depth, with the shallower depths
having lower catch per unit efforts. Over the five sampling days 32.56 % of the whelks caught
were undersized (less than 45 mm total shell length). Out of the total number of whelks caught
2.93 % was bycatch, 59.62 % of this were netted dog whelks (Nassarius reticulatus).

iii
Acknowledgements
I would like to thank all of the people who helped and supported me with this research project.
My greatest appreciation goes to my co-supervisor Jodie Haig whose patient guidance has helped
me greatly throughout the project. My supervisor Lewis Le Vay has given great support in the
design and writing of this project.
I am very grateful to Pete and Stuart Jones for allowing us to sample from their fishing vessel. I
would like to thank Georgia Robinson for helping with data collection.

iv
Contents Declaration ......................................................................................................................................................... i
Abstract .............................................................................................................................................................. ii
Acknowledgements ....................................................................................................................................... iii
Figures ............................................................................................................................................................... vi
Tables ............................................................................................................................................................... viii
Appendices ....................................................................................................................................................... ix
Abbreviations ................................................................................................................................................... x
Introduction ..................................................................................................................................................... 1
Diet ..................................................................................................................................................................................... 2
Reproduction ................................................................................................................................................................. 3
Growth .............................................................................................................................................................................. 4
Predators ......................................................................................................................................................................... 4
Fisheries .......................................................................................................................................................................... 5
Fisheries Management .............................................................................................................................................. 6
Welsh Fisheries Management ................................................................................................................................. 7
Tag-Recapture ............................................................................................................................................................... 7
Aims and Hypotheses ................................................................................................................................................. 9
Objectives ..................................................................................................................................................................... 10
Materials and Methods ............................................................................................................................... 11
Practical Methods ..................................................................................................................................................... 11
Fisheries Data ........................................................................................................................................................ 11
Laboratory Experiments ................................................................................................................................... 12
Abundance Estimates ......................................................................................................................................... 13
Data Analysis .............................................................................................................................................................. 14
Fisheries Data ........................................................................................................................................................ 14
Study of Behavioural Responses ................................................................................................................... 16
Abundance Estimates ......................................................................................................................................... 16
Results .............................................................................................................................................................. 17
Fisheries Data ............................................................................................................................................................. 17
Total Shell Length ................................................................................................................................................ 17
Catch per Unit Effort ........................................................................................................................................... 20
Undersized Whelks ............................................................................................................................................. 21
Bycatch ..................................................................................................................................................................... 24
Laboratory Experiments ................................................................................................................................... 27
Abundance Estimates ......................................................................................................................................... 28
Discussion ....................................................................................................................................................... 30
Total Shell Length ..................................................................................................................................................... 30
Length Frequency ................................................................................................................................................ 33

v
Depth ......................................................................................................................................................................... 34
Habitat Type ........................................................................................................................................................... 35
Catch per Unit Effort ................................................................................................................................................ 35
Soak Time ................................................................................................................................................................ 36
Depth ......................................................................................................................................................................... 37
Percentage Undersized ........................................................................................................................................... 37
Bycatch .......................................................................................................................................................................... 38
Laboratory Experiments ........................................................................................................................................ 38
Tag Retention Study............................................................................................................................................ 38
Behavioural Response to Tagging and Riddling ..................................................................................... 39
Abundance Estimates .............................................................................................................................................. 40
Movement ............................................................................................................................................................... 40
Population Density .............................................................................................................................................. 41
Conclusions ................................................................................................................................................................. 41
Future Studies ............................................................................................................................................................ 42
References ....................................................................................................................................................... 44
Appendices ...................................................................................................................................................... 47

vi
Figures
Figure 1 Photograph of Buccinum undatum out of the water
Figure 2 Landings data for 1985-2011 in the North Sea, North West Scotland, Northern Ireland, and Irish Sea
Figure 3 Photograph of a whelk pot
Figure 4 Riddle used to discard undersized whelks
Figure 5 Photograph of the commercial fishing vessel (removed)
Figure 6 Location of The fishing location, north Wales (removed)
Figure 7 Measuring total shell length (mm) of Buccinum undatum using callipers
Figure 8 Photograph of a common whelk used in the tag retention study tagged with a thick rubber band
Figure 9 Photograph of a black whelk pot
Figure 10 Length-frequency histogram of Buccinum undatum measured in north Wales
Figure 11 a) Bar chart with standard error bars illustrating mean total shell length (mm) for blue and white pot colours b) Length frequency histogram for whelks caught in blue pots c) Length frequency histogram for whelks caught in white pots
Figure 12 a) Bar chart with standard error bars illustrating mean total shell length (mm) for normal and scientific pot types b) Length frequency histogram for whelks caught in standard pots c) Length frequency histogram for whelks caught in scientific pots
Figure 13 a) Bar chart with standard error bars illustrating mean total shell length (mm) for each depth range b) Length frequency histogram for whelks caught at 12-14 m depth c) Length frequency histogram for whelks caught at 15-17 m depth d) Length frequency histogram for whelks caught at 18-20 m depth e) Length frequency histogram for whelks caught at 21-23 m depth f) Length frequency histogram for whelks caught at 24-26 m depth
Figure 14 a) Bar chart with standard error bars illustrating mean total shell length (mm) for
each habitat type b) Length frequency histogram for whelks caught on gravel c) Length frequency histogram for whelks caught on coarse sand d) Length frequency histogram for whelks caught on a muscle bed
Figure 15 Bar chart with standard error bars illustrating the catch per unit effort in each
depth range Figure 16 Bar chart illustrating the mean percentage of undersized whelks caught on each
habitat type Figure 17 Bar chart of the percentage of undersized whelks caught in each depth range

vii
Figure 18 Bar chart to illustrate the percentage of undersized whelks caught after each soak
time Figure 19 Species composition of bycatch caught over the sampling period Figure 20 Map showing the percentage of bycatch caught at each sampling point across the
north Wales sampling area Figure 21 Scatter plot of percentage bycatch caught in each normal and scientific pot
sampled Figure 22 Species composition of bycatch caught at each depth range Figure 23 Box plot to illustrate the time taken for the whelks to right themselves after being
inverted. Control-Whelks were inverted under the water T1-Whelks were tagged under the water then inverted T2-Whelks were removed from the tank, shaken in a box for one minute, tagged, and then returned to the tank T3-Whelks were removed from the tank, shaken in a box for one minute, tagged, left in a bucket exposed to air for one hour and then returned to the tank T4- Whelks were removed from the tank, shaken in a box for one minute, tagged, left in a bucket exposed to air for 3 hours and then returned to the tank
Figure 24 Box plot to illustrate the time taken for the whelks to respond to crab bait.
Control-Whelks were inverted under the water T1-Whelks were tagged under the water then inverted T2-Whelks were removed from the tank, shaken in a box for one minute, tagged, and then returned to the tank T3-Whelks were removed from the tank, shaken in a box for one minute, tagged, left in a bucket exposed to air for one hour and then returned to the tank T4- Whelks have been excluded as no animals responded within 3 hours
Figure 25 Maps illustrating the release and recapture points of each coloured tag over the
north Wales sampling area Figure 26 Mean total shell length variation of Buccinum undatum caught in scientific pots in
north Wales from May-October 2013 Figure 27 Effect of starvation and shell damage on shell growth in Nucella ostrina Figure 28 Length frequency histogram of whelks caught from scientific pots in the north
Wales area during June and July 2013 Figure 29 Change in catch per unit effort against soak time in the common whelk fishery of
the south Irish Sea

viii
Tables
Table 1 Time of mating and egg laying of Buccinum undatum in Europe, Canada and Northern Gulf
Table 2 Advantages and disadvantages for the use of capture-recapture techniques
Table 3 Distribution of whelks and treatments between the three tanks used in the laboratory experiments
Table 4 Tagging event data
Table 5 Total shell length data for each depth range
Table 6 Significant results from an ANOSIM pair-wise comparison for catch per unit effort between depth ranges
Table 7 a) Significant results from an ANOSIM pair-wise comparison for percentage of undersized whelks between depth ranges b) Percentage undersized data for each depth range
Table 8 Percentage undersized data for each soak time
Table 9 Percentage bycatch present on each habitat type Table 10 Mean minimum distance travelled by the blue, neutral, and yellow banded whelks
Table 11 Abundance and density estimates of the whelk population in the north Wales sampling area

ix
Appendices
Appendix A Catch per Unit Effort data for depth
Appendix B R script for a one-way ANOVA used to analyse:
Percentage undersized with depth
Percentage undersized with habitat type
Percentage bycatch with habitat type
CPUE with habitat type
CPUE with pot colour
CPUE with pot type
CPUE with depth
Appendix C R script for a power test
Appendix D R script for a Mann-Whitney U Test used to analyse:
Percentage undersized with pot type
Percentage bycatch with pot colour
Percentage bycatch with pot type
TSL with pot type
TSL with pot colour
Appendix E R script for a Kruskal-Wallis Test used to analyse:
Percentage undersized with soak time
Percentage bycatch with depth
TSL with depth
TSL with habitat type
Appendix F R script for descriptive statistics
Appendix G R script for length frequency histograms
Appendix H R script for box plots

x
Abbreviations
TSL Total shell length
MLS Minimum landing size
CPUE Catch per unit effort
MSY Maximum sustainable yield
GIS Geographical information system

1
Introduction
The aim of this thesis is to collect baseline data on the population structure and ecology of the
marine gastropod Buccinum undatum off the Llyn Peninsula, north Wales. Gastropods are an
extremely diverse taxonomic class within the phylum Mollusca (McArthur and Harasewych,
2003). Gastropod species vary in behaviour, feeding, reproductive cycle, and favoured habitat
making generalities between them hard to find. Marine gastropods were first recorded from the
Late Cambrian period; there are now approximately 30,000 known species. Buccinum undatum,
also known as the “common whelk”, is one of the largest marine gastropods. It is the most
abundant species of gastropod mollusc inhabiting the North Atlantic (Kideys et al., 1993). B.
undatum has a pointed spiral shell with a white/yellow body flecked with black (Figure 1). The
body consists of a ventral foot and head with two tentacles, the eye spots are located on the top
Figure 1: Photograph of a tagged Buccinum undatum out of the water with its siphon extended © Zara Turtle
of the tentacles. The operculum acts as a trap door, closing the shell, and is made of a calcareous
material. B. undatum must make full use of its sensory organs; including its olfactory organs
(sense of smell), statocysts (balance sensor), eyes and mechanoreceptors (which respond to
mechanical pressure or distortion) (Chase, 2001) because it has no hearing. The siphon is used
to draw water into the mantle cavity and over the gills; this both supplies the gills with water (to
extract oxygen) and enables the whelks to “taste” the water for the presence of food. To feed, B.
undatum use their radula; this has very small teeth and is used for cutting food before it enters
the oesophagus. B. undatum have a life span of about 10 years and can grow to a total shell length
(TSL) of 110 mm (Hayward and Ryland, 1995). They are usually found between the sublittoral
zone and the continental shelf edge and have been observed to live on a variety of substrata;
2
including coarse and muddy sand, rocks, and gravel. B. undatum inhabit colder waters with a
salinity of 20-30 ppt. In water temperatures greater than 12 oC they become stressed, lying on
their backs (Himmelman, 1993). Due to differences in diet or habitat preference older whelks
have been found to inhabit deeper waters, whereas younger whelks are found in shallower
waters (Valentinsson et al., 1999). B. undatum are regarded as a K-selected species as they are
late maturing, slow growing, and have a low fecundity (French, 2011). This puts populations at
risk of overfishing as recovery rates are slow. When in search of food the maximum distance a
whelk has been recorded travelling in one day is 50 metres (Pardo and Johnson, 2004). Due to
their limited movement B. undatum populations are expected to have a low inter-population
connectivity, reducing the gene flow between whelk populations. This will further reduce their
recovery rate from over-exploitation.
Diet
To detect food Buccinum undatum “smell” the water by inhaling the seawater into their siphon
and across sensitive chemo-receptors (Gendron, 1992). They have been observed to move at
speeds of up to 10 cm per minute whilst in search of food (Gendron, 1992). B. undatum are both
predators and opportunistic feeders (Morissette and Himmelman, 2000), feeding on molluscs,
polychaetes, echinoderms, small crustaceans, and mussels (Valentinsson et al., 1999). Food
availability and prey species varies for whelks in different habitat types. In a study of the stomach
contents of B.undatum in the northern Gulf of St Lawrence, Canada, fragments of urchins,
polychaetes and amphipodes were found in the stomach of whelks from sandy sediment. Whereas
decapod crustaceans and fish eggs were the most common prey found in the stomach contents of
whelks from rocky habitats (Himmelman, 1993).
3
Reproduction
The reproductive cycle of Buccinum undatum varies in timing and duration, depending on the
location and therefore water temperature (Heude-Berthelin et al., 2011) as seen in Table 1. When
the water reaches approximately 10 oC female whelks release pheromones into the water to
attract male whelks (Kideys et al., 1993). Whelks mate by copulation and the eggs are fertilised
internally. Female whelks accumulate the sperm cells from a number of males until external
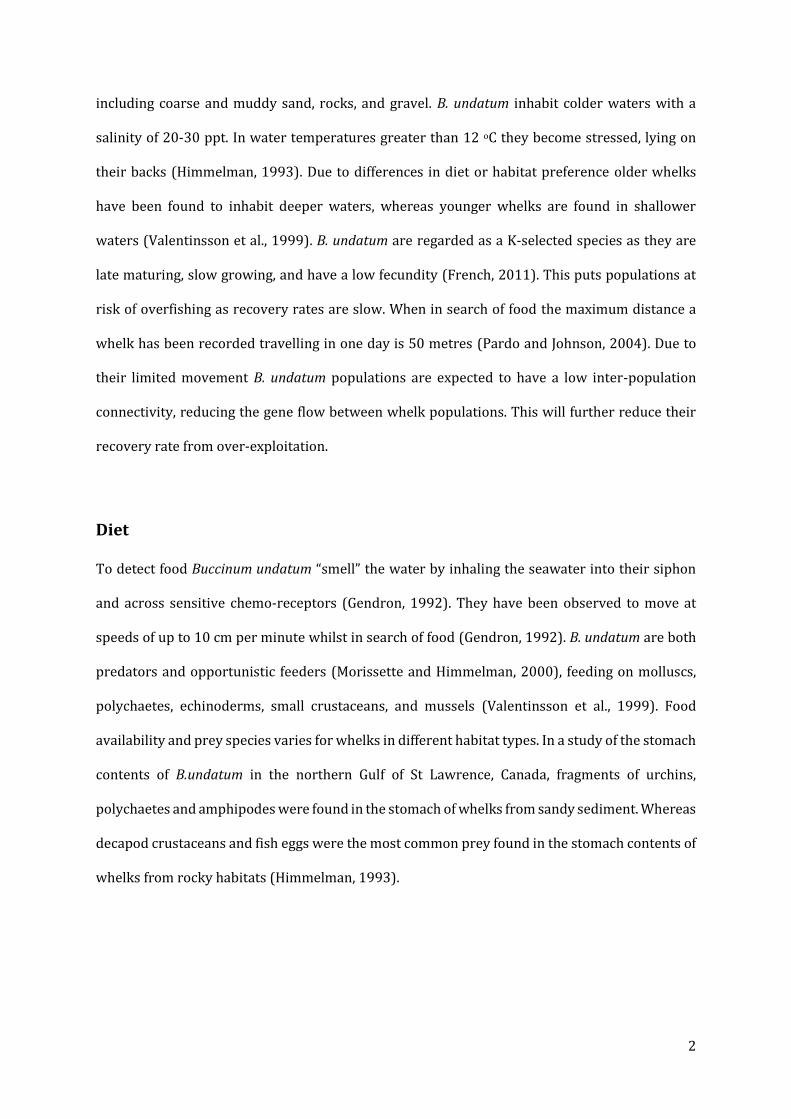
conditions are at their most favourable. On average female whelks produce up to 2,000
Table 1: Time of mating and egg laying of Buccinum undatum in Europe (French, 2011), Canada (Heude-Berthelin et al., 2011) and Northern Gulf (Himmelman, 1993)
Location Mating Period Eggs Laid
Europe Autumn December-January
Canada Late spring Early autumn
Northern Gulf May-June June-August
egg capsules, each one protecting up to 3,000 eggs (Hancock, 1963). However only one percent
of the individuals hatch from each capsule (Smith and Thatje, 2012). Development to a juvenile
stage (3.0 mm in size) is intra-capsular and takes between three to eight months, including seven
ontogenetic stages. Not all eggs develop into larvae and the first veligers to develop consume the
surrounding “nurse” eggs in the capsule. The larvae use these nurse eggs as nutrition. It is
estimated that only one percent of eggs from each egg capsule successfully develop into juveniles
(Heude-Berthelin et al., 2011). Female B. undatum expend six times more energy than male B.
undatum during the reproductive cycle. Females can lose up to 10.5 % of their body mass during
reproduction, compared to a 1.6 % loss of body mass in males (Martel et al., 1986). Females use
the bulk of their energy to produce the protective egg capsules to enclose their eggs before laying
them (Brokordt et al., 2003). This considerable loss in energy reserves compromises their escape
responses, leaving the female B. undatum vulnerable to predation.

4
Growth
Growth rate of Buccinum undatum varies with geographic location but has generally been found
to be a slow process. B. undatum have been observed to grow approximately 2.5 cm in their first
year (and decreasing amounts in the consecutive years) in south east England (Hancock, 1963).
Geographic variation in growth rates leads to corresponding differences in total shell length
(TSL). For example B.undatum measured off the Shetland Isles had a mean TSL of 76 mm, whereas
B.undatum measured off the south coast of England had a mean TSL of 54 mm (Shelmerdine et
al., 2007). This makes the setting of a single minimum landing size for B. undatum can be
problematic. Any minimum landing size that is set, will disproportionally affect fishermen across
Europe. Shell thickness and repair affect the growth rate of whelks. When the shell of a whelk is
damaged a large amount of energy is needed to repair it, causing a decrease in the whelks’ growth
and movement. Growing a thicker shell will also reduce their growth rate but will provide better
protection from predators.
Predators
Starfish, decapods, cod, dogfish, and humans are the common predators of adult Buccinum
undatum whereas the larvae are predated by sea-urchins. Both juvenile and adult whelks have
been observed to effectively identify and escape predators (Rochette et al., 1995). The common
whelk has developed a number of dynamic escape responses when threatened by the predatory
asteroid Leptasterias polaris. These include rapid flight (respective for a whelk), shell rocking,
foot contortions, and burrowing (Rochette et al., 2001). B. undatum also have physical
adaptations to protect from predators such as a thicker shell and outer lip, strong sculpture with
low spire, and a narrow aperture. These features strengthen their shell and reduce the probability
of being crushed by crabs or fish.
5
Fisheries
Buccinum undatum have been commercially fished since the 1940s for food and bait. Current
global whelk landings have an annual value of over £7 million in 2007 (French, 2011) and consist
of catches from Ireland, Belgium, Iceland, France, Canada, and the United Kingdom (Shelmerdine
et al., 2007). In England and Wales whelk landings were worth over £10 million in 2012 (Lawler,
2014). Over the last 20 years an increased demand from commercial markets in the Far East, has
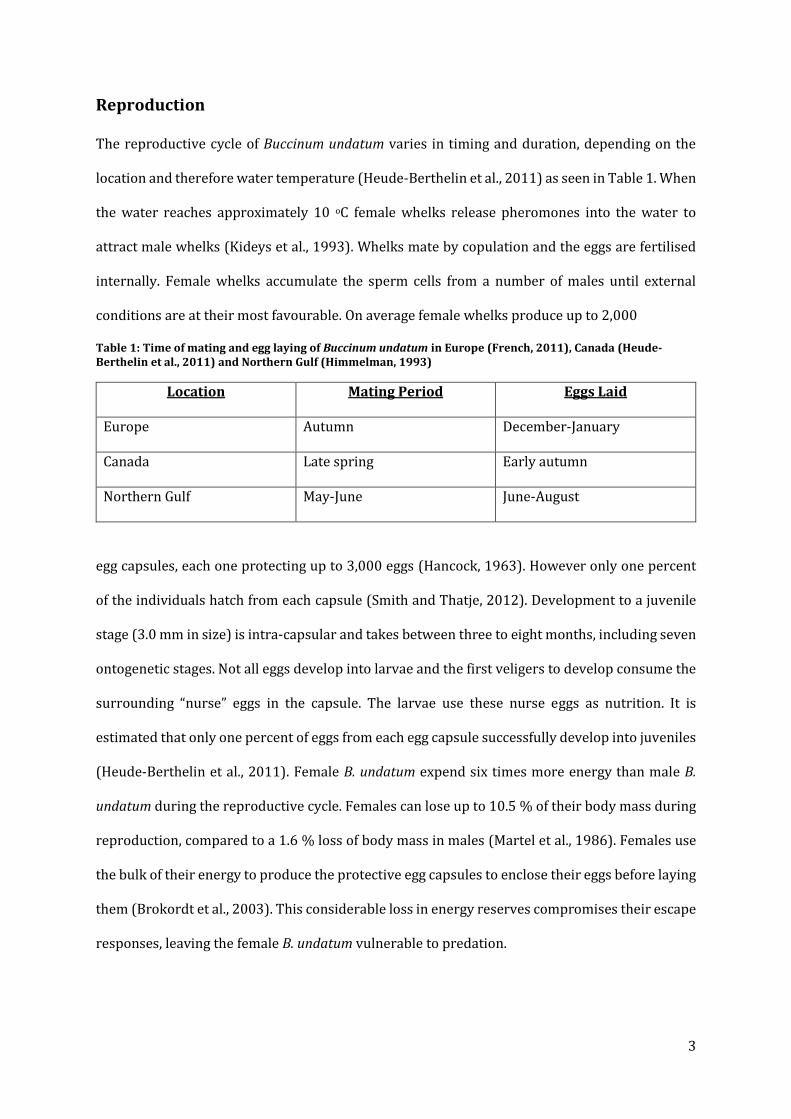
resulted in a dramatic increase in landings (French, 2011). This can be seen in the landings data
from 1985-2011 in the North Sea, North West Scotland, Northern Ireland, and Irish Sea (Figure
2). The levels of local stock and the condition of the market influence the
Figure 2: Landings data sourced from ICES from 1985-2011, in the North Sea, North West Scotland, Northern Ireland, and Irish Sea
expansion or depletion of a whelk fishery. Whelk traps, commonly known as pots, (Figure 3) have
a netted entrance with a quick-release toggle. The net prevents the whelks from escaping and
helps to keep the catch from escaping during stormy conditions. The holes in the side of the pots
provide an escape route for undersized whelks and allow excess mud and water to drain from the
pots during hauling. Whelk pots are relatively inexpensive (£7-25 each) making it comparatively
cheap to get involved in a whelk fishery; this results in large fluctuations in the fishing fleet
numbers.

6
Figure 3: Picture of a whelk pot used by common whelk fishermen in Swansea, South Wales © Georgia Robinson
Fisheries Management
The aim of fisheries management is to maintain a sustainably high yield. A maximum sustainable
yield (MSY) approach can be used to manage fish stocks. The MSY is the highest yield of a fish
stock that can continuously be landed over a long period of time without resulting in a negative
impact on the stocks abundance. However, this method has not proven to be effective as 88 % of
fish stocks in Europe are currently being overfished (Froese et al., 2011). Successful fisheries
management should be based on an ecosystem approach. This approach attempts to take into
account the interactions between biotic, abiotic, and human components, however this is often
not easy due to the environmental complexity. Currently the whelk stocks are not fished at a MSY.
Instead, Annex XII of EU regulation 850/98 has imposed a minimum landing size (MLS) of 45 mm
TSL for Buccinum undatum (Shelmerdine et al., 2007). Whelk fishermen use riddles (Figure 4) to
remove any whelks under the MLS from their catch. The MLS is usually determined by estimating
the size at which at least 50 % of the fished stock have reached sexual maturity (L50). However,
L50 measurements have been found to vary greatly depending on water temperature, and
therefore location (Shelmerdine et al., 2007). The development of highly efficient fishing methods
and equipment, and the increase in market demand from the Far East, will begin to have a
negative impact on whelk populations in the UK (Nicholson and Evans, 1997). Larger whelks
inhabit deeper waters so UK whelk fisheries

7
Figure 4: Riddle used to discard undersized whelks (under 45 mm total shell length) (French, 2011)
(which fish inshore, within 12 nautical miles) are more likely to target younger, smaller whelks.
This may result in growth overfishing, where the mean size of the whelks landed is smaller than
the ideal size that would produce a maximum sustainable yield.
Welsh Fisheries Management
Buccinum undatum are the third most valuable landed species in Wales with average annual
values of £2,536,863 in 2013. European Union and the United Kingdom’s national legislations
have recently requested proof that fisheries are at safe biological limits and are not having a
negative impact the environment. At present the available data for Welsh fisheries is limited,
which has significant implications for effective fishery management.
Tag-Recapture
The first recorded tagging attempt was by a Roman officer named Quintus Pictor in 218 B.C., who
used thread to mark a bird’s leg. Tagging studies on the ecology and biology of fish populations
have been used since 1945. They can be used to study the movement and growth of individuals,
as well as estimating population sizes. The Lincoln-Petersen method, a “two-sample model”, is
the simplest capture-recapture model. A number of individuals from the targeted population are
captured, tagged, and then released. The number of tagged individuals recaptured is used to
estimate the population size at the time of the mark-recapture study. For the Lincoln-Petersen
method the following assumptions must be met:

8
The population is closed; there is no change in population size during the
investigation
There is no loss of tags; 100 % retention rate of tags
Marked and unmarked individuals have the same mortality rates
Marked individuals mix randomly with unmarked individuals
Marked and unmarked individuals are independent; each has the same probability of
being caught in the second sample
The Jolly-Seber method (1965) is a “K-sample” model in which the individuals are distinctly
marked and there are multiple recapture sessions. The same conditions as with the two-sample
model must still be met. It can be used to estimate survival rate, capture probability, and the
number of new individuals immigrating into the population as well as the population size. Table
2 shows the advantages and disadvantages for using capture-recapture techniques (Henry and
Jarne, 2007). The common whelk population density over a certain area can be calculated
Table 2: Advantages and disadvantages for the use of capture-recapture techniques
Advantages Disadvantages
Providing conditions are met, population
estimates can be very accurate
Requires large sampling effort
Useful for populations with restricted ranges Not suitable for highly mobile populations
Permanent tags allow long-term analysis Repeated capture-recapture can be stressful
for the animals
High percentage (50%) of the population
needs to be marked to obtain accurate
estimates
Number of capture sessions needs to be high
(minimum 4-8) to obtain accurate estimates
using underwater cameras, pot sampling, diving, and mark-recapture experiments (Kideys,
1993). Estimations using mark-recapture experiments and underwater cameras have been found
to give overestimates for population density whereas pot sampling and diving methods gave
comparable results. When marking animals the tags should have a high retention rate, be reliable,
and have no impact on the individual. There have been a number of studies which have involved
marking hard-shelled gastropods, including Buccinum undatum. A variety of tags have been used

9
including gouache paint, car body paint, glued plastic markers, thin and thick rubber bands, zip
ties, and plastic tags inserted through a drilled hole in the shell. When choosing a suitable tagging
method for B. undatum there are two problems to consider (Henry and Jarne, 2007). Firstly, if
paint marks or glue have not dried sufficiently before the whelks are released back into the water
it can lead to a poor tag retention rate, resulting in the population size being overestimated. Plenty
of space and time is needed for these methods, neither of which will be possible when tagging is
taking place on a commercial fishing vessel. Secondly, the tag/mark should not affect the survival
probability of the whelk. Survival rate could be reduced by chemical compounds diffusing into
the porous calcium carbonate shell, or if relatively bulky or heavy tags impairing the whelks’
movement. The tag retention rate and the affect the tag has on the whelk should therefore be
quantified before the study.
Aims and Hypotheses
There is currently no published data on the abundance of the common whelk in Wales, so the aim
of this project was to collect baseline data on the local abundance, biology and ecology of
Buccinum undatum.
Observation: Studies have shown that larger whelks are found further offshore and size of whelks
varies with habitat due to diet preferences.
H1: Total shell length of Buccinum undatum varies between habitat types and depth ranges
H0: Total shell length of Buccinum undatum will be similar between habitats and depth
ranges
Observation: Smaller whelks live in higher densities.
H2: The higher the catch per unit effort the larger the percentage of undersized whelks
present
H0: There will be no change in percentage of undersized whelks present with varying
catch per unit effort

10
Observation: When whelk pots have a long soak time the catch per unit effort will start to
decrease due to small whelks escaping, resulting in fewer undersized whelks being caught.
H3: Longer soak times will result in lower catch per unit effort and a smaller percentage
of undersized whelks being caught
H0: Catch per unit effort and percentage undersized will not vary with increased soak time
Observation: Fishers have observed catching more whelks in white coloured pots
H4: Catch per unit effort will be highest in white pots
H0: Catch per unit effort will not vary between white and blue coloured pots
Observation: Whelk prey on rocky sediments consists of decapods crustaceans whereas whelk
prey on sandy sediments consists of urchins and amphipodes.
H5: Percentage bycatch will vary with habitat type
H0 Percentage bycatch will not vary with habitat type
Objectives
The following objectives will be used to investigate these hypotheses:
Determination of length-frequency data and catch per unit effort of a whelk fishery off the
Llyn Peninsula in north Wales
Abundance and movement estimates using mark-recapture methods
To assess the tag retention rate and affect of tagging on individual whelks the following studies
were undertaken in the laboratory:
Tag retention study
Study of the behaviour of whelks after simulated tag-recapture

11
Materials and Methods
Practical Methods
Sampling at sea took place on-board the 32 ft mono-hull commercial vessel out of north Wales.
This vessel fishes with 25 strings with 20 pots per string and eight hours were spent at sea each
day. Spider crab and dog fish were used as bait and the soak time typically ranged for 24-72 hours,
dependent on weather conditions.
Figure 5: Photograph of the commercial fishing vessel (removed)
Figure 6: Sampling location out North Wales (removed)
Fisheries Data
Fisheries data was collected over five days during June and July 2014. All whelks measured were
taken, un-riddled, from the first blue and white pots from every other string. The total shell length
(TSL) was measured to the nearest millimetre, from the siphonal canal to the tip of the apex using
callipers (Figure 7). After measuring, any by-catch present was recorded and
Figure 7: Measuring total shell length (mm) of Buccinum undatum using callipers © Zara Turtle
returned to the sea along with any whelks under the minimum landing size of 45 mm. A GoPro
Hero3 drop down camera was used on the same strings that sample pots were collected from to

12
look at the habitat types across the area. The temperature was recorded through June and July
using a Tiny Tag 2 temperature logger attached to one of the pots.
Laboratory Experiments
Tag Retention Study
During March, 60 common whelks were caught in the Menai Strait and placed into a holding tank
in the School of Ocean Sciences, Bangor University. To test tag retention rate these whelks were
tagged with thick rubber bands (Figure 8) and kept in an 83 L tank circulated with sea-
Figure 8: Photograph of a common whelk used in the tag retention study tagged with a thick rubber band © Zara Turtle
water from the Menai Strait. The whelks were inspected twice a week for four months, the
number of dead whelks and the number of tags lost was recorded.
Behavioural Response to Tagging and Riddling
In a separate experiment, to test how long it would take the whelks to right themselves after
being tagged and inverted, sample whelks were exposed to one of five different treatments. 70
whelks were caught in the Menai Strait and placed into three 83 L holding tanks in the School of
Ocean Sciences, Bangor University. The tanks were circulated with sea-water from the Menai
Strait. The distribution of whelks and treatments between the three tanks can be seen in Table 3.
The control group were left in the tank. Treatment 1 whelks were tagged with neutral coloured
thick rubber bands under the water. Treatment 2 whelks were removed from the tank, shaken in

13
a box for one minute (to simulate being riddled) then tagged with yellow thick rubber bands
before being
Table 3: The number of whelks used in each treatment and in each tank to study how long it would take the
whelks to right themselves after being tagged and inverted
returned to the tank. Treatment 3 whelks were removed from the tank, shaken in a box for one
minute, tagged with blue thick rubber bands, left in a bucket exposed to air for one hour then
returned to the tank. Treatment 4 whelks were removed from the tank, shaken in a box for one
minute, tagged with red thick rubber bands, left in a bucket exposed to air for three hours then
returned to the tank. The experiment was timed so that all of the whelks were returned to the
tank at the same time. On return to the tank all of the whelks (including the control group) were
turned onto their backs and the time taken for them to right themselves was recorded. This
experiment was repeated on a separate occasion using 55 whelks, 12 whelks were used in each
treatment group. 24 hrs after this experiment was completed the whelks were moved to the
middle of the tank and crab bait was placed at the other end. The time taken for the whelks to
reach the bait was recorded.
Abundance Estimates
Tagging events took place over four days during June and July on-board’. The types of pots used
are shown in Figure 9. Tagging data for each day is shown in Table 4. Only whelks
Control
Treatment 1
Treatment 2
Treatment 3
Treatment 4
Total Number
of Whelks
Tank 1 4 5 5 4 5 23
Tank 2 5 5 4 5 4 23
Tank 3 5 4 5 5 5 24

14
Figure 9: Photograph of a black whelk pot used by whelk fishermen in Swansea © Zara Turtle
above the MLS (45 mm) were tagged and the bands were applied either by hand or using a lobster
bander. The locations in which they were released and re-captured were recorded and illustrated
using Arc-Map GIS.
Table 4: Tagging event data
Data Analysis
Statistical analysis was conducted using R software (R Core Team, 2014) or PRIMER (Clarke and
Gorley, 2006). All data was tested for normality (Fox and Weisberg, 2011) and homogeneity
(Sandrini-Neto and Camargo, 2014) before a statistical test was chosen.
Fisheries Data
The total shell length (TSL) was used to construct a length frequency histogram. A Mann-Whitney
test was used to determine any significant differences in TSL between pot colours and between
pot types. Length frequency histograms have been used to illustrate the TSL of whelks present in
normal and scientific pots. Kruskal-Wallis tests were used to analyse any significant differences
Date Number of whelks tagged Number of pots used Colour of tag
17/06/2014 1043 6 Blue
18/06/2014 879 4 Neutral
30/06/2014 962 6 Yellow
15/07/2014 1123 7 Green
15
in TSL between depth and between habitat types (Girdaudoux, 2013). A linear regression was
used to relate changes in TSL with depth.
ANOSIM was used to compare variation in catch per unit effort (CPUE) with soak time and depth.
The CPUE data was twice square-root transformed before one-way ANOVAs were used to test for
significant differences between different coloured pots and between pot types. The CPUE data
was square root transformed before a one-way ANOVA was used to test for significant differences
between habitat types.
The number of undersized whelks was used to calculate an overall percentage of undersized
whelks discarded. A linear regression was used to relate changes in the percentage undersized
whelks with catch per unit effort. The percentage of undersized whelks was calculated separately
for each pot colour and pot type. A Mann-Whitney test was used to analyse differences in
percentage undersized whelks with pot type. A one-way ANOVA was used to test for significant
differences in percentage of undersized whelks between habitat types. A power analysis was used
to determine the sample size required for each habitat type to detect an effect of a given size with
a given degree of confidence. ANOSIM was used to compare variation in the percentage of
undersized whelks with depth and soak time.
The proportion of bycatch of the total catch was calculated and a list of the species caught was
made. Mann-Whitney tests were used to test for significant differences in percentage bycatch
between pot colours and pot types. A one-way ANOVA was used to test for significant differences
in percentage by-catch and habitat type. The species composition of bycatch at each depth range
was graphically analysed. ArcMap was used to illustrate the distribution of percentage of bycatch
over the fishing area using graduated colour markers.

16
Study of Behavioural Responses
The tag retention rate after a four month period was calculated. Box plots were created to display
the time taken for the whelks to right themselves after being inverted and the time taken for the
whelks to respond to bait. Kruskal-Wallis tests were used to detect any tank effects and to
determine any significant differences in response times between treatments.
Abundance Estimates
ArcMap was used to illustrate the positions of release and recapture for each coloured band.
These maps were used to calculate the mean minimum distance travelled for each band colour.
The percentage of recaptures was calculated for each colour band, as well as an overall recapture
rate. Due to the blue band and neutral band tagging events being on consecutive days they have
been treated as one tagging event. Abundance estimates were calculated using the Lincoln-
Petersen model (Eqt 1). The abundance estimates for the blue and neutral tagging event
𝑵 =𝑴𝑻
𝑹
Equation 1: Lincoln=Petersen Model, where N= total population size; M=number of individuals marked initially; T=total of individuals in second sample; and R= number of marked individuals on recapture
and the yellow tagging event were calculated using a three week period after the initial tagging
and release. The abundance estimate for the green tagging event was calculated using a one week
period after the initial tagging and release because the fishermen relocated their fishing efforts
after this date. The area of the main fishing zone was estimated by drawing a polygon round the
release and recapture points on ArcMap. Using the abundance estimates and the area of the main
fishing zone the density of whelks present was determined.

17
Results
Fisheries Data
Total Shell Length
A total of 9041 whelks were measured during five sampling days. The length-frequency
histogram of the whelks measured during the sampling period is presented in Figure 10. The
Figure 10: Length-frequency histogram of the Buccinum undatum measured in north Wales sampling area. Each class size represents 5 mm.
mean total shell length (TSL) was 54.6 mm and the largest and smallest whelks were measured
at 119.00 mm and 10.00 mm respectively. There was a significant difference in median TSL
between blue and white pot colours (Mann-Whitney W=8688007, n1=3463, n2=4629, P<0.05)
(Figure 11) and between scientific and normal pot types (Mann-Whitney W=3249889, n1=949,
n2=8092, P<0.05) (Figure 12), both of which show bimodal distributions.
TSL vs pot colour
Pot Colour
Blue White
Mean T
SL (
mm
)
0
10
20
30
40
50
60
a

18
Figure 11: a) Bar chart with standard error bars illustrating mean total shell length (mm) for blue and white pot colours from the north Wales sampling area. b) Length frequency histogram for whelks caught in blue pots from the north Wales sampling area. Each class size represents 5 mm. c) Length frequency histogram for whelks caught in white pots from the north Wales sampling area. Each class size represents 5 mm.
Figure 12: a) Bar chart with standard error bars illustrating mean total shell length (mm) for normal and scientific pot types from the north Wales sampling area. b) Length frequency histogram for whelks caught in standard pots from the north Wales sampling area. Each class size represents 5 mm. c) Length frequency histogram for whelks caught in scientific pots from the north Wales sampling area. Each class size represents 5 mm.
TSL varied significantly with depth (χ24=218.210, P<0.05) (Figure 13). Whelks caught at 15-17 m
depth were significantly larger than those caught at other depths (Table 5). There was no linear
TSL vs pot type
Pot Type
Normal Scientific
Mea
n T
SL (
mm
)
0
10
20
30
40
50
60
70
c b
a
c b

19
relationship between TSL and depth (P=0.767, R2<0.1). TSL also varied significantly between
each habitat type (χ22=195.05, P<0.05) (Figure 14).
Table 5: Total shell length data for each depth range
Depth
(m)
Number of
Whelks
Measured
Mean
(mm)+/- SD
Minimum
TSL (mm)
Maximum
TSL (mm)
12-14 294 50.1 0.8 10 94
15-17 503 60.5 0.7 18 110
18-20 3017 53.6 0.3 18 119
21-23 2393 54.5 0.3 17 115
24-26 1256 48.8 0.4 20 115
TSL vs depth
Depth (m)
12-14 15-17 18-20 21-23 24-26
Mea
n T
SL
(m
m)
0
10
20
30
40
50
60
70
b a
d c
f e

20
Figure 13: a) Bar chart with standard error bars illustrating mean total shell length (mm) for each depth range from the north Wales sampling area. b) Length frequency histogram for whelks caught at 12-14 m depth from the north Wales sampling area. Each class size represents 5 mm. c) Length frequency histogram for whelks caught at 15-17 m depth from the north Wales sampling area. Each class size represents 5 mm. d) Length frequency histogram for whelks caught at 18-20 m depth from the north Wales sampling area. Each class size represents 5 mm. e) Length frequency histogram for whelks caught at 21-23 m depth from the north Wales sampling area. Each class size represents 5 mm. f) Length frequency histogram for whelks caught at 24-26 m depth from the north Wales sampling area. Each class size represents 5 mm.
Figure 14: a) Bar chart with standard error bars illustrating mean total shell length (mm) for each habitat type from the north Wales sampling area. b) Length frequency histogram for whelks caught on gravel from the north Wales sampling area. Each class size represents 5 mm. c) Length frequency histogram for whelks caught on coarse sand from the north Wales sampling area. Each class size represents 5 mm. d) Length frequency histogram for whelks caught on a muscle bed from the north Wales sampling area. Each class size represents 5 mm.
Catch per Unit Effort
The mean number of whelks caught per pot was 105, this equates to 3.16 kg per pot. The catch
per unit effort (CPUE) in June and July showed no variation with time or temperature. There were
no significant differences in CPUE between soak times (ANOSIM R=0.004, P=0.369). One-way
ANOVAs revealed there were no significant differences in CPUE between pot colours
(F(1,75)=0.281, P=0.598), pot types (F(1,81)=2.540, P=0.115) or habitat types (F(2,5)=0.251, P=0.787).
TSL vs habitat
Habitat Type
Gravel Coarse Sand Muscle Bed
Me
an
TS
L (
mm
)
0
10
20
30
40
50
60
70
a
b
d c

21
CPUE varied significantly with depth (ANOSIM R=0.073, P=0.033) (Table 6) with the shallower
depths having lower CPUEs. From Figure 15, b was significantly different to c, d, and e whilst a
was significantly different from e.
Table 6: Significant results from an ANOSIM pair-wise comparison for catch per unit effort between depth ranges (non-significant results excluded)
Figure 15: Bar chart with standard error bars illustrating the catch per unit effort in the north Wales sampling area from each depth range
Undersized Whelks
Over the five sampling days 32.6 % of the whelks caught were undersized (less than 45 mm total
shell length). The percentage of undersized whelks per pot can be predicted from the CPUE by
the following formula: y=0.001x+0.706, R2=0.079. There was no significant difference in the
percentage of undersized whelks between blue and white pot colours, having 30.9 % and 36.1 %
undersized whelks respectively. 33.9 % of the whelks caught in normal pots were undersized
whereas 21.6 % of the whelks caught in the scientific pots were undersized, although this is a
larger variation than for between pot colours the median percentage undersized for each pot type
did not vary significantly (Mann-Whitney W=237.5, n1=77, n2=5, P=0.388). There was no
Pairwise Test P
15-17 - 18-20 0.039
15-17 - 21-23 0.004
15-17 - 24-26 0.015
12-14 - 24-26 0.016
Depth (m)
12-14 15-17 18-20 21-23 24-26
Ca
tch
pe
r U
nit E
ffo
rt
0
50
100
150
200
250
a
b
c d
e

22
significant difference found in percentage undersized between habitat types (F(2,3)=2.749,
P=0.21), however when the data was displayed graphically there seemed to be a large amount of
variation (Figure 16). The lack of significant difference may have been due to the small sample
sizes. Power analysis, conducted with R software using the pwr package developed by
Figure 16: Bar chart illustrating the mean percentage of undersized whelks caught in the north Wales sampling area on each habitat type
Stephane Champley, used the effect size, significance level, and power to determine that at least
21 samples for each habitat type would be needed to be able to detect any significant effects with
confidence. Percentage undersized varied significantly between depth ranges (ANOSIM R=0.171,
P<0.05) (Table 7). From Figure 16, c varied significantly with a, b and e whilst d varied
significantly with e.
Table 7: a) Significant results from an ANOSIM pair-wise comparison for percentage of undersized whelks between depth ranges. Unsignificant results not included. b) Percentage undersized data for each depth range.
Habitat Type
Gravel Coarse Sand Muscle Bed
% U
nd
ers
ize
d
0
10
20
30
40
50
60
Pairwise Test P
12-14 - 18-20 0.05
15-17 - 18-20 0.008
18-20 - 24-26 0.005
21-23 - 24-26 0.045
a

23
Figure 17: Bar chart of the percentage of undersized whelks caught in the north Wales sampling area from each depth range
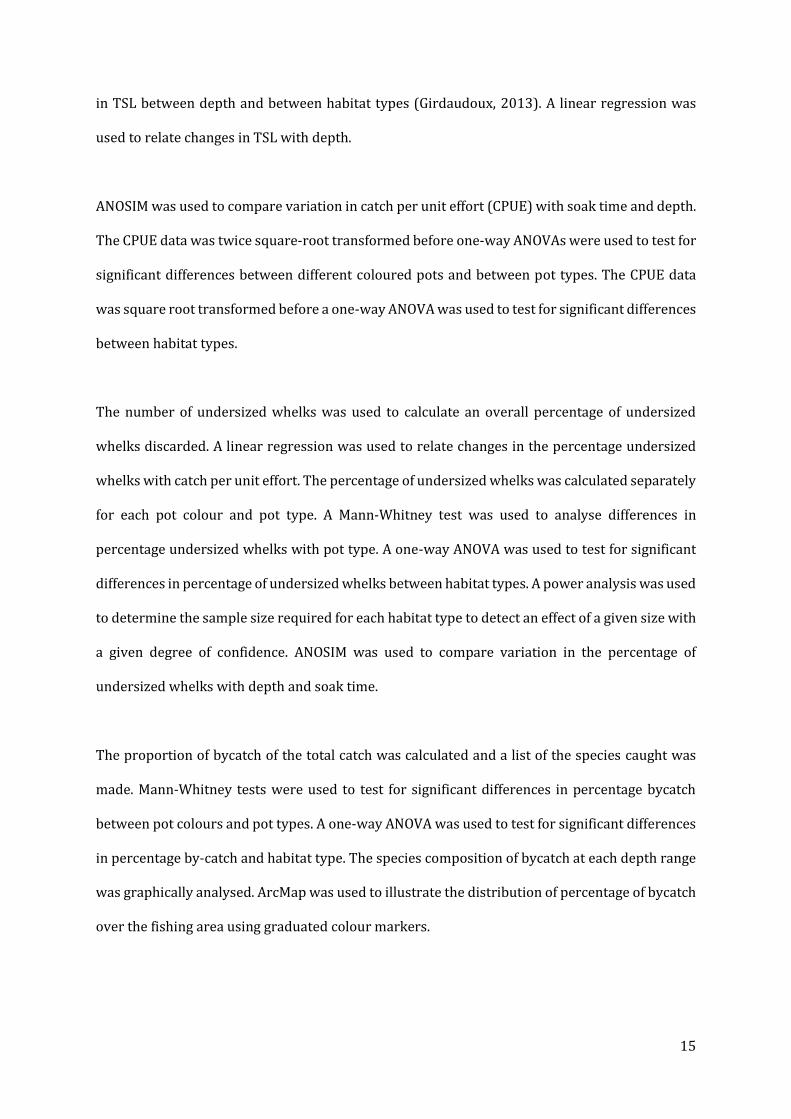
Significant differences were found in percentage undersized between each soak time (ANOSIM
R=0.870, P<0.05) (Table 8) (Figure 18).
Table 8: Percentage undersized data for each soak time
Depth (m)
Number
of Pots
Sampled
Mean (%)Minimum
(%)
Maximum
(%)
12-14 2 33.245 32.857 33.632
15-17 4 10.237 7.087 13.333
18-20 14 25.779 4.839 61.628
21-23 15 22.636 0.000 76.829
24-26 4 27.610 2.899 49.906
Depth (m)
12-14 15-17 18-20 21-23 24-26
% U
nders
ized
0
10
20
30
40
Soak
Time
(hrs)
Number
of Pots
Sampled
Mean (%)Minimum
(%)
Maximum
(%)
24 19 24.027 0.000 61.628
42 8 16.750 4.839 38.585
78 12 27.319 1.351 76.829
b
a
b
c
d e
24
Figure 18: Bar chart to illustrate the percentage of undersized whelks caught in the north Wales sampling area after each soak time (hrs)
Bycatch
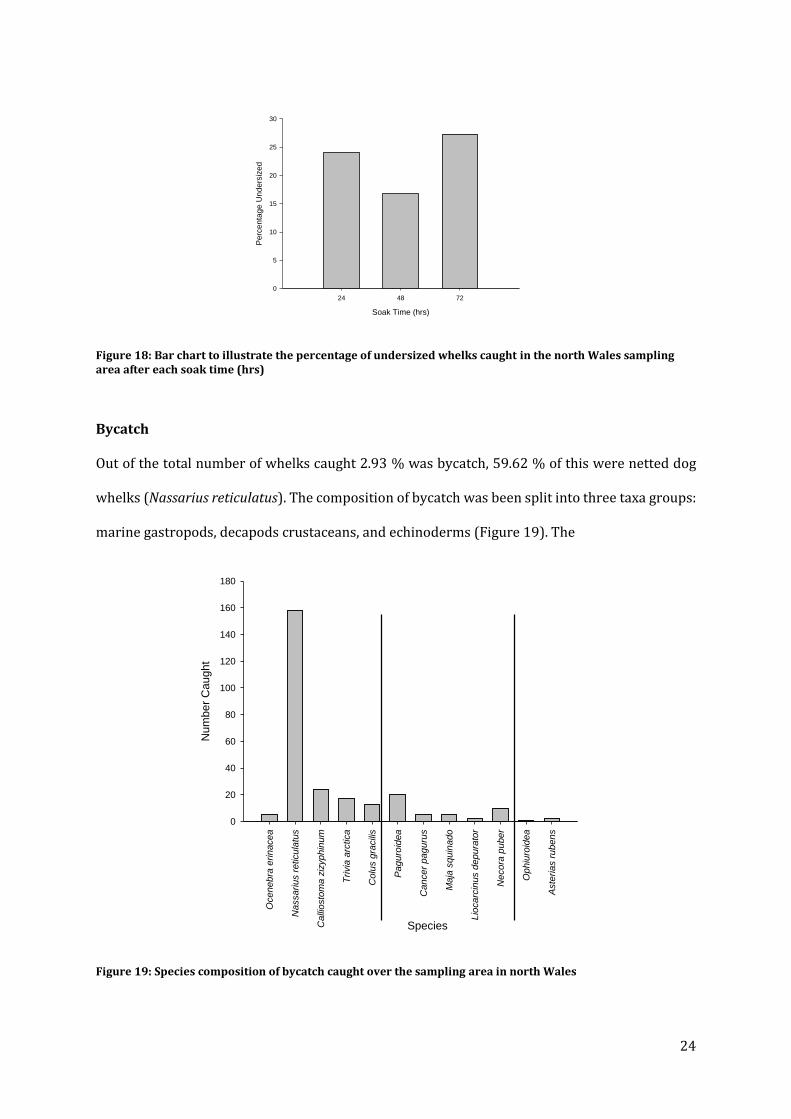
Out of the total number of whelks caught 2.93 % was bycatch, 59.62 % of this were netted dog
whelks (Nassarius reticulatus). The composition of bycatch was been split into three taxa groups:
marine gastropods, decapods crustaceans, and echinoderms (Figure 19). The
Figure 19: Species composition of bycatch caught over the sampling area in north Wales
Soak Time (hrs)
24 48 72
Pe
rce
nta
ge
Un
de
rsiz
ed
0
5
10
15
20
25
30
Species
Ocenebra
erinacea
Nassarius r
eticula
tus
Calli
osto
ma z
izyphin
um
Trivia
arc
tica
Colu
s g
racili
s
Paguro
idea
Cancer
paguru
s
Maja
squin
ado
Lio
carc
inus d
epura
tor
Necora
puber
Ophiu
roid
ea
Aste
rias r
ubens
Nu
mb
er
Ca
ugh
t
0
20
40
60
80
100
120
140
160
180

25
distribution of the percentage bycatch caught is illustrated in Figure 20 and the percentage of
each taxa present on every habitat type is shown in Table 9. The gravel habitat had the highest
percentage bycatch present (64.7 %) followed by the muscle bed (23.5 %) and the coarse sand
habitat had the least percentage bycatch present (11.8 %). There was no significant difference
Figure 20 removed
Figure 20: Map showing the percentage of bycatch caught at each sampling point across the sampled north Wales area
Table 9: Percentage bycatch present on each habitat type
in the median percentage bycatch between pot colours (Mann-Whitney W=840, n1=37, n2=40,
P=0.301) or between pot types (Mann-Whitney W=324, n1=77, n2=6, P=0.096), however this may
be due to the small sample size for the scientific pots (Figure 21). A one-way ANOVA analysis did
not show any significant differences in percentage bycatch between habitat types
Figure 21: Scatter plot of percentage bycatch caught in the north Wales sampled area from each normal and scientific pot sampled
Gravel Coarse Sand Muscle Bed
Marine Gastropods 45 % 100 % 88 %
Decapod Crustaceans 55 % 0 % 12 %
Echinoderms 0 % 0 % 0 %
Pot Type
Normal Scientific
% B
yca
tch
0
20
40
60
80
100
120
26
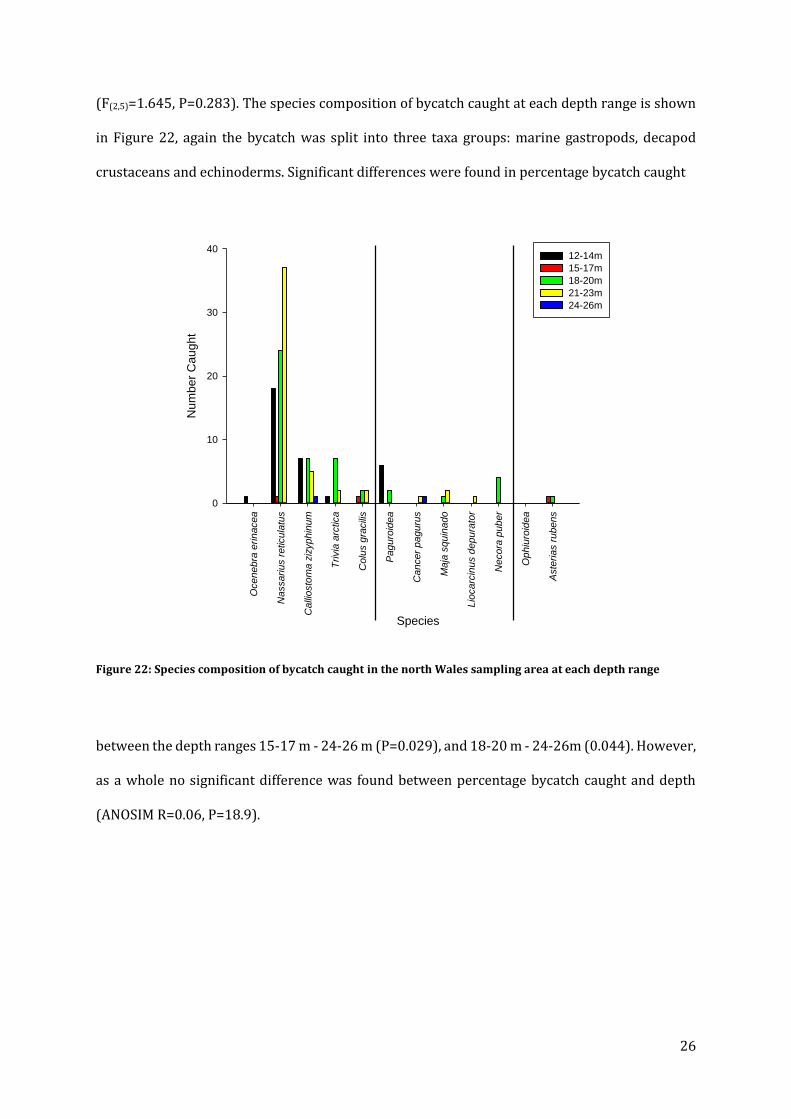
(F(2,5)=1.645, P=0.283). The species composition of bycatch caught at each depth range is shown
in Figure 22, again the bycatch was split into three taxa groups: marine gastropods, decapod
crustaceans and echinoderms. Significant differences were found in percentage bycatch caught
Figure 22: Species composition of bycatch caught in the north Wales sampling area at each depth range
between the depth ranges 15-17 m - 24-26 m (P=0.029), and 18-20 m - 24-26m (0.044). However,
as a whole no significant difference was found between percentage bycatch caught and depth
(ANOSIM R=0.06, P=18.9).
Species
Oce
ne
bra
erin
ace
a
Na
ssa
riu
s r
eticu
latu
s
Ca
llio
sto
ma
ziz
yp
hin
um
Trivia
arc
tica
Co
lus g
racili
s
Pa
gu
roid
ea
Ca
nce
r p
ag
uru
s
Ma
ja s
qu
ina
do
Lio
ca
rcin
us d
ep
ura
tor
Ne
co
ra p
ub
er
Op
hiu
roid
ea
Aste
ria
s r
ub
en
s
Num
be
r C
au
ght
0
10
20
30
4012-14m
15-17m
18-20m
21-23m
24-26m

27
Laboratory Experiments
Tag Retention Study
After four months of the tag retention experiment the thick rubber bands had a 100 % tag
retention rate.
Behavioural Response to Tagging and Riddling
From the first study of behavioural responses no tank effect was found between the three tanks
(χ22=0.184, P=0.668). There was no significant difference in the time taken for the whelks to right
themselves after inversion between treatment groups (χ24=7.881, P=0.096) (Figure 23).
Figure 23: Box plot to illustrate the time taken for the whelks to right themselves after being inverted. Control-Whelks were inverted under the water. T1-Whelks were tagged under the water then inverted. T2-Whelks were removed from the tank, shaken in a box for 1 minute, tagged, and then returned to the tank. T3-Whelks were removed from the tank, shaken in a box for 1 minute, tagged, left in a bucket exposed to air for 1 hour and then returned to the tank. T4- Whelks were removed from the tank, shaken in a box for 1 minute, tagged, left in a bucket exposed to air for 3 hours and then returned to the tank.
After three hours whelks from each of the treatment groups, apart from treatment 4 whelks, had
responded to the bait (Figure 24). The response to bait did not significantly differ between these
treatments (χ23=4.609, P=0.203).

28
Figure 24: Box plot to illustrate the time taken for the whelks to respond to crab bait. Control-Whelks were inverted under the water. T1-Whelks were tagged under the water then inverted. T2-Whelks were removed from the tank, shaken in a box for 1 minute, tagged, and then returned to the tank. T3-Whelks were removed from the tank, shaken in a box for 1 minute, tagged, left in a bucket exposed to air for 1 hour and then returned to the tank. T4 whelks have been excluded as no animals responded within 3 hours.
Abundance Estimates
The positions of release and recapture for the blue, neutral and yellow banded whelks are
illustrated in Figure 25. GPS coordinates could not be recorded for the release of the green banded
whelks so these are not included. Overall there was a recapture rate of 3.29 %. The mean
minimum distance travelled for each of these colours are displayed in Table 10. Three
Table 10: Mean minimum distance travelled by the blue, neutral, and yellow banded whelks
yellow banded whelks, which were recaptured 24 hrs after being released, travelled a minimum
distance of 111.34 m. Table 11 shows the whelk abundance and density estimates for each tagging
event. On average, the whelk population is estimated to be 11,319,410 over a 26 km2 area.
Colour Band
Mean Minimum
Distance
Travelled (m)
+/- SE
Blue 282.3 45.1
Neutral 107.8 20.3
Yellow 94.3 17.0

29
Table 11: Abundance and density estimates of the whelk population in North Wales
Colour Band Abundance 95% Confidence Limits Denisty (whelks per m2)
Blue and Neutral 14656908 14560606 - 14671756 1.774
Yellow 15734219 15686172 - 15782549 1.653
Green 3567102 3547600 - 3586817 7.290

30
Figure 25 removed
Figure 25: Maps illustrating the release and recapture points of each coloured tag over the sampled north Wales area
Discussion
Total Shell Length
During June and July 2014 9041 Buccinum undatum were sampled from The fishing location,
north Wales giving a good sample size for determining the whelk population structure. The
overall mean TSL in this study was 54.6 mm (range 10-119 mm, SE ± 0.19). The mean TSL for
whelks sampled from normal pots was 54.1 mm (range 10-119 mm, SE ± 0.20) and 58.3 mm
(range 24-115 mm, SE ± 0.59) for scientific pots. These values are much smaller than the mean
TSL obtained by the Buccinum undatum sampled in the same area using the scientific pots during
June and July 2013 (66.47 mm, range 22-110 mm). This may be due to the use of B.undatum from
scientific pots only, where the smaller whelks can escape from the larger holes in the bottom of
the pot. The recent smaller mean TSL value could be a result of fishing pressure on the area if the
larger whelks are being removed by the fishing effort. This can be seen from the monthly mean
TSL taken from the same area using scientific pots in 2013 (Figure 26) where the mean TSL has
decreased throughout the year. This could be an example of growth overfishing,

31
Figure 26: Mean total shell length variation of Buccinum undatum caught in scientific pots from May-October 2013
this occurs when the mean size of the whelks caught is smaller than the size that would produce
the maximum yield. Growth overfishing can lead to recruitment overfishing where the adult
whelk population is depleted to a point when it doesn’t have the reproductive capacity to
replenish itself. The current mean TSL for the sampled area is also smaller than the mean TSL for
Camarthen Bay, south Wales (67.4 mm, range 19-111 mm) measured in 2011 (French, 2011) and
the mean TSL for the Shetland Isles (84.1 mm, range 39-122 mm) measured in 2006 (Shelmerdine
et al., 2007). The B. undatum fishery off the Shetland Isles has only been in operation for 30 years,
making it a comparatively new fishery. This may explain its high mean TSL. B.undatum measured
in south England in 2006 (54.3 mm, range 31-86 mm) (Shelmerdine et al., 2007) and in 2009
(49.4 mm, range 8-102 mm) (Lawler, 2009) had a similar mean TSL to those measured in north
Wales 2014 but had a much smaller range of sizes. The relatively small TSL in south England may
be because the B.undatum fishery has been in operation for a much longer period i.e. since 1947.
As well as fishing pressure there are a number of factors which influence the TSL of marine
molluscs. Shell growth requires energy so food availability is a limiting factor for TSL (Moran et
al., 1984). Areas in which the TSL is low could indicate high levels of intra or inter-specific
competition for food resources or poor habitat areas which yield low prey numbers. The presence
of predators can cause marine molluscs to produce a thicker shell for protection, decreasing the
Date
May
2013
June 2
013
July
2013
August 2013
Octo
ber
2013
Me
an
To
tal S
he
ll L
en
gth
(m
m)
55
60
65
70
75
80
32
total shell length at age (M. Nakota, 2000). The temperature and salinity of the water can alter the
metabolism and shell magnesium incorporation of marine molluscs. Fluctuations in water
temperature and salinity can also alter the calcium carbonate solubility, saturation state, and
equilibrium needed for shell growth (Waldbusser et al., 2010). Areas with warmer water
temperatures and higher salinities will have more calcium carbonate available for shell growth
(because it is less soluble in warmer water), resulting in marine molluscs have a higher growth
rate and larger total shell lengths. Wave action has been found to alter the shell formations of the
dog whelk, Nucella lapillus (Crothers, 1983). In areas of high wave action, such as exposed
headlands, the shell edges are battered when the whelks roll along the sea bed, causing them to
form short, squat shell shapes with small total shell lengths. Dog whelks inhabiting sheltered
areas were found to have elongated shells with greater total shell lengths. However after finding
exceptions to this theory Crothers concluded that wave action would not be the sole influence on
shell shape and length. For example, elongated shell length could be an adaptation to avoid
desiccation; dog whelks with longer total shell lengths are able to retain far more water within
their shell than shorter dog whelks. There are a number of trade-offs that take place which can
affect shell growth and total shell length. It could be assumed that a thicker, shorter shell will
provide greater protection from predators and that when a whelk shell is damaged it must use a
large amount of energy to repair it. This can cause a decrease in growth. However the trade-off
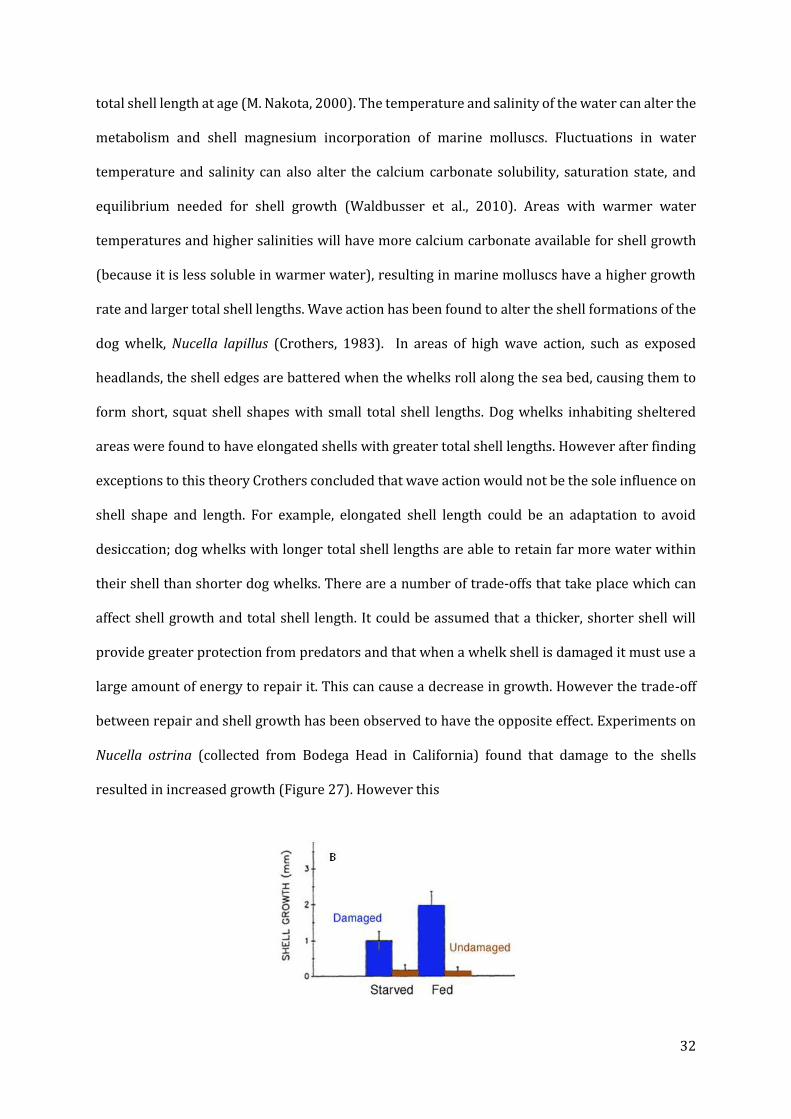
between repair and shell growth has been observed to have the opposite effect. Experiments on
Nucella ostrina (collected from Bodega Head in California) found that damage to the shells
resulted in increased growth (Figure 27). However this

33
Figure 57: Effect of starvation and shell damage on shell growth in Nucella ostrina (collected from Bodega Head in California)
experiment was conducted under laboratory conditions for only 34 days and was not repeated.
Therefore the reproductive period and varying sea water temperatures would not be taken into
account.
Length Frequency
The length-frequency histogram (Figure 10) of the Buccinum undatum sampled in June and July
shows a bimodal distribution with a large range in total shell length (TSL). The size range with
the largest representation is between 40-45 mm. Another much smaller peak can also be seen
between 80-85 mm. B.undatum sampled from scientific pots in the same area during June and
July 2013 (Figure 28) had a multimodal distribution with three distinct cohorts (represented by
vertical lines). The first cohort ranges from 20-35 mm, the second from 35-75 mm and the third
Figure 28: Cumulative length frequency histogram of whelks caught from scientific pots in the north Wales area during June and July 2013. Each class size represents 5 mm. (J. Haig, unpublished data)
from 75-105 mm. The bi and multi modal distributions observed could be due to sexual
differences, age classes, environmental effects, genetic effects or social interactions (Thorpe,
1977). The length frequency histograms plotted for each sex separately showed similar
distributions so the multimodal distribution pattern is not due to sexual differences. An example
of an environmental effect would be if some larval whelks were dispersed onto a favourable

34
habitat. A favourable habitat would give them protection and provide good food resources so the
larval whelks here would grow more rapidly than subordinate individuals. The difference
between the bi and multi modal distributions could be due to the use of scientific pots only in the
2013 samples. The holes in the bottom of the scientific pots are larger than the holes in the side
of the normal pots, allowing smaller whelks to leave the pot. However if the scientific pots are full
the small whelks will not be able to reach the holes in the bottom of the pot to escape. In general,
it is thought that every one mm increase in hole size results in a 1.5-3 % reduction in the
percentage of undersized whelks caught (Kent and Essex IFCA, 2014).
Depth
Total shell length was found to vary significantly with depth. Larger whelks were found in
shallower water depths (mean 60.5 mm at 15-17 m) than smaller whelks (mean 48.8 mm at 24-
26 m). Pots hauled from the deeper waters (24–26 m) had the highest percentage of undersized
whelks (27.6 %). These findings oppose a previous theory that larger whelks are found offshore
whilst smaller whelks remain inshore (Valentinsson et al., 1999). In contrast, whelks sampled in
Camarthen Bay (French, 2011) had larger total shell lengths in depths between 26-30 m (mean
TSL 71.8 mm) whereas the smaller whelks were found between 21-25 m depth (mean TSL 63.3
mm). Some studies have shown that shell growth shows no variation with depth (Hanson et al.,
1988) meaning that the differences between north and south Wales populations could be due to
other limiting factors such as habitat type. Whelks will have to balance food availability with ideal
water temperature, and therefore depth. Although habitats with better food sources may be
located at greater depths the water temperature here may be too cold for the whelks to function
affectively.
35
Habitat Type
Total shell length was found to vary significantly with habitat type, with larger Buccinum undatum
being caught on the muscle beds. The gravel habitat yielded the smallest whelks with only 8 % of
whelks measuring over 65 mm TSL. Larger B. undatum will be able to feed on the muscles whereas
the smaller whelks would feed off smaller prey such as urchins and polychaetes found on sandy
and gravel substrate. Food availability is a limiting factor for shell growth. Experiments on Nucella
ostrina (collected from Bodega Head in California) found that whelks which were starved had a
lower growth rate than fed whelks (Figure 29). Catch per unit effort was lowest over the muscle
bed, suggesting that larger whelks are more sparsely populated and smaller whelks live in higher
densities. The muscle bed is part of an area which is closed to scallop trawling. The shells of
whelks which inhabit trawled areas could be damaged by the trawling gear. A study on the affect
of beam trawling on the common whelk observed that only 40 % of the whelks caught with a
beam trawl survived and that shell repair took up to six weeks (Mensink et al., 2000). This
suggests that whelks on the coarse sand or gravel habitat which are damaged by trawling gear
will have a smaller TSL as more energy is put in to shell repair. Although there was no significant
difference found between percentage of undersized whelks and habitat type the graphical
illustration showed the gravel habitat to have the highest percentage of undersized whelks and
the muscle bed to have the smallest percentage of undersized whelks. This was thought to be due
to the small sample sizes (n=3 for each habitat type). Results of the power analysis concluded that
21 samples would be needed for each habitat type to detect any significant effects with
confidence.
Catch per Unit Effort
On average, during June and July in the north Wales sampling area, 3.16 kg Buccinum undatum
were caught per pot. This is comparable with landings data from south Wales (2.65 kg per pot)
(French, 2011) and Jersey (3.3 kg per pot) (Morel and Bossy, 2004), implying that CPUE is

36
consistent between the locations I have cited. CPUE data from a Swedish B.undatum fishery
(Valentinsson et al., 1999) reported much lower landings of 1.3 kg per pot. This could be due to
colder water temperatures or fishing over unsuitable habitat.
Soak Time
In this study the CPUE did not vary significantly with soak time whereas in the whelk fishery in
Sweden it was found that CPUE increased with lengthened soak time (Valentinsson et al., 1999).
Contrary to this, an assessment of the common whelk fishery in the southwest Irish Sea (Fahy et
al., 2000) found that the CPUE fell with increased soak time (Figure 29). This is usually the case
in areas with strong tidal currents. Increased soak time in areas of strong currents results in gear
becoming tangled and pots rolling over, allowing the whelks to escape. The smell of the bait will
rapidly dissipate in a strong current; this will have two main affects. Firstly, over time whelks will
not be able to sense the bait resulting in fewer whelks entering the pot. Secondly, Cancer pagurus
(the edible crab) which is a common predator to the common whelk will not enter the pot whilst
it can smell crab bait. Once the smell has dispersed the crabs will enter the pot in search of their
whelk prey.
Figure 29: Change in catch per unit effort against soak time in the common whelk fishery of the south Irish Sea (Fahy et al., 2000)

37
Depth
CPUE varied significantly with depth during June and July in the north Wales sampling area, with
CPUE being poorest in shallower depths (mean of 73 whelks caught per pot at 12-17 m) and
greatest in the deeper depth ranges (mean of 201 whelks caught per pot at 24-26 m). This is
comparable to the variation in CPUE in Sweden (Valentinsson et al., 1999) where CPUE was
highest between 25-30 m and lowest between 10-15 m. An opposite trend was reported in south
Wales (French, 2011) where CPUE was highest between 16-20 m depth and least between 26-30
m depth. The variations in CPUE between north and south Wales could again be due to differences
in habitat type. CPUE might be low in shallower waters if there are more small whelks present
because many of them may be undersized and will have to be returned.
Percentage Undersized
Over the sampling period in north Wales 32.56 % of the Buccinum undatum caught were below
the minimum landing size (45 mm). In south Wales (French, 2011) the percentage of undersized
whelks caught was considerably lower with 3.55 % undersized. This implies that there is still a
strong recruitment of smaller whelks in the north Wales area whilst the whelk fishery in south
Wales could be in danger of becoming unsustainable. However the difference could also be due
to the south Wales sampling only taking place in one bay, smaller juvenile whelks could be
present further along the coast. Percentage of undersized whelks varied with soak time, the
longest soak time (72 hrs) yielding the highest percentage of undersized whelks. Alternatively it
could be expected that an increase in soak time will result in a reduction in the number of
undersized whelks caught. This is because the bait will be used up and the whelks will start to try
and leave the pot. The smallest whelks will be able to escape through the holes in the side of the
pot resulting in a small percentage of undersized whelks when the pot is hauled. This was the
case with the study of the common whelk fishery in the southwest Irish Sea (Fahy et al., 2000),

38
however disruptions caused by poor weather conditions and relocation of the gear made any
relationships between percentage undersized whelks and soak time hard to interpret.
Bycatch
Although there is little data available in published literature on the bycatch of other fisheries,
whelk fisheries are generally very clean with low bycatch numbers. In the sampled area in north
Wales 2.93 % of the catch was bycatch, made up of marine gastropods, crustaceans, and
echinoderms. The netted dog whelk (Nassarius reticulatus) comprised 59.62 % of the total
bycatch caught. They were caught over all habitat types, constituting for 35 % of the bycatch on
gravel habitat, 25 % on coarse sand and 50 % on the muscle bed. Percentage bycatch in the whelk
fishery in Sweden was 12.42 % out of the total weight with the main bycatch being Neptunea
antique, making up 10 % of this (Valentinsson et al., 1999).
Laboratory Experiments
Tag Retention Study
To make it possible to calculate accurate abundance estimates using the tag-recapture technique
the tag retention rate had to be determined. Other studies (such as Himmelman, 1988) used
rubber bands for their tagging but had not reported any tag retention data. Henry & Jarne, 2007
compared a number of tagging methods for Buccinum undatum including car body paint, nail
varnish, gouache paint, and glued plastic markers. The whelks were returned to their natural
environment and proportion of tag loss was calculated on recapture. The gouache paint and car
body paint had 0.041 and 0.066 mean proportion of loss respectively with the proportion of loss
for the gouache paint being dependent on colour. The glued plastic markers had the lowest mean
proportion of loss, 0.015 over 57 days. Although the glued plastic markers had a high retention
rate, and would enable individual markings, it was unpractical to use them whilst on the fishing
boat. The whelks would need to be dried before the tag was applied and the glue would need

39
space and time to set before they were returned to the water. A study using embossing tape tags
(Kideys, 1994) had a 100 % tag retention rate after the whelks were kept in laboratory conditions
for one year. However, holes need to be drilled into the shell of the whelk to apply this tag, again
making it unpractical for use on whelk fishing boats. An unpublished study by J. Haig (Bangor
University) investigated the tag retention rate of zip ties, thin and thick rubber bands, and glued
plastic markers on B. undatum over a two month period. 20 % of zip-tie tags and 16 % of thin
band tags were lost whereas thick bands and glued plastic markers had 100 % retention rate. It
is because of this that we chose to further investigate the retention rate and use of thick rubber
bands for tagging B. undatum. They could be applied by hand or using a lobster bander and were
not found to deteriorate over the study period.
Behavioural Response to Tagging and Riddling
The study of behavioural responses was conducted to ensure that the tagging process would not
affect the likelihood of them being recaptured. As no significant difference was found in turn over
times between treatment groups after the whelks were inverted, it can be assumed that tagged
whelks will be able to right themselves if they become inverted after being returned to the water.
Very few of the whelks (12 out of 55) responded at all to the addition of crab bait to the tank. Out
of the whelks which did respond there was no significant difference in the time taken for the
whelks to approach the bait between treatments, however none of the “treatment 4” whelks
responded to the bait within three hours. As the whelks were not left out of the water for more
than one hour after tagging on the fishing boat it is unexpected that there will be an unequal
probability for tagged and untagged whelks entering baited pots. The lack of response to the bait
could be due to the poor water flow in the tank, the whelks might not have been able to smell the
bait. A study into the movement of whelks (Himmelman, 1988) found that whelks generally
responded to baited pots within six hours. If the response to bait experiment was to be run again
a longer time could be given for the whelks to respond.

40
Abundance Estimates
Prior to undertaking the study I was unsure how many whelks we would be able to tag and
whether there would be any recaptures at all. For successful population modelling it is suggested
that the tagging effort should aim to tag 10 % of the population and that the recapture rate should
be at least 10 % of those tagged. The overall recapture rate for this study was 3.29 %. The
recapture rate could be influenced by the fishermen temporarily moving strings out of the release
area (to look for better fishing grounds). The mark recapture study on the common whelk that
took place in Sussex also reported very low and variable recapture numbers. Due to the low catch
rate they used pre-marked whelks from an adjacent site to supplement the release numbers
(Lawler, 2014).
Movement
It is believed that Buccinum undatum are sedentary and have limited daily movement (up to 50
m a day when in search of food) (Himmelman, 1988). Research on the movement of the common
whelk in the Gulf of St Lawrence recorded average movements of 2.2-9.2 m in less than six hours
(Sainte-Marie, 1991). A study on the knobbed whelk, Busycon carica (which can grown up to 305
mm in total shell length), observed much lower daily movements which varied significantly with
gender. For male knobbed whelks the mean distance travelled per day was 1.6 m whereas
females had a mean daily movement of 2.6 m (Shalack, 2007). Using Arcmap software it is
estimated that three yellow banded whelks travelled a minimum distance of 111.34 m in 24
hours during this study, this is over twice the expected amount. If the whelks had been
individually marked it would have been possible to determine a mean distance travelled from
the released population.

41
Population Density
The estimated density of the common whelk present in the north Wales fishing area is much
higher than the density calculated for the common whelk in Swedish waters (Valentinsson et al.,
1999). The mean density calculated in this study was 3.57 m2 whereas the density of whelks in
Swedish waters ranged from 0.06-0.13 whelks per m2. This could be due to the water temperature
being much lower in Swedish waters or the habitat being much less favourable. Research into the
density of Buccinum undatum off Douglas, Isle of Man between 1989-1990 used four different
methods to estimate whelk density. The mark-recapture experiment and underwater camera
method gave overestimations for density whereas density estimates from pot sampling and
diving gave comparable results. The overall mean whelk density estimated from pot sampling
ranged from 0.08-0.38 whelks per m2 (Kideys, 1993).
Conclusions
H1: Total shell length of Buccinum undatum varies between habitat types and depth ranges
H0: Total shell length of B. undatum will be similar between habitats and depth ranges
Conclusion: Total shell length was found to vary significantly between habitat types and depth
ranges. B. undatum caught on the muscle beds had greater total shell lengths than those caught
on gravel or coarse sand. Larger whelks were found in shallower water depths than smaller
whelks.
H2: The higher the catch per unit effort the larger the percentage of undersized whelks present
H0: There will be no change in percentage of undersized whelks present with varying catch per
unit effort
Conclusion: No significant relationship was found between CPUE and percentage of undersized
whelks caught. However CPUE was lowest over the muscle bed, where the larger whelks were
caught, implying that larger whelks are less densely populated.

42
H3: Longer soak times will result in lower catch per unit effort and a smaller percentage of
undersized whelks being caught
H0: Catch per unit effort and percentage undersized will not vary with increased soak time
Conclusion: No significant variation in catch per unit effort was found with increased soak time.
H4: Catch per unit effort will be highest in white pots
H0: Catch per unit effort will not vary between white and blue coloured pots
Conclusion: Catch per unit effort did not vary significantly with pot colour
H5: Percentage bycatch will vary with habitat type
H0: Percentage bycatch will not vary with habitat type
Conclusion: No significant difference was found in percentage bycatch and habitat type, but this
may be due to the small sample sizes. Graphically it was shown that gravel habitat had the highest
percentage bycatch present whereas the coarse sand habitat had the least percentage bycatch
present.
Future Studies
Better recapture rates may be obtained by tagging a greater number of whelks. This would
require an increase in time and effort spent tagging on the fishing vessel. The whelks could be
marked with depth tags to enable better analysis of the movement of whelks between depth
ranges. If the whelks had been individually marked the Jolly Seber model could have been used
for the population size estimates. Other estimations such as survival rate, capture probability and
the number of individuals immigrating into the population could also have been calculated using
the Jolly Seber model. Permanent marker pen could be used to individually mark each thick
rubber band. It would have to be done prior to the tagging events on the fishing vessel to allow
the ink to dry and to save time. Although there are a number of improvements that could be made

43
to this study the data collected so far, and long term data outside the timescale of this thesis, has
provided excellent data as a pilot study.

44
References
Brokordt, K.B., Guderley, H.E., Guay, M., Gaymer, C.F., Himmelman, J.H., 2003. Sex differences in reproductive investment: maternal care reduces escape response capacity in the whelk Buccinum undatum. J. Exp. Mar. Bio. Ecol. 291, 161–180.
Chase, R., 2001. The Biology of Terrestrial Molluscs. Landacre Research.
Clarke, K.R., Gorley, R.N., 2006. PRIMER v6: User Manual/Tutorial. PRIMER-E, Plymouth.
Crothers, J.H., 1983. Variation in dog-whelk shells in relation to wave action and crab predation. Biol. J. Linn. Soc. 20, 85–102.
Fahy, E., Masterson, E., Swords, D., Forrest, N., 2000. A second assessment of the whelk fishery Buccinum undatum in the southwest Irish Sea with particular reference to its history of management by size limit.
Fox. J., Weisberg, S., 2011. An {R} Companion to Apllied Regression. Second Edition.
French, C., 2011. Informing the management and conservation of the whelk ( Buccinum undatum ) fishery in South Wales 1–68.
Froese, R., Branch, T., Proelß, A., Quaas, M., Sainsbury, K., Zimmermann, C., 2011. Generic harvest control rules for European fisheries. Fish Fish. 12, 340–351.
Gendron, L., 1992. Determination of the size at sexual maturity of the waved whelk buccinum undatum linnaeus 1758 in the gulf of st. lawrence as a basis for the establishment of a minimum catchable size. J. Shellfish Res. 11, 1–7.
Giraudoux, P., 2013. pgirmess: Data analysis in ecology. R package version 1.5.8.
Haig, J., 2013. Fisheries and Conservation Science Group (unpublished data), Bangor University.
Hancock, D.A., 1963. Marking experiments with the commercial whelk (Buccinum undatum). ICNAF 4, 176–187.
Hanson, J., Mackay, W., Prepas, E., 1988. The effects of water depth and density on the growth of a unionid clam. Freshw. Biol. 19, 345–355.
Hayward, P.J., Ryland, J.S., 1995. Handbook of the Marine Fauna of North-West Europe. Oxford University Press.
Henry, P., Jarne, P., 2007. Marking hard-shelled gastropods: tag loss, impact on life-history traits, and perspectives in biology. Invertebr. Biol. 126, 138–153.
Heude-Berthelin, C., Hégron-Macé, L., Legrand, V., Jouaux, A., Adeline, B., Mathieu, M., Kellner, K., 2011. Growth and reproduction of the common whelk Buccinum undatum in west Cotentin (Channel), France. Aquat. Living Resour. 24, 317–327.
Himmelman, J.H., 1988. Movement of whelks (Buccinum undatum) towards a baited trap. Mar. Biol. 531, 521–531.
45
Himmelman, J.H., 1993. Diet, behaviour and reproduction of the whelk Buccinum undatum in the northern Gulf of St. Lawrence, eastern Canada. Mar. Biol. 430, 423–430.
Kideys, A., Hartnoll, R., Nash, R., 1993. Reproductive cycle and energetic cost of reproduction of the neogastropod Buccinum undatum L. in the Irish Sea. J. Mar. Biol. Assoc. United Kingdom 73, 391–403.
Kideys, A.E., 1993. Estimation of the density of Buccinum undatum (Gastropoda) off Douglas, Isle of Man. Helgoländer Meeresuntersuchungen 47, 35–48.
Kideys, A.E., 1994. Effect of tagging on the growth rate of the neogastropod, Buccinum undatum in the laboratory. Fish. Res. 20, 283–289.
Lawler, A., 2009. Whelk Biology, CEFAS Final Report.
Lawler, A., 2014. Determination of the Size of Maturity of the Whelk Buccinum undatum in English Waters – Defra project MF0231 Funded by Defra.
M. Nakota, 2000. Nonlethal effects of predators on prey populations: predator-mediated change in bivalve growth. Ecology 81, 1031–1045.
Martel, A., Larrivée, D.H., Himmelman, J.H., 1986. Behaviour and timing of copulation and egg-laying in the neogastropod Buccinum undatum L. J. Exp. Mar. Bio. Ecol. 96, 27–42.
McArthur, A.G., Harasewych, M.G., 2003. Molecular systematics of the major lineages of the Gastropoda.
Mensink, B.P., Fischer, C. V., Cadée, G.C., Fonds, M., Ten Hallers-Tjabbes, C.C., Boon, J.P., 2000. Shell damage and mortality in the common whelk Buccinum undatum caused by beam trawl fishery. J. Sea Res. 43, 53–64.
Moran, M.J., Fairweather, P.G., Underwood, A.J., 1984. Growth and mortality of the predatory intertidal whelk Morula Marginalba Blainville (Muricidae): The effects of different species of prey. J. Exp. Mar. Bio. Ecol. 75, 1–17.
Morel, G., Bossy, S., 2004. Assessment of the whelk (Buccinum undatum L.) population around the Island of Jersey, Channel Isles. Fish. Res. 68, 283–291.
Morissette, S., Himmelman, J.H., 2000. Subtidal food thieves: interactions of four invertebrate kleptoparasites with the sea star Leptasterias polaris. Anim. Behav. 60, 531–543.
Nicholson, G.J., Evans, S.M., 1997. Anthropogenic impacts on the stocks of the common whelk Buccinum undatum (L.). Mar. Environ. Res. 44, 305–314.
Pardo, L.M., Johnson, L.E., 2004. Activity and shelter use of an intertidal snail: effects of sex, reproductive condition and tidal cycle. J. Exp. Mar. Bio. Ecol. 301, 175–191.
Rochette, R., Morissette, S., Himmelman, J.H., 1995. A flexible response to a major predator provides the whelk Buccinum undatum L. with nutritional gains. J. Exp. Mar. Bio. Ecol. 185, 167–180.

46
Rochette, R., Tétreault, F., Himmelman, J.H., 2001. Aggregation of whelks, Buccinum undatum, near feeding predators: the role of reproductive requirements. Anim. Behav. 61, 31–41.
Sainte-Marie, B., 1991. Whelk ( Buccinum undatum ) Movement and Its Implications for the Use of Tag–Recapture Methods for the Determination of Baited Trap Fishing Parameters. Can. J. Fish. Aquat. Sci. 48, 751–756.
Sandrini-Neto, L., Camargo, M.G., 2014. GAD: an R package for ANOVA designs from general principles.
Shalack, J., 2007. Movement and Behaviour of Whelks (Family Melongenidae) in Georgia Coastal Waters.
Shelmerdine, R.L., Adamson, J., Laurenson, C.H., Leslie (neé Mouat), B., 2007. Size variation of the common whelk, Buccinum undatum, over large and small spatial scales: Potential implications for micro-management within the fishery. Fish. Res. 86, 201–206.
Smith, K.E., Thatje, S., 2012. Nurse egg consumption and intracapsular development in the common whelk Buccinum undatum (Linnaeus 1758). Helgol. Mar. Res. 67, 109–120.
Thorpe, J.E., 1977. Bimodal distribution of length of juvenile Atlantic salmon (Salmo salar L.) under artificial rearing conditions. J. Fish Biol. 11, 175–184.
Valentinsson, D., Sjödin, F., Jonsson, P.R., Nilsson, P., Wheatley, C., 1999. Appraisal of the potential for a future fishery on whelks (Buccinum undatum) in Swedish waters: CPUE and biological aspects. Fish. Res. 42, 215–227.
Waldbusser, G.G., Voigt, E.P., Bergschneider, H., Green, M.A., 2010. Biocalcification in the Eastern Oyster (Crassostrea virginica) in Relation to Long-term Trends in Chesapeake Bay pH. Estuaries and Coasts 34, 221–231.
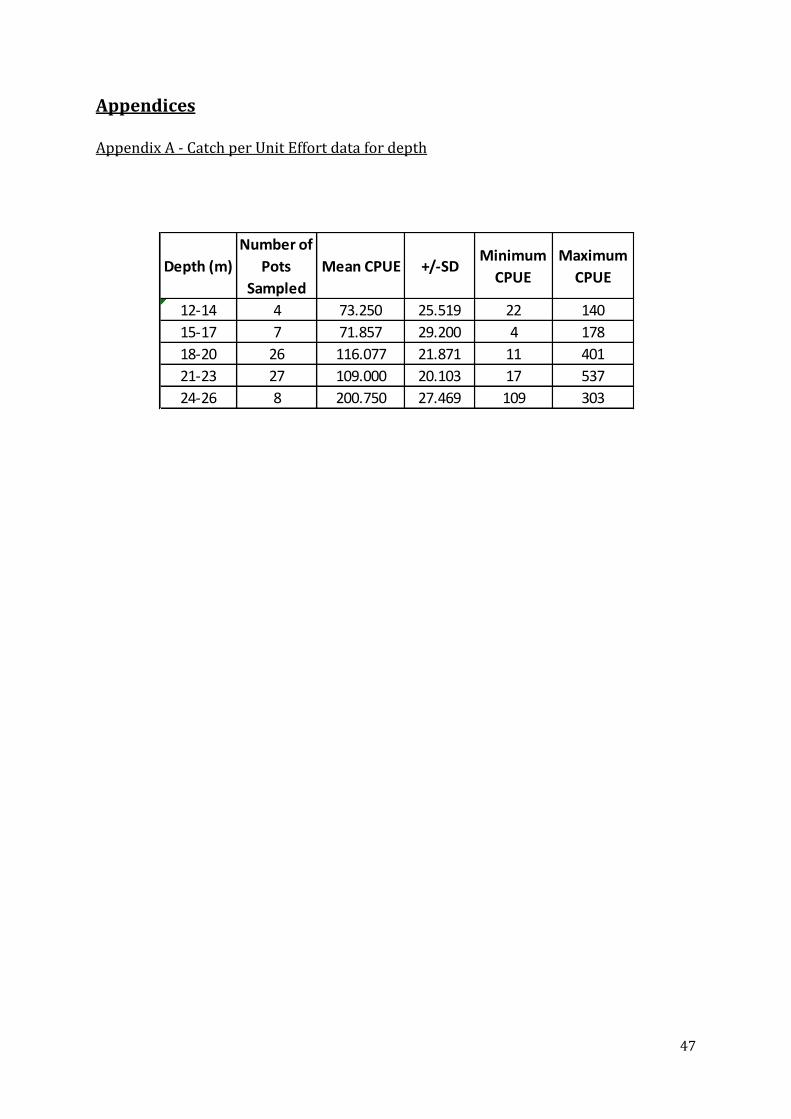
47
Appendices
Appendix A - Catch per Unit Effort data for depth
Depth (m)
Number of
Pots
Sampled
Mean CPUE +/-SDMinimum
CPUE
Maximum
CPUE
12-14 4 73.250 25.519 22 140
15-17 7 71.857 29.200 4 178
18-20 26 116.077 21.871 11 401
21-23 27 109.000 20.103 17 537
24-26 8 200.750 27.469 109 303

48
Appendix B – One-way ANOVA
Used to analyse:
Percentage undersized with depth Percentage undersized with habitat type Percentage bycatch with habitat type CPUE with habitat type CPUE with pot colour CPUE with pot type CPUE with depth
#set up where to find files
setwd("C:/Users/Owner/Documents/Work/DISSERTATION")
getwd()
#import relevant file
undervsdepth<-read.table("% undersized vs depth.csv",header=TRUE,sep=",")
str(undervsdepth)
#check for normaility
#test with shapiro
shapiro.test(undervsdepth$undersized)
#data not normal
#try sqrt transforming data
undervsdepth<-cbind(undervsdepth,sqrt(undervsdepth$undersized))
fix(undervsdepth)
#test with shapiro
shapiro.test(undervsdepth$sqrtundersized)
#data normal
#test for homogeneity
bartlett.test(sqrtundersized~Depth,data=undervsdepth)
#data passes test
#one way anova between habitat types
anovadata<-aov(sqrtundersized~Depth,data=undervsdepth)
summary(anovadata)
#test which depths are significantly different
TukeyHSD(anovadata)

49
Appendix C – Power Test
#power test
pwr.anova.test(k=3,n=,f=0.4,sig.level=0.05,power=0.8)

50
Appendix D – Mann-Whitney U Test
Used to analyse:
Percentage undersized with pot type Percentage bycatch with pot colour Percentage bycatch with pot type TSL with pot type TSL with pot colour
#set up where to find files
setwd("C:/Users/Owner/Google Drive/Work/DISSERTATION")
getwd()
#import relevant file
undervstype<-read.table("% undersized vs pot type.csv",header=TRUE,sep=",")
str(undervstype)
#check for normaility
#test with shapiro
shapiro.test(undervstype$Under)
#data not normal
#try sqrt transforming data
undervstype<-cbind(undervstype,sqrt(undervstype$Under))
fix(undervstype)
#test with shapiro
shapiro.test(undervstype$sqrtunder)
#data not normal
#try sqrt sqrt transforming data
undervstype<-cbind(undervstype,sqrt(undervstype$sqrtunder))
fix(undervstype)
#test with shapiro
shapiro.test(undervstype$sqrtsqrtunder)
#data not normal, only two factors, so use non parametric test
wilcox.test(Under~Type,undervstype)
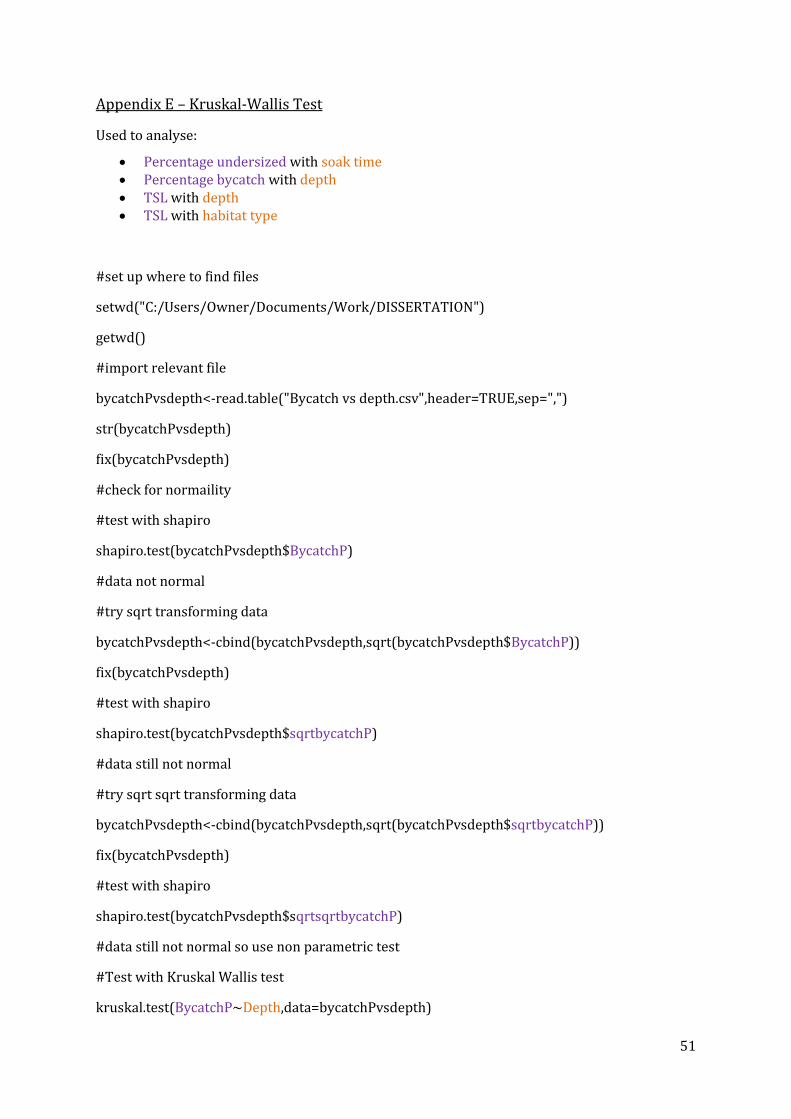
51
Appendix E – Kruskal-Wallis Test
Used to analyse:
Percentage undersized with soak time Percentage bycatch with depth TSL with depth TSL with habitat type
#set up where to find files
setwd("C:/Users/Owner/Documents/Work/DISSERTATION")
getwd()
#import relevant file
bycatchPvsdepth<-read.table("Bycatch vs depth.csv",header=TRUE,sep=",")
str(bycatchPvsdepth)
fix(bycatchPvsdepth)
#check for normaility
#test with shapiro
shapiro.test(bycatchPvsdepth$BycatchP)
#data not normal
#try sqrt transforming data
bycatchPvsdepth<-cbind(bycatchPvsdepth,sqrt(bycatchPvsdepth$BycatchP))
fix(bycatchPvsdepth)
#test with shapiro
shapiro.test(bycatchPvsdepth$sqrtbycatchP)
#data still not normal
#try sqrt sqrt transforming data
bycatchPvsdepth<-cbind(bycatchPvsdepth,sqrt(bycatchPvsdepth$sqrtbycatchP))
fix(bycatchPvsdepth)
#test with shapiro
shapiro.test(bycatchPvsdepth$sqrtsqrtbycatchP)
#data still not normal so use non parametric test
#Test with Kruskal Wallis test
kruskal.test(BycatchP~Depth,data=bycatchPvsdepth)

52
#which depths vary significantly from each other
kmc<-kruskalmc(BycatchP~Depth,bycatchPvsdepth,probs=0.05)
print(kmc)

53
Appendix F – Descriptive Statistics
#descriptive stats for TSL for pot colour
Mean_Potcolour1<-aggregate(TSL..mm.~Pot.colour,data=TSL,mean)
Median_Potcolour1<-aggregate(TSL..mm.~Pot.colour,data=TSL,median)
sd_Potcolour1<-aggregate(TSL..mm.~Pot.colour,data=TSL,sd)

54
Appendix G – Length Frequency Histograms
#set up where to find files
setwd("C:/Users/Owner/Documents/Work/DISSERTATION")
getwd()
#import TSL fisheries analysis
TSL<-read.table("Nefyn TSL R.csv",header=TRUE,sep=",")
str(TSL)
#histogram of TSL for length-frequency distribution
hist(TSL$TSL..mm.,main=NULL,xlab="Total Shell Length (mm)",ylab="Length Frequency (n=9041)",breaks=20,xlim=c(20,120))

55
Appendix H – Box Plots
#set up where to find files
setwd("C:/Users/Owner/Documents/Work/DISSERTATION")
getwd()
#import turn over times
TOT<-read.table("Turning over times.csv",header=TRUE,sep=",")
#look at table to see what needs to be turned into a factor
str(TOT)
#make tank a factor
TankF<-factor(TOT1$Tank)
#connect tank factor to table now called TOT2
TOT2<-cbind.data.frame(TankF,TOT1)
#make box plot of time taken to turn over
boxplot(TOT2$Time~TOT2$TreatmentF,main="Time Taken for Whelks to Right Themselves",xlab="Treatment",ylab="Time Taken (mins)")