A simple and fast method for the determination of selected organohalogenated compounds in serum...
6
Toxicology Letters 192 (2010) 66–71 Contents lists available at ScienceDirect Toxicology Letters journal homepage: www.elsevier.com/locate/toxlet A simple and fast method for the determination of selected organohalogenated compounds in serum samples from the general population Roberta Turci a,∗ , Claudio Balducci b , Gabri Brambilla c , Claudio Colosio c , Marcello Imbriani d,e , Alberto Mantovani f , Francesca Vellere c , Claudio Minoia a a Laboratory for Environmental and Toxicological Testing, Salvatore Maugeri Foundation, via S. Maugeri 10, 27100 Pavia, Italy b U.O. Servizio di Prevenzione e Protezione ASUR Zona Territoriale n.11 Fermo, Italy c Department of Occupational Health, University of Milan, S. Paolo Hospital Unit, and International Centre for Rural Health, Milan, Italy d Environmental and Occupational Medicine Unit, Salvatore Maugeri Foundation, Pavia, Italy e Department of Preventive, Occupational Medicine and Public Health, University of Pavia, Italy f Department of Food Safety and Veterinary Public Health – Istituto Superiore di Sanità, Rome, Italy article info Article history: Available online 3 May 2009 Keywords: Organochlorinated compounds Reference values Serum Italian population abstract Polychlorinated biphenyls (PCBs) and organochlorine pesticides (OCPs) have been widely used in industry and agriculture. Due to their persistence and bioaccumulation, they were globally spread in the environ- ment and may still be found in environmental and biological media, despite the international restrictions on production and use. The main aim of our study was to develop a simple and fast method suitable for the establishment of the reference values for 15 PCB congeners and 16 OCPs in general population subgroups. A cost- and time- saving screening procedure using gas chromatography coupled with low-resolution mass spectrometry, was improved and validated before application to the analysis of real samples. The overall method was validated including uncertainty measurement. Preliminary field data were collected from 95 volunteers living in two Italian areas. HCB, p,p -DDE, PCB 153, PCB 138 and PCB 180 were the most frequently detected compounds. Age and residence area were found to be significant variables for the most abundant compounds, while no correlation between serum concentrations and gender was observed. Our results suggest that long-banned substances, including PCBs and the pesticides HCB and DDT’s breakdown product, are still detectable in the general population. © 2009 Elsevier Ireland Ltd. All rights reserved. 1. Introduction Polychlorinated biphenyls (PCBs) and organochlorine pesticides (OCPs) are lipophilic and persistent compounds that were widely used in industrial and consumer products for decades until the late 1970s. Due to their persistence, PCBs are still ubiquitous contaminants. The general population is exposed to these compounds mainly through ingestion of food of animal origin, such as fish, dairy prod- ucts, and meat, as PCBs bioaccumulate and biomagnify in the food chain (Duarte-Davidson and Jones, 1994). Like PCBs, other OCPs, such as 1,1,1-trichloro-2,2-bis(p- chlorophenyl)ethane (DDT) and hexachlorobenzene (HCB) are no longer used in most of industrialized countries, but exposure still occurs due to their strong persistence in the environment. ∗ Corresponding author. E-mail address: [email protected] (R. Turci). A major environmental and biologic metabolite of DDT, 1,1- dichloro-2,2-bis(p-chlorophenyl)ethylene (p,p -DDE), is also of concern for its toxicity in laboratory studies and because it is more persistent than DDT. Also included in this study are hexachlorocyclohexane isomers (-, - and -HCH), aldrin, dieldrin, isodrin, isobenzane, heptachlor and heptachlor epoxide, since they raise especial interest in public health and epidemiology. PCBs and organochlorine pesticides have long biological half- lives. As a result of their persistence and ubiquity, measurable levels of serum PCBs and organochlorine pesticides are found in a high proportion of the general population (WHO, 1989, 1993). The main objective of our study was to assess the exposure to PCBs and selected OCPs in two general population groups living in Italy in an attempt to establish the reference values for the moni- tored subjects. To this aim, a fast and reliable method, previously developed and validated for PCBs only (Turci et al., 2002, 2004), was modified so as to simultaneously detect 16 OCPs and 15 PCBs, selected based on 0378-4274/$ – see front matter © 2009 Elsevier Ireland Ltd. All rights reserved. doi:10.1016/j.toxlet.2009.04.011
-
Upload
independent -
Category
Documents
-
view
1 -
download
0
Transcript of A simple and fast method for the determination of selected organohalogenated compounds in serum...
Ac
RAa
b
c
d
e
f
a
AA
KORSI
1
(u1
Ttuc
clo
0d
Toxicology Letters 192 (2010) 66–71
Contents lists available at ScienceDirect
Toxicology Letters
journa l homepage: www.e lsev ier .com/ locate / tox le t
simple and fast method for the determination of selected organohalogenatedompounds in serum samples from the general population
oberta Turci a,∗, Claudio Balducci b, Gabri Brambilla c, Claudio Colosio c, Marcello Imbriani d,e,lberto Mantovani f, Francesca Vellere c, Claudio Minoia a
Laboratory for Environmental and Toxicological Testing, Salvatore Maugeri Foundation, via S. Maugeri 10, 27100 Pavia, ItalyU.O. Servizio di Prevenzione e Protezione ASUR Zona Territoriale n.11 Fermo, ItalyDepartment of Occupational Health, University of Milan, S. Paolo Hospital Unit, and International Centre for Rural Health, Milan, ItalyEnvironmental and Occupational Medicine Unit, Salvatore Maugeri Foundation, Pavia, ItalyDepartment of Preventive, Occupational Medicine and Public Health, University of Pavia, ItalyDepartment of Food Safety and Veterinary Public Health – Istituto Superiore di Sanità, Rome, Italy
r t i c l e i n f o
rticle history:vailable online 3 May 2009
eywords:rganochlorinated compoundseference valueserumtalian population
a b s t r a c t
Polychlorinated biphenyls (PCBs) and organochlorine pesticides (OCPs) have been widely used in industryand agriculture. Due to their persistence and bioaccumulation, they were globally spread in the environ-ment and may still be found in environmental and biological media, despite the international restrictionson production and use.
The main aim of our study was to develop a simple and fast method suitable for the establishment ofthe reference values for 15 PCB congeners and 16 OCPs in general population subgroups. A cost- and time-saving screening procedure using gas chromatography coupled with low-resolution mass spectrometry,was improved and validated before application to the analysis of real samples. The overall method was
validated including uncertainty measurement.Preliminary field data were collected from 95 volunteers living in two Italian areas. HCB, p,p′-DDE, PCB153, PCB 138 and PCB 180 were the most frequently detected compounds. Age and residence area werefound to be significant variables for the most abundant compounds, while no correlation between serumconcentrations and gender was observed. Our results suggest that long-banned substances, includingPCBs and the pesticides HCB and DDT’s breakdown product, are still detectable in the general population.
. Introduction
Polychlorinated biphenyls (PCBs) and organochlorine pesticidesOCPs) are lipophilic and persistent compounds that were widelysed in industrial and consumer products for decades until the late970s.
Due to their persistence, PCBs are still ubiquitous contaminants.he general population is exposed to these compounds mainlyhrough ingestion of food of animal origin, such as fish, dairy prod-cts, and meat, as PCBs bioaccumulate and biomagnify in the foodhain (Duarte-Davidson and Jones, 1994).
Like PCBs, other OCPs, such as 1,1,1-trichloro-2,2-bis(p-hlorophenyl)ethane (DDT) and hexachlorobenzene (HCB) are noonger used in most of industrialized countries, but exposure stillccurs due to their strong persistence in the environment.
∗ Corresponding author.E-mail address: [email protected] (R. Turci).
378-4274/$ – see front matter © 2009 Elsevier Ireland Ltd. All rights reserved.oi:10.1016/j.toxlet.2009.04.011
© 2009 Elsevier Ireland Ltd. All rights reserved.
A major environmental and biologic metabolite of DDT, 1,1-dichloro-2,2-bis(p-chlorophenyl)ethylene (p,p′-DDE), is also ofconcern for its toxicity in laboratory studies and because it is morepersistent than DDT.
Also included in this study are hexachlorocyclohexane isomers(�-, �- and �-HCH), aldrin, dieldrin, isodrin, isobenzane, heptachlorand heptachlor epoxide, since they raise especial interest in publichealth and epidemiology.
PCBs and organochlorine pesticides have long biological half-lives. As a result of their persistence and ubiquity, measurable levelsof serum PCBs and organochlorine pesticides are found in a highproportion of the general population (WHO, 1989, 1993).
The main objective of our study was to assess the exposure toPCBs and selected OCPs in two general population groups living in
Italy in an attempt to establish the reference values for the moni-tored subjects.To this aim, a fast and reliable method, previously developed andvalidated for PCBs only (Turci et al., 2002, 2004), was modified soas to simultaneously detect 16 OCPs and 15 PCBs, selected based on
gy Letters 192 (2010) 66–71 67
tTai
eptbN
2
2
fa
(
t
(
2
w
l
c
Etuci
o
u
w
t
U
wrimi
tno
2
op
i(
R. Turci et al. / Toxicolo
heir environmental occurrence, abundance and potential toxicity.arget analytes included DDT isomers and its metabolites, hex-chlorocyclohexane isomers (�-, �- and �-HCH), aldrin, dieldrin,sodrin, isobenzane, heptachlor and heptachlor epoxide.
The method will be then applied to the establishment of the ref-rence values for three subgroups selected from the Italian generalopulation. In addition, the relationship between serum concen-rations and variables, such as gender, age and residence area, wille investigated. Preliminary data from Pavia (Northern Italy) andovafeltria (Central Italy) are herewith presented.
. Experimental
.1. Reagents and materials
Analytical reference standards of all analytes were obtained from Dr. Ehrenstor-er Laboratories (Ausburg, Germany), as well as the internal standards (IS) PCB 46nd PCB 143.
All solvents (methanol, hexane, diethyl ether, iso-octane) were pesticide gradeMerck, Darmstadt, Germany).
A Supelco (Bellefonte, PA, USA) VisiprepTM-DL SPE vacuum manifold was usedo simultaneously process up to 24 samples.
Varian BondElut® PCB (packing 1 g/3 mL column reservoir) SPE tubes were usedVarian Canada Inc., ON, Canada).
.2. Validation study
In order to validate the method performance, accuracy (precision and trueness)as studied according to the Eurachem guidelines (EURACHEM Guide, 1998).
The external standard calibration method was used for the assessment of theinearity of matrix calibration (0.20, 0.50, 1.00, 5.00, 10.0, 25.0 ng/mL).
Ten replicates of each quality control sample (QC) were thus prepared at differentoncentrations (0.25, 3.125, 6.25, and 12.5 ng/mL) on four different days.
The measurement uncertainty was evaluated according to theURACHEM/CITAC Guide (2000). For the analytes selected, the concentra-ions are affected by the repeatability and calibration components. Note that thencertainty component associated with recovery is not considered because thealibration curve was constructed using human serum. The sampling uncertaintys very small and can be ignored.
If y is the concentration, the combined uncertainty, u(y) is therefore given by
u(Y)
y=
√(u(Rep.)
(Rep.)
)2
+(
u(Cal.)
(Cal.)
)2
(1)
r
•Comb. =
√(
•u(Repeat.))
2+ (
•uCalib.)
2(2)
here:•u(Comb.) = combined relative uncertainty,
•u(Repeat.) = relative uncertainty of repeatability, and
•u(Calib.) = relative uncertainty of calibration.
The expanded uncertainty U(y) is calculated from the combined standard uncer-ainty u(y) using
(y) = k × u(y) (3)
here k is an appropriate coverage factor, which depends on the degree of confidenceequired. The expanded uncertainty is defined as “an interval which is expected tonclude a large fraction of the distribution of values reasonably attributable to the
easurand” (EURACHEM/CITAC Guide, 2000). A coverage factor of 2 was chosen ast gives an interval containing about 95% of the distribution of values.
The lower limit of quantification (LOQ) is here defined as the lowest amounthat can be quantitatively determined with suitable precision and accuracy (true-ess). The limit of detection (LOD) is the concentration having a signal-to-noise ratiof 3:1.
.3. Study population (preliminary data)
The research project has been approved by the Scientific Ethycal Committeef the local Universities. After being informed of the objectives of the study, allarticipants agreed to participate and signed their informed consent.
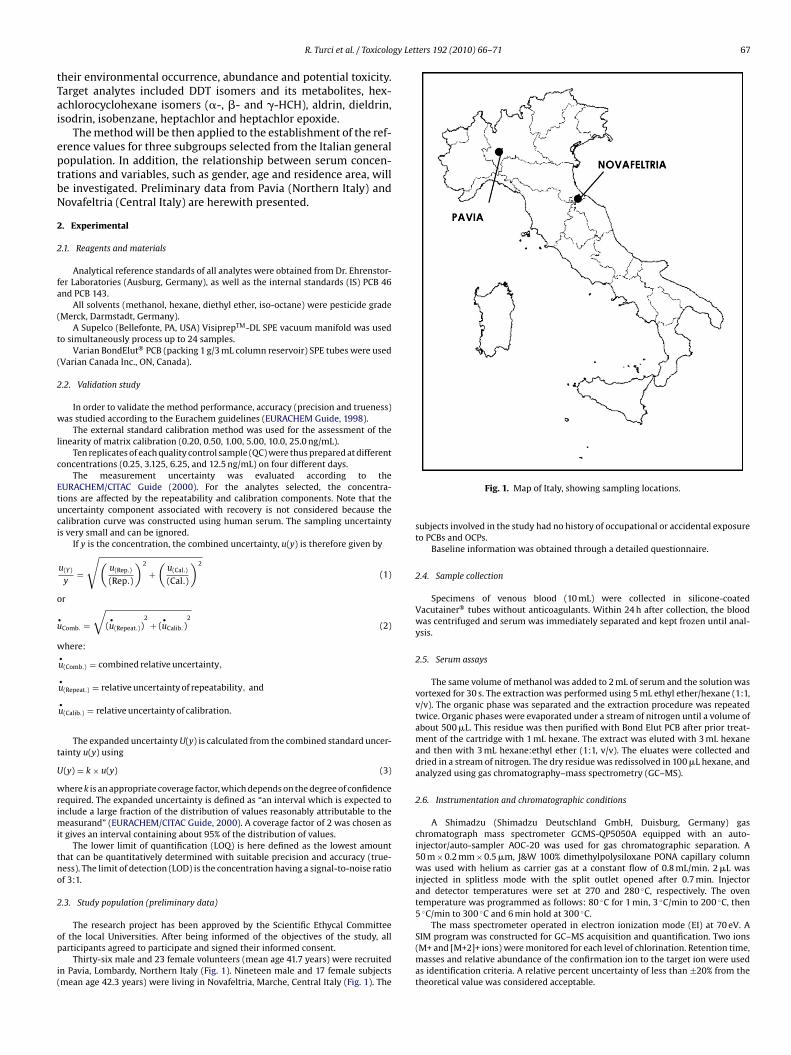
Thirty-six male and 23 female volunteers (mean age 41.7 years) were recruitedn Pavia, Lombardy, Northern Italy (Fig. 1). Nineteen male and 17 female subjectsmean age 42.3 years) were living in Novafeltria, Marche, Central Italy (Fig. 1). The
Fig. 1. Map of Italy, showing sampling locations.
subjects involved in the study had no history of occupational or accidental exposureto PCBs and OCPs.
Baseline information was obtained through a detailed questionnaire.
2.4. Sample collection
Specimens of venous blood (10 mL) were collected in silicone-coatedVacutainer® tubes without anticoagulants. Within 24 h after collection, the bloodwas centrifuged and serum was immediately separated and kept frozen until anal-ysis.
2.5. Serum assays
The same volume of methanol was added to 2 mL of serum and the solution wasvortexed for 30 s. The extraction was performed using 5 mL ethyl ether/hexane (1:1,v/v). The organic phase was separated and the extraction procedure was repeatedtwice. Organic phases were evaporated under a stream of nitrogen until a volume ofabout 500 �L. This residue was then purified with Bond Elut PCB after prior treat-ment of the cartridge with 1 mL hexane. The extract was eluted with 3 mL hexaneand then with 3 mL hexane:ethyl ether (1:1, v/v). The eluates were collected anddried in a stream of nitrogen. The dry residue was redissolved in 100 �L hexane, andanalyzed using gas chromatography–mass spectrometry (GC–MS).
2.6. Instrumentation and chromatographic conditions
A Shimadzu (Shimadzu Deutschland GmbH, Duisburg, Germany) gaschromatograph mass spectrometer GCMS-QP5050A equipped with an auto-injector/auto-sampler AOC-20 was used for gas chromatographic separation. A50 m × 0.2 mm × 0.5 �m, J&W 100% dimethylpolysiloxane PONA capillary columnwas used with helium as carrier gas at a constant flow of 0.8 mL/min. 2 �L wasinjected in splitless mode with the split outlet opened after 0.7 min. Injectorand detector temperatures were set at 270 and 280 ◦C, respectively. The oventemperature was programmed as follows: 80 ◦C for 1 min, 3 ◦C/min to 200 ◦C, then5 ◦C/min to 300 ◦C and 6 min hold at 300 ◦C.
The mass spectrometer operated in electron ionization mode (EI) at 70 eV. A
SIM program was constructed for GC–MS acquisition and quantification. Two ions(M+ and [M+2]+ ions) were monitored for each level of chlorination. Retention time,masses and relative abundance of the confirmation ion to the target ion were usedas identification criteria. A relative percent uncertainty of less than ±20% from thetheoretical value was considered acceptable.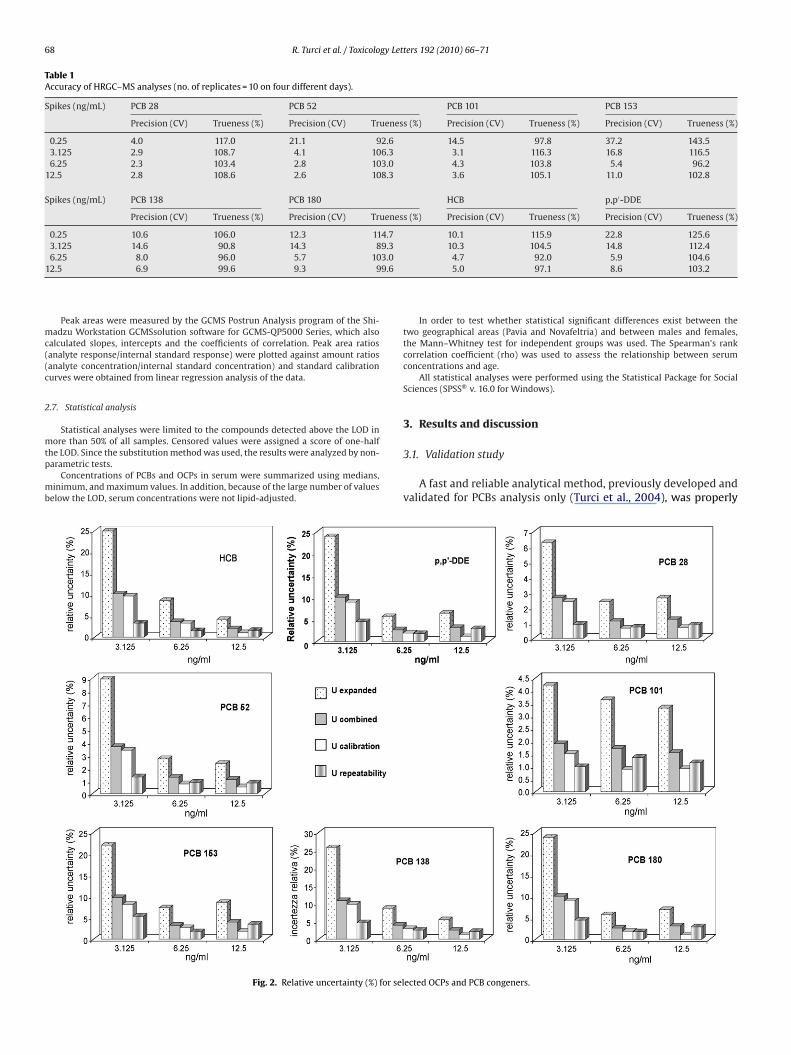
68 R. Turci et al. / Toxicology Letters 192 (2010) 66–71
Table 1Accuracy of HRGC–MS analyses (no. of replicates = 10 on four different days).
Spikes (ng/mL) PCB 28 PCB 52 PCB 101 PCB 153
Precision (CV) Trueness (%) Precision (CV) Trueness (%) Precision (CV) Trueness (%) Precision (CV) Trueness (%)
0.25 4.0 117.0 21.1 92.6 14.5 97.8 37.2 143.53.125 2.9 108.7 4.1 106.3 3.1 116.3 16.8 116.56.25 2.3 103.4 2.8 103.0 4.3 103.8 5.4 96.2
12.5 2.8 108.6 2.6 108.3 3.6 105.1 11.0 102.8
Spikes (ng/mL) PCB 138 PCB 180 HCB p,p′-DDE
Precision (CV) Trueness (%) Precision (CV) Trueness (%) Precision (CV) Trueness (%) Precision (CV) Trueness (%)
0.25 10.6 106.0 12.3 114.7 10.1 115.9 22.8 125.63.125 14.6 90.8 14.3 89.3 10.3 104.5 14.8 112.4
3.01 9.6
mc((c
2
mtp
mb
6.25 8.0 96.0 5.7 102.5 6.9 99.6 9.3 9
Peak areas were measured by the GCMS Postrun Analysis program of the Shi-adzu Workstation GCMSsolution software for GCMS-QP5000 Series, which also
alculated slopes, intercepts and the coefficients of correlation. Peak area ratiosanalyte response/internal standard response) were plotted against amount ratiosanalyte concentration/internal standard concentration) and standard calibrationurves were obtained from linear regression analysis of the data.
.7. Statistical analysis
Statistical analyses were limited to the compounds detected above the LOD in
ore than 50% of all samples. Censored values were assigned a score of one-halfhe LOD. Since the substitution method was used, the results were analyzed by non-arametric tests.
Concentrations of PCBs and OCPs in serum were summarized using medians,inimum, and maximum values. In addition, because of the large number of values
elow the LOD, serum concentrations were not lipid-adjusted.
Fig. 2. Relative uncertainty (%) for sel
4.7 92.0 5.9 104.65.0 97.1 8.6 103.2
In order to test whether statistical significant differences exist between thetwo geographical areas (Pavia and Novafeltria) and between males and females,the Mann–Whitney test for independent groups was used. The Spearman’s rankcorrelation coefficient (rho) was used to assess the relationship between serumconcentrations and age.
All statistical analyses were performed using the Statistical Package for SocialSciences (SPSS® v. 16.0 for Windows).
3. Results and discussion
3.1. Validation study
A fast and reliable analytical method, previously developed andvalidated for PCBs analysis only (Turci et al., 2004), was properly
ected OCPs and PCB congeners.
gy Letters 192 (2010) 66–71 69
mp
crrg
ct1p(lfifl
oFcPpt
n(aQaGpfi
wtt
3
ae
Table 2Limits of detection (LOD≡LOQ) on a wet weight basis(ng/mL).
Analyte LOD≡LOQ
alfa-HCH 0.25beta-HCH 0.15HCB 0.05Lindane 0.25Heptachlor 0.10Aldrin 0.10Isobenzane 0.50Isodrin 0.10Heptachlor epoxide 0.15o,p′-DDE 0.05p,p′-DDE 0.05o,p′-DDD 0.05Dieldrin 0.50p,p′-DDD 0.05o,p′-DDT 0.05p,p′-DDT 0.50PCB 31 0.05PCB 28 0.05PCB 52 0.05PCB 101 0.05PCB 77 0.15PCB 118 0.05PCB 153 0.05PCB 105 0.05PCB 138 0.05PCB 126 0.10PCB 156 0.10PCB 128 0.10PCB 180 0.05PCB 169 0.10PCB 170 0.05
N.B. The LOD is the concentration having a signal-to-noise
TS
bHPPPoPpoPpoPPpPPPP
N
R. Turci et al. / Toxicolo
odified in order to simultaneously detect 16 organohalogenatedesticides and PCBs.
Multi-level calibration curves were created for the quantifi-ation and good linearity was achieved over the concentrationange 0–25 ng/mL for all the analytes. Linearity was accepted whenegression coefficient r > 0.99, and the residual plot confirmed theoodness of fit of the regression model.
Accuracy was evaluated on spiked samples at four differentoncentrations (0.25–12.5 ng/mL). As an example, the results ofhis validation study for PCB 28, PCB 52, PCB 101, PCB 153, PCB38, PCB 180, hexachlorobenzene (HCB), and p,p′-DDE, are dis-layed in Table 1. Precision, expressed as the coefficient of variationCV), significantly exceeded 20% only for PCB 153 at the lowest QCevel. This is due to the presence of this congener in the unforti-ed serum far above the limit of quantification. Trueness ranged
rom 89.3 to 125.6%, except for PCB 153 (143.5%. at the lowest QCevel).
To obtain valuable information about the quality and reliabilityf the results, a proper evaluation of uncertainty is unavoidable. Inig. 2, the histograms showing the contribution of each individualomponent to the combined uncertainty for HCB, p,p′-DDE, PCB 28,CB 52, PCB 101, PCB 153, PCB 138, and PCB 180, are reported. Sam-ling uncertainty can be ignored as it is negligible when comparedo the other factors.
The repeatability uncertainty was found to be the most sig-ificant contribution to the total uncertainty at the lowest level3.125 ng/mL). Moreover, the relative expanded uncertainty waslways below 25% for the selected analytes, even at the lowestC level. Since a method is conventionally considered to be reli-ble when the total uncertainty is less than 30% (EURACHEM/CITACuide, 2000), this procedure can be considered to be fit forurpose, that is to say suitable for exposure assessment in thiseld.
LODs on a whole-weight basis are reported in Table 2. It is note-orthy that reported values for LOD and LOQ are the same for all
he analytes, as an acceptable level of repeatability precision andrueness was observed at LOD level.
.2. Population study (preliminary data)
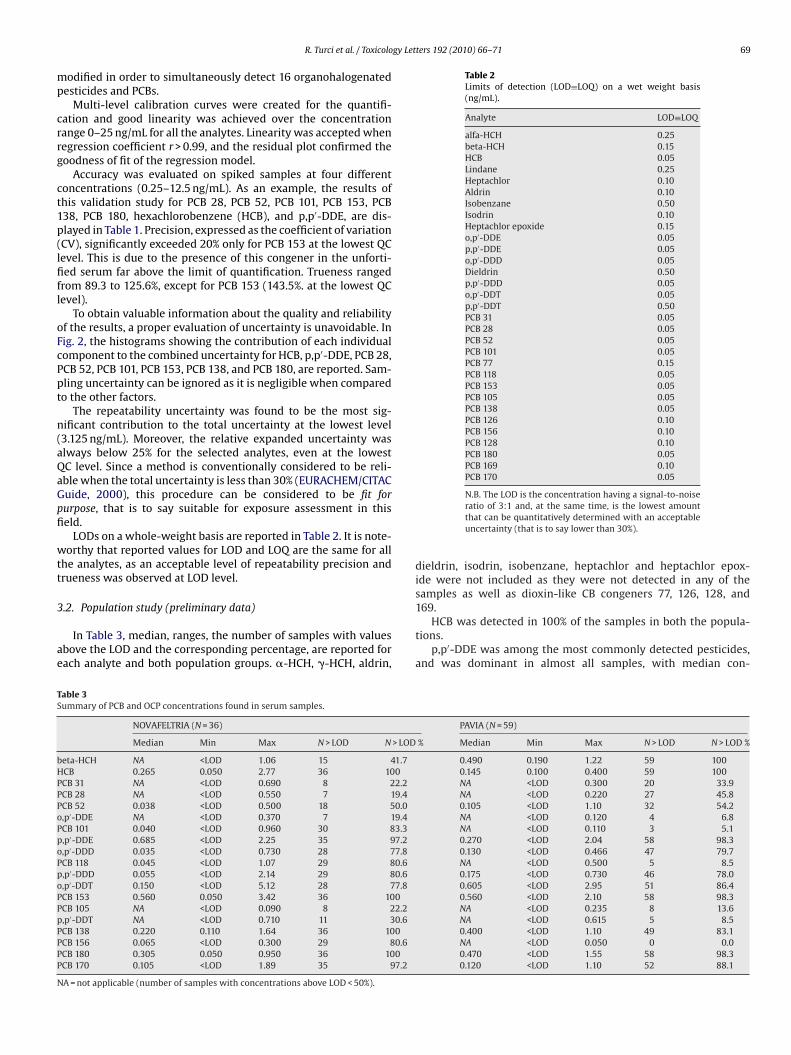
In Table 3, median, ranges, the number of samples with valuesbove the LOD and the corresponding percentage, are reported forach analyte and both population groups. �-HCH, �-HCH, aldrin,
able 3ummary of PCB and OCP concentrations found in serum samples.
NOVAFELTRIA (N = 36)
Median Min Max N > LOD N > LOD
eta-HCH NA <LOD 1.06 15 41.7CB 0.265 0.050 2.77 36 100CB 31 NA <LOD 0.690 8 22.2CB 28 NA <LOD 0.550 7 19.4CB 52 0.038 <LOD 0.500 18 50.0,p′-DDE NA <LOD 0.370 7 19.4CB 101 0.040 <LOD 0.960 30 83.3,p′-DDE 0.685 <LOD 2.25 35 97.2,p′-DDD 0.035 <LOD 0.730 28 77.8CB 118 0.045 <LOD 1.07 29 80.6,p′-DDD 0.055 <LOD 2.14 29 80.6,p′-DDT 0.150 <LOD 5.12 28 77.8CB 153 0.560 0.050 3.42 36 100CB 105 NA <LOD 0.090 8 22.2,p′-DDT NA <LOD 0.710 11 30.6CB 138 0.220 0.110 1.64 36 100CB 156 0.065 <LOD 0.300 29 80.6CB 180 0.305 0.050 0.950 36 100CB 170 0.105 <LOD 1.89 35 97.2
A = not applicable (number of samples with concentrations above LOD < 50%).
ratio of 3:1 and, at the same time, is the lowest amountthat can be quantitatively determined with an acceptableuncertainty (that is to say lower than 30%).
dieldrin, isodrin, isobenzane, heptachlor and heptachlor epox-ide were not included as they were not detected in any of thesamples as well as dioxin-like CB congeners 77, 126, 128, and
169.HCB was detected in 100% of the samples in both the popula-tions.
p,p′-DDE was among the most commonly detected pesticides,and was dominant in almost all samples, with median con-
PAVIA (N = 59)
% Median Min Max N > LOD N > LOD %
0.490 0.190 1.22 59 1000.145 0.100 0.400 59 100NA <LOD 0.300 20 33.9NA <LOD 0.220 27 45.80.105 <LOD 1.10 32 54.2NA <LOD 0.120 4 6.8NA <LOD 0.110 3 5.10.270 <LOD 2.04 58 98.30.130 <LOD 0.466 47 79.7NA <LOD 0.500 5 8.50.175 <LOD 0.730 46 78.00.605 <LOD 2.95 51 86.40.560 <LOD 2.10 58 98.3NA <LOD 0.235 8 13.6NA <LOD 0.615 5 8.50.400 <LOD 1.10 49 83.1NA <LOD 0.050 0 0.00.470 <LOD 1.55 58 98.30.120 <LOD 1.10 52 88.1
70 R. Turci et al. / Toxicology Letters 192 (2010) 66–71
Table 4Results from the non-parametric test for the concentration differences between the two population groups.
beta-HCH HCB o,p′-DDE p,p′-DDE o,p′-DDD p,p′-DDD o,p′-DDT p,p′-DDT
U di Mann–Whitney 377.5 651 933.5 558.5 551 852.5 892 823W di Wilcoxon 1043.5 2421 2703.5 2328.5 1217 1518.5 1558 2593Z −5.2798837 −3.1562391 −1.774202 −3.863064 −3.9397677 −1.61503 −1.307308 −2.888715p value 0.00000 0.00160 0.07603 0.00011 0.00008 0.10630 0.19111 0.00387
PCB 31 PCB 28 PCB 52 PCB 101 PCB 118 PCB 153 PCB 105 PCB 138 PCB 156 PCB 180 PCB 170
U di Mann–Whitney 921.5 762 1002 576 517 985 1002 724 324.5 739 923W di Wilcoxon 1587.5 1428 1668 2346 2287 1651 2772 1390 2094.5 1405 1589Z −1.3378 −2.6844 −0.4889 −4.3886 −4.8770 −0.5909 −0.7061 −2.5962 −7.1135 −2.4789 −1.0682p value 0.18096 0.00727 0.62491 0.00001 0.00000 0.55458 0.48012 0.00943 0.00000 0.01318 0.28544
Analytes detected in more than half of the samples in both population groups are given in bold.
Table 5Results from the non-parametric test for the gender differences in the two population groups.
beta-HCH HCB o,p′-DDE p,p′-DDE o,p′-DDD p,p′-DDD o,p′-DDT p,p′-DDT
U di Mann–Whitney 1041 911 956 961 1029.5 876 1020 975W di Wilcoxon 2871 2741 2786 2791 2859.5 2706 1650 1605Z −0.069817 −1.0735208 −1.305255 −0.686736 −0.1589539 −1.349 −0.232016 −0.911666p value 0.9443393 0.28303749 0.1918061 0.492249 0.8737052 0.177336 0.816526 0.3619446
PCB 31 PCB 28 PCB 52 PCB 101 PCB 118 PCB 153 PCB 105 PCB 138 PCB 156 PCB 180 PCB 170
U di Mann–Whitney 940 991.5 1035 809.5 828.5 883 1009 825 1021 910.5 903W di Wilcoxon 2770 1621.5 2865 2639.5 2658.5 1513 2839 1455 2851 1540.5 1533Z −1.0534 −0.5264 −0.1229 −2.1841 −1.9934 −1.2889 −0.4853 −1.7381 −0.2813 −1.0767 −1.1361p value 0.2922 0.5986 0.90217 0.02895 0.04621 0.19744 0.6275 0.0822 0.77847 0.2816 0.25592
Table 6Correlation between serum concentrations and age (correlation coefficients and Spearman coefficients).
beta-HCH HCB o,p′-DDE p,p′-DDE mitotane p,p′-DDD o,p′-DDT p,p′-DDT
Correlation coeff. 0.021 0.330 0.070 0.371 −0.126 0.055 −0.001 0.118p value 0.841 0.001 0.502 0.000 0.224 0.600 0.991 0.254
PCB 31 PCB 28 PCB 52 PCB 101 PCB 118 PCB 153 PCB 105 PCB 138 PCB 156 PCB 180 PCB 170
Cp
cr
aaa
ob
Di
gaNit
cSCdgp
orrelation coeff. −0.147 −0.080 −0.050 0.150 0.144value 0.155 0.443 0.632 0.147 0.163
entrations of 0.685 and 0.27 ng/mL, for Novafeltria and Pavia,espectively.
�-HCH was found to be the most abundant HCH isomer withmedian concentration of 0.075 ng/mL for the Novafeltria group
nd 0.49 ng/mL for Pavia, where it was detected in all the samplesnalyzed.
p,p′-DDT, and o,p′-DDE were detected in few samples, whereas,p′-DDT and DDDs were detected in a large number of subjects,ut median concentrations are very low.
In all cases the p,p′-DDE concentration greatly exceeded the p,p′-DT concentration. This means that exposure to DDT was either
ndirect (through diet) or historical.As expected, CBs 153, 180 and 138 were the dominant PCB con-
eners, followed by CBs 170, 52, 31, 28, and 105. Congeners 101nd 118 were detected in a large proportion of samples for theovafeltria population, while for Pavia a very low number of pos-
tive samples was observed, with median concentrations close tohe LOD.
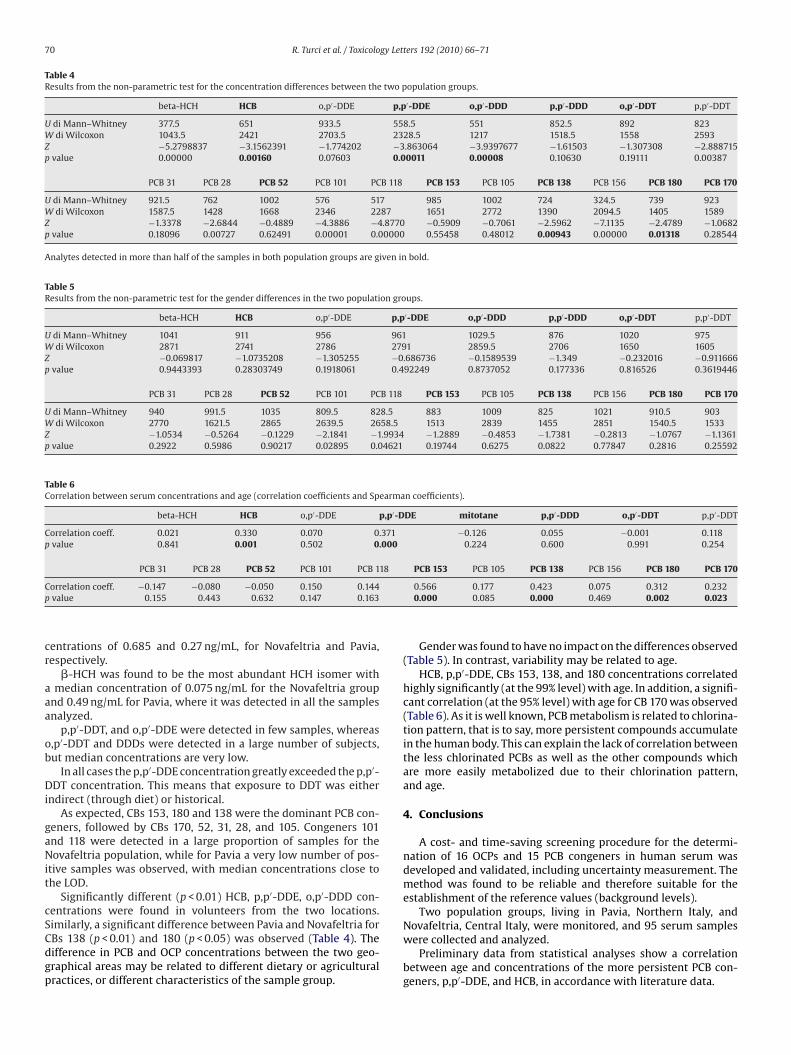
Significantly different (p < 0.01) HCB, p,p′-DDE, o,p′-DDD con-entrations were found in volunteers from the two locations.
imilarly, a significant difference between Pavia and Novafeltria forBs 138 (p < 0.01) and 180 (p < 0.05) was observed (Table 4). Theifference in PCB and OCP concentrations between the two geo-raphical areas may be related to different dietary or agriculturalractices, or different characteristics of the sample group.0.566 0.177 0.423 0.075 0.312 0.2320.000 0.085 0.000 0.469 0.002 0.023
Gender was found to have no impact on the differences observed(Table 5). In contrast, variability may be related to age.
HCB, p,p′-DDE, CBs 153, 138, and 180 concentrations correlatedhighly significantly (at the 99% level) with age. In addition, a signifi-cant correlation (at the 95% level) with age for CB 170 was observed(Table 6). As it is well known, PCB metabolism is related to chlorina-tion pattern, that is to say, more persistent compounds accumulatein the human body. This can explain the lack of correlation betweenthe less chlorinated PCBs as well as the other compounds whichare more easily metabolized due to their chlorination pattern,and age.
4. Conclusions
A cost- and time-saving screening procedure for the determi-nation of 16 OCPs and 15 PCB congeners in human serum wasdeveloped and validated, including uncertainty measurement. Themethod was found to be reliable and therefore suitable for theestablishment of the reference values (background levels).
Two population groups, living in Pavia, Northern Italy, and
Novafeltria, Central Italy, were monitored, and 95 serum sampleswere collected and analyzed.Preliminary data from statistical analyses show a correlationbetween age and concentrations of the more persistent PCB con-geners, p,p′-DDE, and HCB, in accordance with literature data.
gy Let
ab
sHuo
ti
rr
maueh
C
World Health Organization (WHO), 1989. p,p′-DDT and its Derivatives—Environmental Aspects. WHO, Environmental Health Criteria 83, Geneva,Switzerland.
R. Turci et al. / Toxicolo
For these population groups, gender cannot be considered assignificant variable, since no statistical difference was observed
etween males and females.The data-set produced may be regarded as an indicator of expo-
ure levels to the selected compounds in the Italian population.owever, it cannot be considered representative of the Italian pop-lation in general. This is confirmed by the significant differencesbserved between two groups living in different areas.
Although little is known on the historical use of pesticides inhe two regions, it can be assumed that Novafeltria is a rural area,n contrast to Pavia which is a more urbanized zone.
With regard to PCBs, there is good agreement between theseesults and the concentrations determined in previous surveys car-ied out in the same geographical areas (Turci et al., 2004, 2006).
In conclusion, this study has provided data which can be used foronitoring of temporal trends at both national and regional level
s well as international comparisons. Further investigation will beseful to establish the relationship between PCB and OCP serum lev-ls and other possible determining factors, such as lifestyle, dietary
abits, and health conditions.onflict of interest statement
The authors declare that there are no conflicts of interest.
ters 192 (2010) 66–71 71
References
Duarte-Davidson, R., Jones, K.C., 1994. Polychlorinated biphenyls in the UK popula-tion: estimated intake, exposure and body burdens for the general population.Sci. Total Environ. 151, 131–152.
EURACHEM Guide, 1998. The Fitness for Purpose of Analytical Methods, 1st ed.Eurachem, LGC, Teddington, UK, www.eurachem.ul.pt.
EURACHEM/CITAC Guide, 2000. Quantifying Uncertainty in Analytical Measure-ment, 2nd ed. EURACHEM/CITAC, www.eurachem.ul.pt.
Turci, R., Angeleri, F., Minoia, C., 2002. A rapid screening method for routinecongener-specific analysis of polychlorinated biphenyls in human serum byhigh-resolution gas chromatography with mass spectrometric detection. RapidCommun Mass Spectrom. 16 (20), 1957–1964.
Turci, R., Mariani, G., Marinaccio, A., Balducci, C., Bettinelli, M., Fanelli, R., Nichetti,S., Minoia, C., 2004. Critical evaluation of a high-throughput analytical methodfor polychlorinated biphenyls in human serum: which detector for the estab-lishment of the reference values? Rapid Commun. Mass Spectrom. 18 (4), 421–434.
Turci, R., Finozzi, E., Catenacci, G., Marinaccio, A., Balducci, C., Minoia, C., 2006.Reference values of coplanar and non-coplanar PCBs in serum samplesfrom two Italian population groups. Toxicol. Lett. 162, 250–255 (2–3 SPEC.ISS.).
World Health Organization (WHO), 1993. Polychlorinated Biphenyls and Ter-phenyls, second ed. WHO, Environmental Health Criteria 140, Geneva,Switzerland.