Nearly degenerate neutrinos, supersymmetry and radiative corrections
Upload
independentCategory
view
1download
0
The Journal of Nutrition
Nutritional Epidemiology
See corresponding commentary on page 387.
Unmetabolized Folic Acid Is Detected inNearly All Serum Samples from US Children,Adolescents, and Adults1–4
Christine M Pfeiffer,5* Maya R Sternberg,5 Zia Fazili,5 Elizabeth A Yetley,6 David A Lacher,7
Regan L Bailey,6 and Clifford L Johnson7
5National Center for Environmental Health, CDC, Atlanta, GA; 6Office of Dietary Supplements, NIH, Bethesda, MD; and 7National
Center for Health Statistics, CDC, Hyattsville, MD
Abstract
Background: Serum total folate consists mainly of 5-methyltetrahydrofolate (5-methylTHF). Unmetabolized folic acid
(UMFA) may occur in persons consuming folic acid–fortified foods or supplements.
Objectives:We describe serum 5-methylTHF and UMFA concentrations in the US population$1 y of age by demographic
variables and fasting time, stratified by folic acid–containing dietary supplement use. We also evaluate factors associated
with UMFA concentrations >1 nmol/L.
Methods: Serum samples from the cross-sectional NHANES 2007–2008 were measured for 5-methylTHF (n = 2734) and
UMFA (n = 2707) by HPLC–tandem mass spectrometry.
Results: In supplement users compared with nonusers, we found significantly higher geometric mean concentrations of
5-methylTHF (48.4 and 30.7 nmol/L, respectively) and UMFA (1.54 and 0.794 nmol/L, respectively). UMFA concentrations
were detectable (>0.3 nmol/L) in >95% of supplement users and nonusers, regardless of demographic or fasting
characteristics; concentrations differed significantly by age and fasting time, but not by sex and race-ethnicity, both in
supplement users and nonusers. The prevalence of UMFA concentrations >1 nmol/L was 33.2% overall and 21.0% in
fasting ($8 h) adults ($20 y of age). Using multiple logistic regression analysis, UMFA concentrations >1 nmol/L were
associated with being older, non-Hispanic black, nonfasting (<8 h), having smaller body surface area, higher total folic acid
intake (diet and supplements), and higher red blood cell folate concentrations. In fasting adults, a decrease in the mean
daily alcohol consumption was also associated with increased odds of UMFA concentrations >1 nmol/L.
Conclusions:UMFAdetectionwasnearly ubiquitous, and concentrations>1nmol/Lwere largely but not entirely explainedby fasting
status and by total folic acid intake from diet and supplements. These new UMFA data in US persons $1 y of age provide much-
needed information on this vitamer in a fortified population with relatively high use of dietary supplements. J Nutr 2015;145:520–31.
Keywords: NHANES, serum folate, 5-methyltetrahydrofolate, unmetabolized folic acid, HPLC–tandemmass spectrometry
Introduction
Serum and RBC ‘‘total’’ folates are traditional biomarkers offolate status and have been measured since the mid 1970s,covering the time from pre– to post–folic acid fortification in a
representative sample of the US population participating inthe cross-sectional NHANES (1, 2). The specific vitamer com-position of serum ‘‘total’’ folate, however, requires sensitivechromatography-based procedures that became available morerecently, but are limited to more specialized research laboratories(3). Serum 5-methyltetrahydrofolate (5-methylTHF)8 is the maincirculating form (4), generally making up >80% of total folate (5).
1 The authors reported no funding received for this study.2 Author disclosures: CM Pfeiffer, MR Sternberg, Z Fazili, EA Yetley, DA Lacher,
RL Bailey, and CL Johnson, no conflicts of interest.3 The findings and conclusions in this manuscript are those of the authors and do
not necessarily represent the official views or positions of the CDC/Agency for
Toxic Substances and Disease Registry, the NIH, the FDA, or the Department of
Health and Human Services.4 Supplemental Methods, Supplemental Tables 1–7, and Supplemental Figures
1 and 2 are available from the ‘‘Online Supporting Material’’ link in the online
posting of the article and from the same link in the online table of contents at
http://jn.nutrition.org.
* To whom correspondence should be addressed. E-mail: [email protected].
8 Abbreviations used: BSA, body surface area; DFE, dietary folate equivalent;
HPLC-MS/MS, HPLC–tandem MS; LOD, limit of detection; MEC, mobile
examination center; NCHS, National Center for Health Statistics; NHB,
non-Hispanic black; NHW, non-Hispanic white; NIST, National Institute of
Standards and Technology; ORadj, adjusted OR; SUP+, users of folic acid–-
containing dietary supplements; SUP2, nonusers of folic acid–containing dietary
supplements; UMFA, unmetabolized folic acid; 5-formylTHF, 5-formyltetrahy-
drofolate; 5-methylTHF, 5-methyltetrahydrofolate.
ã 2015 American Society for Nutrition.
520 Manuscript received July 30, 2014. Initial review completed September 15, 2014. Revision accepted November 12, 2014.
First published online December 10, 2014; doi:10.3945/jn.114.201210.
by guest on April 19, 2016
jn.nutrition.orgD
ownloaded from
0.DCSupplemental.html http://jn.nutrition.org/content/suppl/2014/12/10/jn.114.20121Supplemental Material can be found at:
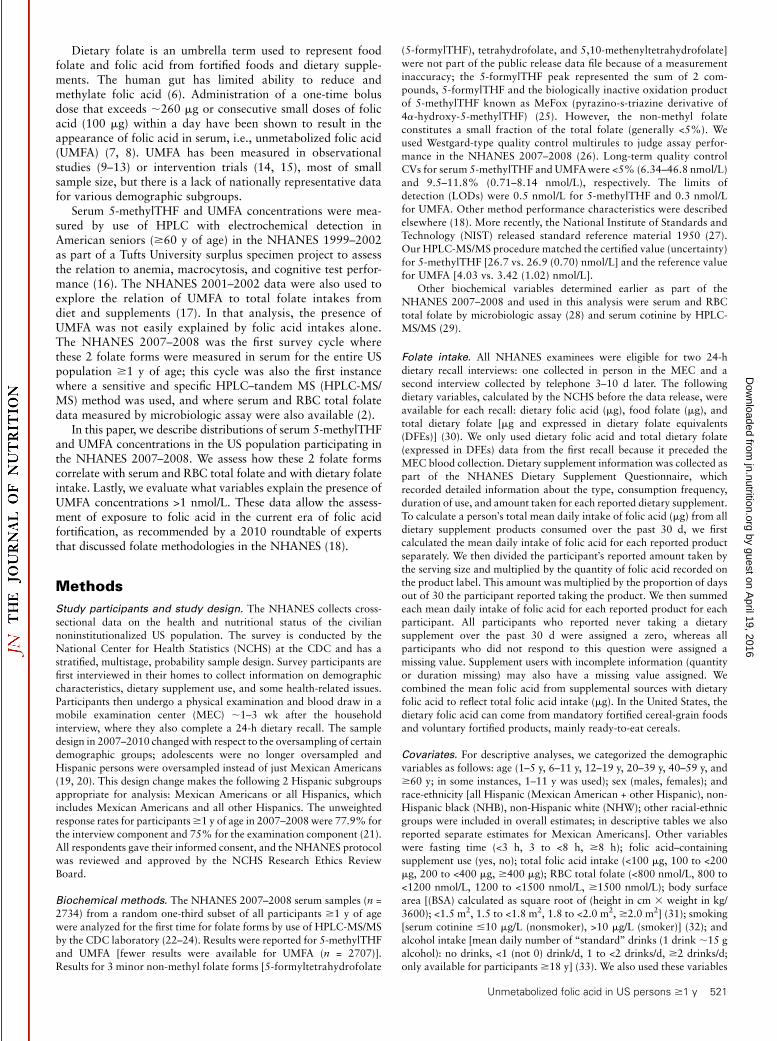
Dietary folate is an umbrella term used to represent foodfolate and folic acid from fortified foods and dietary supple-ments. The human gut has limited ability to reduce andmethylate folic acid (6). Administration of a one-time bolusdose that exceeds ;260 mg or consecutive small doses of folicacid (100 mg) within a day have been shown to result in theappearance of folic acid in serum, i.e., unmetabolized folic acid(UMFA) (7, 8). UMFA has been measured in observationalstudies (9–13) or intervention trials (14, 15), most of smallsample size, but there is a lack of nationally representative datafor various demographic subgroups.
Serum 5-methylTHF and UMFA concentrations were mea-sured by use of HPLC with electrochemical detection inAmerican seniors ($60 y of age) in the NHANES 1999–2002as part of a Tufts University surplus specimen project to assessthe relation to anemia, macrocytosis, and cognitive test perfor-mance (16). The NHANES 2001–2002 data were also used toexplore the relation of UMFA to total folate intakes fromdiet and supplements (17). In that analysis, the presence ofUMFA was not easily explained by folic acid intakes alone.The NHANES 2007–2008 was the first survey cycle wherethese 2 folate forms were measured in serum for the entire USpopulation $1 y of age; this cycle was also the first instancewhere a sensitive and specific HPLC–tandem MS (HPLC-MS/MS) method was used, and where serum and RBC total folatedata measured by microbiologic assay were also available (2).
In this paper, we describe distributions of serum 5-methylTHFand UMFA concentrations in the US population participating inthe NHANES 2007–2008. We assess how these 2 folate formscorrelate with serum and RBC total folate and with dietary folateintake. Lastly, we evaluate what variables explain the presence ofUMFA concentrations >1 nmol/L. These data allow the assess-ment of exposure to folic acid in the current era of folic acidfortification, as recommended by a 2010 roundtable of expertsthat discussed folate methodologies in the NHANES (18).
Methods
Study participants and study design. The NHANES collects cross-
sectional data on the health and nutritional status of the civilian
noninstitutionalized US population. The survey is conducted by the
National Center for Health Statistics (NCHS) at the CDC and has astratified, multistage, probability sample design. Survey participants are
first interviewed in their homes to collect information on demographic
characteristics, dietary supplement use, and some health-related issues.
Participants then undergo a physical examination and blood draw in amobile examination center (MEC) ;1–3 wk after the household
interview, where they also complete a 24-h dietary recall. The sample
design in 2007–2010 changed with respect to the oversampling of certain
demographic groups; adolescents were no longer oversampled andHispanic persons were oversampled instead of just Mexican Americans
(19, 20). This design change makes the following 2 Hispanic subgroups
appropriate for analysis: Mexican Americans or all Hispanics, whichincludes Mexican Americans and all other Hispanics. The unweighted
response rates for participants$1 y of age in 2007–2008were 77.9% for
the interview component and 75% for the examination component (21).
All respondents gave their informed consent, and the NHANES protocolwas reviewed and approved by the NCHS Research Ethics Review
Board.
Biochemical methods. The NHANES 2007–2008 serum samples (n =2734) from a random one-third subset of all participants $1 y of age
were analyzed for the first time for folate forms by use of HPLC-MS/MS
by the CDC laboratory (22–24). Results were reported for 5-methylTHFand UMFA [fewer results were available for UMFA (n = 2707)].
Results for 3 minor non-methyl folate forms [5-formyltetrahydrofolate
(5-formylTHF), tetrahydrofolate, and 5,10-methenyltetrahydrofolate]
were not part of the public release data file because of a measurement
inaccuracy; the 5-formylTHF peak represented the sum of 2 com-pounds, 5-formylTHF and the biologically inactive oxidation product
of 5-methylTHF known as MeFox (pyrazino-s-triazine derivative of
4a-hydroxy-5-methylTHF) (25). However, the non-methyl folate
constitutes a small fraction of the total folate (generally <5%). Weused Westgard-type quality control multirules to judge assay perfor-
mance in the NHANES 2007–2008 (26). Long-term quality control
CVs for serum 5-methylTHF and UMFAwere <5% (6.34–46.8 nmol/L)
and 9.5–11.8% (0.71–8.14 nmol/L), respectively. The limits ofdetection (LODs) were 0.5 nmol/L for 5-methylTHF and 0.3 nmol/L
for UMFA. Other method performance characteristics were described
elsewhere (18). More recently, the National Institute of Standards andTechnology (NIST) released standard reference material 1950 (27).
Our HPLC-MS/MS procedure matched the certified value (uncertainty)
for 5-methylTHF [26.7 vs. 26.9 (0.70) nmol/L] and the reference value
for UMFA [4.03 vs. 3.42 (1.02) nmol/L].Other biochemical variables determined earlier as part of the
NHANES 2007–2008 and used in this analysis were serum and RBC
total folate by microbiologic assay (28) and serum cotinine by HPLC-
MS/MS (29).
Folate intake. All NHANES examinees were eligible for two 24-h
dietary recall interviews: one collected in person in the MEC and asecond interview collected by telephone 3–10 d later. The following
dietary variables, calculated by the NCHS before the data release, were
available for each recall: dietary folic acid (mg), food folate (mg), and
total dietary folate [mg and expressed in dietary folate equivalents(DFEs)] (30). We only used dietary folic acid and total dietary folate
(expressed in DFEs) data from the first recall because it preceded the
MEC blood collection. Dietary supplement information was collected aspart of the NHANES Dietary Supplement Questionnaire, which
recorded detailed information about the type, consumption frequency,
duration of use, and amount taken for each reported dietary supplement.
To calculate a person�s total mean daily intake of folic acid (mg) from alldietary supplement products consumed over the past 30 d, we first
calculated the mean daily intake of folic acid for each reported product
separately. We then divided the participant�s reported amount taken by
the serving size and multiplied by the quantity of folic acid recorded onthe product label. This amount was multiplied by the proportion of days
out of 30 the participant reported taking the product. We then summed
each mean daily intake of folic acid for each reported product for eachparticipant. All participants who reported never taking a dietary
supplement over the past 30 d were assigned a zero, whereas all
participants who did not respond to this question were assigned a
missing value. Supplement users with incomplete information (quantityor duration missing) may also have a missing value assigned. We
combined the mean folic acid from supplemental sources with dietary
folic acid to reflect total folic acid intake (mg). In the United States, the
dietary folic acid can come from mandatory fortified cereal-grain foodsand voluntary fortified products, mainly ready-to-eat cereals.
Covariates. For descriptive analyses, we categorized the demographic
variables as follows: age (1–5 y, 6–11 y, 12–19 y, 20–39 y, 40–59 y, and$60 y; in some instances, 1–11 y was used); sex (males, females); and
race-ethnicity [all Hispanic (Mexican American + other Hispanic), non-
Hispanic black (NHB), non-Hispanic white (NHW); other racial-ethnicgroups were included in overall estimates; in descriptive tables we also
reported separate estimates for Mexican Americans]. Other variables
were fasting time (<3 h, 3 to <8 h, $8 h); folic acid–containing
supplement use (yes, no); total folic acid intake (<100 mg, 100 to <200mg, 200 to <400 mg, $400 mg); RBC total folate (<800 nmol/L, 800 to
<1200 nmol/L, 1200 to <1500 nmol/L, $1500 nmol/L); body surface
area [(BSA) calculated as square root of (height in cm 3 weight in kg/
3600); <1.5 m2, 1.5 to <1.8 m2, 1.8 to <2.0 m2, $2.0 m2] (31); smoking[serum cotinine #10 mg/L (nonsmoker), >10 mg/L (smoker)] (32); and
alcohol intake [mean daily number of ‘‘standard’’ drinks (1 drink ;15 g
alcohol): no drinks, <1 (not 0) drink/d, 1 to <2 drinks/d, $2 drinks/d;only available for participants $18 y] (33). We also used these variables
Unmetabolized folic acid in US persons $1 y 521
by guest on April 19, 2016
jn.nutrition.orgD
ownloaded from

(same categories as above unless specified) to develop multiple logistic
regression models: age (continuous), sex, race-ethnicity, fasting status
[$8 h (fasting), <8 h (not fasting)], total folic acid intake (continuous),RBC total folate (to adjust for folate status; continuous), BSA (to adjust
for body size; continuous), smoking, and alcohol consumption (contin-
uous).
Statistical analyses. Statistical analyses were performed with use of
SAS (version 9.2; SAS Institute) and SUDAAN (version 11.0.1; RTI)
software. We excluded pregnant and lactating women from all analyses
(n = 31 for 5-methylTHF and n = 30 for UMFA) and 1 individual becauseof a sample weight of zero. Otherwise we used pairwise deletion for
missing data to minimize unnecessary removal of valid data and thus the
introduction of bias. This resulted in an analytic sample of 2702participants for 5-methylTHF and 2676 participants for UMFA (Figure
1) and in different sample sizes depending on the scope of the analysis.
We used the one-third subsample weights to account for differential
nonresponse or noncoverage and to adjust for oversampling of somegroups. We calculated the proportion of detectable UMFA results by
demographic, fasting, or supplement use characteristics. CIs for the
prevalence estimates were calculated using a logit transformation with
the SEM of the logit prevalence based on the delta method. Wecalculated the mean absolute and percent contribution of UMFA and
5-methylTHF in serum to the sum of 5-methylTHF and UMFA (for all,
fasting persons, fasting nonusers, and users of folic acid–containingdietary supplements) by weighted quartiles of 5-methylTHF concentra-
tion derived from the entire population. We calculated cumulative
frequency distributions for UMFA overall and by fasting status. We
explored bivariate associations between geometric mean folate bio-marker concentrations (serum 5-methylTHF, UMFA, and total folate;
RBC total folate) or median folic acid intake amounts (diet, supplements,
and total folic acid) and demographic variables (age, sex, race-ethnicity)
or fasting status, stratified by folic acid supplement use. Geometricmeans were compared across the categories on the basis of Wald F tests
with and without controlling for additional covariates (age, sex, race-
ethnicity, and fasting time). Sample sizes for the folate biomarkers and
folic acid intakes stratified by folic acid supplement use are presented in
Supplemental Tables 1 and 2, respectively. We assessed pairwise
correlations between folate biomarkers and folate intake by calculatingSpearman correlation coefficients. We assessed the distributions [geo-
metric means and selected percentiles (95%CIs)] of serum 5-methylTHF
and UMFA among participants $1 y of age fasting from food and
supplements for$8 h by demographic variables or folic acid supplementuse.
To evaluate what variables explained UMFA concentrations >1 nmol/
L, we first explored bivariate associations between the prevalence of
UMFA concentrations >1 nmol/L and variables of interest specified in thecovariates section and then performed multiple logistic regression
analysis to provide adjusted ORs (ORsadj). We selected a UMFA cutoff
of 1 nmol/L for several reasons: it represented approximately the 75thpercentile for fasting (from food and supplements) individuals (supple-
ment users and nonusers together) in our dataset (0.957 nmol/L) and was
therefore not too unusual; it was reasonably close to the 1.35 nmol/L
cutoff used by Kalmbach et al. (10), which represented the 85thpercentile for fasting UMFA concentrations in the prefortification
Framingham Offspring Cohort; and it represented a round number
that will not fluctuate from one dataset to another as would be the case
with a specific percentile derived from our dataset.We used a backward elimination approach with listwise deletion for
missing values to arrive at the final multivariate logistic regression model
and made some preliminary analytic decisions to conserve the limited dfand to allow simultaneous modeling of several variables and investiga-
tion of pairwise interactions (Supplemental Methods). Once we devel-
oped a final model for the entire study population ($1 y of age, model 1),
we fit a subsequent model limited to fasting ($8 h) persons$20 y of age(model 2) to evaluate whether similar factors explained UMFA concen-
trations >1 nmol/L in a more homogeneous sample. In model 2, we used
all relevant variables included in model 1 plus mean daily alcohol
consumption, which was only publically available among adults $18 yof age. We reported ORadj (95% CI) and Wald F test P values for each
pairwise comparison to the selected reference category. We also evaluated
model sensitivity at 2 other UMFA cutoff values using data for everybody:
FIGURE 1 Study participants$1 y of age with serum folate vitamer data in the NHANES 2007–2008 one-third subsample. Serum 5-methylTHF
and UMFA were measured by LC–tandem MS. Serum and RBC total folate were measured by microbiologic assay. UMFA, unmetabolized folic
acid; 5-methylTHF, 5-methyltetrahydrofolate.
522 Pfeiffer et al.
by guest on April 19, 2016
jn.nutrition.orgD
ownloaded from

2 nmol/L and 5 nmol/L, corresponding to the 95th and 98th percentile for
fasting persons in our dataset, respectively. All statistical comparisons were
evaluated at a 2-sided significance level of a = 0.05.
Results
Characteristics of the study population and of
5-methylTHF and UMFA concentrations. Among US persons$1 y of age in the unweighted one-third subsample of NHANES2007–2008, 26% were children (1–11 y), 12% adolescents (12–19 y), and 62% adults ($20 y), nearly half were female (49%),more than one-third were NHW (41%), 38% were fasting for$8 h, and 27% reported using a folic acid–specific dietarysupplement in the last 30 d (Supplemental Table 3). The rangesof serum 5-methylTHF and UMFA concentrations were 5.37–190 and <LOD (0.3)–397 nmol/L, respectively. UMFA concen-trations were detectable in >95% of samples regardless ofdemographic, fasting, or supplement use characteristics (Sup-plemental Table 4). When we grouped samples according toweighted 5-methylTHF quartiles, the absolute mean UMFAconcentration in quartile 4 (5.60 nmol/L) was significantlyhigher than in quartiles 1–3 (1.81, 1.41, and 3.41 nmol/L,respectively) (Supplemental Table 5), but the relative UMFAcontribution to the sum of 5-methylTHF + UMFA was fairlyconstant (3.1–5.0%) across the quartiles. When we limited thesamples to fasting ($8 h) persons, the relative UMFA contribu-tion appeared somewhat lower (2.2–3.5%). We observed themost distinction in the relative UMFA contribution acrossquartiles when we limited the samples to fasting nonusers (3.6,2.3, 1.9, and 1.5%, respectively).
Bivariate associations between folate biomarkers or folic
acid intake and variables of interest. For users of folic acid–containing dietary supplements (SUP+) compared with nonusers(SUP2), the overall geometric mean serum concentrationsof 5-methylTHF (48.4 nmol/L vs. 30.7 nmol/L) and UMFA(1.54 nmol/L vs. 0.794 nmol/L) were significantly higher(Table 1). Similarly, the overall median total folic acid intakewas significantly higher in the SUP+ vs. SUP2 group (508 mg vs.145 mg), whereas the dietary folic acid intake was comparable(135 mg vs. 145 mg) in the 2 groups (Table 2). Age was asignificant factor for 5-methylTHF, UMFA, serum total folate,and RBC total folate in both the SUP+ and SUP2 groups and wenoted a generally U-shaped age pattern (Table 1). Age was also asignificant factor for folic acid intake, but here we noted aninverse U-shaped age pattern for dietary folic acid intake (Table2). Although females (SUP+ and SUP2) had significantly higher5-methylTHF and serum total folate concentrations, there wereno significant sex differences for UMFA and RBC folate concen-trations (Table 1). Females had significantly lower dietary folicacid intake, but significantly higher supplemental folic acid intake(Table 2). We found significant associations between race-ethnicity and the folate biomarkers in the SUP+ and SUP2groups with the exception of 5-methylTHF and UMFA in theSUP2 group (Table 1). We found significant associationsbetween race-ethnicity and dietary folic acid intake, andsupplemental and total folic acid intake, with NHW personshaving higher supplemental folic acid intakes (Table 2). Asexpected, fasting status was significantly associated with lowerUMFA concentrations in the SUP+ and SUP2 groups, withlarger concentration differences between persons who were notfasting (<3 h) and those who were fasting ($8 h) in the SUP+group (1.17 nmol/L) compared with the SUP2 group (0.269nmol/L) (Table 1). We found no significant association between
fasting status and folic acid intake, except for dietary folic acidintake in nonusers (Table 2). After we controlled for selectedcovariates (age, sex, race-ethnicity, and fasting status), theinterpretation of associations based on statistical significanceremained unchanged except for serum UMFA in users being nolonger different by race-ethnicity (Table 1); serum total folate innonusers being no longer different by fasting time (Table 1); andfolic acid intake from diet in users being no longer different byrace-ethnicity (Table 2).
Correlations between folate biomarkers and folate intake.
Spearman correlations were significant for all pairwise compar-isons of folate biomarkers (P < 0.0001 in all cases) (SupplementalFigure 1 and Supplemental Table 6). We observed moderate-to-strong correlations for 5-methylTHF with serum (r > 0.9)and RBC (r > 0.5) total folate overall in the SUP+ and SUP2groups. We noted moderate correlations for UMFA (r > 0.4)with 5-methylTHF and serum total folate overall in the SUP+group, but weak correlations (r = 0.35) in the SUP2 group. Thecorrelation between UMFA and RBC total folate was weak (r =0.30 overall, r = 0.36 in the SUP+ group, and r = 0.17 in theSUP2 group).
Spearman correlations between folate biomarkers and totalfolic acid intake (from diet and supplements) were significantbut generally weak (r # 0.4; overall: P < 0.0001 in all cases;SUP+ group: < 0.0001 < P < 0.03; SUP2 group: P# 0.0001 in allcases). Spearman correlations between folate biomarkers andtotal dietary folate intake (expressed in DFEs, not includingintake from supplements) were weaker yet (overall: < 0.0001 < P#0.0004; SUP2 group: P # 0.0001 in all cases) and not sig-nificant in the SUP+ group except for RBC folate (r = 0.08,P = 0.0105).
Distributions of serum 5-methylTHF and UMFA. To allow ameaningful interpretation of distributions for 5-methylTHF(Table 3) and UMFA (Table 4), we limited our sample to fasting($8 h) persons to minimize the transient effects of recentconsumption from meals or supplements. We observed distinctdistributions for the SUP+ and SUP2 groups for both folateforms. The overall central 95% reference intervals (2.5–97.5percentile) for 5-methylTHF and UMFAwere 11.5–92.9 nmol/Land <LOD (0.3)–3.08 nmol/L, respectively. The cumulativefrequency distributions for UMFA (Supplemental Table 7) pro-vide ameans of estimating the proportion of concentrations aboveand below the reported concentration groupings. Although boththe nonfasting (44%) and fasting (59%) persons had the majorityof UMFA concentrations between 0.5 and <1 nmol/L, almost halfof the nonfasting persons but only one quarter of the fastingpersons had UMFA concentrations >1 nmol/L.
Bivariate associations between the prevalence of UMFA
concentrations >1 nmol/L and variables of interest to
explain UMFA concentrations >1 nmol/L. The prevalence ofUMFA concentrations >1 nmol/L was 33.2% overall and 21.0%in fasting ($8 h) adults (Table 5). The prevalence variedsignificantly by age group, sex, race-ethnicity, consumption of afolic acid–containing supplements, dietary folic acid intake,alcohol intake (only available for adults), smoking status, andfolate status (as represented by RBC folate concentrations) in theoverall group and in fasting adults. In the overall group, theprevalence also varied significantly by BSA and fasting status.The prevalence of UMFA concentrations >2 and >5 nmol/L was13.9% and 7.0%, respectively, in the overall group and 5.2%and 1.9%, respectively, in fasting adults (data not shown).
Unmetabolized folic acid in US persons $1 y 523
by guest on April 19, 2016
jn.nutrition.orgD
ownloaded from
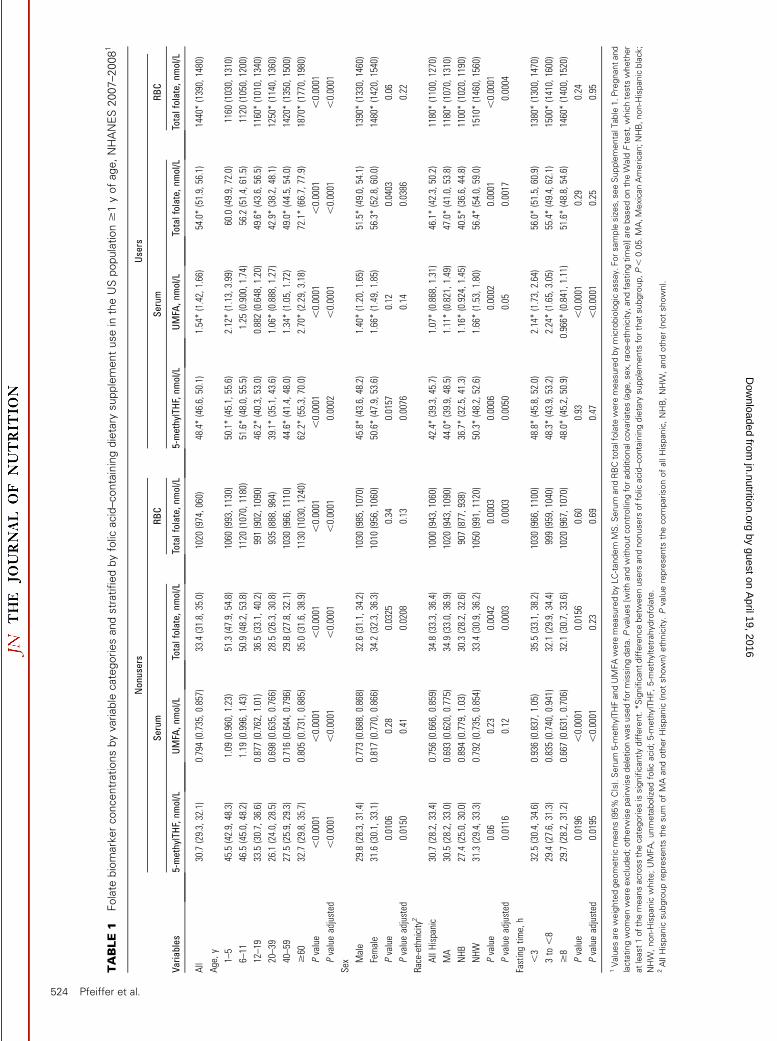
TABLE1
Folate
biomarkerconcentrationsbyvariable
categoriesandstratifiedbyfolic
acid–containingdietary
supplementusein
theUSpopulation$1yofage,NHANES2007–20081
Varia
bles
Nonusers
Users
Serum
RBC
Serum
RBC
5-methylTHF,nm
ol/L
UMFA
,nmol/L
Totalfolate,
nmol/L
Totalfolate,
nmol/L
5-methylTHF,nm
ol/L
UMFA
,nmol/L
Totalfolate,
nmol/L
Totalfolate,
nmol/L
All
30.7(29.3,32.1)
0.794(0.735,0.857)
33.4(31.8,35.0)
1020
(974,060)
48.4*(46.6,50.1)
1.54*(1.42,1.66)
54.0*(51.9,56.1)
1440*(1390,1480)
Age,y
1–5
45.5(42.9,48.3)
1.09
(0.960,1.23)
51.3(47.9,54.8)
1060
(993,1130)
50.1*(45.1,55.6)
2.12*(1.13,3.99)
60.0(49.9,72.0)
1160
(1030,1310)
6–11
46.5(45.0,48.2)
1.19
(0.996,1.43)
50.9(48.2,53.8)
1120
(1070,1180)
51.6*(48.0,55.5)
1.25
(0.900,1.74)
56.2(51.4,61.5)
1120
(1050,1200)
12–19
33.5(30.7,36.6)
0.877(0.762,1.01)
36.5(33.1,40.2)
991(902,1090)
46.2*(40.3,53.0)
0.882(0.648,1.20)
49.6*(43.6,56.5)
1160*(1010,1340)
20–39
26.1(24.0,28.5)
0.698(0.635,0.766)
28.5(26.3,30.8)
935(888,984)
39.1*(35.1,43.6)
1.06*(0.888,1.27)
42.9*(38.2,48.1)
1250*(1140,1360)
40–59
27.5(25.9,29.3)
0.716(0.644,0.796)
29.8(27.8,32.1)
1030
(966,1110)
44.6*(41.4,48.0)
1.34*(1.05,1.72)
49.0*(44.5,54.0)
1420*(1350,1500)
$60
32.7(29.8,35.7)
0.805(0.731,0.885)
35.0(31.6,38.9)
1130
(1030,1240)
62.2*(55.3,70.0)
2.70*(2.29,3.18)
72.1*(66.7,77.9)
1870*(1770,1980)
Pvalue
,0.0001
,0.0001
,0.0001
,0.0001
,0.0001
,0.0001
,0.0001
,0.0001
Pvalueadjusted
,0.0001
,0.0001
,0.0001
,0.0001
0.0002
,0.0001
,0.0001
,0.0001
Sex Male
29.8(28.3,31.4)
0.773(0.688,0.868)
32.6(31.1,34.2)
1030
(985,1070)
45.8*(43.6,48.2)
1.40*(1.20,1.65)
51.5*(49.0,54.1)
1390*(1330,1460)
Female
31.6(30.1,33.1)
0.817(0.770,0.866)
34.2(32.3,36.3)
1010
(956,1060)
50.6*(47.9,53.6)
1.66*(1.49,1.85)
56.3*(52.8,60.0)
1480*(1420,1540)
Pvalue
0.0106
0.28
0.0325
0.34
0.0157
0.12
0.0403
0.06
Pvalueadjusted
0.0150
0.41
0.0208
0.13
0.0076
0.14
0.0386
0.22
Race-ethnicity2
AllH
ispanic
30.7(28.2,33.4)
0.756(0.666,0.859)
34.8(33.3,36.4)
1000
(943,1060)
42.4*(39.3,45.7)
1.07*(0.868,1.31)
46.1*(42.3,50.2)
1180*(1100,1270)
MA
30.5(28.2,33.0)
0.693(0.620,0.775)
34.9(33.0,36.9)
1020
(943,1090)
44.0*(39.9,48.5)
1.11*(0.821,1.49)
47.0*(41.0,53.8)
1180*(1070,1310)
NHB
27.4(25.0,30.0)
0.894(0.779,1.03)
30.3(28.2,32.6)
907(877,938)
36.7*(32.5,41.3)
1.16*(0.924,1.45)
40.5*(36.6,44.8)
1100*(1020,1190)
NHW
31.3(29.4,33.3)
0.792(0.735,0.854)
33.4(30.9,36.2)
1050
(991,1120)
50.3*(48.2,52.6)
1.66*(1.53,1.80)
56.4*(54.0,59.0)
1510*(1460,1560)
Pvalue
0.06
0.23
0.0042
0.0003
0.0006
0.0002
0.0001
,0.0001
Pvalueadjusted
0.0116
0.12
0.0003
0.0003
0.0050
0.05
0.0017
0.0004
Fastingtim
e,h
,3
32.5(30.4,34.6)
0.936(0.837,1.05)
35.5(33.1,38.2)
1030
(966,1100)
48.8*(45.8,52.0)
2.14*(1.73,2.64)
56.0*(51.5,60.9)
1380*(1300,1470)
3to
,8
29.4(27.6,31.3)
0.835(0.740,0.941)
32.1(29.9,34.4)
999(959,1040)
48.3*(43.9,53.2)
2.24*(1.65,3.05)
55.4*(49.4,62.1)
1500*(1410,1600)
$8
29.7(28.2,31.2)
0.667(0.631,0.706)
32.1(30.7,33.6)
1020
(967,1070)
48.0*(45.2,50.9)
0.966*
(0.841,1.11)
51.6*(48.8,54.6)
1460*(1400,1520)
Pvalue
0.0196
,0.0001
0.0156
0.60
0.93
,0.0001
0.29
0.24
Pvalueadjusted
0.0195
,0.0001
0.23
0.69
0.47
,0.0001
0.25
0.95
1Valuesare
weightedgeometricmeans(95%
CIs).Serum
5-m
ethylTHFandUMFAwere
measuredbyLC-tandem
MS.Serum
andRBCtotalfolate
were
measuredbymicrobiologicassay.Forsample
sizes,seeSupplementalT
able
1.Pregnantand
lactatingwomenwere
excluded;otherw
isepairwisedeletionwasusedformissingdata.Pvalues[w
ithandwithoutcontrollingforadditionalcovariates(age,sex,race-ethnicity,andfastingtime)]are
basedontheW
ald
Ftest,whichtests
whether
atleast1ofthemeansacrossthecategoriesissignificantlydifferent.*Significantdifferencebetw
eenusers
andnonusers
offolic
acid–containingdietary
supplements
forthatsubgroup,P,
0.05.MA,MexicanAmerican;NHB,non-Hispanicblack;
NHW
,non-Hispanic
white;UMFA,unmetabolizedfolic
acid;5-m
ethylTHF,5-m
ethyltetrahydrofolate.
2AllHispanic
subgrouprepresents
thesum
ofMAandotherHispanic
(notshown)ethnicity.Pvaluerepresents
thecomparisonofallHispan
ic,NHB,NHW
,andother(notshown).
524 Pfeiffer et al.
by guest on April 19, 2016
jn.nutrition.orgD
ownloaded from
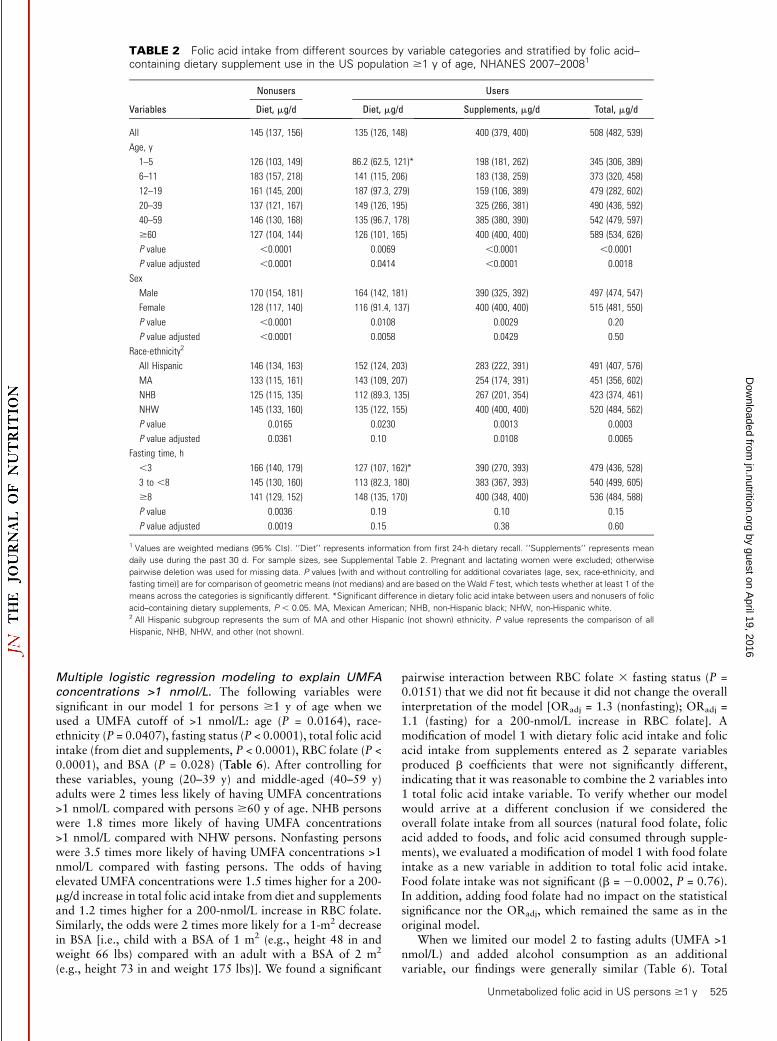
Multiple logistic regression modeling to explain UMFA
concentrations >1 nmol/L. The following variables weresignificant in our model 1 for persons $1 y of age when weused a UMFA cutoff of >1 nmol/L: age (P = 0.0164), race-ethnicity (P = 0.0407), fasting status (P < 0.0001), total folic acidintake (from diet and supplements, P < 0.0001), RBC folate (P <0.0001), and BSA (P = 0.028) (Table 6). After controlling forthese variables, young (20–39 y) and middle-aged (40–59 y)adults were 2 times less likely of having UMFA concentrations>1 nmol/L compared with persons $60 y of age. NHB personswere 1.8 times more likely of having UMFA concentrations>1 nmol/L compared with NHW persons. Nonfasting personswere 3.5 times more likely of having UMFA concentrations >1nmol/L compared with fasting persons. The odds of havingelevated UMFA concentrations were 1.5 times higher for a 200-mg/d increase in total folic acid intake from diet and supplementsand 1.2 times higher for a 200-nmol/L increase in RBC folate.Similarly, the odds were 2 times more likely for a 1-m2 decreasein BSA [i.e., child with a BSA of 1 m2 (e.g., height 48 in andweight 66 lbs) compared with an adult with a BSA of 2 m2
(e.g., height 73 in and weight 175 lbs)]. We found a significant
pairwise interaction between RBC folate 3 fasting status (P =0.0151) that we did not fit because it did not change the overallinterpretation of the model [ORadj = 1.3 (nonfasting); ORadj =1.1 (fasting) for a 200-nmol/L increase in RBC folate]. Amodification of model 1 with dietary folic acid intake and folicacid intake from supplements entered as 2 separate variablesproduced b coefficients that were not significantly different,indicating that it was reasonable to combine the 2 variables into1 total folic acid intake variable. To verify whether our modelwould arrive at a different conclusion if we considered theoverall folate intake from all sources (natural food folate, folicacid added to foods, and folic acid consumed through supple-ments), we evaluated a modification of model 1 with food folateintake as a new variable in addition to total folic acid intake.Food folate intake was not significant (b = 20.0002, P = 0.76).In addition, adding food folate had no impact on the statisticalsignificance nor the ORadj, which remained the same as in theoriginal model.
When we limited our model 2 to fasting adults (UMFA >1nmol/L) and added alcohol consumption as an additionalvariable, our findings were generally similar (Table 6). Total
TABLE 2 Folic acid intake from different sources by variable categories and stratified by folic acid–containing dietary supplement use in the US population $1 y of age, NHANES 2007–20081
Variables
Nonusers Users
Diet, mg/d Diet, mg/d Supplements, mg/d Total, mg/d
All 145 (137, 156) 135 (126, 148) 400 (379, 400) 508 (482, 539)
Age, y
1–5 126 (103, 149) 86.2 (62.5, 121)* 198 (181, 262) 345 (306, 389)
6–11 183 (157, 218) 141 (115, 206) 183 (138, 259) 373 (320, 458)
12–19 161 (145, 200) 187 (97.3, 279) 159 (106, 389) 479 (282, 602)
20–39 137 (121, 167) 149 (126, 195) 325 (266, 381) 490 (436, 592)
40–59 146 (130, 168) 135 (96.7, 178) 385 (380, 390) 542 (479, 597)
$60 127 (104, 144) 126 (101, 165) 400 (400, 400) 589 (534, 626)
P value ,0.0001 0.0069 ,0.0001 ,0.0001
P value adjusted ,0.0001 0.0414 ,0.0001 0.0018
Sex
Male 170 (154, 181) 164 (142, 181) 390 (325, 392) 497 (474, 547)
Female 128 (117, 140) 116 (91.4, 137) 400 (400, 400) 515 (481, 550)
P value ,0.0001 0.0108 0.0029 0.20
P value adjusted ,0.0001 0.0058 0.0429 0.50
Race-ethnicity2
All Hispanic 146 (134, 163) 152 (124, 203) 283 (222, 391) 491 (407, 576)
MA 133 (115, 161) 143 (109, 207) 254 (174, 391) 451 (356, 602)
NHB 125 (115, 135) 112 (89.3, 135) 267 (201, 354) 423 (374, 461)
NHW 145 (133, 160) 135 (122, 155) 400 (400, 400) 520 (484, 562)
P value 0.0165 0.0230 0.0013 0.0003
P value adjusted 0.0361 0.10 0.0108 0.0065
Fasting time, h
,3 166 (140, 179) 127 (107, 162)* 390 (270, 393) 479 (436, 528)
3 to ,8 145 (130, 160) 113 (82.3, 180) 383 (367, 393) 540 (499, 605)
$8 141 (129, 152) 148 (135, 170) 400 (348, 400) 536 (484, 588)
P value 0.0036 0.19 0.10 0.15
P value adjusted 0.0019 0.15 0.38 0.60
1 Values are weighted medians (95% CIs). ‘‘Diet’’ represents information from first 24-h dietary recall. ‘‘Supplements’’ represents mean
daily use during the past 30 d. For sample sizes, see Supplemental Table 2. Pregnant and lactating women were excluded; otherwise
pairwise deletion was used for missing data. P values [with and without controlling for additional covariates (age, sex, race-ethnicity, and
fasting time)] are for comparison of geometric means (not medians) and are based on the Wald F test, which tests whether at least 1 of the
means across the categories is significantly different. *Significant difference in dietary folic acid intake between users and nonusers of folic
acid–containing dietary supplements, P , 0.05. MA, Mexican American; NHB, non-Hispanic black; NHW, non-Hispanic white.2 All Hispanic subgroup represents the sum of MA and other Hispanic (not shown) ethnicity. P value represents the comparison of all
Hispanic, NHB, NHW, and other (not shown).
Unmetabolized folic acid in US persons $1 y 525
by guest on April 19, 2016
jn.nutrition.orgD
ownloaded from

folic acid intake (P = 0.0001) and RBC folate (P < 0.0001) werestill significant variables in model 2 and the b coefficients weregenerally comparable to model 1 (data not shown). Age (P =
0.07), race-ethnicity (P = 0.13), and BSA (P = 0.13) were nolonger significant variables, possibly because of the loss of powerin model 2. Alcohol consumption was significant (P = 0.0138).
TABLE 3 Serum 5-methylTHF concentration distributions by variable categories in the fasting US population $1 y of age, NHANES2007–20081
VariablesSamplesize, n
Geometricmean, nmol/L
Percentiles, nmol/L
5th 25th 50th 75th 95th
All 1066 34.9 (33.3, 36.6) 13.0 (11.9, 14.6) 24.0 (22.0, 26.4) 35.2 (32.7, 37.9) 52.7 (50.0, 54.8) 79.9 (75.5, 89.3)
Age, y
1–11 95 49.0 (46.0, 52.2) 26.8* (15.4, 29.3) 38.4 (33.8, 45.6) 54.3 (46.0, 59.5) 62.6 (58.5, 65.9) 74.4* (71.7, 87.6)
12–19 139 36.0 (32.0, 40.6) 15.1* (9.71, 18.3) 27.7 (23.7, 30.4) 36.0 (32.3, 42.6) 50.3 (42.1, 57.8) 77.8* (58.5, 95.3)
20–39 257 28.3 (25.3, 31.6) 11.7 (9.88, 13.5) 20.2 (16.6, 23.5) 28.6 (25.4, 32.6) 40.5 (36.5, 47.2) 59.3 (53.8, 106)
40–59 272 33.7 (30.4, 37.4) 13.0 (11.1, 14.1) 23.4 (20.7, 26.3) 34.3 (28.9, 39.7) 52.4 (44.6, 56.4) 75.5 (69.4, 85.4)
$60 303 45.1 (41.0, 49.7) 17.6 (15.0, 19.8) 30.0 (25.9, 33.7) 47.0 (41.6, 53.1) 67.1 (60.2, 75.8) 103 (95.0, 129)
Sex
Male 546 33.5 (31.0, 36.2) 13.0 (11.2, 15.2) 24.4 (21.6, 27.6) 34.2 (30.3, 37.9) 48.3 (45.1, 52.5) 70.8 (67.5, 79.1)
Female 520 36.3 (34.7, 38.0) 13.1 (11.9, 15.2) 24.0 (21.9, 25.4) 36.8 (33.6, 40.9) 55.6 (53.3, 57.9) 89.3 (80.3, 96.1)
Race-ethnicity2
All Hispanic 324 30.4 (26.5, 34.8) 12.0 (7.92, 13.8) 21.4 (17.3, 25.3) 30.5 (26.9, 35.9) 44.7 (41.0, 50.1) 70.0 (62.7, 74.9)
MA 188 30.5 (26.4, 35.2) 11.3* (5.43, 14.9) 21.4 (16.8, 26.6) 30.9 (27.2, 36.4) 43.5 (40.8, 50.0) 73.5* (62.4, 79.7)
NHB 229 27.0 (24.8, 29.5) 11.5 (7.42, 13.0) 17.8 (16.6, 19.4) 27.8 (23.6, 31.9) 40.9 (36.6, 45.1) 58.2 (55.7, 66.2)
NHW 478 37.8 (35.3, 40.5) 14.6 (12.2, 16.7) 26.4 (23.2, 29.5) 37.8 (34.5, 42.0) 55.4 (52.6, 59.4) 87.5 (78.6, 96.2)
Folic acid–containing
supplement
No 717 29.7 (28.2, 31.2) 12.0 (11.1, 13.1) 21.4 (19.7, 22.9) 30.3 (28.4, 32.8) 42.3 (40.4, 45.3) 64.6 (60.4, 72.4)
Yes 283 48.0 (45.2, 50.9) 19.7 (11.1, 23.3) 35.7 (32.7, 37.6) 52.1 (48.1, 54.3) 66.2 (59.1, 78.0) 95.7 (87.6, 133)
1 Values are weighted geometric means and selected percentile concentrations (95% CIs) for fasting persons (no consumption of food and supplements for $8 h before blood
draw). Pregnant and lactating women were excluded; otherwise pairwise deletion was used for missing data. *Estimate is subject to greater uncertainty because of small cell size
(n , 224). MA, Mexican American; NHB, non-Hispanic black; NHW, non-Hispanic white; 5-methylTHF, 5-methyltetrahydrofolate.2 All Hispanic subgroup represents the sum of MA and other Hispanic (not shown) ethnicity.
TABLE 4 Serum UMFA concentration distributions by variable categories in the fasting US population $1 y of age, NHANES 2007–20081
VariablesSamplesize, n
Geometricmean, nmol/L
Percentiles, nmol/L
5th 25th 50th 75th 95th
All 1056 0.758 (0.714, 0.804) 0.308 (,LOD, 0.366) 0.547 (0.510, 0.580) 0.696 (0.671, 0.723) 0.951 (0.896, 1.02) 1.98 (1.67, 2.45)
Age, y
1–11 95 0.920 (0.709, 1.19) 0.373* (,LOD, 0.527) 0.617 (0.600, 0.663) 0.743 (0.672, 0.897) 1.04 (0.865, 1.28) 2.89* (1.65, 42.3)
12–19 138 0.734 (0.645, 0.836) 0.348* (,LOD, 0.476) 0.579 (0.483, 0.615) 0.698 (0.617, 0.802) 0.939 (0.815, 1.18) 1.48* (1.31, 3.70)
20–39 255 0.673 (0.608, 0.745) ,LOD (,LOD, 0.369) 0.506 (0.453, 0.561) 0.639 (0.590, 0.701) 0.872 (0.788, 0.936) 1.62 (1.15, 2.75)
40–59 268 0.693 (0.660, 0.728) 0.301 (,LOD, 0.340) 0.519 (0.483, 0.568) 0.693 (0.671, 0.710) 0.876 (0.809, 0.955) 1.61 (1.41, 1.98)
$60 300 1.01 (0.860, 1.18) 0.330 (,LOD, 0.422) 0.597 (0.563, 0.629) 0.863 (0.757, 0.953) 1.18 (1.09, 1.40) 7.58 (3.06, 35.5)
Sex
Male 541 0.696 (0.636, 0.762) ,LOD 0.496 (0.453, 0.546) 0.670 (0.606, 0.718) 0.899 (0.832, 0.992) 1.95 (1.48, 2.82)
Female 515 0.824 (0.762, 0.891) 0.379 (0.306, 0.427) 0.592 (0.561, 0.614) 0.713 (0.697, 0.760) 0.997 (0.927, 1.11) 2.10 (1.61, 4.60)
Race-ethnicity2
All Hispanic 324 0.642 (0.571, 0.723) ,LOD 0.483 (0.394, 0.552) 0.645 (0.595, 0.694) 0.847 (0.784, 0.933) 1.33 (1.19, 1.68)
MA 188 0.607 (0.523, 0.704) ,LOD* 0.441 (0.336, 0.534) 0.609 (0.538, 0.690) 0.837 (0.729, 0.936) 1.20* (1.17, 1.46)
NHB 225 0.797 (0.709, 0.896) 0.326 (,LOD, 0.453) 0.554 (0.501, 0.619) 0.780 (0.714, 0.874) 1.03 (0.927, 1.25) 2.06 (1.56, 3.10)
NHW 472 0.789 (0.728, 0.856) 0.352 (,LOD, 0.396) 0.563 (0.515, 0.600) 0.698 (0.670, 0.729) 0.959 (0.898, 1.05) 2.07 (1.64, 4.58)
Folic acid–containing
supplement
No 712 0.667 (0.631, 0.706) 0.302 (,LOD, 0.351) 0.518 (0.484, 0.556) 0.655 (0.619, 0.682) 0.856 (0.806, 0.919) 1.42 (1.31, 1.73)
Yes 281 0.966 (0.841, 1.11) 0.339 (,LOD, 0.433) 0.630 (0.535, 0.689) 0.825 (0.707, 0.918) 1.13 (1.05, 1.38) 5.44 (2.24, 40.4)
1 Values are weighted geometric means and selected percentile concentrations (95% CIs) for fasting persons (no consumption of food and supplements for $8 h before blood
draw). Pregnant and lactating women were excluded; otherwise pairwise deletion was used for missing data. LOD for UMFA is 0.3 nmol/L. *Estimate is subject to greater
uncertainty because of small cell size (n , 224). LOD, limit of detection; MA, Mexican American; NHB, non-Hispanic black; NHW, non-Hispanic white; UMFA, unmetabolized folic
acid.2 All Hispanic subgroup represents the sum of MA and other Hispanic (not shown) ethnicity.
526 Pfeiffer et al.
by guest on April 19, 2016
jn.nutrition.orgD
ownloaded from

TABLE 5 Prevalence of UMFA concentrations .1 nmol/L by variable categories in US participants $1 yof age, NHANES 2007–20081
Variables
Fasting and nonfasting participants $1 y Fasting ($8 h) adults ($20 y)
Sample size, n Prevalence, % Sample size, n Prevalence, %
All 2676 33.2 (29.7, 36.9) 823 21.0 (17.7, 24.7)
Age, y
1–5 263 41.2 (33.7, 49.1) — —
6–11 337 44.8 (36.3, 53.6) — —
12–19 337 33.7 (26.4, 41.9) — —
20–39 536 22.7 (19.2, 26.6) 255 13.9 (9.1, 20.7)
40–59 560 29.0 (23.3, 35.4) 268 17.6 (13.5, 22.7)
$60 643 48.3 (42.7, 54.0) 300 36.2 (29.8, 43.1)
P value ,0.0001 0.0001
Sex
Male 1378 30.1 (25.4, 35.3) 411 16.3 (11.4, 22.8)
Female 1298 36.3 (32.5, 40.2) 412 25.3 (21.2, 30.0)
P value 0.0277 0.0177
Race-ethnicity2
All Hispanic 875 25.7 (22.0, 29.8) 245 10.9 (7.0, 16.6)
NHB 563 35.8 (28.4, 44.0) 162 26.0 (17.6, 36.6)
NHW 1121 34.7 (30.5, 39.1) 391 22.6 (18.1, 27.9)
P value 0.0040 0.0159
Fasting time, h
,3 1047 41.9 (36.8, 47.1) — —
3 to ,8 573 41.7 (35.8, 47.8) — —
$8 1056 21.5 (18.2, 25.3) — —
P value ,0.0001 —
Folic acid–containing supplement3
Yes 688 51.1 (47.8, 54.3) 241 35.2 (28.0, 43.2)
No 1857 24.9 (20.8, 29.6) 523 12.9 (8.9, 18.3)
P value ,0.0001 0.0001
Total folic acid intake,4 μg/d
,100 596 18.3 (14.0, 23.6) 209 8.2 (4.1, 15.6)*
100 to ,200 609 22.4 (17.5, 28.1) 168 12.5 (7.4, 20.4)
200 to ,400 614 31.2 (27.3, 35.4) 157 15.0 (9.9, 22.0)
$400 630 54.9 (50.1, 59.6) 214 38.7 (31.6, 46.3)
P value ,0.0001 0.0001
Alcohol intake,5 drinks/d
No drinks — — 253 24.0 (19.2, 29.5)
,1 — — 404 21.1 (15.7, 27.8)
1 to ,2 — — 71 19.8 (11.6, 31.6)
$2 — — 39 8.2 (2.0, 28.5)**
P value — 0.0403
Smoking status6
Nonsmoker 2029 36.4 (32.6, 40.3) 615 24.2 (20.7, 28.1)
Smoker 487 21.2 (16.0, 27.6) 207 11.7 (6.3, 20.9)
P value 0.0009 0.0131
Body surface area,7 m2
,1.5 612 42.8 (37.6, 48.2) 22 17.2 (4.5, 47.7)**
1.5 to ,1.8 686 35.0 (29.0, 41.6) 238 26.4 (19.4, 34.9)
1.8 to ,2.0 578 35.2 (28.7, 42.3) 229 21.2 (14.7, 29.7)
$2 685 25.4 (21.1, 30.2) 316 16.0 (11.7, 21.5)
P value 0.0005 0.06
(Continued)
Unmetabolized folic acid in US persons $1 y 527
by guest on April 19, 2016
jn.nutrition.orgD
ownloaded from
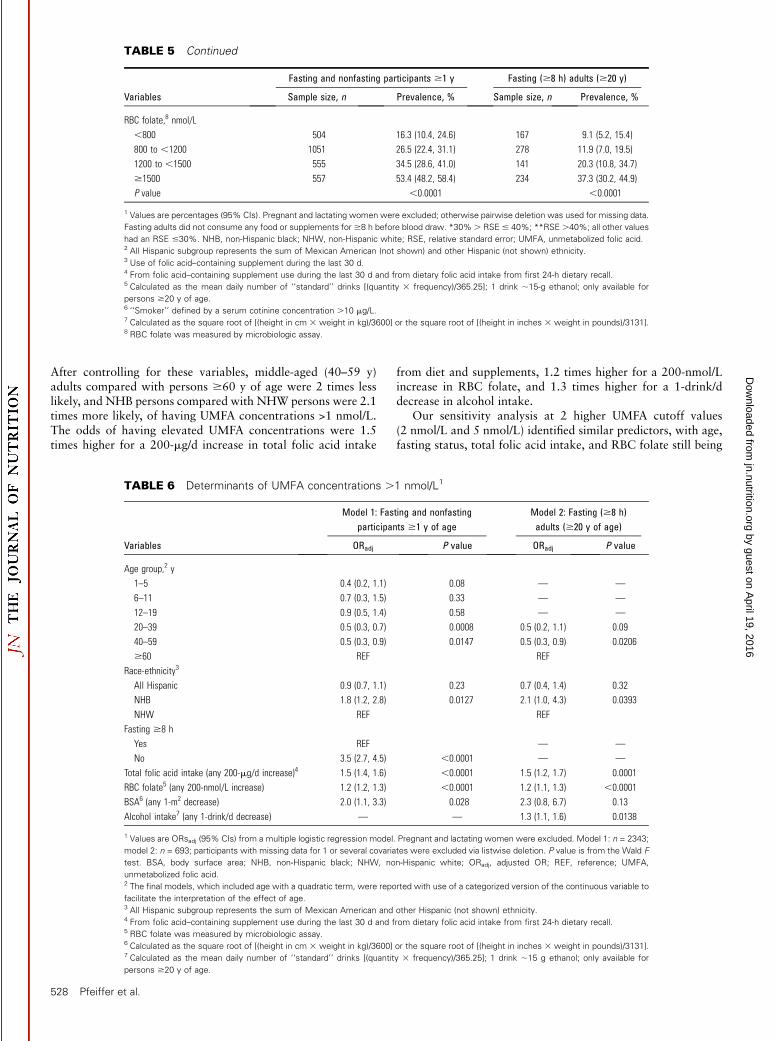
After controlling for these variables, middle-aged (40–59 y)adults compared with persons $60 y of age were 2 times lesslikely, and NHB persons compared with NHW persons were 2.1times more likely, of having UMFA concentrations >1 nmol/L.The odds of having elevated UMFA concentrations were 1.5times higher for a 200-mg/d increase in total folic acid intake
from diet and supplements, 1.2 times higher for a 200-nmol/Lincrease in RBC folate, and 1.3 times higher for a 1-drink/ddecrease in alcohol intake.
Our sensitivity analysis at 2 higher UMFA cutoff values(2 nmol/L and 5 nmol/L) identified similar predictors, with age,fasting status, total folic acid intake, and RBC folate still being
TABLE 5 Continued
Variables
Fasting and nonfasting participants $1 y Fasting ($8 h) adults ($20 y)
Sample size, n Prevalence, % Sample size, n Prevalence, %
RBC folate,8 nmol/L
,800 504 16.3 (10.4, 24.6) 167 9.1 (5.2, 15.4)
800 to ,1200 1051 26.5 (22.4, 31.1) 278 11.9 (7.0, 19.5)
1200 to ,1500 555 34.5 (28.6, 41.0) 141 20.3 (10.8, 34.7)
$1500 557 53.4 (48.2, 58.4) 234 37.3 (30.2, 44.9)
P value ,0.0001 ,0.0001
1 Values are percentages (95% CIs). Pregnant and lactating women were excluded; otherwise pairwise deletion was used for missing data.
Fasting adults did not consume any food or supplements for $8 h before blood draw. *30%. RSE # 40%; **RSE .40%; all other values
had an RSE #30%. NHB, non-Hispanic black; NHW, non-Hispanic white; RSE, relative standard error; UMFA, unmetabolized folic acid.2 All Hispanic subgroup represents the sum of Mexican American (not shown) and other Hispanic (not shown) ethnicity.3 Use of folic acid–containing supplement during the last 30 d.4 From folic acid–containing supplement use during the last 30 d and from dietary folic acid intake from first 24-h dietary recall.5 Calculated as the mean daily number of ‘‘standard’’ drinks [(quantity 3 frequency)/365.25]; 1 drink ;15-g ethanol; only available for
persons $20 y of age.6 ‘‘Smoker’’ defined by a serum cotinine concentration .10 mg/L.7 Calculated as the square root of [(height in cm 3 weight in kg)/3600] or the square root of [(height in inches 3 weight in pounds)/3131].8 RBC folate was measured by microbiologic assay.
TABLE 6 Determinants of UMFA concentrations .1 nmol/L1
Variables
Model 1: Fasting and nonfastingparticipants $1 y of age
Model 2: Fasting ($8 h)adults ($20 y of age)
ORadj P value ORadj P value
Age group,2 y
1–5 0.4 (0.2, 1.1) 0.08 — —
6–11 0.7 (0.3, 1.5) 0.33 — —
12–19 0.9 (0.5, 1.4) 0.58 — —
20–39 0.5 (0.3, 0.7) 0.0008 0.5 (0.2, 1.1) 0.09
40–59 0.5 (0.3, 0.9) 0.0147 0.5 (0.3, 0.9) 0.0206
$60 REF REF
Race-ethnicity3
All Hispanic 0.9 (0.7, 1.1) 0.23 0.7 (0.4, 1.4) 0.32
NHB 1.8 (1.2, 2.8) 0.0127 2.1 (1.0, 4.3) 0.0393
NHW REF REF
Fasting $8 h
Yes REF — —
No 3.5 (2.7, 4.5) ,0.0001 — —
Total folic acid intake (any 200-mg/d increase)4 1.5 (1.4, 1.6) ,0.0001 1.5 (1.2, 1.7) 0.0001
RBC folate5 (any 200-nmol/L increase) 1.2 (1.2, 1.3) ,0.0001 1.2 (1.1, 1.3) ,0.0001
BSA6 (any 1-m2 decrease) 2.0 (1.1, 3.3) 0.028 2.3 (0.8, 6.7) 0.13
Alcohol intake7 (any 1-drink/d decrease) — — 1.3 (1.1, 1.6) 0.0138
1 Values are ORsadj (95% CIs) from a multiple logistic regression model. Pregnant and lactating women were excluded. Model 1: n = 2343;
model 2: n = 693; participants with missing data for 1 or several covariates were excluded via listwise deletion. P value is from the Wald F
test. BSA, body surface area; NHB, non-Hispanic black; NHW, non-Hispanic white; ORadj, adjusted OR; REF, reference; UMFA,
unmetabolized folic acid.2 The final models, which included age with a quadratic term, were reported with use of a categorized version of the continuous variable to
facilitate the interpretation of the effect of age.3 All Hispanic subgroup represents the sum of Mexican American and other Hispanic (not shown) ethnicity.4 From folic acid–containing supplement use during the last 30 d and from dietary folic acid intake from first 24-h dietary recall.5 RBC folate was measured by microbiologic assay.6 Calculated as the square root of [(height in cm 3 weight in kg)/3600] or the square root of [(height in inches 3 weight in pounds)/3131].7 Calculated as the mean daily number of ‘‘standard’’ drinks [(quantity 3 frequency)/365.25]; 1 drink ;15 g ethanol; only available for
persons $20 y of age.
528 Pfeiffer et al.
by guest on April 19, 2016
jn.nutrition.orgD
ownloaded from

significant variables; additionally, use of any dietary supplementin the last 30 d emerged as a significant variable (P = 0.0016 forUMFA >2 nmol/L; P = 0.0087 for UMFA >5 nmol/L; data notshown).
Discussion
To our knowledge, this paper presents the first data for serum5-methylTHF and UMFA concentrations in a nationally represen-tative sample of the US population $1 y of age where we havereadily available information on dietary intake and supplementuse. Our results raise questions as to what UMFA concentrationsmean and whether they contribute useful information to theassessment of folate status. We confirmed previous findings thatUMFA concentrations are associated with folic acid intake (9–14, 17) and that UMFA is closely associated (r =;0.3–0.6) with5-methylTHF (9, 14) and total folate concentrations (11).UMFA was detected in nearly everyone, and concentrations >1nmol/L were mainly associated with being nonfasting andhaving higher folic acid intake from diet and supplements.However, at the same total folic acid intake and fasting status,certain groups were more likely to have UMFA concentrations>1 nmol/L: NHB persons, older persons, persons with a smallerBSA, and persons with decreased alcohol consumption.
These findings raise the possibility that UMFA concentrationsmay be an indicator of a mismatch between supply (i.e., intakes)and cellular demand (i.e., requirements). For example, the lowerserum and RBC folate concentrations for NHB persons com-pared with all Hispanics and NHW persons, also observed here,have always created a paradox with respect to our understand-ing of a causal relation between folate status and neural tubedefects rates. NHB persons have both the lowest neural tubedefects rates and the lowest blood folate concentrations com-pared with other race-ethnic groups (34). Although NHBpersons in the SUP2 group in our study had lower 5-methylTHFconcentrations but comparable UMFA concentrations com-pared with NHW persons, being NHB almost doubled theirodds of having UMFA concentrations >1 nmol/L. Whether thisreflects a lower requirement for dietary folic acid in thispopulation subgroup or genetic differences in how efficientlyfolic acid is metabolized is unknown. Human liver has beenshown to have low and variable dihydrofolate reductase activity(35), and it has been suggested that a polymorphism indihydrofolate reductase may limit folic acid assimilation intocellular folate stores at high and low intakes leading to increasedplasma UMFA (36).
The higher serum UMFA concentrations in children or olderadults compared with other age groups may also be a reflectionof lower requirements relative to their intakes. For example, theestimated average requirements of folate for children 1–3 y and4–8 y of age compared with adults $19 y of age are 120, 160,and 320 mg DFE/d, respectively (37), thus approximately one-third to one-half that of adults. Yet the folic acid intakes forchildren 1–11 y of age in the SUP+ group in this study wereapproximately two-thirds that of adults. Our finding that asmaller BSA was associated with higher UMFA concentrationsseems plausible because children have a higher intake-to-BSAratio compared with adults. In another example, older adults inthe SUP+ group may have higher UMFA concentrations thanyounger adults because their intakes were higher although theirestimated average requirements are the same. And finally, wefound an inverse association between UMFA concentrations andalcohol consumption even though serum and RBC folate con-centrations were similar across categories of increasing alcohol
consumption (data not shown).This may reflect altered folatemetabolism because of the known adverse interactions (in-hibited absorption and metabolism and/or increased urinarylosses) between alcohol consumption and folate utilization (38).Although the speculations described here are suggestive of apotential use for UMFA in folate status assessments, moreresearch is needed to confirm that these hypotheses are in factvalid.
Challenging our understanding of folic acid biotransforma-tion, a recent human intervention study showed that 15 minafter a 220-mg dose of folic acid, 80% of labeled folate in thehepatic portal vein was unmodified folic acid (6). The humangut thus appears to have limited ability to reduce folic acid,whereas a 5-formylTHF dose was converted very efficiently to5-methylTHF (4% unmodified 5-formylTHF in the portal vein).The authors suggested that ‘‘chronic exposure to folic acid inphysiologic doses (as would be the case with mandatory fortifi-cation) may induce saturation and explain the observed systemiccirculation of UMFA’’ (6). We detected UMFA in 96% and 98%of the SUP2 and SUP+ groups, respectively. The higher UMFAgeometric mean in the SUP+ group (1.54 nmol/L) compared withthe SUP2 group (0.794 nmol/L) suggested that some of theUMFA in the SUP+ group likely comes from consumption offortified cereal-grain foods and/or ready-to-eat cereals.
Earlier studies that measured UMFA or 5-methylTHF did notrepresent demographically diverse populations. Kalmbach et al.(10) evaluated determinants of UMFA concentrations $1.35nmol/L in adult participants of the Framingham OffspringCohort before (n = 1103) and after (n = 600) fortification.Dietary folic acid intake, total folate intake, B vitamin supple-ment use, and plasma folate concentrations were positivelyassociated with the prevalence of high UMFA concentrations,but age, sex, BMI, smoking, alcohol intake, caffeine intake,natural folate intake, and plasma concentrations or dietaryintake of vitamins B-6 and B-12 were not.
Serum UMFA and 5-methylTHF concentrations appearedhigher in the United States where there is fortification andapproximately one-third of the population uses folic acidsupplements [as shown in this study, Kalmbach et al. (10), andBailey et al. (17)] compared to small convenience sample reportsfrom countries with lower dietary supplement use and withvoluntary fortification [Ireland, n = 135 (11); Germany, n = 25(8) and n = 37 (13)], although this was merely an ecologicobservation (Supplemental Figure 2). However, aside from thefact that these data come from different populations, cautionshould be used when comparing data from different studiesbecause of method differences, including LOD differences.Previous studies reported different UMFA detection rates evenwith the same method (Tufts LOD = 0.18 nmol/L): 38% (16),67% (9), and 78% (39). The Irish studies (11, 12) reporteddetection rates (85–94%, LOD =;0.07–0.15 nmol/L) similar tothis study (>95%, LOD = 0.30 nmol/L). To assess the compa-rability of the Tufts and CDC method, we performed a methodcomparison on 311 surplus sera from American seniors ($60 yof age) in the NHANES 2001–2002 (40). Serum 5-methylTHFconcentrations were comparable (no bias, Pearson r = 0.89),whereas UMFA concentrations were not (CDC method detectedUMFA in all samples; CDC results were on average 33% higherthan Tufts results in a subset of 152 samples with detectableUMFA results by the Tufts method after excluding 11 extremeoutliers, Pearson r = 0.80), thereby restricting the comparabilityof the current to the previous UMFA data in the NHANES.
Our study has some limitations. We were limited in thenumber of stratifications we could perform with a one-third
Unmetabolized folic acid in US persons $1 y 529
by guest on April 19, 2016
jn.nutrition.orgD
ownloaded from

subset 2-y NHANES data set. We did not estimate usual intake,which is preferred to describe the distribution of intakes in thepopulation. Instead we focused on mean intakes collected in theMEC at the time of the blood draw so as to have these 2indicators of folate status reflect the same time period. We didnot investigate the association of UMFA with sources of folicacid intake (fortified cereal-grain foods, ready-to-eat cereals,supplements, and combinations thereof). The strengths of ouranalysis are several fold. The inclusion of all age groups providesthe first nationally representative data for children and adoles-cents, in addition to adults, in a demographically diversepopulation. The availability of dietary intake and supplementuse information as well as demographic and lifestyle character-istics allowed us to evaluate a multitude of factors that may berelated to high UMFA concentrations. UMFA was detectable innearly all samples, maximizing the power of our study. OurHPLC-MS/MS procedure matched the uncertainty limits of theNIST-certified value for 5-methylTHF and the reference valuefor UMFA, proving that this method yielded comparable resultsto NIST�s reference measurement procedure. In summary, ourfindings suggest that UMFA concentrations cannot be solelyexplained by total folic acid intake and fasting status. They mayindicate a mismatch between supply and cellular demand, butsome common genetic polymorphisms may also have an impact(36). Confirmation of our findings in other populations will beimportant to enhance our understanding of how to interpretfolate forms in the context of folate status and health outcomes.Given that in the United States we have both folic acidfortification and a high rate of supplement use, it remainsimportant to monitor the folate vitamer concentrations; thiswork serves to establish the first nationally representative datafor such purposes.
AcknowledgmentsWe thank the following laboratory members: Neelima Paladugula,Bridgette Toombs, and Huiping Chen (CDC National Centerfor Environmental Health). CMP and MRS designed the overallresearch project; CMP, MRS, and ZF conducted most of theresearch; CMP and MRS analyzed most of the data; CMP wrotethe initial draft, which was modified based on critical reviewfrom EAY, DAL, RLB, and CLJ; and CMP had primaryresponsibility for all content. All authors read and approved thefinal manuscript.
References
1. Yetley EA, Johnson CL. Folate and vitamin B-12 biomarkers inNHANES: history of their measurement and use. Am J Clin Nutr2011;94(Suppl):322S–31S.
2. Pfeiffer CM, Hughes JP, Lacher DA, Bailey RL, Berry RJ, Zhang M,Yetley EA, Rader JI, Sempos CT, Johnson CL. Estimation of trends inserum and RBC folate in the U.S. population from pre- to postforti-fication using assay-adjusted data from the NHANES 1988–2010.J Nutr 2012;142:886–93.
3. Pfeiffer CM, Fazili Z, Zhang M. Folate analytical methodology. In:Bailey LB, editor. Folate in health and disease. 2nd ed. Philadelphia:CRC Press, Taylor & Francis Group; 2010. p. 517–74.
4. Shane B. Folate status assessment history: implications for measurementof biomarkers in NHANES. Am J Clin Nutr 2011;94(Suppl):337S–42S.
5. Fazili Z, Pfeiffer CM, Zhang M. Comparison of serum folate speciesanalyzed by LC-MS/MS with total folate measured by microbiologicassay and BioRad radioassay. Clin Chem 2007;53:781–4.
6. Patanwala I, King MJ, Barrett DA, Rose J, Jackson R, Hudson M, PhiloM, Dainty JR, Wright AJA, Finglas PM, et al. Folic acid handling by thehuman gut: implications for food fortification and supplementation. AmJ Clin Nutr 2014;100:593–99.
7. Kelly P, McPartlin J, Goggins M, Weir DG, Scott JM. Unmetabolizedfolic acid in serum: acute studies in subjects consuming fortified foodand supplements. Am J Clin Nutr 1997;65:1790–5.
8. Sweeney MR, McPartlin J, Weir DG, Daly L, Scott JM. Postprandialserum folic acid response to multiple doses of folic acid in fortifiedbread. Br J Nutr 2006;95:145–51.
9. Obeid R, Kasoha M, Kirsch SH, Munz W, HerrmannW. Concentrationsof unmetabolized folic acid and primary folate forms in pregnantwomen at delivery and in umbilical cord blood. Am J Clin Nutr2010;92:1416–22.
10. Kalmbach RD, Choumenkovitch SF, Troen AM, D�Angostino R,Jacques PF, Selhub J. Circulating folic acid in plasma: relation to folicacid fortification. Am J Clin Nutr 2008;88:763–8.
11. Boilson A, Staines A, Kelleher CC, Daly L, Shirley I, Shrivastava A,Bailey SW, Alverson PB, Ayling JE, McDermott AP, et al. Unmetabolizedfolic acid prevalence is widespread in the older Irish population despitethe lack of a mandatory fortification program. Am J Clin Nutr2012;96:613–21.
12. Sweeney MR, Staines A, Daly L, Traynor A, Daly S, Bailey SW,Alverson PB, Ayling JE, Scott JM. Persistent circulating unmetabolisedfolic acid in a setting of liberal voluntary folic acid fortification.Implications for further mandatory fortification? BMC Public Health2009;9:295.
13. Sweeney MR, McPartlin J, Weir DG, Daly S, Pentieva K, Daly L, ScottJ. Evidence of unmetabolised folic acid in cord blood of newborn andserum of 4-day-old infants. Br J Nutr 2005;94:727–30.
14. Obeid R, Kirsch SH, Kasoha M, Eckert R, Herrmann W. Concentra-tions of unmetabolized folic acid and primary folate forms in plasmaafter folic acid treatment in older adults. Metabolism 2011;60:673–80.
15. Sweeney MR, McPartlin J, Scott J. Folic acid fortification and publichealth: report on threshold doses above which unmetabolised folic acidappear in serum. BMC Public Health 2007;7:41.
16. Morris MS, Jacques PF, Rosenberg IH, Selhub J. Circulating unmetab-olized folic acid and 5-methyltetrahydrofolate in relation to anemia,macrocytosis, and cognitive test performance in American seniors. Am JClin Nutr 2010;91:1733–44.
17. Bailey RL, Mills JL, Yetley EA, Gahche JJ, Pfeiffer CM, Dwyer JT, DoddKW, Sempos CT, Betz JM, Picciano MF. Unmetabolized serum folic acidand its relation to folic acid intake from diet and supplements in anationally representative sample of adults aged $60 y in the UnitedStates. Am J Clin Nutr 2010;92:383–9.
18. Yetley EA, Pfeiffer CM, Phinney KW, Fazili Z, Lacher DA, Bailey RL,Blackmore S, Bock JL, Brody LC, Carmel R, et al. Biomarkers of folatestatus in the National Health and Nutrition Examination Survey(NHANES): a roundtable summary. Am J Clin Nutr 2011;94(Suppl):303S–12S.
19. Curtin LR, Mohadjer LK, Dohrmann SM, Kruszon-Moran D, Mirel LB,Carroll MD, Hirsch R, Burt VL, Johnson CL. National Health andNutrition Examination Survey: sample design, 2007–2010. Vital HealthStat 2 2013;160:1–32.
20. Mirel LB, Mohadjer LK, Dohrmann SM, Clark J, Burt VL, Johnson CL,Curtin LR. National Health and Nutrition Examination Survey:estimation procedures, 2007–2010. Vital Health Stat 2 2013;159:1–25.
21. Centers for Disease Control and Prevention, National Center for HealthStatistics. NHANES response rates and population totals [cited 2014Jul 19]. Available from: http://www.cdc.gov/nchs/nhanes/response_rates_CPS.htm.
22. Centers for Disease Control and Prevention, National Center for HealthStatistics. 2007–2008 Serum folate forms (FOLFMS_E) [cited 2014 Jul19]. Available from: http://www.cdc.gov/nchs/nhanes/nhanes2007–2008/FOLFMS_E.htm.
23. Pfeiffer CM, Fazili Z, McCoy LF, Gunter EW. Determination of folatevitamers in human serum by stable-isotope dilution tandem massspectrometry and comparison to radioassay and microbiologic assay.Clin Chem 2004;50:423–32.
24. Fazili Z, Pfeiffer CM. Measurement of folates in serum and conven-tionally prepared whole blood lysates: application of an automated 96-well plate isotope-dilution tandem MS method. Clin Chem 2004;50:2378–81.
25. Fazili Z, Pfeiffer CM. Accounting for an isobaric interference allowscorrect determination of folate vitamers in serum by isotope dilution-liquid chromatography-tandem mass spectrometry. J Nutr 2013;143:108–13.
530 Pfeiffer et al.
by guest on April 19, 2016
jn.nutrition.orgD
ownloaded from

26. Caudill SP, Schleicher RL, Pirkle JL. Multi-rule quality control for theage-related eye disease study. Stat Med 2008;27:4094–106.
27. Phinney KW, Ballihaut G, Bedner M, Benford BS, Camara JE,Christopher SJ, Davis WC, Dodder NG, Eppe G, Lang BE, et al.Development of a standard reference material for metabolomicsresearch. Anal Chem 2013;85:11732–8.
28. Centers for Disease Control and Prevention, National Center for HealthStatistics. Total folate by microbiological assay [cited 2014 Sep 22].Available from: http://www.cdc.gov/nchs/data/nhanes/nhanes_07_08/FOLATE_E_met.pdf.
29. Centers for Disease Control and Prevention, National Center for HealthStatistics. Cotinine in serum by HPLC APCI tandem mass spectrometry[cited 2014 Sep 22]. Available from: http://www.cdc.gov/nchs/data/nhanes/nhanes_07_08/COT_E_met.pdf.
30. Centers for Disease Control and Prevention, National Center for HealthStatistics. 2007–2008 Dietary interview: total nutrient intakes—firstday (DR1TOT_E) [cited 2014 Sep 22]. Available from: http://wwwn.cdc.gov/nchs/nhanes/2007–2008/DR1TOT_E.htm.
31. Mosteller RD. Simplified calculation of body-surface area. N Engl JMed 1987;317:1098.
32. Pirkle JL, Flegal KM, Bernert JT, Brody DJ, Etzel RA, Maurer KR.Exposure of the US population to environmental tobacco smoke. JAMA1996;275:1233–40.
33. Sternberg MR, Schleicher RL, Pfeiffer CM. Regression modeling planfor 29 biochemical indicators of diet and nutrition measured inNHANES 2003–2006. J Nutr 2013;143:948S–56S.
34. Boulet SL, Yang Q, Mai C, Mulinare J, Pfeiffer CM. Folate status inwomen of childbearing age by race/ethnicity–United States 1999–2000,2001–2002, and 2003–2004. Morb Mortal Wkly Rep 2007;55:1377–80.
35. Bailey SW, Ayling JE. The extremely slow and variable activity ofdihydrofolate reductase in human liver and its implications for highfolic acid intake. Proc Natl Acad Sci USA 2009;106:15424–9.
36. Kalmbach RD, Choumenkovitch SF, Troen AP, Jacques PF, D�AgostinoR, Selhub J. A 19-base pair deletion polymorphism in dihydrofolatereductase is associated with increased unmetabolized folic acid inplasma and decreased red blood cell folate. J Nutr 2008;138:2323–7.
37. Institute of Medicine, Food and Nutrition Board. Dietary referenceintakes: thiamin, riboflavin, niacin, vitamin B6, folate, vitamin B12,pantothenic acid, biotin, and choline. Washington (DC): NationalAcademy Press; 1998.
38. Laufer EM, Hartman TJ, Baer DJ, Gunter EW, Dorgan JF, CampbellWS, Clevidence BA, Brown ED, Albanes D, Judd JT, et al. Effects ofmoderate alcohol consumption on folate and vitamin B12 status inpostmenopausal women. Eur J Clin Nutr 2004;58:1518–24.
39. Troen AM, Mitchell B, Sorensen B, Wener MH, Johnston A, Wood B,Selhub J, McTiernan A, Yasui Y, Oral E, et al. Unmetabolized folic acidin plasma is associated with reduced natural killer cell cytotoxicityamong postmenopausal women. J Nutr 2006;136:189–94.
40. Centers for Disease Control and Prevention, National Center for HealthStatistics. 2001–2002 Folic acid and 5-methyltetrahydrofolate in serum(Surplus Sera) (SSFA_B_R) [cited 2014 Sep 22]. Available from: http://wwwn.cdc.gov/nchs/nhanes/limited_access/SSFA_B_R.htm.
Unmetabolized folic acid in US persons $1 y 531
by guest on April 19, 2016
jn.nutrition.orgD
ownloaded from
Copyright © 2022 FDOKUMEN