
5-Methyltetrahydrofolic Acid and Folic Acid Pregnancy Diets ...
21
nutrients Article [6S]-5-Methyltetrahydrofolic Acid and Folic Acid Pregnancy Diets Differentially Program Metabolic Phenotype and Hypothalamic Gene Expression of Wistar Rat Dams Post-Birth Emanuela Pannia 1 , Rola Hammoud 1 , Rebecca Simonian 1 , Erland Arning 2 , Paula Ashcraft 2 , Brandi Wasek 2 , Teodoro Bottiglieri 2 , Zdenka Pausova 1,3,4 , Ruslan Kubant 1, * and G. Harvey Anderson 1,3, * Citation: Pannia, E.; Hammoud, R.; Simonian, R.; Arning, E.; Ashcraft, P.; Wasek, B.; Bottiglieri, T.; Pausova, Z.; Kubant, R.; Anderson, G.H. [6S]-5-Methyltetrahydrofolic Acid and Folic Acid Pregnancy Diets Differentially Program Metabolic Phenotype and Hypothalamic Gene Expression of Wistar Rat Dams Post-Birth. Nutrients 2021, 13, 48. http://dx.doi.org/10.3390/nu 13010048 Received: 24 November 2020 Accepted: 22 December 2020 Published: 25 December 2020 Publisher’s Note: MDPI stays neu- tral with regard to jurisdictional claims in published maps and institutional affiliations. Copyright: © 2020 by the authors. Li- censee MDPI, Basel, Switzerland. This article is an open access article distributed under the terms and conditions of the Creative Commons Attribution (CC BY) license (https://creativecommons.org/ licenses/by/4.0/). 1 Department of Nutritional Sciences, Faculty of Medicine, University of Toronto, Toronto, ON M5S 1A8, Canada; [email protected] (E.P.); [email protected] (R.H.); [email protected] (R.S.); [email protected] (Z.P.) 2 Center of Metabolomics, Institute of Metabolic Disease, Baylor Scott and White Health, Dallas, TX 75246, USA; [email protected] (E.A.); [email protected] (P.A.); [email protected] (B.W.); [email protected] (T.B.) 3 Department of Physiology, Faculty of Medicine, University of Toronto, Toronto, ON M5S 1A8, Canada 4 The Hospital for Sick Children, Toronto, ON M5G 1X8, Canada * Correspondence: [email protected] (R.K.); [email protected] (G.H.A.); Tel.: +1-416-978-3700 (R.K.); +1-416-978-1832 (G.H.A.) Abstract: [6S]-5-methyltetrahydrofolic acid (MTHF) is a proposed replacement for folic acid (FA) in diets and prenatal supplements. This study compared the effects of these two forms on maternal metabolism and hypothalamic gene expression. Pregnant Wistar rats received an AIN-93G diet with recommended FA (1X, 2 mg/kg, control), 5X-FA or equimolar levels of MTHF. During lactation they received the control diet and then a high fat diet for 19-weeks post-weaning. Body weight, adiposity, food intake, energy expenditure, plasma hormones, folate, and 1-carbon metabolites were measured. RNA-sequencing of the hypothalamus was conducted at parturition. Weight-loss from weaning to 1-week post-weaning was less in dams fed either form of the 5X vs. 1X folate diets, but final weight-gain was higher in 5X-MTHF vs. 5X-FA dams. Both doses of the MTHF diets led to 8% higher food intake and associated with lower plasma leptin at parturition, but higher leptin at 19-weeks and insulin resistance at 1-week post-weaning. RNA-sequencing revealed 279 differentially expressed genes in the hypothalamus in 5X-MTHF vs. 5X-FA dams. These findings indicate that MTHF and FA differ in their programing effects on maternal phenotype, and a potential adverse role of either form when given at the higher doses. Keywords: folate; folic acid; pregnancy; food intake regulation; hypothalamus; postpartum; weight- gain 1. Introduction The regulation of food intake, body weight, stress response, and circadian cycles is highly reliant on the development and plasticity of the hypothalamus to enable proper integration of central- and peripheral-derived signals and nutrient-related cues [1–3]. In addition to the fetus and newborn, the maternal brain undergoes dynamic functional adaptations throughout pregnancy into lactation [4]. As such, the peripartum period represents a period of high susceptibility to environmental factors that may influence mothers’ later-life outcomes. Folate is an essential B-vitamin required during pregnancy to support both maternal and fetal health outcomes [5] and regulatory functions of the brain [6,7]. Because of the biological importance of folate during pregnancy, deficiencies and/or excessive intakes may alter central or peripheral regulatory systems perpetuating the development of long-term health consequences [8–10]. Nutrients 2021, 13, 48. https://dx.doi.org/10.3390/nu13010048 https://www.mdpi.com/journal/nutrients
-
Upload
khangminh22 -
Category
Documents
-
view
1 -
download
0
Transcript of 5-Methyltetrahydrofolic Acid and Folic Acid Pregnancy Diets ...

nutrients
Article
[6S]-5-Methyltetrahydrofolic Acid and Folic Acid PregnancyDiets Differentially Program Metabolic Phenotype andHypothalamic Gene Expression of Wistar Rat Dams Post-Birth
Emanuela Pannia 1, Rola Hammoud 1, Rebecca Simonian 1, Erland Arning 2, Paula Ashcraft 2, Brandi Wasek 2,Teodoro Bottiglieri 2 , Zdenka Pausova 1,3,4, Ruslan Kubant 1,* and G. Harvey Anderson 1,3,*
�����������������
Citation: Pannia, E.; Hammoud, R.;
Simonian, R.; Arning, E.; Ashcraft, P.;
Wasek, B.; Bottiglieri, T.; Pausova, Z.;
Kubant, R.; Anderson, G.H.
[6S]-5-Methyltetrahydrofolic Acid
and Folic Acid Pregnancy Diets
Differentially Program Metabolic
Phenotype and Hypothalamic Gene
Expression of Wistar Rat Dams
Post-Birth. Nutrients 2021, 13, 48.
http://dx.doi.org/10.3390/nu
13010048
Received: 24 November 2020
Accepted: 22 December 2020
Published: 25 December 2020
Publisher’s Note: MDPI stays neu-
tral with regard to jurisdictional claims
in published maps and institutional
affiliations.
Copyright: © 2020 by the authors. Li-
censee MDPI, Basel, Switzerland. This
article is an open access article distributed
under the terms and conditions of the
Creative Commons Attribution (CC BY)
license (https://creativecommons.org/
licenses/by/4.0/).
1 Department of Nutritional Sciences, Faculty of Medicine, University of Toronto,Toronto, ON M5S 1A8, Canada; [email protected] (E.P.); [email protected] (R.H.);[email protected] (R.S.); [email protected] (Z.P.)
2 Center of Metabolomics, Institute of Metabolic Disease, Baylor Scott and White Health,Dallas, TX 75246, USA; [email protected] (E.A.); [email protected] (P.A.);[email protected] (B.W.); [email protected] (T.B.)
3 Department of Physiology, Faculty of Medicine, University of Toronto, Toronto, ON M5S 1A8, Canada4 The Hospital for Sick Children, Toronto, ON M5G 1X8, Canada* Correspondence: [email protected] (R.K.); [email protected] (G.H.A.);
Tel.: +1-416-978-3700 (R.K.); +1-416-978-1832 (G.H.A.)
Abstract: [6S]-5-methyltetrahydrofolic acid (MTHF) is a proposed replacement for folic acid (FA) indiets and prenatal supplements. This study compared the effects of these two forms on maternalmetabolism and hypothalamic gene expression. Pregnant Wistar rats received an AIN-93G diet withrecommended FA (1X, 2 mg/kg, control), 5X-FA or equimolar levels of MTHF. During lactation theyreceived the control diet and then a high fat diet for 19-weeks post-weaning. Body weight, adiposity,food intake, energy expenditure, plasma hormones, folate, and 1-carbon metabolites were measured.RNA-sequencing of the hypothalamus was conducted at parturition. Weight-loss from weaningto 1-week post-weaning was less in dams fed either form of the 5X vs. 1X folate diets, but finalweight-gain was higher in 5X-MTHF vs. 5X-FA dams. Both doses of the MTHF diets led to 8% higherfood intake and associated with lower plasma leptin at parturition, but higher leptin at 19-weeks andinsulin resistance at 1-week post-weaning. RNA-sequencing revealed 279 differentially expressedgenes in the hypothalamus in 5X-MTHF vs. 5X-FA dams. These findings indicate that MTHF and FAdiffer in their programing effects on maternal phenotype, and a potential adverse role of either formwhen given at the higher doses.
Keywords: folate; folic acid; pregnancy; food intake regulation; hypothalamus; postpartum; weight-gain
1. Introduction
The regulation of food intake, body weight, stress response, and circadian cycles ishighly reliant on the development and plasticity of the hypothalamus to enable properintegration of central- and peripheral-derived signals and nutrient-related cues [1–3]. Inaddition to the fetus and newborn, the maternal brain undergoes dynamic functionaladaptations throughout pregnancy into lactation [4]. As such, the peripartum periodrepresents a period of high susceptibility to environmental factors that may influencemothers’ later-life outcomes. Folate is an essential B-vitamin required during pregnancyto support both maternal and fetal health outcomes [5] and regulatory functions of thebrain [6,7]. Because of the biological importance of folate during pregnancy, deficienciesand/or excessive intakes may alter central or peripheral regulatory systems perpetuatingthe development of long-term health consequences [8–10].
Nutrients 2021, 13, 48. https://dx.doi.org/10.3390/nu13010048 https://www.mdpi.com/journal/nutrients
Nutrients 2021, 13, 48 2 of 21
To date, several studies demonstrated the programming potential of high FA towardsnegative metabolic health outcomes in the offspring. In the rodent model, exposure to FAat 2.5–10X above requirements during pregnancy resulted in male offspring that had higherbody weight, food intake and central and/or peripheral metabolic dysregulation [11–14]. Incontrast, female offspring born to high FA fed mothers exhibited lower post-weaning bodyweight-gain [15,16], but similarly showed evidence of metabolic dysregulation, includingreduced bone length, mineral content and density that associates with their lower weight-gain [17]. While the effects of FA intake on maternal health outcomes have been investigatedto a lesser extent, our recent study showed that 2.5–10X-FA intakes during pregnancy alsolead to metabolic dysregulation in the mother early post-birth [18], and others have shown20X-FA provided during pregnancy and lactation leads to the development of obesity inthe postpartum mother and future mothers to be (i.e., female offspring) [19].
In North America, many women consume FA at 2.5–7-fold the tolerable upper intakelevel of 1000 µg/day [20,21], raising concern of the potential negative effects associated withhigh intakes. 5-methyltetrahydrofolate (5-MTHF) is the bioactive form of folate derivedfrom the reduction of FA or 5-MTHF naturally present in foods. 5-MTHF participates inthe biosynthesis of nucleotides and monoamine neurotransmitters, homocysteine (Hcy)metabolism and production of S-adenosylmethionine (SAM). SAM is the universal methyldonor involved in cellular methylation reactions of which regulates dynamic changes ingene expression [22]. However, the conversion of FA to 5-MTHF is limited by commonpolymorphisms as well as high FA-induced enzyme inhibitions [23]. High concentrationsof serum [24] and maternal cord blood [25] unmetabolized FA have been detected andpredicted to affect the metabolism, intracellular transport and/or regulatory functions ofbioactive folates [26,27].
As a result, the replacement of FA with the reduced bioactive form of folate in dietarysupplements has been proposed [9,23,28]. Many prescribed and over-the-counter prenatalsupplements now incorporate the naturally occurring calcium salt, [6S]-5-methyltetrahydro-folic acid (MTHF), at a dose that is equivalent to those containing FA (1000 µg) [9,28].Moreover, its addition to baby formula has been discussed [29]. Support for the useof MTHF is shown through randomized clinical trials that showed MTHF is equally ormore effective as FA at increasing blood folate concentrations required for birth defectprevention [30]. Furthermore, MTHF supplementation has been shown to correct low5-MTHF production arising from genetic polymorphisms in folate-metabolism genes orFA-induced enzyme inhibitions [23,31]. The therapeutic potential of MTHF compared toFA in the prevention and possible treatment of mental health issues including perinataldepression has also been reported [32], further encouraging the replacement of FA withMTHF during pregnancy. However, a comparison of the effects of the different folate formsprovided during pregnancy and on long-term metabolic health has not been conducted.
The objective of this study was to compare the effects of diets containing FA atrecommended (1X) or high (5X) doses vs. equimolar MTHF provided during pregnancy onthe post-partum metabolic phenotype of Wistar rat mothers. In addition, we also aimed toinvestigate whether high folate diets differentially affected hypothalamic energy regulatorygenes and pathways in the mother immediately following parturition. We hypothesizedthat the adverse long-term effects of high FA intakes on mothers are not observed with highMTHF additions to the pregnancy diet, and these effects associate with modified expressionof regulatory genes in the hypothalamus. Primary outcome measure was body weight-gain.Other outcome measures included long-term food intake, energy expenditure, plasmaenergy regulatory hormones, plasma and tissue folates and 1-carbon metabolites andhypothalamic gene expression measured at parturition and up to 19 weeks post-weaning.
2. Materials and Methods2.1. Animals and Diets
All animal work was approved by the University of Toronto Animal Care Committee(#20011892). First-time pregnant Wistar rats (2–3 days, 170–250 g) were purchased from
Nutrients 2021, 13, 48 3 of 21
Charles River Farms (Quebec, Canada) and individually housed upon arrival. Animalswere maintained on a reverse 12-h dark-light cycle (lights on at 07:00 a.m. at 22 ± 1 ◦C)and ad libitum food and water were provided throughout the study. Dams were randomlyallocated to one of four dietary interventions that were provided contemporaneously andonly during pregnancy until term (3 weeks). Pregnant dams (n = 16–18/group) received anisocaloric AIN-93G diet (energy density 4.0 kcal/g) [33] containing either the recommended(1X, 2 mg/kg diet, control) or 5X-quantity of FA for rodents (1X-FA or 5X-FA) or equimolarrecommended levels of [6S]-5-methyltetrahydrofolic acid, calcium salt (1X, 2.1 mg/kg diet,Metafolin®, Merck & Cie, Schaffhausen, Switzerland) or 5X-quantity of MTHF (1X-MTHFor 5X-MTHF). FA and MTHF diets at equimolar doses have been used in clinical trialsassessing folate status and related-health effects [34–36]. The recommended (1X) dosewas chosen based on the FA requirements for rodents for adequate growth rate [37] andreflects the FDA requirements for non-pregnant women (400 µg/day) [38]. The 5X dosewas chosen to reflect FA intakes commonly consumed in North America above the basaldietary requirements for humans [20,21]. Diets were custom made by Research Diets Inc.(New Brunswick, NJ, USA) (Supplementary Materials Table S1) and stored at 4 ◦C and inthe dark until provided fresh weekly. The additions of the MTHF form of folate into foodshas been shown to be stable at both 4 ◦C and room temperature for up to 24 months [39].Analytical testing of the high folate diets following a 36-month storage at −80 ◦C showed>80% retention of folates (Table S1), further confirming their long-term stability.
At birth, a subset of dams (n = 5–6/group) and their entire litters were terminated foranalyses. Of the remaining dams, within 24 h post-birth, litters were culled to 6 pups/dam(3 male/female) for the lactation period (3 weeks). Dams were then all fed the control FAdiet (1X-FA) during lactation until weaning (21 days post-birth). Dams (n = 10–12/group)were maintained on a high fat diet (45% kcal from lard), adjusted to provide a similarmicronutrient content per 100 kcal as the control (1X-FA) AIN-93G diet, until terminationat 19-weeks post-weaning. As post-weaning body weight-gain was our primary outcomemeasure, a sample size of n = 10–12/group was used to achieve statistical power fordetecting 10% difference among treatment groups (α = 0.05, β = 0.8).
2.2. Body Weight, Food Intake, Body Composition and Plasma Analyses
Body weight of dams and pups were recorded immediately following parturitionand body weight of dams were recorded thereafter at weaning and weekly until 19-weekspost-weaning. Food intake was recorded weekly. Early weight-loss of the mothers wascalculated as the difference between 1-week post-weaning and weaning as previouslyreported [18], and maternal weight-gain calculated from 1–19 weeks post-weaning. The 1-week post-weaning time point was chosen as it is a hypothesized time point when maternalmetabolism begins to re-stabilize to the pre-pregnancy set-point or establishment of a newset-point [40]. All terminations occurred by rapid decapitation following an 8–10 h daytimefast. The intra-abdominal (visceral) adipose tissue (VAT), which constituted retroperitoneal,perirenal and periovarian fat pads, were manually excised and weighed. Adiposity Index(AI%) was calculated as percentage of total VAT weight adjusted per gram of body weight.Liver weight was also calculated as a percentage per gram of body weight, and percentageof total liver lipids were determined according to the method described by Folch et al. [41]and expressed per gram of tissue weight. Whole brains were excised and immediatelyfrozen on dry ice for later analyses. Trunk blood from dams at parturition and 19-weekspost-weaning were collected and plasma was separated and immediately frozen at −80 ◦Cfor further analyses.
2.3. Folate and Related 1-Carbon Metabolites
Concentrations of plasma and tissue folates [42,43] along with related 1-carbon metabo-lites including methionine, SAM, S-adenosylhomocysteine (SAH), cystathionine (Cys),choline and betaine [44] were measured in dams at parturition and at 19-weeks post-
Nutrients 2021, 13, 48 4 of 21
weaning by liquid chromatography tandem mass spectrometry (LC-MS/MS). Plasma Hcywas also measured by LC-MS/MS as previously described [45].
2.4. Plasma Hormones, and Insulin Tolerance Test
At parturition and 19-weeks post-weaning, fasting plasma glucose, insulin, activeghrelin and leptin were measured by commercially available assays: glucose (Cat#10009582,Cayman Chemical Co., Ann Arbor, MI, USA), insulin (Cat# 80-INSRT-E01, Alpco, Salem,NH, USA), leptin (Cat# EZRL-83K, EMD Millipore, Billerica, MA, USA) and active ghrelin(Cat#EZRGRA-90K, EMD Millipore, Billerica, MA, USA). Plasma leptin concentrationswere further adjusted for VAT mass. Insulin resistance (IR) at parturition and 19-weekspost-weaning was evaluated via a surrogate index of the homeostatic model assessmentinsulin resistance (HOMA-IR) calculated as follows: [fasting glucose (in mg/dL) × fastinginsulin (in µU/mL)]/2430] [46]. An insulin tolerance test (ITT) was also conducted in asubset of dams at 1- and 12-weeks post-weaning (n = 8/group) by measuring the glucoseconcentrations following a 6-h day-time fast and intraperitoneal injection of an insulin bolus(0.75 IU of insulin/kg body weight). Glucose was measured with the Accu-Chek® Avivaglucometer (Roche Diagnostics, Laval, QC, Canada) at 0, 15, 30, 60, 90 and 120 min via tailprick. To better ascertain the function of insulin-stimulated glucose uptake by tissue andinsulin-stimulated hepatic glucose suppression, the rate constant for glucose disappearance(kITT) was calculated 0–60 min using the formula kITT (%min−1) = (0.693/t1/2) × 100.
2.5. Energy Expenditure
Whole-body energy expenditure using the Comprehensive Lab Animal MonitoringSystem (CLAMS™, Columbus Instruments, Columbus, OH, USA) was measured in asubset of dams (n = 8/group) as previously reported [47]. Briefly, animals were transferredto The Hospital for Sick Children (Toronto, ON, Canada) at 14 weeks post-weaning, alloweda 1-week acclimatization period and tested on week 15. All measurements were taken atroom temperature (22 ◦C) and each animal was monitored for two consecutive 24-h periods(24-h acclimatization, 24-h data collection and analysis), as described elsewhere [26,27]).Heat production was automatically calculated from O2 consumption (VO2) and CO2production (VCO2) as follows: heat (kcal/kg/h) = (3.815 + 1.232 × (VCO2/VO2)) ×VO2 (mL/kg/h) and animal activity was measured using the Opto-M3 activity monitor(Columbus Instruments, Columbus, OH, USA).
2.6. Brain Analyses from 5X-FA and 5X-MTHF Dams2.6.1. Brain Dissections and RNA-Sequencing
The primary nutrient-sensing nucleus of the hypothalamus, the arcuate nucleus(ARC), was identified and macrodissected from frozen whole brain tissue collected from5X-FA and 5X-MTHF dams. The ARC was excised using the approximate stereotaxiccoordinates according to “The Rat Brain in Stereotaxic Coordinates” (Bregma −2.12 mm to−2.56 mm) [21], as previously described [40]. The optic chiasm was used as a landmark forthe anterior portion of the hypothalamus and as a horizontal limit for the first cut that wasmade using a sterile single edge razor blade. The ARC was isolated by inserting a blade~2 mm caudal to the first slice. The collected coronal brain slice was placed on a glass slideover dry ice and dissociated free hand. The 3rd ventricle was used as an anatomic referenceguiding the excision of the ARC for RNA extraction. The same coronal sections were alsoused for collection of a representative region of the midbrain for processing of folate [42]and 1-carbon metabolites [38] by LC-MS/MS, as previously described. This brain sectionwas excised by creating a box cut on either side of the midline that bordered the dorsalthird ventricle and contained regions of the mediodorsal thalamic nucleus.
For RNA analyses, the dissected ARC at parturition (n = 5/group) was homogenizedon ice using a tissue rupture homogenizer (Qiagen Tech., Mississauga, ON, Canada). RNAwas isolated using Trizol reagent and chloroform extraction according to the manufac-turer’s protocol (Invitrogen, Grand Island, NY, USA) and quantified by NanoDropTM2000
Nutrients 2021, 13, 48 5 of 21
Spectrophotometer (Thermo Scientific Inc., Wilmington, DE, USA). Quality of RNA wasassessed using the Agilent BioAnalyzer (RNA 6000 Nano LabChip) at the Centre for Ap-plied Genomics (TCAG) at the Hospital for Sick Children. Whole-transcriptome analysisby RNA-sequencing was performed at TCAG at the Hospital for Sick Children using apoly-A selection of mRNA. Paired-end 2 × 125 bp sequencing was performed with Il-lumina HiSeq 2500 instruments at a sequencing depth of ≈20 million paired reads persample. Sequence data was demultiplexed and base calls were converted to FASTQ formatwith bcl2fastq2 v2.20. The sequence read quality was assessed using FastQC v.0.11.5 [48].Adapter trimming and removal of lower quality ends was performed using Trim Galorev. 0.5.0 [49]. Trimmed reads were screened for presence of rRNA and mtRNA sequencesusing FastQ-Screen v.0.10.0 [50]. RSeQC package v.2.6.2 [51] was used to confirm strandspecific RNA-Seq library construction and to assess positional read duplication and readdistribution across exonic, intronic and intergenic regions. The quality of trimmed readswas re-assessed with FastQC. STAR aligner v.2.6.0c [52,53] was used to align the trimmedreads to Rnor_6.0 genome downloaded from Ensembl database version 98.6 using Ensemblgene models. The STAR alignments were processed to extract raw read counts for genesusing htseq-count v.0.6.1p2 (HTSeq) [54]. Two-condition differential gene expression wasperformed with DESeq2 [55] v. 1.26.0s, using R v.3.6.1. Initial minimal filtering of 10 readsper gene for all samples was applied to the datasets. More strict filtering to increase poweris automatically applied via independent filtering on the mean of normalized counts withinthe DESeq results function. Selected differentially expressed genes (DEGs), correctedfor multiple testing (Benjamini-Hochberg), were used as an input for pathway analysis(p-adjusted, padj ≤ 0.05). The reference level was data from 5X-FA dams.
2.6.2. Enrichment Analysis of Differential Expressed Genes (DEGs)
Goseq procedure was used for pathway enrichment analyses. For each goseq analysis,two lists of genes were created with up-regulated genes (log fold change > 0) and down-regulated genes (log fold change < 0) using padj ≤ 0.05. The up- or down-regulatedgene lists were used one at a time with correction for gene length bias. Rat gene setswere obtained from GO (through R package GO.db, 3.8.2); KEGG files were downloadeddirectly from the KEGG website on 2020/03/26; Reactome sets were downloaded from theReactome website, and used together with GO and KEGG sets to create a custom gene setcollection; all sets were filtered to retain those with several genes between 5 and 1000. Touse the custom gene set collection, the gene2cat argument was set to point to the gene setcollection, and used together with the output of nullp in the goseq function to estimate theprobability of over and under-representation in each set, for either up- or down-regulatedlists of genes using Wallenius approximation to estimate the null distribution. Genes inthe differential analysis that could not be mapped to any gene set term were excludedfrom the background. The enrichment results for gene sets enriched in up-regulated anddown-regulated genes or both (up- and down-regulated) were generated using p < 0.005and padj < 0.1. Results were visualized in cytoscape using the enrichment map plugin [56].The cytoscape map was analyzed using the autoannotate plug in with default parameters.Cluster names were manually adjusted to better reflect the underlying gene sets. This dataset is available at the NCBI Gene Expression Omnibus (GEO) under accession GSE161954.
2.6.3. Validation of DEGs: cDNA Synthesis and qRT-PCR
Select genes in the ARC at parturition that were enriched in pathway gene sets relatedto energy metabolism were validated by qRT-PCR (n = 5/group) and also at post-weaning(n = 6–7/group). cDNA was synthesized using 1500 ng of total RNA using the HighCapacity cDNA Archive Kit (Applied Biosystems Inc; ABI, Foster City, CA, USA) on theTProfessional Standard Gradient 96 thermocycler (Biometra). qRT-PCR was performedon the ABI PRISM 7900 Sequence Detection System using SYBR Green (Thermo Fisher).mRNA levels were normalized to levels of beta-2-microglobulin used as a housekeepinggene selected based on lowest variance in Cq value. Primers were designed using Primer-

Nutrients 2021, 13, 48 6 of 21
BLAST software and are listed in Table S2. mRNA fold change were analyzed using the2−∆∆CT method [57].
2.7. Statistical Analyses
Data were analyzed using SAS Version 9.4 software (SAS Institute Inc., Carey, NC,USA). A two-way analysis of variance (ANOVA) was performed using PROC GLIMMIXprocedure with folate dose (1X vs. 5X) and form (FA vs. MTHF) as main factors and Dose× Form interaction term for measures of cumulative food intake, total body weight-gain,plasma hormones, insulin tolerance, folate, and 1-carbon metabolites. A covariate argumentfor “batch effect” was used for analyses of body weight and food intake to account forpotential differences in stress response in dams who were transferred between institutionsfor energy expenditure analysis. To identify the effect of treatment during pregnancy onweight-change over time, a Repeated Measures ANOVA was used with pregnancy diet andtime as the main factors and a Diet × Time interaction term. Comparisons made betweenbrain gene expression and folate concentrations of only 5X-FA vs. 5X-MTHF dams wereconducted using a Student’s t-test. All significant interactions were examined by Tukey’spost-hoc analysis. Statistical significance was declared at p < 0.05 and all data is expressedas least square (LS) Mean ± S.E.M.
3. Results3.1. Effects of Folate Diets on Maternal Plasma and Liver 5-MTHF and 1-Carbon Metabolites atParturition and 19-Weeks
Upon parturition, plasma FA was only detectable in dams fed 5X-FA diet (9.72 ± 1.21);all other dams (1X-FA, 1X-MTHF or 5X-MTHF) had FA concentrations below the lowerdetection limit of quantification. Plasma (Table 1) and liver (Table 2) 5-MTHF and methio-nine were higher in dams on 5X vs. 1X diets of either form (Dose p < 0.01). At 19-weekspost-weaning, plasma FA was below the detection limit in all groups, and plasma and liver5-MTHF did not differ among the groups.
Table 1. Plasma 5-MTHF and 1-carbon metabolites upon parturition and at 19-weeks post-weaning (PW) of dams fed FA orMTHF pregnancy diets.
FA MTHF Two-Way ANOVAp-Value
1X-FA 5X-FA 1X-MTHF 5X-MTHF Dose FormDose×
Form
Parturition5-MTHF (nmol/L) 103.83 ± 18.89 188 ± 20.69 117.2 ± 18.89 152.6 ± 20.69 0.007 0.58 0.24
Methionine (µmol/L) 65 ± 4.43 79.2 ± 4.85 60.4 ± 4.85 76.6 ± 4.85 0.005 0.46 0.84SAM (nmol/L) 297.2 ± 19.94 294.3 ± 25.74 285.8 ± 18.2 281 ± 19.94 0.86 0.57 0.96SAH (nmol/L) 73.2 ± 15.09 79.5 ± 16.87 123.8 ± 15.09 88 ± 15.09 0.35 0.07 0.2Hcy (µmol/L) 14.55 ± 3.02 11.9 ± 3.31 29.12 ± 3.31 20.8 ± 3.31 0.11 0.002 0.39Cys (nmol/L) 1304 ± 156.2 1494 ± 156.18 1917 ± 142.6 1504 ± 156.2 0.48 0.06 0.07
Choline (µmol/L) 13.7 ± 1.32 12.28 ± 1.18 14.42 ± 1.08 10.72 ± 1.18 0.048 0.73 0.36Betaine (µmol/L) 34.72 ab ± 2.48 43.12 a ± 2.73 38.72 ab ± 2.49 30.7 b ± 3.04 0.943 0.14 0.007
19-weeks PW5-MTHF (nmol/L) 116.9 ± 10.29 122.1 ± 10.29 131.1 ± 11 132.15 ± 10.29 0.77 0.26 0.84
Methionine (µmol/L) 76.65 ± 4.19 66.9 ± 4.84 67.1 ± 4.84 74.7 ± 4.19 0.81 0.84 0.07SAM (nmol/L) 255.2 ± 22.77 254.6 ± 22.77 298.9 ± 22.77 279.4 ± 22.77 0.66 0.14 0.68SAH (nmol/L) 72.4 ± 8.6 79.77 ± 9.19 86.84 ± 8.6 75.73 ± 8.6 0.82 0.57 0.29Hcy (µmol/L) 3.69 ± 0.98 6.21 ± 0.92 4.93 ± 0.92 4.51 ± 0.92 0.27 0.81 0.13Cys (nmol/L) 765.47 ± 80.91 752.9 ± 86.5 733.3 ± 80.91 776.36 ± 80.91 0.85 0.96 0.74
Choline (µmol/L) 11.23 ± 0.97 10.31 ± 0.97 11.98 ± 0.97 10.44 ± 0.97 0.22 0.67 0.75Betaine (µmol/L) 84.61 ± 5.7 78.71 ± 5.7 64.44 ± 5.7 76.81 ± 6.1 0.58 0.07 0.13
Significant at p < 0.05 Dose, Form or interaction effect by Two-way repeated measures ANOVA. ab Significantly different by Tukey Post-hocAnalysis. Values are Least Square Mean ± S.E.M. n = 5–6/group at parturition, n = 10–12 at 19-weeks post-weaning (PW). Abbreviations:AIN-93G rodent diet with 1X (recommended, 2 mg/kg) or 5X folic acid (FA) or equimolar [6S]-5-methyltetrahydrofolic acid calcium salt(MTHF) at 1X (2.1 mg/kg) or 5X (10.4 mg/kg) levels. 5-methyltetrahydrofolate (5-MTHF), Methionine (Met), S-adenosylmethionine (SAM),S-adenosylhomocysteine (SAH), Cysteine (Cys).
Nutrients 2021, 13, 48 7 of 21
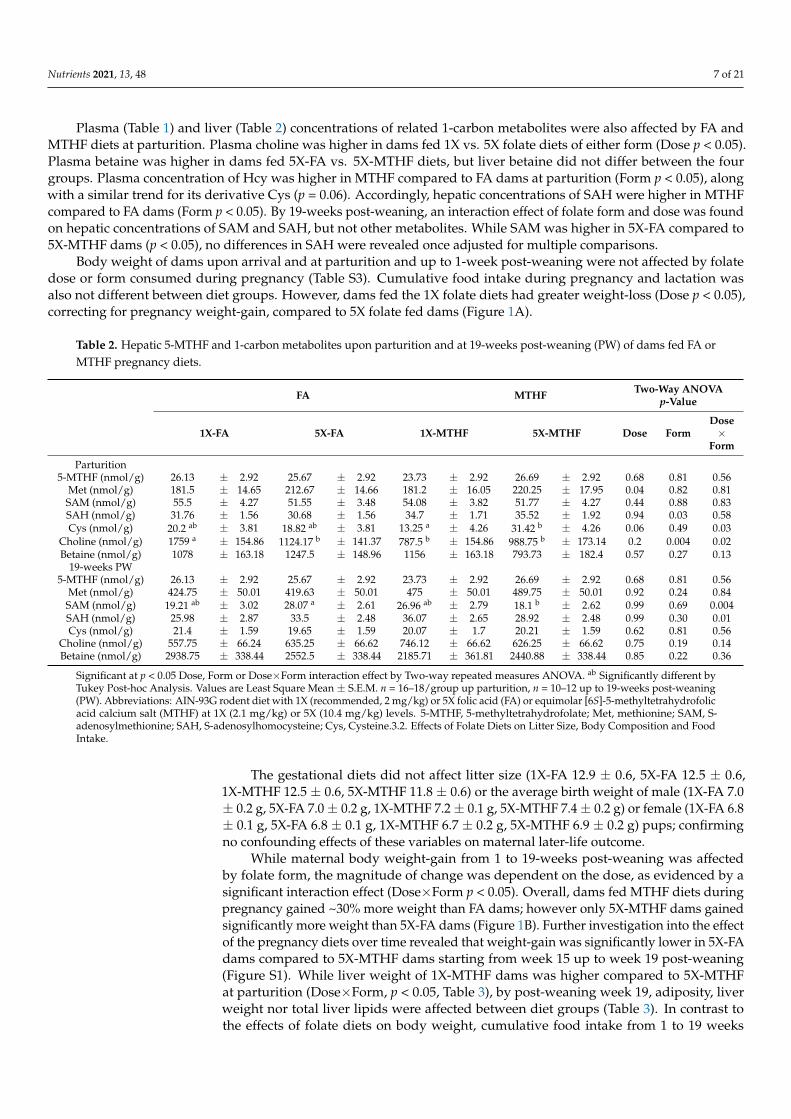
Plasma (Table 1) and liver (Table 2) concentrations of related 1-carbon metabolites were also affected by FA andMTHF diets at parturition. Plasma choline was higher in dams fed 1X vs. 5X folate diets of either form (Dose p < 0.05).Plasma betaine was higher in dams fed 5X-FA vs. 5X-MTHF diets, but liver betaine did not differ between the fourgroups. Plasma concentration of Hcy was higher in MTHF compared to FA dams at parturition (Form p < 0.05), alongwith a similar trend for its derivative Cys (p = 0.06). Accordingly, hepatic concentrations of SAH were higher in MTHFcompared to FA dams (Form p < 0.05). By 19-weeks post-weaning, an interaction effect of folate form and dose was foundon hepatic concentrations of SAM and SAH, but not other metabolites. While SAM was higher in 5X-FA compared to5X-MTHF dams (p < 0.05), no differences in SAH were revealed once adjusted for multiple comparisons.
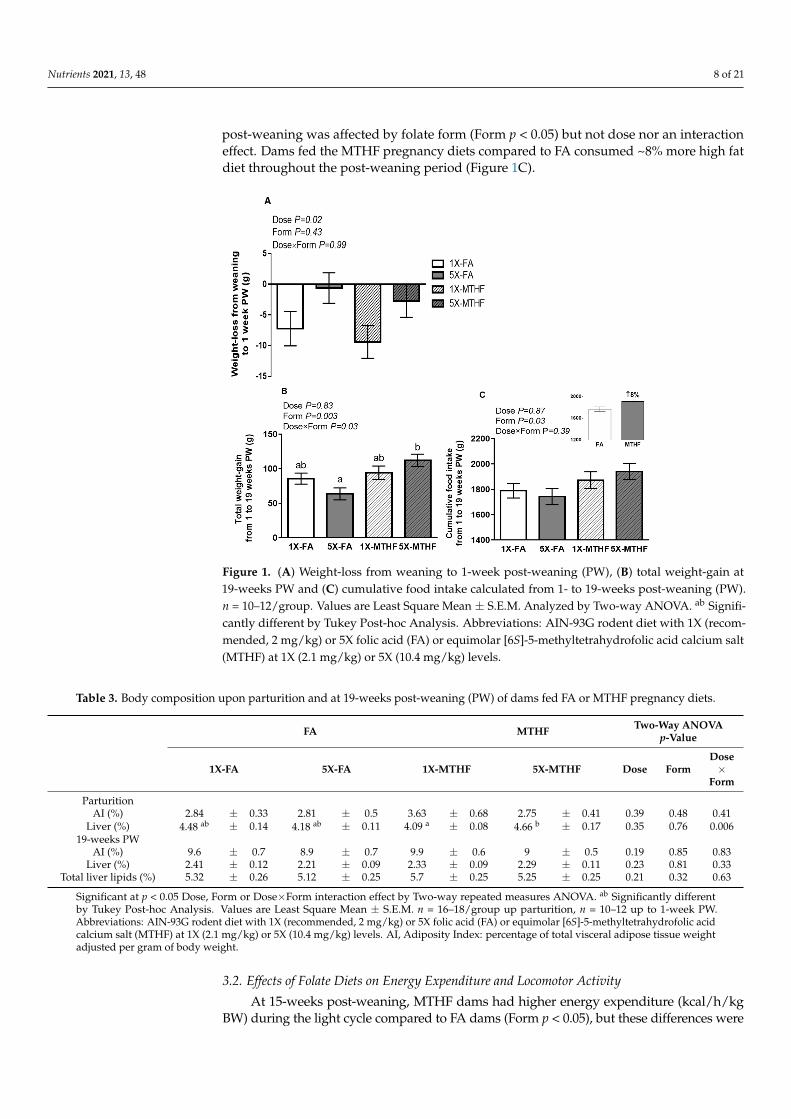
Body weight of dams upon arrival and at parturition and up to 1-week post-weaning were not affected by folatedose or form consumed during pregnancy (Table S3). Cumulative food intake during pregnancy and lactation wasalso not different between diet groups. However, dams fed the 1X folate diets had greater weight-loss (Dose p < 0.05),correcting for pregnancy weight-gain, compared to 5X folate fed dams (Figure 1A).
Table 2. Hepatic 5-MTHF and 1-carbon metabolites upon parturition and at 19-weeks post-weaning (PW) of dams fed FA orMTHF pregnancy diets.
FA MTHF Two-Way ANOVAp-Value
1X-FA 5X-FA 1X-MTHF 5X-MTHF Dose FormDose×
Form
Parturition5-MTHF (nmol/g) 26.13 ± 2.92 25.67 ± 2.92 23.73 ± 2.92 26.69 ± 2.92 0.68 0.81 0.56
Met (nmol/g) 181.5 ± 14.65 212.67 ± 14.66 181.2 ± 16.05 220.25 ± 17.95 0.04 0.82 0.81SAM (nmol/g) 55.5 ± 4.27 51.55 ± 3.48 54.08 ± 3.82 51.77 ± 4.27 0.44 0.88 0.83SAH (nmol/g) 31.76 ± 1.56 30.68 ± 1.56 34.7 ± 1.71 35.52 ± 1.92 0.94 0.03 0.58Cys (nmol/g) 20.2 ab ± 3.81 18.82 ab ± 3.81 13.25 a ± 4.26 31.42 b ± 4.26 0.06 0.49 0.03
Choline (nmol/g) 1759 a ± 154.86 1124.17 b ± 141.37 787.5 b ± 154.86 988.75 b ± 173.14 0.2 0.004 0.02Betaine (nmol/g) 1078 ± 163.18 1247.5 ± 148.96 1156 ± 163.18 793.73 ± 182.4 0.57 0.27 0.13
19-weeks PW5-MTHF (nmol/g) 26.13 ± 2.92 25.67 ± 2.92 23.73 ± 2.92 26.69 ± 2.92 0.68 0.81 0.56
Met (nmol/g) 424.75 ± 50.01 419.63 ± 50.01 475 ± 50.01 489.75 ± 50.01 0.92 0.24 0.84SAM (nmol/g) 19.21 ab ± 3.02 28.07 a ± 2.61 26.96 ab ± 2.79 18.1 b ± 2.62 0.99 0.69 0.004SAH (nmol/g) 25.98 ± 2.87 33.5 ± 2.48 36.07 ± 2.65 28.92 ± 2.48 0.99 0.30 0.01Cys (nmol/g) 21.4 ± 1.59 19.65 ± 1.59 20.07 ± 1.7 20.21 ± 1.59 0.62 0.81 0.56
Choline (nmol/g) 557.75 ± 66.24 635.25 ± 66.62 746.12 ± 66.62 626.25 ± 66.62 0.75 0.19 0.14Betaine (nmol/g) 2938.75 ± 338.44 2552.5 ± 338.44 2185.71 ± 361.81 2440.88 ± 338.44 0.85 0.22 0.36
Significant at p < 0.05 Dose, Form or Dose×Form interaction effect by Two-way repeated measures ANOVA. ab Significantly different byTukey Post-hoc Analysis. Values are Least Square Mean ± S.E.M. n = 16–18/group up parturition, n = 10–12 up to 19-weeks post-weaning(PW). Abbreviations: AIN-93G rodent diet with 1X (recommended, 2 mg/kg) or 5X folic acid (FA) or equimolar [6S]-5-methyltetrahydrofolicacid calcium salt (MTHF) at 1X (2.1 mg/kg) or 5X (10.4 mg/kg) levels. 5-MTHF, 5-methyltetrahydrofolate; Met, methionine; SAM, S-adenosylmethionine; SAH, S-adenosylhomocysteine; Cys, Cysteine.3.2. Effects of Folate Diets on Litter Size, Body Composition and FoodIntake.
The gestational diets did not affect litter size (1X-FA 12.9 ± 0.6, 5X-FA 12.5 ± 0.6,1X-MTHF 12.5 ± 0.6, 5X-MTHF 11.8 ± 0.6) or the average birth weight of male (1X-FA 7.0± 0.2 g, 5X-FA 7.0 ± 0.2 g, 1X-MTHF 7.2 ± 0.1 g, 5X-MTHF 7.4 ± 0.2 g) or female (1X-FA 6.8± 0.1 g, 5X-FA 6.8 ± 0.1 g, 1X-MTHF 6.7 ± 0.2 g, 5X-MTHF 6.9 ± 0.2 g) pups; confirmingno confounding effects of these variables on maternal later-life outcome.
While maternal body weight-gain from 1 to 19-weeks post-weaning was affectedby folate form, the magnitude of change was dependent on the dose, as evidenced by asignificant interaction effect (Dose×Form p < 0.05). Overall, dams fed MTHF diets duringpregnancy gained ~30% more weight than FA dams; however only 5X-MTHF dams gainedsignificantly more weight than 5X-FA dams (Figure 1B). Further investigation into the effectof the pregnancy diets over time revealed that weight-gain was significantly lower in 5X-FAdams compared to 5X-MTHF dams starting from week 15 up to week 19 post-weaning(Figure S1). While liver weight of 1X-MTHF dams was higher compared to 5X-MTHFat parturition (Dose×Form, p < 0.05, Table 3), by post-weaning week 19, adiposity, liverweight nor total liver lipids were affected between diet groups (Table 3). In contrast tothe effects of folate diets on body weight, cumulative food intake from 1 to 19 weeks
Nutrients 2021, 13, 48 8 of 21
post-weaning was affected by folate form (Form p < 0.05) but not dose nor an interactioneffect. Dams fed the MTHF pregnancy diets compared to FA consumed ~8% more high fatdiet throughout the post-weaning period (Figure 1C).
Nutrients 2021, 13, x FOR PEER REVIEW 8 of 21
(FA) or equimolar [6S]-5-methyltetrahydrofolic acid calcium salt (MTHF) at 1X (2.1 mg/kg) or 5X (10.4 mg/kg) levels. 5-
MTHF, 5-methyltetrahydrofolate; Met, methionine; SAM, S-adenosylmethionine; SAH, S-adenosylhomocysteine; Cys,
Cysteine.3.2. Effects of Folate Diets on Litter Size, Body Composition and Food Intake.
Body weight of dams upon arrival and at parturition and up to 1-week post-weaning
were not affected by folate dose or form consumed during pregnancy (Table S3). Cumu-
lative food intake during pregnancy and lactation was also not different between diet
groups. However, dams fed the 1X folate diets had greater weight-loss (Dose p < 0.05),
correcting for pregnancy weight-gain, compared to 5X folate fed dams (Figure 1A).
Figure 1. (A) Weight-loss from weaning to 1-week post-weaning (PW), (B) total weight-gain at 19-
weeks PW and (C) cumulative food intake calculated from 1- to 19-weeks post-weaning (PW). n =
10–12/group. Values are Least Square Mean ± S.E.M. Analyzed by Two-way ANOVA. ab Signifi-
cantly different by Tukey Post-hoc Analysis. Abbreviations: AIN-93G rodent diet with 1X (recom-
mended, 2 mg/kg) or 5X folic acid (FA) or equimolar [6S]-5-methyltetrahydrofolic acid calcium salt
(MTHF) at 1X (2.1 mg/kg) or 5X (10.4 mg/kg) levels.
The gestational diets did not affect litter size (1X-FA 12.9 ± 0.6, 5X-FA 12.5 ± 0.6, 1X-
MTHF 12.5 ± 0.6, 5X-MTHF 11.8 ± 0.6) or the average birth weight of male (1X-FA 7.0 ± 0.2
g, 5X-FA 7.0 ± 0.2 g, 1X-MTHF 7.2 ± 0.1 g, 5X-MTHF 7.4 ± 0.2 g) or female (1X-FA 6.8 ± 0.1
g, 5X-FA 6.8 ± 0.1 g, 1X-MTHF 6.7 ± 0.2 g, 5X-MTHF 6.9 ± 0.2 g) pups; confirming no con-
founding effects of these variables on maternal later-life outcome.
While maternal body weight-gain from 1 to 19-weeks post-weaning was affected by
folate form, the magnitude of change was dependent on the dose, as evidenced by a sig-
nificant interaction effect (Dose×Form p < 0.05). Overall, dams fed MTHF diets during
pregnancy gained ~30% more weight than FA dams; however only 5X-MTHF dams
gained significantly more weight than 5X-FA dams (Figure 1B). Further investigation into
the effect of the pregnancy diets over time revealed that weight-gain was significantly
lower in 5X-FA dams compared to 5X-MTHF dams starting from week 15 up to week 19
post-weaning (Figure S1). While liver weight of 1X-MTHF dams was higher compared to
5X-MTHF at parturition (Dose×Form, p < 0.05, Table 3), by post-weaning week 19, adipos-
ity, liver weight nor total liver lipids were affected between diet groups (Table 3). In con-
trast to the effects of folate diets on body weight, cumulative food intake from 1 to 19
Figure 1. (A) Weight-loss from weaning to 1-week post-weaning (PW), (B) total weight-gain at19-weeks PW and (C) cumulative food intake calculated from 1- to 19-weeks post-weaning (PW).n = 10–12/group. Values are Least Square Mean ± S.E.M. Analyzed by Two-way ANOVA. ab Signifi-cantly different by Tukey Post-hoc Analysis. Abbreviations: AIN-93G rodent diet with 1X (recom-mended, 2 mg/kg) or 5X folic acid (FA) or equimolar [6S]-5-methyltetrahydrofolic acid calcium salt(MTHF) at 1X (2.1 mg/kg) or 5X (10.4 mg/kg) levels.
Table 3. Body composition upon parturition and at 19-weeks post-weaning (PW) of dams fed FA or MTHF pregnancy diets.
FA MTHF Two-Way ANOVAp-Value
1X-FA 5X-FA 1X-MTHF 5X-MTHF Dose FormDose×
Form
ParturitionAI (%) 2.84 ± 0.33 2.81 ± 0.5 3.63 ± 0.68 2.75 ± 0.41 0.39 0.48 0.41
Liver (%) 4.48 ab ± 0.14 4.18 ab ± 0.11 4.09 a ± 0.08 4.66 b ± 0.17 0.35 0.76 0.00619-weeks PW
AI (%) 9.6 ± 0.7 8.9 ± 0.7 9.9 ± 0.6 9 ± 0.5 0.19 0.85 0.83Liver (%) 2.41 ± 0.12 2.21 ± 0.09 2.33 ± 0.09 2.29 ± 0.11 0.23 0.81 0.33
Total liver lipids (%) 5.32 ± 0.26 5.12 ± 0.25 5.7 ± 0.25 5.25 ± 0.25 0.21 0.32 0.63
Significant at p < 0.05 Dose, Form or Dose×Form interaction effect by Two-way repeated measures ANOVA. ab Significantly differentby Tukey Post-hoc Analysis. Values are Least Square Mean ± S.E.M. n = 16–18/group up parturition, n = 10–12 up to 1-week PW.Abbreviations: AIN-93G rodent diet with 1X (recommended, 2 mg/kg) or 5X folic acid (FA) or equimolar [6S]-5-methyltetrahydrofolic acidcalcium salt (MTHF) at 1X (2.1 mg/kg) or 5X (10.4 mg/kg) levels. AI, Adiposity Index: percentage of total visceral adipose tissue weightadjusted per gram of body weight.
3.2. Effects of Folate Diets on Energy Expenditure and Locomotor Activity
At 15-weeks post-weaning, MTHF dams had higher energy expenditure (kcal/h/kgBW) during the light cycle compared to FA dams (Form p < 0.05), but these differences were

Nutrients 2021, 13, 48 9 of 21
not maintained throughout the dark-cycle (Figure 2). Spontaneous activity (Figure S2) wasnot affected during the light cycle but there was an effect of activity during the dark-cycleattributable to folate dose that was dependent on the form, as evidenced by a significantDose×Form interaction (p < 0.05). However, the magnitude of these changes was notsufficient to induce overall significant differences in energy expenditure during this time.While, 1X folate dams had lower stereotypy activity than 5X folate dams during the dark-cycle (Figure S2A), only 1X-MTHF dams had lower total activity (Figure S2B) attributableto a lower ambulation activity (Figure S2C) than 5X-MTHF dams. Respiratory exchangeratio, which reflects substrate oxidation, was not different between the groups (data notshown).
Nutrients 2021, 13, x FOR PEER REVIEW 9 of 21
weeks post-weaning was affected by folate form (Form p < 0.05) but not dose nor an inter-
action effect. Dams fed the MTHF pregnancy diets compared to FA consumed ~8% more
high fat diet throughout the post-weaning period (Figure 1C).
Table 3. Body composition upon parturition and at 19-weeks post-weaning (PW) of dams fed FA or MTHF pregnancy diets.
FA MTHF Two-Way ANOVA p-Value
1X-FA 5X-FA 1X-MTHF 5X-MTHF Dose Form Dose × Form
Parturition
AI (%) 2.84 ± 0.33 2.81 ± 0.5 3.63 ± 0.68 2.75 ± 0.41 0.39 0.48 0.41
Liver (%) 4.48 ab ± 0.14 4.18 ab ± 0.11 4.09 a ± 0.08 4.66 b ± 0.17 0.35 0.76 0.006
19-weeks PW
AI (%) 9.6 ± 0.7 8.9 ± 0.7 9.9 ± 0.6 9 ± 0.5 0.19 0.85 0.83
Liver (%) 2.41 ± 0.12 2.21 ± 0.09 2.33 ± 0.09 2.29 ± 0.11 0.23 0.81 0.33
Total liver lipids (%) 5.32 ± 0.26 5.12 ± 0.25 5.7 ± 0.25 5.25 ± 0.25 0.21 0.32 0.63
Significant at p < 0.05 Dose, Form or Dose×Form interaction effect by Two-way repeated measures ANOVA. ab Significantly
different by Tukey Post-hoc Analysis. Values are Least Square Mean ± S.E.M. n = 16–18/group up parturition, n = 10–12
up to 1-week PW. Abbreviations: AIN-93G rodent diet with 1X (recommended, 2 mg/kg) or 5X folic acid (FA) or equimolar
[6S]-5-methyltetrahydrofolic acid calcium salt (MTHF) at 1X (2.1 mg/kg) or 5X (10.4 mg/kg) levels. AI, Adiposity Index:
percentage of total visceral adipose tissue weight adjusted per gram of body weight.
3.2. Effects of Folate Diets on Energy Expenditure and Locomotor Activity
At 15-weeks post-weaning, MTHF dams had higher energy expenditure (kcal/h/kg
BW) during the light cycle compared to FA dams (Form p < 0.05), but these differences
were not maintained throughout the dark-cycle (Figure 2). Spontaneous activity (Figure
S2) was not affected during the light cycle but there was an effect of activity during the
dark-cycle attributable to folate dose that was dependent on the form, as evidenced by a
significant Dose×Form interaction (p < 0.05). However, the magnitude of these changes
was not sufficient to induce overall significant differences in energy expenditure during
this time. While, 1X folate dams had lower stereotypy activity than 5X folate dams during
the dark-cycle (Figure S2A), only 1X-MTHF dams had lower total activity (Figure S2B)
attributable to a lower ambulation activity (Figure S2C) than 5X-MTHF dams. Respiratory
exchange ratio, which reflects substrate oxidation, was not different between the groups
(data not shown).
Figure 2. Average energy expenditure (kcal/kg/h) during 24 h in dams at 15-weeks post-
weaning (PW). Embedded graph represents the effect of Form alone (FA vs. MTHF). n =
10–12/group. Values are Least Square Mean ± S.E.M. Analyzed by Two-way ANOVA,
significance at p < 0.05. Abbreviations: AIN-93G rodent diet with 1X (recommended, 2
mg/kg) or 5X folic acid (FA) or equimolar [6S]-5-methyltetrahydrofolic acid calcium salt
(MTHF) at 1X (2.1 mg/kg) or 5X (10.4 mg/kg) levels.
1 .5
2 .0
2 .5
3 .0
3 .5
5 X -M T H F
1 X -M T H F
5 X -F A
1 X -F A
L ig h t-C y c le D a rk -C y c le
D o s e P = 0 .2 0
F o rm P = 0 .0 2
D o s e ×F o rm P = 0 .7 0
N S
En
erg
y e
xp
en
dit
ure
(kc
al/
hr/k
g B
W)
Figure 2. Average energy expenditure (kcal/kg/h) during 24 h in dams at 15-weeks post-weaning(PW). Embedded graph represents the effect of Form alone (FA vs. MTHF). n = 10–12/group. Valuesare Least Square Mean ± S.E.M. Analyzed by Two-way ANOVA, significance at p < 0.05. Abbrevi-ations: AIN-93G rodent diet with 1X (recommended, 2 mg/kg) or 5X folic acid (FA) or equimolar[6S]-5-methyltetrahydrofolic acid calcium salt (MTHF) at 1X (2.1 mg/kg) or 5X (10.4 mg/kg) levels.
3.3. Effects of Folate Diets on Plasma Hormones and IR
Upon parturition, MTHF dams had lower plasma leptin compared to FA dams (Dosep < 0.001, Table 4). Plasma glucose and insulin concentrations and IR, as assessed byHOMA-IR, were not different between dams at parturition. At 1-week post-weaning, IRassessed by the rate of glucose disappearance (kITT), was lower in MTHF dams comparedto FA dams (1X-FA 1.07 ± 0.13, 5X-FA 0.97 ± 0.12, 1X-MTHF 0.66 ± 0.12, 5X-MTHF0.83 ± 0.12, (Form p < 0.05, Figure S3A,B); however no differences were observed at 12-weeks post-weaning (1X-FA 0.9 ± 0.09, 5X-FA 0.8 ± 0.09, 1X-MTHF 0.8 ± 0.9, 5X-MTHF0.7 ± 0.1). At 19-weeks post-weaning, plasma leptin was higher and active ghrelin waslower in MTHF compared to FA dams (Form p < 0.05, Table 4), but plasma insulin, glucoseand HOMA-IR were not different.

Nutrients 2021, 13, 48 10 of 21
Table 4. Plasma glucose and hormones upon parturition and at 19-weeks post-weaning (PW) of dams fed FA or MTHFpregnancy diets.
FA MTHF Two-Way ANOVAp-Value
1X-FA 5X-FA 1X-MTHF 5X-MTHF Dose FormDose×
Form
ParturitionLeptin ng/mL 5.68 ± 0.74 6.13 ± 0.74 4.39 ± 0.81 3.88 ± 0.81 0.97 0.03 0.55Leptin/VAT 0.63 ± 0.12 0.88 ± 0.12 0.43 ± 0.13 0.5 ± 0.13 0.23 0.03 0.46
Insulin ng/mL 1.36 ± 0.34 1.88 ± 0.31 1.14 ± 0.31 1.46 ± 0.31 0.20 0.33 0.77Glucose mg/dL 116.8 ± 6.54 122.4 ± 5.85 101 ± 5.85 115.1 ± 5.85 0.12 0.08 0.50
HOMA-IR 1.67 ± 0.37 2.31 ± 0.33 1.19 ± 0.33 1.71 ± 0.33 0.11 0.13 0.8619-weeks PWLeptin ng/mL 9.9 ± 2.06 9.66 ± 1.71 15.02 ± 1.71 14.96 ± 1.86 0.94 0.008 0.96Leptin/VAT 0.23 ± 0.06 0.26 ± 0.05 0.39 ± 0.06 0.44 ± 0.06 0.53 0.007 0.88
Ghrelin ng/mL 146.6 ± 16 120.1 ± 14.3 78.73 ± 16 96.96 ± 15.1 0.79 0.006 0.16Insulin ng/mL 1.75 ± 0.22 1.62 ± 0.23 1.98 ± 0.23 1.71 ± 0.26 0.40 0.52 0.77Glucose mg/dL 129.9 ± 2.39 128.5 ± 2.53 128.2 ± 2.71 123.9 ± 2.71 0.27 0.21 0.57
HOMA-IR 2.56 ± 0.3 2.35 ± 0.32 2.64 ± 0.3 2.2 ± 0.35 0.30 0.89 0.76
Significant at p < 0.05 Dose, Form or Dose×Form interaction effect by Two-way repeated measures ANOVA. Values are Least Square Mean± S.E.M. n = 5–6/group at parturition, n = 10–12 at 19-weeks PW. Abbreviations: AIN-93G rodent diet with 1X (recommended, 2 mg/kg)or 5X folic acid (FA) or equimolar [6S]-5-methyltetrahydrofolic acid calcium salt (MTHF) at 1X (2.1 mg/kg) or 5X (10.4 mg/kg) levels. VAT,visceral adipose tissue; HOMA-IR, homeostatic model assessment insulin resistance calculated as follows: [fasting glucose (in mg/dL) ×fasting insulin (in µU/mL)]/2430].
3.4. Effect of 5X-FA vs. 5X-MTHF Diets on Whole-Transcriptome Gene Expression in the ARC atParturition
To investigate the effects of high FA vs. MTHF gestational diets on the maternal brain,gene expression in the hypothalamic ARC was compared between 5X-FA and 5X-MTHFdams at parturition. The 5X dose was preferentially chosen as this dose reflects current highintakes of FA in the North American population [20,21]. Like FA, MTHF supplementationis becoming widespread, thus it is possible that intakes may also increase over time.
Upon parturition, a total of 279 differentially expressed genes were identified in theARC of dams fed 5X-MTHF diets vs. 5X-FA diets during pregnancy. These genes included170 up-regulated and 109 down-regulated genes (Table S4). The up-regulated and/ordown-regulated genes were then classified for enrichment by GO, KEGG and Reactomepathway analyses. Gene sets in GO analyses identified 116 in Biological Processes, 24 inMolecular Function and 27 in Cellular Component (Tables S5 and S6). In BiologicalProcesses (Figure 3B), up-regulated gene sets were mainly those related to ‘regulationof behaviour’, ‘circadian behaviour’ and ‘nucleotide metabolic processes’, while down-regulated gene sets were enriched only in ‘regulation of glucose transport’. Analysisof gene sets enriched in both up- and down-regulated genes included those related to‘response to food’, ‘synaptic plasticity’ and ‘regulation of transmembrane transport’. Inthe Cellular Component, the enriched terms were also related to neurons and synapsesand included ‘postsynapse’, ‘neuronal cell body’, ‘dendrite’ and ‘synaptic membrane’ thatwere enriched primarily due to up-regulated gene sets. Up- and down-regulated gene setsclustered around ‘GABAergic synapse’. In the Molecular Function cluster, up-regulatedgene sets were enriched in several terms related to transporter activity and down-regulatedgene sets were enriched in pathways related to hormone binding. Up- and down-regulatedgene sets in Molecular Function were significantly enriched in ‘receptor ligand activity’.
A total of 30 gene sets were further enriched in KEGG and Reactomepathways (Figure 3C, Table S7) with 16 gene sets enriched in up-regulated genes re-lated to neurological disorders and endocrine control and included ‘Parkinson’s disease’,‘Alzheimer’s disease’, ‘opioid signaling pathway’, ‘calcium signaling pathway’, ‘thermo-genesis’, ‘melanogenesis’, ‘insulin secretion’, ‘retrograde endocannabinoid signaling’ and‘neuronal systems’. Gene sets enriched in both up- and down-regulated genes included

Nutrients 2021, 13, 48 11 of 21
gene sets related to neurotransmission, including ‘neuroactive ligand-receptor interaction’pathway.
Nutrients 2021, 13, x FOR PEER REVIEW 11 of 21
Component, the enriched terms were also related to neurons and synapses and included
‘postsynapse’, ‘neuronal cell body’, ‘dendrite’ and ‘synaptic membrane’ that were enriched
primarily due to up-regulated gene sets. Up- and down-regulated gene sets clustered
around ‘GABAergic synapse’. In the Molecular Function cluster, up-regulated gene sets
were enriched in several terms related to transporter activity and down-regulated gene sets
were enriched in pathways related to hormone binding. Up- and down-regulated gene sets
in Molecular Function were significantly enriched in ‘receptor ligand activity’.
A total of 30 gene sets were further enriched in KEGG and Reactome pathways (Fig-
ure 3C, Table S7) with 16 gene sets enriched in up-regulated genes related to neurological
disorders and endocrine control and included ‘Parkinson’s disease’, ‘Alzheimer’s disease’,
‘opioid signaling pathway’, ‘calcium signaling pathway’, ‘thermogenesis’, ‘melanogene-
sis’, ‘insulin secretion’, ‘retrograde endocannabinoid signaling’ and ‘neuronal systems’.
Gene sets enriched in both up- and down-regulated genes included gene sets related to
neurotransmission, including ‘neuroactive ligand-receptor interaction’ pathway.
Figure 3. Cont.

Nutrients 2021, 13, 48 12 of 21Nutrients 2021, 13, x FOR PEER REVIEW 12 of 21
Figure 3. (A) Gene set enrichment legend, (B) Gene ontology (GO) and (C) Kyoto Encyclopedia of
Genes and Genomes (KEGG) and Reactome pathways from custom gene set collections. Legend
shows enrichment tests were run for gene sets enriched in “up-regulated”, “down-regulated” or
“up- and down-regulated (i.e., differentially expressed)” genes in 5X-MTHF compared to 5X-FA
dams using Goseq. Node size is proportional to the number of genes in the pathway set, and the
connecting line thickness is proportional to the number of identical genes in connected sets. Outer
node colors represent the FDR with multiple test correction (BH, Benjamini-Hochberg’s proce-
dure). An FDR ≤ 0.1 and p ≤ 0.005 was used for enrichment analyses. Genes of interests (*) were
validated by qRT-PCR at birth and post-weaning. Red font indicates if the gene was up-regulated
and blue font indicates down-regulated genes. The center node color represents the number of
identical genes that were from this validated gene list by qRT-PCR that are enriched in other path-
ways, with 10 being the maximum number of validated genes in a single pathway. Gene set clus-
ters from GO are shown with representative cluster terms. Validated Gene Abbreviations: Cck,
cholecystokinin; Crh2, corticotropin-releasing hormone receptor 2; Esr1, estrogen receptor 1;
Gaba4a, gamma-aminobutyric acid type A (Gaba) receptor alpha; Gabrd, gaba receptor delta; Gabre,
gaba receptor epsilon; Grm2, glutamate receptor 2; Kiss1, kisspeptin; Prhr, prolactin hormone re-
ceptor; Prlhr, prolactin-releasing peptide.
3.5. Validation of RNAseq Data Using qRT-PCR
A total of 11 selected differentially expressed genes were validated with qRT-PCR.
These genes were selected as they were found to be enriched in several key pathways
regulating physiological changes during pregnancy and/or food intake regulation (Table
S6 and S7). These genes include corticotropin-releasing hormone 2 (Crh2), prolactin-releasing
peptide receptor (Prlhr), prolactin hormone receptor (Prlr), Kisspeptin (Kiss1), Estrogen receptor
1 (Esr1), Cholecystokinin (Cck), Gamma-Aminobutyric Acid Type A Receptor Subunit- alpha4
(Gabra4), -delta (Gabrd) and -epsilon (Gabre), Dopamine receptor 2 (Drd2), and Glutamate
metabotropic receptor 2 (Grm2). RNAseq results showed a strong and positive correlation
with genes validated by qRT-PCR (Figure S4A,B) confirming high reliability of the RNA-
seq data set. While mRNA levels of Crh2, Prlhr, Prhr, Kiss1, Esr1, and Gabre were signifi-
cantly down-regulated in ARC of MTHF dams compared to FA dams at parturition,
mRNA levels of Gabra4, Gabrd, Drd2, Grm2 and Cck were significantly up-regulated in
MTHF dams (Figure 4A, p < 0.05) corroborating RNAseq results. By 19-weeks post-wean-
ing however, gene expression of the selected target genes in the ARC of dams were not
affected (Figure 4B).
Figure 3. (A) Gene set enrichment legend, (B) Gene ontology (GO) and (C) Kyoto Encyclopedia of Genes and Genomes(KEGG) and Reactome pathways from custom gene set collections. Legend shows enrichment tests were run for genesets enriched in “up-regulated”, “down-regulated” or “up- and down-regulated (i.e., differentially expressed)” genes in5X-MTHF compared to 5X-FA dams using Goseq. Node size is proportional to the number of genes in the pathway set, andthe connecting line thickness is proportional to the number of identical genes in connected sets. Outer node colors representthe FDR with multiple test correction (BH, Benjamini-Hochberg’s procedure). An FDR ≤ 0.1 and p ≤ 0.005 was used forenrichment analyses. Genes of interests (*) were validated by qRT-PCR at birth and post-weaning. Red font indicates ifthe gene was up-regulated and blue font indicates down-regulated genes. The center node color represents the number ofidentical genes that were from this validated gene list by qRT-PCR that are enriched in other pathways, with 10 being themaximum number of validated genes in a single pathway. Gene set clusters from GO are shown with representative clusterterms. Validated Gene Abbreviations: Cck, cholecystokinin; Crh2, corticotropin-releasing hormone receptor 2; Esr1, estrogenreceptor 1; Gaba4a, gamma-aminobutyric acid type A (Gaba) receptor alpha; Gabrd, gaba receptor delta; Gabre, gaba receptorepsilon; Grm2, glutamate receptor 2; Kiss1, kisspeptin; Prhr, prolactin hormone receptor; Prlhr, prolactin-releasing peptide.
3.5. Validation of RNAseq Data Using qRT-PCR
A total of 11 selected differentially expressed genes were validated with qRT-PCR.These genes were selected as they were found to be enriched in several key pathwaysregulating physiological changes during pregnancy and/or food intake regulation (TablesS6 and S7 ). These genes include corticotropin-releasing hormone 2 (Crh2), prolactin-releasingpeptide receptor (Prlhr), prolactin hormone receptor (Prlr), Kisspeptin (Kiss1), Estrogen receptor1 (Esr1), Cholecystokinin (Cck), Gamma-Aminobutyric Acid Type A Receptor Subunit- alpha4(Gabra4), -delta (Gabrd) and -epsilon (Gabre), Dopamine receptor 2 (Drd2), and Glutamatemetabotropic receptor 2 (Grm2). RNAseq results showed a strong and positive correlationwith genes validated by qRT-PCR (Figure S4A,B) confirming high reliability of the RNA-seqdata set. While mRNA levels of Crh2, Prlhr, Prhr, Kiss1, Esr1, and Gabre were significantlydown-regulated in ARC of MTHF dams compared to FA dams at parturition, mRNAlevels of Gabra4, Gabrd, Drd2, Grm2 and Cck were significantly up-regulated in MTHFdams (Figure 4A, p < 0.05) corroborating RNAseq results. By 19-weeks post-weaninghowever, gene expression of the selected target genes in the ARC of dams were notaffected (Figure 4B).

Nutrients 2021, 13, 48 13 of 21Nutrients 2021, 13, x FOR PEER REVIEW 13 of 21
Figure 4. (A) Relative mRNA expression of differentially expressed genes identified by RNAseq validated by qRT-PCR in
the ARC of 5X-MTHF compared to 5X-FA dams at parturition and (B) at 19-weeks post-weaning (PW). n = 5/group at
parturition and n = 7/group post-weaning. Values are Means ± S.E.M. Comparisons between 5X-MTHF and 5X-FA groups
were analyzed by Student T-test, significance at * p < 0.05. Abbreviations: AIN-93G rodent diet with 5X folic acid (FA) or
equimolar [6S]-5-methyltetrahydrofolic acid calcium salt (MTHF) at 5X (10.4 mg/kg) levels. Cck, cholecystokinin; Crh2, cor-
ticotropin-releasing hormone receptor 2; Esr1, estrogen receptor 1; Gaba4a, gamma-aminobutyric acid type A (Gaba) receptor alpha;
Gabrd, gaba receptor delta; Gabre, gaba receptor epsilon; Grm2, glutamate receptor 2; Kiss1, kisspeptin; Prhr, prolactin hormone
receptor; Prlhr, prolactin-releasing peptide.
3.6. Effect of 5X-FA vs. 5X-MTHF Diets on Brain 5-MTHF and 1-Carbon Metabolites in Dams
at Parturition and 19-Weeks Post-Weaning
Maternal brain concentrations of 5-MTHF (Table 5) were not different between diet
groups at parturition or at 19-weeks post-weaning. While brain betaine concentrations
were ~53% higher in 5X-FA compared to 5X-MTHF dams (p < 0.05), no other metabolites
were affected.
Table 5. Brain 5-MTHF and 1-carbon metabolites upon parturition and at 19-weeks post-weaning
(PW) of dams fed 5X-FA or 5X-MTHF pregnancy diets.
5X-FA 5X-MTHF p-Value
Parturition
5-MTHF (nmol/g) 0.24 ± 0.02 0.29 ± 0.05 0.43
Met (nmol/g) 48.9 ± 1.21 44.66 ± 2.07 0.14
SAM (nmol/g) 22.57 ± 0.5 21.86 ± 1.06 0.59
SAH (nmol/g) 3.4 ± 0.34 3 ± 0.19 0.34
Cys (nmol/g) 47.95 ± 4.87 46.12 ± 5.84 0.82
Choline (nmol/g) 811 ± 51.9 706 ± 38.02 0.14
Betaine (nmol/g) 13.65 ± 2.25 6.36 * ± 1.15 0.02
19-weeks PW
5-MTHF (nmol/g) 0.26 ± 0.03 0.23 ± 0.03 0.59
Met (nmol/g) 41.4 ± 3.66 36.5 ± 4.61 0.43
SAM (nmol/g) 21.07 ± 0.81 22.1 ± 1.63 0.86
SAH (nmol/g) 2.77 ± 0.18 2.58 ± 0.12 0.42
Cys (nmol/g) 42.2 ± 1.92 44.46 ± 2.82 0.53
Choline (nmol/g) 408.83 ± 40.72 375 ± 22.27 0.14
Betaine (nmol/g) 8.94 ± 1.08 7.16 ± 0.46 0.51
* Significant at p < 0.05 by t-test. Values are Mean ± S.E.M. n = 5–6/group at parturition, n = 6–7 at
19-weeks PW. Abbreviations: AIN-93G rodent diet with 5X folic acid (FA) or equimolar [6S]-5-
Figure 4. (A) Relative mRNA expression of differentially expressed genes identified by RNAseq validated by qRT-PCRin the ARC of 5X-MTHF compared to 5X-FA dams at parturition and (B) at 19-weeks post-weaning (PW). n = 5/groupat parturition and n = 7/group post-weaning. Values are Means ± S.E.M. Comparisons between 5X-MTHF and 5X-FAgroups were analyzed by Student T-test, significance at * p < 0.05. Abbreviations: AIN-93G rodent diet with 5X folic acid(FA) or equimolar [6S]-5-methyltetrahydrofolic acid calcium salt (MTHF) at 5X (10.4 mg/kg) levels. Cck, cholecystokinin;Crh2, corticotropin-releasing hormone receptor 2; Esr1, estrogen receptor 1; Gaba4a, gamma-aminobutyric acid type A (Gaba) receptoralpha; Gabrd, gaba receptor delta; Gabre, gaba receptor epsilon; Grm2, glutamate receptor 2; Kiss1, kisspeptin; Prhr, prolactin hormonereceptor; Prlhr, prolactin-releasing peptide.
3.6. Effect of 5X-FA vs. 5X-MTHF Diets on Brain 5-MTHF and 1-Carbon Metabolites in Dams atParturition and 19-Weeks Post-Weaning
Maternal brain concentrations of 5-MTHF (Table 5) were not different between dietgroups at parturition or at 19-weeks post-weaning. While brain betaine concentrationswere ~53% higher in 5X-FA compared to 5X-MTHF dams (p < 0.05), no other metaboliteswere affected.
Table 5. Brain 5-MTHF and 1-carbon metabolites upon parturition and at 19-weeks post-weaning (PW) of dams fed 5X-FAor 5X-MTHF pregnancy diets.
5X-FA 5X-MTHF p-Value
Parturition5-MTHF (nmol/g) 0.24 ± 0.02 0.29 ± 0.05 0.43
Met (nmol/g) 48.9 ± 1.21 44.66 ± 2.07 0.14SAM (nmol/g) 22.57 ± 0.5 21.86 ± 1.06 0.59SAH (nmol/g) 3.4 ± 0.34 3 ± 0.19 0.34Cys (nmol/g) 47.95 ± 4.87 46.12 ± 5.84 0.82
Choline (nmol/g) 811 ± 51.9 706 ± 38.02 0.14Betaine (nmol/g) 13.65 ± 2.25 6.36 * ± 1.15 0.02
19-weeks PW5-MTHF (nmol/g) 0.26 ± 0.03 0.23 ± 0.03 0.59
Met (nmol/g) 41.4 ± 3.66 36.5 ± 4.61 0.43SAM (nmol/g) 21.07 ± 0.81 22.1 ± 1.63 0.86SAH (nmol/g) 2.77 ± 0.18 2.58 ± 0.12 0.42Cys (nmol/g) 42.2 ± 1.92 44.46 ± 2.82 0.53
Choline (nmol/g) 408.83 ± 40.72 375 ± 22.27 0.14Betaine (nmol/g) 8.94 ± 1.08 7.16 ± 0.46 0.51
* Significant at p < 0.05 by t-test. Values are Mean ± S.E.M. n = 5–6/group at parturition, n = 6–7 at 19-weeks PW. Abbreviations: AIN-93Grodent diet with 5X folic acid (FA) or equimolar [6S]-5-methyltetrahydrofolic acid calcium salt (MTHF, 10.4 mg/kg) levels. 5-MTHF,5-methyltetrahydrofolate; Met, methionine; SAM, S-adenosylmethionine; SAH, S-adenosylhomocysteine; Cys, Cysteine.

Nutrients 2021, 13, 48 14 of 21
4. Discussion
These results are the first to show that FA and MTHF when fed during pregnancydiffer in their effects on programming of post-birth maternal metabolic phenotype andhypothalamic regulatory genes. Contrary to our hypothesis, the results provide evidenceof a potential adverse role of both forms when fed at the higher dose. Firstly, post-birthweight-loss from weaning to 1-week post-weaning in dams was delayed. Although long-term body weight-gain was higher in 5X-MTHF compared to 5X-FA dams fed the highfat diet for 19-weeks, the increased weight did not reflect in a negative body compositionphenotype. Second, MTHF diets led to higher PW food intake and associated with lowerplasma leptin at parturition and higher leptin at 19-weeks post-weaning as well as IR at1-week post-weaning. In addition, RNAseq analysis revealed 279 newly identified DEGsin the ARC of mothers at parturition in response to the high 5X-MTHF compared to 5X-FApregnancy diet that were associated with dysregulated 1-carbon metabolism at parturitionand later-life phenotypes.
The folate dose and form in the gestational diets resulted in different effects on bodyweight changes in the dams. Weight-loss from weaning to 1-week post-weaning wasless in dams fed either form of the 5X compared to 1X folate diets. These results areconsistent with our previous findings that a high FA dose during pregnancy may lengthenthe period of metabolic adjustment that follows immediately post-birth [18] and reporta novel observation that these effects are independent of folate form. However, after19-weeks of the high fat diet, those on the high (5X) FA diet gained ~75% less weightthan 5X-MTHF dams. Surprisingly, differences in body weight were not reflected in bodycomposition, as they were independent of changes in visceral adiposity, liver weight ortotal liver lipids at 19-weeks.
In addition to higher body weight-gain up to 19-weeks post-weaning, the MTHFfolate diets resulted in 8% higher food intake and associated with a metabolic profile earlypost-birth that favors increased food intake. Upon giving birth, MTHF mothers had lowerplasma leptin, which may act as a long-term afferent signal in the negative-feedback loopof the hypothalamus to stimulate feeding [58]. At 1-week post-weaning, MTHF damsalso had a lower constant for the disappearance of glucose (kITT), indicating transientlyhigher IR once exposed to the high fat diet. By 19-weeks post-weaning, plasma leptinnormalized for VAT was higher in MTHF dams suggesting possible development of leptinresistance [59]. Moreover, MTHF dams had lower plasma levels of the orexigenic hormoneghrelin, which may be compensatory to their increased food intake and body weight asobserved in overweight individuals [60] and high fat diet-induced obesity models [61].
As further evidence of effects of folate form on energy regulation, MTHF dams hadhigher energy expenditure during the light cycle, a period when rodents maintained ona high fat diet are known to have higher thermogenesis. This has been suggested to bemediated by an increase in leptin and its actions on the sympathetic nervous system todecrease feeding-bouts during this time [62,63]. These results point to a role of folate inaffecting non-exercise activity thermogenesis, as measures of spontaneous activity weresimilar between diet groups during the light cycle and plasma leptin was accordinglyhigher in MTHF dams post-weaning. Together, these findings suggest that higher energyexpenditure in MTHF dams may have been a homeostatic mechanism to counteract effectsof increased food intake on their weight-gain.
To begin to investigate the association between the phenotypic effects of excess intakesof folates with the maternal brain transcriptome, RNAseq was conducted in the ARCof high (5X) folate fed dams immediately after giving birth. Our results showed thatthe 5X-MTHF pregnancy diet resulted in differential expression of 279 genes in the ARCof dams at parturition and enrichment of 197 regulatory pathways. While functionalenrichment analysis revealed pathways that were diverse in function, many were relatedto regulation of behavior, food response, addiction, transmembrane signaling, synapticplasticity, thermogenesis, and neuronal function, of which are relevant to the later-lifeobserved postpartum phenotype of the dams in this study. Moreover, while the majority

Nutrients 2021, 13, 48 15 of 21
of the terms identified were enriched due to up-regulated gene sets, several regulatorypathways were also enriched due to both up- and down-regulated gene sets equallycontributing to their enrichment (Table S4). These findings suggest that while 5X-MTHFsupplementation during pregnancy may induce overall “activation” of hypothalamic geneexpression compared to 5X-FA mothers at parturition, there also exists “dysregulation” inseveral central regulatory pathways controlling energy homeostasis.
Several affected hypothalamic regulatory pathways in 5X-MTHF compared to 5X-FAdams have been previously shown to be associated with obesity, mood disorders andaddictive behavior, including food addiction [64,65]. These pathways include, but are notlimited to, the KEGG neuroactive ligand-receptor interaction, GABAergic synapse, andretrograde endocannabinoid synapse. The neuroactive ligand-receptor interaction pathwayis a group of receptors and ligands that regulate intracellular and extracellular signalingon the plasma membrane and is of particular interest as genes within this pathway arehighly enriched (both activated and repressed) throughout several brain regions duringpregnancy, parturition and the post-partum period in the rodent [66]. Many of the geneswithin this pathway also have a specific role in modulating effects of lactogenic hormonesin preparation for lactation [67–69]. We identified candidate genes within the neuroactiveligand receptor interaction pathway to be validated as possible novel targets of folate-induced effects in the maternal brain during pregnancy, including Crhr2, Prlhr, Kiss1, Gabra4,Gabre, Gabrd, Drd2 and Grm2. In addition, we also validated genes that were enriched inother related pathways that may play a role in mediating the observed maternal phenotypeincluding Esr1 and Cck. While the selected genes have a role beyond food intake regulation,it is noteworthy that 5X-MTHF dams had transiently lower expression of genes known tobe involved in the ARC to reduce food intake including Crhr2 [70], Prlhr [71], Kiss1 [72],and Esr1 [73] and higher expression of genes encoding the GABAA receptor involved infood stimulation [74] at parturition; possibly contributing to higher food intake over timein 5X-MTHF dams, especially once exposed to a highly palatable high fat diet duringthe post-weaning period. Moreover, our findings also highlight the interplay betweenfolate-induced peripheral metabolic changes and molecular mechanisms in the brain asseveral of the identified genes have also been shown to be under the regulation of theplasma hormone leptin to regulate food intake (e.g., Prlh [75], Drd2 [76], Cck [77]), thelactogenic hormone prolactin (e.g., Prlr, Drd2 [69]) or modulate the fluctuating response ofthe ARC to circulating sex-steroids (e.g., Gabre, Gabrd [78]).
To offer additional insight towards the role of folate form during pregnancy in diseasepredisposition, we searched for common genes between our differentially expressed geneset and those identified in the disease center human database, Human Genome Epidemiol-ogy (HuGE) Navigator [79]. Disease terms related to the long-term phenotype of MTHF vs.FA dams and gene ontology terms identified by enrichment analysis were searched andgene lists were extracted and compared with our gene set (Table S8). Corroborating ourphenotypic results, we identified 52 common genes between datasets using the search termobesity, 8 common genes related to hyperphagia, 10 genes related to anorexia, 59 genes relatedto diabetes mellitus type-2 and 12 common genes related to gestational diabetes. Although thisdata cannot be interpreted as cause and effect, it is well known that the development ofseveral metabolic and behavioral disorders is complex and commonly attributed to thedysregulation of genes and signaling pathways arising from multiple interacting regulatorysystems. The differential expression gene set in this study may lead to hypothesis testingand the development of studies to identify novel candidate genes and pathways targetedby folate during pregnancy that have a role in disease on-set and/or prevention.
While the primary mechanism(s) by which folate dose and form during pregnancyaffected maternal post-birth outcome are left uncertain, a probable mechanism is suggestedby transient disruptions in folate-mediated 1-carbon metabolism upon giving birth thatwere re-stabilized by 19-weeks post-weaning. As expected, only the 5X-FA diet led todetectable amounts of plasma unmetabolized FA in the mother post-birth. As high un-metabolized FA have been linked to negative health consequences [27], this may have
Nutrients 2021, 13, 48 16 of 21
been a factor underlying differences in later-life phenotype that warrants investigation.Moreover, although plasma and hepatic concentrations of 5-MTHF and methionine at par-turition directly reflected the dose of folate provided during pregnancy, with 5X dams withhigher concentrations compared to 1X dams, potential perturbations in folate-mediated1-carbon metabolism in plasma and tissues were also found that may explain differentialprogramming of folate forms, especially at the higher dose.
Plasma and tissue concentrations of choline, betaine, SAH and Hcy at parturition wereaffected by the dose and form of folate provided during pregnancy; potentially contributingto the post-birth phenotype of the dams. Dams fed the MTHF diet had 1-fold higher plasmaHcy concentrations, which contrasts with clinical studies showing MTHF to result in lowerplasma Hcy levels than FA in non-pregnant women [35,80]. However, the difference inHcy due to folate form as found immediately post-birth in rat dams are likely specific tothe effect of pregnancy on mediating transient changes in 1-carbon metabolism followingparturition as found in mice [81]. Upon giving birth, maternal concentrations of cholineand betaine are lower in the liver and increased in plasma to support placental transport tothe fetus and milk production for lactation [82]. In turn, hepatic SAH hydrolase reaction isreduced, and endogenous choline synthesis is increased, both of which are suggested tobe responsible for the transient increases in maternal plasma Hcy observed at the time ofdelivery. Accordingly, MTHF compared to FA dams also had higher hepatic concentrationsof SAH that associated with higher plasma Hcy and a strong trend towards its derivativeCys (p = 0.06).
Because the 5X folate diets differed in their effects on gene expression in the maternalhypothalamus at parturition, folates and 1-carbon metabolites were measured in the brainof the dams. However, the only differences were in brain concentrations of betaine, whichwere higher in 5X-FA compared to 5X-MTHF dams. These results are consistent with thehigher plasma betaine found in 5X-FA compared to 5X-MTHF dams and observationsthat brain betaine concentrations are mainly reflective of the exchange of betaine betweenplasma and brain [83]. Brain betaine uptake into neurons only occurs through a betainetransporter that is also responsible for transporting and re-uptake of GABA. As betainebinds with higher affinity to the transporter, higher betaine availability may affect GABAtransport/re-uptake and consequential signaling [83,84]. Noteworthy, GABA is the pri-mary inhibitory neurotransmitter in the CNS and GABAergic neurons throughout thehypothalamus have a prominent role in regulating normal food intake, body weight andenergy expenditure [85]. It has also been shown that maternal folate diets [86] and commonpolymorphisms that influence folate status [87] affect GABA availability and signaling inthe brain and result in altered gene expression and behavioral patterns. These findings arein line with data derived from our pathway enrichment analysis showing several pathwaysincluding GABAergic signaling to be differentially affected in the dam at parturition inresponse to the folate diet provided during pregnancy. This may suggest a potential role ofGABA in the observed folate-mediated effects and warrants future investigation.
A weakness of the study arises from a lack of follow-up on gene expression regulatorymechanisms, including DNA methylation, to explain the observed changes as well asthe lack of comparative transcriptomic analyses between recommended vs. high folategestational diets. Additionally, a time course analysis of metabolic parameters is requiredto understand critical time-points leading to altered phenotype in the mother and thepossible interaction effects of the high fat diet. Furthermore, the results of the present studydo not allow a conclusion on whether high MTHF or FA additions to the pregnancy dietare potentially of greater concern. However, a strength of the study is that it raises severalimportant questions regarding the potential adverse programming effects of high MTHFin addition to FA intakes during pregnancy on metabolic programming of mothers. Itprovides support for more research to understand the pharmacokinetic differences andsimilarities between the two folate forms throughout various life stages in influencingmetabolic disease risk and brain health. More research towards defining an optimal folate

Nutrients 2021, 13, 48 17 of 21
dose and form for healthy pregnancy and long-term outcomes should be a priority to informfood regulatory actions pertaining to folate food fortification and prenatal supplements.
5. Conclusions
MTHF when compared to FA intake during pregnancy differ in their programing ofthe early and later-life phenotype of the mother, and a potential adverse role of either formis observed when provided at the higher doses.
Supplementary Materials: The following are available online at https://www.mdpi.com/2072-6643/13/1/48/s1, Figure S1: Weekly weight-gain of dams from weaning to 19-weeks post-weaning(PW). Figure S2: Insulin Resistance at 1-week post-weaning in dams fed FA or MTHF pregnancy diets.Figure S3: Locomotor activity at 15-weeks post-weaning in dams fed FA or MTHF pregnancy diets.Figure S4: Comparison between data derived from RNAseq and qRT-PCR in ARC at parturition ofdams fed 5X-FA or 5X-MTHF pregnancy diets. Table S1: Composition of experimental folate diets fedduring pregnancy to Wistar rat dams and post-weaning high fat diet (HFD). Table S2: List of primersused for gene expression assay in hypothalamus of 5X-FA vs. 5X-MTHF dams at parturition andpost-weaning. Table S3: Body weight and food intake changes up to 1-week (wk) post-weaning (PW)of dams fed FA or MTHF diets during pregnancy. Table S4: Differentially Expressed Genes (DEGs)derived from DeSeq. Up- and Down-regulated gene list with padj < 0.05 were used for pathwayenrichment. Table S5: Up-regulated, down-regulated or up-and down-regulated gene lists classifiedby GO enrichment Biological Processes (BP), Cellular Component (CC), and Molecular Function(MF). Table S6: Up-regulated, down-regulated or up-and down-regulated gene lists classified by GOBiological Processes (BP) using Markov Cluster (MCL) algorithm. Table S7: Up-regulated, down-regulated or up-and down-regulated gene lists classified by KEGG and Reactome pathways. TableS8: Common genes between our differentially expressed gene lists (padj < 0.05) and those identifiedin the disease-centre human database, Human Genome Epidemiology (HuGE) Navigator.
Author Contributions: E.P., R.H., R.K., G.H.A.: designed the research; E.P., R.H., R.S.: conductedresearch; E.P.: analyzed data and wrote the manuscript; T.B., E.A., P.A., B.W.: performed and providedexpertise in LC-MS/MS analyses; Z.P.: provided resources and expertise in energy expenditureanalysis; G.H.A., R.K.: had primary responsibility for final content; and all authors: provided criticalfeedback to shape the manuscript. All authors have read and agreed to the published version of themanuscript.
Funding: This research was supported by: Canadian Institute of Health Research, Institute ofNutrition, Metabolism and Diabetes (CIHR-INMD), Reference MOP-130286; Natural Sciences andengineering Research Council of Canada (NSERC), Reference RGPIN-2016-06639; EP was supportedby the NSERC Alexander Graham Bell Canada Graduate Scholarships-Doctoral Program (CGS D).
Institutional Review Board Statement: The study was conducted according to the guidelines of theDeclaration of Helsinki, and approved by the Ethics Committee of the University of Toronto (protocol#20011892 on November 2, 2016).
Informed Consent Statement: Not applicable.
Data Availability Statement: The RNAseq data presented in this study are openly available in NCBIGene Expression Omnibus (GEO) at [https://www.ncbi.nlm.nih.gov/geo/query/acc.cgi?acc=GSE161954], reference number [GSE161954].
Acknowledgments: We would like to thank the Centre for Applied Genomics (TCAG), at theHospital for Sick Children, for performing RNA-sequencing analysis. We would also like to thankDiana Sánchez-Hernández for guidance on statistical analyses.
Conflicts of Interest: The authors declare no conflict of interest.
References1. Napso, T.; Yong, H.E.J.; Lopez-Tello, J.; Sferruzzi-Perri, A.N. The Role of Placental Hormones in Mediating Maternal Adaptations
to Support Pregnancy and Lactation. Front. Physiol. 2018, 9, 1091. [CrossRef]2. Dietrich, M.O.; Horvath, T.L. Hypothalamic control of energy balance: Insights into the role of synaptic plasticity. Trends Neurosci.
2013, 36, 65–73. [CrossRef]3. Brunton, P.J.; Russell, J.A.; Douglas, A.J. Adaptive responses of the maternal hypothalamic-pituitary-adrenal axis during
pregnancy and lactation. J. Neuroendocrinol. 2008, 20, 764–776. [CrossRef] [PubMed]
Nutrients 2021, 13, 48 18 of 21
4. Barba-Muller, E.; Craddock, S.; Carmona, S.; Hoekzema, E. Brain plasticity in pregnancy and the postpartum period: Links tomaternal caregiving and mental health. Arch. Womens Ment. Health 2019, 22, 289–299. [CrossRef] [PubMed]
5. Kalhan, S.C. One carbon metabolism in pregnancy: Impact on maternal, fetal and neonatal health. Mol. Cell. Endocrinol. 2016, 435,48–60. [CrossRef] [PubMed]
6. Stover, P.J.; Durga, J.; Field, M.S. Folate nutrition and blood-brain barrier dysfunction. Curr. Opin. Biotechnol. 2017, 44, 146–152.[CrossRef] [PubMed]
7. Varela-Rey, M.; Iruarrizaga-Lejarreta, M.; Lozano, J.J.; Aransay, A.M.; Fernandez, A.F.; Lavin, J.L.; Mosen-Ansorena, D.; Berdasco,M.; Turmaine, M.; Luka, Z.; et al. S-adenosylmethionine levels regulate the schwann cell DNA methylome. Neuron 2014, 81,1024–1039. [CrossRef] [PubMed]
8. Field, M.S.; Stover, P.J. Safety of folic acid. Ann. N. Y. Acad. Sci. 2018, 1414, 59–71. [CrossRef] [PubMed]9. Lamers, Y.; MacFarlane, A.J.; O’Connor, D.L.; Fontaine-Bisson, B. Periconceptional intake of folic acid among low-risk women in
Canada: Summary of a workshop aiming to align prenatal folic acid supplement composition with current expert guidelines. Am.J. Clin. Nutr. 2018, 108, 1357–1368. [CrossRef]
10. Pannia, E.; Cho, C.E.; Kubant, R.; Sanchez-Hernandez, D.; Huot, P.S.; Harvey Anderson, G. Role of maternal vitamins inprogramming health and chronic disease. Nutr. Rev. 2016, 74, 166–180. [CrossRef]
11. Yang, N.V.; Pannia, E.; Chatterjee, D.; Kubant, R.; Ho, M.; Hammoud, R.; Pausova, Z.; Anderson, G.H. Gestational folic acidcontent alters the development and function of hypothalamic food intake regulating neurons in Wistar rat offspring post-weaning.Nutr. Neurosci. 2018, 23, 149–160. [CrossRef] [PubMed]
12. Cho, C.E.; Pannia, E.; Huot, P.S.; Sanchez-Hernandez, D.; Kubant, R.; Dodington, D.W.; Ward, W.E.; Bazinet, R.P.; Anderson,G.H. Methyl vitamins contribute to obesogenic effects of a high multivitamin gestational diet and epigenetic alterations inhypothalamic feeding pathways in Wistar rat offspring. Mol. Nutr. Food Res. 2015, 59, 476–489. [CrossRef] [PubMed]
13. Cho, C.E.; Sanchez-Hernandez, D.; Reza-Lopez, S.A.; Huot, P.S.; Kim, Y.I.; Anderson, G.H. Obesogenic phenotype of offspring ofdams fed a high multivitamin diet is prevented by a post-weaning high multivitamin or high folate diet. Int. J. Obes. 2013, 37,1177–1182. [CrossRef] [PubMed]
14. Huang, Y.; He, Y.; Sun, X.; He, Y.; Li, Y.; Sun, C. Maternal high folic acid supplement promotes glucose intolerance and insulinresistance in male mouse offspring fed a high-fat diet. Int. J. Mol. Sci. 2014, 15, 6298–6313. [CrossRef] [PubMed]
15. Sie, K.K.; Li, J.; Ly, A.; Sohn, K.J.; Croxford, R.; Kim, Y.I. Effect of maternal and postweaning folic acid supplementation on globaland gene-specific DNA methylation in the liver of the rat offspring. Mol. Nutr. Food Res. 2013, 57, 677–685. [CrossRef] [PubMed]
16. Huot, P.S.; Ly, A.; Szeto, I.M.; Reza-Lopez, S.A.; Cho, D.; Kim, Y.I.; Anderson, G.H. Maternal and postweaning folic acidsupplementation interact to influence body weight, insulin resistance, and food intake regulatory gene expression in rat offspringin a sex-specific manner. Appl. Physiol. Nutr. Metab. 2016, 41, 411–420. [CrossRef]
17. Huot, P.S.; Dodington, D.W.; Mollard, R.C.; Reza-Lopez, S.A.; Sanchez-Hernandez, D.; Cho, C.E.; Kuk, J.; Ward, W.E.; Anderson,G.H. High Folic Acid Intake during Pregnancy Lowers Body Weight and Reduces Femoral Area and Strength in Female RatOffspring. J. Osteoporos. 2013, 2013, 154109. [CrossRef]
18. Pannia, E.; Yang, N.V.; Ho, M.; Chatterjee, D.; Hammoud, R.; Kubant, R.; Anderson, G.H. Folic acid content of diet duringpregnancy determines post-birth re-set of metabolism in Wistar rat dams. J. Nutr. Biochem. 2020, 83, 108414. [CrossRef]
19. Keating, E.; Correia-Branco, A.; Araujo, J.R.; Meireles, M.; Fernandes, R.; Guardao, L.; Guimaraes, J.T.; Martel, F.; Calhau, C.Excess perigestational folic acid exposure induces metabolic dysfunction in post-natal life. J. Endocrinol. 2015, 224, 245–259.[CrossRef]
20. Mudryj, A.N.; de Groh, M.; Aukema, H.M.; Yu, N. Folate intakes from diet and supplements may place certain Canadians at riskfor folic acid toxicity—CORRIGENDUM. Br. J. Nutr. 2016, 116, 1995. [CrossRef]
21. Bailey, R.L.; Pac, S.G.; Fulgoni, V.L., 3rd; Reidy, K.C.; Catalano, P.M. Estimation of Total Usual Dietary Intakes of Pregnant Womenin the United States. JAMA Netw. Open 2019, 2, e195967. [CrossRef] [PubMed]
22. Mentch, S.J.; Locasale, J.W. One-carbon metabolism and epigenetics: Understanding the specificity. Ann. N. Y. Acad. Sci. 2016,1363, 91–98. [CrossRef] [PubMed]
23. Bailey, S.W.; Ayling, J.E. The pharmacokinetic advantage of 5-methyltetrahydrofolate for minimization of the risk for birth defects.Sci. Rep. 2018, 8, 4096. [CrossRef] [PubMed]
24. Pfeiffer, C.M.; Sternberg, M.R.; Fazili, Z.; Yetley, E.A.; Lacher, D.A.; Bailey, R.L.; Johnson, C.L. Unmetabolized folic acid is detectedin nearly all serum samples from US children, adolescents, and adults. J. Nutr. 2015, 145, 520–531. [CrossRef]
25. Plumptre, L.; Masih, S.P.; Ly, A.; Aufreiter, S.; Sohn, K.J.; Croxford, R.; Lausman, A.Y.; Berger, H.; O’Connor, D.L.; Kim, Y.I. Highconcentrations of folate and unmetabolized folic acid in a cohort of pregnant Canadian women and umbilical cord blood. Am. J.Clin. Nutr. 2015, 102, 848–857. [CrossRef]
26. Smith, D.; Hornstra, J.; Rocha, M.; Jansen, G.; Assaraf, Y.; Lasry, I.; Blom, H.; Smulders, Y.M. Folic Acid Impairs the Uptake of5-Methyltetrahydrofolate in Human Umbilical Vascular Endothelial Cells. J. Cardiovasc. Pharmacol. 2017, 70, 271–275. [CrossRef]
27. Smith, A.D.; Kim, Y.I.; Refsum, H. Is folic acid good for everyone? Am. J. Clin. Nutr. 2008, 87, 517–533. [CrossRef]28. Saldanha, L.G.; Dwyer, J.T.; Haggans, C.J.; Mills, J.L.; Potischman, N. Perspective: Time to Resolve Confusion on Folate Amounts,
Units, and Forms in Prenatal Supplements. Adv. Nutr. 2020, 11, 753–759. [CrossRef]

Nutrients 2021, 13, 48 19 of 21
29. Troesch, B.; Demmelmair, J.; Gimpfl, M.; Hecht, C.; Lakovic, G.; Roehle, R.; Sipka, L.; Trisic, B.; Vusurovic, M.; Schoop, R.; et al.Suitability and safety of L-5-methyltetrahydrofolate as a folate source in infant formula: A randomized-controlled trial. PLoSONE 2019, 14, e0216790. [CrossRef]
30. Pietrzik, K.; Bailey, L.; Shane, B. Folic acid and L-5-methyltetrahydrofolate: Comparison of clinical pharmacokinetics andpharmacodynamics. Clin. Pharmacokinet. 2010, 49, 535–548. [CrossRef]
31. Servy, E.J.; Jacquesson-Fournols, L.; Cohen, M.; Menezo, Y.J.R. MTHFR isoform carriers. 5-MTHF (5-methyl tetrahydrofolate) vsfolic acid: A key to pregnancy outcome: A case series. J. Assist. Reprod. Genet. 2018, 35, 1431–1435. [CrossRef] [PubMed]
32. Freeman, M.P.; Savella, G.M.; Church, T.R.; Goez-Mogollon, L.; Sosinsky, A.Z.; Noe, O.B.; Kaimal, A.; Cohen, L.S. A prenatalsupplement with methylfolate for the treatment and prevention of depression in women trying to conceive and during pregnancy.Ann. Clin. Psychiatry 2019, 31, 4–16. [PubMed]
33. Reeves, P.G. Components of the AIN-93 diets as improvements in the AIN-76A diet. J. Nutr. 1997, 127 (Suppl. 5), 838S–841S.[CrossRef] [PubMed]
34. Prinz-Langenohl, R.; Bramswig, S.; Tobolski, O.; Smulders, Y.M.; Smith, D.E.; Finglas, P.M.; Pietrzik, K. [6S]-5-methyltetrahydrofolateincreases plasma folate more effectively than folic acid in women with the homozygous or wild-type 677C–>T polymorphism ofmethylenetetrahydrofolate reductase. Br. J. Pharmacol. 2009, 158, 2014–2021. [CrossRef]
35. Lamers, Y.; Prinz-Langenohl, R.; Moser, R.; Pietrzik, K. Supplementation with [6S]-5-methyltetrahydrofolate or folic acid equallyreduces plasma total homocysteine concentrations in healthy women. Am. J. Clin. Nutr. 2004, 79, 473–478. [CrossRef]
36. Cochrane, K.M.; Mayer, C.; Devlin, A.M.; Elango, R.; Hutcheon, J.A.; Karakochuk, C.D. Is natural (6S)-5-methyltetrahydrofolicacid as effective as synthetic folic acid in increasing serum and red blood cell folate concentrations during pregnancy? Aproof-of-concept pilot study. Trials 2020, 21, 380. [CrossRef]
37. Council, N.R. Nutrient requirements of the laboratory rat. In Nutrient Requirements of Laboratory Animals, 4th ed.; NationalAcademy Press: Washington, DC, USA, 1995; pp. 11–79.
38. Medicine, I.O. Folate. In Dietary Reference Intakes for Thiamin, Riboflavin, Niacin, Vitamin B6, Folate, Vitamin B12, Pantothenic Acid,Biotin, and Choline; National Academy Press: Washington, DC, USA, 1998; pp. 196–305.
39. EFSA Panel on Nutrition, Novel Foods and Food Allergens (NDA); Turck, D.; Castenmiller, J.; De Henauw, S.; Hirsch-Ernst,K.I.; Kearney, J.; Maciuk, A.; Mangelsdorf, I.; McArdle, H.J.; Naska, A.; et al. Calcium l-methylfolate as a source of folate addedfor nutritional purposes to infant and follow-on formula, baby food and processed cereal-based food. EFSA J. 2020, 18, e05947.[CrossRef]
40. Stuebe, A.M.; Rich-Edwards, J.W. The reset hypothesis: Lactation and maternal metabolism. Am. J. Perinatol. 2009, 26, 81–88.[CrossRef]
41. Folch, J.; Lees, M.; Sloane Stanley, G.H. A simple method for the isolation and purification of total lipides from animal tissues. J.Biol. Chem. 1957, 226, 497–509.
42. Arning, E.; Bottiglieri, T. Quantitation of 5-Methyltetrahydrofolate in Cerebrospinal Fluid Using Liquid Chromatography-Electrospray Tandem Mass Spectrometry. Methods Mol. Biol. 2016, 1378, 175–182. [CrossRef]
43. Nandania, J.; Kokkonen, M.; Euro, L.; Velagapudi, V. Simultaneous measurement of folate cycle intermediates in differentbiological matrices using liquid chromatography-tandem mass spectrometry. J. Chromatogr. B Anal. Technol. Biomed. Life Sci. 2018,1092, 168–178. [CrossRef] [PubMed]
44. Rooney, M.; Bottiglieri, T.; Wasek-Patterson, B.; McMahon, A.; Hughes, C.F.; McCann, A.; Horigan, G.; Strain, J.J.; McNulty, H.;Ward, M. Impact of the MTHFR C677T polymorphism on one-carbon metabolites: Evidence from a randomised trial of riboflavinsupplementation. Biochimie 2020, 173, 91–99. [CrossRef] [PubMed]
45. Ducros, V.; Belva-Besnet, H.; Casetta, B.; Favier, A. A robust liquid chromatography tandem mass spectrometry method for totalplasma homocysteine determination in clinical practice. Clin. Chem. Lab. Med. 2006, 44, 987–990. [CrossRef] [PubMed]
46. Kubant, R.; Poon, A.N.; Sanchez-Hernandez, D.; Domenichiello, A.F.; Huot, P.S.; Pannia, E.; Cho, C.E.; Hunschede, S.; Bazinet,R.P.; Anderson, G.H. A comparison of effects of lard and hydrogenated vegetable shortening on the development of high-fatdiet-induced obesity in rats. Nutr. Diabetes 2015, 5, e188. [CrossRef] [PubMed]
47. Hammoud, R.; Pannia, E.; Kubant, R.; Liao, C.S.; Ho, M.; Yang, N.V.; Chatterjee, D.; Caudill, M.A.; Malysheva, O.V.; Pausova,Z.; et al. Maternal Choline Intake Programs Hypothalamic Energy Regulation and Later-Life Phenotype of Male Wistar RatOffspring. Mol. Nutr. Food Res. 2020, 64, e1901178. [CrossRef] [PubMed]
48. Andrews, S. FastQC: A Quality Control Tool for High Throughput Sequence Data. 2017. Available online: http://www.bioinformatics.babraham.ac.uk/projects/fastqc/ (accessed on 1 November 2020).
49. Krueger, F. Trim Galore: A Wrapper Tool around Cutadapt and FastQC to Consistently Apply Quality and Adapter Trimming toFastQ Files, with Some Extra Functionality for MspI-Digested RRBS-Type (Reduced Representation Bisufite-Seq) Libraries. 2018.Available online: http://www.bioinformatics.babraham.ac.uk/projects/trim_galore/ (accessed on 1 November 2020).
50. Wingett, S. FastQ Screen: FastQ Screen Allows You to Screen a Library of Sequences in FastQ Format against a Set of SequenceDatabases so You Can See If the Composition of the Library Matches with What You Expect. 2017. Available online: http://www.bioinformatics.babraham.ac.uk/projects/fastq_screen/ (accessed on 1 November 2020).
51. Wang, L. RSeQC: An RNA-seq Quality Control Package. 2019. Available online: http://rseqc.sourceforge.net/ (accessed on 1November 2020).
52. Dobin, A. STAR: RNA-seq aligner. 2019. Available online: https://github.com/alexdobin/STAR (accessed on 1 November 2020).

Nutrients 2021, 13, 48 20 of 21
53. Dobin, A. STAR: Ultrafast universal RNA-seq aligner. Bioinformatics 2013, 29, 15–21. [CrossRef]54. Anders, S.; Pyl, P.T.; Huber, W. HTSeq—A Python framework to work with high-throughput sequencing data. Bioinformatics 2015,
31, 166–169. [CrossRef]55. Love, M.I.; Huber, W.; Anders, S. Moderated estimation of fold change and dispersion for RNA-seq data with DESeq2. Genome
Biol. 2014, 15, 550. [CrossRef]56. Merico, D.; Isserlin, R.; Stueker, O.; Emili, A.; Bader, G.D. Enrichment map: A network-based method for gene-set enrichment
visualization and interpretation. PLoS ONE 2010, 5, e13984. [CrossRef]57. Livak, K.J.; Schmittgen, T.D. Analysis of relative gene expression data using real-time quantitative PCR and the 2(-Delta Delta
C(T)) Method. Methods 2001, 25, 402–408. [CrossRef]58. Friedman, J.M. The function of leptin in nutrition, weight, and physiology. Nutr. Rev. 2002, 60, S1–S14, discussion S68–S84.
[CrossRef] [PubMed]59. Gruzdeva, O.; Borodkina, D.; Uchasova, E.; Dyleva, Y.; Barbarash, O. Leptin resistance: Underlying mechanisms and diagnosis.
Diabetes Metab. Syndr. Obes. 2019, 12, 191–198. [CrossRef]60. Tschop, M.; Weyer, C.; Tataranni, P.A.; Devanarayan, V.; Ravussin, E.; Heiman, M.L. Circulating ghrelin levels are decreased in
human obesity. Diabetes 2001, 50, 707–709. [CrossRef] [PubMed]61. Gomez, G.; Han, S.; Englander, E.W.; Greeley, G.H., Jr. Influence of a long-term high-fat diet on ghrelin secretion and ghrelin-
induced food intake in rats. Regul. Pept. 2012, 173, 60–63. [CrossRef] [PubMed]62. Licholai, J.A.; Nguyen, K.P.; Fobbs, W.C.; Schuster, C.J.; Ali, M.A.; Kravitz, A.V. Why Do Mice Overeat High-Fat Diets? How
High-Fat Diet Alters the Regulation of Daily Caloric Intake in Mice. Obesity 2018, 26, 1026–1033. [CrossRef] [PubMed]63. Pandit, R.; Beerens, S.; Adan, R.A.H. Role of leptin in energy expenditure: The hypothalamic perspective. Am. J. Physiol. Regul.
Integr. Comp. Physiol. 2017, 312, R938–R947. [CrossRef]64. Cornelis, M.C.; Flint, A.; Field, A.E.; Kraft, P.; Han, J.; Rimm, E.B.; van Dam, R.M. A genome-wide investigation of food addiction.
Obesity 2016, 24, 1336–1341. [CrossRef]65. Fan, T.; Hu, Y.; Xin, J.; Zhao, M.; Wang, J. Analyzing the genes and pathways related to major depressive disorder via a systems
biology approach. Brain Behav. 2020, 10, e01502. [CrossRef]66. Ray, S.; Tzeng, R.Y.; DiCarlo, L.M.; Bundy, J.L.; Vied, C.; Tyson, G.; Nowakowski, R.; Arbeitman, M.N. An Examination of
Dynamic Gene Expression Changes in the Mouse Brain During Pregnancy and the Postpartum Period. G3: Genes Genomes Genet.2015, 6, 221–233. [CrossRef]
67. Kokay, I.C.; Petersen, S.L.; Grattan, D.R. Identification of prolactin-sensitive GABA and kisspeptin neurons in regions of the rathypothalamus involved in the control of fertility. Endocrinology 2011, 152, 526–535. [CrossRef]
68. Andrews, Z.B.; Kokay, I.C.; Grattan, D.R. Dissociation of prolactin secretion from tuberoinfundibular dopamine activity in latepregnant rats. Endocrinology 2001, 142, 2719–2724. [CrossRef] [PubMed]
69. Brown, R.S.; Kokay, I.C.; Phillipps, H.R.; Yip, S.H.; Gustafson, P.; Wyatt, A.; Larsen, C.M.; Knowles, P.; Ladyman, S.R.; LeTissier, P.;et al. Conditional Deletion of the Prolactin Receptor Reveals Functional Subpopulations of Dopamine Neurons in the ArcuateNucleus of the Hypothalamus. J. Neurosci. 2016, 36, 9173–9185. [CrossRef] [PubMed]
70. De Gortari, P.; Mancera, K.; Cote-Velez, A.; Amaya, M.I.; Martinez, A.; Jaimes-Hoy, L.; Joseph-Bravo, P. Involvement ofCRH-R2 receptor in eating behavior and in the response of the HPT axis in rats subjected to dehydration-induced anorexia.Psychoneuroendocrinology 2009, 34, 259–272. [CrossRef] [PubMed]
71. Gu, W.; Geddes, B.J.; Zhang, C.; Foley, K.P.; Stricker-Krongrad, A. The prolactin-releasing peptide receptor (GPR10) regulatesbody weight homeostasis in mice. J. Mol. Neurosci. 2004, 22, 93–103. [CrossRef]
72. Talbi, R.; Navarro, V.M. Novel insights into the metabolic action of Kiss1 neurons. Endocr. Connect. 2020, 9, R124–R133. [CrossRef]73. Frank, A.; Brown, L.M.; Clegg, D.J. The role of hypothalamic estrogen receptors in metabolic regulation. Front. Neuroendocrinol.
2014, 35, 550–557. [CrossRef]74. Delgado, T.C. Glutamate and GABA in Appetite Regulation. Front. Endocrinol. 2013, 4, 103. [CrossRef]75. Naef, L.; Woodside, B. Prolactin/Leptin interactions in the control of food intake in rats. Endocrinology 2007, 148, 5977–5983.
[CrossRef]76. Billes, S.K.; Simonds, S.E.; Cowley, M.A. Leptin reduces food intake via a dopamine D2 receptor-dependent mechanism. Mol.
Metab. 2012, 1, 86–93. [CrossRef]77. Merino, B.; Cano, V.; Guzman, R.; Somoza, B.; Ruiz-Gayo, M. Leptin-mediated hypothalamic pathway of cholecystokinin (CCK-8)
to regulate body weight in free-feeding rats. Endocrinology 2008, 149, 1994–2000. [CrossRef]78. Henderson, L.P. Steroid modulation of GABAA receptor-mediated transmission in the hypothalamus: Effects on reproductive
function. Neuropharmacology 2007, 52, 1439–1453. [CrossRef] [PubMed]79. Yu, W.; Clyne, M.; Khoury, M.J.; Gwinn, M. Phenopedia and Genopedia: Disease-centered and gene-centered views of the
evolving knowledge of human genetic associations. Bioinformatics 2010, 26, 145–146. [CrossRef] [PubMed]80. Venn, B.J.; Green, T.J.; Moser, R.; Mann, J.I. Comparison of the effect of low-dose supplementation with L-5-methyltetrahydrofolate
or folic acid on plasma homocysteine: A randomized placebo-controlled study. Am. J. Clin. Nutr. 2003, 77, 658–662. [CrossRef][PubMed]
81. Molloy, A.M.; Mills, J.L.; Cox, C.; Daly, S.F.; Conley, M.; Brody, L.C.; Kirke, P.N.; Scott, J.M.; Ueland, P.M. Choline and homocysteineinterrelations in umbilical cord and maternal plasma at delivery. Am. J. Clin. Nutr. 2005, 82, 836–842. [CrossRef]

Nutrients 2021, 13, 48 21 of 21
82. Zeisel, S.H.; Niculescu, M.D. Perinatal choline influences brain structure and function. Nutr. Rev. 2006, 64, 197–203. [CrossRef]83. Knight, L.S.; Piibe, Q.; Lambie, I.; Perkins, C.; Yancey, P.H. Betaine in the Brain: Characterization of Betaine Uptake, its Influence
on Other Osmolytes and its Potential Role in Neuroprotection from Osmotic Stress. Neurochem. Res. 2017, 42, 3490–3503.[CrossRef]
84. Kempson, S.A.; Zhou, Y.; Danbolt, N.C. The betaine/GABA transporter and betaine: Roles in brain, kidney, and liver. Front.Physiol. 2014, 5, 159. [CrossRef]
85. Suyama, S.; Yada, T. New insight into GABAergic neurons in the hypothalamic feeding regulation. J. Physiol. Sci. 2018, 68,717–722. [CrossRef]
86. Liu, L.; Liu, Z.; Li, Y.; Sun, C. Integration of metabolomics and proteomics to highlight altered neural development relatedpathways in the adult offspring after maternal folic acid supplement. Clin. Nutr. 2020. [CrossRef]
87. Jadavji, N.M.; Wieske, F.; Dirnagl, U.; Winter, C. Methylenetetrahydrofolate reductase deficiency alters levels of glutamate andgamma-aminobutyric acid in brain tissue. Mol. Genet. Metab. Rep. 2015, 3, 1–4. [CrossRef]