MicroRNAs Regulate Human Adipocyte Lipolysis: Effects of miR-145 Are Linked to TNF-α
Upload
independentCategory
view
3download
0
ORIGINAL ARTICLE
Differences in adipocyte long chain fatty acid uptakein Osborne–Mendel and S5B/Pl rats in response tohigh-fat diets
O Petrescu1, AF Cheema2, X Fan1, MW Bradbury1 and PD Berk1,2
1Division of Liver Diseases, Department of Medicine, Mount Sinai School of Medicine, New York, NY, USA and 2Division ofDigestive and Liver Disease, Department of Medicine, Columbia University College of Physicians and Surgeons, New York,NY, USA
Objective: To determine whether strain differences in adipocyte uptake of long chain fatty acids (LCFAs) contribute todifferences in weight gain by Osborne–Mendel (OM) and S5B/Pl rats (S) fed a high-fat diet (HFD).Subjects: Ninety-four adult (12–14-week old) male OM and S rats.Measurements: Body weight; epididymal fat pad weight; adipocyte size, number, LCFA uptake kinetics; and plasma insulin andleptin during administration of HFD or chow diets (CDs).Results: In both strains, rate of weight gain (RWG) was greater on an HFD than a CD; RWG on an HFD was greater, overall, inOM than S. A significant RWG increase occurred on days 1 and 2 in both strains. It was normalized in S by days 6–9 but persistedat least till day 14 in OM. RWGs were significantly correlated (Po0.001) with the Vmax for saturable adipocyte LCFA uptake(Vmax). In S, an increase in Vmax on day 1 returned to baseline by day 7 and was correlated with both plasma insulin and leptinlevels throughout. In OM, a greater increase in Vmax was evident by day 2, and persisted for at least 14 days, during which bothinsulin and leptin levels remained elevated. Growth in epididymal fat pads on the HFD correlated with body weight, reflectinghypertrophy in OM and both hypertrophy and hyperplasia in S.Conclusions: (a) Changes in Vmax contribute significantly to changes in RWG on HFDs. (b) There are important strain differencesin circulating insulin and leptin responses to an HFD. (c) Both insulin and leptin responses to an HFD are closely correlated withVmax of adipocyte fatty acid uptake in S animals, but suggest early onset of insulin resistance in OM. Thus, differences inhormonal regulation of adipocyte LCFA uptake may underlie the different responses of OM and S to HFD.
International Journal of Obesity (2008) 32, 853–862; doi:10.1038/sj.ijo.0803792; published online 15 January 2008
Keywords: adipose tissue; uptake kinetics; insulin; leptin
Introduction
Obesity is the accumulation of excess fat in the form of
triglycerides (TGs) in adipose tissue. However, since adipo-
cytes are not major sites of long chain fatty acid (LCFA)
synthesis,1 and the insulin resistance associated with obesity
leads to increased lipolysis and cellular fatty acid release,2
this excessive TG accumulation must ultimately reflect, at
least in part, increased LCFA uptake, irrespective of the
kinetics for esterification of LCFA to TG. Uptake occurs via
two discrete processes: regulatable, protein-mediated, facili-
tated transport and passive flip-flop (diffusion) across the
plasma membrane.3–5 We have demonstrated several fold
upregulation of saturable LCFA uptake in adipocytes from
single-gene obesity models such as the Zucker rat,6 ob, db, fat
and tubby mouse,7 and in dietary models of obesity in both
rats and mice.7 A similar upregulation of LCFA uptake occurs
in omental adipocytes from obese patients undergoing
bariatric surgery.8 Upregulation of adipocyte LCFA uptake
precedes onset of overt obesity in weanling Zucker rats,6 and
downregulation of adipocyte LCFA uptake precedes weight
loss during leptin administration to ob mice,9 suggesting that
regulation of adipocyte LCFA uptake is a key control point
for body adiposity. While these data suggest that dysregula-
tion of adipocyte LCFA uptake might contribute to the
pathogenesis of obesity, it is alternatively possible that the
ability of adipocytes to upregulate LCFA uptake duringReceived 31 May 2007; revised 18 October 2007; accepted 19 November
2007; published online 15 January 2008
Correspondence: Professor PD Berk, Department of Medicine, Columbia
Presbyterian Medical Center, Russ Berrie Medical Science Pavillion, 1150
St Nicholas Avenue, Room 412, New York, NY 10032, USA.
E-mail: [email protected]
International Journal of Obesity (2008) 32, 853–862& 2008 Nature Publishing Group All rights reserved 0307-0565/08 $30.00
www.nature.com/ijo

caloric excess represents a buffer that protects hepatocytes,
pancreatic b-cells, cardiac and skeletal muscle from LCFA-
mediated lipotoxicity.10–16
Comparisons of obesity-prone and -resistant rodent strains
are useful in studying the pathogenesis of obesity. C57BL/6J
but not A/J mice,17,18 and Osborne–Mendel (OM) but not
S5B/Pl rats develop obesity when fed high-fat diets
(HFDs).19,20 The reasons for these differences are not fully
understood. We therefore postulated that the differences
between OM and S rats in susceptibility to obesity while
consuming an HFD might reflect differences in regulation of
facilitated LCFA uptake. The studies described below test this
hypothesis.
Methods
Animals
Male Osborne–Mendel (OM) and S5B/Pl (S) rats were
purchased at 6–8 weeks of age from Pennington Biomedical
Research Institute (Baton Rouge, LA, USA). Animals were
maintained in a temperature-controlled facility with a 12 h
light/dark cycle with free access to water and laboratory
chow until the start of the studies. Weights were taken
regularly to determine when the growth rate decreased at
maturity. For OM, this occurred by B12 weeks and in S at
12–14 weeks of age.
Protocols
The impact of an HFD on body weight, adipocyte cell size
and adipocyte uptake of LCFA in OM and S was compared in
three protocols. In protocol 1, 10 12-week-old male rats
of each strain were weighed on day 0 and randomized to
receive either an HFD containing 35% lard (55% of calories
from fat) (Bio-Serv, Frenchtown, NJ, USA) (OMfat, Sfat), or a
chow diet (CD) (Diet no. 5053, 13% of calories from fat; WF
Fisher, Somerville, NJ, USA) (OMchow, Schow). Animals were
weighed at 4 and 8 weeks and killed after 10–11 weeks on
the designated diet. Separate groups of nine OM and six S
animals, obtained subsequently, were designated as controls
(OMcontrol, Scontrol) and were fed the same CD until killed
for study on reaching ages equivalent to those in the four
experimental groups on day 0. At the time of killing,
adipocytes were isolated for cell sizing and [3H]-oleic acid
uptake kinetics were measured using standard methods (see
below). For protocol 2, designed to determine the effects of
time on diet on the rate of weight gain (RWG), two
additional groups of 12-week-old male OM rats (n¼4 per
group; OMfat, OMchow) were given the same HFD or CD as in
protocol 1. Corresponding groups of S received the same
diets Sfat, Schow). Animals were kept on their assigned diet
and weighed weekly for 10–11 weeks. In protocol 3, groups
of OM and S comparable to those in protocol 1 were placed
on the HFD and killed on days 0, 1, 2, 6–9, 14 and 70 for
studies of adipocyte size, LCFA uptake, and insulin and
leptin responses. Animals were weighed 1 day prior to and
just before killing, and RWG (g per day) was estimated as the
24-h increment between weighings. There were no chow-fed
controls in this study.
Ethics statement
All applicable institutional and governmental regulations on
ethical use of animals were followed in this research. All
protocols were approved by the Mt Sinai IACUC Committee.
Adipocyte isolation and measurements
In protocols 1 and 3, epididymal fat pads were removed after
killing, weighed and collected in DMEM. Adipocytes were
isolated by collagenase digestion of weighed samples,3,6
suspended in Krebs–Ringer bicarbonate/Hepes buffer con-
taining 5% bovine albumin21 and counted. The total number
of epididymal adipocytes was calculated from the weights
of the epididymal fat pads in grams and the measured cell
counts per gram of tissue. The distribution of adipocyte
diameters (in mm) in each suspension was determined by
direct microscopy using a graduated eyepiece reticle.22 The
mean cell surface area (mm2) and volume (mm3) of these
spherical cells were calculated from the diameters.22
Fatty acid uptake studies
Long chain fatty acid uptake kinetics by adipocyte suspen-
sions were measured by rapid filtration using tracer amounts
of [3H]-oleic acid (OA).3,6 As previously,3,6–9,23 data for OA
uptake were best fitted by the sum of a saturable plus a non-
saturable function of the unbound OA concentration in the
incubation medium, of the form:
UTð½Ou�Þ ¼ ðVmax � ½Ou�=ðKm þ ½Ou�ÞÞ þ k � ½Ou� ð1Þ
where UT([Ou]) is OA uptake velocity at unbound OA
concentration [Ou] (nM), Vmax (pmol per sec per 50 000 cells)
and Km (nM) are, respectively, the maximal OA uptake
velocity of the saturable uptake process and the unbound OA
concentration at which 1/2 of maximal uptake velocity is
achieved, and k (ml per sec per 50 000 cells) is the rate
constant for non-saturable uptake. Curve fitting and deter-
mination of the kinetic constants of the uptake process were
accomplished as described3 with the Simulation, Analysis
and Modeling II (SAAMII) program.24,25
Other measurements
Whole blood glucose was measured in tail vein samples with
a glucose meter (One-Touch; LifeScan Inc., Milpitas,
CA, USA). Additional blood was collected after killing into
EDTA and promptly separated by centrifugation. Plasma was
stored at �20 1C for leptin and insulin measurements by
RIA (Linco Research, St Louis, MO, USA) and free fatty acids
(FFA) using a commercial kit (Wako Chemicals USA Inc.,
Richmond, VA, USA).
Adipocyte fatty acid uptake in fat-fed ratsO Petrescu et al
854
International Journal of Obesity

Statistical analyses
The key hypothesis being tested in these studies was that
RWG in the rat strains studied would be correlated with the
Vmax for adipocyte LCFA uptake. The choice of statistical
methods, therefore, is focused on those most appropriate to
test this hypothesis. Measurements at each time point within
each treatment group were initially summarized in terms of
mean, standard deviation and standard error, using conven-
tional methods of descriptive statistics.26 Measured Differ-
ences between strains at specific times, or between time
points within a strain, were determined by Student’s two-
tailed t-tests. Relationships between parameters were assessed
by both linear and nonlinear correlations.
The weights recorded in protocol 2 were influenced by
multiple factors, those most important being rat strain,
diet and time on diet. Rigorous analysis, therefore, involved
simultaneous consideration of four variables measured
repeatedly at succeeding times, requiring a novel statistical
approach.27 Specifically, differences in the experimental
growth curves in OM and S rats on both HFD and CD
(protocol 2) were analyzed by a model27 in which the natural
log (ln) of weight at week i was expressed as a function of diet
(b1), strain (b2), a term that changes with i (b3, to capture the
fact that the animals of both strains continue to gain some
weight independent of dietary fat content), a term that
changes with i2 (b4, to capture the fact that the relative
weight gain changes with time), and two interaction terms
(b5 and b6), which were included because the pattern of
weight gain for the high-fat animals (of both strains) differs
from that of the chow animals. The model can also include
terms for differences in the pattern of weight gain between
the two strains, but those were not statistically significant
in the present study. The equation describing the model is
presented in Results.
Growth curve data were fitted to the model by methods of
hierarchical mixed models for repeated measures,27 assum-
ing a first order autoregressive covariance structure (that is,
the correlation between weights decreases as time between
measurements increases) with SAS software (SAS Institute
Inc., Cary, NC, USA), generating estimates for model
parameters, designated b0–b6. The consequent interpreta-
tions are presented in Results. As illustrated there, the model
permits identification and separation of both strain and
dietary factors contributing to differences in weight gain,
and would be widely applicable to other similar studies.
Data are presented as mean±s.e.
Results
Protocol 1: preliminary investigations
Weight gain. At day 0, OMfat and OMchow animals were
significantly heavier than their Sfat and Schow counterparts.
For each strain, the initial weight of the two experimental
groups did not differ from that of the corresponding controls
(OMcontrol and Scontrol). After killing at 10–11 weeks on their
assigned diets, all four experimental groups weighed
significantly more than initial weight (Table 1). Moreover,
OMfat animals were significantly heavier than OMchow, while
the differences in weight between Sfat and Schow were not
significant. Thus, over the 70 days of the study, OMfat rats
gained 55% of their initial weight at an average rate of
3.1 g day–1, while the OMchow group gained 30% of their
initial weight at an average of 1.7 g day–1. Over the same
period, Sfat animals gained 39% of their initial weight at an
average of 1.6 g day–1, while Schow animals gained 28% of
their initial weight at a mean of 1.1 g day–1. There were,
however, appreciable changes in RWGs over time in all
groups. On the basis of weights at 4 and 8 weeks, and at the
time of killing, RWGs in groups OMfat, OMchow, Sfat and
Schow, respectively, averaged 5.0, 2.6, 2.3 and 1.3 g day–1 over
the first 4 weeks of the study, 2.0, 0.9, 1.3 and 1.1 g day–1
during weeks 4–8, and 0.9, 0.9, 0.6 and 0.5 g day–1 from 8
weeks to killing. These changes were explored in more detail
in protocol 2 (Table 1).
Adipocyte cell size. On day 0, adipocyte diameters in
OMcontrol rats were significantly greater than in Scontrols
(Table 1). Thereafter, diameters in both OM and S adipocytes
grew significantly between days 0 and 70 on the HFD, but
only minimally on the CD. However, the increases in
diameter (48 vs 26%) and surface area (113 vs 59%) were
much greater in the OMfat than in the Sfat animals.
Fatty acid uptake. There was no difference in LCFA uptake
kinetics between OMcontrol and Scontrol animals on day 0
(Table 1). Likewise, there were no differences in LCFA
uptake Vmax between days 0 and 70 for OMchow, Schow or Sfat
animals. However, the Vmax for LCFA uptake increased
significantly over this period in the OMfat animals, so that
the value at day 70 in OMfat animals was 31% greater than in
Sfat. Thus, the effect of the HFD in preferentially promoting
weight gain in OM animals is accompanied by a selective
upregulation of saturable LCFA uptake. In this protocol,
when Vmax (pmol per sec per 50 000 cells) was divided by the
surface area (in mm2) of 50 000 cells, expressing the results
as pmol per sec per mm2 of adipocyte surface area (Vmax0),
there was no difference in the values of Vmax0 between the
OMcontrol and Scontrol groups (Table 1). Despite the modest
increase in Vmax after 70 days of the HFD, Vmax0 decreased
significantly in OMfat animals, because the increase in cell
size and surface area was much greater than that in Vmax.
Vmax0 fell to a lesser degree in the OMchow, Sfat and Schow
groups, reflecting the lack of change in Vmax, and smaller
increases in cell size and surface area.
Other measurements. At killing, none of the animals was
hyperglycemic; FFA were higher in the OM (OMfat, OMchow)
than in the corresponding S animals (Sfat, Schow) (395±28 vs
307±21 mM, Po0.05). The HFD produced no difference in
FFA between Sfat and Schow animals, and the increase in FFA
Adipocyte fatty acid uptake in fat-fed ratsO Petrescu et al
855
International Journal of Obesity

to a mean of 425 mM in OMfat vs 365 mM in OMchow was not
significant.
Protocol 2: time course study
Many studies have compared the effects of HFDs on weight
gain in OM and S over a specific period, such as 14 days (for
example, 19, 20). Protocol 1 was designed assuming that
prolonged HFD administration would produce a sustained
increase in RWG and saturable LCFA uptake in OM rats.
However, the results above suggested that the effects of the
HFD were not sustained, but rather decreased with time.
Accordingly, additional groups of 12-week-old male OM and
S animals (n¼4 per group) were given either the HFD or CD
and weighed weekly for 10–11 weeks. The weight curves are
shown in Figure 1a. In all four groups, the RWGs appear
greatest by inspection over the initial 3–4 weeks. From week
4 to approximately week 8, there is a nearly linear RWG,
which is slower than the initial rate for that strain and diet.
Finally, in CD-fed animals, weight gain slows further during
the final 2–3 weeks. These observations are amplified by
analysis of daily RWGs (Figure 1b). The RWGs in the OMchow
and Schow animals were virtually identical during week 1, and
little changed during weeks 1–3. They then fell compared
Tab
le1
Effect
sof
lon
g-t
erm
ad
min
istr
ation
of
ah
igh
-fat
die
ton
bod
yw
eig
ht
an
dad
ipocy
teup
take
of
ole
icaci
din
Osb
orn
eF
Men
del
(OM
)an
dS5B/P
l(S
)ra
tsa,b
Str
ain
Gro
up
Die
tIn
itia
lw
eight
(g)
Finalw
eight
(g)
Cel
ldia
m(m
m)
Cel
lsu
rface
(mm
2)
Vm
axc
Vm
ax/s
urf
ace
d(p
m/s
/mm
2)
10
8K
me
kf
OM C
on
trol
OM
con
trol
Ch
ow
374±
10a
NA
77±
5f
21
000±
1601
5.5
±0.6
70.5
24
±0.0
75
23.1
±9.4
0.0
058
±0.0
030
Exp
eri
men
tal
OM
fat
(n¼
5)
Hig
h-f
at
392±
12b
606±
19c,
d114±
14g
44
781±
5042
8.5
±0.2
7h
,i0.3
80
±0.0
44
7.4
±2
0.0
064
±0.0
017
OM
ch
ow
(n¼
5)
Ch
ow
509±
12c
83±
622
911±
1636
6.5
±0.1
60.5
67
±0.0
43
21±
2.2
0.0
046
±0.0
011
S5
B/P
l
Con
trol
Scon
trol
Ch
ow
308±
11a
NA
66±
114
792±
478
6.6
±1.2
0.8
92
±0.2
07
35±
17.9
0.0
054
±0.0
024
Exp
eri
men
tal
Sfa
t(n
¼5)
Hig
h-f
at
290±
5b
404±
7c,
e83±
7g
23
538±
3284
6.3
±0.1
30.5
35
±0.0
75
15±
1.7
0.0
13±
0.0
008
Sch
ow
(n¼
5)
Ch
ow
370±
14c
76±
219
197±
1306
6.1
±0.2
20.6
36
±0.0
49
22±
0.5
0.0
03±
0.0
009
Ab
bre
viati
on
s:N
A,
not
ap
plic
ab
le;
NS,
not
sig
nific
an
t.aA
llva
lues
are
mean
±s.
e.m
.bD
ata
for
con
trolg
roup
sare
from
day
0.
Th
ose
from
exp
eri
men
tal
gro
up
sw
ere
ob
tain
ed
at
killi
ng
at
day
70.
Un
its:
cV
max¼
pm
olp
er
sec
per
50
000
cells
;dV
max/s
urf
ace
are
a¼
pm
olp
er
sec
per
mic
ron
2;
eK
m¼
nM
;f k¼
mlp
er
sec
per
50
000
cells
.Sta
tist
icalco
mp
ari
son
s:a:P¼
NS
vsco
rresp
on
din
gexp
eri
men
talg
roup
;b
:
Po
0.0
01
vsS5BP/l
exp
eri
men
tal
gro
up
;c:
Po
0.0
01
vsin
itia
lw
eig
ht
of
corr
esp
on
din
gexp
eri
men
tal
gro
up
;d
:Po
0.0
05
vsO
Mch
ow;
e:
0.1
4P4
0.0
5vs
Sch
ow
;f:
Po
0.0
5vs
Scon
trol;
g:
Po
0.0
5vs
corr
esp
on
din
gco
ntr
olg
roup
;h
:Po
0.0
05
vsO
Mcon
trol;
i:Po
0.0
1vs
Sfa
t.
650
600
550
500
450
400
350
300
250
Wei
ght (
g)
OM Hi-FatS5B/Pl Hi-FatOM ChowS5B/Pl Chow
OM Hi-FatS5B/Pl Hi-FatOM ChowS5B/Pl Chow
0 1 2 3 4 5 6 7 8 9 10Weeks
8
7
6
5
4
3
2
1
0Rat
e of
Wei
ght G
ain
(g/d
ay)
to1 2 3 4 5 6 7 10Weeks on High Fat Diet
Figure 1 (a) Weights of adult male Osborne–Mendel (OM) and S5B/Pl
rats fed either standard laboratory chow or a high-fat diet for 10–11 weeks
(protocol 2). Results are mean±s.e. (n¼4 per group). (b) Average rates of
weight gain (g per day) in fat- and chow-fed OM and S5B/Pl rats in protocol 2,
during each week of the study. Results are mean±s.e.
Adipocyte fatty acid uptake in fat-fed ratsO Petrescu et al
856
International Journal of Obesity

with baseline in both strains during week 4 and remained
below baseline thereafter. In contrast, RWG in OMfat rats was
greatest during week 1 (6.2±0.6 g day–1), which is signifi-
cantly greater than the basal rate preceding onset of the
study (1.6±0.5 g day–1, Po0.001). It then declined over the
next 4 weeks to 1.4±0.5 g day–1 at week 5, a value similar to
baseline, which persisted thereafter. While the peak value
(4.0±0.3 g day–1) in Sfat animals, also observed during week
1, was significantly less than that in OM (Po0.025), and
RWG in OMfat consistently exceeded that in Sfat, the pattern
over time was similar (Figure 1b): increases in RWG in both
OMfat and Sfat animals were greatest during weeks 1–3 and
least during week 9 and thereafter (Figure 1).
As noted above, the weights recorded in Figure 1a were
influenced by multiple factors, of which those most
important to this study were strain, diet and time on diet.
To examine simultaneously the influence of each of these
factors on the observed weights, the data were analyzed by a
model in which the natural logarithm of weight at week i is
given by:
Inðweight � iÞ ¼b0 þ b1ðHFÞ þ b2ðOMÞ þ b3ðiÞ þ b4ði2Þþ b5ðHF�iÞ þ b6ðHF�i2Þ þ error
ð2Þwhere HF is assigned a value of 1 for HFD, 0 for CD. Similarly,
OM¼1 for Osborne–Mendel rats, 0 for S5B rats; HF*i¼ i for
HFD, 0 for CD; and HF*i2¼ i2 for HFD, 0 for CD. Data were
fitted to Equation (2) as described in Methods. The solution
yielded numerical values for parameters b0–b6, giving
the following results: b0¼5.70 (Po0.0001), b1¼0.065
(P¼0.077), b2¼0.23 (Po0.0001), b3¼0.04 (Po0.0001),
b4¼�0.0019 (Po0.0001), b5¼0.023 (P¼0.0001), and
b6¼�0.0012 (P¼0.029). The meaning of these results is
most readily illustrated by examples. Substituting 1 or 0, as
appropriate, for HF and OM and using the estimated
b-coefficients, the expected ln of the weight of an HFD-fed
OM rat at week 3 is estimated as:
LnðWeight � 3Þ ¼5:70 þ 0:065 þ 0:23 þ 0:04ð3Þ � 0:0019ð9Þþ 0:023ð3Þ � 0:0012ð9Þ ¼ 6:156;
and Weight � 3 ¼ expð6:156Þ ¼ 471:6
The relative weight gain from one week to the next can be
calculated by subtracting the ln of weight at week i from that
at week (iþ1) and exponentiating. This involves dividing
weight at week (iþ1) by that at week i. The relative change
in weight from week i to week (iþ1) is:
High Fat :1:066 expf�0:00308ð2i þ 1Þgand Chow : 1:042 expf�0:00193ð2i þ 1Þg
From this, we get the following model estimates of relative
changes in body weight over time on the two diets: day 0 to
week 1: HFD: 1.066 (that is, þ6.6%) vs CD:1.042 (þ4.2%);
week 3–4: HFD: 1.043 (þ4.3%) vs CD: 1.029 (þ2.9%); and
week 9–10: HFD: 1.005 (þ0.5%) vs CD: 1.004 (þ0.4%).
These model-dependent results support experimental
observations that (1) initial weights of OM rats were
significantly higher than those of the S rats of the same
age (b2), and (2) the HFD-fed rats of both strains started out
marginally heavier than the Chow (b1). (3) Weights of both
strains increased significantly with time (b3 for S), but (4) the
rate of increase from week to week was maximal during week
1 and thereafter slowed down with time (b4 for S). (5) The fat-
fed rats of both strains gained weight faster than the chow
(b5 for the HFD excess), but (6) their weekly rate of increase
diminished faster (b6 for the HFD excess fall-off). A more
detailed explanation of the approach will be found in Brown
and Prescott.27
Protocol 3: short-term response study
Protocols 1 and 2 suggested that the RWG produced by an
HFD in both OM and S animals was greatest soon after
introduction of the diet. Since protocol 1 studies were
conducted mainly during week 10, they might have missed
key strain differences during the initial diet period. This was
addressed in protocol 3, which tested our basic hypothesis by
examining RWG, LCFA uptake kinetics, and plasma levels
of insulin and leptinFboth are putative regulators of LCFA
uptakeFat frequent intervals over the first 14 days and on
day 70 (Figures 2–5).
Weight gain. Individual S rats gained 4–6 g on day 1, but the
average, which was 3.2±0.2 g day–1 prior to starting the
HFD, was stable at B3.0 g day–1 over the initial 14 days
(Figure 2). In contrast, mean RWG in OM animals increased
to 5.5 g day–1 over the initial 14 days of fat feeding, although
with much day-to-day variability. Thus, RWG in OM peaked
at 8.9±0.7 g day–1 on day 2, with individual rats gaining
p10.5 g on that day. It then fell by 50% by days 6–9 and to
baseline on day 70 (Figure 2). All values except day 70 were
significantly greater than baseline.
12
10
8
6
4
2
0
Rat
e of
Wei
ght G
ain
(g/d
ay)
Days on Diet
OM
S5B/PI
0 1 2 6-9 14 70
Figure 2 Rates of weight gain (g per day) in fat-fed Osborne–Mendel (OM)
and S5B/Pl rats on specific days during protocol 3. Data represent differences
in weight measurements made on the day stipulated and 24 h earlier. Results
are mean±s.e. Values in OM rats on days 1 (Po0.025), 2 (Po0.001), 6–9
(Po0.005) and 14 (Po0.01) are all significantly greater than those at baseline.
Adipocyte fatty acid uptake in fat-fed ratsO Petrescu et al
857
International Journal of Obesity
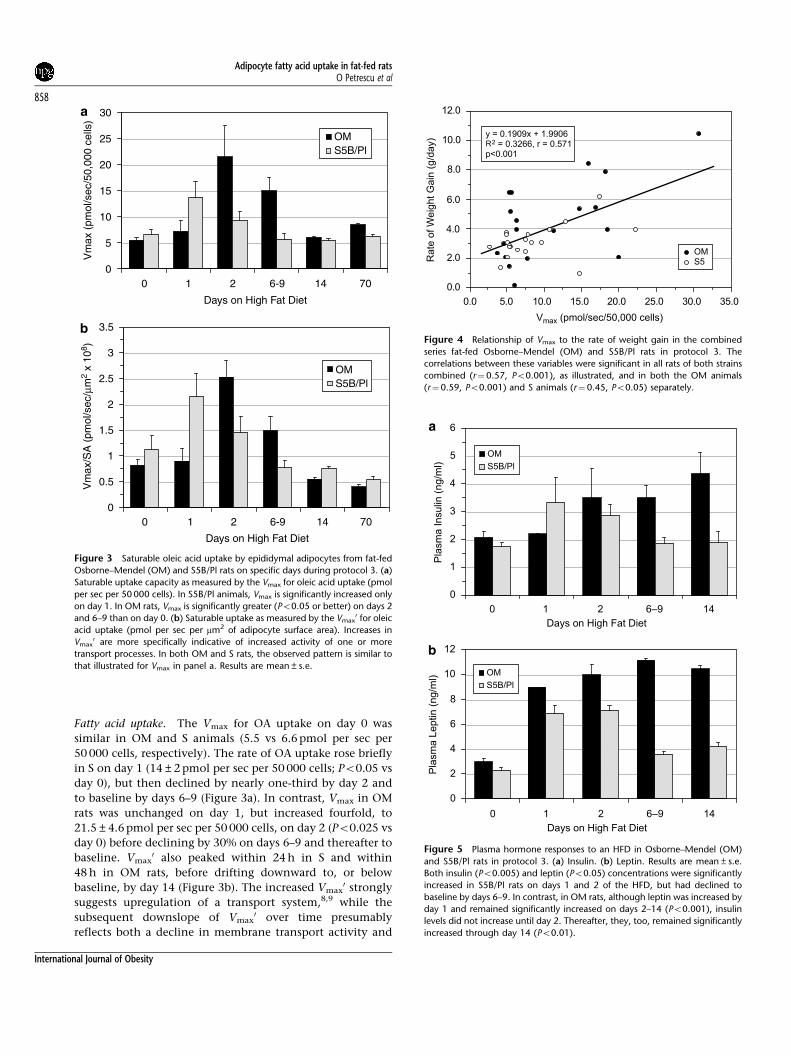
Fatty acid uptake. The Vmax for OA uptake on day 0 was
similar in OM and S animals (5.5 vs 6.6 pmol per sec per
50 000 cells, respectively). The rate of OA uptake rose briefly
in S on day 1 (14±2 pmol per sec per 50 000 cells; Po0.05 vs
day 0), but then declined by nearly one-third by day 2 and
to baseline by days 6–9 (Figure 3a). In contrast, Vmax in OM
rats was unchanged on day 1, but increased fourfold, to
21.5±4.6 pmol per sec per 50 000 cells, on day 2 (Po0.025 vs
day 0) before declining by 30% on days 6–9 and thereafter to
baseline. Vmax0 also peaked within 24 h in S and within
48 h in OM rats, before drifting downward to, or below
baseline, by day 14 (Figure 3b). The increased Vmax0 strongly
suggests upregulation of a transport system,8,9 while the
subsequent downslope of Vmax0 over time presumably
reflects both a decline in membrane transport activity and
Figure 5 Plasma hormone responses to an HFD in Osborne–Mendel (OM)
and S5B/Pl rats in protocol 3. (a) Insulin. (b) Leptin. Results are mean±s.e.
Both insulin (Po0.005) and leptin (Po0.05) concentrations were significantly
increased in S5B/Pl rats on days 1 and 2 of the HFD, but had declined to
baseline by days 6–9. In contrast, in OM rats, although leptin was increased by
day 1 and remained significantly increased on days 2–14 (Po0.001), insulin
levels did not increase until day 2. Thereafter, they, too, remained significantly
increased through day 14 (Po0.01).
OMS5B/Pl
OMS5B/Pl
30
25
20
15
10
5
0
Vm
ax (
pmol
/sec
/50,
000
cells
)
0 1 2 6-9 14 70
Days on High Fat Diet
3.5
3
2.5
2
1.5
1
0.5
00 1 2 6-9 14 70
Days on High Fat Diet
Vm
ax/S
A (
pmol
/sec
/µm
2 x
108 )
Figure 3 Saturable oleic acid uptake by epididymal adipocytes from fat-fed
Osborne–Mendel (OM) and S5B/Pl rats on specific days during protocol 3. (a)
Saturable uptake capacity as measured by the Vmax for oleic acid uptake (pmol
per sec per 50 000 cells). In S5B/Pl animals, Vmax is significantly increased only
on day 1. In OM rats, Vmax is significantly greater (Po0.05 or better) on days 2
and 6–9 than on day 0. (b) Saturable uptake as measured by the Vmax0 for oleic
acid uptake (pmol per sec per mm2 of adipocyte surface area). Increases in
Vmax0 are more specifically indicative of increased activity of one or more
transport processes. In both OM and S rats, the observed pattern is similar to
that illustrated for Vmax in panel a. Results are mean±s.e.
Figure 4 Relationship of Vmax to the rate of weight gain in the combined
series fat-fed Osborne–Mendel (OM) and S5B/Pl rats in protocol 3. The
correlations between these variables were significant in all rats of both strains
combined (r¼0.57, Po0.001), as illustrated, and in both the OM animals
(r¼0.59, Po0.001) and S animals (r¼ 0.45, Po0.05) separately.
Adipocyte fatty acid uptake in fat-fed ratsO Petrescu et al
858
International Journal of Obesity

a progressive increase in cell surface area. These results are
in contrast to those in protocol 1, in which Vmax0 in OM
declined on day 70 at which a small increase in Vmax was
overshadowed by a much larger increase in surface area.
Vmax was linearly correlated with RWG throughout the
study (Figure 4).
Insulin and leptin responses. Both plasma insulin and leptin
levels were similar in the two strains on day 0 (Figure 5). In S,
insulin subsequently doubled on day 1, declined somewhat
on day 2 and returned to baseline by days 6–9 (Figure 5a);
leptin was significantly elevated on days 1 and 2 (Po0.001)
and declined thereafter, although it still exceeded baseline
on day 14 (Po0.025) (Figure 5b). The parallel rise and
subsequent fall in Vmax, insulin and leptin concentrations in
S animals (Figures 3 and 5) resulted in highly significant
linear correlations between Vmax and insulin, and Vmax and
leptin during days 0–2 (insulin: r¼0.46, Po0.05; leptin:
r¼0.64, Po0.01), days 2–14 (insulin: r¼0.73, Po0.01;
leptin: r¼0.79; Po0.01) and over the entire period from
day 0 through day 14 (insulin: r¼0.52, Po0.01; leptin
r¼0.69, Po0.01). In contrast, in OM animals, Vmax, insulin
and leptin concentrations moved roughly in parallel only
during days 0–2. Both insulin and Vmax were essentially
unchanged on day 1, before increasing strikingly on day 2.
Thereafter Vmax declined toward baseline, while both insulin
and leptin remained elevated (Figures 3 and 5). Conse-
quently, correlations in OM between Vmax and insulin
concentration, and Vmax and leptin from day 0 through
day 2 were both statistically significant (r¼0.53, Po0.05 and
r¼0.75, Po0.01, respectively). Subsequently, from days
2–14, correlations between Vmax and insulin (r¼0.28), and
Vmax and leptin (r¼0.08) were no longer significant.
Adipocyte measurements. On day 0, combined weights of
the two epididymal fat pads were similar in OM and S
(Figure 6a), but consistently more cells were recovered in
OM (12.7±2.5106) than S (9.1±1.0106). After the
initiation of the HFD, cell counts remained constant over
the next 14 days, but adipocytes increased in size (data not
shown), and fat pad weights increased in both strains
(Figure 6a) and were highly correlated with changes in body
weight (r¼0.9790, Po0.001) (Figure 6b) and with the total
volume of adipocytes (the product of the number of isolated
cells and their mean cell volume) (r¼0.838, Po0.001).
While the numbers of cells recovered during days 0–14
remained unchanged in both strains, the weight of the fat
pads increased by 49% from baseline in the S group
(Po0.005) but nearly threefold in OM (Po0.001) during
this period (Figure 6a). From days 14–70, epididymal fat-pad
growth remained much greater in OM than S (Figure 6a). The
number of cells recovered in OM between days 14 and 70
remained essentially constant (12.1±1.7106), but recovery
of fat-pad cells in S increased 26% to 11.5±2.8106. While
adipocyte numbers were thus equivalent at day 70, the
average volume of an OM adipocyte, 812 pl, was 2.75 times
that in S (295 pl).
Discussion
Although obesity can be defined as the excessive accumula-
tion of LCFA in the form of TG within adipocytes, the
importance of fatty acid disposition to obesity and its
comorbidities, including the entire metabolic syndrome,
was long underestimated. This largely reflected the long-held
view that the movement of LCFA into and out of cells was an
entirely passive, unregulatable and therefore uninteresting
process. Multiple laboratories have now shown that LCFAs
enter cells by both a facilitated, regulatable, protein-
mediated transport process and diffusion.3–5,28–39 At the
unbound LCFA concentrations that commonly exist in most
mammals, X90% of LCFA uptake into key tissues occurs by
Figure 6 (a) Weights of epididymal fat pads over time in fat-fed Osborne–
Mendel (OM) and S5B/Pl rats in protocol 3. Results are mean±s.e. (b)
Correlation between body weight and total epididymal fat pad weights over
time in fat-fed OM and S5B/Pl rats in protocol 3. The illustrated correlation
with a third-order polynomial has a correlation coefficient of r¼0.9790
(Po0.001). It provides a visually better fit than a simple linear regression,
which nevertheless has a highly significant correlation coefficient of r¼ 0.876
(Po0.001).
Adipocyte fatty acid uptake in fat-fed ratsO Petrescu et al
859
International Journal of Obesity
the facilitated process.23,37–40 At least four proteins have
been proposed as LCFA transporters: plasma membrane fatty
acid-binding protein (FABPpm),32,37–39 fatty acid translocase
(FAT),30 the fatty acid transport polypeptide family
(FATP)41–43 and caveolin-1.44,45 While there is good evidence
supporting a role in LCFA transport for these proteins, there
are also unresolved issues that have led to persistent doubts
about each. While some or all of them probably do
participate in LCFA uptake in different tissues under
different conditions, it would not be surprising if entirely
new classes of LCFA transporters were discovered. Although
the nature of LCFA transporters is still debated, the existence
of LCFA uptake mechanisms besides diffusion seems well
established.
Osborne–Mendel and S rats are known to gain weight at
different rates on an HFD.19,20 The central hypothesis tested
in the current studies is that differences in the regulation of
saturable adipocyte LCFA uptake could explain these
differences in RWGs. The core data of this study suggest
that changes in the Vmax for adipocyte fatty acid uptake,
which in other settings has been shown to be tightly
correlated with expression of one or more putative LCFA
transporters,31,46 contribute significantly to changes in the
RWG in response to an HFD. It remains to explain what
underlies the observed differences in Vmax. More preliminary
data suggest (a) that differences in circulating insulin and
leptin responses to an HFD may explain the strain differ-
ences in saturable adipocyte LCFA uptake; and (b) that
different mechanisms of adipose tissue growth may con-
tribute to the differences in hormonal responses. Both issues
require more definitive study.
On the basis of studies in ob mice,7,9 which lack leptin,47
and Zucker fatty rats,6 with a defective leptin receptor,48,49
we proposed that insulin was an upregulator and leptin a
downregulator of adipocyte LCFA uptake.6,7,9 The former
suggestion was supported by strong correlations between
plasma insulin and the Vmax for adipocyte LCFA uptake in
obese and nonobese humans.8 While leptin is an insulin
counter-regulatory hormone in some settings,50 in others its
effects parallel those of insulin. Its precise role in LCFA
uptake is unclear.
In the present studies, Vmax and circulating insulin and
leptin in S animals rose and fell in parallel during the first 2
weeks of HFD feeding; Vmax was highly correlated with each
of the hormones. In contrast, in OM rats, insulin and leptin
concentrations correlated significantly with Vmax only for
the first 2 days, after which elevated insulin and leptin levels
persisted as Vmax returned to baseline. This suggests the
development of insulin resistance, and possibly also of leptin
resistance, in OM animals, within the first week of HFD
administration. It is also noteworthy that, in contrast to
their parallel increase in S animals on day 1 of the HFD, Vmax
and plasma insulin concentration in OM animals were both
unchanged on day 1, but increased together 24 h later. Thus,
we speculate that differences in hormonal regulation of
adipocyte LCFA uptake may underlie the different body
weight responses of OM and S rats to an HFD. Moreover,
these differences in hormonal responses, themselves, may be
related to different mechanisms of fat pad growth. While
adipocytes increased in size in both strains, the constancy of
adipocyte numbers in OM animals suggests that the increase
in fat pad weight was largely a consequence of cellular
hypertrophy, while the late increase in adipocytes in S
animals suggested, in addition, an appreciable degree of
hyperplasia. The resulting differences in adipocyte size
between strains could contribute to differences in produc-
tion of leptin and other adipokines.51
Another important observation is that responses to the
initiation of an HFD are not fixed, but rather evolve over
time despite continuation of the diet. Most papers on HFD
responses in these strains report data at a single time after
starting the diet. Our data suggest that the responses
observed depend critically on time at which measurements
are made, and that regulatory responses may obliterate
important early effects by day 14.
Hormonal responses to HFDs have been studied exten-
sively in these strains, although their effects were thought
to be mediated mainly by changes in caloric intake or
energy expenditure. Our hypothesis, supported by the
current studies, is that these responses impact on adiposity
by altering LCFA partitioning,8 with OM rats storing an
increased proportion of available LCFA as TG in adipose
tissue. While many studies of the differences between OM
and S rats during fat feeding focused on leptin18,52–55 and
other hormones, neuropeptides and uncoupling proteins
(for example, 52, 55), they have not yet led to a clear
explanation for the differences in HFD responses.
We have proposed that the diverse neuroendocrine
signaling resulting from food-related stimuli converge on a
final common pathway that regulates adipocyte LCFA
uptake and sequestration, which we believe to be a major
control point for body adiposity.8 The present studies are
consistent with, but certainly do not prove, that hypothesis.
Detailed studies of the role of hormones and fat depot
growth in regulating LCFA uptake, of the transporters and
genes involved, and of changes in gene expression associated
with HFD responses, are planned.
Acknowledgements
This work was supported, in part, by Grants DK-23718,
DK-52401 and DK-72526 from the National Institute of
Diabetes, Digestive and Kidney Diseases of the National
Institutes of Health. Dr Carol Bodian developed the mixed
model used in our analysis of experimental growth curves.
References
1 Shrago E, Spennetta A, Gordon E. Fatty acid synthesis in humanadipose tissue. J Biol Chem 1969; 244: 2761–2766.
Adipocyte fatty acid uptake in fat-fed ratsO Petrescu et al
860
International Journal of Obesity

2 Delarue J, Magnan C. Free fatty acids and insulin resistance.Curr Opin Clin Nutr Metab Care 2007; 10: 142–148.
3 Stump DD, Fan X, Berk PD. Oleic acid uptake and binding by ratadipocytes define dual pathways for cellular fatty acid uptake.J Lipid Res 2001; 42: 509–520.
4 Kampf JP, Kleinfeld AM. Fatty acid transport in adipocytesmonitored by imaging intracellular free fatty acid levels. J BiolChem 2004; 279: 35775–35780.
5 Kleinfeld AM, Kampf JP, Lechene C. Transport of 13C-oleate inadipocytes measured using multi imaging mass spectrometry.J Am Soc Mass Spectrom 2004; 11: 1572–1580.
6 Berk PD, Zhou SL, Kiang CL, Stump D, Bradbury M, Isola LM.Uptake of long chain free fatty acids is selectively up-regulated inadipocytes of Zucker rats with genetic obesity and non-insulin-dependent diabetes mellitus. J Biol Chem 1997; 272: 8830–8835.
7 Berk PD, Zhou S, Kiang C, Stump DD, Fan X, Bradbury MW.Selective up-regulation of fatty acid uptake by adipocytescharacterizes both genetic and diet-induced obesity in rodents.J Biol Chem 1999; 274: 28626–28631.
8 Petrescu O, Fan X, Gentileschi P, Hossain S, Bradbury M, GagnerM et al. Long-chain fatty acid uptake is upregulated in omentaladipocytes from patients undergoing bariatric surgery for obesity.Int J Obes (Lond) 2005; 29: 196–203.
9 Fan X, Bradbury MW, Berk PD. Leptin and insulin modulatenutrient partitioning and weight loss in ob/ob mice throughregulation of long-chain fatty acid uptake by adipocytes. J Nutr2003; 133: 2707–2715.
10 Unger RH, Zhou YT. Lipotoxicity of beta-cells in obesity and inother causes of fatty acid spillover. Diabetes 2001; 50 (Suppl 1):S118–S121.
11 Listenberger LL, Ory DS, Schaffer JE. Palmitate-induced apoptosiscan occur through a ceramide-independent pathway. J Biol Chem2001; 276: 14890–14895.
12 Unger RH. Lipotoxic diseases. Annu Rev Med 2002; 53: 319–336.13 Unger RH. Minireview: weapons of lean body mass destruction:
the role of ectopic lipids in the metabolic syndrome. Endocrinology2003; 144: 5159–5165.
14 Borradaile NM, Schaffer JE. Lipotoxicity in the heart. CurrHypertens Rep 2005; 7: 412–417.
15 Lee Y, Naseem RH, Park BH, Garry DJ, Richardson JA, Schaffer JEet al. Alpha-lipoic acid prevents lipotoxic cardiomyopathy in acylCoA-synthase transgenic mice. Biochem Biophys Res Commun2006; 344: 446–452.
16 Borradaile NM, Han X, Harp JD, Gale SE, Ory DS, Schaffer JE.Disruption of endoplasmic reticulum structure and integrity inlipotoxic cell death. J Lipid Res 2006; 47: 2726–2737.
17 Surwit RS, Feinglos MN, Rodin J, Sutherland A, Petro AE, OparaEC et al. Differential effects of fat and sucrose on the developmentof obesity and diabetes in C57BL/6J and A/J mice. Metabolism1995; 44: 645–651.
18 Bergen HT, Mizuno T, Taylor J, Mobbs CV. Resistance todiet-induced obesity is associated with increased proopio-melanocortin mRNA and decreased neuropeptide Y mRNA inthe hypothalamus. Brain Res 1999; 851: 198–203.
19 Osborne TB, Mendel LB. The growth of rats upon diets of isolatedfood substances. Biochem J 1916; 10: 534–538.
20 Schemmel R, Mickelsen O, Gill JL. Dietary obesity in rats: bodyweight and body fat accretion in seven strains of rats. J Nutr 1970;100: 1041–1048.
21 Cushman SW, Wardzala LJ. Potential mechanism of insulinaction on glucose transport in the isolated rat adipose cell.Apparent translocation of intracellular transport systems to theplasma membrane. J Biol Chem 1980; 255: 4758–4762.
22 Di Girolamo M, Mendlinger S, Fertig JW. A simple method todetermine fat cell size and number in four mammalian species.Am J Physiol 1971; 221: 850–858.
23 Schwieterman W, Sorrentino D, Potter BJ, Rand J, Kiang CL,Stump D et al. Uptake of oleate by isolated rat adipocytes ismediated by a 40-kDa plasma membrane fatty acid binding
protein closely related to that in liver and gut. Proc Natl Acad SciUSA 1988; 85: 359–363.
24 Berman M, Weiss MF. User’s Manual for SAAM. US GovernmentPrinting Office: Washington, DC, 1967.
25 SAAM II User’s Guide. SAAM Institute: Seattle, WA, 1997, 1998.26 Snedecor GW, Cochran WG. Statistical Methods. Iowa State
University Press: Ames Iowa, 1967.27 Brown H, Prescott R. Applied Mixed Models in Medicine. John Wiley
& Sons Ltd: Chichester, 1999.28 Abumrad NA, Perkins RC, Park JH, Park CR. Mechanism of long
chain fatty acid permeation in the isolated adipocyte. J Biol Chem1981; 256: 9183–9191.
29 Abumrad NA, Park JH, Park CR. Permeation of long-chain fattyacid into adipocytes. Kinetics, specificity, and evidence forinvolvement of a membrane protein. J Biol Chem 1984; 259:8945–8953.
30 Abumrad NA, el-Maghrabi MR, Amri EZ, Lopez E, Grimaldi PA.Cloning of a rat adipocyte membrane protein implicated inbinding or transport of long-chain fatty acids that is inducedduring preadipocyte differentiation. Homology with humanCD36. J Biol Chem 1993; 268: 17665–17668.
31 Berk PD, Stump DD. Mechanisms of cellular uptake of long chainfree fatty acids. Mol Cell Biochem 1999; 192: 17–31.
32 Bradbury MW, Berk PD. Cellular uptake of long chain free fattyacids: the structure and function of plasma membrane fatty acidbinding protein. Adv Mol Cell Biol 2004; 33: 47–81.
33 Cupp D, Kampf JP, Kleinfeld AM. Fatty acid–albumin complexesand the determination of the transport of long chain free fattyacids across membranes. Biochemistry 2004; 43: 4473–4481.
34 Glatz JF, van Nieuwenhoven FA, Luiken JJ, Schaap FG, van derVusse GJ. Role of membrane-associated and cytoplasmic fattyacid-binding proteins in cellular fatty acid metabolism. Prosta-glandins Leukot Essent Fatty Acids 1997; 57: 373–378.
35 Luiken JJ, Turcotte LP, Bonen A. Protein-mediated palmitateuptake and expression of fatty acid transport proteins in heartgiant vesicles. J Lipid Res 1999; 40: 1007–1016.
36 Luiken JJ, Glatz JF, Bonen A. Fatty acid transport proteinsfacilitate fatty acid uptake in skeletal muscle. Can J Appl Physiol2000; 25: 333–352.
37 Stremmel W, Berk PD. Hepatocellular influx of [14C]oleate reflectsmembrane transport rather than intracellular metabolism orbinding. Proc Natl Acad Sci USA 1986; 83: 3086–3090.
38 Stremmel W, Strohmeyer G, Berk PD. Hepatocellular uptake ofoleate is energy dependent, sodium linked, and inhibited by anantibody to a hepatocyte plasma membrane fatty acid bindingprotein. Proc Natl Acad Sci USA 1986; 83: 3584–3588.
39 Sorrentino D, Stump D, Potter BJ, Robinson RB, White R, KiangCL et al. Oleate uptake by cardiac myocytes is carrier mediatedand involves a 40-kD plasma membrane fatty acid bindingprotein similar to that in liver, adipose tissue, and gut. J ClinInvest 1988; 82: 928–935.
40 Sorrentino D, Robinson RB, Kiang CL, Berk PD. At physiologicalbumin/oleate concentrations oleate uptake by isolatedhepatocytes, cardiac myocytes, and adipocytes is a saturablefunction of the unbound oleate concentration. Uptake kineticsare consistent with the conventional theory. J Clin Invest 1989;84: 1325–1333.
41 Schaffer JE, Lodish HF. Expression cloning and characterization ofa novel adipocyte long chain fatty acid transport protein. Cell1994; 79: 427–436.
42 Hirsch D, Stahl A, Lodish HF. A family of fatty acid transportersconserved from mycobacterium to man. Proc Natl Acad Sci USA1998; 95: 8625–8629.
43 Stahl A, Gimeno RE, Tartaglia LA, Lodish HF. Fatty acid transportproteins: a current view of a growing family. Trends EndocrinolMetab 2001; 12: 266–273.
44 Pohl J, Ring A, Stremmel W. Uptake of long-chain fatty acids inHepG2 cells involves caveolae: analysis of a novel pathway. J LipidRes 2002; 43: 1390–1399.
Adipocyte fatty acid uptake in fat-fed ratsO Petrescu et al
861
International Journal of Obesity
45 Pohl J, Ring A, Ehehalt R, Herrmann T, Stremmel W. Newconcepts of cellular fatty acid uptake: role of fatty acid transportproteins and of caveolae. Proc Nutr Soc 2004; 63: 259–262.
46 Berk PD, Zhou SL, Bradbury M, Stump D, Kiang CL, Isola LM.Regulated membrane transport of free fatty acids in adipocytes:role in obesity and non-insulin dependent diabetes mellitus.Trans Am Clin Climatol Assoc 1996; 108: 26–43.
47 Zhang Y, Proenca R, Maffei M, Barone M, Leopold L, FriedmanJM. Positional cloning of the mouse obese gene and its humanhomologue. Nature 1994; 372: 425–432.
48 Lee GH, Proenca R, Montez JM, Carroll KM, Darvishzadeh JG,Lee JI et al. Abnormal splicing of the leptin receptor in diabeticmice. Nature 1996; 379: 632–635.
49 Chua Jr SC, Chung WK, Wu-Peng XS, Zhang Y, Liu SM, Tartaglia Let al. Phenotypes of mouse diabetes and rat fatty due tomutations in the OB (leptin) receptor. Science 1996; 271: 994–996.
50 Remesar X, Rafecas I, Fernandez-Lopez JA, Alemany M. Is leptinan insulin counter-regulatory hormone? FEBS Lett 1997; 402:9–11.
51 Skurk T, Alberti-Huber C, Herder C, Hauner H. Relationshipbetween adipocyte size and adipokine expression and secretion.J Clin Endocrinol Metab 2007; 92: 1023–1033.
52 Schaffhauser AO, Madiehe AM, Braymer HD, Bray GA, York DA.Effects of a high-fat diet and strain on hypothalamic geneexpression in rats. Obes Res 2002; 10: 1188–1196.
53 Madiehe AM, Schaffhauser AO, Braymer DH, Bray GA,York DA. Differential expression of leptin receptor in high- andlow-fat-fed Osborne–Mendel and S5B/Pl rats. Obes Res 2000; 8:467–474.
54 Lin X, Chavez MR, Bruch RC, Kilroy GE, Simmons LA, Lin Let al. The effects of a high fat diet on leptin mRNA, serum leptinand the response to leptin are not altered in a rat strainsusceptible to high fat diet-induced obesity. J Nutr 1998; 128:1606–1613.
55 York DA, Singer L, Thomas S, Bray GA. Effect of topiramate onbody weight and body composition of Osborne–Mendel rats fed ahigh-fat diet: alterations in hormones, neuropeptide, anduncoupling-protein mRNAs. Nutrition 2000; 16: 967–975.
Adipocyte fatty acid uptake in fat-fed ratsO Petrescu et al
862
International Journal of Obesity
Copyright © 2022 FDOKUMEN