Nuclear Receptor Cofactors in PPARγ-Mediated Adipogenesis and Adipocyte Energy Metabolism
Upload
independentCategory
view
4download
0
1
18F-FDG PET/CT Monitoring of β3 Agonist-Stimulated
Brown Adipocyte Recruitment in White Adipose Tissue
(Short Running Head: FDG PET Monitors WAT Browning)
Jin-Won Park, Kyung-Ho Jung, Jin Hee Lee, Cung Hoa Thien Quach,
Seung-Hwan Moon, Young Seok Cho, Kyung-Han Lee
Department of Nuclear Medicine, Samsung Medical Center,
Sungkyunkwan University School of Medicine
Corresponding Author : Kyung-Han Lee, M.D
Department of Nuclear Medicine, Samsung Medical Center,
50 Ilwon-dong, Gangnam-gu, Seoul 135-710, Korea
Tel : 82-2-3410-2630; Fax : 82-2-3410-2639; [email protected]
First Author: Jin-Won Park, M.S. (currently in training)
Department of Nuclear Medicine, Samsung Medical Center,
50 Ilwon-dong, Gangnam-gu, Seoul 135-710, Korea
Tel : 82-2-3410-2648; Fax : 82-2-3410-2639; [email protected]
This work was supported by Samsung Biomedical Research Institute Grant # SMX1131891.
Journal of Nuclear Medicine, published on December 18, 2014 as doi:10.2967/jnumed.114.147603by on June 19, 2016. For personal use only. jnm.snmjournals.org Downloaded from
2
ABSTRACT
There is rising interest in recruitment of brown adipocytes into white adipose tissue (WAT) as a
means to augment energy expenditure for weight reduction. We thus investigated the potential of 18F-
FDG uptake as an imaging biomarker that can monitor the process of WAT browning. Methods:
C57BL/6 mice were treated daily with the β3 agonist CL316,243, while controls received saline. 18F-
FDG micro-PET/CT was serially performed at 1 h after CL316,243 injection. Following sacrifice,
interscapular brown adipose tissue (BAT) and WAT depots were extracted, weighed and measured for
18F-FDG uptake. Tissues underwent immunostaining, and UCP1 content was quantified by Western
blotting. Results: PET/CT showed very low 18F-FDG uptake in both BAT and inguinal WAT at
baseline. BAT uptake was substantially increased by a single stimulation with CL316,243. Uptake in
inguinal WAT was only modestly elevated by the first stimulation, but uptake gradually increased to
BAT level by prolonged stimulation. Ex-vivo measurements recapitulated the PET findings, and
measured 18F-FDG uptakes in other WAT depots were similar to inguinal WAT. WAT browning by
prolonged stimulation was confirmed by a substantial increase of UPC1, COX4 and PRDM16 staining
as markers brown adipocytes. UCP1 content, which served as a measure for extent of browning, was
low in baseline inguinal WAT but linearly increased over 10 days of CL316,243 injection. Finally,
image-based and ex vivo measured 18F-FDG uptake in inguinal WAT correlated well with UCP1
content. Conclusions: 18F-FDG PET/CT has the capacity to monitor brown adipocyte recruitment into
WAT depots in vivo, and may thus be useful for screening the efficacy of strategies to promote WAT
browning.
Key words: White adipose tissue, Brown adipose tissue, 18F-FDG, PET, UCP-1, Beige cell
by on June 19, 2016. For personal use only. jnm.snmjournals.org Downloaded from
3
INTRODUCTION
Subcutaneous and visceral white adipose tissue (WAT) contributes to obesity by storing excess
energy as intracellular lipid (1,2). By contrast, brown adipose tissue (BAT) can have a negative
influence on weight gain by dissipating energy as heat (3,4). This thermoregulatory response is
mediated through norepinephrine-activated β3 adrenergic receptor (β3AR) signaling. The exciting
recent revelation that functional BAT is present not only in animals and young children but also in
human adults (5,6) has fueled attempts to exploit its energy-consuming property to counter obesity
(7,8). Unfortunately, however, obese patients have insufficient amounts of BAT, limiting the value of
constitutive BAT for weight reduction (9).
On the other hand, obese subjects have abundant amounts WAT. It has recently become known that
WAT can recruit clusters of adipocytes with brown-like phenotype. This process, called WAT
browning, can be seen in mice stimulated by prolonged cold exposure or by β3AR agonists as a
mimetic of cold stress (10,11). Brown-like cells recruited by WAT browning are referred to as ‘beige’
(pale brown) adipocytes (12-14). Based on these findings, there is rising interest on modulating the
metabolic characteristics of WAT through beige cell recruitment to treat obesity. A particular
attractiveness of this strategy is that it proposes to convert a fat-storing tissue into one that burns
calories.
However, several questions need to be answered before targeting of WAT browning for weight
reduction can be realized. For example, it is not known to what extent WAT can convert to beige cells
or how various depots differ in this capacity. Furthermore, a method to evaluate the thermogenic
impact of new drug candidates and allow a better understanding of the factors involved in optimal
WAT browning is required. The current standard method for assessing WAT browning in animal
models is based on invasive tissue sampling for histological or immunological detection of brown
adipocyte-specific biomarkers, and the contribution of WAT browning on thermogenesis and systemic
metabolism has relied on indirect inference from tissue characteristics.
by on June 19, 2016. For personal use only. jnm.snmjournals.org Downloaded from
4
As such, the ability to directly image energy consumption of WAT in living subjects may allow a
better understanding of the mechanism of beige adipocyte recruitment and help facilitate the
development of new candidate drugs. Visualization of heat radiation using infrared cameras is not a
good measure of WAT thermogenesis due to dependence on thermal conductance, insulation and
blood flow. Positron emission tomography-computed tomography (PET-CT) with 18F-
fluorodeoxyglucose (18F-FDG) can readily image acutely activated brown adipocytes that have
heightened glucose utilization for thermogenesis (5,6). However, such studies to date have been
mostly limited to acute BAT activation. Although β3AR stimulation has recently been shown to
increase 18F-FDG uptake in WAT of rodents (15.16), whether the level of 18F-FDG uptake has
sufficient accuracy to faithfully represent the magnitude of WAT browning has not been properly
investigated. If 18F-FDG can be shown to be a reliable biomarker, PET-CT imaging could help foster
the in vivo translation of recent molecular discoveries related to WAT browning, and may provide
insight on how obesity could be treated by modifying WAT metabolism. In this study, we thus
investigated the ability of 18F-FDG PET-CT to monitor and quantify recruitment of beige cells into
WAT depots of living mice by prolonged simulation with the selective β3AR agonist CL316,243.
by on June 19, 2016. For personal use only. jnm.snmjournals.org Downloaded from
5
MATERIALS AND METHODS
Reagents and Cells
The β3 adrenoceptor agonist, CL316,243 was from Sigma-Aldrich. Normal goat serum, 3,3'-
diaminobenzidine (DAB), chromogen solution, and citrate buffer were from Dako. Enhanced
chemiluminescence kit was from Pierce, Rabbit polyclonal antibodies against glucose transporter 4
(GLUT4), uncoupling protein 1 (UCP1), and cytochrome c oxidase 4 (COX4) were from Abcam.
Rabbit polyclonal antibody against PR domain containing 16 (PRDM16) was from Santa Cruz Biotech,
rabbit monoclonal antibody against hexokinase-II was from Cell Signaling Technology, and HRP-
labeled polymer conjugated antibody against rabbit IgG was from Dako. Wild-type male C57BL/6
mice (8 week; 21 g) were from Orient Bio.
Animal Preparation and CL316,243 Treatment
All animal experiments were in accordance with the National Institute of Health Guide for the Care
and Use of Laboratory Animals and approved by the Institutional Animal Care and Use Committee.
Mice were housed at a constant room temperature (RT) of 23°C with food and water given ad libitum,
and were fed a standard diet that contains 62.1% carbohydrate, 24.7% protein, and 13.2% fat. Each
morning, animals were intra-peritoneally injected with 1 mg/kg CL316,243 (n = 16) or saline
(controls; n = 8). PET/CT imaging was serially performed at baseline (day -1) and on days 1, 4, 7, and
10 of treatment.
18F-FDG Micro-PET/CT Acquisition and Image Analysis
Mice were fasted for 5 h prior to PET/CT studies. At 1 h after injection with CL316,243 or saline,
animals were tail vein injected with 11.1 MBq of 18F-FDG. Imaging was performed 1 h later under
isoflurane anesthesia, using a micro-PET/CT scanner (Inveon; Siemens) without respiratory gating.
by on June 19, 2016. For personal use only. jnm.snmjournals.org Downloaded from

6
Acquisition of non-enhanced CT images was followed by emission PET imaging. Care was taken to
maintain the mice in an environment of 23 to 25 °C.
On non-attenuation corrected tomographic PET/CT fusion images, polygonal regions of interest
(ROIs) were drawn on interscapular BAT on sagittal slices, and inguinal WAT on coronal slices.
Circular ROIs were placed in the left lung as background activity. From each ROI, mean standard
uptake values (SUVs) and target-to-background (T/B) ratios were measured as indices of 18F-FDG
uptake.
Ex Vivo Quantification of 18F-FDG Uptake in BAT and WAT Depots
Subsets of animals were sacrificed on day 1, 4, 7 or 10 (n = 4 each), immediately after PET/CT
imaging. Inter-scapular BAT and WAT depots were extracted. Retroperitoneal and mesenteric WAT
were from the abdominal cavity delimited by serous membranes divided into retroperitoneal and
intraperitoneal areas. Epididymal WAT was from the abdomino-pelvic depot. Tissues were weighed
and measured for 18F-FDG activity on a high energy gamma counter (Parkin Elmer). Uptake levels
were expressed as % of injection activity per gram of tissue (%IA/g). Tissues were fast-frozen until
use for immune staining and western blots.
Immune Staining for Brown Adipocyte Markers
Tissues fixed in 4% paraformaldehyde were embedded in paraffin and microsectioned in 5 μm
thickness. The sections were then deparaffinized in xylene and rehydrated in phosphate-buffered
saline (PBS, pH 7.4). After heat-induced epitope retrieval with citrate buffer (pH 6.0) for 3 min at
121°C, endogenous peroxidase was blocked with 3% hydrogen peroxide in PBS for 10 min at RT.
Sections treated with blocking solution for 20 min at RT to block nonspecific binding were were
incubated with antibodies against UCP1 (1:100), PRDM16 (1:200), COX4 (1:200), GLUT-4 (1:400)
or hexokinase-II (1:50) for 60 min at RT. PBS washed sections were incubated for 30 min at RT with
HRP-conjugated antibodies against rabbit IgG. The color reaction was developed using DAB
by on June 19, 2016. For personal use only. jnm.snmjournals.org Downloaded from
7
substrate-chromogen solution, and sections were lightly counterstained with Mayer’s hematoxylin
before dehydration and mounting.
Quantitation of Brown Adipocytes by Mitochondrial UCP1 Content
Tissues minced in cold buffer containing 0.25 M sucrose and 5.0 mM N-Tris
(hydroxlymethyl)methyl-2-amino ethanesulfonic acid buffer (pH 7.2) were homogenized in a Dounce
homogenizer. After tissue debris removal, the supernatant was centrifuged at 10,000g for 10 min at
4°C. The mitochondrial pellet was re-suspended in buffer containing 20 mM Tris (pH 8.0), 1 mM
EDTA, 100 mM NaCl, 0.9% sodium cholate, and 1% Triton X-100.
Mitochondria were lysed by incubation for 30 min on ice followed by freeze-thawing.
Mitochondrial protein was separated by a 12% sodium dodecyl sulfate-polyacrylamide gel
electrophoresis (SDS-PAGE), and transferred to a PVDF membrane. Following blocking, membranes
were incubated overnight at 4°C with anti-UCP1 (1:1000) or anti-COX4 antibody (1:1000) in TBST
(50 mM Tris, pH 7.5, 150 mM NaCl, 0.05% Tween-20) containing 5% skim milk. After washing three
times for 10 min with TBST, the membrane was incubated with secondary antibodies for 1 h at RT.
Immune reactive protein was detected with an enhanced chemiluminescence kit and measured for
band densities.
Statistical Analysis
All data are shown as means ± SD. Comparison of values between multiple groups were performed
by ANOVA with Tukey-Kramer post-hoc tests. Correlation was determined by linear regression
analysis. P values < 0.05 were considered significant.
by on June 19, 2016. For personal use only. jnm.snmjournals.org Downloaded from
8
RESULTS
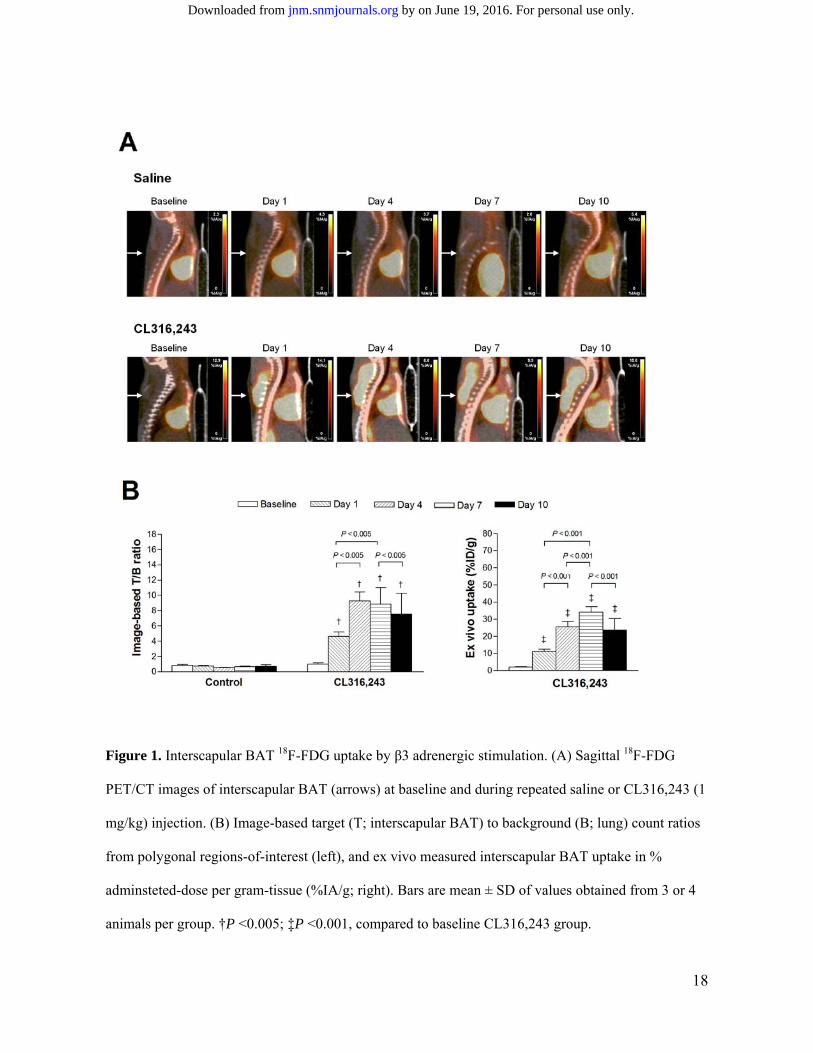
Acute Stimulation of Interscapular BAT 18F-FDG Uptake
PET/CT images of interscapular fat showed no visible 18F-FDG uptake at baseline, but a single
dose of CL316,243 stimulated an acute and prominent enhancement of 18F-FDG uptake and this
finding recurred following each dose of CL316,243 for 10 days (Fig. 1A). Image analysis showed that
T/B ratio of interscapular BAT was < 1 at baseline, but was markedly increased to 4.6 ± 1.2 only 1 h
after the first CL316,243 dose (Fig. 1B). Interestingly, the ratio further increased on day 4 of
CL316,243 injection. Image analysis using mean SUV showed nearly identical results with an increase
from 0.7 ± 0.2 at baseline to 4.0 ± 1.3 at day 1, 5.6 ± 1.2 at day 4, 5.6 ± 1.8 at day 7, and 5.1 ± 3.0 at
day 10. Ex vivo measurement of extracted tissue largely recapitulated the PET findings. Hence, ex
vivo 18F-FDG uptake was markedly increased from 2.1 ± 0.7 at baseline to 11.3 ± 2.5 %IA/gm by the
first CL316,243 dose, and further increased to 25.6 ± 6.2 and 34.1 ± 5.7 %IA/gm on days 4 and 7,
respectively. Uptake on day 10 (23.8 ± 11.5 %IA/gm) returned to a level comparable to that on day 7
(Fig. 1B).
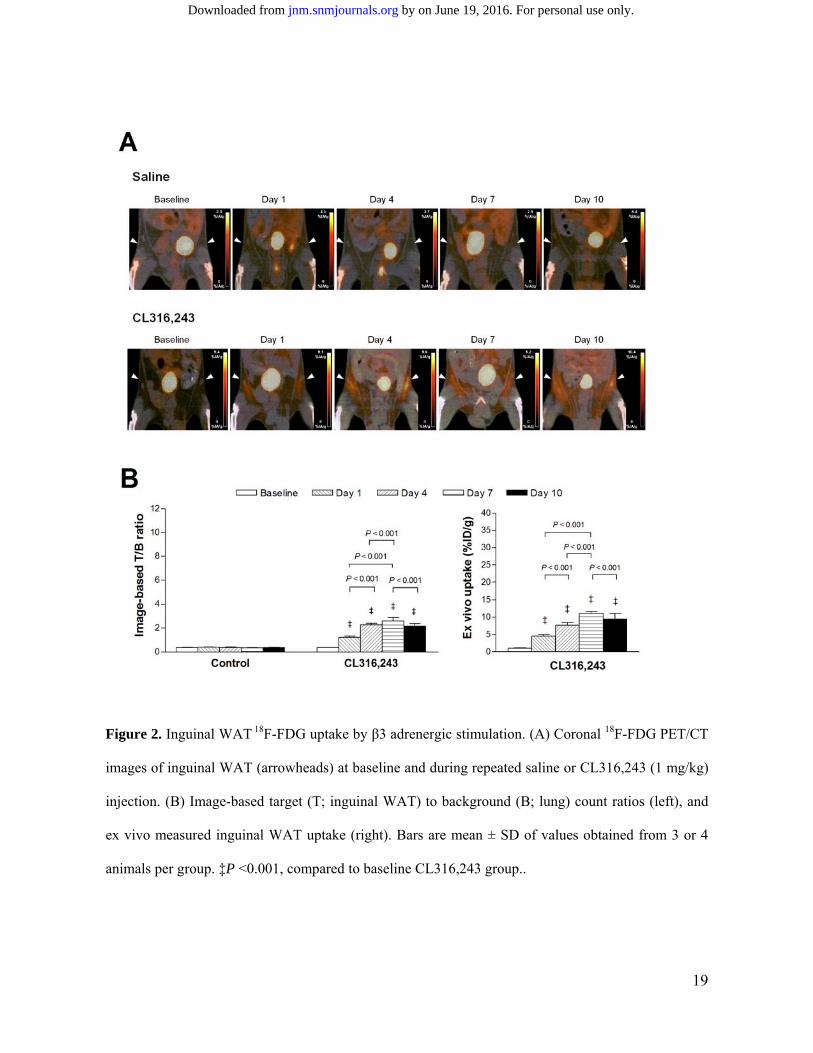
Prolonged Stimulation Increases WAT 18F-FDG Uptake
PET/CT images of inguinal WAT also showed no visible 18F-FDG uptake at baseline or after saline
injections (Fig. 2A). Unexpectedly, this tissue also demonstrated increased 18F-FDG uptake by a single
CL316,243 dose, although the magnitude was only modest compared to that of BAT. Stimulated
uptake gradually became stronger with repeated CL316,243 doses (Fig. 2A). On image analysis, T/B
ratio of inguinal WAT gradually increased from 0.4 ± 0.0 at baseline to 1.2 ± 0.2 on day 1, 2.3 ± 0.2
on day 4, and 2.6 ± 0.5 on day 7 (Fig. 2B). The ratio at day 10 day (2.2 ± 0.4) was similar to that at
day 4. Again, mean SUV levels showed nearly identical results with an increase from 0.3 ± 0.0 at
baseline to 1.1 ± 0.3 at day 1, 1.4 ± 0.3 at day 4, 1.7 ± 0.1 at day 7, and 1.5 ± 0.3 at day 10. Ex vivo
measurements largely mirrored the PET image findings (Fig. 2B).
by on June 19, 2016. For personal use only. jnm.snmjournals.org Downloaded from
9
Epididymal and visceral WAT were evaluated by ex vivo measurements for 18F-FDG uptake, and
displayed temporal patterns of gradually increased uptake by prolonged stimulation similar to inguinal
WAT (Supplement Fig. 1A). Uptake was greatest for mesenteric WAT, followed by retroperitoneal
WAT, and lowest for epididymal WAT (15.3 ± 2.4, 12.3 ± 0.7, and 0.7 ± 0.3 %IA/gm at day 7,
respectively). 18F-FDG uptake of BAT and WAT are compared side by side in supplement figure 1B.
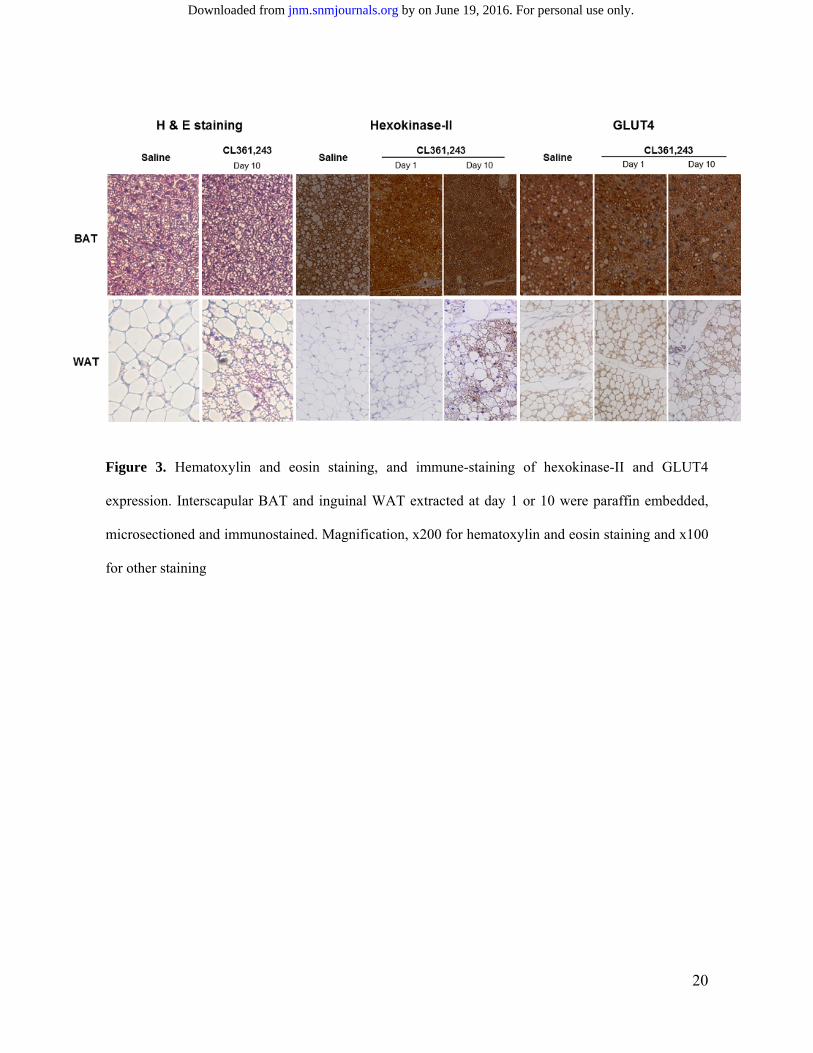
GLUT4 and Hexokinase-II Expression in Inguinal WAT
On identifying the mediator(s) for increased 18F-FDG uptake in by β3AR stimulation, BAT
displayed high expression of both Glut4 and hexokinase-II regardless of treatment (Fig.3). On the
other hand, inguinal WAT showed low expression of both proteins at baseline. However, hexokinase-
II expression was substantially increased after 10 days of stimulation, whereas GLUT4 expression was
unaffected (Fig. 3).
Evidence for Brown Adipocyte Recruitment in Inguinal WAT
Inspection of hematoxylin and eosin stained tissue sections under a light microscope showed that
interscapular BAT was filled with small brown adipocytes containing multiple small lipid droplets. In
contrast, baseline inguinal WAT consisted of large round white adipocytes with a single massive lipid
droplet. Following 10 days of CL316,243 injection, however, there was substantially increased
numbers of cells with the brown adipocyte-like features (Fig. 3).
More compelling evidence of WAT browning was obtained by staining for UCP1, a thermogenic
protein present exclusively in brown adipocytes. BAT showed intense UCP1 staining on abundant
brown adipocytes regardless of treatment (Fig.4). Inguinal WAT showed very few UCP1 positive cells
at baseline, which substantially increased following prolonged stimulation (Fig. 4). WAT browning
was further evidenced by COX4 and PRDM16 staining. Again inguinal WAT showed very few
positive cells at baseline, whereas the number of COX4 and PRDM16 stained cells significantly
increased following prolonged stimulation (Fig. 5).
by on June 19, 2016. For personal use only. jnm.snmjournals.org Downloaded from
10
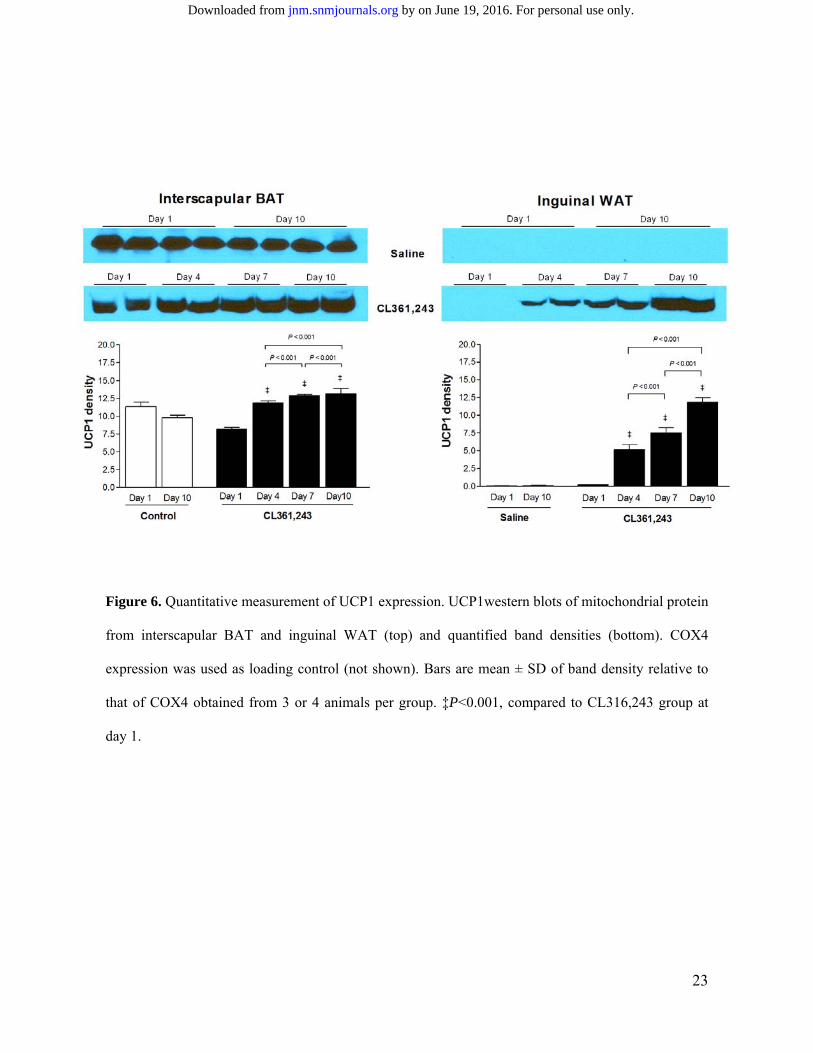
18F-FDG Uptake in Stimulated WAT Correlates to UCP1 Expression
Quantitative analysis by western blotting of mitochondria protein confirmed high UCP1 expression
level in BAT regardless of treatment, although there were further increases with repeated CL316,243
injection (Fig 6). Inguinal WAT showed undetectable levels of UCP1 level at baseline, but expression
level steadily and significantly increased over 10 days of repeated stimulation (Fig 6). At day 10,
UCP1 band intensity of WAT appeared similar to that of BAT, which indicates that equivalent
amounts of mitochondrial protein, rather than that of fat tissue, have similar UCP1 content.
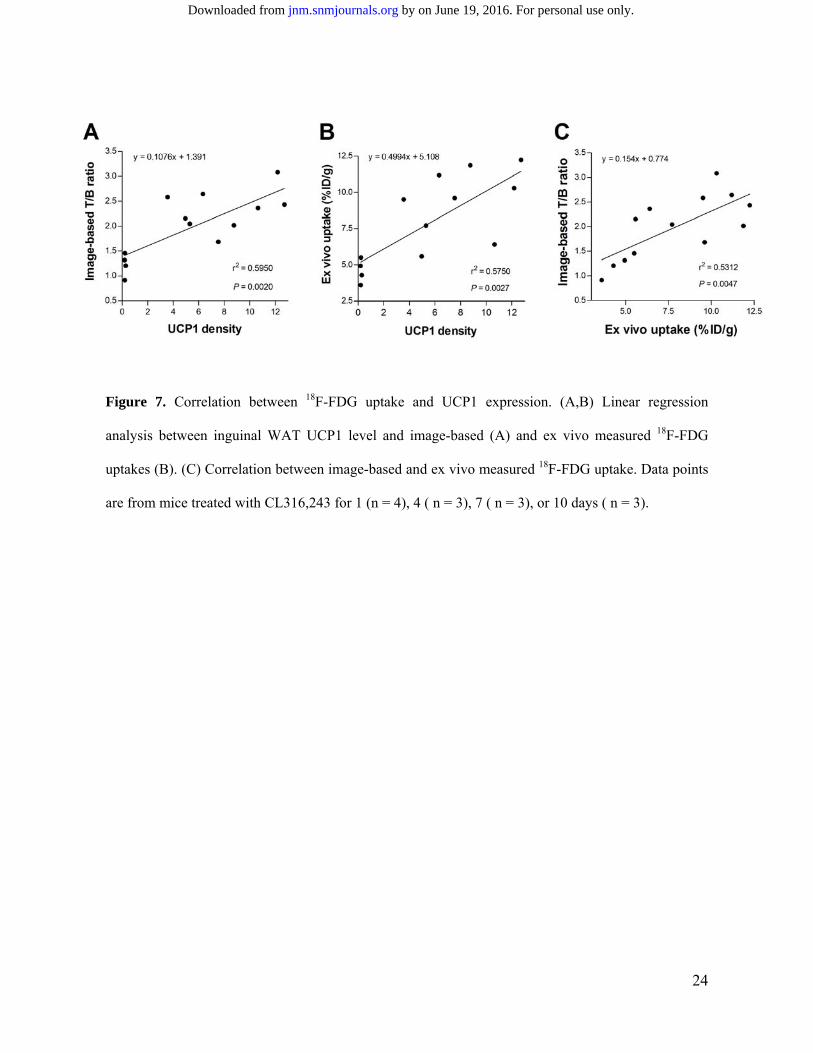
Finally, we evaluated whether 18F-FDG uptake could serve as a surrogate marker of WAT
browning as determined by UCP1 expression. As a result, regression analysis revealed good
correlation of WAT UCP1 expression level to PET image-based 18F-FDG uptake (Fig. 7A), as well as
to ex vivo measured uptake level (Fig. 7B). In vivo and ex vivo measurements of 18F-FDG uptake also
showed a close correlation (Fig. 7C).
by on June 19, 2016. For personal use only. jnm.snmjournals.org Downloaded from

11
DISCUSSION
The results of this study show that 18F-FDG uptake of interscapular BAT is prominently increased
by a single challenge with CL316,243, which is consistent with acute metabolic responses previously
observed in mice (17,18) and human subjects (5,6). Interscapular BAT thus served as a positive
control in our study to investigate the ability of 18F-FDG imaging to monitor beige cell recruitment
into WAT.
Inguinal WAT displayed a relatively modest increase of 18F-FDG uptake by the first CL316,243
dose, but uptake was gradually enhanced by repeated stimulations to finally reach a level comparable
to that of the first-dose BAT response. Mirbolooki MR et al previously reported that WAT of rats
show an increase of 18F-FDG uptake by a single dose of CL 316243 (15). In addition, Quarta C et al.
treated mice with CL316,2434 for 4 weeks and observed an increase of inguinal WAT 18F-FDG
uptake along with elevations of UCP-1 protein and PGC-1 mRNA expression (16). This finding
suggests a link between enhanced FDG uptake and WAT browning as a result of prolonged β3
stimulation. Our study sought to further expand on these findings by a more detailed investigation to
validate the potential of 18F-FDG uptake as an imaging biomarker of WAT browning.
If 18F-FDG uptake level reflects brown adipocyte recruitment, we would expect to observe a
gradual increase of uptake over repeated stimulations. Therefore, we first longitudinally explored the
time-course of how WAT 18F-FDG uptake is enhanced during daily injections of CL316,243, a
method previous shown to induce WAT browning over 10 days (14). Inguinal fat was selected for
image analysis because it is better delineated by PET/CT, constitutes the biggest and physiologically
most important WAT depot in mice, and is known to recruit beige adipocytes by adrenergic
stimulation (14,19). On prolonged stimulation, inguinal WAT displayed only a modest increase of 18F-
FDG uptake by the first dose, but the magnitude of stimulated 18F-FDG uptake gradually increased
with repeat doses. By day 7, stimulated uptake became comparable to the first-dose BAT response. Of
by on June 19, 2016. For personal use only. jnm.snmjournals.org Downloaded from

12
the major determinants of glucose uptake, prolonged CL316,243 stimulation significantly increased
inguinal WAT expression of hexokinase-II, but not Glut4.
As different WAT depots in mice are known to have unique biologic characteristics including
adipocyte size, protein content and metabolic enzyme level (20), they could respond differently to
browning stimulations. The beneficial effect of a drug would be limited if it induces browning only of
inguinal WAT. We therefore evaluated whether the metabolic response of inguinal WAT monitored
by 18F-FDG uptake was representative of other major WAT depots. As a result, although
retroperitoneal, mesenteric and epididymal WAT showed minor differences in 18F-FDG uptake levels,
all demonstrated a time-course of stimulated 18F-FDG uptake that largely paralleled that of inguinal
WAT. This suggests that WAT deposits from different sites may have similar roles in thermogenesis
in response to prolonged β3 stimulation.
To qualify as a useful imaging biomarker, it is crucial that quantitative image results demonstrate a
close correlation to the actual biologic effect-of-interest. We investigated this by comparing 18F-FDG
uptake levels to serial immunohistochemistry of brown adipocyte-specific makers as well as to UCP1
band intensities from western blots. Verification that metabolic response of inguinal WAT to
prolonged stimulation was indeed related to browning was provided not only by visual inspection of
morphologic changes but also by observing increased staining for UCP1, the most widely used brown
adipocyte-specific marker. UCP1, a mitochondrial transmembrane protein that mediates ATP
production-uncoupled transfer of protons from intermembrane space to mitochondrial matrix, is
present exclusively in brown adipocytes (3,4). We further confirmed WAT browning by increased
expression of 2 other major brown adipocyte markers, COX4 and RDM16. COX4 is a mitochondrial
cytochrome-c oxidase abundantly present in brown adipocytes, and is a marker for oxidative
phosphorylation-related gene expression (21). PRDM16 is a transcriptional complex that controls
brown adipocyte formation (22), whose overexpression has been linked to beige cell induction and
increased energy expenditure (23), supporting its critical role in WAT browning.
by on June 19, 2016. For personal use only. jnm.snmjournals.org Downloaded from
13
As a measure of the magnitude of WAT browning, we used UCP1 protein band intensities obtained
from western blots. These data showed high baseline UCP1 expression in interscapular BAT, as
expected. Daily CL316,243 injections further increased UCP1 levels, indicating an up-regulation of
UCP1 density per mitochondria, which would account for the enhancement of stimulated 18F-FDG
uptake in interscapular BAT by repeated stimulation that we observed. Inguinal WAT showed
undetectable levels of UCP1 at baseline, which raises the question of how 18F-FDG uptake in this
tissue was acutely increased, albeit modestly, by a single CL316,243 injection. Although white
adipocytes do not express UCP1, they do express β3ARs. In mice knocked out of these receptors,
agonist-induced thermogenesis is fully restored if the receptors are reinstalled in both BAT and WAT,
but not BAT alone (24). Furthermore, mice lacking UCP1 were shown to retain a significant
thermogenic response to β3AR stimulation (25). These findings suggest the possibility that white fat
may elicit an acute metabolic response to β3AR stimulation in a manner independent of UCP1,
although the precise mechanism remains to be revealed. With repeat CL316,243 doses, UCP1 protein
began to appear in inguinal WAT by day 4, followed by a continued linear increase, finally reaching
expression levels (per mitochondrial protein weight) comparable to that of BAT by day 10.
Finally, we found that UCP1 content closely correlated to image-based and ex vivo measured 18F-
FDG level before and during repeated β3AR stimulation. This indicates that 18F-FDG PET/CT can
detect the thermogenic response of recruited beige adipocytes, and may be able to estimate the extent
of WAT browning by therapeutic agents. There was a relative decrease of WAT 18F-FDG uptake at
day 10 compared to day 7 that was divergent from the stronger UCP1 protein band intensity. Possible
explanations may include a reduced sensitivity of UCP1 to repeated activation by CL316,2434, or a
partial shift of stimulated energy expenditure from glucose to fatty acid as substrate. However, the
precise cause for this finding is not clear and will require further investigation.
Although the relevance of beige cells in humans remains to be established, recent studies show that
human fat tissue previously thought to be BAT actually contain islands of brown-like adipocytes
by on June 19, 2016. For personal use only. jnm.snmjournals.org Downloaded from

14
mixed within WAT, pointing to the presence of beige cells (26,27). Furthermore, in patients with
retroperitoneal pheochromocytoma, abdominal visceral fat exposed to high noradrenaline
concentrations for prolonged durations have shown intense 18F-FDG uptake (28). These findings
suggest that beige adipocytes could be of potential significance in human subjects as they are in mice.
CONCLUSION
Our results demonstrate that 18F-FDG PET/CT has the capacity to monitor brown adipocyte
recruitment into WAT depots in vivo. Imaging 18F-FDG uptake may thus be useful for screening the
efficacy of strategies to promote WAT browning, as well as help delineate its impact on energy
expenditure by glucose utilization.
ACKNOWLEDGEMENTS
This work was supported by Samsung Biomedical Research Institute Grant # SMX1131891.
by on June 19, 2016. For personal use only. jnm.snmjournals.org Downloaded from
15
REFERENCES
1. Peirce V, Carobbio S, Vidal-Puig A. The different shades of fat. Nature. 2014;510:76-83.
2. Rosen ED, Spiegelman BM. Adipocytes as regulators of energy balance and glucose homeostasis.
Nature. 2006;444:847-853.
3. Lowell BB, Spiegelman BM. Towards a molecular understanding of adaptive thermogenesis.
Nature. 2000;404:652-660.
4. Harms M, Seale P. Brown and beige fat: development, function and therapeutic potential. Nat
Med. 2013;19:1252-1263.
5. Van Marken Lichtenbelt WD, Vanhommerig JW, et al. Cold-activated brown adipose tissue in
healthy men. N Engl J Med. 2009;360: 1500-1508.
6. Virtanen KA, Lidell ME, Orava J, et al. Functional brown adipose tissue in healthy adults. N Engl
J Med. 2009; 360:1518-1525.
7. Tseng YH, Cypess AM, Kahn CR. Cellular bioenergetics as a target for obesity therapy. Nat Rev
Drug Discov. 2010;9:465-482. .
8. Lidell ME, Enerback S. Brown adipose tissue - a new role in humans? Nat Rev Endocrinol.
2010;6: 319–325.
9. Ravussin E, Kozak LP. Have we entered the brown adipose tissue renaissance? Obes Rev.
2009;10:265-268.
10. Wu J, Cohen P, Spiegelman BM. Adaptive thermogenesis in adipocytes: Is beige the new brown?
Genes Dev. 2013;27: 234-250.
11. Granneman JG, Li P, Zhu Z, Lu Y. Metabolic and cellular plasticity in white adipose tissue I:
effects of β3-adrenergic receptor activation. Am J Physiol. Endocrinol Metab. 2005;289:E608-
E616.
12. Wu J, Bostro¨m P, Sparks LM, et al. Beige adipocytes are a distinct type of thermogenic fat cell
in mouse and human. Cell. 2012;150:366-376.
by on June 19, 2016. For personal use only. jnm.snmjournals.org Downloaded from
16
13. Rosenwald M, Perdikari A, Ru¨licke T, Wolfrum C. Bi-directional interconversion of brite and
white adipocytes. Nat Cell Biol. 2013;15:659–667.
14. Vegiopoulos A, Müller-Decker K, Strzoda D, Schmitt I, et al. Cyclooxygenase-2 controls energy
homeostasis in mice by de novo recruitment of brown adipocytes. Science. 2010;328:1158-1161.
15. Mirbolooki MR, Upadhyay SK, Constantinescu CC, Pan ML, Mukherjee J. Adrenergic
pathway activation enhances brown adipose tissue metabolism: a [¹⁸F]FDG PET/CT study in
mice. Nucl Med Biol. 2014;41:10-16.
16. Quarta C, Lodi F, Mazza R, et al. (11)C-meta-hydroxyephedrine PET/CT imaging allows in
vivo study of adaptive thermogenesis and white-to-brown fat conversion. Mol Metab.
2013;2:153-160.
17. Cypess AM, Doyle AN, Sass CA, et al. Quantification of human and rodent brown adipose tissue
function using 99mTc-methoxyisobutylisonitrile SPECT/CT and 18F-FDG PET/CT. J Nucl Med.
2013;54:1896-2901.
18. Mirbolooki MR, Constantinescu CC, Pan ML, Mukherjee J. Quantitative assessment of brown
adipose tissue metabolic activity and volume using 18F-FDG PET/CT and β3-adrenergic receptor
activation. EJNMMI Res. 2011;1:30.
19. Waldén TB, Hansen IR, Timmons JA, Cannon B, Nedergaard J. Recruited vs. nonrecruited
molecular signatures of brown, “brite,” and white adipose tissues. Am J Physiol Endocrinol
Metab. 2012; 302:E19-E31.
20. Sackmann-Sala L, Berryman DE, Munn RD, Lubbers ER, Kopchick JJ. Heterogeneity among
white adipose tissue depots in male C57BL/6J mice. Obesity (Silver Spring). 2012;20:101-111.
21. Gburcik V, Cleasby ME, Timmons JA. Loss of neuronatin promotes "browning" of primary
mouse adipocytes while reducing Glut1-mediated glucose disposal. Am J Physiol Endocrinol
Metab. 2013;304:E885-894.
by on June 19, 2016. For personal use only. jnm.snmjournals.org Downloaded from

17
22. Seale P, Bjork B, Yang W, et al. PRDM16 controls a brown fat/skeletal muscle switch. Nature.
2008; 454: 961–967.
23. Ohno H, Shinoda K, Spiegelman BM, Kajimura S. PPARgamma agonists induce a white-to-
brown fat conversion through stabilization of PRDM16 protein. Cell Metab. 2012;15:395-404.
24. Grujic D, Susulic VS, Harper ME, et al. Beta3-adrenergic receptors on white and brown
adipocytes mediate beta3-selective agonist-induced effects on energy expenditure, insulin
secretion, and food intake. A study using transgenic and gene knockout mice. J Biol Chem
1997;272: 17686-17693.
25. Granneman JG, Burnazi M, Zhu Z, Schwamb LA. White adipose tissue contributes to UCP1-
independent thermogenesis. Am J Physiol Endocrinol Metab 2003;285: E1230–E1236.
26. Wu J, Boström P, Sparks LM, et al. Beige adipocytes are a distinct type of thermogenic fat cell in
mouse and human. Cell. 2012;150:366-376.
27. Sharp L, Shinoda K, Ohno H, et al. Human BAT possesses molecular signatures that resemble
beige/brite cells. PLoS ONE. 2012;7:e49452.
28. Dong A, Wang Y, Lu J, Zuo C. Hypermetabolic mesenteric brown adipose tissue on dual-time
point FDG PET/CT in a patient with benign retroperitoneal pheochromocytoma. Clin Nucl Med.
2014;39:e229-e232.
by on June 19, 2016. For personal use only. jnm.snmjournals.org Downloaded from
18
Figure 1. Interscapular BAT 18F-FDG uptake by β3 adrenergic stimulation. (A) Sagittal 18F-FDG
PET/CT images of interscapular BAT (arrows) at baseline and during repeated saline or CL316,243 (1
mg/kg) injection. (B) Image-based target (T; interscapular BAT) to background (B; lung) count ratios
from polygonal regions-of-interest (left), and ex vivo measured interscapular BAT uptake in %
adminsteted-dose per gram-tissue (%IA/g; right). Bars are mean ± SD of values obtained from 3 or 4
animals per group. †P <0.005; ‡P <0.001, compared to baseline CL316,243 group.
by on June 19, 2016. For personal use only. jnm.snmjournals.org Downloaded from
19
Figure 2. Inguinal WAT 18F-FDG uptake by β3 adrenergic stimulation. (A) Coronal 18F-FDG PET/CT
images of inguinal WAT (arrowheads) at baseline and during repeated saline or CL316,243 (1 mg/kg)
injection. (B) Image-based target (T; inguinal WAT) to background (B; lung) count ratios (left), and
ex vivo measured inguinal WAT uptake (right). Bars are mean ± SD of values obtained from 3 or 4
animals per group. ‡P <0.001, compared to baseline CL316,243 group..
by on June 19, 2016. For personal use only. jnm.snmjournals.org Downloaded from
20
Figure 3. Hematoxylin and eosin staining, and immune-staining of hexokinase-II and GLUT4
expression. Interscapular BAT and inguinal WAT extracted at day 1 or 10 were paraffin embedded,
microsectioned and immunostained. Magnification, x200 for hematoxylin and eosin staining and x100
for other staining
by on June 19, 2016. For personal use only. jnm.snmjournals.org Downloaded from

21
Figure 4. Immunostaining of UCP1 expression in interscapular BAT and inguinal WAT extracted at
indicated time points. Magnification, x100
by on June 19, 2016. For personal use only. jnm.snmjournals.org Downloaded from

22
Figure 5. Immunostaining of COX5 and PRDM16 expression in interscapular BAT and inguinal
WAT extracted at indicated time points. Magnification, x100
by on June 19, 2016. For personal use only. jnm.snmjournals.org Downloaded from
23
Figure 6. Quantitative measurement of UCP1 expression. UCP1western blots of mitochondrial protein
from interscapular BAT and inguinal WAT (top) and quantified band densities (bottom). COX4
expression was used as loading control (not shown). Bars are mean ± SD of band density relative to
that of COX4 obtained from 3 or 4 animals per group. ‡P<0.001, compared to CL316,243 group at
day 1.
by on June 19, 2016. For personal use only. jnm.snmjournals.org Downloaded from
24
Figure 7. Correlation between 18F-FDG uptake and UCP1 expression. (A,B) Linear regression
analysis between inguinal WAT UCP1 level and image-based (A) and ex vivo measured 18F-FDG
uptakes (B). (C) Correlation between image-based and ex vivo measured 18F-FDG uptake. Data points
are from mice treated with CL316,243 for 1 (n = 4), 4 ( n = 3), 7 ( n = 3), or 10 days ( n = 3).
by on June 19, 2016. For personal use only. jnm.snmjournals.org Downloaded from

Doi: 10.2967/jnumed.114.147603Published online: December 18, 2014.J Nucl Med. Kyung-Han LeeJin Won Park, Kyung-Ho Jung, Jin Hee Lee, Cung Hoa Thien Quach, Seung-Hwan Moon, Young Seok Cho and White Adipose Tissue
3 Agonist-Stimulated Brown Adipocyte Recruitment inβF-FDG PET/CT Monitoring of 18
http://jnm.snmjournals.org/content/early/2014/12/16/jnumed.114.147603This article and updated information are available at:
http://jnm.snmjournals.org/site/subscriptions/online.xhtml
Information about subscriptions to JNM can be found at:
http://jnm.snmjournals.org/site/misc/permission.xhtmlInformation about reproducing figures, tables, or other portions of this article can be found online at:
and the final, published version.proofreading, and author review. This process may lead to differences between the accepted version of the manuscript
ahead of print area, they will be prepared for print and online publication, which includes copyediting, typesetting,JNMcopyedited, nor have they appeared in a print or online issue of the journal. Once the accepted manuscripts appear in the
. They have not beenJNM ahead of print articles have been peer reviewed and accepted for publication in JNM
(Print ISSN: 0161-5505, Online ISSN: 2159-662X)1850 Samuel Morse Drive, Reston, VA 20190.SNMMI | Society of Nuclear Medicine and Molecular Imaging
is published monthly.The Journal of Nuclear Medicine
© Copyright 2014 SNMMI; all rights reserved.
by on June 19, 2016. For personal use only. jnm.snmjournals.org Downloaded from
Copyright © 2022 FDOKUMEN


![CYCLOTRON PRODUCED RADIONUCLIDES:GUIDANCE ON FACILITY DESIGN AND PRODUCTION OF [18F]FLUORODEOXYGLUCOSE (FDG)](https://static.fdokumen.com/doc/165x107/631647d8c32ab5e46f0db468/cyclotron-produced-radionuclidesguidance-on-facility-design-and-production-of-18ffluorodeoxyglucose.jpg)