Enhanced Fibroblast Contraction of 3D Collagen Lattices and Integrin Expression by TGF-β1 and -β3:...
13
Enhanced Fibroblast Contraction of 3D Collagen Lattices and Integrin Expression by TGF-1 and -3: Mechanoregulatory Growth Factors? Robert A. Brown, 1 Kamaljit K. Sethi, Ivo Gwanmesia, David Raemdonck, Mark Eastwood,* and Vivek Mudera Tissue Repair Unit, Centre for Plastic and Reconstructive Surgery, University College London, RFUCMS, 67 Riding House Street, London W1W 7EJ, United Kingdom; and *Department of Biological Sciences, University of Westminster, New Cavendish Street, London, WC1, United Kingdom Generation of contractile forces as fibroblasts attach and migrate through collagenous substrates is a fun- damental behavior, yet its regulation and conse- quences are obscure. Although the transforming growth factor-s (TGF-) are similarly important in fibrosis and tissue repair, their role in contraction is controversial. Using a quantitative, 3D collagen cul- ture model we have measured the effects of TGF-1 and -3 on contractile forces generated by human der- mal fibroblasts. Maximal stimulation was between 7.5 and 15 ng/ml of TGF-1. Higher doses were inhibitory (30 ng/ml), giving a bell-shaped dose response. The initial rate of force generation was increased seven- fold (15 ng/ml). A similar response pattern was seen with TGF-3 alone. However, the addition of both iso- forms together stimulated a biphasic increase in force generation, suggesting that there was a distinct tem- poral cooperativity between the two isforms. This very early onset (10 –20 min) of stimulation suggested that TGF- might act through cell attachment and integrin function and the effect of TFG- on expression of fi- bronectin (FnR) and vitronectin (VnR) integrin recep- tors was monitored over the same time scale. TGF-1 dramatically up-regulated VnR expression, relative to FnR, over time but the optimal time for this was 2– 4 h later than that of force stimulation. It is concluded that TGF-1 and -3 behave here primarily as mech- anoregulatory growth factors and that stimulation of integrin expression may be a consequence of the al- tered cell stress. © 2002 Elsevier Science (USA) Key Words: culture force monitor; transforming growth factor-; human dermal fibroblasts; collagen lattices; force generation; cytomechanics; fibronectin; vitronectin; integrins. INTRODUCTION TGF-1 and -2 are regarded as potent profibrotic agents, based on their promotion of rapid deposition of collagenous matrix in wound repair [1–3], though the detailed mechanisms involved remain to be estab- lished. This is supported by their diverse activities on cultured fibroblasts, stimulating collagen, fibronectin [4, 5], and TIMP synthesis while suppressing metallo- proteinase production [6]. TGF-3, in contrast, has been claimed to be an antifibrotic isoform, based on work in in vivo dermal scarring [7], in which TGF-3 was proposed to inhibit matrix scarring/fibrosis by blocking the actions of TGF-1 and -2. However, this is controversial and supporting evidence in vitro is limited [8 –10]. In addition, TGF-1 (and potentially -3) is reported to promote long-term myofibroblast differentiation and -smooth muscle actin (SMA) ex- pression in vitro and in wounds [11–14] and this has been suggested as a potential contributing factor to in vivo scarring. A basic function of many cell types is the ability to generate tensional forces on their substrate. This can take the form of tractional forces on two-dimensional substrates. In vitro these can be wrinkling of silicone sheets by adherent fibroblasts [15, 16] or geometric shrinkage of 3D cell-seeded collagen gels [17, 18]. Free- floating gels are under minimal mechanical stress and so are less effective models of tissue function (which are almost always mechanically tethered). TGF- has been reported to stimulate free-floating gel contraction in vitro [19]. Stressed or tethered gels inevitably rep- resent an entirely different mechanical environment at the cell level, producing reactive tensile forces on res- ident cells as they contract. This is clearly essential for the mechanical feedback involved in tensional ho- meostasis [20] and a range of other alterations in cell behavior [21–23]. Despite interest in the obvious importance of me- chanical forces in contractile and connective tissue cell biology, understanding of cytomechanical control pro- cesses is surprisingly primitive. This has in part been due to the paucity of quantitative experimental models able to test detailed mechanical and materials engi- neering, at the cell level. The origins of fibroblast con- 1 To whom reprint requests should be addressed. E-mail: [email protected]. Fax: 44-208-909-8784. 310 0014-4827/02 $35.00 © 2002 Elsevier Science (USA) All rights reserved. Experimental Cell Research 274, 310 –322 (2002) doi:10.1006/excr.2002.5471, available online at http://www.idealibrary.com on
Transcript of Enhanced Fibroblast Contraction of 3D Collagen Lattices and Integrin Expression by TGF-β1 and -β3:...
Experimental Cell Research 274, 310–322 (2002)doi:10.1006/excr.2002.5471, available online at http://www.idealibrary.com on
Enhanced Fibroblast Contraction of 3D Collagen Lattices and IntegrinExpression by TGF-�1 and -�3: Mechanoregulatory Growth Factors?
Robert A. Brown,1 Kamaljit K. Sethi, Ivo Gwanmesia, David Raemdonck,Mark Eastwood,* and Vivek Mudera
Tissue Repair Unit, Centre for Plastic and Reconstructive Surgery, University College London, RFUCMS, 67 Riding House Street,London W1W 7EJ, United Kingdom; and *Department of Biological Sciences, University of Westminster,
Generation of contractile forces as fibroblasts attachand migrate through collagenous substrates is a fun-damental behavior, yet its regulation and conse-quences are obscure. Although the transforminggrowth factor-�s (TGF-�) are similarly important infibrosis and tissue repair, their role in contraction iscontroversial. Using a quantitative, 3D collagen cul-ture model we have measured the effects of TGF-�1and -�3 on contractile forces generated by human der-mal fibroblasts. Maximal stimulation was between 7.5and 15 ng/ml of TGF-�1. Higher doses were inhibitory(30 ng/ml), giving a bell-shaped dose response. Theinitial rate of force generation was increased seven-fold (15 ng/ml). A similar response pattern was seenwith TGF-�3 alone. However, the addition of both iso-forms together stimulated a biphasic increase in forcegeneration, suggesting that there was a distinct tem-poral cooperativity between the two isforms. This veryearly onset (10–20 min) of stimulation suggested thatTGF-� might act through cell attachment and integrinfunction and the effect of TFG-� on expression of fi-bronectin (FnR) and vitronectin (VnR) integrin recep-tors was monitored over the same time scale. TGF-�1dramatically up-regulated VnR expression, relative toFnR, over time but the optimal time for this was 2–4 hlater than that of force stimulation. It is concludedthat TGF-�1 and -�3 behave here primarily as mech-anoregulatory growth factors and that stimulation ofintegrin expression may be a consequence of the al-tered cell stress. © 2002 Elsevier Science (USA)
Key Words: culture force monitor; transforminggrowth factor-�; human dermal fibroblasts; collagenlattices; force generation; cytomechanics; fibronectin;vitronectin; integrins.
INTRODUCTION
TGF-�1 and -�2 are regarded as potent profibroticagents, based on their promotion of rapid deposition of
1 To whom reprint requests should be addressed. E-mail:
[email protected]. Fax: ��44-208-909-8784.3100014-4827/02 $35.00© 2002 Elsevier Science (USA)All rights reserved.
collagenous matrix in wound repair [1–3], though thedetailed mechanisms involved remain to be estab-lished. This is supported by their diverse activities oncultured fibroblasts, stimulating collagen, fibronectin[4, 5], and TIMP synthesis while suppressing metallo-proteinase production [6]. TGF-�3, in contrast, hasbeen claimed to be an antifibrotic isoform, based onwork in in vivo dermal scarring [7], in which TGF-�3was proposed to inhibit matrix scarring/fibrosis byblocking the actions of TGF-�1 and -�2. However, thisis controversial and supporting evidence in vitro islimited [8–10]. In addition, TGF-�1 (and potentially-�3) is reported to promote long-term myofibroblastdifferentiation and �-smooth muscle actin (�SMA) ex-pression in vitro and in wounds [11–14] and this hasbeen suggested as a potential contributing factor to invivo scarring.
A basic function of many cell types is the ability togenerate tensional forces on their substrate. This cantake the form of tractional forces on two-dimensionalsubstrates. In vitro these can be wrinkling of siliconesheets by adherent fibroblasts [15, 16] or geometricshrinkage of 3D cell-seeded collagen gels [17, 18]. Free-floating gels are under minimal mechanical stress andso are less effective models of tissue function (whichare almost always mechanically tethered). TGF-� hasbeen reported to stimulate free-floating gel contractionin vitro [19]. Stressed or tethered gels inevitably rep-resent an entirely different mechanical environment atthe cell level, producing reactive tensile forces on res-ident cells as they contract. This is clearly essential forthe mechanical feedback involved in tensional ho-meostasis [20] and a range of other alterations in cellbehavior [21–23].
Despite interest in the obvious importance of me-chanical forces in contractile and connective tissue cellbiology, understanding of cytomechanical control pro-cesses is surprisingly primitive. This has in part beendue to the paucity of quantitative experimental modelsable to test detailed mechanical and materials engi-
New Cavendish Street, Lo
n, WC1, United Kingdom ndoneering, at the cell level. The origins of fibroblast con-
tractile forces within a 3D matrix have been studiedusing direct force measurement instruments [24–26].The culture force monitor (CFM) instrument was de-veloped in this lab, on sound mechanical engineeringprinciples, to allow continuous, precise measurementof forces generated by tethered cell-populated collagengels [26, 27]. Continuous data collection/processing andthe definable, uniaxial mechanical configuration of theCFM make it possible to reproducibly measure cytome-chanical responses in real time. In this model, theearliest generation of force (�8 h) appears to be due tofibroblast traction on the matrix collagen [27–29],while later stages (�12 h) are dominated by contrac-tion of cells on the collagen fibrils, with the appearanceof stress fibers. It is important to distinguish herebetween the cell–matrix contraction process leading tocollagenous remodeling (with apparent physical short-ening) [30] and the familiar, reversible “muscle-type”contraction, mediated through cell–cell contact.
Particularly in terms of contraction, the relationshipof the fibroblast and myofibroblast is ambivalent. Thelatter are sometimes defined by the presence of �SMA,a marker also found in most smooth muscle cells [31,32] Importantly, the necessity to treat cultured fibro-blasts for several days with TGF-�1 to induce �SMAexpression (i.e., the myofibroblast phenotype) and thefact that not all cells respond present something of aparadox. Specifically, if this is a direct growth factoreffect, why is the response incomplete and so pro-tracted? This has led us to consider that the primaryTGF-� response of fibroblasts may be to alter the wayin which they receive cytomechanical stimuli fromtheir matrix. Such a modulation of a key external–internal cell signaling system would also be expected toelicit a secondary plethora of downstream responses inmechanoreactive cells such as fibroblasts. This is dis-tinct from the current view that TGF-� has a wholerange of individual activities (stimulating collagen,proteoglycans, and fibronectin production, reducingmatrix protease expression, etc.), which incidentallylead to altered matrix properties. The speed of onset ofreaction to TGF-� would seem to be key to identifyingthe defining first cell response.
Studies here on the CFM identified the characteris-tic and rapid-onset increase of force generation withtwo isoforms of TGF-�, in a manner suggesting thatthis is indeed a primary response, potentially actingthrough cell substrate attachment. Mechanisms of en-hanced force generation by TGF-� at the cell levelcould include (a) stimulation of actinomyosin motorelements of the cytoskeleton, (b) enhanced integrinsynthesis and processing [4] to promote cell attach-ment to collagen, or (c) alteration of matrix mechanicalproperties (only likely to be significant after manyhours/days). Option (c) is implausible as a mechanismover this short time course and was not considered
further. Since there is existing literature supportingthe idea that TGF-� promotes integrin expression, thispossibility was tested first. While TGF-�-mediatedchanges in integrin receptor expression were identifiedover the same time frame, they were found to follow 2to 4 h AFTER initial stimulation of force generation.This is inconsistent with mechanism (a) and suggeststhat stimulation of cytoskeletal force generation (inter-nal prestress: b) is more likely.
MATERIALS AND METHODS
Fibroblast culture. Human dermal fibroblasts were cultured fromexplants of normal skin taken directly from the operating theatre[26, 33] in Dulbecco’s modified Eagle’s medium (DMEM) containingpenicillin/streptomycin (100 U/ml and 100 �g/ml, Gibco BRL, Pais-ley, Scotland) and L-glutamine (2 mM, ICN, Biochemicals Ltd.,Thyne, UK) with 10% fetal calf serum (FCS, First Link, West Mid-lands, UK). Cells were used between the sixth and seventh passages.Human recombinant TGF-�1 and -�3 (Sigma Chemicals, Dorset,UK) was diluted to required concentrations in 0.1% bovine serumalbumin (BSA, Sigma Chemicals) dissolved in 4 mM HCl. Doses ofTGF-�1 and -�3 tested were 2.5, 7.5, 15, 22.5, and 30 ng/ml, finalconcentrations.
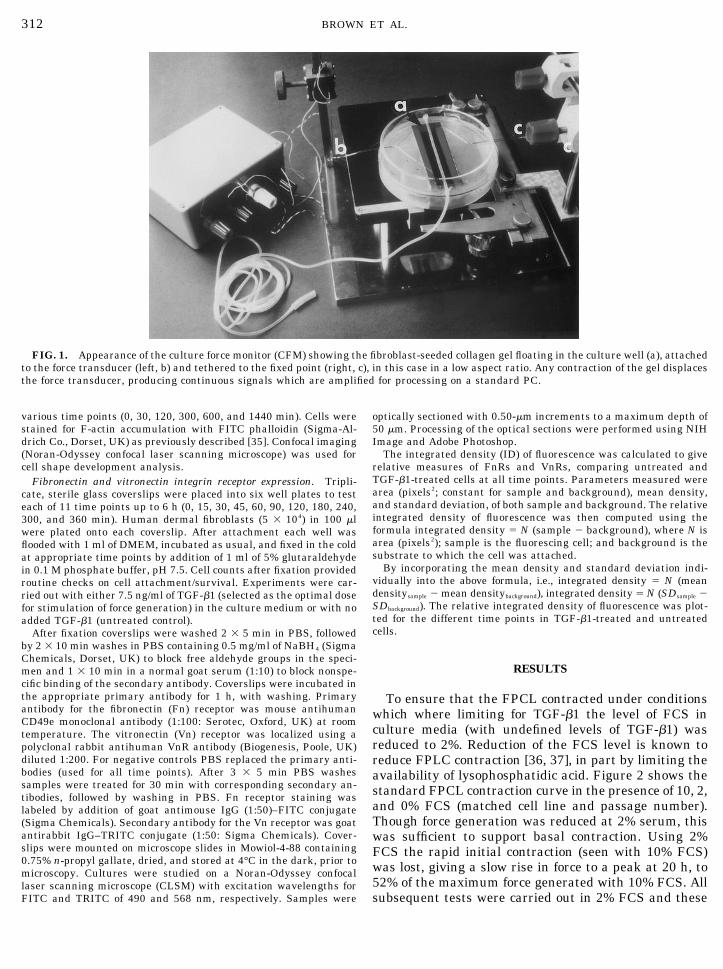
Culture force monitor and TGF-�. The CFM apparatus was con-structed and calibrated as previously described [26] (Fig. 1). TheCFM is an instrument capable of quantitatively measuring forcesgenerated by cells as they migrate through the collagen matrix. Inbrief, a rectangular fibroblast seeded collagen gel was cast andfloated in medium, tethered to two floatation bars on either of theshort edges, in turn attached to an anchor point at one end and aforce transducer at the other. Cell-generated tensional forces in thecollagen gel are detected by the force transducer and logged into aPC. Graphical data points are produced every 10 min, averaged from600 readings (1/s), providing a continuous output of force generated.
Collagen gels were prepared by mixing 5 ml of a 2.28 mg/mlsolution of native acid soluble type I rat tail collagen (First Link)with 0.625 ml of 10� DMEM (Gibco BRL). Gels were neutralizedusing 1 M NaOH before addition of 1 ml of fibroblast suspension, togive 106 cells/ml of gel solution [or 1 ml of DMEM alone for cell-freecontrols] and 25 �l of TGF-�1 stock or vehicle alone. Gels were set for5 min, at 37°C, 5% CO2 prior to being floated in 15 ml of supple-mented DMEM (above) with 2% FCS and 100 �l of TGF-�1 stock orvehicle alone and data capture began immediately (over 20 h); 2%FCS was determined in advance as the minimal serum concentrationto support a basal, measurable contraction, minimizing the contri-bution of serum-derived factors. This protocol allowed us to deter-mine the response to TGF-�1 and/or -�3 available to the cell fromtime 0 (i.e., incorporated into the gel and the culture medium). Fordual isoform addition experiments (adding both TGF-�1 and -�3simultaneously) a mixture of the two factors was added (as before, at0 time) at doses which gave maximal stimulation when given singly,namely, 12.5 ng/ml for �1 and 15 ng/ml for �3.
Rates of contraction and statistical analysis of data were carriedout using standard computer software (Lotus 1-2-3 Release 5 forWindows: Lotus Development Corp., UK).
Morphological studies of 3D collagen gel cultures. Collagen gelswere fixed under tension using 2.5% glutaraldehyde in 0.1 M phos-phate buffer, pH 7.5, for 1 h at 4°C. TGF-�-treated gels were stainedin 1% toluidine blue for 1 min. Gels were then destained in distilledwater. Routine monitoring of fibroblast morphology used high-defi-nition stereo light microscopy (Edge Scientific Instrument Corp., LA,U.S.A.) [34]. The pattern of cell shape development within the 3Dmatrix was investigated. Cells were fixed under tension in 2.5%gluteraldehyde in 0.1 M phosphate buffer, pH 7.5, for 1 h at 4°C at
311TGF-� AND CONTRACTION
various time points (0, 30, 120, 300, 600, and 1440 min). Cells werestained for F-actin accumulation with FITC phalloidin (Sigma-Al-drich Co., Dorset, UK) as previously described [35]. Confocal imaging(Noran-Odyssey confocal laser scanning microscope) was used forcell shape development analysis.
Fibronectin and vitronectin integrin receptor expression. Tripli-cate, sterile glass coverslips were placed into six well plates to testeach of 11 time points up to 6 h (0, 15, 30, 45, 60, 90, 120, 180, 240,300, and 360 min). Human dermal fibroblasts (5 � 104) in 100 �lwere plated onto each coverslip. After attachment each well wasflooded with 1 ml of DMEM, incubated as usual, and fixed in the coldat appropriate time points by addition of 1 ml of 5% glutaraldehydein 0.1 M phosphate buffer, pH 7.5. Cell counts after fixation providedroutine checks on cell attachment/survival. Experiments were car-ried out with either 7.5 ng/ml of TGF-�1 (selected as the optimal dosefor stimulation of force generation) in the culture medium or with noadded TGF-�1 (untreated control).
After fixation coverslips were washed 2 � 5 min in PBS, followedby 2 � 10 min washes in PBS containing 0.5 mg/ml of NaBH4 (SigmaChemicals, Dorset, UK) to block free aldehyde groups in the speci-men and 1 � 10 min in a normal goat serum (1:10) to block nonspe-cific binding of the secondary antibody. Coverslips were incubated inthe appropriate primary antibody for 1 h, with washing. Primaryantibody for the fibronectin (Fn) receptor was mouse antihumanCD49e monoclonal antibody (1:100: Serotec, Oxford, UK) at roomtemperature. The vitronectin (Vn) receptor was localized using apolyclonal rabbit antihuman VnR antibody (Biogenesis, Poole, UK)diluted 1:200. For negative controls PBS replaced the primary anti-bodies (used for all time points). After 3 � 5 min PBS washessamples were treated for 30 min with corresponding secondary an-tibodies, followed by washing in PBS. Fn receptor staining waslabeled by addition of goat antimouse IgG (1:50)–FITC conjugate(Sigma Chemicals). Secondary antibody for the Vn receptor was goatantirabbit IgG–TRITC conjugate (1:50: Sigma Chemicals). Cover-slips were mounted on microscope slides in Mowiol-4-88 containing0.75% n-propyl gallate, dried, and stored at 4°C in the dark, prior tomicroscopy. Cultures were studied on a Noran-Odyssey confocallaser scanning microscope (CLSM) with excitation wavelengths forFITC and TRITC of 490 and 568 nm, respectively. Samples were
optically sectioned with 0.50-�m increments to a maximum depth of50 �m. Processing of the optical sections were performed using NIHImage and Adobe Photoshop.
The integrated density (ID) of fluorescence was calculated to giverelative measures of FnRs and VnRs, comparing untreated andTGF-�1-treated cells at all time points. Parameters measured werearea (pixels2; constant for sample and background), mean density,and standard deviation, of both sample and background. The relativeintegrated density of fluorescence was then computed using theformula integrated density � N (sample � background), where N isarea (pixels2); sample is the fluorescing cell; and background is thesubstrate to which the cell was attached.
By incorporating the mean density and standard deviation indi-vidually into the above formula, i.e., integrated density � N (meandensitysample � mean densitybackground), integrated density � N (SDsample �SDbackground). The relative integrated density of fluorescence was plot-ted for the different time points in TGF-�1-treated and untreatedcells.
RESULTS
To ensure that the FPCL contracted under conditionswhich where limiting for TGF-�1 the level of FCS inculture media (with undefined levels of TGF-�1) wasreduced to 2%. Reduction of the FCS level is known toreduce FPLC contraction [36, 37], in part by limiting theavailability of lysophosphatidic acid. Figure 2 shows thestandard FPCL contraction curve in the presence of 10, 2,and 0% FCS (matched cell line and passage number).Though force generation was reduced at 2% serum, thiswas sufficient to support basal contraction. Using 2%FCS the rapid initial contraction (seen with 10% FCS)was lost, giving a slow rise in force to a peak at 20 h, to52% of the maximum force generated with 10% FCS. Allsubsequent tests were carried out in 2% FCS and these
FIG. 1. Appearance of the culture force monitor (CFM) showing the fibroblast-seeded collagen gel floating in the culture well (a), attachedto the force transducer (left, b) and tethered to the fixed point (right, c), in this case in a low aspect ratio. Any contraction of the gel displacesthe force transducer, producing continuous signals which are amplified for processing on a standard PC.
312 BROWN ET AL.

two features, namely, (a) maximum total force generatedand (b) initial force generation, were used in subsequentanalyses of responses to TGF-�.
TGF-�1- and -�3-Mediated Force Generation
Figure 3 compares the full force–time profiles for 2.5,7.5, 15, and 30 ng/ml, relative to untreated gels. Stim-
ulation of contraction was clear at 7.5 and 15 ng/ml,particularly in terms of increased force generated atthe earliest time points (0 to 4 h), sustained up to 20 h.Interestingly, the highest dose, 30 ng/ml, was stronglyinhibitory, almost completely abolishing contraction.The overall dose response to TGF-�1 in the CFM issummarized in Fig. 4a (as maximal force generated)
FIG. 2. Representative force–time plots from human dermal fibroblasts allowed to contract on the CFM in the presence of 0, 2, and 10% fetalcalf serum (FCS), showing the clear serum-dependence for both peak force generation (at 24 h) and initial rate of force generation. In order tominimize the effects of endogenous serum growth factors on basal cell responses, all subsequent experiments were performed in 2% serum.
FIG. 3. Mean force time plots (n � 3) for four doses of TGF-�1: (a) 2.5, (b) 7.5, (c) 15, (d) 30 ng/ml; each compared with the zero dosecontrol. Note the increase in both maximal force generation and the initial rate of force generation between 7.5 and 15 ng/ml and the profoundinhibition of contraction at the highest dose of 30 ng/ml.
313TGF-� AND CONTRACTION
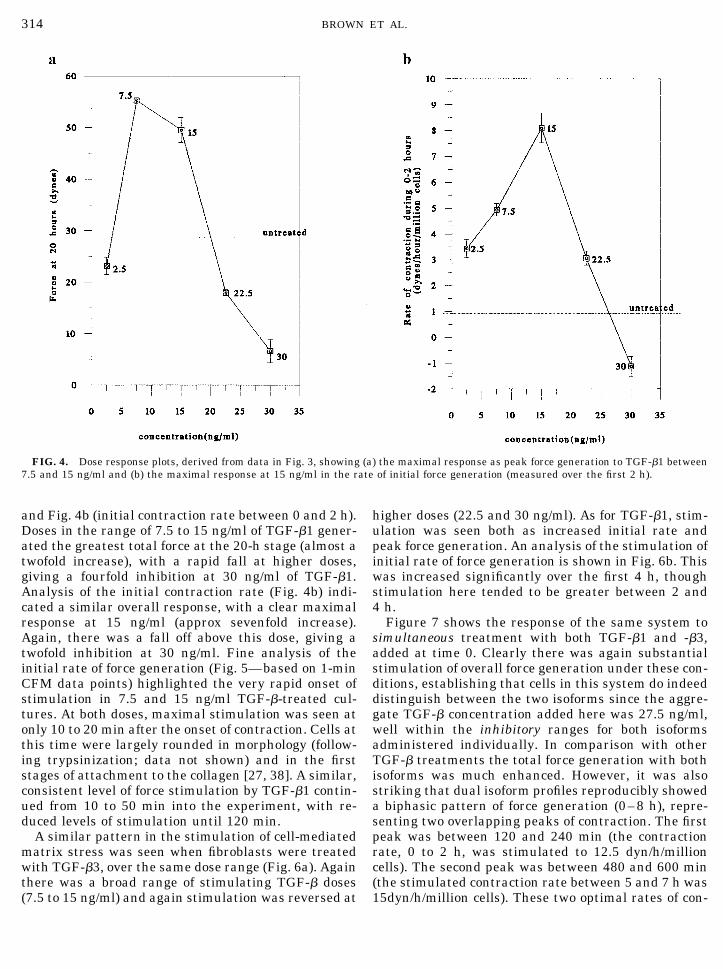
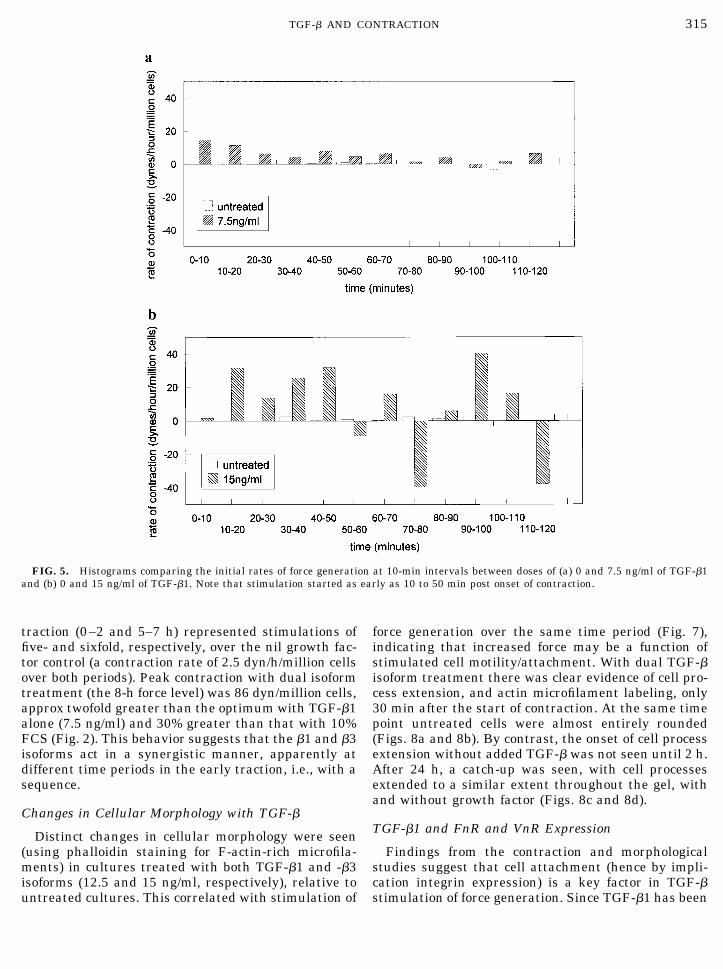
and Fig. 4b (initial contraction rate between 0 and 2 h).Doses in the range of 7.5 to 15 ng/ml of TGF-�1 gener-ated the greatest total force at the 20-h stage (almost atwofold increase), with a rapid fall at higher doses,giving a fourfold inhibition at 30 ng/ml of TGF-�1.Analysis of the initial contraction rate (Fig. 4b) indi-cated a similar overall response, with a clear maximalresponse at 15 ng/ml (approx sevenfold increase).Again, there was a fall off above this dose, giving atwofold inhibition at 30 ng/ml. Fine analysis of theinitial rate of force generation (Fig. 5—based on 1-minCFM data points) highlighted the very rapid onset ofstimulation in 7.5 and 15 ng/ml TGF-�-treated cul-tures. At both doses, maximal stimulation was seen atonly 10 to 20 min after the onset of contraction. Cells atthis time were largely rounded in morphology (follow-ing trypsinization; data not shown) and in the firststages of attachment to the collagen [27, 38]. A similar,consistent level of force stimulation by TGF-�1 contin-ued from 10 to 50 min into the experiment, with re-duced levels of stimulation until 120 min.
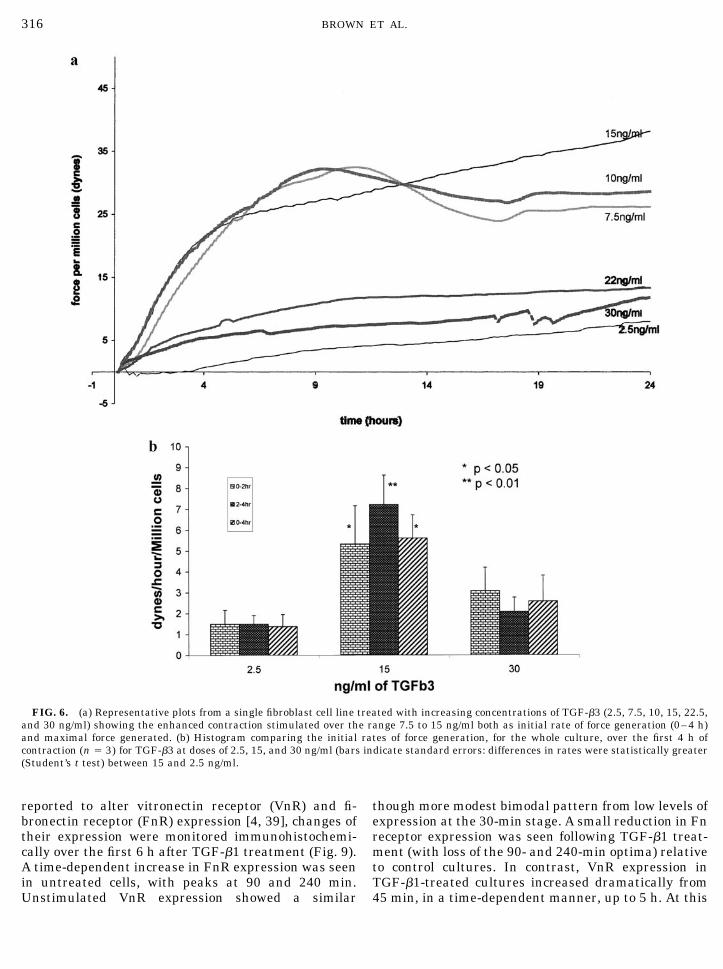
A similar pattern in the stimulation of cell-mediatedmatrix stress was seen when fibroblasts were treatedwith TGF-�3, over the same dose range (Fig. 6a). Againthere was a broad range of stimulating TGF-� doses(7.5 to 15 ng/ml) and again stimulation was reversed at
higher doses (22.5 and 30 ng/ml). As for TGF-�1, stim-ulation was seen both as increased initial rate andpeak force generation. An analysis of the stimulation ofinitial rate of force generation is shown in Fig. 6b. Thiswas increased significantly over the first 4 h, thoughstimulation here tended to be greater between 2 and4 h.
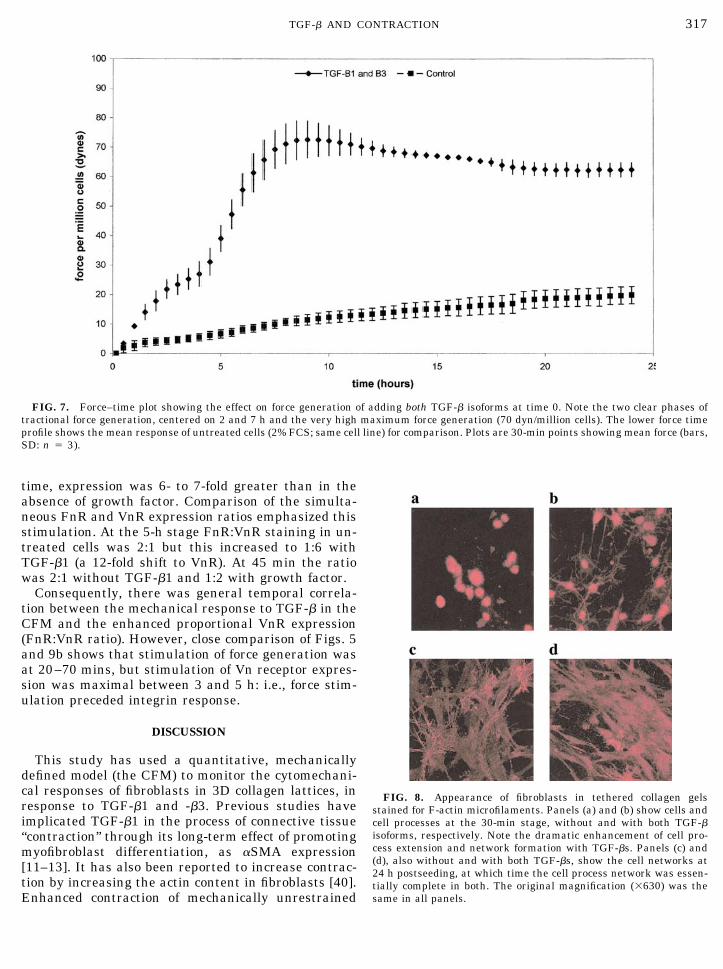
Figure 7 shows the response of the same system tosimultaneous treatment with both TGF-�1 and -�3,added at time 0. Clearly there was again substantialstimulation of overall force generation under these con-ditions, establishing that cells in this system do indeeddistinguish between the two isoforms since the aggre-gate TGF-� concentration added here was 27.5 ng/ml,well within the inhibitory ranges for both isoformsadministered individually. In comparison with otherTGF-� treatments the total force generation with bothisoforms was much enhanced. However, it was alsostriking that dual isoform profiles reproducibly showeda biphasic pattern of force generation (0–8 h), repre-senting two overlapping peaks of contraction. The firstpeak was between 120 and 240 min (the contractionrate, 0 to 2 h, was stimulated to 12.5 dyn/h/millioncells). The second peak was between 480 and 600 min(the stimulated contraction rate between 5 and 7 h was15dyn/h/million cells). These two optimal rates of con-
FIG. 4. Dose response plots, derived from data in Fig. 3, showing (a) the maximal response as peak force generation to TGF-�1 between7.5 and 15 ng/ml and (b) the maximal response at 15 ng/ml in the rate of initial force generation (measured over the first 2 h).
314 BROWN ET AL.
traction (0–2 and 5–7 h) represented stimulations offive- and sixfold, respectively, over the nil growth fac-tor control (a contraction rate of 2.5 dyn/h/million cellsover both periods). Peak contraction with dual isoformtreatment (the 8-h force level) was 86 dyn/million cells,approx twofold greater than the optimum with TGF-�1alone (7.5 ng/ml) and 30% greater than that with 10%FCS (Fig. 2). This behavior suggests that the �1 and �3isoforms act in a synergistic manner, apparently atdifferent time periods in the early traction, i.e., with asequence.
Changes in Cellular Morphology with TGF-�
Distinct changes in cellular morphology were seen(using phalloidin staining for F-actin-rich microfila-ments) in cultures treated with both TGF-�1 and -�3isoforms (12.5 and 15 ng/ml, respectively), relative tountreated cultures. This correlated with stimulation of
force generation over the same time period (Fig. 7),indicating that increased force may be a function ofstimulated cell motility/attachment. With dual TGF-�isoform treatment there was clear evidence of cell pro-cess extension, and actin microfilament labeling, only30 min after the start of contraction. At the same timepoint untreated cells were almost entirely rounded(Figs. 8a and 8b). By contrast, the onset of cell processextension without added TGF-� was not seen until 2 h.After 24 h, a catch-up was seen, with cell processesextended to a similar extent throughout the gel, withand without growth factor (Figs. 8c and 8d).
TGF-�1 and FnR and VnR Expression
Findings from the contraction and morphologicalstudies suggest that cell attachment (hence by impli-cation integrin expression) is a key factor in TGF-�stimulation of force generation. Since TGF-�1 has been
FIG. 5. Histograms comparing the initial rates of force generation at 10-min intervals between doses of (a) 0 and 7.5 ng/ml of TGF-�1and (b) 0 and 15 ng/ml of TGF-�1. Note that stimulation started as early as 10 to 50 min post onset of contraction.
315TGF-� AND CONTRACTION
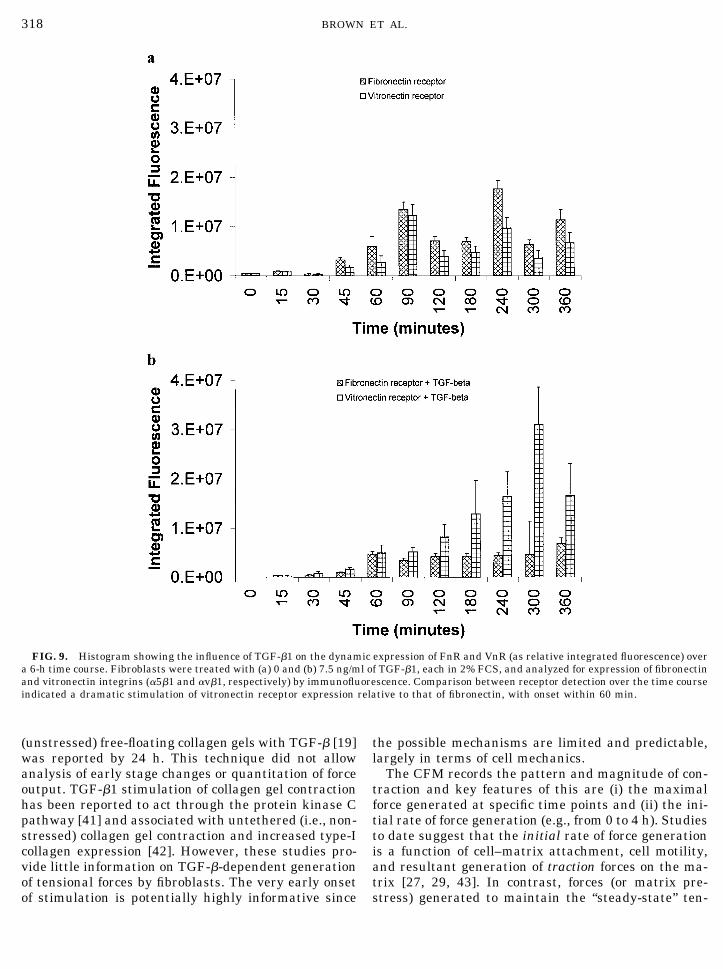
reported to alter vitronectin receptor (VnR) and fi-bronectin receptor (FnR) expression [4, 39], changes oftheir expression were monitored immunohistochemi-cally over the first 6 h after TGF-�1 treatment (Fig. 9).A time-dependent increase in FnR expression was seenin untreated cells, with peaks at 90 and 240 min.Unstimulated VnR expression showed a similar
though more modest bimodal pattern from low levels ofexpression at the 30-min stage. A small reduction in Fnreceptor expression was seen following TGF-�1 treat-ment (with loss of the 90- and 240-min optima) relativeto control cultures. In contrast, VnR expression inTGF-�1-treated cultures increased dramatically from45 min, in a time-dependent manner, up to 5 h. At this
FIG. 6. (a) Representative plots from a single fibroblast cell line treated with increasing concentrations of TGF-�3 (2.5, 7.5, 10, 15, 22.5,and 30 ng/ml) showing the enhanced contraction stimulated over the range 7.5 to 15 ng/ml both as initial rate of force generation (0–4 h)and maximal force generated. (b) Histogram comparing the initial rates of force generation, for the whole culture, over the first 4 h ofcontraction (n � 3) for TGF-�3 at doses of 2.5, 15, and 30 ng/ml (bars indicate standard errors: differences in rates were statistically greater(Student’s t test) between 15 and 2.5 ng/ml.
316 BROWN ET AL.
time, expression was 6- to 7-fold greater than in theabsence of growth factor. Comparison of the simulta-neous FnR and VnR expression ratios emphasized thisstimulation. At the 5-h stage FnR:VnR staining in un-treated cells was 2:1 but this increased to 1:6 withTGF-�1 (a 12-fold shift to VnR). At 45 min the ratiowas 2:1 without TGF-�1 and 1:2 with growth factor.
Consequently, there was general temporal correla-tion between the mechanical response to TGF-� in theCFM and the enhanced proportional VnR expression(FnR:VnR ratio). However, close comparison of Figs. 5and 9b shows that stimulation of force generation wasat 20–70 mins, but stimulation of Vn receptor expres-sion was maximal between 3 and 5 h: i.e., force stim-ulation preceded integrin response.
DISCUSSION
This study has used a quantitative, mechanicallydefined model (the CFM) to monitor the cytomechani-cal responses of fibroblasts in 3D collagen lattices, inresponse to TGF-�1 and -�3. Previous studies haveimplicated TGF-�1 in the process of connective tissue“contraction” through its long-term effect of promotingmyofibroblast differentiation, as �SMA expression[11–13]. It has also been reported to increase contrac-tion by increasing the actin content in fibroblasts [40].Enhanced contraction of mechanically unrestrained
FIG. 7. Force–time plot showing the effect on force generation of adding both TGF-� isoforms at time 0. Note the two clear phases oftractional force generation, centered on 2 and 7 h and the very high maximum force generation (70 dyn/million cells). The lower force timeprofile shows the mean response of untreated cells (2% FCS; same cell line) for comparison. Plots are 30-min points showing mean force (bars,SD: n � 3).
FIG. 8. Appearance of fibroblasts in tethered collagen gelsstained for F-actin microfilaments. Panels (a) and (b) show cells andcell processes at the 30-min stage, without and with both TGF-�isoforms, respectively. Note the dramatic enhancement of cell pro-cess extension and network formation with TGF-�s. Panels (c) and(d), also without and with both TGF-�s, show the cell networks at24 h postseeding, at which time the cell process network was essen-tially complete in both. The original magnification (�630) was thesame in all panels.
317TGF-� AND CONTRACTION
(unstressed) free-floating collagen gels with TGF-� [19]was reported by 24 h. This technique did not allowanalysis of early stage changes or quantitation of forceoutput. TGF-�1 stimulation of collagen gel contractionhas been reported to act through the protein kinase Cpathway [41] and associated with untethered (i.e., non-stressed) collagen gel contraction and increased type-Icollagen expression [42]. However, these studies pro-vide little information on TGF-�-dependent generationof tensional forces by fibroblasts. The very early onsetof stimulation is potentially highly informative since
the possible mechanisms are limited and predictable,largely in terms of cell mechanics.
The CFM records the pattern and magnitude of con-traction and key features of this are (i) the maximalforce generated at specific time points and (ii) the ini-tial rate of force generation (e.g., from 0 to 4 h). Studiesto date suggest that the initial rate of force generationis a function of cell–matrix attachment, cell motility,and resultant generation of traction forces on the ma-trix [27, 29, 43]. In contrast, forces (or matrix pre-stress) generated to maintain the “steady-state” ten-
FIG. 9. Histogram showing the influence of TGF-�1 on the dynamic expression of FnR and VnR (as relative integrated fluorescence) overa 6-h time course. Fibroblasts were treated with (a) 0 and (b) 7.5 ng/ml of TGF-�1, each in 2% FCS, and analyzed for expression of fibronectinand vitronectin integrins (�5�1 and �v�1, respectively) by immunofluorescence. Comparison between receptor detection over the time courseindicated a dramatic stimulation of vitronectin receptor expression relative to that of fibronectin, with onset within 60 min.
318 BROWN ET AL.
sion (post 10 h), also termed tensional homeostasis[20], seem to be a function of the active contraction ofcells on collagen. Both the traction and contractionstages must be strongly integrin-dependent, thoughthe density, turnover, and integrin composition arelikely to differ between what are short-term (trac-tional) versus more long-term, durable interactionsduring contraction.
Analysis of changes in expression of �SMA was notundertaken here since this is well known in the liter-ature and tends to be expressed by variable propor-tions of cultured fibroblasts. The appearance of �SMAin monolayer fibroblast cultures, following TGF-�treatment, takes a number of days [14]. Fibroblasts inthe CFM (i.e., stressed) first show signs of stress fibersat 6 h and develop prominent stress fibers as theybegin to align [44], between 8 and 12 h after the startof contraction (Tomasek and Brown, unpublisheddata). Clearly, neither of these correlate with the early-onset stimulation of force generation seen here, within10 to 20 min of TGF-� treatment, even before cells havefully attached. Indeed, it seems that there is a clearcorrelation between the time of stimulation by TGF-�and the time when cells are attaching to and spreadingthrough the collagen substrate, i.e., the traction phase[15]. There is an inescapable requirement for cell–matrix attachment to occur before force can be gener-ated in the CFM, focusing on the potential role ofintegrin function. In contrast, the temporal correlationwas poor with the standard changes in cytoskeletalstructure which might lead to force generation by con-traction (e.g., stress fiber formation, �SMA). This in-terpretation of the temporal events seems to leave twoplausible hypotheses to explain this TGF-� stimula-tion, in terms of cell mechanics. Either (a) TGF-� di-rectly stimulates force output from cytoskeletal motor(actinomyosin) elements (presumably via a receptor/intracellular signaling route) or (b) the expression ofappropriate integrins is enhanced, allowing greatertransmission of force to the matrix. However, the tem-poral correlation for the stimulation of force generationand integrin expression was the reverse of that re-quired for (b); i.e., integrin stimulation followed thestimulation of force generation.
On the basis of cell mechanics, then, the most likelyworking hypothesis from this study suggests thatTGF-� stimulates greater cytoskeletal force output, atthe time of cell attachment/spreading. Cells at thisstage (20–60 min) are still largely round, poorlyspread, with few processes [27, 38] and negligiblestress fiber organization. Force generation at this stageis thought to be mainly traction mediated as cells moveand extend processes [15]. This seems most likely tooperate through a conventional TGF-� receptor, intra-cellular cell signaling pathway, a number of which arealready well recognized [45, 46]. Interestingly, an un-
expected uncoupling of myosin light chain phosphory-lation from PDGF-stimulated collagen contraction hasbeen reported [46].
Time-dependent changes in integrin utilization inthese early stages (0–12 h) of collagen contraction havebeen reported, shifting from FnR (mainly �5�1) to VnR(�v�1) and eventually to collagen receptor (�2�1) asforce generation progresses [47, 48]. Recently, Gaf etal. [49] have reported increased motility and alpha-3,vitronectin-binding, integrin subcomponent in cardiacfibroblasts in response to TGF-�1, while Vn and itsreceptor have been implicated as key factors in cellspreading and process extension [38]. The finding thatthe stimulation of traction force generation (from cellspreading/movement) is sustained throughout theexperiment indicates that these early stage eventspredetermine the eventual matrix tension whichis maintained (tensional homeostasis). Although thestimulation of integrin expression has been eliminatedhere as a primary mechanism, it remains possible thatthis significant stimulation is itself a downstream con-sequence of increased stress in cells, following stimu-lation by TGF-�. In other words it is possible that thisis an early member of the group of cell responses whichfollow from changes in cell–matrix prestress. The im-plication of this is that the many and diverse effects ofTGF-� (including enhanced integrin expression, ma-trix deposition, and �SMA expression) may be down-stream consequences of an altered cytomechanical en-vironment (prestress in the matrix) [50]. Recentstudies are increasingly recognizing the importance ofthe local mechanical environment as a key factor infibroblast behavior [44, 50, 51].
The apparent synergy between stimulation withTGF-�1 and -�3 is consistent with the idea of the directTGF-� activation of intracellular prestress, with thecaveat that the isoforms operate through parallel, non-identical pathways. This is evident in the way that theuse of two isoforms together circumvented the inhibi-tory effect of higher doses of single TFG-� species.Indeed, this suggests a possible subtlety in the mech-anism of regulation through isoform mixtures. Recentanalyses of timed TGF-� isoform addition provide fur-ther support for a complex time-dependent interplaybetween the isoforms (in preparation).
Reduction of FCS levels is known to reduce the rateof FPCL contraction [36, 37]. It has also been shown[36] that contraction of stress-relaxed lattices was de-pendent on an organized actin cytoskeleton and thepresence of serum. The components responsible for thisFCS-mediated contraction are thought to include LPA(lysophosphatidic acid) [45] acting through myosinlight chain kinase (MLCK) and phosphatase (MLCP-Pase). Such results highlight the serum-dependence ofFPCL contraction reported here and elsewhere and itseems that at least part of this can be substituted by
319TGF-� AND CONTRACTION
TGF-�1. A parallel role for LPA in mediating TGF-�stimulation of force generation cannot be discounted inthis serum-limited (2% FCS) model, since its secretionby fibroblasts is known [52]. This seems less likely inview of the previous report of TGF-� stimulation ofcontraction using 10% serum [19], the presence of atleast some serum (and so LPA), and the rate at whichit would need to be released by fibroblasts to elicit theeffect. However, involvement of LPA becomes a morelikely mechanism in the slower, biphasic response seenwith TGF-�1 and -�3.
Stimulation of contraction at specific doses ofTGF-�1 (i.e., the bell-shaped dose response curve) isconsistent with the action of other growth factors, in-cluding PDGF [53–55]. The optimal TGF-�1 dose forcontraction seen here is comparable with the levelsused elsewhere. For example, it has been shown [12]that myofibroblast transformation (monitored as�SMA expression) was stimulated over the range of0.1–10 ng/ml of TGF-�1, while 1–10 ng/ml of TGF-�1has been used [56] to reduce MMP-1 mRNA expres-sion. A much lower dose of TGF-�2 was used to differ-entially stimulate young versus aged rat dermal fibro-blasts in unstressed, free-floating collagen gels [57],implying that the �2 isoform may have a slightly dif-ferent dose response. The observation that TGF-�1 and-�3 have a similar dose-dependent pattern of stimula-tion/inhibition on overall force generation is important.In particular, analysis of force generation with bothisoforms together established that they elicit additiveyet independent responses and so must be processedindependently by the cells. This was clear since the“total TGF-�” dose (i.e., �1 � �3) would have been inthe inhibitory dose range and could only have stimu-lated contraction if they act independently. Further-more, the appearance of a reproducible biphasic stim-ulation of force generation in the presence of bothisoforms together suggests that they may have dis-tinct, if complementary, effects.
Other reports of the up-regulation of integrin func-tion by TGF-� [4, 58] are consistent with the observa-tion of VnR up-regulation see here. This is likely toenhance cell–matrix attachment and so to influencesubsequent force generation. In turn, increased cellattachment may eventually be the downstream triggerto the assembly of prominent stress fibers. Assembly ofstress fibers would be expected to lead to greater forcegeneration on the substrate [59–61], representing an-other mechanodependent downstream amplification ofthe initial prestress. This sequence, initiated byTGF-�, would then represent the progression of cell–matrix events which leads to progressively more loadgeneration over the first 12 h.
In conclusion, TGF-�1 and -�3 stimulate traction-based force generation by fibroblasts in 3D collagenlattices within minutes of treatment. Contractile pro-
file data in response to TGF-�1 and -�3, together withTGF-�1 modification of integrin receptor expression,over the same time course, support the concept ofTGF-� as a “mechanosignaling growth factor.” Thisearly stage stimulation has the appearances of a pri-mary stimulation event, at the start of a regulatedcascade, producing a prestress through the matrix.Both TGF-� isoforms demonstrated comparable prop-erties but specific dissimilarities and their synergisticaction suggests that there is nonidentical processing. Itis suggested that the TGF-� activity acts directly oncytoskeletal motor force output and this idea is cur-rently under test.
(Note. Grinnell and Ho (study currently in press)report that TGF-� and LPA act in concert to stimulatecontraction directly and indirectly through promotionof the myofibroblast phenotype, though these effectswere regulated by mechanical stress [62].)
We are grateful to the Mountbatten Memorial Trust and JohnEllerman Foundation, EPSRC, and the European Commission fortheir joint financial support, to Dr. D. Abrahams for his kind gift ofhuman TGF-�1 and 3, and to Dr. Hein ter Linden (University Hos-pital Utrecht) for his initial technical contribution.
REFERENCES
1. Shah, M., Foreman, D. M., and Ferguson, M. W. J. (1994).Neutralising antibody to TGF-�1 and TGF-�2 reduces cutane-ous scarring in rodents. J. Cell. Sci. 107, 1137–1157.
2. Roberts, A. B., Sporn, M. B., and Assoian, R. K. (1986). Trans-forming Growth Factor type beta: Rapid induction of fibrosisand angiogenesis in vivo and stimulation of collagen formationin vitro. Proc. Natl. Acad. Sci. USA 83, 4167–4171.
3. Roberts, A. B. (1995). TGF-�: Activity and efficacy in animalmodels of wound healing. Wound Repair Reg. 3, 408–418.
4. Ignotz, R. A., and Massague, J. (1987). Cell adhesion proteinreceptors as targets for TGF� action. Cell 51, 189–197.
5. Keski-Oja, J., Raghow, R., and Sawdey, M. (1988). Regulation ofmRNA for Type 1 plasminogen activator inhibitor, fibronectinand Type I procollagen by Transforming growth factor-beta.J. Biol. Chem. 263, 3111–3115.
6. Overall, C., Wrana, J. I., and Sodek, J. (1991). Transcriptionaland post-transcriptional regulation of 72kDa gelatinase/type IVcollagenase by transforming growth factor-beta1 in human fi-broblasts. Comparison with collagenase and TIMP gene expres-sion. J. Biol. Chem. 266, 14064–14071.
7. Shah, M., Foreman, D. M., and Ferguson, M. W. J. (1995).Neutralisation of TGF-�1 and TGF-�2 by exogenous addition ofTGF-�3 to cutaneous rat wounds reduces scarring. J. Cell. Sci.108, 985–1002.
8. Murata, H., Zhou, L., Ochoa, S., Hasan, A., Badiavas, E., andFalanga, V. (1997). TGF-�3 stimulates and regulates collagensynthesis through TGF-�1 dependent and independent mecha-nisms. J. Invest. Dermatol. 108, 258–262.
9. Eickelberg, O., Kohler, E., Reichenberger, F., Bertchin, S.,Woodtli, T., Erne, P., Perruchoud, A. P., and Roth, M. (1999).Extracellular matrix deposition by primary human lung fibro-blasts in response to TGF-�1 and TGF-�3. Am. J. Physiol. LungCell. Mol. Physiol. 276, L814–L824.
320 BROWN ET AL.
10. Lanning D. A., Deigelmann R. F., Yager D. R., Wallace M. L.,Bagwell C. E., and Haynes J. H. (2000). Myofibroblast trans-formation with trasforming growth factor-beta 1 and -beta 3 incutaneous foetal excisional wounds. J. Pediatr Surg. 35, 183–187.
11. Desmouliere, A., Geinoz, A., Gabbiani, F., and Gabbiani, G.(1993). TGF-�-1 induces alpha smooth muscle actin expressionin granulation tissue myofibroblasts and in quiescent and grow-ing cultured fibroblasts. J. Cell Biol. 122, 103–111.
12. Jester, J. V., Barry-Lane, P. A., Cavanagh, H. D., and Petroll,W. M. (1996). Induction of alpha-smooth muscle actin expres-sion and myofibroblast transformation in cultured corneal ker-atocytes. Cornea 15, 505–516.
13. Masur, S. K., Dewal, H. S., Dinh, T. T., Erenburg, I., andPetridou, S. (1996). Myofibroblasts differentiate from fibro-blasts when plated at low density. Proc. Nat. Acad. Sci. USA 93,4219–4223.
14. Desmouliere, A., and Gabbiani, G. (1994). Modulation of fibro-blastic cytoskeletal features during pathological situations: therole of extracellular matrix and cytokines. Cell Motil. Cytoskel-eton 29, 195–203.
15. Harris, A. K., Stopak, D., and Wild, P. (1981). Fibroblast trac-tion as a mechanism for morphogenesis. Nature 290, 249–251.
16. Palecek, S. P., Loftus, J. C., Ginsberg, M. H., Lauffenberger,D. A., and Horwitz, A. F. (1997). Intgrin-ligand binding prop-erties govern cell migration speed through cell-substratum ad-hesiveness. Nature 385, 537–540.
17. Elsdale. T., and Bard, J. (1972). Collagen substrata for studieson cell behaviour. J. Cell Biol. 54, 626–637.
18. Bell, E., Ivasson, B., and Merill, C. (1979). Production of atissue-like structure by contraction of collagen lattices by hu-man fibroblasts of different proliferative potential in vitro. Proc.Natl.Acad. Sci. USA 76, 1274–1278.
19. Montesano, R., and Orci, L. (1988). Transforming growth factorbeta stimulates collagen matrix contractionby fibroblsts: impli-cations for wound healing. Proc.Natl.Acad Sci. USA 85, 4894–4897.
20. Brown, R. A., Prajapati, R., McGrouther, D. A., Yannas, I. V.,and Eastwood, M. (1998). Tensional homeostasis in dermalfibroblasts: Mechanical responses to mechanical loading inthree-dimensional substrates. J. Cell. Physiol. 175, 323–332.
21. Porter, R. A., Brown, R. A., Eastwood, M., Khaw, P., andOccleston, N. (1998). Ultrastructural changes during contrac-tion of collagen lattices by ocular fibroblasts. Wound RepairRegen. 6, 157–166.
22. Grinnell, F., Ho, C. H., Lin, Y. C., and Skuta, G. (1999). Differ-ences in the regulation of fibroblast contraction of floating ver-sus stressed collagen matrices. J. Biol. Chem. 274, 918–923.
23. Grinnell, F., Zhu, M., Carlson, M. A., and Abrams, J. M. (1999).Release of mechanical tension triggers apoptosis of human fi-broblasts in a model of regressing granulation tissue. Exp. CellRes. 248, 608–619.
24. Delvoye, P., Wiliquet, P., Leveque, J. L., Nusgens, B. V., andLapiere, C. M. (1991). Measurement of mechanical forces gen-erated by skin fibroblasts embedded in a 3D collagen gel. J. In-vest. Dermatol. 97, 898–902.
25. Kolodney, M. S., and Wysolmerski, R. B. (1992). Isometric con-traction by fibroblasts and endothelial cells in tissue culture: aquantitative study. J. Cell Biol. 117, 73–82.
26. Eastwood, M., McGrouther, D. A., and Brown, R. A. (1994). Aculture force monitor for measurement of contraction forcesgenerated by dermal fibroblast cultures: Evidence for cell-ma-trix mechanical signaling. Biochem. Biophys. Acta 1201, 186–192.
27. Eastwood, M., Porter, R. A., Khan, U., McGrouther, D. A., andBrown, R. A. (1996). Quantitative analysis of collagen gel con-tractile forces generated by dermal fibroblasts and their rela-tionship to cell morphology. J. Cell. Physiol. 166, 33–42.
28. Brown, R. A., Talas, G., Porter, R. A., and McGrouther, D. A.,Eastwood, M. (1996). Balanced mechanical forces and microtu-bule contribution to fibroblast contraction. J. Cell. Physiol. 169,439–447.
29. Ehrlich, H. P., and Rajaratnam, J. B. (1990). Cell locomotionforces versus cell contraction forces for collagen lattice contrac-tion: an in vitro model of wound contraction. Tissue Cell 22,407–417.
30. Glimcher, M. J. (1992). The biochemistry, structure and mac-romolecular organisation of collagen in Dupuytren’s disease. In“Collagen, Vol. V, Pathobiology” A. H. Kang and ME Nimni,Eds.), pp. 137–165, CRC Press, Boca Raton.
31. Skalli, O., Ropraz, P., Trzeciak, A., Benzonana, G., Gillessen,D., and Gabbiani, G. (1986). A monoclonal antibody against asmooth muscle actin: A new probe for smooth muscle differen-tiation. J. Cell Biol. 103, 2787–2796.
32. Serini, G., and Gabbiani, G. (1999). Mechanisms of myofibro-blast activity and phenotypic modulation. Exp. Cell Res. 250,273–283.
33. Burt, A. M., and McGrouther, D. A. (1994). Production and useof skin cell cultures in therapeutic situation. In “Animal CellBiotechnology,” pp. 150–168, Academic Press, New York.
34. Greenberg, G., and Boyde, A. (1993). Novel method for stereoimaging in light microscopy at high magnifications. Neuroim-age 1, 121–128.
35. Faulstich, H., Zobeley, S., Heintz, D., and Drewes, G. (1993).Probing the phalloidin binding site actin. FEBS Lett. 318, 218–222.
36. Tomasek, J. J., Haaksma, C. J., Eddy, R. J., and Vaughan, M. B.(1992). Fibroblast contraction occurs on release of tension inattached collagen lattices: Dependency on an organized actincytoskeleton and serum. Anat. Rec. 232, 359–368.
37. Grinnell, F. (1994). Review: Fibroblasts, myofibroblasts andwound contraction. J. Cell Biol. 124, 401–404.
38. Talas, G., Adams, T. S. T., Eastwood, M., Rubio, G., and Brown,R. A. (1997). Phenytoin reduces the contraction of RecessiveDystrophic Epidermolysis Bullosa fibroblast populated collagengels. Int. J. Biochem. Cell Biol. 29, 261–270.
39. Adams, J. C., and Watt, F. M. (1993). Changes in keratinocyteadhesion during terminal differentiation: Reduction in fi-bronectin binding precedes �5�1 integrin loss from the cellsurface. Cell 63, 425–435.
40. Franzen, L. E., Ghassemifar, M. R., Lonnberg, B., Schultz,G. G., and Tarpila, E. (1996). Stimulation of protracted connec-tive tissue repair in normal mice by TGF�-1. Scand. J. Plast.Reconstr. Surg. Hand Surg. 30, 267–273.
41. Sakamoto, T., Hinton, D. R., Sakamoto, H., Oganesian, A.,Kohen, L., Gopalakrishna, R., and Ryan, S. J. (1994). Collagengel contraction induced by retinal pigment epithelial cells andchoroidalfibroblasts involves the protein kinase C pathway.Curr. Eye Res. 13, 451–459.
42. Reed, M. J., Vernon, R. B., Abrass, I. B., and Sage, E. H. (1994).TGF-�-1 induces the expression of type-I-collagen and SPARC,and enhances contraction of collagen gels, by fibroblasts fromyoung and aged donors. J. Cell. Physiol. 158, 169–179.
43. Khaw, P. T., Occleston, N. L., Schultz, G. S., Grierson, I.,Sherwood, M. B., and Larkin, G. (1994). Activation & suppres-sion of fibroblast activity. Eye 8, 188–195.
44. Eastwood, M., Mudera, V. C., McGrouther, D. A., and Brown,R. A. (1998). Effect of precise mechanical loading on fibroblast
321TGF-� AND CONTRACTION
populated collagen lattices: morphological changes. Cell Motil.Cytoskeleton 40, 13–21.
45. Parizi, M., Howard, E. W., and Tomasek, J. J. (2000). Regula-tion of LPA-promoted myofibroblast contraction: role of myosinlight chain kinase and phosphatase. Exp. Cell Res. 254, 210–220.
46. Skuta, G., Ho, C-H., and Grinnell F. (1999). Increased myosinlight chain phosphorylation is not required for growth factorstimulation of collagen matrix contraction. J. Biol Chem. 274,30163–30168.
47. Sethi, K. K. (1999). “Controlled Fibroblast-Mediated CollagenContraction: Importance and Mechanism of Cell Attachment inthe Contraction Process,” Ph.D. thesis, University College Lon-don.
48. Sethi, K. K., Yannas, I. V, Mudera, V., Eastwood, M., McFar-land, C., and Brown, R. A. Sequential utilization of fibronectin,vitronectin and collagen during fibroblast-mediated collagencontraction, (submitted for publication).
49. Graf, K., Neuss, M., Stawowy, P., Hsueh, W. A., Fleck, E., andLaw, R. E. (2000). Angiotensin II and alpha (v) beta(3) integrinexpression in rat neonatal cardiac fibroblasts. Hypertension 35,978–984.
50. Arora, P. D., Narani, N., and McCulloch (1999). The complianceof collagen gels regulates transforming growth factor-� induc-tion of �-smooth muscle actin in fibroblasts. Am. J. Pathol. 154,871–882.
51. Mudera, V. C., Pleass, R., Eastwood, M., Tarnuzzer, R., Schultz,P., Khaw, D. A., McGrouther, D. A., and Brown, R. A. (2000).Molecular responses of human dermal fibroblasts to dual cues:Contact guidance and mechanical load. Cell Motil. Cytoskeleton45, 1–9.
52. Pages C., Simon M. F., Valet P., Saulnier-Blanche J. S. (2001).Lysophosphatidic acid synthesis and release. ProstaglandinLipid Mediator 64, 1–10.
53. Tingstrom, A., Heldin, C. H., and Rubin, K. (1992). Regulationof fibroblast-mediated collagen gel contraction by PDGF, IL-1-alpha and TGF-�-1. J. Cell Sci. 102, 315–322.
54. Kirchberg, K., Lange, T. S., Klein, E. C., Jungtaubl, H., Heinen,G., Meyer-Ingold, W., and Scharffetter-Kochanek, K. (1995).Induction of beta-1 integrin synthesis by recombinantPDGF-AB correlates with an enhanced migratory response ofhuman dermal fibroblasts to various extracellular matrix pro-teins. Exp. Cell Res. 220, 29–35.
55. Younai, S., Venters, G., Vu, S., Nichter, L., Nimni, M. E., andTuan, T. L. (1996). Role of growth factors in scar contraction: anin vitro analysis. Ann. Plast. Surg. 36, 495–501.
56. Alvares, O., Klebe, R., Grant, G., and Cochran, D. L. (1995).Growth factor effects on the expression of collagenase andTIMP-1 in peridontal ligament cells. J. Peridontal. 66, 552–558.
57. Ballas, C. B., and Davidson, J. M. (2001). Delayed wound heal-ing in aged rats is associated with increased collagen gel re-modeling and contraction by skin fibroblasts, not with differ-ences in apoptotic or myofibroblast cell populations. WoundRepair Regen. 9, 223–237.
58. Riikonen, T., Koivisto, L., Vihinen, P., and Heino, J. (1995).Transforming growth factor beta regulated collagen gel contrac-tion by increasing alpha 2 beta 1 integrin expression in osteo-genic cells. J. Biol Chem. 270, 376–382.
59. Burridge, K. (1981). Are stress fibres contractile? Nature 294,691–692.
60. Chrzanowska, M., and Burridge, K. (1996). Rho-stimulated con-tractility drives the formation of stress fibers and focal adhe-sions. J. Cell Biol. 133, 1403–1415.
61. Mochitate K., Pawelek P., and Grinnell F. (1991). Stress relax-ation of contracted collagen gels: Disruption of actin filamentbundles, release of cell surface fibronectin, and down regulationof DNA and protein synthesis. Exp. Cell Res. 193, 198–207.
62. Grinnell, F., and Ho, C.-H. Transforming growth factor �stimuolates fibroblasts-collagen matrix contraction by differentmechanisms in mechanically loaded and unloaded matrices.Exp. Cell Res. 273, 248–255.
Received September 24, 2001Published online February 20, 2002
322 BROWN ET AL.