Detection of inter-hemispheric metabolic asymmetries in FDG-PET images using prior anatomical...
8
Detection of inter-hemispheric metabolic asymmetries in FDG-PET images using prior anatomical information L. Zhou a,b , P. Dupont b,c, ⁎, K. Baete a , W. Van Paesschen d , K. Van Laere a , J. Nuyts a,b a Nuclear Medicine, KU Leuven and UZ Leuven, Leuven, Belgium b Medical Imaging Center, KU Leuven and UZ Leuven, Leuven, Belgium c Cognitive Neurology, KU Leuven and UZ Leuven, Leuven, Belgium d Experimental Neurology, KU Leuven and UZ Leuven, Leuven, Belgium abstract article info Article history: Received 24 June 2008 Revised 17 July 2008 Accepted 20 July 2008 Available online 3 August 2008 Keywords: Asymmetry index Positron emission tomography [ 18 F] FDG positron emission tomography (PET) is commonly used to highlight brain regions with abnormal metabolism. Correct interpretation of FDG images is important for investigation of diseases. When the FDG uptake is compared between hemispheres, confusion can arise because it might be difficult to determine whether an observed asymmetry is physiological and due to normal anatomical variation or pathological. In this paper we propose a new method, which calculates an anatomy-corrected asymmetry index (ACAI), to highlight inter-hemispheric metabolic asymmetry in FDG images without the influence of anatomical asymmetry. Using prior anatomical information from MRI, the ACAI method only takes into account voxels that belong to a certain anatomical class. For the evaluation of detection performance, this method is applied on homogeneous brain phantoms and realistic analytical simulated FDG-PET images with known asymmetries. Results from these simulations demonstrated the validity of ACAI and its potential perspective in the future. © 2008 Elsevier Inc. All rights reserved. Introduction [ 18 F]fluorodeoxyglucose ([ 18 F]FDG) positron emission tomography (PET) is useful in the evaluation of neurological diseases, such as epilepsy, by detecting abnormalities in the cerebral glucose metabo- lism. In a number of pathologies usually one hemisphere is predominately affected. Comparing the metabolism in homologous regions between both hemispheres is a sensitive way of detecting hypo- or hypermetabolic regions. Therefore, the inter-hemispheric metabolic asymmetry is one of the most helpful information for the analysis of the FDG-PET image. Visual assessment of FDG-PET images is widely used in a clinical situation, but the results are observer- dependent. Therefore, quantification methods are needed for accurate diagnosis. Several methods have been proposed for detecting the functional asymmetry of the brain: a region of interest (ROI)-based or a volume of interest (VOI)-based method (Kang et al., 2001), voxel neighborhood-based methods (Aubert-Broche et al., 2003, 2005), voxel-based methods (Signorini et al., 1999; Van Bogaert et al., 2000) and methods based on global information (Volkau et al., 2006). However, these methods suffer from either the subjectivity of manually drawing the regions of interest, or the influence from the asymmetric anatomical structure of the human brain. In this paper, we propose an unsupervised method to detect the inter-hemispheric metabolic asymmetry by calculating an anatomy- corrected asymmetry index (ACAI) of the investigated image. In comparison with the methods mentioned above, ACAI can effectively avoid the impact from the asymmetric structure of the brain, and only focus on the asymmetry caused by abnormal metabolism. The basic idea of ACAI method is to take advantage of the anatomical information obtained from magnetic resonance imaging (MRI), and construct an asymmetry indices (AI) map based on the classification of voxels. The algorithm of ACAI is concisely described and a validation procedure is performed by a set of simulation images to evaluate the detection performance of this new method. Materials and methods Firstly, we describe the definition of a conventional AI (Aubert- Broche et al., 2005), which is referred as non-corrected asymmetry index (NCAI) in contrast to ACAI. Then the basic algorithm of ACAI as well as its implementation process in the practical application is explained in detail. Lastly, the simulation experiments which were used to validate our ACAI method are described. Definition and algorithm NCAI Assume that for a target image, whose inter-hemispheric asym- metries need to be investigated, the mid-sagittal plane is well defined. NeuroImage 44 (2009) 35–42 ⁎ Corresponding author. Labo for Cognitive Neurology and Medical Imaging Center, O&N II, Herestraat 49, bus 1022, 3000 Leuven, Belgium. E-mail address: [email protected] (P. Dupont). 1053-8119/$ – see front matter © 2008 Elsevier Inc. All rights reserved. doi:10.1016/j.neuroimage.2008.07.047 Contents lists available at ScienceDirect NeuroImage journal homepage: www.elsevier.com/locate/ynimg
Transcript of Detection of inter-hemispheric metabolic asymmetries in FDG-PET images using prior anatomical...
NeuroImage 44 (2009) 35–42
Contents lists available at ScienceDirect
NeuroImage
j ourna l homepage: www.e lsev ie r.com/ locate /yn img
Detection of inter-hemispheric metabolic asymmetries in FDG-PET images usingprior anatomical information
L. Zhou a,b, P. Dupont b,c,⁎, K. Baete a, W. Van Paesschen d, K. Van Laere a, J. Nuyts a,b
a Nuclear Medicine, KU Leuven and UZ Leuven, Leuven, Belgiumb Medical Imaging Center, KU Leuven and UZ Leuven, Leuven, Belgiumc Cognitive Neurology, KU Leuven and UZ Leuven, Leuven, Belgiumd Experimental Neurology, KU Leuven and UZ Leuven, Leuven, Belgium
⁎ Corresponding author. Labo for Cognitive NeurologO&N II, Herestraat 49, bus 1022, 3000 Leuven, Belgium.
E-mail address: [email protected] (P
1053-8119/$ – see front matter © 2008 Elsevier Inc. Alldoi:10.1016/j.neuroimage.2008.07.047
a b s t r a c t
a r t i c l e i n f oArticle history:
[18F] FDG positron emission Received 24 June 2008Revised 17 July 2008Accepted 20 July 2008Available online 3 August 2008Keywords:Asymmetry indexPositron emission tomography
tomography (PET) is commonly used to highlight brain regions with abnormalmetabolism. Correct interpretation of FDG images is important for investigation of diseases. When the FDGuptake is compared between hemispheres, confusion can arise because it might be difficult to determinewhether an observed asymmetry is physiological and due to normal anatomical variation or pathological. Inthis paper we propose a new method, which calculates an anatomy-corrected asymmetry index (ACAI), tohighlight inter-hemispheric metabolic asymmetry in FDG images without the influence of anatomicalasymmetry. Using prior anatomical information fromMRI, the ACAImethod only takes into account voxels thatbelong to a certain anatomical class. For the evaluation of detection performance, this method is applied onhomogeneous brain phantoms and realistic analytical simulated FDG-PET images with known asymmetries.Results from these simulations demonstrated the validity of ACAI and its potential perspective in the future.
© 2008 Elsevier Inc. All rights reserved.
Introduction
[18F]fluorodeoxyglucose ([18F]FDG) positron emission tomography(PET) is useful in the evaluation of neurological diseases, such asepilepsy, by detecting abnormalities in the cerebral glucose metabo-lism. In a number of pathologies usually one hemisphere ispredominately affected. Comparing the metabolism in homologousregions between both hemispheres is a sensitive way of detectinghypo- or hypermetabolic regions. Therefore, the inter-hemisphericmetabolic asymmetry is one of the most helpful information for theanalysis of the FDG-PET image. Visual assessment of FDG-PET imagesis widely used in a clinical situation, but the results are observer-dependent. Therefore, quantificationmethods are needed for accuratediagnosis. Several methods have been proposed for detecting thefunctional asymmetry of the brain: a region of interest (ROI)-based ora volume of interest (VOI)-based method (Kang et al., 2001), voxelneighborhood-based methods (Aubert-Broche et al., 2003, 2005),voxel-based methods (Signorini et al., 1999; Van Bogaert et al., 2000)and methods based on global information (Volkau et al., 2006).However, these methods suffer from either the subjectivity ofmanually drawing the regions of interest, or the influence from theasymmetric anatomical structure of the human brain.
y and Medical Imaging Center,
. Dupont).
rights reserved.
In this paper, we propose an unsupervised method to detect theinter-hemispheric metabolic asymmetry by calculating an anatomy-corrected asymmetry index (ACAI) of the investigated image. Incomparison with the methods mentioned above, ACAI can effectivelyavoid the impact from the asymmetric structure of the brain, and onlyfocus on the asymmetry caused by abnormal metabolism. The basicidea of ACAI method is to take advantage of the anatomicalinformation obtained from magnetic resonance imaging (MRI), andconstruct an asymmetry indices (AI) map based on the classification ofvoxels. The algorithm of ACAI is concisely described and a validationprocedure is performed by a set of simulation images to evaluate thedetection performance of this new method.
Materials and methods
Firstly, we describe the definition of a conventional AI (Aubert-Broche et al., 2005), which is referred as non-corrected asymmetryindex (NCAI) in contrast to ACAI. Then the basic algorithm of ACAI aswell as its implementation process in the practical application isexplained in detail. Lastly, the simulation experiments which wereused to validate our ACAI method are described.
Definition and algorithm
NCAIAssume that for a target image, whose inter-hemispheric asym-
metries need to be investigated, the mid-sagittal plane is well defined.

Fig. 1. Locations and the size of four hypermetabolic 3-D ROIs that were used in thesimulation experiments. The location of each ROI is visualized in black for the centralplane through the ROI.
36 L. Zhou et al. / NeuroImage 44 (2009) 35–42
Taking a volume of interest (VOI) and its homologous VOI in this targetimage, the mean intensity of the voxel values within each VOI can beestimated. NCAI is thus calculated by comparing these two meanintensity values. The whole procedure can be considered as two steps:step 1 is a convolution between the target image and a certainconvolution kernel (weighting), which generates a volumetric imageVINC. Step 2 is the subtraction between VINC and its homologous image(which is the same image but flipped around the mid-sagittal plane),generating the NCAImap. The basic idea of NCAI can be depicted as thefollowing equations:
VINC ið Þ =
PjaKi
wijTjPjaKi
wijð1Þ
NCAI ið Þ = 200� VINC ið Þ − VINC i′ð ÞVINC ið Þ + VINC i′ð Þ ð2Þ
where VINC(i) is the value of the volumetric image in voxel i, Ki isthe convolution kernel centered in voxel i, wij is the weight of Ki atvoxel j, Ti is the value of the target image in voxel i, i′ is thehomologous voxel of i. Note that in the calculation of NCAI, allvoxels in the target image are taken into account at the convolutionand subtraction steps.
ACAIAssume that the target image (e.g. the FDG image) and its MRI-
based fuzzy segmentations are available with high image quality,and already well coregistered. Normally the segmentation imagesare the fraction images of N different tissue classes (e.g. gray matter(GM), white matter (WM), cerebrospinal fluid (CSF), etc.). The valuesof the voxels in the segmentation images are between 0 and 1,representing the probability that the voxel belongs to that specifictissue class. Depending on the application, segmentation images oftissue classes of interest are selected, leading to the anatomicalinformation that will be used. In this article we aimed atinvestigating the metabolic abnormalities in the FDG image in thegray matter of patients with partial epilepsy. Therefore thesegmentation of gray matter was selected as the prior anatomicalinformation used for further calculation.
Similar to NCAI, there are also a convolution step and a subtractionstep in the ACAI calculation. Only voxels that belong to the tissue ofinterest, i.e. the voxels that have a non-zero probability in the segmen-tationmap, are considered into the convolution step. In our study, onlyvoxels having a non-zero GM probability are taken into consideration.This is done by limiting the weighting of the convolution kernel tothese voxels and by weighting the voxels according to the convolutionkernel and the probabilities given by the segmentation map. Theweighted sum is normalized by the total weight of the GM voxelscovered by that kernel. This step results in a volumetric imageVIAC. Thewhole basic idea can be concisely written as Eq. (3):
VIAC ið Þ =
PjaKi\A
wijajTjP
jaKi\Awijaj
ð3Þ
where VIAC(i) is the value of the volumetric image in voxel i, A is thesegmentation map for the tissue class of interest, and aj is theprobability of the segmentation (i.e. the value of A) in voxel j used asthe prior anatomical information. In principle, any kernel with asymmetrical shape can be used in this procedure. This algorithm canbe used for calculating the volumetric images of different tissueclasses simultaneously. However, in this article we only use thesegmentation A of the GM.
To acquire the ACAI map of a certain tissue class defined bythe segmentation A, again every voxel in the volumetric image
is compared with its homologous voxel. The ACAI are thusdefined as:
ACAI ið Þ = 200� VIAC ið Þ − VIAC i′ð ÞVIAC ið Þ + VIAC i′ð Þ iaA
0 igA
8<: ð4Þ
Note that only voxels localized in that segmentation map A ismaintained in the final ACAI map, all the rest are set to zero.
Validation
In order to evaluate the performance of our new method, we useddifferent phantoms (see below). Comparisonwas made between ACAIand NCAI methods. Mean values of AI within a certain region ofinterest acquired from both methods were calculated and comparedwith referential asymmetry indices.
To validate the ability of our ACAI method in eliminating theanatomical asymmetries, a 3-D digital software phantom, which isprovided by the BrainWeb database at McGill University (Montreal,Canada, http://www.bic.mni.mcgill.ca/brainweb/), was used as aperfect image in our experiment. The dimensions of the softwarephantom are 181×217×181 voxels with an isotropic voxel size of1 mm. GM, WM and CSF were identified by the discrete anatomicalmodel, in which each voxel was classified into a certain tissue class.This software phantom can be considered as an ideal brain phantomsince the signal in every tissue class is homogeneous, and every voxelis clearly classified into either GM, WM or CSF. For the simulation ofmetabolic abnormalities, four 3-D regions within GM were deli-neated (Baete et al., 2004b) on this brain phantom as region ofinterest (ROI) by MRIcro software (http://www.mricro.com/). Thelocations and the sizes of these four ROIs are given in Fig. 1. Thesignal was increased by 20% in these regions. From here onwards, wecall the brain phantom without the additional hyperintense ROI“baseline phantom”, while the brain phantom with those ROI iscalled “asymmetric phantom”.
For the validation of our method on realistic images, a set ofsimulated FDG images were constructed based on these two digitalbrain phantoms. Accordingly, baseline and asymmetric FDG imageswere generated during the simulation, which represented the normal

Fig. 2. Mean AI (both ACAI and NCAI) of each ROI in the original brain phantoms (dimensions 181×217×181) calculated using a Gaussian kernel. A and B are short for “Asymmetric”and “Baseline” phantom, respectively. The dashed line represents the true AI value. Note that ACAI of all ROI in the baseline image are almost zero.
37L. Zhou et al. / NeuroImage 44 (2009) 35–42
FDG-PET of a human brain and the one with additional metabolicabnormalities, respectively. To simulate the tracer distribution innormal human brain, tracer activity uptake was set to 4 counts/mm3 in GM, 1 count/mm3 in WM, and no uptake in CSF. In thesimulated asymmetric phantoms, the tracer activity uptake in thefour regions of interest was increased by 20%. Sinograms of asimulated PET were generated from the brain phantoms asdescribed by Baete et al. (2004a,b). With the tracer uptake valuesmeasured above, a realistic number of counts in the sinograms wasobtained. Poisson noise was added to these sinograms and thereconstruction was performed including the attenuation correctionand using ordered subset expectation maximization (OSEM)(Hudson and Larkin, 1994) using the following iteration scheme(iteration×subset): 1×18, 1×16, 1×12, 1×8, 1×6, 1×3. For eachtracer uptake image, 100 different Poisson noise realizations werederived, generating 100 different pairs of images. The dimensions ofthe simulated FDG images are 100×100×73 voxels, with anisotropic voxel size of 2.25 mm.
Two referential AI values were adopted in our study. One is thetrue AI which is in accord with the 20% added hyperintensity inROIs:
AItrue = 200� 1:2 − 11:2 + 1
= 18:18%
The other is the “best” AI that we can obtain in each ROI given thesimulated PET scanner. Due to the limited spatial resolution of PETscanner, the referential AI values AIROIref are much lower than AItrue. Toacquire AIROIref , mean images of 100 baseline and 100 asymmetric FDG
phantoms were computed and subtracted. The referential AI in eachROI is defined by
AIrefROI = 200� AROI − BROI
AROI + BROIð5Þ
where AROI and BROI represent the mean value of a certain ROI in themean asymmetric image and the mean baseline image, respectively.
For the evaluation, first, both methods (NCAI and ACAI) wereapplied on the original digital brain phantoms, in order to estimatetheir ability in dealing with two different asymmetries (anatomicaland metabolic) in such perfect images. Then, both methods wereapplied to the 100 baseline and 100 asymmetric simulated imagesto estimate their performance on the realistic FDG images. AGaussian kernel was adopted in all simulations, with its full widthat half maximum (FWHM) ranging from 1 to 5 voxels. On theresultant asymmetry index maps, mean AI of all voxels withineach ROI was calculated. Results from the two methods werecompared for each ROI. The true AI and the referential AI obtainedfrom the mean images were used to evaluate to what extent themetabolic asymmetries can be detected and the anatomicalasymmetries can be minimized by the method with prioranatomical information.
Implementation
The algorithm was implemented as follows: the first step was torigidly coregister the MRI and the MRI-based segmentation images tothe target image (or vice versa). Segmentation and registration were

Fig. 3. Median and maximum ACAI of each ROI of the original brain phantom with 4 induced hypermetabolic regions calculated using a Gaussian kernel. A and B are short for“Asymmetric” and “Baseline” phantom, respectively. The dashed line represents the true AI value.
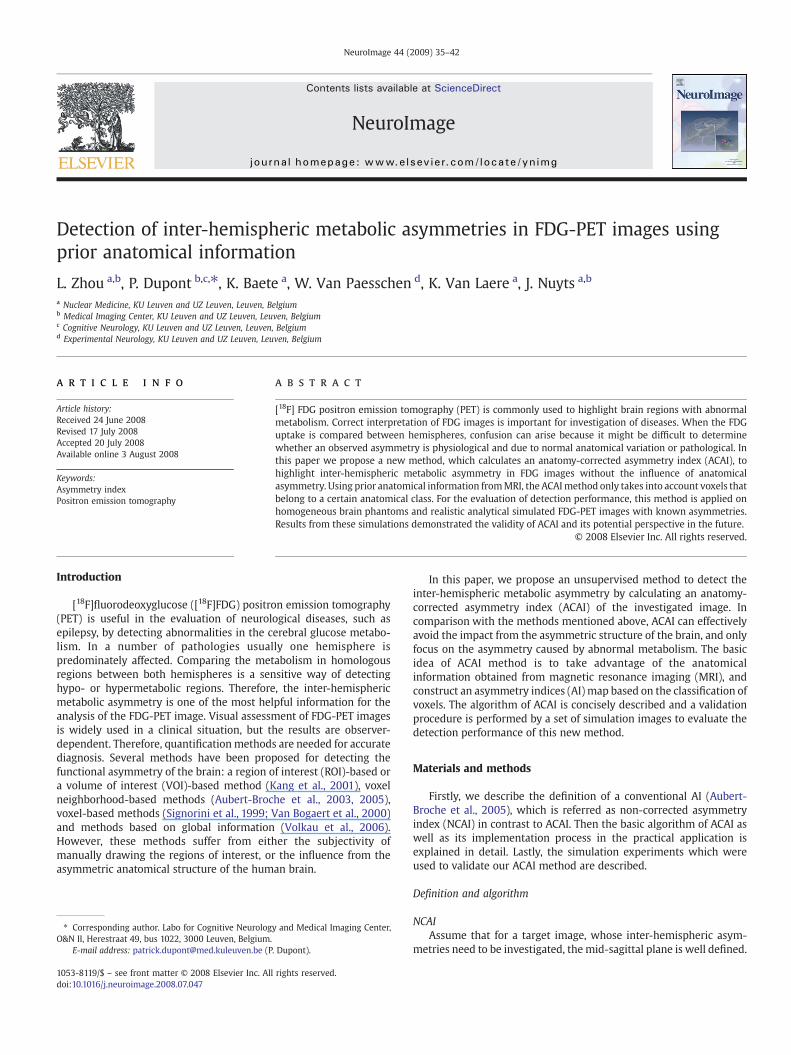
Fig. 4.Mean AI of 100 baseline and 100 phantom images acquired by bothmethods using a Gaussian kernel. The standard deviations of AI values across 100 images are plotted as well.A and B are short for “Asymmetric” and “Baseline” FDG images, respectively. ACAI curves are plotted by solid lines, while NCAI curves are depicted by dashed lines. The two horizontallines represent the true AI value (dashed line) and the referential AI in each ROI (dash-dotted line), respectively.
38 L. Zhou et al. / NeuroImage 44 (2009) 35–42

39L. Zhou et al. / NeuroImage 44 (2009) 35–42
performed using SPM2 (http://www.fil.ion.ucl.ac.uk/spm/). In order todefine the mid-sagittal plane in an automatic way, all these imageswerewarped to the Montreal Neurological Institute (MNI) space usingthe PET template provided in SPM2. The prior anatomical informationwas extracted from the segmentation images of a certain tissue class.The volumetric images (VINC, VIAC) were computed according to Eq. (1)and Eq. (3). To determine the homologous regions on the twohemispheres automatically, both volumetric images were flippedalong the mid-sagittal plane. Voxels located at the correspondingplace in the original and the flipped volumetric images wereconsidered as a pair of homologous voxels. The outcome NCAI andACAI maps were then calculated by Eq. (2) and Eq. (4), respectively.Both methods were implemented in MATLAB 6.5, Release 13.
Application
To demonstrate that the ACAImethod can be applied on real data, aFDG image of an epilepsy patient showing visually a metabolicasymmetry and the corresponding MRI image was selected. The FDGimage and the anatomical MRI (3-D MPRAGE) were acquiredaccording to the standard clinical protocol. Segmentation andwarpinginto MNI space was done using SPM2.
Results
Fig. 2 depicts AI values (both ACAI and NCAI) of the original brainphantoms (dimensions 181×217×181) using a Gaussian kernel. Foreach ROI, the mean ACAI and the mean NCAI (shortly referred as“ACAI” and “NCAI” in the following text) over the whole region werecalculated. As theoretically predicted, for the baseline brain phantom,ACAI in every ROI almost equals zero. For the asymmetric brainphantom, ACAI clearly depicts the inter-hemispheric functionalasymmetries in 4 induced hyperintense regions. Using a FWHM of 1voxel for the Gaussian kernel, ACAI in these ROIs are very close toAItrue. The underestimation of the true value is due to voxels at theborder of each region which have a lower AI, therefore we also showthe median and the maximum ACAI values (Fig. 3). As expected, the
Fig. 5. An example of the method applied on a single noise realization using a Gaussian kerne2 (marked by the white circle) for the asymmetric image, as well as the corresponding NCA
maximumACAI values are higher andmuch closer to the true AI value.In the remainder of the text, we will only report the results on themean AI values.
The NCAI curves of the original brain phantoms are shown in thelower row in Fig. 2. With NCAI, large asymmetries are detected in thebaseline brain phantom which has no intensity variation but only theanatomical asymmetries. NCAI of the baseline phantom varies greatlyfrom ROI to ROI and depends on the kernel size. For the asymmetricphantom, an increase of NCAI is detected at each ROI compared to thebaseline case. Obviously, NCAI contains both the anatomical andfunctional asymmetries, which cannot be separated by this method.
The results reported in Figs. 2 and 3 are for the high-resolutionphantoms in an ideal situation. However, when a PET measurement issimulated, the results will include the effect of the limited spatialresolution of the scanner and of noise introduced during themeasurement. The results in that case are shown in Fig. 4. The ACAIand NCAI curves of 100 baseline and 100 asymmetric simulated FDGimages, calculated with the Gaussian kernel, are plotted as function ofthe FWHM of the Gaussian kernel for the different regions of interest.Each point on the curve represents the mean AI of 100 simulationimages in a certain ROI calculated at a certain kernel size. The resultsof NCAI are similar with those obtained from the original brainphantoms. In comparison with NCAI, ACAI method remarkablyreduces the residual AI in the baseline images. In most ROIs, theACAI of the baseline are much closer to zero, which means that theasymmetries due to anatomical variation are greatly minimized.Furthermore, the difference in asymmetry (between the asymmetricphantom and the baseline phantom) is always larger for ACAIcompared to NCAI.
Fig. 5 shows an example of a reconstruction of one single noiserealization in a transaxial slice through ROI 2 (both for the asymmetricand the baseline phantom) using a Gaussian kernel with 5 voxelsFWHM. NCAI shows a clear asymmetry near ROI 2 in the asymmetricimage, but this is also the case for the baseline phantom. Furthermore,several other regions (with no metabolic asymmetry in the originalphantom) also show obvious asymmetries. The ACAI method showslittle asymmetry in the baseline phantom and a clear – but smaller –
l with a FWHM of 5 voxels. Top rowgives the reconstruction of an axial slice through ROII/ACAI overlay image. The bottom row shows the same for the baseline image.

Fig. 6. A schematic figure of the application of the ACAI method in a clinical environment.
40 L. Zhou et al. / NeuroImage 44 (2009) 35–42
asymmetry in ROI 2 and almost no other voxels with an asymmetry of10% or more in the asymmetric phantom.
Fig. 6 depicts a schematic figure of the application of the ACAImethod in a clinical environment. An example of this method on realpatient data is shown in Fig. 7. Segmentations were obtained usingSPM2. For the real patient data we applied a Gaussian kernel with 9voxels FWHM. This clearly depicts the area of asymmetricmetabolism.For the NCAI method, a large kernel is a disadvantage becausedifferent tissue classes are intermixed. Therefore, we also show theresults of NCAI when using a smaller Gaussian kernel (FWHM=3voxels).
Discussion
The proposed ACAI method aims at detecting inter-hemisphericmetabolic asymmetries in brain FDG-PET images without theinfluence of anatomical asymmetries due to the intrinsic localasymmetrical structure of human brain. For this purpose, prioranatomical information obtained fromMRI segmentation is integratedinto the voxel-based computation to calculate the inter-hemisphericdifference. In comparison with the conventional NCAI method, ourmethod can highlight the metabolic asymmetries in the outcome AI
map by taking into account the anatomical asymmetries. Usefulinformation about the abnormal metabolism can be picked up moreeasily and clearly by the proposed method.
Factors that affect the results
Our simulated baseline images only have anatomical asymmetries,while the simulated phantom images contain both anatomical andmetabolic asymmetries. The challenge is to solely pick out inter-hemispheric metabolic differences in simulated images, whileremoving all influences from anatomical asymmetries. The experi-ment on the original homogeneous brain image shows that the ACAImethod achieves this in ideal, high-resolution images. Nevertheless,when data are used which simulate the reconstruction of a PETmeasurement (including statistical noise and limited spatial resolu-tion) ACAI was only partially successful in removing the anatomicalasymmetries: e.g. in ROI 2, where the residual AI is relatively large andcannot be neglected in the interpretation (Fig. 4).
There are several factors that can influence the outcomeasymmetry indices map: the accuracy of MRI segmentation, thecoregistration between MRI and FDG images, the accuracy of definingthe homologous regions, the complexity of the ROI in combination

Fig. 7. The application of our ACAI algorithm on a FDG image of an epileptic patient. A transaxial slice of the original FDG image is shown (A) together with the GM segmentation map.The asymmetry index image overlayed on the GM or FDG images for the ACAI method (B) and NCAI method (C). A Gaussian kernel was used with a FWHM of 9 voxels. To avoid toomuch effect of other tissue classes in the NCAI method, we also show the results for NCAI with a Gaussian kernel with a FWHM of 3 voxels (D).
41L. Zhou et al. / NeuroImage 44 (2009) 35–42
with a limited spatial resolution of PET scanner, image noise, andso on.
Currently, the quality of the MRI segmentation image is alwayssufficiently high for this application (Van Leemput et al., 1999;D'Agostino et al., 2006; Nelissen et al., 2006). The outcomes of theMRIsegmentation are images consisting of the probabilities that a voxelbelongs to a tissue class. These probabilities are used by ACAI. Imagecoregistration is always a key issue in the image processing domain. Inour current implementation, the high-resolution anatomical MRIimage was coregistered to the low resolution FDG image, butalternatively, the FDG image could be coregistered to the MRI image.The latter approach has the advantage that the segmented GM voxelsare unchanged after the coregistration while the former has theadvantage that it can be easily combined with the anatomical-basedreconstructed PET images (Baete et al., 2004a,b). In our simulationexperiment, a perfect coregistration was used since the simulatedimages were all derived from standard brain phantom. Therefore, oursimulation results are not affected bymiscoregistration at all. Actually,current registration methods perform very well based on variousspecialized algorithms such as the mutual information technique(Maes et al., 1999) as is the case in our clinical example. Therefore, weexpect that this factor will not lead to large errors in the applications.
The accuracy of determination of homologous regions in thecontralateral brain can be easily guaranteed in our simulationexperiment, because the brain phantom used for constructingsimulated images is a standard template where the mid-plane of thebrain is accurately defined. Therefore, the influences of this factorshould be negligible in our results. In real images, several differentapproaches can be used to identify the mid-sagittal plane. One way isto manually define this plane on MRI. Another approach is to use aspatial normalization scheme (e.g. using SPM http://www.fil.ion.ucl.ac.uk/spm/). The latter one is what we adopted in the implementation.By warping the target image to a standard space, the symmetry planeof the brain can be determined automatically.
In some cases, the homologous voxel belongs to a different tissueclass. When using a the NCAI method, this is not important as longas we use a kernel width which results in inclusion of voxels mainlybelonging to the same tissue class for both homologous voxels. Forthe ACAI method, this is no problem as long as the kernel containssome voxels of the tissue class of interest. For larger kernels this willalways be the case and it is recommended to use sufficient largekernels. In our patient data we used a Gaussian kernel of 9 voxelsFWHM.
Some parts in the brain are not symmetrical and the homologousregion might be located slightly asymmetrical. This problem can betaken into account by using a parcellation of the brain in volumes ofinterest (Tzourio-Mazoyer et al., 2002) and to combine it with ourACAI method.
Because of the limited spatial resolution of a PET scanner, thevoxel values suffer from the partial volume effect (PVE). Comparingwith the homologous region, this might introduce a large asymmetry,which is the case in ROI 2 in our experiment. It is important to notethat the ACAI method is not correcting for the partial volume effect,but it can be applied in combination with a partial volume correctiontechnique, e.g. using anatomical-based maximum-a-posteriori recon-struction algorithm (AMAP) (Baete et al., 2004a,b), which can greatlyreduce PVE.
Image noise is always inevitable in all medical images. To estimatethe influence of image noise, 100 different noise realizations wereused in our validation experiment. The standard deviation of themeanAI across 100 images was evaluated at each kernel size in each regionof interest. The standard deviation decreases when the area of the ROIincreases. In larger ROIs, the standard deviation is relatively smallbecause of the smoothing nature of the convolution and the averagingcalculation within each ROI. The worst case is in ROI 1 (size of0.14 cm3) where, the standard deviation of AI can be comparable with,or even be larger than the AI of baseline. It means that noise willgreatly affect the detection result when the size of the expected region
42 L. Zhou et al. / NeuroImage 44 (2009) 35–42
is small. Care must be taken when interpreting asymmetry data insmall regions.
Kernel size
When the kernel size increases, the AI curves of all ROI tend todecrease. Basically there are two reasons: first, larger kernel coversmore voxels with normal intensity, which can further reduce theaverage value in the hyperintense ROI in volumetric images afterconvolution. Second, image noise can be furtherminimized by a largerkernel because of its statistical distribution all over the image. Aproper kernel size should be comparable to the size of the expectedregion of interest (Turin, 1960), facilitating the proposed method toobtain relatively large difference between AI of baseline and phantomimage, meanwhile keep relatively small residual AI of baseline.
Kernel type
In our study, we only used a Gaussian kernel. However, other typesof kernels also can be adopted in ACAI method as long as they have asymmetric structure.
Extension to other tissue classes
In this study, we applied the proposed method using only the graymatter. Its basic idea is easily extended to include other tissue classesand other image modalities beyond FDG-PET. Functional asymmetriesfrom different tissue classes can be calculated at the same time by Eqs.(3–4) and compared as needed. The method can be used for othernuclear medicine brain imaging. The proposed method has greatpotential to become a useful diagnostic tool in medical imaging.
Conclusion
We proposed a method using prior anatomical information todetect the metabolic asymmetries in FDG-PET images. The advantageof our method is the ability of greatly minimizing the asymmetriescaused by anatomical variation, and focusing on the real metabolicabnormalities. Simulation experiment proves the validity of thismethod and shows its great potential.
References
Aubert-Broche, B., Grova, C., Jannin, P., Buvat, I., Benali, H., Gibaud, B., 2003. Detection ofinter-hemispheric asymmetries of brain perfusion in SPECT. Phys. Med. Biol. 48,1505–1517.
Aubert-Broche, B., Jannin, P., Biraben, A., Bernard, A.-M., Haegelen, C., Prigent LeJeune, F., Gibaud, F., 2005. Evaluation of methods to detect interhemisphericasymmetry on cerebral perfusion SPECT: application to epilepsy. J. Nucl. Med. 46,707–713.
Baete, K., Nuyts, J., Van Paesschen, W., Suetens, P., Dupont, P., 2004a. Anatomical basedFDG-PET reconstruction for the detection of hypometabolic regions in epilepsy.IEEE Trans. Med. Imag. 23, 510–519.
Baete, K., Nuyts, J., Van Laere, K., Van Paesschen, W., Ceyssens, S., De Ceuninck, L.,Gheysens, O., Kelles, A., Van den Eynden, J., Suetens, P., Dupont, P., 2004b.Evaluation of anatomy based reconstruction for partial volume correction in brainFDG-PET. NeuroImage. 23, 305–317.
D'Agostino, E., Maes, F., Vandermeulen, D., Suetens, P., 2006. A unified frameworkfor atlas based brain image segmentation and registration. Lect. NotesComput. Sci. 4057, 136–143 (Proceedings third international workshop onbiomedical image registration — WBIR 2006, July 9–11, 2006, Utrecht, TheNetherlands).
Hudson, H., Larkin, R., 1994. Accelerated image reconstruction using ordered subsets ofprojection data. IEEE Trans. Med. Imag. 13 (4), 601–609.
Kang, K., Lee, D., Cho, J., Lee, J., Yeo, J., Lee, S., Chung, J., Lee, M., 2001. Quantification of F-18 FDG PET images in temporal lobe epilepsy patients using probabilistic brainatlas. NeuroImage 14, 1–6.
Maes, F., Vandermeulen, D., Suetens, P., 1999. Comparative evaluation of multiresolutionoptimization strategies for multimodality image registration by maximization ofmutual information. Med. Image Anal. 3 (4), 373–386.
Nelissen, N., Van Paesschen, W., Baete, K., Van Laere, K., Palmini, A., Van Billoen, H.,Dupont, P., 2006. Correlations of interictal FDG-PET metabolism and ictal SPECTperfusion changes in human temporal lobe epilepsy with hippocampal sclerosis.NeuroImage 32, 684–695.
Signorini, M., Paulesu, E., Friston, K., Perani, D., Colleluori, A., Lucignani, G., Grassi, F.,Bettinardi, V., Frackowiak, R., Fazio, F., 1999. Rapid assessment of regional cerebralmetabolic abnormalities in single subjects with quantitative and nonquantitative[18F]FDG PET: a clinical validation of statistical parametric mapping. NeuroImage 9,63–80.
Turin, G., 1960. An introduction to matched filters. IRE Trans. Inf. Theory 6, 311–329.Tzourio-Mazoyer, N., Landeau, B., Papathanassiou, D., Crivello, F., Etard, O., Delcroix, N.,
Mazoyer, B., Joliot, M., 2002. Automated anatomical labeling of activations in SPMusing a macroscopic anatomical parcellation of the MNI MRI single-subject brain.Neuroimage 15, 273–289.
Van Bogaert, P., Massager, N., Tugendhaft, P., Wikler, D., Damhaut, P., Levivier, M.,Brotchi, J., Goldman, S., 2000. Statistical parametric mapping of regional glucosemetabolism in mesial temporal lobe epilepsy. NeuroImage 12, 129–138.
Van Leemput, K., Maes, F., Vandermeulen, D., Suetens, P., 1999. Automated model basedtissue classification of MR images of the brain. IEEE Trans. Med. Imaging 18 (10),897–908.
Volkau, I., Prakash, B., Ananthasubramaniam, A., Gupta, V., Aziz, A., Nowinski, W., 2006.Quantitative analysis of brain asymmetry by using the divergence measure:normal-pathological brain discrimination. Acad. Radiol. 13, 752–758.