WHAT DETERMINES THE “LEGAL” QUALITY Of BANK REGULATION AND SUPERVISION
Upload
independentCategory
view
1download
0
The FASEB Journal • Research Communication
Polymerase I and transcript release factor (PTRF)regulates adipocyte differentiation and determinesadipose tissue expandability
Sergio Perez-Diaz,* Lance A. Johnson,† Robert M. DeKroon,‡
Jose M. Moreno-Navarrete,§,� Oscar Alzate,‡ Jose M. Fernandez-Real,§,� Nobuyo Maeda,†
and Jose M. Arbones-Mainar*,�,1
*Adipocyte and Fat Biology Laboratory (AdipoFat), Unidad de Investigación Traslacional, InstitutoAragonés de Ciencias de la Salud (IACS), Hospital Universitario Miguel Servet, Zaragoza, Spain;†Department of Pathology and Laboratory Medicine and ‡University of North Carolina Systems-Proteomics Center, University of North Carolina at Chapel Hill, Chapel Hill, North Carolina, USA;§Department of Diabetes, Endocrinology, and Nutrition, Institut d’Investigació Biomèdica de Girona(IdlBGi) Hospital Dr. Josep Trueta, Girona, Spain; and �Centro de Investigación Biomédica en RedFisiopatología Obesidad y Nutrición (CIBERObn), Instituto Salud Carlos III, Madrid, Spain
ABSTRACT Impaired adipogenesis renders an adi-pose tissue unable to expand, leading to lipotoxicityand conditions such as diabetes and cardiovasculardisease. While factors important for adipogenesis havebeen studied extensively, those that set the limits ofadipose tissue expansion remain undetermined. Feed-ing a Western-type diet to apolipoprotein E2 knock-inmice, a model of metabolic syndrome, produced 3groups of equally obese mice: mice with normal glucosetolerance, hyperinsulinemic yet glucose-tolerant mice,and prediabetic mice with impaired glucose toleranceand reduced circulating insulin. Using proteomics, wecompared subcutaneous adipose tissues from mice inthese groups and found that the expression of PTRF(polymerase I and transcript release factor) associatedselectively with their glucose tolerance status. Lentiviraland pharmacologically overexpressed PTRF, whosefunction is critical for caveola formation, compromisedadipocyte differentiation of cultured 3T3-L1cells. Inhuman adipose tissue, PTRF mRNA levels positivelycorrelated with markers of lipolysis and cellular senes-cence. Furthermore, a negative relationship betweentelomere length and PTRF mRNA levels was ob-served in human subcutaneous fat. PTRF is associ-ated with limited adipose tissue expansion underpin-ning the key role of caveolae in adipocyte regulation.Furthermore, PTRF may be a suitable adipocyte
marker for predicting pathological obesity and in-form clinical management.—Perez-Diaz, S., Johnson,L. A., DeKroon, R. M., Moreno-Navarrete, J. M.,Alzate, O., Fernandez-Real, J. M., Maeda, N., Ar-bones-Mainar, J. M. Polymerase I and transcriptrelease factor (PTRF) regulates adipocyte differenti-ation and determines adipose tissue expandability.FASEB J. 28, 3769–3779 (2014). www.fasebj.org
Key Words: senescence � glucose intolerance � telomeres
Obese individuals are epidemiologically associatedwith a wide array of metabolic risk factors (1, 2).However, evidence suggests that 20–30% of the obesepopulation can remain as metabolically healthy individ-uals on the basis of a beneficial adipose tissue growth(3, 4). The subcutaneous adipose tissue is a key endo-crine organ able to expand during times of caloricexcess with a paramount importance in energy homeo-stasis (5). In addition, it has been proposed thatimpaired adipogenesis can cause a failure to sequesterlipotoxic fatty acids (6). This deregulated adipose tissueultimately leads to conditions such as metabolic syn-drome, diabetes, dyslipidemia, and cardiovascular dis-ease (reviewed in ref. 7).
The aim of our study was to investigate the biogenesisof subcutaneous adipose tissue, to determine the fac-tors that set the limits of its expansion. This studyemployed a murine model of diet-induced obesity, thedyslipidemic apolipoprotein E2 (APOE2) knock-in mice (8,
1 Correspondence: Adipocyte and Fat Biology Laboratory(AdipoFat), Unidad de Investigación Traslacional, InstitutoAragonés de Ciencias de la Salud, Hospital UniversitarioMiguel Servet, Zaragoza 50009, Spain. E-mail: [email protected]
doi: 10.1096/fj.14-251165This article includes supplemental data. Please visit http://
www.fasebj.org to obtain this information.
Abbreviations: 2D-DIGE, 2-dimensonal fluorescence differ-ence gel electrophoresis; ACC, acyl-CoA carboxylase; AFABP,adipocyte fatty acid-binding protein; APOE2, apolipoproteinE2; ATGL, adipose triglyceride lipase; AUC, area under thecurve; BMI, body mass index; EGFP, enhanced green fluores-cent protein; HEK, human embryonic kidney; HSL, hor-mone-sensitive lipase; IGT, impaired glucose tolerance; INS,hyperinsulinemic; MALDI, matrix-assisted laser desorption/ionization; NEFA, nonesterified free fatty acid; NGT, normalglucose-tolerant; OGTT, oral glucose tolerance test; PTRF,polymerase I and transcript release factor; TOF, time of flight;WD, Western-type diet
37690892-6638/14/0028-3769 © FASEB
9), whose endogenous murine Apoe gene has beensubstituted by the human APOE*2 gene (10). Thesemice also present additional features of the metabolicsyndrome such as fatty liver susceptibility (11), hyper-coagulant activity (12), and aortic plaque deposition(10). With 2-dimensional fluorescence difference gelelectrophoresis (2D-DIGE) and mass spectrometryanalyses we identified that protein expression of poly-merase I and transcript release factor (PTRF) in thesubcutaneous adipose tissue is selectively associatedwith the glucose tolerance status of the obese mice. Wedemonstrated that PTRF overexpression compromisesadipocyte differentiation in vitro and that PTRF mRNAlevels are directly associated with cellular senescence inhuman adipose tissue.
MATERIALS AND METHODS
Mice
Male mice homozygous for replacement of the endogenousApoe gene with the human APOE*2 on a C57BL/6 back-ground (10) were fed a Western-type diet (WD) containing21% (w/w) fat and 0.2% (w/w) cholesterol (TD88137; Te-klad. Madison, WI, USA) over 12 wk, starting at 8 wk of age.At the end of the intervention period, mice were deniedaccess to food for 4 h and euthanized. Subcutaneous adiposetissue, aortic root, and liver were collected and frozen inliquid N2. Plasma concentrations of nonesterified free fattyacids (NEFAs), glucose, and cholesterol were determinedusing kits from Wako (Richmond, VA, USA). Triglyceride andinsulin concentrations were determined using kits from Stan-bio (San Antonio, TX, USA) and Crystal Chem (Chicago, IL,USA), respectively. Plasma adiponectin was measured usingan ELISA as described previously (13). Oral glucose tolerancetests (OGTTs) were performed as described previously (6).The bases of the mouse hearts were collected and processedfor aortic cross-sectional analysis as described previously (14).Livers were homogenized, and triglyceride concentrationdetermined as described previously (15). The animals werehandled under protocols approved by the Institutional Ani-mal Care and Use Committees of the University of NorthCarolina at Chapel Hill.
Proteomics
Proteomics analysis was performed with the internal controlmethodology using 2D-DIGE as described previously (16).Quantitative differential protein expression analysis was per-formed with the DeCyder 2D software (GE Healthcare, Pisca-taway, NJ, USA). After determination of differential proteinexpression using as selection criteria the Student’s t test withP � 0.05, selected protein spots were subjected to proteinidentification by matrix-assisted laser desorption/ionizationtandem time-of-flight (MALDI-TOF/TOF) mass spectrometryat the University of North Carolina Proteomics Core Facilityas described previously (17).
Cells
3T3-L1 murine preadipocytes (no. CL-173; American TypeCulture Collection, Rockville, MD, USA), a gift from Dr.Moreno-Aliaga (Universidad de Navarra, Pamplona, Spain),and human embryonic kidney 293 (HEK 293T; CRL-3216,American Type Culture Collection), a gift from Dr. Fernan-
dez-Vizarra (University of Cambridge, Cambridge, UK), wereused. Cells were grown and preadipocytes transformed intomature adipocytes as described previously (15). Adipocyteswere considered mature at 8–10 d postdifferentiation.
Lentivirus production
The open-reading frame encoding the murine Ptrf1 taggedby monomeric enhanced green fluorescent protein (EGFP;ref. 18) was excised from the pcDNA5/FRT/TO vector(27709; Addgene, Cambridge, MA, USA) with PmeI digest andblunt-end ligated into the second-generation transfer vectorpWPXLd (12258; Addgene) in which the GFP sequence hadbeen substituted by a puromycin resistance cassette (pWPXLd-ires-PuroR) (19). HIV-1-derived lentiviral particles were pro-duced by transfecting cloroquine-pretreated HEK 293T cellswith the transfer vector along with the attenuated packagingvector psPAX2 (12260; Addgene) and the vesicular stomatitisvirus glycoprotein (VSV-G)-encoding plasmid pMD2.G(12259; Addgene), in combination with the transfectionenhancer IBAfect (IBA, Göttingen, Germany). Lentivirus-containing supernatants of transfected cells were collected 48h later and passed through 0.45 �m filters (ThermoFisherScientific, San Jose, CA, USA). Viral load for each preparationwas determined by Dr. Martinez-Sapiña (Department OfMicrobiology, Hospital Universitario Miguel Servet, Zaragoza,Spain) using 1:1000 diluted supernatants with the COBASTaqMan HIV-1 Test, v. 2.0 system (Roche Molecular Systems,Branchburg, NJ. USA). Similar numbers of lentiviral particlesof the PTRF1-mGFP/pWPXLd-ires-PuroR or the emptypWPXLd-ires-PuroR vector were then used to transduce thepreconfluent 3T3-L1 cells supplemented with polybrene (Sig-ma-Aldrich, St. Louis, MO, USA), and subsequently cells wereselected for puromycin resistance. Two different 3T3-L1 celllines were established, constitutively expressing either theempty pWPXLd-ires-PuroR or the PTRF1-mGFP/pWPXLd-ires-PuroR.
Western blot, lipid accumulation, and cell cycle analysis
Differentiated 3T3-L1 cells were lysed and immunoblotted fortotal acyl-CoA carboxylase (ACC; C83B10; Cell Signaling,Beverly, MA, USA), phospho-ACC (Ser79; 3661; Cell Signal-ing), PTRF (sc-133934; Santa Cruz Biotecnology, Santa Cruz,CA, USA), adipocyte fatty acid-binding protein (AFABP;sc-18661; Santa Cruz Biotecnology), caveolin-1 (sc-894; SantaCruz Biotecnology), and actin (sc-1615; Santa Cruz Biotecnol-ogy), followed by the appropriate secondary antibodies. Lipidcontent was quantified by adding Nile Red (Acros, Geel,Belgium) to 3T3-L1 mature adipocytes, and fluorescence wasmeasured (�ex 485 nm, �em 572 nm) with a Synergy HTspectrophotometer (Biotek, Winooski, VT, USA) or using aFACSAria cytometer (�em 604 nm; Becton Dickinson, SanJose, CA. USA). Oil Red O stain on 3T3-L1 cells was per-formed as described previously (20). Cell cycle was investi-gated 2 d after reaching 100% confluence. Briefly, 3T3-L1cells were induced to differentiate with the adipogenic cock-tail (15) and collected at selected time points to evaluate byflow cytometry the distribution of cells at specific cell cyclestages, as described previously (21), using a FACSArray (Bec-ton Dickinson). Each fluorescence-activated cell-sorting anal-ysis sample contained 104 cells.
Radioisotopes
Glucose uptake was assayed with deoxy-d-glucose as describedpreviously (22). For the isoproterenol-stimulated lipolysis,3T3-L1 adipocytes seeded in 12-well plates at d 8 postdiffer-
3770 Vol. 28 August 2014 PEREZ-DIAZ ET AL.The FASEB Journal � www.fasebj.org
entiation were incubated overnight with 0.5 ml/well of cul-ture medium supplemented with 1 nCi/�l [9,10-3H(N)]-palmitic acid (NET043005MC; Perkin-Elmer, Madrid, Spain).Lipolysis was initiated with the addition of 10 �M isoproter-enol (Aleudrina; Reig Jofre, Barcelona. Spain) in serum-freeDMEM containing 2% BSA (Sigma-Aldrich). The condi-tioned medium was collected at 0, 30, 60, 90, and 120 min,and then analyzed for fatty acid release in a Rackbeta liquidscintillation counter (Model 1209; LKB Wallac, Turku. Fin-land) after addition of Ultimate Gold scintillant (Perkin-Elmer). De novo lipogenesis was assayed in 3T3-L1 adipocytesseeded in 12-well plates at d 8 postdifferentiation and thenincubated with 1 ml/well of culture medium supplementedwith 1 nCi/�l [3H]-acetic acid (NET003005MC; Perkin-El-mer). After overnight incubation, lipids were extracted, andradioactivity was assayed as described above.
Human adipose tissues
Adipose tissue samples (93 visceral and 85 subcutaneous fatdepots) from a group of Caucasian participants, with differ-ent degree of obesity [body mass index (BMI) between 20and 58 kg/m2], were analyzed. Body weight had been stablefor �3 mo before the study, and all subjects gave writteninformed consent. The cohort was recruited at the Endo-crinology Service of the Hospital Universitari Dr. JosepTrueta (Girona, Spain) and the hospital’s institutionalreview board approved the protocols. Exclusion criteriahave been previously detailed (23). Adipose tissues wereobtained during elective surgical procedures (cholecystec-tomy, surgery of abdominal hernia, and gastric bypasssurgery) and immediately frozen in liquid nitrogen. RNApreparation, reverse transcription, and quantitative PCR,as well as measurement of telomere length, were per-formed as described previously (23, 24).
Statistical analysis
All statistical analyses were performed using SPSS 17.0 soft-ware (SPSS, Chicago, IL, USA). Results are expressed asmeans � sem. One-way ANOVA followed by Student’s t testfor post hoc analysis was used unless otherwise stated. To testthe strength of the correlations between variables, the Pear-son product-moment correlation coefficients were calculated.
RESULTS
Metabolic effects of WD in APOE2 knock-in mice
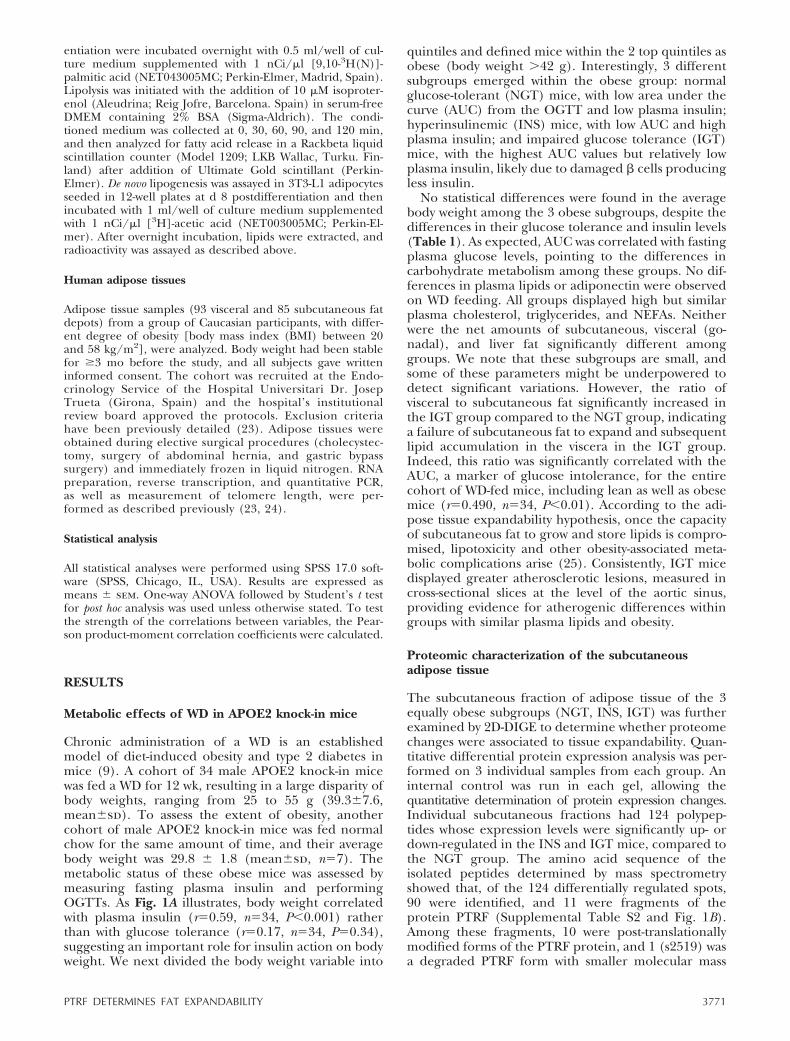
Chronic administration of a WD is an establishedmodel of diet-induced obesity and type 2 diabetes inmice (9). A cohort of 34 male APOE2 knock-in micewas fed a WD for 12 wk, resulting in a large disparity ofbody weights, ranging from 25 to 55 g (39.3�7.6,mean�sd). To assess the extent of obesity, anothercohort of male APOE2 knock-in mice was fed normalchow for the same amount of time, and their averagebody weight was 29.8 � 1.8 (mean�sd, n�7). Themetabolic status of these obese mice was assessed bymeasuring fasting plasma insulin and performingOGTTs. As Fig. 1A illustrates, body weight correlatedwith plasma insulin (r�0.59, n�34, P�0.001) ratherthan with glucose tolerance (r�0.17, n�34, P�0.34),suggesting an important role for insulin action on bodyweight. We next divided the body weight variable into
quintiles and defined mice within the 2 top quintiles asobese (body weight �42 g). Interestingly, 3 differentsubgroups emerged within the obese group: normalglucose-tolerant (NGT) mice, with low area under thecurve (AUC) from the OGTT and low plasma insulin;hyperinsulinemic (INS) mice, with low AUC and highplasma insulin; and impaired glucose tolerance (IGT)mice, with the highest AUC values but relatively lowplasma insulin, likely due to damaged � cells producingless insulin.
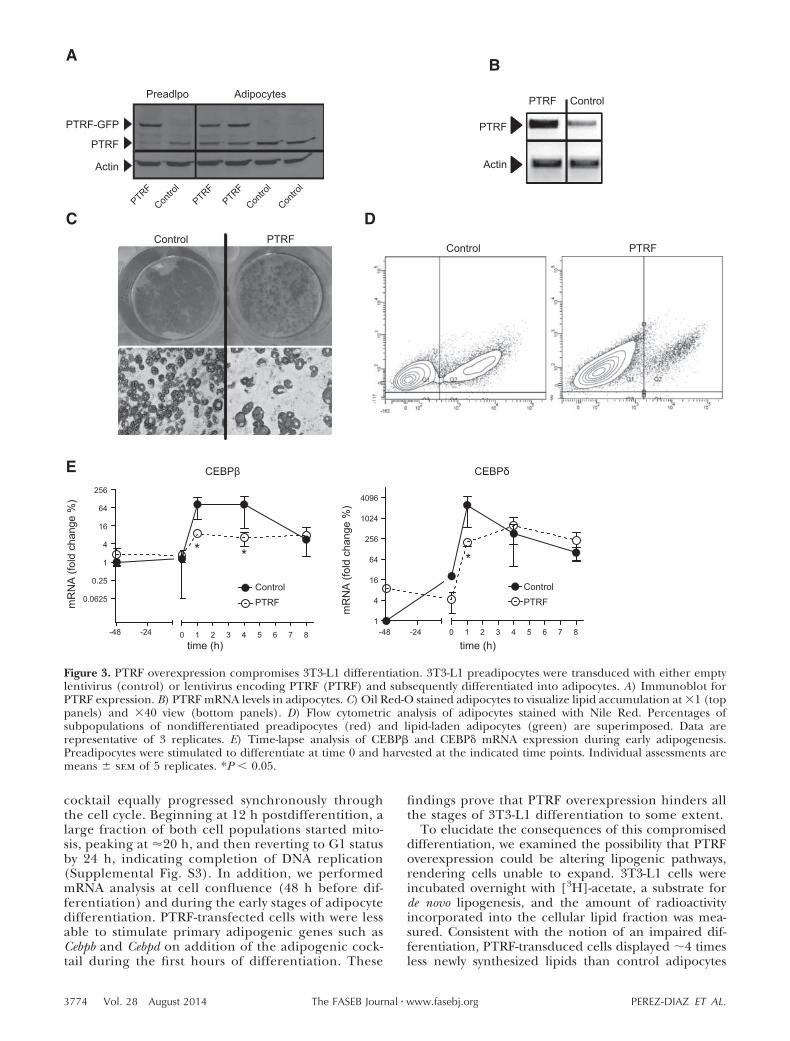
No statistical differences were found in the averagebody weight among the 3 obese subgroups, despite thedifferences in their glucose tolerance and insulin levels(Table 1). As expected, AUC was correlated with fastingplasma glucose levels, pointing to the differences incarbohydrate metabolism among these groups. No dif-ferences in plasma lipids or adiponectin were observedon WD feeding. All groups displayed high but similarplasma cholesterol, triglycerides, and NEFAs. Neitherwere the net amounts of subcutaneous, visceral (go-nadal), and liver fat significantly different amonggroups. We note that these subgroups are small, andsome of these parameters might be underpowered todetect significant variations. However, the ratio ofvisceral to subcutaneous fat significantly increased inthe IGT group compared to the NGT group, indicatinga failure of subcutaneous fat to expand and subsequentlipid accumulation in the viscera in the IGT group.Indeed, this ratio was significantly correlated with theAUC, a marker of glucose intolerance, for the entirecohort of WD-fed mice, including lean as well as obesemice (r�0.490, n�34, P�0.01). According to the adi-pose tissue expandability hypothesis, once the capacityof subcutaneous fat to grow and store lipids is compro-mised, lipotoxicity and other obesity-associated meta-bolic complications arise (25). Consistently, IGT micedisplayed greater atherosclerotic lesions, measured incross-sectional slices at the level of the aortic sinus,providing evidence for atherogenic differences withingroups with similar plasma lipids and obesity.
Proteomic characterization of the subcutaneousadipose tissue
The subcutaneous fraction of adipose tissue of the 3equally obese subgroups (NGT, INS, IGT) was furtherexamined by 2D-DIGE to determine whether proteomechanges were associated to tissue expandability. Quan-titative differential protein expression analysis was per-formed on 3 individual samples from each group. Aninternal control was run in each gel, allowing thequantitative determination of protein expression changes.Individual subcutaneous fractions had 124 polypep-tides whose expression levels were significantly up- ordown-regulated in the INS and IGT mice, compared tothe NGT group. The amino acid sequence of theisolated peptides determined by mass spectrometryshowed that, of the 124 differentially regulated spots,90 were identified, and 11 were fragments of theprotein PTRF (Supplemental Table S2 and Fig. 1B).Among these fragments, 10 were post-translationallymodified forms of the PTRF protein, and 1 (s2519) wasa degraded PTRF form with smaller molecular mass
3771PTRF DETERMINES FAT EXPANDABILITY
and different isoelectric point (Supplemental Table S2and Fig. 1C). The average fold change of PTRF(mean�sem relative to NGT mice) was significantlylower (0.67�3) in the INS group and significantlyhigher (1.43�11) in the IGT mice group. Interestingly,of the 90 known spots, 27 were identified as membrane-associated proteins, highlighting the important role ofthis cellular domain in the adipocyte metabolism.
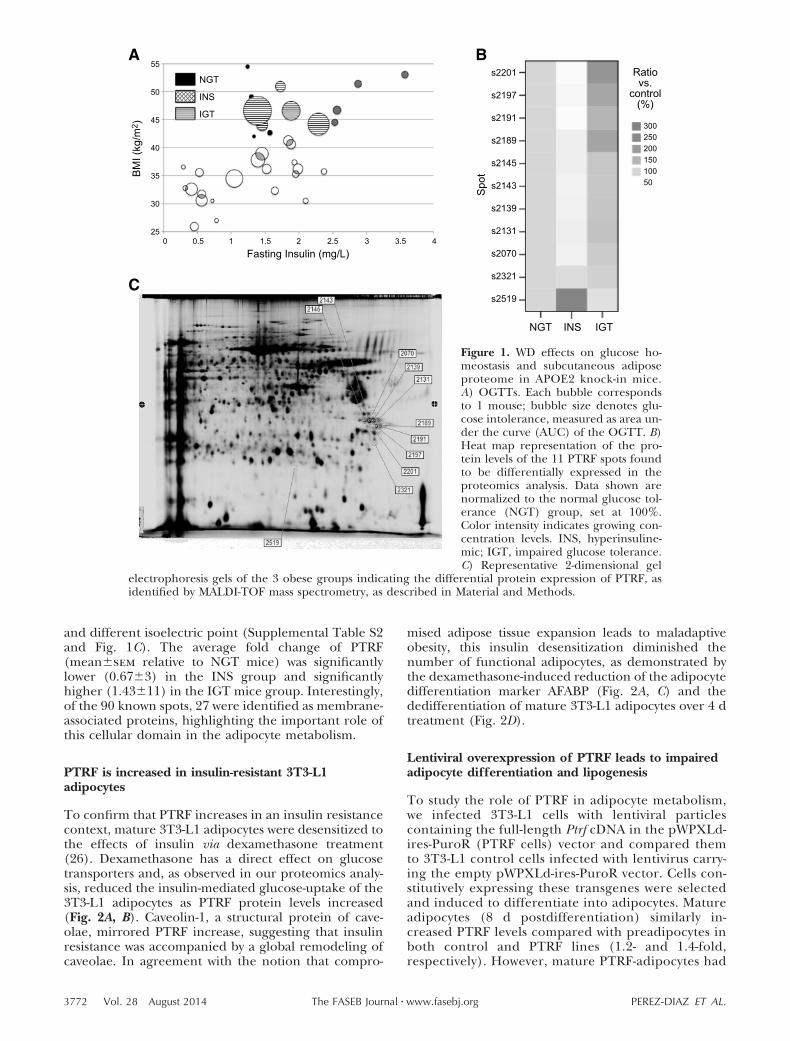
PTRF is increased in insulin-resistant 3T3-L1adipocytes
To confirm that PTRF increases in an insulin resistancecontext, mature 3T3-L1 adipocytes were desensitized tothe effects of insulin via dexamethasone treatment(26). Dexamethasone has a direct effect on glucosetransporters and, as observed in our proteomics analy-sis, reduced the insulin-mediated glucose-uptake of the3T3-L1 adipocytes as PTRF protein levels increased(Fig. 2A, B). Caveolin-1, a structural protein of cave-olae, mirrored PTRF increase, suggesting that insulinresistance was accompanied by a global remodeling ofcaveolae. In agreement with the notion that compro-
mised adipose tissue expansion leads to maladaptiveobesity, this insulin desensitization diminished thenumber of functional adipocytes, as demonstrated bythe dexamethasone-induced reduction of the adipocytedifferentiation marker AFABP (Fig. 2A, C) and thededifferentiation of mature 3T3-L1 adipocytes over 4 dtreatment (Fig. 2D).
Lentiviral overexpression of PTRF leads to impairedadipocyte differentiation and lipogenesis
To study the role of PTRF in adipocyte metabolism,we infected 3T3-L1 cells with lentiviral particlescontaining the full-length Ptrf cDNA in the pWPXLd-ires-PuroR (PTRF cells) vector and compared themto 3T3-L1 control cells infected with lentivirus carry-ing the empty pWPXLd-ires-PuroR vector. Cells con-stitutively expressing these transgenes were selectedand induced to differentiate into adipocytes. Matureadipocytes (8 d postdifferentiation) similarly in-creased PTRF levels compared with preadipocytes inboth control and PTRF lines (1.2- and 1.4-fold,respectively). However, mature PTRF-adipocytes had
55
50
45
40
35
30
250 0.5 1 1.5 2 2.5 3 3.5 4
Fasting Insulin (mg/L)
BM
I (kg
/m2 )
NGT
INS
IGT
s2201
s2197
s2191
s2189
s2145
s2143
s2139
s2131
s2070
s2321
s2519
NGT INS IGT
30025020015010050
Ratiovs.
control(%)
Spo
t
A B
C
Figure 1. WD effects on glucose ho-meostasis and subcutaneous adiposeproteome in APOE2 knock-in mice.A) OGTTs. Each bubble correspondsto 1 mouse; bubble size denotes glu-cose intolerance, measured as area un-der the curve (AUC) of the OGTT. B)Heat map representation of the pro-tein levels of the 11 PTRF spots foundto be differentially expressed in theproteomics analysis. Data shown arenormalized to the normal glucose tol-erance (NGT) group, set at 100%.Color intensity indicates growing con-centration levels. INS, hyperinsuline-mic; IGT, impaired glucose tolerance.C) Representative 2-dimensional gel
electrophoresis gels of the 3 obese groups indicating the differential protein expression of PTRF, asidentified by MALDI-TOF mass spectrometry, as described in Material and Methods.
3772 Vol. 28 August 2014 PEREZ-DIAZ ET AL.The FASEB Journal � www.fasebj.org
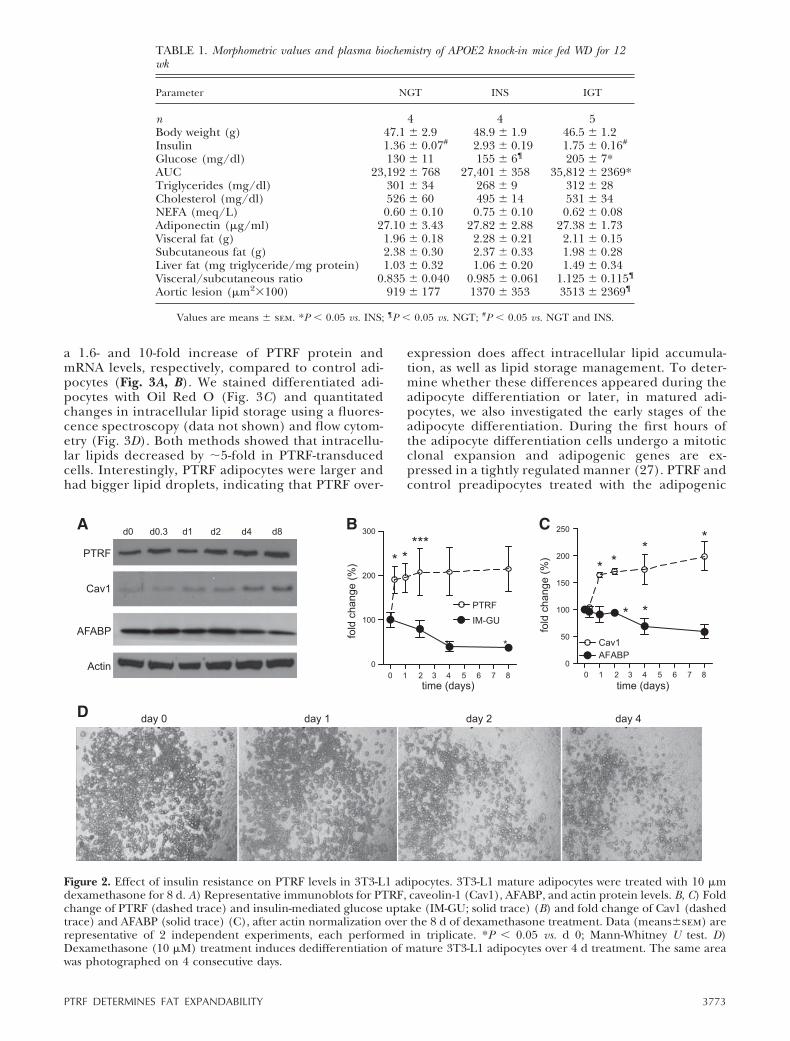
a 1.6- and 10-fold increase of PTRF protein andmRNA levels, respectively, compared to control adi-pocytes (Fig. 3A, B). We stained differentiated adi-pocytes with Oil Red O (Fig. 3C) and quantitatedchanges in intracellular lipid storage using a fluores-cence spectroscopy (data not shown) and flow cytom-etry (Fig. 3D). Both methods showed that intracellu-lar lipids decreased by 5-fold in PTRF-transducedcells. Interestingly, PTRF adipocytes were larger andhad bigger lipid droplets, indicating that PTRF over-
expression does affect intracellular lipid accumula-tion, as well as lipid storage management. To deter-mine whether these differences appeared during theadipocyte differentiation or later, in matured adi-pocytes, we also investigated the early stages of theadipocyte differentiation. During the first hours ofthe adipocyte differentiation cells undergo a mitoticclonal expansion and adipogenic genes are ex-pressed in a tightly regulated manner (27). PTRF andcontrol preadipocytes treated with the adipogenic
TABLE 1. Morphometric values and plasma biochemistry of APOE2 knock-in mice fed WD for 12wk
Parameter NGT INS IGT
n 4 4 5Body weight (g) 47.1 � 2.9 48.9 � 1.9 46.5 � 1.2Insulin 1.36 � 0.07# 2.93 � 0.19 1.75 � 0.16#
Glucose (mg/dl) 130 � 11 155 � 6¶ 205 � 7*AUC 23,192 � 768 27,401 � 358 35,812 � 2369*Triglycerides (mg/dl) 301 � 34 268 � 9 312 � 28Cholesterol (mg/dl) 526 � 60 495 � 14 531 � 34NEFA (meq/L) 0.60 � 0.10 0.75 � 0.10 0.62 � 0.08Adiponectin (�g/ml) 27.10 � 3.43 27.82 � 2.88 27.38 � 1.73Visceral fat (g) 1.96 � 0.18 2.28 � 0.21 2.11 � 0.15Subcutaneous fat (g) 2.38 � 0.30 2.37 � 0.33 1.98 � 0.28Liver fat (mg triglyceride/mg protein) 1.03 � 0.32 1.06 � 0.20 1.49 � 0.34Visceral/subcutaneous ratio 0.835 � 0.040 0.985 � 0.061 1.125 � 0.115¶
Aortic lesion (�m2100) 919 � 177 1370 � 353 3513 � 2369¶
Values are means � sem. *P � 0.05 vs. INS; ¶P � 0.05 vs. NGT; #P � 0.05 vs. NGT and INS.
A B C
00
100
200
300
PTRFIM-GU
* ****
**
time (days)
fold
cha
nge
(%)
D
0
50
100
150
200
250
Cav1AFABP
***
*
* *
time (days)
fold
cha
nge
(%)
1 2 3 4 5 6 7 8 0 1 2 3 4 5 6 7 8
d0 d0.3 d1 d2 d4 d8
PTRF
Cav1
AFABP
Actin
day 0 day 1 day 2 day 4
Figure 2. Effect of insulin resistance on PTRF levels in 3T3-L1 adipocytes. 3T3-L1 mature adipocytes were treated with 10 �mdexamethasone for 8 d. A) Representative immunoblots for PTRF, caveolin-1 (Cav1), AFABP, and actin protein levels. B, C) Foldchange of PTRF (dashed trace) and insulin-mediated glucose uptake (IM-GU; solid trace) (B) and fold change of Cav1 (dashedtrace) and AFABP (solid trace) (C), after actin normalization over the 8 d of dexamethasone treatment. Data (means�sem) arerepresentative of 2 independent experiments, each performed in triplicate. *P � 0.05 vs. d 0; Mann-Whitney U test. D)Dexamethasone (10 �M) treatment induces dedifferentiation of mature 3T3-L1 adipocytes over 4 d treatment. The same areawas photographed on 4 consecutive days.
3773PTRF DETERMINES FAT EXPANDABILITY
cocktail equally progressed synchronously throughthe cell cycle. Beginning at 12 h postdifferentition, alarge fraction of both cell populations started mito-sis, peaking at �20 h, and then reverting to G1 statusby 24 h, indicating completion of DNA replication(Supplemental Fig. S3). In addition, we performedmRNA analysis at cell confluence (48 h before dif-ferentiation) and during the early stages of adipocytedifferentiation. PTRF-transfected cells with were lessable to stimulate primary adipogenic genes such asCebpb and Cebpd on addition of the adipogenic cock-tail during the first hours of differentiation. These
findings prove that PTRF overexpression hinders allthe stages of 3T3-L1 differentiation to some extent.
To elucidate the consequences of this compromiseddifferentiation, we examined the possibility that PTRFoverexpression could be altering lipogenic pathways,rendering cells unable to expand. 3T3-L1 cells wereincubated overnight with [3H]-acetate, a substrate forde novo lipogenesis, and the amount of radioactivityincorporated into the cellular lipid fraction was mea-sured. Consistent with the notion of an impaired dif-ferentiation, PTRF-transduced cells displayed 4 timesless newly synthesized lipids than control adipocytes
-48 -24
0.0625
0.25
1
4
16
64
256
0 1 2 3 4 5 6 7 8
ControlPTRF
time (h)
E
**
CEBPβ
mR
NA
(fol
d ch
ange
%)
-48 -241
4
16
64
256
1024
4096
0 1 2 3 4 5 6 7 8
ControlPTRF
time (h)
*
CEBPδ
mR
NA
(fol
d ch
ange
%)
PTRF-GFP
PTRF
Actin
PTRF
Actin
PTRF ControlPreadlpo Adipocytes
PTRF
Contro
l
PTRF
Contro
l
Contro
l
PTRF
PTRFControlPTRFControl
AB
C D
Figure 3. PTRF overexpression compromises 3T3-L1 differentiation. 3T3-L1 preadipocytes were transduced with either emptylentivirus (control) or lentivirus encoding PTRF (PTRF) and subsequently differentiated into adipocytes. A) Immunoblot forPTRF expression. B) PTRF mRNA levels in adipocytes. C) Oil Red-O stained adipocytes to visualize lipid accumulation at 1 (toppanels) and 40 view (bottom panels). D) Flow cytometric analysis of adipocytes stained with Nile Red. Percentages ofsubpopulations of nondifferentiated preadipocytes (red) and lipid-laden adipocytes (green) are superimposed. Data arerepresentative of 3 replicates. E) Time-lapse analysis of CEBP� and CEBP� mRNA expression during early adipogenesis.Preadipocytes were stimulated to differentiate at time 0 and harvested at the indicated time points. Individual assessments aremeans � sem of 5 replicates. *P � 0.05.
3774 Vol. 28 August 2014 PEREZ-DIAZ ET AL.The FASEB Journal � www.fasebj.org

(Fig. 4A). The mechanism of impaired lipogenesis wasinvestigated by analyzing ACC, a key enzyme for thebiosynthesis of fatty acids (28). ACC protein levels weresignificantly reduced (20%) in PTRF adipocytes com-pared to control adipocytes. PTRF overexpression didnot change ACC phosphorylation (p-ACC). However,when the ratio between p-ACC and total ACC wasconsidered, we observed a higher ratio on PTRF trans-duction, compared with control cells (1.30 vs. 1.00,P�0.01; Fig. 4B). On the other hand, PTRF cells had a30% reduction of the fatty acid carrier and marker oflipid accumulation, AFABP/aP2, compared with thecontrol 3T3-L1 cells. In addition, at d 8 postdifferentia-tion, PTRF cells showed a dramatic decrease in expres-sion of adipocyte late-expression genes, such as Ppar and Afabp, markers of terminal differentiation (Fig.4C). These results indicate that PTRF overexpressionleads to decreased adipocyte differentiation and im-paired lipid accumulation.
Overexpressing PTRF in adipocytes stimulateslipolysis
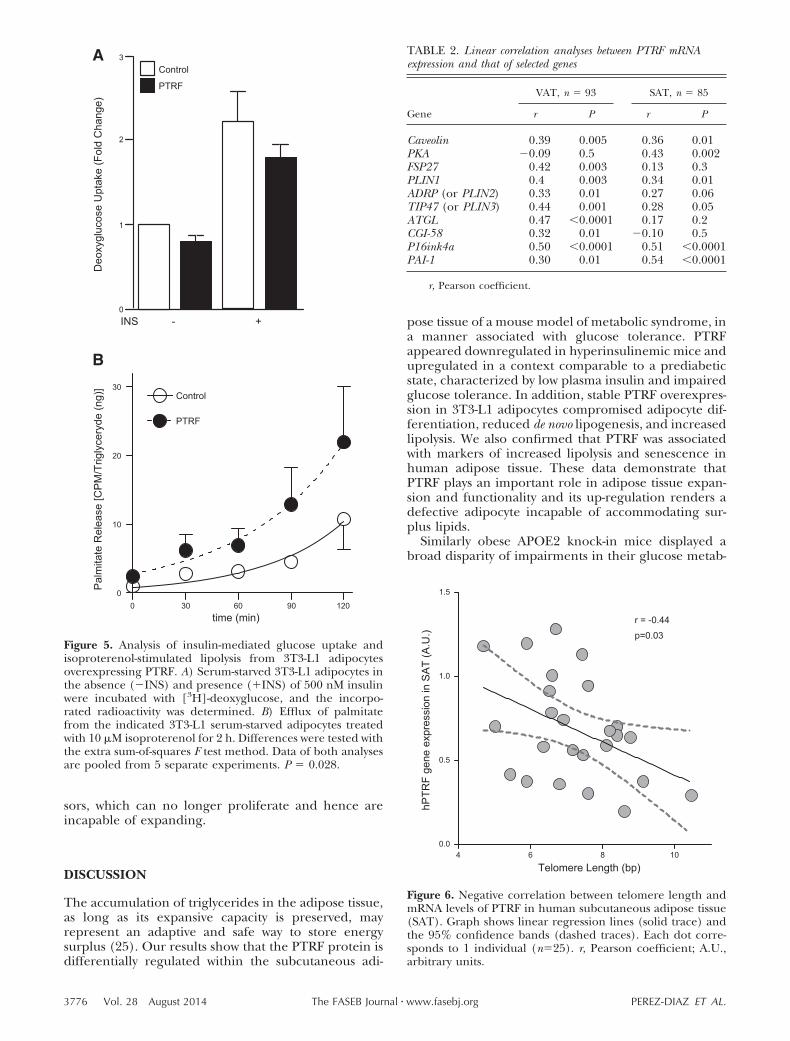
Next, we examined the relationship between PTRF andinsulin-stimulated glucose transport activity. Insulinstimulation increased [3H]-deoxyglucose uptake com-pared to unstimulated cells, but this phenomenon wasnot significantly affected by PTRF overexpression (Fig.5A). To test the lipolytic capacity of PTRF, adipocyteswere loaded with [3H]-palmitate overnight, which wasincorporated into triglycerides. Subsequently, the re-lease of radiolabeled palmitate in the absence or pres-ence of the �-adrenergic isoproterenol was deter-mined. No differences in lipolysis between PTRF andcontrol cells were observed in the absence of isoproter-enol (not shown). However, 234% more palmitate wasreleased from PTRF adipocytes compared to controladipocytes after a 2 h incubation period with isoproter-enol (AUC�488 vs. 1146 cpm/ng triglyceride/min forcontrol and PTRF, respectively; Fig. 5B). These resultssupport the important role of PTRF in regulatinglipolysis, as previously suggested (29, 30).
PTRF expression positively associates with adipocyteremodeling and senescence markers in humanadipose tissue
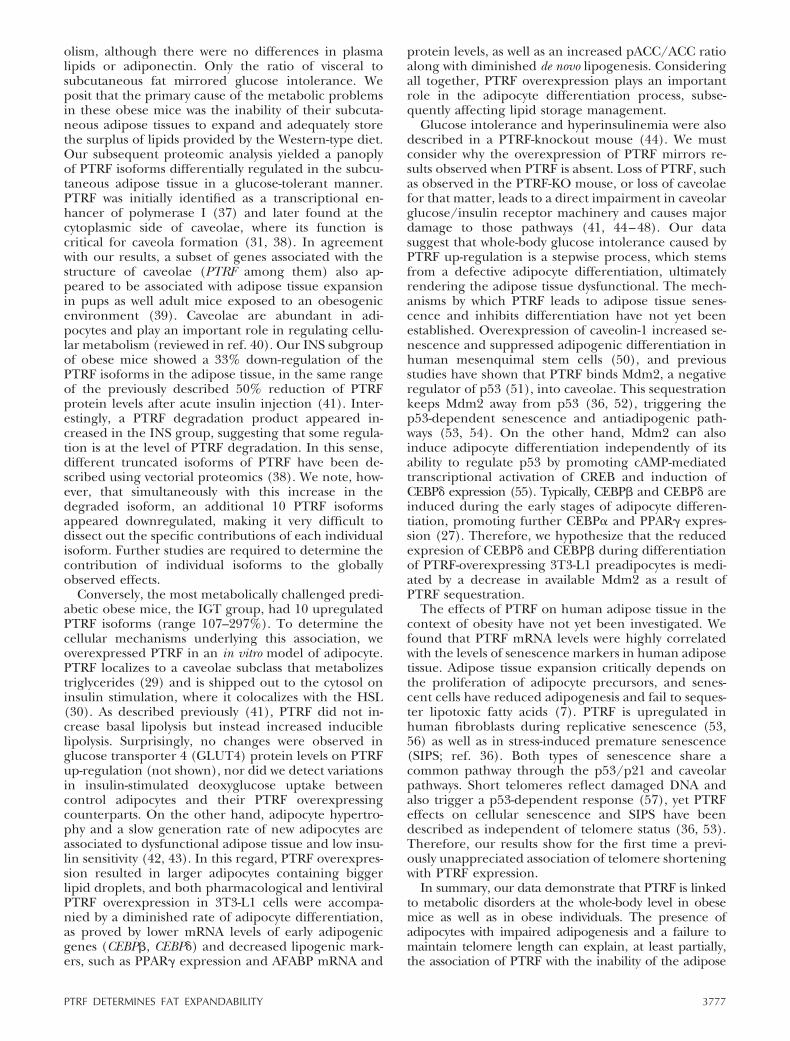
Next, we studied the relationship between PTRF expres-sion and mRNA levels of selected markers of adipocytefunctionality in human adipose tissue from a cohort ofCaucasian participants (BMI between 20 and 58 kg/m2). As described previously (31), a positive correlationbetween mRNA levels of PTRF and caveolin, bothcaveolar components, was found in both visceral andsubcutaneous adipose depots (Table 2). Adipose tri-glyceride lipase (ATGL) and hormone-sensitive lipase(HSL) release free fatty acids from adipose triacylglyc-erol stores (32). Both ATGL and its coactivator CGI58(33) correlated with PTRF expression in the visceraldepot. Likewise, the PAT family members, perilipinA (PLIN1), adipose differentiation-related protein(ADRP), and TIP47, which ultimately control lipolysiscatalyzed by HSL (34), were also strongly correlatedwith PTRF mRNA levels in visceral fat. In addition,expression levels of protein kinase A and its substratePLIN1 were also associated with PTRF in subcutaneousadipose tissue, highlighting the connection betweenPTRF and adipocyte lipolysis.
Fat-specific protein 27, which plays a dual role inregulating both adipocyte metabolism and cell death(35), also paralleled PTRF expression in the visceraldepots. Adipose tissue senescence may contribute tothe diabetic phenotype (7), and it has been shown thatPTRF is a regulator of stress-induced senescence (36).Consistent with these observations, we found a directassociation between PTRF mRNA levels and the mark-ers of senescence P16Ink4a and PAI1 (Table 2). Indeed,when analyzing telomere length, a strong negativerelationship was observed between subcutaneous adi-pocyte telomeres and PTRF mRNA levels (Fig. 6).Furthermore, this correlation remained significant af-ter age, sex, and BMI adjustments. Although correla-tion cannot prove causation, PTRF association withshorter telomeres in subcutaneous fat might suggestthe presence of functionally limited adipocyte precur-
100
75
50
25
0
1200
100
800
125
100
75
50
25
0Control PTRF
ControlPTRF
ACC
pACC
AFABP
Actin mR
NA
rela
tive
leve
ls
PTRF PPARG AFABP
***
**
**
ControlPTRF
Ace
tate
inco
rpor
atio
n[F
old
chan
ge (%
)]
A B C
Figure 4. PTRF overexpression impairs lipogenesis in vitro. A) Lipogenesis in mature 3T3-L1 adipocytes, measured as the uptakeof [3H]-acetate. B) Western blot analysis of components of lipogenic pathway in adipocytes. C) mRNA levels of PTRF, PPARG,and AFABP assessed by qPCR. Values are means � sem (n�5). *P � 0.05, **P � 0.01.
3775PTRF DETERMINES FAT EXPANDABILITY
sors, which can no longer proliferate and hence areincapable of expanding.
DISCUSSION
The accumulation of triglycerides in the adipose tissue,as long as its expansive capacity is preserved, mayrepresent an adaptive and safe way to store energysurplus (25). Our results show that the PTRF protein isdifferentially regulated within the subcutaneous adi-
pose tissue of a mouse model of metabolic syndrome, ina manner associated with glucose tolerance. PTRFappeared downregulated in hyperinsulinemic mice andupregulated in a context comparable to a prediabeticstate, characterized by low plasma insulin and impairedglucose tolerance. In addition, stable PTRF overexpres-sion in 3T3-L1 adipocytes compromised adipocyte dif-ferentiation, reduced de novo lipogenesis, and increasedlipolysis. We also confirmed that PTRF was associatedwith markers of increased lipolysis and senescence inhuman adipose tissue. These data demonstrate thatPTRF plays an important role in adipose tissue expan-sion and functionality and its up-regulation renders adefective adipocyte incapable of accommodating sur-plus lipids.
Similarly obese APOE2 knock-in mice displayed abroad disparity of impairments in their glucose metab-
0
10
20
30Control
PTRF
time (min)
A
B
0 30 60 90 120
Pal
mita
te R
elea
se [C
PM
/Trig
lyce
ryde
(ng)
]
0
1
2
3Control
PTRFD
eoxy
gluc
ose
Upt
ake
(Fol
d C
hang
e)
INS - +
Figure 5. Analysis of insulin-mediated glucose uptake andisoproterenol-stimulated lipolysis from 3T3-L1 adipocytesoverexpressing PTRF. A) Serum-starved 3T3-L1 adipocytes inthe absence (�INS) and presence (�INS) of 500 nM insulinwere incubated with [3H]-deoxyglucose, and the incorpo-rated radioactivity was determined. B) Efflux of palmitatefrom the indicated 3T3-L1 serum-starved adipocytes treatedwith 10 �M isoproterenol for 2 h. Differences were tested withthe extra sum-of-squares F test method. Data of both analysesare pooled from 5 separate experiments. P � 0.028.
TABLE 2. Linear correlation analyses between PTRF mRNAexpression and that of selected genes
Gene
VAT, n � 93 SAT, n � 85
r P r P
Caveolin 0.39 0.005 0.36 0.01PKA �0.09 0.5 0.43 0.002FSP27 0.42 0.003 0.13 0.3PLIN1 0.4 0.003 0.34 0.01ADRP (or PLIN2) 0.33 0.01 0.27 0.06TIP47 (or PLIN3) 0.44 0.001 0.28 0.05ATGL 0.47 �0.0001 0.17 0.2CGI-58 0.32 0.01 �0.10 0.5P16ink4a 0.50 �0.0001 0.51 �0.0001PAI-1 0.30 0.01 0.54 �0.0001
r, Pearson coefficient.
4 6 8 100.0
0.5
1.0
1.5
Telomere Length (bp)
hPTR
F ge
ne e
xpre
ssio
n in
SA
T (A
.U.)
r = -0.44p=0.03
Figure 6. Negative correlation between telomere length andmRNA levels of PTRF in human subcutaneous adipose tissue(SAT). Graph shows linear regression lines (solid trace) andthe 95% confidence bands (dashed traces). Each dot corre-sponds to 1 individual (n�25). r, Pearson coefficient; A.U.,arbitrary units.
3776 Vol. 28 August 2014 PEREZ-DIAZ ET AL.The FASEB Journal � www.fasebj.org
olism, although there were no differences in plasmalipids or adiponectin. Only the ratio of visceral tosubcutaneous fat mirrored glucose intolerance. Weposit that the primary cause of the metabolic problemsin these obese mice was the inability of their subcuta-neous adipose tissues to expand and adequately storethe surplus of lipids provided by the Western-type diet.Our subsequent proteomic analysis yielded a panoplyof PTRF isoforms differentially regulated in the subcu-taneous adipose tissue in a glucose-tolerant manner.PTRF was initially identified as a transcriptional en-hancer of polymerase I (37) and later found at thecytoplasmic side of caveolae, where its function iscritical for caveola formation (31, 38). In agreementwith our results, a subset of genes associated with thestructure of caveolae (PTRF among them) also ap-peared to be associated with adipose tissue expansionin pups as well adult mice exposed to an obesogenicenvironment (39). Caveolae are abundant in adi-pocytes and play an important role in regulating cellu-lar metabolism (reviewed in ref. 40). Our INS subgroupof obese mice showed a 33% down-regulation of thePTRF isoforms in the adipose tissue, in the same rangeof the previously described 50% reduction of PTRFprotein levels after acute insulin injection (41). Inter-estingly, a PTRF degradation product appeared in-creased in the INS group, suggesting that some regula-tion is at the level of PTRF degradation. In this sense,different truncated isoforms of PTRF have been de-scribed using vectorial proteomics (38). We note, how-ever, that simultaneously with this increase in thedegraded isoform, an additional 10 PTRF isoformsappeared downregulated, making it very difficult todissect out the specific contributions of each individualisoform. Further studies are required to determine thecontribution of individual isoforms to the globallyobserved effects.
Conversely, the most metabolically challenged predi-abetic obese mice, the IGT group, had 10 upregulatedPTRF isoforms (range 107–297%). To determine thecellular mechanisms underlying this association, weoverexpressed PTRF in an in vitro model of adipocyte.PTRF localizes to a caveolae subclass that metabolizestriglycerides (29) and is shipped out to the cytosol oninsulin stimulation, where it colocalizes with the HSL(30). As described previously (41), PTRF did not in-crease basal lipolysis but instead increased induciblelipolysis. Surprisingly, no changes were observed inglucose transporter 4 (GLUT4) protein levels on PTRFup-regulation (not shown), nor did we detect variationsin insulin-stimulated deoxyglucose uptake betweencontrol adipocytes and their PTRF overexpressingcounterparts. On the other hand, adipocyte hypertro-phy and a slow generation rate of new adipocytes areassociated to dysfunctional adipose tissue and low insu-lin sensitivity (42, 43). In this regard, PTRF overexpres-sion resulted in larger adipocytes containing biggerlipid droplets, and both pharmacological and lentiviralPTRF overexpression in 3T3-L1 cells were accompa-nied by a diminished rate of adipocyte differentiation,as proved by lower mRNA levels of early adipogenicgenes (CEBP�, CEBP�) and decreased lipogenic mark-ers, such as PPAR expression and AFABP mRNA and
protein levels, as well as an increased pACC/ACC ratioalong with diminished de novo lipogenesis. Consideringall together, PTRF overexpression plays an importantrole in the adipocyte differentiation process, subse-quently affecting lipid storage management.
Glucose intolerance and hyperinsulinemia were alsodescribed in a PTRF-knockout mouse (44). We mustconsider why the overexpression of PTRF mirrors re-sults observed when PTRF is absent. Loss of PTRF, suchas observed in the PTRF-KO mouse, or loss of caveolaefor that matter, leads to a direct impairment in caveolarglucose/insulin receptor machinery and causes majordamage to those pathways (41, 44–48). Our datasuggest that whole-body glucose intolerance caused byPTRF up-regulation is a stepwise process, which stemsfrom a defective adipocyte differentiation, ultimatelyrendering the adipose tissue dysfunctional. The mech-anisms by which PTRF leads to adipose tissue senes-cence and inhibits differentiation have not yet beenestablished. Overexpression of caveolin-1 increased se-nescence and suppressed adipogenic differentiation inhuman mesenquimal stem cells (50), and previousstudies have shown that PTRF binds Mdm2, a negativeregulator of p53 (51), into caveolae. This sequestrationkeeps Mdm2 away from p53 (36, 52), triggering thep53-dependent senescence and antiadipogenic path-ways (53, 54). On the other hand, Mdm2 can alsoinduce adipocyte differentiation independently of itsability to regulate p53 by promoting cAMP-mediatedtranscriptional activation of CREB and induction ofCEBP� expression (55). Typically, CEBP� and CEBP� areinduced during the early stages of adipocyte differen-tiation, promoting further CEBP� and PPAR expres-sion (27). Therefore, we hypothesize that the reducedexpresion of CEBP� and CEBP� during differentiationof PTRF-overexpressing 3T3-L1 preadipocytes is medi-ated by a decrease in available Mdm2 as a result ofPTRF sequestration.
The effects of PTRF on human adipose tissue in thecontext of obesity have not yet been investigated. Wefound that PTRF mRNA levels were highly correlatedwith the levels of senescence markers in human adiposetissue. Adipose tissue expansion critically depends onthe proliferation of adipocyte precursors, and senes-cent cells have reduced adipogenesis and fail to seques-ter lipotoxic fatty acids (7). PTRF is upregulated inhuman fibroblasts during replicative senescence (53,56) as well as in stress-induced premature senescence(SIPS; ref. 36). Both types of senescence share acommon pathway through the p53/p21 and caveolarpathways. Short telomeres reflect damaged DNA andalso trigger a p53-dependent response (57), yet PTRFeffects on cellular senescence and SIPS have beendescribed as independent of telomere status (36, 53).Therefore, our results show for the first time a previ-ously unappreciated association of telomere shorteningwith PTRF expression.
In summary, our data demonstrate that PTRF is linkedto metabolic disorders at the whole-body level in obesemice as well as in obese individuals. The presence ofadipocytes with impaired adipogenesis and a failure tomaintain telomere length can explain, at least partially,the association of PTRF with the inability of the adipose
3777PTRF DETERMINES FAT EXPANDABILITY

tissue to expand appropriately and makes this protein asuitable marker of dysfunctional adipocytes.
The authors are grateful to Dr. Trono (École Polytech-nique Fédérale de Lausanne, Lausanne, Switzerland) and Dr.Helenius (Eidgenössische Technische Hochschule Zürich,Zurich, Switzerland) for the generous gifts of the lentiviralexpression system and the Ptrf1-mEGFP plasmid, respectively.The authors also acknowledge the invaluable technical assis-tance made by Ms. Pilar García-Sobreviela (Instituto Aragonésde Ciencias de la Salud) to the present work. Likewise, theauthors thank Drs. E. Fernadez-Vizarra (University of Cam-bridge, Cambridge, UK), J. Osada (Universidad de Zaragoza,Zaragoza, Spain), and R. Köhler (Instituto Aragonés deCiencias de la Salud) for their critical reading. This work wassupported by the Miguel Servet program from the Institutode Salud Carlos III (Madrid, Spain), by the Marie-CurieAction: 303717-APOMET from the European Commission toJ.M.A.-M., and by U.S. National Institutes of Health grantHL042360 to N.M. S.P.-D. was partially supported by a pre-doctoral fellowship from the Diputación General de Aragón(Madrid, Spain). The authors declare no conflicts of interest.
REFERENCES
1. Haffner, S. M. (2006) Relationship of metabolic risk factors anddevelopment of cardiovascular disease and diabetes. Obesity 4,121S–127S
2. Kilpelainen, T. O., Zillikens, M. C., Stancakova, A., Finucane,F. M., Ried, J. S., Langenberg, C., Zhang, W., Beckmann, J. S.,Luan, J., Vandenput, L., Styrkarsdottir, U., Zhou, Y., Smith,A. V., Zhao, J.-H., Amin, N., Vedantam, S., Shin, S. Y., Haritu-nians, T., Fu, M., Feitosa, M. F., Kumari, M., Halldorsson, B. V.,Tikkanen, E., Mangino, M., Hayward, C., Song, C., Arnold,A. M., Aulchenko, Y. S., Oostra, B. A., Campbell, H., Cupples,L. A., Davis, K. E., Döring, A., Eiriksdottir, G., Estrada, K.,Fernández-Real, J. M., Garcia, M., Gieger, C., Glazer, N. L.,Guiducci, C., Hofman, A., Humphries, S. E., Isomaa, B., Jacobs,L. C., Jula, A., Karasik, D., Karlsson, M. K., Khaw, K.-T., Kim,L. J., Kivimäki, M., Klopp, N., Kühnel, B., Kuusisto, J., Liu, Y.,Ljunggren, O, Lorentzon, M., Luben, R. N., McKnight, B.,Mellström, D., Mitchell, B. D., Mooser, V., Moreno, J. M.,Männistö, S., O’Connell, J. R., Pascoe, L., Peltonen, L., Peral, B.,Perola, M., Psaty, B. M., Salomaa, V., Savage, D. B., Semple,R. K., Skaric-Juric, T., Sigurdsson, G., Song, K. S., Spector, T. D.,Syvänen, A.-C., Talmud, P. J., Thorleifsson, G., Thorsteinsdottir,U., Uitterlinden, A. G., van Duijn, C. M., Vidal-Puig, A., Wild,S. H., Wright, A. F., Clegg, D. J., Schadt, E., Wilson, J. F., Rudan,I., Ripatti, S., Borecki, I. B., Shuldiner, A. R., Ingelsson, E.,Jansson, J.-O., Kaplan, R. C., Gudnason, V., Harris, T. B., Groop,L., Kiel, D. P., Rivadeneira, F., Walker, M., Barroso, I., Vollen-weider, P., Waeber, G., Chambers, J. C., Kooner, J. S., Soranzo,N., Hirschhorn, J. N., Stefansson, K., Wichmann, H.-E., Ohlsson,C., O’Rahilly, S., Wareham, N. J., Speliotes, E. K., Fox, C. S.,Laakso, M., and Loos, R. J. F. (2011) Genetic variation near IRS1associates with reduced adiposity and an impaired meta-bolic profile. Nat. Genet. 43, 753–760
3. Stefan, N., Kantartzis, K., Machann, J., Schick, F., Thamer, C.,Rittig, K., Balletshofer, B., Machicao, F., Fritsche, A., andHäring, H. U. (2008) Identification and characterization ofmetabolically benign obesity in humans. Arch. Intern. Med. 168,1609–1616
4. Wildman, R. P., Muntner, P., Reynolds, K., McGinn, A. P.,Rajpathak, S., Wylie-Rosett, J., and Sowers, M. R. (2008) Theobese without cardiometabolic risk factor clustering and thenormal weight with cardiometabolic risk factor clustering: prev-alence and correlates of 2 phenotypes among the US population(NHANES 1999–2004). Arch. Intern. Med. 168, 1617–1624
5. Scherer, P. E. (2006) Adipose tissue: from lipid storage com-partment to endocrine organ. Diabetes 55, 1537–1545
6. Arbones-Mainar, J. M., Johnson, L. A., Altenburg, M. K., andMaeda, N. (2008) Differential modulation of diet-induced obe-
sity and adipocyte functionality by human apolipoprotein E3and E4 in mice. Int. J. Obes. 32, 1595–1605
7. Tchkonia, T., Morbeck, D. E., Von Zglinicki, T., Van Deursen, J.,Lustgarten, J., Scrable, H., Khosla, S., Jensen, M. D., andKirkland, J. L. (2010) Fat tissue, aging, and cellular senescence.Aging Cell 9, 667–684
8. Hennuyer, N., Tailleux, A., Torpier, G., Mezdour, H., Fruchart,J.-C., Staels, B., and Fiévet, C. (2005) PPARalpha, but notPPARgamma, activators decrease macrophage-laden atheroscle-rotic lesions in a nondiabetic mouse model of mixed dyslipide-mia. Arterioscler. Thromb. Vasc. Biol. 25, 1897–902
9. Kuhel, D. G., Konaniah, E. S., Basford, J. E., McVey, C., Goodin,C. T., Chatterjee, T. K., Weintraub, N. L, Hui, D. Y. (2013)Apolipoprotein E2 accentuates postprandial inflammation anddiet-induced obesity to promote hyperinsulinemia in mice.Diabetes 62, 382–391
10. Sullivan, P. M., Mezdour, H., Quarfordt, S. H., and Maeda, N.(1998) Type III hyperlipoproteinemia and spontaneous athero-sclerosis in mice resulting from gene replacement of mouseApoe with human Apoe*2. J. Clin. Invest. 102, 130–135
11. Shiri-Sverdlov, R., Wouters, K., van Gorp, P. J., Gijbels, M. J.,Noel, B., Buffat, L., Staels, B., Maeda, N., van Bilsen, M., andHofker, M. H. (2006) Early diet-induced non-alcoholic steato-hepatitis in APOE2 knock-in mice and its prevention by fibrates.J. Hepatol. 44, 732–741
12. Vanschoonbeek, K., Wouters, K., van der Meijden, P. E. J., vanGorp, P. J., Feijge, M. A., H., Herfs, M., Schurgers, L. J., Hofker,M. H., de Maat, M. P., and Heemskerk, J. W. (2008) Anticoag-ulant effect of dietary fish oil in hyperlipidemia: a study ofhepatic gene expression in APOE2 knock-in mice. Arterioscler.Thromb. Vasc. Biol. 28, 2023–2029
13. Arbonés-Mainar, J. M., Navarro, M. A., Acín, S., Guzmán, M. A.,Arnal, C., Surra, J. C., Carnicer, R., Roche, H. M., and Osada, J.(2006) Trans-10, cis-12- and cis-9, trans-11-conjugated linoleicacid isomers selectively modify HDL-apolipoprotein composi-tion in apolipoprotein E knockout mice. J. Nutr. 136, 353–359
14. Arbonés-Mainar, J. M., Navarro, M. A., Guzmán, M. A., Arnal, C.,Surra, J. C., Acín, S., Carnicer, R., Osada, J., Roche, H. M. (2006)Selective effect of conjugated linoleic acid isomers on athero-sclerotic lesion development in apolipoprotein E knock-out mice. Atherosclerosis 189, 318–327
15. Arbones-Mainar, J. M., Johnson, L. A., Altenburg, M. K., Kim,H.-S., and Maeda, N. (2010) Impaired adipogenic response tothiazolidinediones in mice expressing human apolipopro-teinE4. FASEB J. 24, 3809–3818
16. DeKroon, R. M., Osorio, C., Robinette, J. B., Mocanu, M.,Winnik, W. M., and Alzate, O. (2011) Simultaneous detection ofchanges in protein expression and oxidative modification as afunction of age and APOE genotype. J. Proteome Res. 10, 1632–1644
17. Osorio, C., Sullivan, P. M., He, D. N., Mace, B. E., Ervin, J. F.,Strittmatter, W. J., and Alzate, O. (2007) Mortalin is regulatedby APOE in hippocampus of AD patients and by human APOEin TR mice. Neurobiol. Aging 28, 1853–1862
18. Hayer, A., Stoeber, M., Bissig, C., and Helenius, A. (2010)Biogenesis of caveolae: stepwise assembly of large caveolin andcavin complexes. Traffic 11, 361–382
19. Sánchez, E., Lobo, T., Fox, J. L., Zeviani, M., Winge, D. R., andFernández-Vizarra, E. (2013) LYRM7/MZM1L is a UQCRFS1chaperone involved in the last steps of mitochondrial complexIII assembly in human cells. Biochim. Biophys. Acta Bioenerg. 1827,285–293
20. Ramirez-Zacarias, J. L., Castro-Munozledo, F., and Kuri-Har-cuch, W. (1992) Quantitation of adipose conversion and trig-lycerides by staining intracytoplasmic lipids with Oil Red O.Histochemistry 97, 493–497
21. Krishan, A. (1975) Rapid flow cytofluorometric analysis ofmammalian cell cycle by propidium iodide staining. J. Cell Biol.66, 188–193
22. Johnson, L. A., Arbones-Mainar, J. M., Fox, R. G., Pendse, A. A.,Altenburg, M. K., Kim, H.-S., and Maeda, N. (2011) Apolipo-protein E4 exaggerates diabetic dyslipidemia and atherosclero-sis in mice lacking the LDL receptor. Diabetes 60, 2285–2294
23. Moreno-Navarrete, J. M., Ortega, F., Sabater, M., Ricart, W., andFernández-Real, J. M. (2010) Telomere length of subcutaneousadipose tissue cells is shorter in obese and formerly obese sub-jects. Int. J. Obes. 34, 1345–1348
3778 Vol. 28 August 2014 PEREZ-DIAZ ET AL.The FASEB Journal � www.fasebj.org

24. Moreno-Navarrete, J. M., Petrov, P., Serrano, M., Ortega, F.,García-Ruiz, E., Oliver, P., Ribot, J., Ricart, W., Palou, A., Bonet,M. L., and Fernández-Real, J. M. (2013) Decreased RB1 mRNA,protein, and activity reflect obesity-induced altered adipogeniccapacity in human adipose tissue. Diabetes 62, 1923–1931
25. Virtue, S., and Vidal-Puig, A. (2008) It’s not how fat you are, it’swhat you do with it that counts. PLoS Biol. 6, e237
26. Sakoda, H., Ogihara, T., Anai, M., Funaki, M., Inukai, K.,Katagiri, H., Fukushima, Y., Onishi, Y., Ono, H., Fujishiro, M.,Kikuchi, M., Oka, Y., and Asano, T. (2000) Dexamethasone-induced insulin resistance in 3T3-L1 adipocytes is due toinhibition of glucose transport rather than insulin signal trans-duction. Diabetes 49, 1700–1708
27. Farmer, S. R. (2006) Transcriptional control of adipocyte for-mation. Cell Metab. 4, 263–273
28. Abu-Elheiga, L., Jayakumar, A., Baldini, A., Chirala, S. S., andWakil, S. J. (1995) Human acetyl-CoA carboxylase: characteriza-tion, molecular cloning, and evidence for two isoforms. Proc.Natl. Acad. Sci. U.S.A. 92, 4011–4015
29. Ost, A., Ortegren, U., Gustavsson, J., Nystrom, F. H., andStrålfors, P. (2005) Triacylglycerol is synthesized in a specificsubclass of caveolae in primary adipocytes. J. Biol. Chem. 280, 5–8
30. Aboulaich, N., Ortegren, U., Vener, A. V., and Strålfors, P.(2006) Association and insulin regulated translocation of hor-mone-sensitive lipase with PTRF. Biochem. Biophys. Res. Commun.350, 657–661
31. Hill, M. M., Bastiani, M., Luetterforst, R., Kirkham, M., Kirkham,A., Nixon, S. J., Walser, P., Abankwa, D., Oorschot, V. M.,Martin, S., Hancock, J. F., and Parton, R. G. (2008) PTRF-Cavin,a conserved cytoplasmic protein required for caveola formationand function. Cell 132, 113–124
32. Zimmermann, R., Strauss, J. G., Haemmerle, G., Schoiswohl, G.,Birner-Gruenberger, R., Riederer, M., Lass, A., Neuberger, G.,Eisenhaber, F., Hermetter, A., and Zechner, R. (2004) Fatmobilization in adipose tissue is promoted by adipose triglycer-ide lipase. Science 306, 1383–1386
33. Lord, C. C., Betters, J. L., Ivanova, P. T., Milne, S. B., Myers,D. S., Madenspacher, J., Thomas, G., Chung, S., Liu, M., Davis,M. A., Lee, R. G., Crooke, R. M., Graham, M. J., Parks, J. S.,Brasaemle, D. L., Fessler, M. B., Brown, H. A., and Brown, J. M.(2012) CGI-58/ABHD5-derived signaling lipids regulate sys-temic inflammation and insulin action. Diabetes 61, 355–363
34. Wang, H., Hu, L., Dalen, K., Dorward, H., Marcinkiewicz, A.,Russell, D., Gong, D., Londos, C., Yamaguchi, T., Holm, C.,Rizzo, M. A., Brasaemle, D., and Sztalryd, C. (2009) Activation ofhormone-sensitive lipase requires two steps, protein phosphor-ylation and binding to the PAT-1 domain of lipid dropletcoat proteins. J. Biol. Chem. 284, 32116–32125
35. Kim, J. Y., Liu, K., Zhou, S., Tillison, K., Wu, Y., and Smas, C. M.(2008) Assessment of fat-specific protein 27 in the adipocytelineage suggests a dual role for FSP27 in adipocyte metabolismand cell death. Am. J. Physiol. Endocrinol. Metab. 294, E654–E667
36. Volonte, D., and Galbiati, F. (2011) Polymerase I and transcriptrelease factor (PTRF)/cavin-1, a novel regulator of stress-in-duced premature senescence. J. Biol. Chem. 286, 28657–28661
37. Jansa, P., Mason, S. W., Hoffmann-Rohrer, U., and Grummt, I.(1998) Cloning and functional characterization of PTRF, anovel protein which induces dissociation of paused ternarytranscription complexes. EMBO J. 17, 2855–2864
38. Aboulaich, N., Vainonen, J. P., Strålfors, P., and Vener, A. V.(2004) Vectorial proteomics reveal targeting, phosphorylationand specific fragmentation of polymerase I and transcriptrelease factor (PTRF) at the surface of caveolae in human adi-pocytes. Biochem. J. 383, 237–248
39. Kozak, L. P., Newman, S., Chao, P.-M., Mendoza, T., and Koza,R. A. (2010) The early nutritional environment of mice deter-mines the capacity for adipose tissue expansion by modulatinggenes of caveolae structure. PLoS ONE 5, e11015
40. Pilch, P. F., and Liu, L. (2011) Fat caves: caveolae, lipidtrafficking and lipid metabolism in adipocytes. Trends Endocrinol.Metab. 22, 318–324
41. Aboulaich, N., Chui, P. C., Asara, J. M., Flier, J. S., andMaratos-Flier, E. (2011) Polymerase I and transcript releasefactor regulates lipolysis via a phosphorylation-dependent mech-anism. Diabetes 60, 757–765
42. Jernås, M., Palming, J., Sjöholm, K., Jennische, E., Svensson,P.-A., Gabrielsson, B. G., Levin, M., Sjögren, A., Rudemo, M.,Lystig, T. C., Carlsson, B., Carlsson, L. M., and Lönn, M. (2006)Separation of human adipocytes by size: hypertrophic fat cellsdisplay distinct gene expression. FASEB J. 20, 1540–1542
43. Arner, E., Westermark, P. O., Spalding, K. L., Britton, T., Ryden,M., Frisen, J., Bernard, S., and Arner, P. (2010) Adipocyteturnover: relevance to human adipose tissue morphology. Dia-betes 59, 105–109
44. Liu, L., Brown, D., McKee, M., Lebrasseur, N. K., Yang, D.,Albrecht, K. H., Ravid, K., and Pilch, P. F. (2008) Deletion ofCavin/PTRF causes global loss of caveolae, dyslipidemia, andglucose intolerance. Cell Metab. 8, 310–317
45. Razani, B., Combs, T. P., Wang, X. B., Frank, P. G., Park, D. S.,Russell, R. G., Li, M., Tang, B., Jelicks, L. A., Scherer, P. E., andLisanti, M. P. (2002) Caveolin-1-deficient mice are lean, resis-tant to diet-induced obesity, and show hypertriglyceridemia withadipocyte abnormalities. J. Biol. Chem. 277, 8635–8647
46. Gustavsson, J., Parpal, S., Karlsson, M., Ramsing, C., Thorn, H.,Borg, M., Lindroth, M., Peterson, K. H., Magnusson, K. E., andStrâlfors, P. (1999) Localization of the insulin receptor incaveolae of adipocyte plasma membrane. FASEB J. 13, 1961–1971
47. Kim, C. A., Delépine, M., Boutet, E., El Mourabit, H., Le Lay, S.,Meier, M., Nemani, M., Bridel, E., Leite, C. C., Bertola, D. R.,Semple, R. K., O’Rahilly, S., Dugail, I., Capeau, J., Lathrop, M.,and Magré, J. (2008) Association of a homozygous nonsensecaveolin-1 mutation with berardinelli-seip congenital lipodystro-phy. J. Clin. Endocrinol. Metab. 93, 1129–1134
48. Cao, H., Alston, L., Ruschman, J., and Hegele, R. A. (2008)Heterozygous CAV1 frameshift mutations (MIM 601047) inpatients with atypical partial lipodystrophy and hypertriglyceri-demia. Lipids Heal. Dis. 7, 3
49. González-Muñoz, E., López-Iglesias, C., Calvo, M., Palacín, M.,Zorzano, A., and Camps, M. (2009) Caveolin-1 loss of functionaccelerates glucose transporter 4 and insulin receptor degrada-tion in 3T3-L1 adipocytes. Endocrinology 150, 3493–3502
50. Park, J. S., Kim, H. Y., Kim, H. W., Chae, G. N., Oh, H. T.,Park, J. Y., Shim, H., Seo, M., Shin, E. Y., Kim, E. G., Park,S. C., and Kwak, S. J. (2005) Increased caveolin-1, a cause forthe declined adipogenic potential of senescent human mes-enchymal stem cells. Mech. Ageing Dev. 126, 551–559
51. Haupt, Y., Maya, R., Kazaz, A., and Oren, M. (1997) Mdm2promotes the rapid degradation of p53. Nature 387(6630),296–299
52. Bitar, M. S., Abdel-Halim, S. M., and Al-Mulla, F. (2013)Caveolin-1/PTRF upregulation constitutes a mechanism formediating p53-induced cellular senescence: implications forevidence-based therapy of delayed wound healing in diabetes.Am. J. Physiol. Endocrinol. Metab. 305, E951963
53. Bai, L., Deng, X., Li, J., Wang, M., Li, Q., An, W., A, D., andCong, Y. S. (2011) Regulation of cellular senescence by theessential caveolar component PTRF/Cavin-1. Cell Res. 21, 1088–1101
54. Molchadsky, A., Ezra, O., Amendola, P. G., Krantz, D., Kogan-Sakin, I., Buganim, Y., Rivlin, N., Goldfinger, N., Folgiero, V.,Falcioni, R., Sarig, R., and Rotter, V. (2013) p53 is required forbrown adipogenic differentiation and has a protective roleagainst diet-induced obesity. Cell Death Differ. 20, 774–783
55. Hallenborg, P., Feddersen, S., Francoz, S., Murano, I., Sun-dekilde, U., Petersen, R. K., Akimov, V., Olson, M. V., Lozano,G., Cinti, S., Gjertsen, B. T., Madsen, L., Marine, J. C., Blagoev,B., and Kristiansen, K. (2012) Mdm2 controls CREB-dependenttransactivation and initiation of adipocyte differentiation. CellDeath Differ. 19, 1381–1389
56. Cong, Y.-S., Fan, E., and Wang, E. (2006) Simultaneous pro-teomic profiling of four different growth states of humanfibroblasts, using amine-reactive isobaric tagging reagents andtandem mass spectrometry. Mech. Ageing Dev. 127, 332–343
57. Chin, L., Artandi, S. E., Shen, Q., Tam, A., Lee, S.-L., Gottlieb,G. J., Greider, C. W., DePinho, R. A. (1999) p53 Deficiencyrescues the adverse effects of telomere loss and cooperates withtelomere dysfunction to accelerate carcinogenesis. Cell 97, 527–538
Received for publication February 5, 2014.Accepted for publication May 28, 2014.
3779PTRF DETERMINES FAT EXPANDABILITY
Copyright © 2022 FDOKUMEN