Fatty acid composition of liver, adipose tissue, spleen, and heart of mice fed diets containing t10,...
8
Prostaglandins, Leukotrienes and Essential Fatty Acids 74 (2006) 331–338 Fatty acid composition of liver, adipose tissue, spleen, and heart of mice fed diets containing t10, c12-, and c9, t11-conjugated linoleic acid Darshan S. Kelley a, , Giovanni L. Bartolini a , John W. Newman a , Madhuri Vemuri a , Bruce E. Mackey b a Western Human Nutrition Research Center, ARS, USDA, and Department of Nutrition, University of California, One Shields Avenue, Davis, CA 95616, USA b Western Regional Research Center, ARS, USDA, Albany, CA, USA Received 23 January 2006; received in revised form 13 February 2006; accepted 14 February 2006 Abstract Conjugated linoleic acid (CLA) isomers have unique effects on tissue lipids. Here we investigated the influence of individual CLA isomers on the lipid weight and fatty acid composition of lipid metabolizing (i.e. liver and retroperitoneal adipose) and lipid sensitive (i.e. spleen and heart) tissues. Female mice (8 week old; n ¼ 6/group) were fed either a control or one of the two CLA isomer supplemented (0.5%) diets for 8 weeks. The cis-9, trans-11-CLA diet reduced the 18:1n-9 wt% by 20–50% in liver, adipose tissue, and spleen, reduced the spleen n-3 polyunsaturated fatty acid (PUFA) by 90%, and increased the n-6 PUFA wt% by 20–50% in all tissues except heart. The trans-10, cis-12-CLA reduced both the n-6 and n-3 PUFA wt% in liver (450%), reduced the heart n-3 PUFA wt% by 25%, and increased the wt% of spleen n-3 PUFA by 700%. The functional consequences of such changes in tissue fatty acid composition need to be investigated. r 2006 Elsevier Ltd. All rights reserved. 1. Introduction Conjugated linoleic acid (CLA) is the collective term for a group of linoleic acid isomers having conjugated double bonds. Several isomers of CLA have been reported with unique double-bond position and geome- try [1]. Most studies exploring the biological conse- quences of CLA feeding have used isomeric mixtures comprised of the two major forms, cis-9, trans-11-CLA (c9, t11-CLA) and trans-10, cis-12-CLA (t10, c12-CLA), and a number of minor isomers. The major dietary sources of c9, t11-CLA are dairy products and ruminant meat, while that of t10, c12-CLA are partially hydro- genated vegetable oils from margarines and shortenings [2]. Feeding CLA isomer mixtures has been reported to alter tissue fatty acid profiles in various animal models including rats [3], mice [4,5], hamsters [6], fish [7], chickens [8,9], and pigs [10–12]. However, a few studies have examined the effects of individual CLA isomers on tissue fatty acid profiles [13–18]. From the studies feeding individual CLA isomers, it can be seen that c9, t11-CLA and t10, c12-CLA produced different effects on the fatty acid profiles of rat liver and adipose tissue [13,18], mouse liver [15,16], mouse carcass, mammary gland, and milk [17], as well as bovine milk fat [14]. However, the effects of these CLA isomers on the fatty acid profiles of other mouse tissues have not been examined. Therefore, to enhance our understanding of these CLA isomer effects, we investi- gated lipid content, fatty acid profiles, and CLA isomer incorporation in the liver, retroperitoneal (RP) adipose tissue, spleen, and heart of mice fed either CLA-free diets (Control), or diets containing highly enriched c9, ARTICLE IN PRESS www.elsevier.com/locate/plefa 0952-3278/$ - see front matter r 2006 Elsevier Ltd. All rights reserved. doi:10.1016/j.plefa.2006.02.008 Corresponding author. Tel.: 530 752 5138; fax: 530 754 5723. E-mail address: [email protected] (D.S. Kelley).
-
Upload
independent -
Category
Documents
-
view
1 -
download
0
Transcript of Fatty acid composition of liver, adipose tissue, spleen, and heart of mice fed diets containing t10,...
ARTICLE IN PRESS
0952-3278/$ - se
doi:10.1016/j.pl
�CorrespondE-mail addr
Prostaglandins, Leukotrienes and Essential Fatty Acids 74 (2006) 331–338
www.elsevier.com/locate/plefa
Fatty acid composition of liver, adipose tissue, spleen, andheart of mice fed diets containing t10, c12-, and
c9, t11-conjugated linoleic acid
Darshan S. Kelleya,�, Giovanni L. Bartolinia, John W. Newmana,Madhuri Vemuria, Bruce E. Mackeyb
aWestern Human Nutrition Research Center, ARS, USDA, and Department of Nutrition, University of California,
One Shields Avenue, Davis, CA 95616, USAbWestern Regional Research Center, ARS, USDA, Albany, CA, USA
Received 23 January 2006; received in revised form 13 February 2006; accepted 14 February 2006
Abstract
Conjugated linoleic acid (CLA) isomers have unique effects on tissue lipids. Here we investigated the influence of individual CLA
isomers on the lipid weight and fatty acid composition of lipid metabolizing (i.e. liver and retroperitoneal adipose) and lipid sensitive
(i.e. spleen and heart) tissues. Female mice (8week old; n ¼ 6/group) were fed either a control or one of the two CLA isomer
supplemented (0.5%) diets for 8 weeks. The cis-9, trans-11-CLA diet reduced the 18:1n-9wt% by 20–50% in liver, adipose tissue,
and spleen, reduced the spleen n-3 polyunsaturated fatty acid (PUFA) by 90%, and increased the n-6 PUFA wt% by 20–50% in all
tissues except heart. The trans-10, cis-12-CLA reduced both the n-6 and n-3 PUFA wt% in liver (450%), reduced the heart n-3
PUFA wt% by 25%, and increased the wt% of spleen n-3 PUFA by 700%. The functional consequences of such changes in tissue
fatty acid composition need to be investigated.
r 2006 Elsevier Ltd. All rights reserved.
1. Introduction
Conjugated linoleic acid (CLA) is the collective termfor a group of linoleic acid isomers having conjugateddouble bonds. Several isomers of CLA have beenreported with unique double-bond position and geome-try [1]. Most studies exploring the biological conse-quences of CLA feeding have used isomeric mixturescomprised of the two major forms, cis-9, trans-11-CLA(c9, t11-CLA) and trans-10, cis-12-CLA (t10, c12-CLA),and a number of minor isomers. The major dietarysources of c9, t11-CLA are dairy products and ruminantmeat, while that of t10, c12-CLA are partially hydro-genated vegetable oils from margarines and shortenings[2]. Feeding CLA isomer mixtures has been reported to
e front matter r 2006 Elsevier Ltd. All rights reserved.
efa.2006.02.008
ing author. Tel.: 530 752 5138; fax: 530 754 5723.
ess: [email protected] (D.S. Kelley).
alter tissue fatty acid profiles in various animal modelsincluding rats [3], mice [4,5], hamsters [6], fish [7],chickens [8,9], and pigs [10–12]. However, a few studieshave examined the effects of individual CLA isomers ontissue fatty acid profiles [13–18].
From the studies feeding individual CLA isomers, itcan be seen that c9, t11-CLA and t10, c12-CLAproduced different effects on the fatty acid profiles ofrat liver and adipose tissue [13,18], mouse liver [15,16],mouse carcass, mammary gland, and milk [17], as well asbovine milk fat [14]. However, the effects of these CLAisomers on the fatty acid profiles of other mouse tissueshave not been examined. Therefore, to enhance ourunderstanding of these CLA isomer effects, we investi-gated lipid content, fatty acid profiles, and CLA isomerincorporation in the liver, retroperitoneal (RP) adiposetissue, spleen, and heart of mice fed either CLA-freediets (Control), or diets containing highly enriched c9,
ARTICLE IN PRESSD.S. Kelley et al. / Prostaglandins, Leukotrienes and Essential Fatty Acids 74 (2006) 331–338332
t11-CLA or t10, c12-CLA. Liver and adipose tissue wereselected for their major role in fatty acid metabolism,while the spleen and heart were selected because fattyacids significantly modulate their functions. Our resultsshow that the two CLA isomers differed in theirincorporation into tissue lipids and in their effects ontissue fatty acid composition.
2. Materials and methods
2.1. CLA isomers and diets
The c9, t11-CLA, and t10, c12-CLA isomer free acids(85–88% pure) were a kind gift from Natural ASA,Hovdebygda, Norway. The concentration of CLA usedin this study was 0.5wt% of the diet, which iscomparable to the concentration range of 0.1–1.5wt%of a CLA isomer mixture used in previous studies withrodent models. The basal diet was AIN-93G highcarbohydrate mouse diet. The nutrient and fatty acidcomposition of this diet has been previously reported[19,20]. The diet used in this study was low in 18:3n-3,with an 18:2n-6:18:3n-3 ratio of 25:1, as compared to a7:1 ratio for the AIN-93 diet prepared with soybean oil.However, since t10, c12-CLA caused the development offatty livers and the reduction in adipose tissue weights inmice fed diets based on either soybean oil [21] orsunflower plus linseed oil-based diets [22], the CLAisomer effects do not appear linked to a low 18:3n-3intake. All animal protocols were approved by theAnimal Use Committee at the University of California,Davis.
2.2. Animals, feeding, and tissue collection
Eighteen, 8-week-old, pathogen-free C57BL/6N fe-male mice were purchased from Charles River (Raleigh,NC). They were maintained in a sterile air curtainisolator at the animal facility of the University ofCalifornia, Medical School with controlled temperature(25 1C) and light and dark cycle (12 h each). They werefed the laboratory Chow diet for first 7 days andexperimental diets for the last 56 days. Animals weredivided into three groups at the start of experimentaldiets (study day 1), 6 per group. Details regardinganimal handling, sacrifice, tissue collection and storagehave been published [16,19,20].
2.3. Lipid extraction and fatty acid analysis
Livers, RP adipose tissue, spleens and hearts wereremoved, blotted dry with tissue paper, weighed, placedin liquid nitrogen, and stored frozen at �80 1C untilprocessed. Extraction of lipids and fatty acid analysiswas performed according to the previously published
methods from our laboratory [23], with the exceptionthat mass spectral, rather than flame ionization detec-tion was used to record fatty acid responses. Isolatedfatty acid methyl esters were analyzed on an Agilent6890 gas chromatograph equipped with a 100m�0.25mm� 0.2 mm film SP-2380 (Sigma-Aldrich; St.Louis, MO) and interfaced with an Agilent 5973N MassSpectral Detector with electron impact ionizationscanning from m=z 50–436, All data analysis andquantification was performed using Agilent Chemsta-tion Software. Methylated fatty acid standards wereused to calibrate instrumental retention times andresponses. These along with the acquired full scan massspectra were used to identify and quantify sample fattyacids. All fatty acid results are shown as the mean-s7SEM (n ¼ 6) for the weight percent (wt%) ofindividual fatty acids. Fatty acids with concentrationsof less than 0.5wt%, were considered minor, and are notshown unless they were CLA isomers or other fattyacids whose concentration exceeded 0.5 wt% in at leastone tissue.
2.4. Statistical analysis
The SAS proc glm was used for a one-way analysis ofvariance between treatments and for Levene’s test forheterogeneity of variance. Dunnett’s test was used tocompare the two treatment means with the control.When there was evidence of heterogeneity of variance,the SAS proc mixed was used to incorporate theheterogeneity in the model. When the control data isentirely zero, t tests were used to test for treatmentmeans significantly different from zero [24]. Treatmenteffects with Po0:05 are considered significant.
3. Results
3.1. Effect of CLA isomers on tissue wet and lipid weights
The c9, t11-CLA diet did not alter either the tissue wetor lipid weights for the four tissues examined whencompared to the controls (Table 1). In contrast, whilet10, c12-CLA feeding did not alter the wet or lipidweights of the spleen or heart, this isomer influenced theliver and RP adipose tissue (Table 1). The t10, c12-CLAdiet increased the liver wet weight and concentration oflipid by 2-folds, while increasing the total tissue lipidmass 4-fold. The t10, c12-CLA diet also caused a 50%reduction in RP adipose tissue weight and 75%reduction in its total lipid content. Thus, neither isomeraffected the total lipid content of the spleen and heart,while the t10, c12-CLA altered the lipid contents of liverand adipose tissue.
ARTICLE IN PRESS
Table 1
Effect of CLA isomers on tissue weight and lipid content
Group Control c9,t11-CLA t10,c12-CLA
Liver
Wet weight (g) 1.2870.030 1.4670.060 2.5470.070*
Lipid weight (mg) 107713 95.279.7 430739*
Lipid (mg/g) 79.578.6 65.175.0 17178.2*
Retroperitoneal adipose tissue
Wet weight (g) 0.4970.04 0.4870.05 0.2070.02*
Lipid weight (mg) 224729 253735 63.0710*
Lipid (mg/g) 423715 521746 360721
Spleen
Wet weight (g) 0.1070.01 0.1270.02 0.1270.01
Lipid weight (mg) 4.470.2 5.570.4 5.070.3
Lipid (mg/g) 41.871.4 47.672.4 44.573.3
Heart
Wet weight (g) 0.1770.03 0.1770.03 0.1670.02
Lipid weight (mg) 8.871.3 8.370.7 8.670.6
Lipid (mg/g) 52.074.9 53.173.0 51.472.9
Data shown are mean7SEM (n ¼ 6). Numbers with an * are
significantly different (Po0.05) from control.
D.S. Kelley et al. / Prostaglandins, Leukotrienes and Essential Fatty Acids 74 (2006) 331–338 333
3.2. CLA isomers incorporation into tissue lipids
The mean wt% of c9, t11-CLA in RP adipose tissue,liver, and heart lipids were 3.9, 1.0, and 0.6, respectively;corresponding values for t10, c12-CLA were 1.2, 0.2,and 0.4, respectively (Table 2). Incorporation ofboth isomers into spleen lipids was below the detectionlimit. The wt% of c9, t11-CLA in liver and adiposetissue lipids was approximately 4-fold greater thanthose of the corresponding concentrations of the t10,c12-CLA.
3.3. Effect of CLA isomers on tissue fatty acid
composition
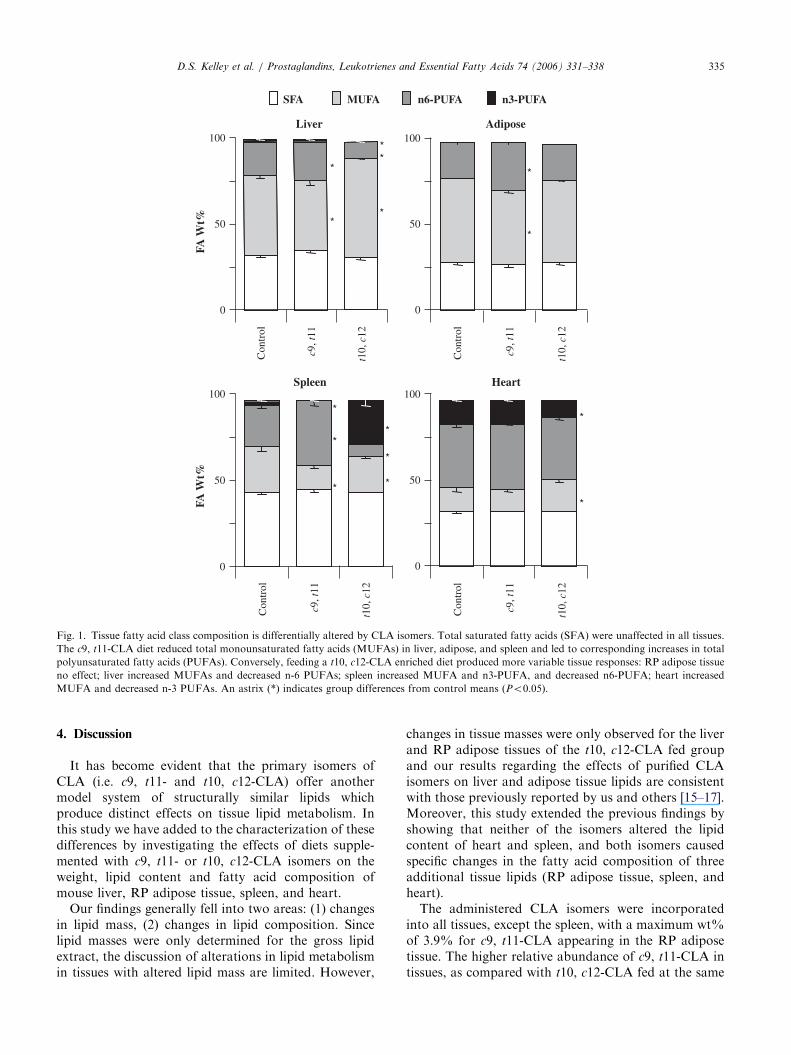
As expected, each control tissue showed unique fattyacid compositions (Fig. 1 and Table 2). The liver andadipose lipid composition was rather similar. Relative tothese tissues, the spleen was enriched in saturated fattyacids (SFAs) and low in monounsaturated fatty acids(MUFAs), while the heart was greatly enriched inpolyunsaturated fatty acids (PUFAs) at the expense ofMUFAs.
As shown in Section 3.1 above, neither CLA isomerchanged the total lipid content of the spleen and heart(Table 1); however, they both altered the fatty acid wt%in all examined tissues (Fig. 1 and Table 2). As seen inFig. 1, the c9, t11-CLA diet caused a reduction in thewt% of MUFAs in all tissues except the heart, showing16–50% reductions in the wt% of 18:1n-9 and acorresponding increase in the wt% of total n-6 PUFAin lipids from all tissues except heart. This increase in
n-6 PUFA was due to a 1.2-fold increase in the wt% of18:2n-6 in liver (from 12 to 15wt%) and RP adiposetissue (from 19 to 23wt%), and a 1.7-fold increase (from16 to 27wt%) in 20:4n-6 in spleen lipids (Table 2). Thelipids of the spleen also showed the only effect on n3-PUFAs by the c9, t11-CLA diet, a reduction in DHAfrom 2.8 to 0.3wt%. Representative chromatograms ofspleen lipids are shown in Fig. 2 to highlighted peakidentifications.
While the relative abundance of the total SFAs werenot altered by either CLA isomers in any tissue (Fig. 1),small yet significant changes in SFA composition wereobserved (Table 2). Most notably, the t10, c12-CLA dietreduced the 18:0 contribution to the total SFA by 10, 9,and 5% in the liver, spleen, and adipose tissue,respectively with a concomitant increase in 16:0. More-over, the t10, c12-CLA diet increased the wt% ofMUFAs in the liver and heart and decreased themin spleen, but did not change their wt% in adiposetissue (Fig. 1). From Table 2, it can be clearly seen thatthese changes are primarily being driven by shifts in18:1n-9.
Similar to the c9, t11-CLA diet, feeding the t10, c12-CLA isomer had dramatic, yet distinct effects on tissuePUFA compositions. The t10, c12-CLA diet decreasedthe wt% of n-6 PUFAs in the liver and spleen, but notthe heart or RP adipose tissue (Fig. 1). In the liver, thereduction in n6-PUFA wt% was due to a 50% reductionin 18:2n-6 and a 66% reduction in 20:4n-6. No changesin the wt% of 18:2n-6 was observed in the other threetissues, and the 20:4n-6wt% was also unchanged in theRP adipose tissue and heart lipids. In the spleen,however, 20:4n-6 was reduced from 16.4 to 0.6wt%(Table 2). The 22:5n-6 comprised less than 1wt% of theisolated lipids in all tissues except the heart, wherethe control level of 9.3wt% was reduced to 6.0wt% inthe t10, c12-CLA group.
With respect to the n3-PUFAs, the t10, c12-CLA dietreduced the wt% of these fatty acids in both the liverand heart, while increasing them in the spleen (Figs. 1and 2). The n-3 PUFA were below the method detectionlimit in the RP adipose tissue. Changes in liver, heart,and spleen n-3 PUFA were largely due to changes in theconcentration of DHA, which decreased in liver (1.2–0.4wt%) and heart (13.1–9.7wt%) and increased inspleen (2.8–21.0 wt%). The wt% of EPA increased fromundetectable to 2.8% in the spleen in the t10, c12-CLAfed group (Table 2).
Therefore, in terms of alterations of fatty acid wt%,the c9, t10-CLA diet affected the spleen bliverERPadipose while the heart changed the least. In contrast thet10, c12-CLA diet affected the spleen4liverbheart andthe RP adipose was minimally changed. Moreoverchanges produced by the t10, c12-CLA diet weregenerally much larger than those produced by the c9,t11-CLA diet in all tissues.

ARTICLE IN PRESS
Table
2
Effectofdietary
CLA
isomersonwt%
fattyacidcompositionofmouse
tissues
FAME
Liver
RPadipose
tissue
Spleen
Heart
Control
c9,
t11
t10,
c12
Control
c9,
t11
t10,
c12
Control
c9,
t11
t10,
c12
Control
c9,
t11
t10,
c12
Sa
tura
ted
fatt
ya
cids
14:0
0.370.1
0.370.1
0.470.1
1.570.1
1.870.0*
1.470.1
1.270.2
1.170.1
2.870.3*
1.070.2
0.970.2
1.270.3
16:0
23.970.6
25.471.3
25.370.6
21.770.2
21.970.5
23.170.3*
26.471.0
26.570.7
29.170.6*
13.471.5
14.170.6
14.370.9
18:0
7.670.5
9.570.5
4.370.3*
4.270.2
2.570.3*
2.870.3*
15.470.6
16.471.1
11.670.6*
17.570.5
17.170.3
16.570.5
Mo
no
un
satu
rate
dfa
tty
aci
ds
16:1n-9
0.8
0.670.2
1.770.1*
0.670
0.670.0
1.170.0*
0.470.1
0.270.0
0.470.1
0.270.0
0.270.0
0.470.1
16:1n-7
3.070.2
1.770.3
*2.570.1
7.070.2
7.470.5
3.570.1*
1.770.3
1.870.4
1.870.1
0.670.1
0.670.2
0.570.2
18:1n-9
38.771.6
34.171.3*
48.870.8*
39.270.8
32.870.8*
40.770.7
21.471.8
10.572.4*
17.072.0*
10.270.7
9.670.6
13.971.3*
18:1n-7
4.170.3
3.370.3*
5.070.1*
2.770.5
2.170.1
3.070.1
2.870.1
1.370.1*
1.870.1*
2.470.2
2.070.1*
2.670.1
Poly
un
satu
rate
dfa
tty
aci
ds
18:2n-6
12.070.9
14.771.5*
6.470.2*
19.170.5
22.770.6*
18.270.3
4.470.2
2.670.4*
5.670.2
16.070.9
17.570.7
16.970.6
c9,
t11-C
LA
ND
1.070.1*
0.170.0
ND
3.970.1*
0.270.0
ND
ND
ND
ND
0.670.1*
ND
t10,
c12-C
LA
ND
0.170.0*
0.270.0*
ND
0.370.0*
1.270.0*
ND
ND
ND
ND
ND
0.470.1*
20:3n-6
0.470.1
0.470.1
0.270.0
0.270.0
0.270.0
0.170.0
0.670.1
0.970.1*
0.270.0*
0.570.1
0.670.1
0.670.0
20:4n-6
6.270.4
6.270.5
2.170.2*
0.670.1
0.570.1
0.770.1
16.471.0
27.370.8*
0.670.1*
10.270.6
9.970.1
11.370.2
22:4n-6
0.170.0
0.170.0
0.170.0
0.170.0
0.170.0
0.170.0
2.170.2
6.370.3*
ND
0.970.1
1.070.1
0.970.1
22:5n-6
0.670.1
0.570.1
0.370.1
0.170.0
0.170.0
0.170.0
0.570.0
0.570.1
ND
9.370.6
8.470.5
6.070.8*
20:5n-3
ND
ND
ND
ND
ND
ND
ND
ND
2.870.3*
ND
ND
ND
22:5n-3
ND
ND
ND
ND
ND
ND
ND
ND
0.570.0
0.270.0
0.370.0
0.170.0
22:6n-3
1.270.1
1.170.1
0.470.0*
ND
ND
ND
2.870.3
0.370.0*
21.071.4*
13.170.9
13.270.4
9.770.5*
Minor/unknown
1.1
12.2
33.1
3.8
3.9
4.3
4.8
4.5
44.7
Ra
tio
s
n-3/n-6
0.0670.0
0.0570.0
0.0470.0
——
—0.1270.0
0.0170.0*
3.8070.2*
0.3670.04
0.3670.02
0.2770.04*
MUFA:SFA
1.4770.1
1.1370.1*
1.9370.1*
1.8170.1
1.6570.1
1.7770.1
0.6170.1
0.3170.07*
0.4870.06
0.4270.02
0.3970.02
0.5470.05*
Data
are
mean7SEM
(n¼
6).Numberswith*are
significantlydifferent(Po0.05)from
correspondingnumbersin
controlgroup,FAME¼
fattyacidmethylesters;ND¼
notdetected;RP¼
retroperitoneal;SFA¼
saturatedfattyacids;
MUFA¼
monounsaturatedfattyacids;
PUFA¼
polyunsaturatedfattyacids.
Theratiobetweenn-3
andn-6
PUFA
foradipose
tissues
isnot
calculatedbecause
theconcentrationofn-3PUFA
wasbelow
thedetectionlimit.Minorfattyacidsincludethose
withconcentrationsless
than0.5wt%
inalltissues.
D.S. Kelley et al. / Prostaglandins, Leukotrienes and Essential Fatty Acids 74 (2006) 331–338334
ARTICLE IN PRESS
Liver
0
50
100
Con
trol
c9, t
11
t10,
c12
FA W
t%
Adipose
0
50
100
Con
trol
c9, t
11
t10,
c12
Spleen
0
50
100
Con
trol
c9, t
11
FA W
t%
Heart
0
50
100
Con
trol
c9, t
11
t10,
c12
t10,
c12
*
*
*
**
*
*
*
*
*
*
*
*
*
*
n3-PUFAn6-PUFAMUFASFA
Fig. 1. Tissue fatty acid class composition is differentially altered by CLA isomers. Total saturated fatty acids (SFA) were unaffected in all tissues.
The c9, t11-CLA diet reduced total monounsaturated fatty acids (MUFAs) in liver, adipose, and spleen and led to corresponding increases in total
polyunsaturated fatty acids (PUFAs). Conversely, feeding a t10, c12-CLA enriched diet produced more variable tissue responses: RP adipose tissue
no effect; liver increased MUFAs and decreased n-6 PUFAs; spleen increased MUFA and n3-PUFA, and decreased n6-PUFA; heart increased
MUFA and decreased n-3 PUFAs. An astrix (*) indicates group differences from control means (Po0.05).
D.S. Kelley et al. / Prostaglandins, Leukotrienes and Essential Fatty Acids 74 (2006) 331–338 335
4. Discussion
It has become evident that the primary isomers ofCLA (i.e. c9, t11- and t10, c12-CLA) offer anothermodel system of structurally similar lipids whichproduce distinct effects on tissue lipid metabolism. Inthis study we have added to the characterization of thesedifferences by investigating the effects of diets supple-mented with c9, t11- or t10, c12-CLA isomers on theweight, lipid content and fatty acid composition ofmouse liver, RP adipose tissue, spleen, and heart.
Our findings generally fell into two areas: (1) changesin lipid mass, (2) changes in lipid composition. Sincelipid masses were only determined for the gross lipidextract, the discussion of alterations in lipid metabolismin tissues with altered lipid mass are limited. However,
changes in tissue masses were only observed for the liverand RP adipose tissues of the t10, c12-CLA fed groupand our results regarding the effects of purified CLAisomers on liver and adipose tissue lipids are consistentwith those previously reported by us and others [15–17].Moreover, this study extended the previous findings byshowing that neither of the isomers altered the lipidcontent of heart and spleen, and both isomers causedspecific changes in the fatty acid composition of threeadditional tissue lipids (RP adipose tissue, spleen, andheart).
The administered CLA isomers were incorporatedinto all tissues, except the spleen, with a maximum wt%of 3.9% for c9, t11-CLA appearing in the RP adiposetissue. The higher relative abundance of c9, t11-CLA intissues, as compared with t10, c12-CLA fed at the same

ARTICLE IN PRESS
Fig. 2. Spleen PUFA profiles were differentially altered by dietary CLA isomers. This figure shows representative chromatograms from the analysis
of spleen tissue (�35mg) from control, c9, t11-CLA, t10,c12-CLA fed groups superimposed with a reference standard 87 (each with a 5min time
offset). As seen in this figure, palmitic acid (PA) was unchanged while arachidonic acid (AA) and docosahexenoic acid (DHA) were influenced by
CLA feeding. In particular c9, t11-CLA increased AA and decreased DHA amounts, while t10, c12-CLA decreased AA and increased DHA
amounts. The inset shows the superposition of the DHA peaks without time offset. Signal to noise calculation for the peaks were 190:1, 40:1, and
750:1 for the control, c9,t11-CLA, t10, c12-CLA fed groups, respectively. The mass spectra of the peak co-eluting with DHA in the spleens of t10,
c12-CLA fed animals match the published DHA spectra (data not shown).
D.S. Kelley et al. / Prostaglandins, Leukotrienes and Essential Fatty Acids 74 (2006) 331–338336
dose, may be due to either increased absorption of c9,t11-CLA or increased degradation of t10, c12-CLA.The present study cannot discriminate among thesepossibilities.
While traces of CLA isomers are likely to be presentin the spleen, we were unable to detect them even bylowering the threshold for peak detection to 0.05% ofthe total peak area, and close visual inspection indicatedno perturbation of the chromatographic baseline atretention times corresponding to these peaks. We havepreviously reported that for liver lipids, concentration ofc9, t11-CLA in cholesteryl esters, triglycerides, andphospholipids was 3.1, 1.3, and 0.1%, respectively [16].Failure to detect CLA in spleen lipids may be due tohigher proportion of phospholipids in spleen lipids. Inaddition, since spleens were not perfused before lipidextraction, the RBC lipids may have also contributedsignificantly to the lipids in these extracts. In a previoushuman study, we found that CLA isomers were notdetectable in RBC lipids when healthy women supple-mented their diets with a CLA mixture (3.8 g/d) for 63days (Nelson et al., unpublished). Even after 24 weeks ofsupplementing CLA to healthy men, incorporation ofc9, t11-CLA and t10, c12-CLA into RBC lipids was only0.31 and 0.19wt% [25].
In animals fed with the control diet, concentrations ofseveral fatty acids differed among the tissues studied(Table 2). Liver and RP adipose fatty acid profiles werequite similar with the exception of 20:4n-6 and 22:6n-3,which appeared only at trace levels in the adiposetissues. Spleen and heart lipids contained even higher
concentrations of long chain PUFA as compared withthose in liver lipids. Previous studies have shown thatthe fatty acid composition of the tissues varied with theconcentrations of n-3 and n-6 PUFA in the diet [26–34].In animals fed the control diet, tissue fatty acid profilesare generally comparable to those previously reportedfor mice fed moderate amount of n-6 PUFA (Table 2)and [26,27,31,34].
Changes in the liver fatty acid profiles caused by bothc9, t11- and t10, c12-CLA are consistent with those wepreviously reported for mouse liver [16]. Most notice-able effects of c9, t11-CLA was a reduction in wt%18:1n-9 in liver, adipose tissue, and spleen. It alsoincreased the wt% of n-6 PUFA (20:4n-6 and 22:4n-6)and decreased n-3:n-6 PUFA (0.01 vs. 0.12 in control) inspleen lipids. This isomer had only marginal effects onthe fatty acid profile of heart lipids.
Feeding of t10, c12-CLA decreased the wt% of both18:2n-6 and 20:4n-6 in liver and that of 20:4n-6 inspleen, while it did not alter these fatty acids in the RPadipose tissue or heart lipids. In contrast to c9, t11-CLA, t10, c12-CLA increased the wt% of 18:1n-9 inliver and heart lipids, but did not significantly alter thewt% of this fatty acid in the other two tissues. Failure ofboth CLA isomers to alter the wt% of 20:4n-6 in heartlipids in our study is consistent with the conservation ofheart 20:4n-6 in mice fed an essential fatty acid deficientdiet [32]. In control mice, the wt% of 22:5n-6 and 22:6n-3 were less than 1 in all tissues except the heart, wheretheir concentrations were 9.3 and 13.1wt% respectively.However, in the t10, c12-CLA fed group, these long
ARTICLE IN PRESSD.S. Kelley et al. / Prostaglandins, Leukotrienes and Essential Fatty Acids 74 (2006) 331–338 337
chain PUFAs were reduced 25–30% in the heart. Thisisomer also reduced the spleen 20:4n-6 by 95% (from16.6 to 0.60wt%) and caused a 7.5-fold increase in thewt% (from 2.80 to 21.0wt%) of DHA in the lipidsisolated from spleens. This t10, c12-CLA-induced shiftin n-3 and n-6 PUFAs increased the n-3:n-6 PUFA ratioin the spleen �30-fold (from 0.12 to 3.8). To the best ofour knowledge, these are the most dramatic changes inthe fatty acid composition of any tissue caused by adietary intervention for just 8 weeks.
In summary, our results show that c9, t11-CLA didnot alter the weights of lipids in the examined tissues,and that t10, c12-CLA did not alter lipid weights inheart and spleen, but altered those in liver and adiposetissue. Both isomers altered the fatty acid compositionof all tissues, and differed in their effects on the fattyacid composition. The major effect of t10, c12-CLA wasan increase in wt% of DHA, and a decrease inarachidonic acid in spleen lipids; also highly significantwere the reductions in 22:6n-3 and 22:5n-6 in heartlipids. Since changes in total lipid mass were notdetected in the spleen and heart, this data suggests thata high t10, c12-CLA diet can produce quantitativechanges in these long chain PUFAs of the spleen andheart. While the underlying mechanisms for the changesin the fatty acid composition are unclear, these mayreflect a tissue specific shift in fatty acid distribution.Thus, the increase in spleen DHA may be a compensa-tory response to the reduction in DHA concentration inliver and heart. If in fact the RBC lipids are a significantportion of those isolated from the spleen, the circulatorysystem may provide a reservoir large enough to accountfor these changes. Regardless, this study suggests thatfurther investigations of the effect of t10, c12-CLA onthe fatty acid profiles of heart and spleen lipids in otherspecies and the mechanisms driving these changes areneeded. The changes in fatty acid composition observedin this relatively short-term study may in fact haveadverse health consequences.
Funding and disclaimer: This research was funded by theUS Department of Agriculture. References to a com-pany or product name do not imply approval orrecommendation of the product by the US Departmentof Agriculture to the exclusion of others that may besuitable.
References
[1] K. Eulitz, M.P. Yurawecz, N. Sehat, et al., Preparation
separation, and confirmation of the eight geometrical cis/trans
conjugated linoleic acid isomers 8,10- through 11,13-18:2, Lipids
34 (1999) 873–877.
[2] M.K. McGuire, M.A. McGuire, K. Ritzenthaler, T.D. Schultz,
Dietery sources and intakes of conjugated linoleic acid in humans,
in: M.P. Yurawecz, M.M. Mossoba, J.K.G. Kramer, M.W.
Pariza, G.J. Nelson (Eds.), Advances in Conjugated Linoleic
Acid, vol. 1, AOCS Press, Champaign, IL, 1999, pp. 369–376.
[3] Y. Li, B.A. Watkins, Conjugated linoleic acids alter bone fatty
acid composition and reduce ex vivo prostaglandin E2 biosynth-
esis in rats fed n-6 or n-3 fatty acids, Lipids 33 (1998) 417–425.
[4] M.A. Belury, A. Kempa-Steczko, Conjugated linoleic acid
modulates hepatic lipid composition in mice, Lipids 32 (1997)
199–204.
[5] K.M. Hargrave, B.J. Meyer, C. Li, M.J. Azain, C.A. Baile, J.L.
Miner, Influence of dietary conjugated linoleic acid and fat source
on body fat and apoptosis in mice, Obes. Res. 12 (2004) 1435–
1444.
[6] E.A. de Deckere, J.M. van Amelsvoort, G.P. McNeill, P. Jones,
Effects of conjugated linoleic acid (CLA) isomers on lipid levels
and peroxisome proliferation in the hamster, Br. J. Nutr. 82
(1999) 309–317.
[7] R.G. Twibell, B.A. Watkins, L. Rogers, P.B. Brown, Effects of
dietary conjugated linoleic acids on hepatic and muscle lipids in
hybrid striped bass, Lipids 35 (2000) 155–161.
[8] L. Badinga, K.T. Selberg, A.C. Dinges, C.W. Corner, R.D. Miles,
Dietary conjugated linoleic acid alters hepatic lipid content and
fatty acid composition in broiler chickens, Poult. Sci. 82 (2003)
111–116.
[9] G. Cherian, T.B. Holsonbake, M.P. Goeger, R. Bildfell, Dietary
CLA alters yolk and tissue FA composition and hepatic
histopathology of laying hens, Lipids 37 (2002) 751–757.
[10] J.K. Kramer, N. Sehat, M.E. Dugan, et al., Distributions of
conjugated linoleic acid (CLA) isomers in tissue lipid classes of
pigs fed a commercial CLA mixture determined by gas
chromatography and silver ion-high-performance liquid chroma-
tography, Lipids 33 (1998) 549–558.
[11] T.G. Ramsay, C.M. Evock-Clover, N.C. Steele, M.J. Azain,
Dietary conjugated linoleic acid alters fatty acid composition of
pig skeletal muscle and fat, J. Anim. Sci. 79 (2001) 2152–2161.
[12] R.L. Thiel-Cooper, F.C. Parrish Jr., J.C. Sparks, B.R. Wiegand,
R.C. Ewan, Conjugated linoleic acid changes swine performance
and carcass composition, J. Anim. Sci. 79 (2001) 1821–1828.
[13] S. Banni, G. Carta, E. Angioni, et al., Distribution of conjugated
linoleic acid and metabolites in different lipid fractions in the rat
liver, J. Lipid. Res. 42 (2001) 1056–1061.
[14] L.H. Baumgard, E. Matitashvili, B.A. Corl, D.A. Dwyer, D.E.
Bauman, trans-10, cis-12 conjugated linoleic acid decreases
lipogenic rates and expression of genes involved in milk lipid
synthesis in dairy cows,, J. Dairy. Sci. 85 (2002) 2155–2163.
[15] J.M. Chardigny, O. Hasselwander, M. Genty, K. Kraemer, A.
Ptock, J.L. Sebedio, Effect of conjugated FA on feed intake, body
composition, and liver FA in mice, Lipids 38 (2003) 895–902.
[16] D.S. Kelley, G.L. Bartolini, J.M. Warren, V.A. Simon, B.E.
Mackey, K.L. Erickson, Contrasting effects of t10,c12- and
c9,t11-conjugated linoleic acid isomers on the fatty acid profiles of
mouse liver lipids, Lipids 39 (2004) 135–141.
[17] J.J. Loor, X. Lin, J.H. Herbein, Effects of dietary cis 9, trans 11-
18:2, trans 10, cis 12-18:2, or vaccenic acid (trans 11-18:1) during
lactation on body composition, tissue fatty acid profiles, and litter
growth in mice, Br. J. Nutr. 90 (2003) 1039–1048.
[18] J.L. Sebedio, E. Angioni, J.M. Chardigny, S. Gregoire, P.
Juaneda, O. Berdeaux, The effect of conjugated linoleic acid
isomers on fatty acid profiles of liver and adipose tissues and their
conversion to isomers of 16:2 and 18:3 conjugated fatty acids in
rats, Lipids 36 (2001) 575–582.
[19] D.S. Kelley, J.M. Warren, V.A. Simon, G. Bartolini, B.E.
Mackey, K.L. Erickson, Similar effects of c9,t11-CLA and
t10,c12-CLA on immune cell functions in mice, Lipids 37 (2002)
725–728.
[20] J.M. Warren, V.A. Simon, G. Bartolini, K.L. Erickson, B.E.
Mackey, D.S. Kelley, Trans-10,cis-12 CLA increases liver and

ARTICLE IN PRESSD.S. Kelley et al. / Prostaglandins, Leukotrienes and Essential Fatty Acids 74 (2006) 331–338338
decreases adipose tissue lipids in mice: possible roles of specific
lipid metabolism genes, Lipids 38 (2003) 497–504.
[21] K.M. Hargrave, C. Li, B.J. Meyer, et al., Adipose depletion and
apoptosis induced by trans-10, cis-12 conjugated linoleic acid in
mice, Obes. Res. 10 (2002) 1284–1290.
[22] P. Degrace, L. Demizieux, J. Gresti, J.M. Chardigny, J.L.
Sebedio, P. Clouet, Hepatic steatosis is not due to impaired fatty
acid oxidation capacities in C57BL/6J mice fed the conjugated
trans-10,cis-12-isomer of linoleic acid, J. Nutr. 134 (2004)
861–867.
[23] D.S. Kelley, G.J. Nelson, J.E. Love, et al., Dietary alpha-linolenic
acid alters tissue fatty acid composition, but not blood lipids,
lipoproteins or coagulation status in humans, Lipids 28 (1993)
533–537.
[24] R.C. Lettell, W.W. Stroup, R.J. Freund, SAS for Linear Models,
fouth ed, SAS Institute Inc., Cary, NC, 2002.
[25] G.C. Burdge, P.R. Derrick, J.J. Russell, et al., Incorporation of
cis-9,trans-11 or trans-10,cis-12 conjugated linoleic acid into
human erythrocytes in vivo, Nutr. Res. 25 (2005) 13–19.
[26] A. Berger, J.B. German, Phospholipid fatty acid composition of
various mouse tissues after feeding alpha-linolenate (18:3n-3) or
eicosatrienoate (20:3n-3), Lipids 25 (1990) 473–480.
[27] A. Berger, M.E. Gershwin, J.B. German, Effects of various
dietary fats on cardiolipin acyl composition during ontogeny of
mice, Lipids 27 (1992) 605–612.
[28] J.M. Cao, J.P. Blond, P. Juaneda, G. Durand, J. Bezard, Effect of
low levels of dietary fish oil on fatty acid desaturation and tissue
fatty acids in obese and lean rats, Lipids 30 (1995) 825–832.
[29] C.E. Hoy, G. Holmer, Influence of dietary linoleic acid and trans
fatty acids on the fatty acid profile of cardiolipins in rats, Lipids
25 (1990) 455–459.
[30] P.J. Jones, B.R. Toy, M.C. Cha, Differential fatty acid accretion
in heart, liver and adipose tissues of rats fed beef tallow, fish oil,
olive oil and safflower oils at three levels of energy intake, J. Nutr.
125 (1995) 1175–1182.
[31] S. Kew, E.S. Gibbons, F. Thies, G.P. McNeill, P.T. Quinlan, P.C.
Calder, The effect of feeding structured triacylglycerols enriched
in eicosapentaenoic or docosahexaenoic acids on murine spleno-
cyte fatty acid composition and leucocyte phagocytosis, Br.
J. Nutr. 90 (2003) 1071–1080.
[32] J.B. Lefkowith, V. Flippo, H. Sprecher, P. Needleman, Para-
doxical conservation of cardiac and renal arachidonate content in
essential fatty acid deficiency, J. Biol. Chem. 260 (1985) 15736–
15744.
[33] F. Marangoni, C. Mosconi, G. Galella, C. Galli, Increments of
dietary linoleate raise liver arachidonate, but markedly reduce
heart n-6 and n-3 fatty acids in the rat, Lipids 27 (1992) 624–628.
[34] S.M. Watkins, T.Y. Lin, R.M. Davis, et al., Unique phospholipid
metabolism in mouse heart in response to dietary docosahex-
aenoic or alpha-linolenic acids, Lipids 36 (2001) 247–254.