Improving the Diets of Children: Understanding the Decision ...
221
Improving the Diets of Children: Understanding the Decision-Making of Parents, Children, and Food Manufacturers by Shannon Allen A thesis submitted in partial fulfillment of the requirements for the degree of Doctor of Philosophy In AGRICULTURAL AND RESOURCE ECONOMICS Department of Resource Economics and Environmental Sociology University of Alberta © Shannon Allen, 2019
-
Upload
khangminh22 -
Category
Documents
-
view
0 -
download
0
Transcript of Improving the Diets of Children: Understanding the Decision ...

Improving the Diets of Children:
Understanding the Decision-Making of Parents, Children, and Food
Manufacturers
by
Shannon Allen
A thesis submitted in partial fulfillment of the requirements for the degree of
Doctor of Philosophy
In
AGRICULTURAL AND RESOURCE ECONOMICS
Department of Resource Economics and Environmental Sociology
University of Alberta
© Shannon Allen, 2019
ii
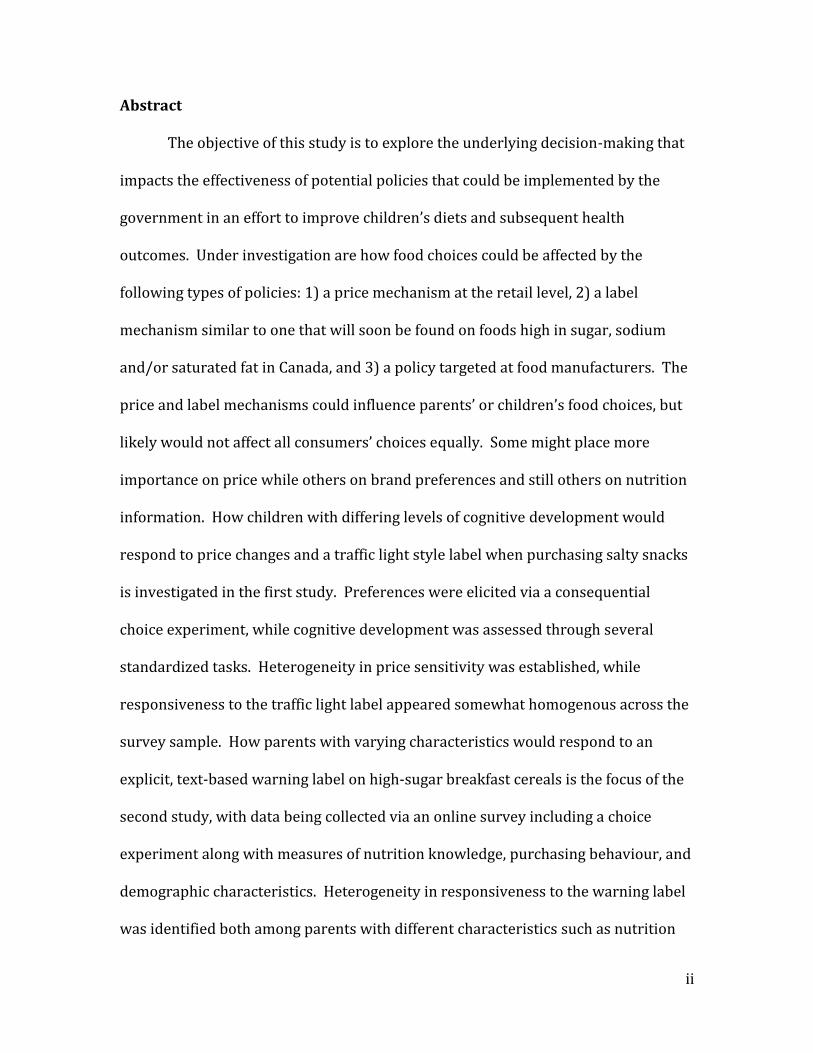
Abstract
The objective of this study is to explore the underlying decision-making that
impacts the effectiveness of potential policies that could be implemented by the
government in an effort to improve children’s diets and subsequent health
outcomes. Under investigation are how food choices could be affected by the
following types of policies: 1) a price mechanism at the retail level, 2) a label
mechanism similar to one that will soon be found on foods high in sugar, sodium
and/or saturated fat in Canada, and 3) a policy targeted at food manufacturers. The
price and label mechanisms could influence parents’ or children’s food choices, but
likely would not affect all consumers’ choices equally. Some might place more
importance on price while others on brand preferences and still others on nutrition
information. How children with differing levels of cognitive development would
respond to price changes and a traffic light style label when purchasing salty snacks
is investigated in the first study. Preferences were elicited via a consequential
choice experiment, while cognitive development was assessed through several
standardized tasks. Heterogeneity in price sensitivity was established, while
responsiveness to the traffic light label appeared somewhat homogenous across the
survey sample. How parents with varying characteristics would respond to an
explicit, text-based warning label on high-sugar breakfast cereals is the focus of the
second study, with data being collected via an online survey including a choice
experiment along with measures of nutrition knowledge, purchasing behaviour, and
demographic characteristics. Heterogeneity in responsiveness to the warning label
was identified both among parents with different characteristics such as nutrition
iii
knowledge as well as between brands. In terms of food manufacturers, improving
our understanding of their strategic behavior will help to identify what types of
policy measures targeted at them could be effective in improving the nutritional
quality of their products. The last study in this dissertation examines how breakfast
cereal manufacturers choose a combination of price, advertising, and nutritional
quality for the products in their portfolio and how these decisions correspond to
input prices and consumer awareness of nutrition. There is evidence that firms
react both to trends in public nutrition awareness and to each other’s actions, and
that overall their product portfolios have been improving in terms of nutritional
quality over the past two decades.
iv
Preface
This dissertation is an original work by Shannon Allen, while the research
projects discussed within were collaborative efforts.
Chapter 2 of this dissertation was part of a larger research project being
conducted with Sean Cash at Tufts University, Vic Adamowicz at the University of
Alberta, and Anna McAlister at Endicott College. This project received research
ethics approval from the University of Alberta Research Ethics Board, Project Name
“Children’s Response to Information on Foods: Alberta Study”, Pro00034195, Oct.
31, 2012.
Chapter 3 of this dissertation was a collaboration with Ellen Goddard at the
University of Alberta with findings presented by myself at the Canadian Agricultural
Economics Society’s annual conference in June 2017 and at the International
Conference of Agricultural Economists in July 2018. This project received research
ethics approval from the University of Alberta Research Ethics Board, Project Name
“Assessing the effectiveness of warning labels on food for children”, Pro00067440,
Sept. 26, 2016.

v
Acknowledgments
First and foremost, I would like to thank my supervisor, Professor Ellen
Goddard for all the time and effort she invested in my studies and academic
development as well as for the financial support she secured that allowed me to
pursue a PhD and travel to conferences to present my work. I would also like to
thank my co-supervisors, Professors Vic Adamowicz and Sean Cash, for all their
valuable teachings and research insight. Thanks as well to all the professors from
whom I took courses throughout my graduate studies.
For financial support, I would like to thank the Co-operative Program in
Agricultural Marketing and Business, the Consumer and Market Demand Network,
the Public Policy Oriented Consumer Interest Research Group, and from the Faculty
of Agricultural, Life, and Environmental Sciences at the University of Alberta, the
Support for the Advancement of Scholarship fund and the Food and Health
Innovation Initiative.
Finally, I would like to thank my family for their love and support, without
whom this endeavour would not have been possible!

vi
Table of Contents
Chapter 1: Introduction ........................................................................................................................ 1
1.1 Background ........................................................................................................................................ 1
1.2 Factors influencing children’s diets ......................................................................................... 4
1.2.1 Price .............................................................................................................................................. 6
1.2.2 Nutrition and product label................................................................................................. 8
1.2.3 Advertising.............................................................................................................................. 10
1.2.4 Regulation of Food Manufacturers ................................................................................ 12
1.2.5 Limiting access to junk food ............................................................................................. 13
1.3 Problem statement ....................................................................................................................... 13
1.4 Study objectives ............................................................................................................................ 15
1.5 Description of papers .................................................................................................................. 15
1.6 Contribution of study .................................................................................................................. 17
Chapter 2: Children’s response to price and label interventions ..................................... 18
2.1 Introduction .................................................................................................................................... 18
2.2 Literature Review ......................................................................................................................... 19
2.2.1 Taxes ......................................................................................................................................... 19
2.2.2 Graphic labeling mechanisms .......................................................................................... 21
2.2.3 Children as consumers ....................................................................................................... 23
2.2.4 Children’s ability levels ...................................................................................................... 24
2.3 Objective and Research Question ........................................................................................... 24
2.4 Methods ........................................................................................................................................... 25
2.4.1 Theoretical Model ................................................................................................................ 25
2.4.2 Data collection ....................................................................................................................... 26
Table 2.2: Descriptive statistics of sample ............................................................................ 29
2.5 Analysis ............................................................................................................................................ 30
2.5.1 Estimations ............................................................................................................................. 31
2.5.2 WTP calculations .................................................................................................................. 33
2.5.3 Simulation ............................................................................................................................... 35
2.6 Discussion ........................................................................................................................................ 36

vii
Chapter 3: Parental response to label interventions ............................................................. 38
3.1 Introduction .................................................................................................................................... 38
3.2 Literature review .......................................................................................................................... 39
3.2.1.What makes an effective warning label? ..................................................................... 39
3.2.2 Warning labels on products intended for adults ..................................................... 40
3.2.3 Warning labels on products intended for children ................................................. 41
3.2.4 Food packaging ..................................................................................................................... 42
3.2.5 Previous studies on effectiveness of warning labels .............................................. 43
3.2.6 Choice Experiment Design ................................................................................................ 45
3.3 Objectives and Research Question ......................................................................................... 48
3.4 Data .................................................................................................................................................... 49
3.4.1 Questionnaire Design ......................................................................................................... 50
3.4.2 Choice Experiment Design ................................................................................................ 51
3.4.3 Data collection ....................................................................................................................... 56
3.4.4 Descriptive Statistics .......................................................................................................... 58
3.4.4.1 Demographic characteristics ................................................................................... 59
3.4.4.2 Nutrition knowledge................................................................................................... 60
3.4.4.3 Purchasing behaviour ................................................................................................ 63
3.5 Analysis and Results .................................................................................................................... 65
3.5.1 Empirical Model .................................................................................................................... 65
3.5.2 Estimations ............................................................................................................................. 68
3.5.3 WTP Calculations ................................................................................................................. 75
3.5.4 Simulations ............................................................................................................................. 78
3.6 Discussion ........................................................................................................................................ 80
Chapter 4: Nutritional trends in the breakfast cereal industry ........................................ 85
4.1 Introduction .................................................................................................................................... 85
4.2 Literature Review ......................................................................................................................... 87
4.2.1 Impacts of public nutrition awareness on industry ................................................ 87
4.2.2 Firm Behaviour ..................................................................................................................... 89
4.2.2.1 Quality .............................................................................................................................. 90
4.2.2.2 Price .................................................................................................................................. 93

viii
4.2.2.3 Advertising ..................................................................................................................... 94
4.2.2.4 Product Line Extensions ........................................................................................... 96
4.2.3 Breakfast cereal industry .................................................................................................. 97
4.3 Objectives and Research Question ....................................................................................... 100
4.4 Data .................................................................................................................................................. 101
4.5 Analysis and Results .................................................................................................................. 105
4.5.1 Advertising spending ........................................................................................................ 105
4.5.2 Retail Prices .......................................................................................................................... 107
4.5.3 Nutrient Trends .................................................................................................................. 109
4.5.4 Long running brands ........................................................................................................ 113
4.5.5 Correlations between nutrition and other factors ................................................ 115
4.5.6 Fixed Effects Model............................................................................................................ 117
4.6 Discussion ...................................................................................................................................... 121
Chapter 5: Synopsis of dissertation ............................................................................................ 126
5.1 Summary of background and objectives ........................................................................... 126
5.2 Children’s choices ...................................................................................................................... 128
5.3 Parents’ choices ........................................................................................................................... 130
5.4 Food manufacturer behaviour............................................................................................... 132
5.5 Implications .................................................................................................................................. 134
5.6 Limitations of study ................................................................................................................... 138
5.7 Future research ........................................................................................................................... 139
References ............................................................................................................................................ 141
Appendix 2A - Questionnaire ........................................................................................................ 165
Appendix 2B – Information and Consent Forms ................................................................... 166
Appendix 3A – Parent Questionnaire ......................................................................................... 171
Appendix 3B – Children’s Questionnaire .................................................................................. 188
Appendix 3C – Experimental Design .......................................................................................... 194
Appendix 3D – Tests and RPL estimations .............................................................................. 198
Appendix 4A – Summary of Breakfast Cereals ....................................................................... 203
ix
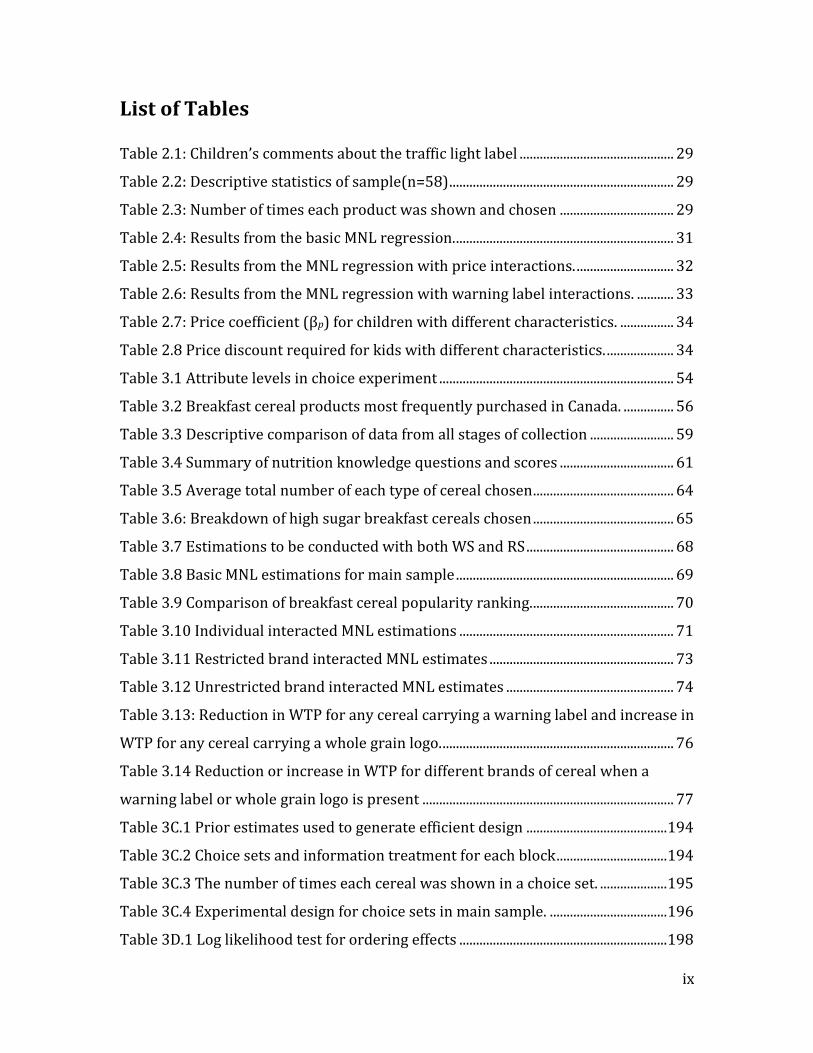
List of Tables
Table 2.1: Children’s comments about the traffic light label .............................................. 29
Table 2.2: Descriptive statistics of sample(n=58) ................................................................... 29
Table 2.3: Number of times each product was shown and chosen .................................. 29
Table 2.4: Results from the basic MNL regression. ................................................................. 31
Table 2.5: Results from the MNL regression with price interactions. ............................. 32
Table 2.6: Results from the MNL regression with warning label interactions. ........... 33
Table 2.7: Price coefficient (βp) for children with different characteristics. ................ 34
Table 2.8 Price discount required for kids with different characteristics. .................... 34
Table 3.1 Attribute levels in choice experiment ...................................................................... 54
Table 3.2 Breakfast cereal products most frequently purchased in Canada. ............... 56
Table 3.3 Descriptive comparison of data from all stages of collection ......................... 59
Table 3.4 Summary of nutrition knowledge questions and scores .................................. 61
Table 3.5 Average total number of each type of cereal chosen .......................................... 64
Table 3.6: Breakdown of high sugar breakfast cereals chosen .......................................... 65
Table 3.7 Estimations to be conducted with both WS and RS ............................................ 68
Table 3.8 Basic MNL estimations for main sample ................................................................. 69
Table 3.9 Comparison of breakfast cereal popularity ranking. .......................................... 70
Table 3.10 Individual interacted MNL estimations ................................................................ 71
Table 3.11 Restricted brand interacted MNL estimates ....................................................... 73
Table 3.12 Unrestricted brand interacted MNL estimates .................................................. 74
Table 3.13: Reduction in WTP for any cereal carrying a warning label and increase in
WTP for any cereal carrying a whole grain logo. ..................................................................... 76
Table 3.14 Reduction or increase in WTP for different brands of cereal when a
warning label or whole grain logo is present ........................................................................... 77
Table 3C.1 Prior estimates used to generate efficient design .......................................... 194
Table 3C.2 Choice sets and information treatment for each block ................................. 194
Table 3C.3 The number of times each cereal was shown in a choice set. .................... 195
Table 3C.4 Experimental design for choice sets in main sample. ................................... 196
Table 3D.1 Log likelihood test for ordering effects .............................................................. 198
x
Table 3D.2 Basic RPL estimates ................................................................................................... 198
Table 3D.3 Log likelihood test for inclusion of interaction variables ............................ 199
Table 3D.4 Individual specific characteristic / label attribute interacted RPL ......... 199
Table 3D.5 Log likelihood test for brand interaction model. ........................................... 200
Table 3D.6 Brand / label attribute interacted RPL estimates .......................................... 201
Table 4.1 Data sources for breakfast cereal industry analysis ......................................... 101
Table 4.2: Summary statistics of data collected from Mintel database ......................... 102
Table 4.3 Correlations between RRR and other factors for General Mills ................... 117
Table 4.4 Correlations between RRR and other factors for Kellogg’s ........................... 117
Table 4.4 Fixed effects model coefficients ................................................................................ 119
Table 4.5 Fixed effects model elasticities ................................................................................. 120
Table 4A.1 Summary of all products included in Chapter 4 analysis. ........................... 203
xi
List of Figures
Figure 1.1 Conceptual framework identifying children’s sources of food ........................ 6
Figure 2.1 Traffic Light label mechanism used in choice experiment ............................. 29
Figure 2.2 The number of children who reported purchasing food independently .. 31
Figure 2.3 Purchase probability simulation .............................................................................. 35
Figure 3.1 Example of a choice set used in the purchase experiment ............................. 53
Figure 3.2 Enlarged image of the warning label used in purchase experiment .......... 53
Figure 3.3 Enlarged image of whole grain stamp used in purchase experiment ........ 53
Figure 3.4 Information given to those receiving the information treatment ............... 54
Figure 3.5 Purchase probability simulation for higher and lower sugar products .... 79
Figure 3.6 Purchase probability simulation for individual brands .................................. 80
Figure 4.1 Commodity prices for breakfast cereal inputs .................................................. 103
Figure 4.2 Coverage of specific nutrients in Canadian print media ............................... 104
Figure 4.3: Advertising spending for top 4 breakfast cereal manufacturers .............. 106
Figure 4.4 Kellogg’s advertising spending .............................................................................. 107
Figure 4.5 General Mills advertising spending ....................................................................... 107
Figure 4.6 Retail prices for high, medium, and low RRR Kellogg’s products.............. 108
Figure 4.7 Retail prices for high, medium, and low RRR General Mills products ..... 109
Figure 4.8 Average sodium content ............................................................................................ 110
Figure 4.9 Average sugar content ................................................................................................ 111
Figure 4.10 Average fibre content ............................................................................................... 111
Figure 4.11 Mean, minimum, and maximum RRR ................................................................. 112
Figure 4.12 Average and weighted RRR ................................................................................... 113

1
Chapter 1: Introduction
1.1 Background
An individual’s diet has long-term health implications as both over and under-
consumption of various nutrients can lead to an assortment of health problems. In
developing nations, health issues are more commonly related to the under-
consumption of nutrients; for example, under-consumption of vitamin A can lead to
immune system deficiencies and blindness (Stephensen 2001; Sommer 2001),
inadequate protein can result in Kwashiorkor (Wu et al 2004), and low iron intake
causes anemia and impaired cognitive development (Grantham-McGregor and Ani
2001).
Although micronutrient deficiencies are still present in some population
segments of developed countries, more broadly it is the overconsumption of
nutrients, specifically sugar, sodium, and saturated fat that is resulting in the most
negative health consequences. High sugar consumption is a major factor in
developing diabetes as well as hypertension and kidney disease (Johnson et al
2007) and has also been linked to increased risk of cardiovascular disease (Yang et
al 2014). Overconsumption of sodium and saturated fat lead to increased risk of
cardiovascular disease and stroke (Strazzullo et al 2009; Astrup et al 2010). In
addition to these problems, poor dietary choices in general are contributing to the
obesity epidemic and a variety of other chronic health issues such as cancer,
arthritis, osteoporosis, etc.
The relationship between diet and health is complex, and because it can be
decades before the negative impacts of dietary choices are felt by an individual, it
may be difficult for people to make what are lifetime utility maximizing choices.
Most people, although they aren’t aware of it, have myopic discount rates meaning
that they value current utility of present consumption, be it of food or other goods,
proportionately more than that in the future. As such, many people eat what they
enjoy now, putting off their healthy eating plan till the future, and the result is poor
health outcomes, be they 5, 10, or 50 years down the road (Wing et al 2001). In
addition, most developed countries have some form of health care system or
2
insurance, meaning that the costs of poor dietary choices and their resulting health
problems are borne in part by society, not solely by the individual. Therefore, it is
not only in a person’s best interest to eat a healthy diet, it is also in society’s best
interest for them to do so. Unfortunately due to the high palatability of less healthy
foods and their relative cheapness compared to healthier choices (Neumark-
Sztainer et al 1999; Veling et al 2013; Drewnowski and Darmon 2005; Jones et al
2014), combined with the temporal separation of consumption and consequence,
incentives for people to eat healthy are too low to have an economically efficient
outcome (Brunello et al 2009; Sassi et al 2009).
Some argue that this inefficiency should be addressed through public policy.
Policies designed to do this could take many forms such as financial mechanisms,
food manufacturer regulations, or consumer education. Some policies, however, are
criticized as being paternalistic if the government restricts the options available to
consumers despite being in the best long term interests of the consumer. For
example, if it became illegal to put trans-fats in foods (which are known to
contribute to cardiovascular disease), some people may complain that their weekly
doughnut doesn’t taste as good and that they have the right to eat products with
trans-fats if they so choose. The virtual elimination of trans-fats in foods is a
consumer protectionist policy which has been effective in reducing the risk of
coronary heart disease in Denmark (Stender et al 2006). A similar ban on producing
foods containing trans fats in Canada was recently implemented in September 2018
(Health Canada 2018).
The debate surrounding consumer sovereignty vs. consumer protection is not
a new one. Choice is the core value of consumerism (Gabriel and Lang 2006), so to
many parties limiting choice would be detrimental to consumer well being, however
Gabriel and Lang (2006) point out that without enough information the freedom to
choose is an illusion. In economic terms, most views of consumption assume that
utility is non-decreasing in choice. Consumers were once seen as naïve victims of
mass marketing in need of government protection, but are now seen as active and
knowledgeable (Klompenhouwer and van den Belt 2003). Therefore, proponents of
consumer sovereignty would argue that by giving consumers as much information
3
as possible, they will make utility maximizing decisions. As such, regulations
pertaining to food labels are intended to assist the consumer make informed choices
through information provision (Klompenhouwer and van den Belt 2003). It should
be pointed out, however, that some studies have found that people are
overwhelmed when facing too many options and can often resort to heuristics,
meaning that they don’t choose the utility maximizing option (Scheibehenne et al
2010). Proponents of consumer protection would argue that by eliminating
unhealthy or unsafe choices, they are protecting the consumer’s well being and
making it less likely that the consumer ‘chooses wrong’ or in other words, does not
choose the utility maximizing option. European Union legislation pertaining to food
product labels states that “the prime consideration for any rules on the labeling of
foodstuffs should be the need to inform and protect the consumer” (EC 2000 recital
6). As pointed out by Klompenhouwer and van den Belt (2003), the objectives of
informing and protecting can easily be conflicting. Informing consumers promotes
their sovereignty while protecting them can quickly degenerate into paternalism.
When it comes to public policy, however, not all population groups are treated
equally. Of particular interest in this research are children, and there are far more
policies protecting children than there are adults as they are not expected to be
capable of protecting themselves. These policies include everything from specific
standards to which toys must be made (for example, the eye of a plush toy must
withstand a 9kg load being suspended from it for 5 minutes without detaching) and
putting warning labels about fire resistance and proper fitting in sleepwear up to
stringent car seat requirements and not selling alcohol or tobacco to minors.
Despite this level of child protection, there are no federal policies pertaining to
protecting children from poor dietary choices, although the province of Quebec has
restricted advertising to children since 1980 (Dhar and Bayliss 2011). Legislation
restricting the marketing of unhealthy foods to children, is however, currently being
debated and could come into effect in the next year if passed (Weeks 2018). There
is increasing evidence that diet-related health problems once assumed to be
exclusive to adults such as high blood pressure, type 2 diabetes, sleep breathing
disorders, polycystic ovary syndrome, artery hardening, and nonalcoholic fatty liver
4
disease are being seen more frequently in children (Daniels 2006, Han et al 2010,
Franks et al 2010, Mayer-Davis et al 2017). In addition, obese children are more
likely to become obese adults and experience obesity-associated health issues
(Magarey et al 2003, Patrick and Nicklas 2005). Given that children are consuming
unhealthy foods and suffering the negative health consequences, the arguments for
consumer sovereignty lose out to those of consumer protection when discussing
children’s food choices. Children should be protected from poor diets just as they
are protected from tobacco use, unsafe toys, and inadequate seatbelts. Also
important to consider is that dietary habits and preferences developed in childhood
can persist into adulthood, so improving children’s diets will likely improve their
lifetime dietary choices. Finkelstein et al (2004 pg. 71) argue that “interventions
targeted at youth are relatively easy to justify on economic grounds due to the
additional protections that this group requires”. The focus of this research will be to
explore the potential policy tools that could be mandated by the government to
improve children’s diets and subsequently their long-term health and to determine
what would be most effective and equitable.
1.2 Factors influencing children’s diets
An individual’s dietary choices are influenced by the environment in which
they are making choices, including culture, food prices, availability of food products,
advertising, and many other things, subject to their personal preferences. When it
comes to children, food choices are made by a combination of parents, institutions
(ie schools or daycares), and children themselves. Parents typically purchase the
food that children have available to them at home and are generally preparing meals
for the children. Despite this, children do have influence on the foods their parents
purchase and prepare, both in the form of ‘pester power’ (McNeal and Kellogg 2000)
and more simply in what they will and won’t eat. We will assume that parents are
utility maximizing agents with a budget constraint and that they derive some utility
from both their child’s happiness and expectation of long-term health.
5
There is also the possibility that children can act as consumers independently
from their parents, purchasing food when away from home from stores, vending
machines, etc. Institutions, primarily schools and daycares, also shape a child’s diet
in terms of providing meals, the options they make available at the cafeteria, and
products for sale in vending machines. Several studies have found that the school
food environment can affect children’s food choices because they consume a large
proportion of their daily calories there (Fox et al 2001, Burghardt et al 1993,
Gleason and Suitor 2001, Oostindjer et al 2017, Leonard 2017). We will assume that
children maximize utility subject to a budget constraint and that they derive utility
from current consumption but may or may not get utility from expected health in
future time periods as it is difficult for children to understand how current choices
will affect them in the future (Komlos et al 2004; Smith et al 2005).
In addition, food manufacturers also play a role in children’s diets through the
formulation of their products, as well as how they price, label, and advertise them.
We will assume that food manufacturers are profit-maximizing agents but that their
profits are affected not only by prices, input costs, and quantities sold, but also by
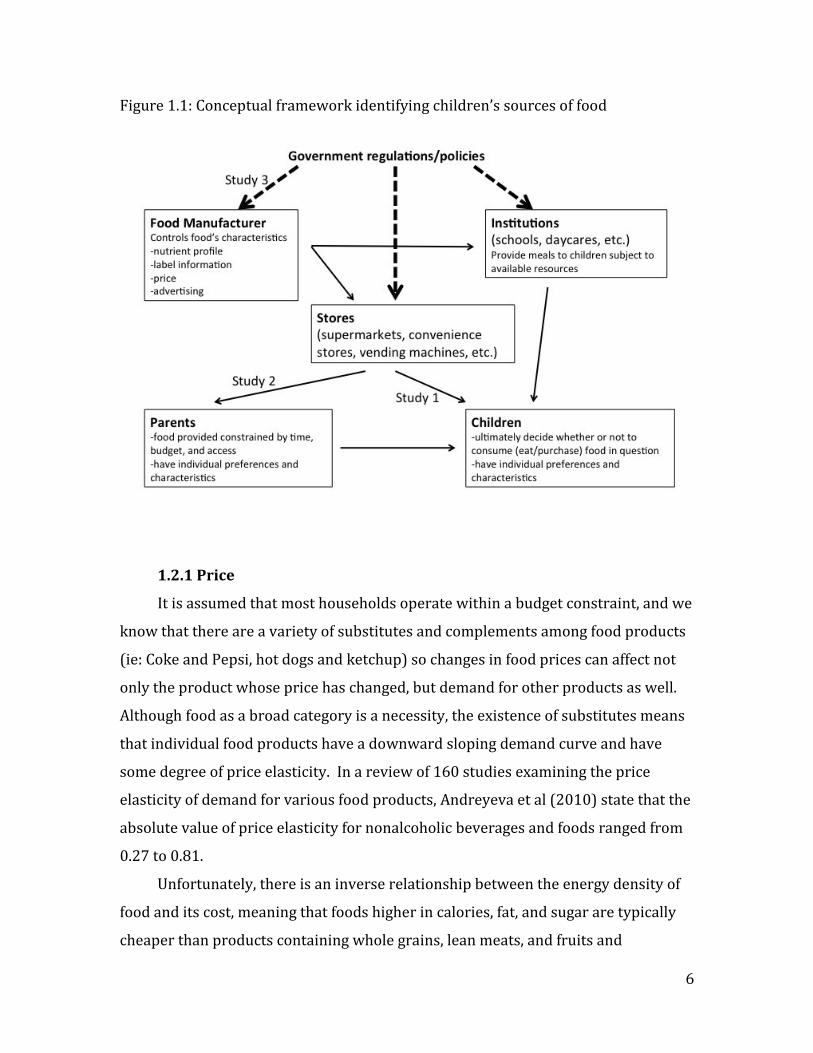
the quality of their product and advertising strategy. Figure 2 represents the
avenues through which children obtain food and identifies which of these avenues
the different studies in this dissertation focus on. Policies can be used to modify
various elements within the food environment that affect children’s decisions.
These factors along with policy instruments that could address them will now be
discussed.
6
Figure 1.1: Conceptual framework identifying children’s sources of food
1.2.1 Price
It is assumed that most households operate within a budget constraint, and we
know that there are a variety of substitutes and complements among food products
(ie: Coke and Pepsi, hot dogs and ketchup) so changes in food prices can affect not
only the product whose price has changed, but demand for other products as well.
Although food as a broad category is a necessity, the existence of substitutes means
that individual food products have a downward sloping demand curve and have
some degree of price elasticity. In a review of 160 studies examining the price
elasticity of demand for various food products, Andreyeva et al (2010) state that the
absolute value of price elasticity for nonalcoholic beverages and foods ranged from
0.27 to 0.81.
Unfortunately, there is an inverse relationship between the energy density of
food and its cost, meaning that foods higher in calories, fat, and sugar are typically
cheaper than products containing whole grains, lean meats, and fruits and
7
vegetables (Darmon and Drewnowski 2015). Cash and Lacanilao (2007) found that
in Canada, the price per calorie is the lowest in the fats/sugar/oils category,
followed by grains and then processed sweets, while fish and poultry were the most
expensive followed by vegetables. Given this relationship between price and
demand, it follows that people are more likely to purchase (or will purchase more
of) cheaper goods, so the relative prices of healthy vs. unhealthy foods are likely to
play a role in the quality of a child’s diet. It should be pointed out, however, that
different food categories, while all being price inelastic, have different levels of
elasticity (Andreyeva et al 2010), meaning that the same price change in two
different types of products could result in different changes in quantities consumed.
For example, if granola bars are more price elastic than breakfast cereals, and the
same tax is imposed on both products that are high in sugar, consumption of high-
sugar granola bars will decrease more than for high-sugar cereals, and some
category switching could result. As such, price elasticities, not only absolute prices,
should be considered when designing price interventions to improve diets.
Financial considerations are also key for institutions providing food. Many
schools participate in school breakfast and lunch programs which must adhere to a
given budget and nutrition standards. As such, prices greatly affect what foods they
can provide and how many man-hours can be allotted to preparing them, often
steering these meals in a less desirable direction nutritionally (Belot and James
2011; Story et al 2009). In addition, many schools also have food for sale a la carte
or through vending machines which do not need to meet any standards, are
typically of low nutritional value, and provide valuable income for schools
(Kaphingst and French 2006; Cisse-Egbuonye et al 2016; Suarez-Balcazar et al
2007). Despite their best intentions, the people responsible have limited resources
with which to operate schools so it may be difficult to give up the additional income
generated from the sale of unhealthy food.
Tax policy has been proposed as a possible instrument for reducing the
incidence of diet-related non-communicable diseases. A “fat tax” may discourage
people from buying energy dense, nutrient poor products by raising their price
relative to healthier substitutes (Brownell and Frieden 2009, Jacobson and Brownell
8
2000, Marshall 2000). Evidence from fat tax studies focusing on adults implies that
using taxes to discourage consumption of less nutritious foods will have limited
success (e.g., Faulkner et al 2011, Cash and Lacanilao 2007, Lacanilao and Cash
2011, Kuchler et al 2005, Powell and Chaloupka 2009, Schroeter et al 2008,
Wansink et al 2014, Bodker et al 2015). In many situations, the tax only makes the
unhealthy product relatively more expensive; in absolute terms it is still often
cheaper than the healthy product. One of the drawbacks of a fat tax is that it would
place a disproportionately high burden on lower income families as they spend a
greater proportion of their disposable income on food (Cash et al 2005, Madden
2015). Also, there is no evidence to date on how children would react to a fat tax
(ie: whether they are price sensitive) as they are generally not regarded as
autonomous consumers.
1.2.2 Nutrition and product label
Some parents may make choices based on nutrient profile of products, by the
nutrition level inferred by information provided on the label (ie: a healthy choice
symbol), or based on their knowledge about nutrition. Nutrition information can be
presented on the back of the food package via the nutrition facts panel (mandatory)
or on the front of the package via a health claim (subject to the health claim
regulations imposed by Health Canada). Although they are not specific to nutrient
content, third party logos can infer a product’s healthfulness while a warning or
recommendation can communicate that a product may be less healthy. Health
Canada is currently undergoing the process of implementing warning labels on
foods high in sugar, sodium, and/or saturated fat, but the exact foods or criteria
have yet to be announced. This warning label could not only impact the foods that
consumers choose to buy, but also manufacturer behaviour. When mandatory
disclosure of trans fats became regulated in the US in 2003, many packaged foods
were reformulated to eliminate trans fats to maintain consumer demand and
maintain product reputation (Unnevehr and Jagmanaite 2008). A study by Tandon
et al (2011) found that when menus were labeled with calorie contents, parents
chose meals for themselves that had fewer calories but did not purchase lower
9
calorie meals for their children. Harris et al (2011) found that nutrition related
claims on breakfast cereal packaging influenced parents’ perceptions of the
healthfulness of a product (often erroneously) as well as their willingness to
purchase it. Fenko et al (2018) found that consumers paid more attention to a traffic
light label than a healthy choice logo but that visual attention to these attributes was
a poor predictor of a healthy choice.
Clark et al (2007) note that parents with higher levels of nutrition knowledge
feed their children healthier diets. A study by Variyam (2001) found that
prevalence of overweight and obesity in children is lower among families where
parents have higher nutrition knowledge. Children’s nutrition knowledge and fruit
intake has also been shown to be positively related to maternal nutrition knowledge
(Zarnowiecki et al 2011).
Institutions such as schools and daycares may have policies guiding nutritional
aspects of the food they provide. For example, daycares in Alberta must provide 2-3
year olds with at least 4 servings of fruits and vegetables per day (Healthy Alberta
2012). Typically they would purchase products wholesale from a catalogue, so
labeling would not be a factor in this decision making process. Food retailers, such
as grocery stores, convenience stores, and food service establishments do not have
to adhere to any particular nutritional guidelines in the products they sell.
There is no evidence to date whether children (among those who are even old
enough to comprehend nutrition labels) care about the information contained on a
food label. One aspect of the proposed research will be to assess how children and
parents respond to label mechanisms indicating an unhealthy product.
Various types of warning labels on food products have been proposed as a tool
to improve the public’s diet. Several studies have evaluated the effectiveness of the
traffic-light style label in which the healthiest foods have a green light, the least
healthy have a red light, and those in between have a yellow light. Sacks et al (2011)
and Kelly et al (2009) found that consumers were more likely to choose healthier
products when the traffic light label was included on the food package. Balcombe
and Fraser (2010) found that consumers avoided products with a red light.
Thorndike et al (2014) found that in a hospital cafeteria setting, using traffic light
10
labels increased the sales of healthier (green label) choices. Freire et al (2017)
found that children and adolescents would use traffic light labels infrequently in
purchasing decisions. With regards to warning labels more generally, Boncinelli et al
(2017) found little effect among college students, while Bollard et al (2016) found
that New Zealand youth would be responsive.
Some governments have implemented explicit warning labels on some food
products. Most countries in the EU require a warning label on foods containing
synthetic dyes stating “may have an adverse effect on activity and attention in
children” (Bayer 2010). Denmark was the first to implement mandatory warning
labels on energy drinks advising that they are not intended for consumption by
children or women who are pregnant or breastfeeding, and the rest of the EU
adopted the same labeling policy in 2014 (Meister 2014). Most recently, the
California senate passed a bill requiring warning labels on sugar sweetened
beverages saying “Drinking beverages with added sugar(s) contributes to obesity,
diabetes, and tooth decay” (Zuraw 2014).
Also proposed have been graphic (tobacco-style) warning labels that put
unappealing photographs directly on to food packages. This approach has not
gained much traction however, due to the fact that while tobacco is unequivocally
bad for people, the relationship between food and health is much more complex and
less healthy foods can be consumed in moderation by most people without causing
health concerns (Yach et al 2003).
Educational warning labels have also been suggested by consumer groups to
help put the consumption of junk food into a more easily understood context. An
example of this would be a statement such as “to burn the calories contained in this
product, you would need to climb 6 flights of stairs”. This type of label has received
less attention than others due to its lack of generalizability to products and/or
individuals.
1.2.3 Advertising
Food products are very heavily advertised. In the US alone, the food industry
spent about $3.8 billion on advertising in 2013, with McDonalds spending $976
11
million and Kraft Foods spending $376.2 million (Statista 2014). Globally,
advertising on food reached $516.47 billion in 2013 (Statista 2014). A 2008 report
estimated that food and beverage manufacturers spend around $2 billion annually
marketing their products to children (Kovacic and 2008). Legislation prohibiting
the advertising of unhealthy foods to children is currently under review in Canada
and could pass in the next year (Weeks 2018).
Despite the evidence that both parents and children are exposed to high levels
of food advertising, it is not clear how this advertising is affecting our diets and
subsequent levels of obesity. Several studies have found that it is predominantly
energy dense, nutrient poor food products that are being advertised (Folkvord et al
2016, Boyland and Whalen 2015, Sonntag et al 2015). In a study examining
children’s exposure to television and advertising in Australia, Dixon et al (2007)
found that increased television viewing led to higher self-reported consumption of
junk food by children. Halford et al (2004) found that increased exposure to
television adverts resulted in increased consumption of the advertised foods in
children aged 9-11 while Lobstein and Dibb (2005) found a positive association
between the amount of nutrient-poor energy-dense food advertising and the
proportion of children who were overweight. A study by Veerman et al (2009)
estimated that by decreasing the exposure of 6-12 year olds in the US to zero food
advertising, the prevalence of obesity would be decreased by approximately 2.5
percentage points.
Given that the evidence suggests some kind of link between food advertising
and children’s consumption of nutritionally-poor foods, banning the advertising of
unhealthy foods to children has been proposed. Currently in Canada, Advertising
Standards Canada has a code specific to advertising to children in an ethical and
appropriate fashion (ASC 2014), but this is a self-regulatory approach and thus is
not enforceable by the government. As mentioned, the federal government is
currently looking into banning the advertising of junk food to children in Canada.
Quebec, however, has had a ban on advertising targeting children since 1980, and
fast food consumption has been found to be significantly lower in Quebec (Dhar and
Bayliss 2011). While there are many potential explanations for the differences in
12
fast food consumption between Quebec and the rest of Canada, this link shouldn’t be
ignored.
1.2.4 Regulation of Food Manufacturers
There are various factors influencing the nutrient content of foods, such as the
availability and cost of ingredients, the firm’s objective function and marketing
strategy, perceived market demand for nutritious foods, the actions of competing
firms, and the regulatory environment in which the firm is operating.
Understanding how these components affect the nutritional profile of children’s
food products is important to know because even minor changes in them could have
significant impacts on children’s health outcomes.
From a consumer policy perspective, rather than adopting policies aimed at
influencing children or parents’ food choices, the government could choose to go
straight to the source and place mandatory nutrition standards on food produced
primarily for children. This could include placing upper limits on the amount of
sugar or sodium permitted in a typical serving of a product or a lower limit for
vitamins or fibre. For example a standard sized granola bar could be limited to
contain no more than 6 grams of sugar and at least 4 grams of fibre. The benefit of
this type of approach is that all consumers of the regulated products would be
better off nutritionally. The drawback is that it infringes upon the consumer’s
freedom of choice and could impose additional costs on firms. New York City
imposed a policy to protect consumers by requiring that restaurants eliminate the
trans-fat content of their foods by 2008 (Angell et al 2009). Argentina has recently
passed legislation to limit the allowable amount of trans-fats in foods (Rubinstein et
al 2015). A ban on trans fats in Canada and the US was just implemented in 2018
(Health Canada 2018, FDA 2018).
Some types of regulations, such as labeling regulations do not limit consumer
choice but rather provide more information to the consumer so that they can make
better choices. In Canada and the US, a regulation mandating that nutrition facts
panels on food packaging include the amount of trans-fat came into effect in 2005.
This labeling regulation resulted in the large-scale reformulation of products to
13
reduce or eliminate the trans-fat content of foods (Ratnayake et al 2008). Some
regions have mandated that restaurants include nutrition information on menus
which has resulted in a decrease in the content of sodium, saturated fat, and
calories, although the amounts still exceed recommended levels (Bruemmer et al
2012).
Policies could also be targeted at the other factors that play a role in
determining the nutritional profile of foods, such as adjusting the input prices faced
by firms or placing restrictions on advertising.
1.2.5 Limiting access to junk food
Another proposed policy to improve children’s diets is the banning of
unhealthy foods from schools, be they from cafeterias or vending machines. In 2005,
New Brunswick was the first of 6 provinces to ban junk food in Canadian schools,
the most recent being Ontario in 2011, and this ban has resulted in small but
significant declines in students’ BMI (Leonard 2017). In 2007, the state of California
implemented a policy banning the sale of junk foods (candy bars, soda, etc) from
vending machines in schools and implemented salad bars as part of lunch cafeteria
fare (Suarez-Balcazar et al 2007). A 2012 report found that since this policy had
taken effect, average daily caloric intake had decreased by 158 calories, as had the
consumption of fat and sugar (O’Connor 2012). Despite these promising results,
this type of policy has not become common in the rest of North America due in part
to concerns about the financial repercussions of such actions and partly due to the
additional manpower and knowhow it requires to substitute junk food with
perishable healthier options.
1.3 Problem statement
People’s food choices can have negative externalities on society due to the
financial burden they impose on the health care system, as well as on their own
lifetime utility in the form of long-term health issues. This makes diet-related
policies a priority for many governments. Given that children merit higher levels of
protection as consumers than adults do, policies to improve the diets of children and
14
protect them from high levels of sugar, sodium, and excess calories are being
advocated by many parties. Financial instruments, especially taxes, are the more
popular instruments due in part to some degree of empirical evidence, but also
because they do not infringe on consumer sovereignty and because they can
potentially generate revenue (Faulkner et al 2011). Label mechanisms have also
garnered support because they inform consumers rather than restricting their
choices (Swinburn and Egger 2002), and will soon be found on Canadian grocery
store shelves.
Children’s food choices are influenced by various factors within the food
environment. In many situations, their choices are limited to what is provided to
them by their parents or what is available to them at school, but some children may
have access to supermarkets, convenience stores, vending machines, or food service
establishments. When choosing what to eat, a child or their parent likely
subconsciously narrows down all of the available options to a subset of familiar
foods predetermined by previous exposure, familial influences, known preferences,
and knowledge about healthy eating. Children’s choices from within this subset may
be affected by food prices, the advertising they’ve been exposed to, or information
found on food packaging. If they are affected by these factors, the suggested price
and label policies could be effective in helping them make better choices. If they are
not, some type of manufacturer regulation would likely be the most effective policy
in improving children’s diets. In order to take this approach, we need to better
understand how various factors affect firms’ decision making as the nutrient
profiles of foods could be affected by prices of ingredients, market structure, public
awareness of nutrition issues, advertising and/or product line diversification.
These factors need to be explored before regulating manufacturers could be
recommended.
Poor dietary choices are creating externalities. Affecting dietary changes could
help to mitigate these externalities, but before this can be done, we need a better
understanding of how different factors influence decision-making (of both
consumers and manufacturers). The effectiveness and equity of the aforementioned

15
policies will be estimated empirically to help inform potential policies that could
address the diets of children.
1.4 Study objectives
The objective of this study is to inform potential policies that could be
implemented by the government in an effort to improve children’s diets and
subsequent health outcomes. The policies that will be investigated are 1) a tax
mechanism, 2) a traffic-light or warning label, and 3) a regulation on food
manufacturers. The tax and warning label mechanisms address factors that could
influence parents’ or children’s food choices while the regulation of food
manufacturers would address the manufacturer’s strategic decisions in order to
improve the nutritional profile of foods targeted at children and bypass the
consumer choice aspect completely.
1.5 Description of papers
The first paper of this dissertation will address children’s willingness to pay
for food with different price and label characteristics when purchasing the food
directly for themselves. How their preferences are affected by their age, gender, and
cognitive abilities will be assessed. This will be achieved through the use of a choice
experiment conducted with children aged 8-12 along with a questionnaire
pertaining to food purchasing behaviours and various tasks assessing cognitive
abilities. The policy instruments tested are a tax and a traffic light style label, which
will be applied in some scenarios to less healthy products. Given our assumption
that they are maximizing utility subject to a budget constraint, the children will
choose their utility maximizing bundle (making trade-offs between price, brand
preference, and label information) in several scenarios and this will allow us to
determine their sensitivity to price and label mechanisms.
The second paper of this dissertation will examine parents’ willingness to pay
for foods based on the product’s price and presence of an explicit text based
warning label. Rather than assuming the parent will choose only one product,
16
however, we will construct an experiment where the parent can choose multiple
products in varying amounts as if they are making purchases for a month. This will
allow for the reduction rather than elimination of purchases of products with a
warning label which could be more realistic. If the parent is deriving utility from
both the child’s happiness and the child’s expected long-term health, they will want
to choose products that they know the child likes and more often that are healthy
(ie: no warning label). However, they may need to make trade-offs between these
objectives when they are not aligned, all while adhering to their budget constraint,
keeping in mind that it doesn’t matter how healthy a product is if the child won’t eat
it. Positive dietary changes could be affected if parents prefer to purchase healthier
products without warning labels and their child is willing to consume them. If the
parents do not respond to the warning label, this mechanism will not be effective.
This paper will explore how parents would respond to a warning label (in terms of
frequency of choice) and how this response might differ based on individual-specific
characteristics such as nutrition knowledge.
The third paper of this dissertation will assess whether or not there is any
merit to regulating the manufacturers of children’s food. This will be done by
examining the firms’ decision-making via the outcome of nutrient profiles of their
products and how they’ve adjusted over time in response to nutrition trends in the
media, recommendations by third-parties, and regulations from the government
(such as mandatory trans-fat labeling). If the nutrient profiles of products have
adapted and improved without direct government mandates, be it to adjust to
consumer demand for healthier products or to appear like a socially responsible
corporation, a manufacturer regulation would likely be unnecessary or inefficient.
However, if products are getting nutritionally worse or increasingly segmented (a
super healthy kind for nutrition-conscious consumers with a sugar-packed variety
for kids), this could be grounds for putting mandatory nutrient standards in place.
In addition to the nutrition aspect of these products, prices and advertising will also
be considered, as lower prices and/or higher advertising of less healthy products
could be encouraging their consumption.
17
1.6 Contribution of study
This study will endeavor to improve the understanding of how extrinsic food
characteristics, namely price and labeling mechanisms, affect children’s and parents’
food choices, thus hoping to inform policy designed to improve the diets of children.
If behaviour can be modified through the provision of information via food labeling
or through a price mechanism, a policy utilizing one of these approaches to improve
children’s diets without infringing on consumer sovereignty could be recommended.
This research will also give some insight into the possible effects that the upcoming
warning label will have on the purchases of Canadian consumers. Firm behaviour
will also be examined to determine how various factors such as input prices, public
health focus, and the regulatory environment affect the nutrition profile of their
products. If desirable outcomes cannot be achieved through the modification of
extrinsic food characteristics, policies affecting firm decision making and thus
impacting intrinsic food characteristics, namely their nutrition profiles, could be the
more effective approach to improving children’s diets.
By eliciting a better understanding of children’s and parents’ decision making
with respect to food and how the aforementioned policies can affect their choices, as
well as exploring the potential of firm level policies, this study will help to
determine the most effective approaches in improving children’s diets. More
specifically, this study will contribute the literature by providing evidence as to how
children react to traffic light style labels and price changes when purchasing food
for themselves, how parents react to a warning label and price changes when
purchasing food for their family, and what factors influence food manufacturers to
produce healthier products.
18
Chapter 2: Children’s response to price and label interventions
2.1 Introduction
As discussed in the introductory chapter, there are many factors influencing
children’s food choices. Although parents and institutions are largely responsible
for providing children with food, it is the children themselves who ultimately choose
whether or not to consume it. In some situations, however, we need to consider that
children could be purchasing food independently. Many kids have a vending
machine or cafeteria in their school or at a recreational facility where they can buy
food. Some may have a grocery store, corner store, or fast food restaurant within
easy walking distance of home or school. These kids may receive an allowance from
their parents that they might use to purchase food or their parents might give them
money specifically to buy food with if they are unable to send a lunch or snack to
school or extracurricular activities with their child. Given that our overall objective
is to evaluate the effectiveness of potential policy tools to improve children’s diets, it
is critical that we consider children’s autonomous food purchasing decisions and
their responses to these policies.
When considering the effectiveness of various policy mechanisms, researchers
typically assume they’re dealing with an adult who behaves as a rational economic
agent. Rarely are children studied as consumers. Can we apply the same
assumptions to them as we do to adults? Do kids even care about prices? How do
they differ as consumers from their grown-up counterparts? And how does their
level of cognitive development affect these similarities or differences? This study
attempts to provide some insight into how children behave as consumers while
addressing the overall objective.
The economic objective of this paper is to explore how children respond to
two of the proposed policy instruments: price and label mechanisms. What we
really want to know is if a child decided to buy a snack at a vending machine or in a
convenience store, whether their choice would be affected by a price or something
they saw on the label, such as the impending warning label soon to be implemented
by Health Canada. If it was, we could use this information to help increase the
19
likelihood that children will buy the healthier options. To address this, a simulated
purchase environment where a child is choosing a pre-packaged salty snack is
created with legitimate, recognizable brands. In order to determine whether the
children exhibit any sensitivity to price changes or a traffic light style warning label,
prices will be varied and the traffic light label will be applied to the products higher
in saturated fat and calories on some occasions. Given that children develop at
different rates and that they have a wide range of cognitive abilities, it is also of
interest to consider whether the policies would elicit an equitably distributed
change or if only some segments of the child population would be affected.
Therefore, measures of cognitive development (such as IQ and vocabulary) in
addition to age and gender will be used to explain variation in responses to pricing
and label interventions.
Following this introduction is a literature review exploring the use of price and
label mechanisms to influence food choice as well as considering children as
consumers. Next the methods and data collection are discussed, then the analysis
and finally the conclusion.
2.2 Literature Review
2.2.1 Taxes
Most commonly referred to as a ‘fat tax’, the name implies that the tax is
applied to foods high in fat, which is not necessarily the case; more broadly the
instrument should be called a health related food tax. Food taxes have been
proposed as a policy instrument to improve diets in many countries for the past
decade and beyond. Countries such as Norway, Samoa, Australia, Fiji, Finland,
Hungary, Denmark, and France have implemented various taxes on unhealthy foods
with the focus being largely on soft drinks and foods high in sugar (Mytton et al
2012). While the US does not have a national tax applied to sugary drinks, many
cities, starting with Berkeley, California in 2015 followed by Philadelphia,
Pennsylvania and many others (some still to be implemented in 2018) have applied
a soda tax to reduce the consumption of sugary beverages (Boseley 2017). As such,
20
there has been a fair amount of research dedicated to determining how effective
health related food taxes are or could be.
A study examining the effectiveness of the soda tax in Berkeley (Falbe et al
2015) showed a 26% decrease in the city’s soda consumption. A similar study in
Brazil also found that a soda tax did in fact reduce consumption (Claro et al 2012) as
it did in Mexico (Colchero et al 2017). However, it should be pointed out that
Debnam (2017) found heterogeneity in consumer response to the soda tax in
Berkeley, with those in the high-consuming households being less responsive to
price changes. Cawley and Frisvold (2017) found that across all brands and sizes of
SSBs, 43.1% of the Berkeley tax was passed on to consumers, and that this level
increased as the distance to the closest store exempt from the tax increased.
Therefore the policy is not affecting consumer prices to the extent it was expected.
It has also been reported that when a soda tax was briefly imposed in Cook County,
Illinois, many people drove to nearby Indiana to stock up on SSBs (The Economist
2017). It should also be noted that just because consumers decrease their soda
consumption, it doesn’t necessarily mean that they’re substituting it with a healthier
option. It is important to keep in mind that findings on beverage consumption are
not necessarily transferable to food decisions; sugary drinks are not a necessity, and
water is a widely available and much cheaper substitute when sugary drinks get
more expensive. There is not, however, a similar substitute for food products, so the
price elasticity of food is lower than for beverages. As such, the transferability of
these results on the effectiveness of a tax on ‘junk’ food is not clear.
The Danish tax on saturated fats provided an opportunity to see how effective
a fat tax would be; a study by Smed et al (2016) using scanner data found that the
tax resulted in a 4% reduction in saturated fat intake. In addition, they found that
vegetable consumption increased, as did salt intake for most population groups.
Mexico also imposed a tax on high energy density nonessential foods which resulted
in a 10.2% decline in the amount of taxed foods low income households purchased;
middle income households purchased 5.8% less of the taxed foods while high
income households did not change their purchases (Batis et al 2016). Taillie et al
(2017) found that the purchases of taxed foods in Mexico declined with the greatest
21
change being among families who were the most frequent purchasers of the taxed
products before the tax was introduced.
An ex-post study assessing how a fat tax affects nutrients purchased by
households in France found that the effects were small and ambiguous (Allais et al
2010). Using the 2005-2006 UK Expenditure and Food Survey to construct demand
equations, Tiffin and Arnoult (2011) estimated that although a tax could reduce
consumption of saturated fat, it was insufficient in reducing it enough to improve
health outcomes. They did find, however, that a subsidy could increase average fruit
and vegetable consumption to the recommended levels. When examining scanner
data for dairy product consumption in the US, Chouinard et al (2005) estimated that
a fat tax on dairy products would not reduce fat consumption significantly. Mytton
et al (2007), using data from the National Food Survey in Great Britain, found that
taxing primary sources of saturated fat would not improve health outcomes due to
substitution behaviours, but that taxing unhealthy foods would have modest
improvements in health outcomes largely due to reductions in sodium consumption.
Regardless of effectiveness, the main criticism of food taxes is that they place a much
larger burden on lower income households (Allais et al 2010; Madden 2015).
All of this research focused on adults; none was found pertaining to children’s
responses to food taxes. One study by Just and Price (2013) did find that by
providing a financial reward (the opposite of a tax), elementary school aged children
increased their fruit and vegetable consumption, more so if they were in low-income
neighborhoods. It is possible that children will react differently to taxes than adults
do, perhaps due to their limited disposable income, less developed financial
competency, or that they are more likely purchasing extraneous snacks. This
portion of the research will explore how children respond to financial mechanisms
imposed on snack foods.
2.2.2 Graphic labeling mechanisms
Various types of label mechanisms beyond just the nutrition facts panel have
been proposed to help consumers make healthier choices. Many of these initiatives
22
have been led by third parties who offer endorsements such as the Health Check
symbol in Canada, the Pick the Tick logo in New Zealand and Australia, and a
Healthy Choice symbol in Singapore to healthier products in exchange for a licensing
fee. What should be pointed out about these programs is that most simply point out
‘healthier’ products, they don’t tell a consumer when something they’re choosing is
unhealthy. The traffic light food labeling system, which was developed by the Food
Standards Agency (a department of the Government of the United Kingdom) has
been widely used in the UK on a voluntary basis, uses red, green, and amber signals
for the amounts of sugar, salt, and fat in a product, making it easier for consumers to
discern the more or less healthy choices with a glance at the front of the package.
A study examining vending machine purchases found that when items were
colour coded, purchases of the ‘red’ items (least healthy) decreased by around 5%
(Garson and Engelhard 2007). In a study examining explicit vs. subtle health
messages in snack choices, Wagner et al (2015) found that subtle messages
indicating a healthy choice (such as a heart with checkmark symbol) were more
effective in encouraging healthy snack choices than explicit messages (such as the
words “A Healthy Choice”). They theorize that explicitly labelling a food as healthy
may imply that the food tastes bad or lead to reactance. In traffic-light style label
research, Sacks et al (2010) and Kelly et al (2009) found that consumers were more
likely to choose healthier products when the traffic light label was included on the
food package, and Balcombe and Fraser (2010) found that consumers avoided
products with a red light. More recently, Boncinelli et al (2017) found that among
college students, a high-calorie warning label had little effect on respondents’
choices. In a study examining preferences for SSBs among New Zealand youth (aged
13-24), Bollard et al (2016) found that all the interventions they considered
(warning label, tax, and plain packaging) significantly reduced respondents’
purchase probability of SSBs.
Very little research pertaining to children’s responses to a graphic labeling
mechanism or nutrient information on food packaging was published until quite
recently. One study evaluated consumer perception of the traffic light label in
Ecuador, and found that although some consumers used the label to help them
23
choose food products, children and adolescents reported using them infrequently
(Freire et al 2017). Another found that American adolescents (aged 12-18) were
less likely to purchase SSBs when a warning label was present (VanEpps and
Roberto 2016). Children’s responsiveness to traffic light labels will be investigated
in this study because knowing whether children’s choices will be affected by some
type of warning about the inappropriate nutritional content of a food is an
important aspect of designing policies to improve children’s diets.
2.2.3 Children as consumers
A survey conducted in 1998 found that American children get about $9 billion
annually in pocket money and gifts; because of their wealth, children aged 8-12 are
a significant market (Gunter and Furnham 1998). It was estimated that in 2002,
American 4-12 year olds spent $30 billon (Schor 2004). A large proportion of
children’s disposable income is spent on food. A 2012 study conducted in Ontario,
Canada, found that 65% of grade 7 and 8 students surveyed reported purchasing
food at either fast food outlets or convenience stores (He et al 2012). Dennisuk et al
(2011) found that 10-14 year olds surveyed in Baltimore, USA, on average
purchased food at corner stores twice per week and that chips, candy, and soda
were the most commonly purchased items. In Australia, Finch et al (2006) found
that less healthy foods and high sugar drinks were the most commonly purchased
products at school canteens by children in grades 1 through 6. A study of junior-
senior high schools in Minnesota found that the availability of less healthy snacks
and drinks in schools was associated with a small but significant increase in BMIs
(Nanney et al 2016). Given this evidence that many children have a disposable
income and often use it to purchase unhealthy food, examining how they would
react to the proposed policy measures is merited. If we can gain a better
understanding of what affects children’s food purchasing decisions, we can assist in
the development of policies to help children choose healthier foods, thus improving
their diets and lowering the incidence of chronic diseases in the future.
24
2.2.4 Children’s ability levels
Several studies have examined children’s cognitive capabilities, patience, and
honesty in order to better understand what influences their economic behaviour.
According to the literature, as children enter the phase of late childhood to early
adolescence, they begin to make choices about how to spend their money and
allocate their time (Lundberg et al 2009). From the age of eight to sixteen, children
rapidly develop the skills to weigh options and make rational choices (Keating
1990).
Using mathematical scores as a proxy for cognitive ability, Harbaugh et al
(2001) found that children with higher cognitive levels made more rational
economic choices up to age 12, at which point they behaved consistently with
college students. Another study by Harbaugh et al (2003) found that bargaining
behaviour among children changes with age and height, but not by gender.
Bettinger and Slonim (2007) found that in general, children’s choices exhibit
hyperbolic discounting and that more specifically, girls, older children, and kids with
higher mathematical scores are more patient.
2.3 Objective and Research Question
The overall objective of this dissertation is to evaluate potential policy tools to
improve children’s diets; the focus of this study is to determine how children would
respond to price and label mechanisms and how this response might differ based on
age, gender, and cognitive abilities. If, for example, children with higher cognitive
abilities were more responsive to price interventions, that would mean that a tax
policy would have greater impacts in some groups of children than others.
Therefore it is important to consider not only the overall effectiveness of the
different mechanisms but also how the child-specific characteristics play a role.
25
2.4 Methods
In order to address the research question, an incentive-compatible choice
experiment involving real snack foods and money was conducted with children aged
8-12. This was done in order to emulate real-world purchases and thus elicit
realistic responses. The attributes of the purchase experiment were brand, price,
and a traffic light label. There were four types of pre-packaged salty snacks used,
they had four price levels in order to be able to identify price sensitivity, and there
was a traffic light label which could appear on two of the higher fat products. In
addition to the choice experiment, children participated in several tasks used to
evaluate their level of IQ, verbal mental age, and executive functioning. Participants
also filled out a questionnaire giving their age, gender, allowance, and food
purchasing habits. It was decided to utilize the child’s age in months rather than
grade as it could provide a more precise measure and the use of both would lead to
multicollinearity. More detail about data collection can be found in section 2.4.2.
This combination of cognitive assessment data and a choice experiment is
uncommon in and of itself, but no other studies have been found that collected both
types of data with children. This gives us an opportunity to see how a child’s level of
cognitive development affects their responsiveness to a price and/or label
mechanism.
2.4.1 Theoretical Model
This choice experiment and cognitive task data will allow us to identify
children’s sensitivity to price and label mechanisms and how it varies with cognitive
ability. The theory behind choice experiments is the random utility model (RUM)
(Verbeek 2008 pg.220-223). Random utility theory is used to elicit non-market
valuations for attributes which cannot be purchased independently of each other. It
builds on Lancaster’s (1966) theory which considers goods to be bundles of
attributes rather than homogeneous. The main assumption of the RUM is that each
respondent will select the option from the set of alternatives that gives them the
most utility. In this scenario, we assume that the child will choose the type of snack,
possibly with a traffic light label, at the associated price that gives them the greatest
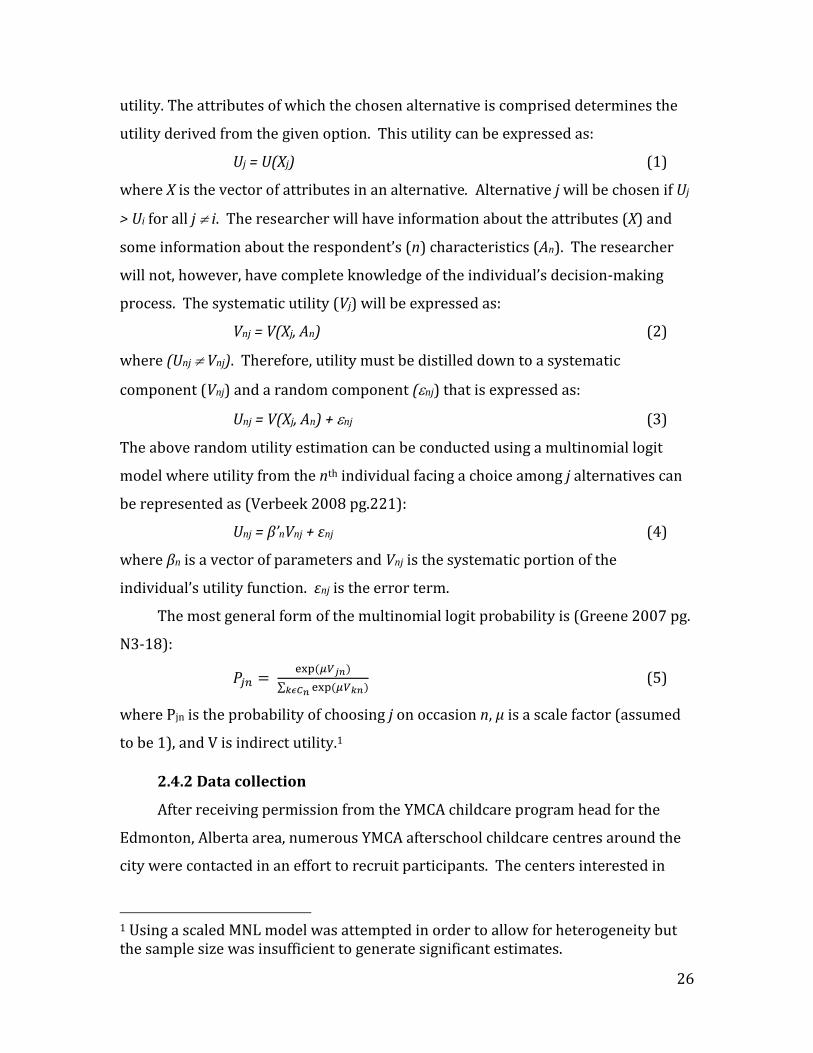
26
utility. The attributes of which the chosen alternative is comprised determines the
utility derived from the given option. This utility can be expressed as:
Uj = U(Xj) (1)
where X is the vector of attributes in an alternative. Alternative j will be chosen if Uj
> Ui for all j i. The researcher will have information about the attributes (X) and
some information about the respondent’s (n) characteristics (An). The researcher
will not, however, have complete knowledge of the individual’s decision-making
process. The systematic utility (Vj) will be expressed as:
Vnj = V(Xj, An) (2)
where (Unj Vnj). Therefore, utility must be distilled down to a systematic
component (Vnj) and a random component (nj) that is expressed as:
Unj = V(Xj, An) + nj (3)
The above random utility estimation can be conducted using a multinomial logit
model where utility from the nth individual facing a choice among j alternatives can
be represented as (Verbeek 2008 pg.221):
Unj = β’nVnj + εnj (4)
where βn is a vector of parameters and Vnj is the systematic portion of the
individual’s utility function. εnj is the error term.
The most general form of the multinomial logit probability is (Greene 2007 pg.
N3-18):
𝑃𝑗𝑛 = exp (𝜇𝑉𝑗𝑛)
∑ exp (𝜇𝑉𝑘𝑛)𝑘𝜖𝐶𝑛
(5)
where Pjn is the probability of choosing j on occasion n, μ is a scale factor (assumed
to be 1), and V is indirect utility.1
2.4.2 Data collection
After receiving permission from the YMCA childcare program head for the
Edmonton, Alberta area, numerous YMCA afterschool childcare centres around the
city were contacted in an effort to recruit participants. The centers interested in
1 Using a scaled MNL model was attempted in order to allow for heterogeneity but the sample size was insufficient to generate significant estimates.
27
taking part in the study were given information sheets to send home with the
children, then the children who wanted to participate were given consent forms to
have signed by their parents. Once consent forms were returned to the centre, dates
to conduct the research at the facility were coordinated. Initially, 60 children aged
8-12 were participating in the study, but 2 of them completed only a portion of the
tasks and were unavailable to finish at a later date. Each child completed a short
questionnaire pertaining to allowance received and snack food purchases (see
Appendix 2A), participated in a purchase experiment, and did several tasks used to
evaluate various aspects of their cognitive development. As recommended by a
developmental psychologist, the tasks used to evaluate cognitive measures in the
participating children were the Peabody Picture Vocabulary Test (PPVT) which
assesses the child’s verbal mental age, the Stanford Binet Intelligence Scales (non-
verbal) which is a standardized test used to evaluate the child’s IQ, the Sort task
which assesses organization and categorization skills by asking the child to sort
shapes with their hands that they are unable to see, the Tower of London task which
assesses planning and anticipation by asking the child to move pieces on a game to
match a picture, the Circle Trace task which measures impulse control by asking the
child to trace over a circle printed on letter sized paper as slowly as possible, and
finally the Stroop test which assesses impulse control and working memory by
having them read words and name colours on a page as quicly as possible. The Sort
task, Tower of London task, Circle Trace task, and Stroop test all evaluate different
components of executive functioning and are therefore combined to generate an
overall measure of executive functioning. The developmental variables included in
the analysis are therefore IQ (from the Stanford Binet task), verbal mental age (from
the Peabody Picture Vocabulary Test), and executive functioning.
In order to evaluate whether the surveyed children were autonomous
consumers of food, the questionnaire asked them whether they got a weekly
allowance, and if so, how much was it and did they ever use it to purchase food, as
well as whether their parents ever gave them money specifically to purchase food
with. They were also asked to check any foods on a list that they purchase
independently from their parents.
28
The purchase experiment was designed to elicit children’s preferences for
various snack foods with different prices and the occasional inclusion of a traffic
light style label indicating that the snack wasn’t a healthy choice. A 96 choice set
efficient design based on a fractional factorial design and some parameter estimates
was generated using Ngene. These choice sets were broken down into 8 blocks of
12. Each participant was randomly assigned a block of 12 choice sets, each of which
gave the child 2 snack options (individual-sized bags of salty snacks) in addition to a
‘neither’ option (A, B, or none). Each child was given $2.00 in Canadian coins to keep
or use in the task, and real packaged snacks were used in the experiment. Upon
completion of the 12 choice sets, one was drawn at random and the transaction
actually carried out with the snacks and prices in question. This process was
explained to the children prior to beginning the purchase experiment, and they were
permitted to ask as many questions about the process as they liked until they felt
that they understood how it worked. The fact that the children were aware that one
of their choices would be binding makes them more likely to make choices which
reflect their true purchasing behavior. Any of the 4 price levels ($0.75, $1.00, $1.25,
and $1.75) could be associated with any of the 4 brands, but the traffic light labels
were only ever applied to the Original Lay’s Potato Chips and the Cheetos Cheese
Puffs as they are higher in fat and calories than the other two options (Baked Lay’s
Chips and Rold Gold Pretzels).
The label mechanism incorporates a red traffic light image as well as the
statement “Health Canada recommends eating foods like this less often because they
are high in calories, fat or sodium”. This label mechanism was pre-tested by a pilot
sample of 10 children to ensure that it was easy to understand and conveyed the
correct message. The general feedback from the participating children was that it
was easy to understand, so no modifications were made to it. The traffic light label
is displayed in Figure 2.1 below and the children’s comments about it are shown in
Table 2.1.
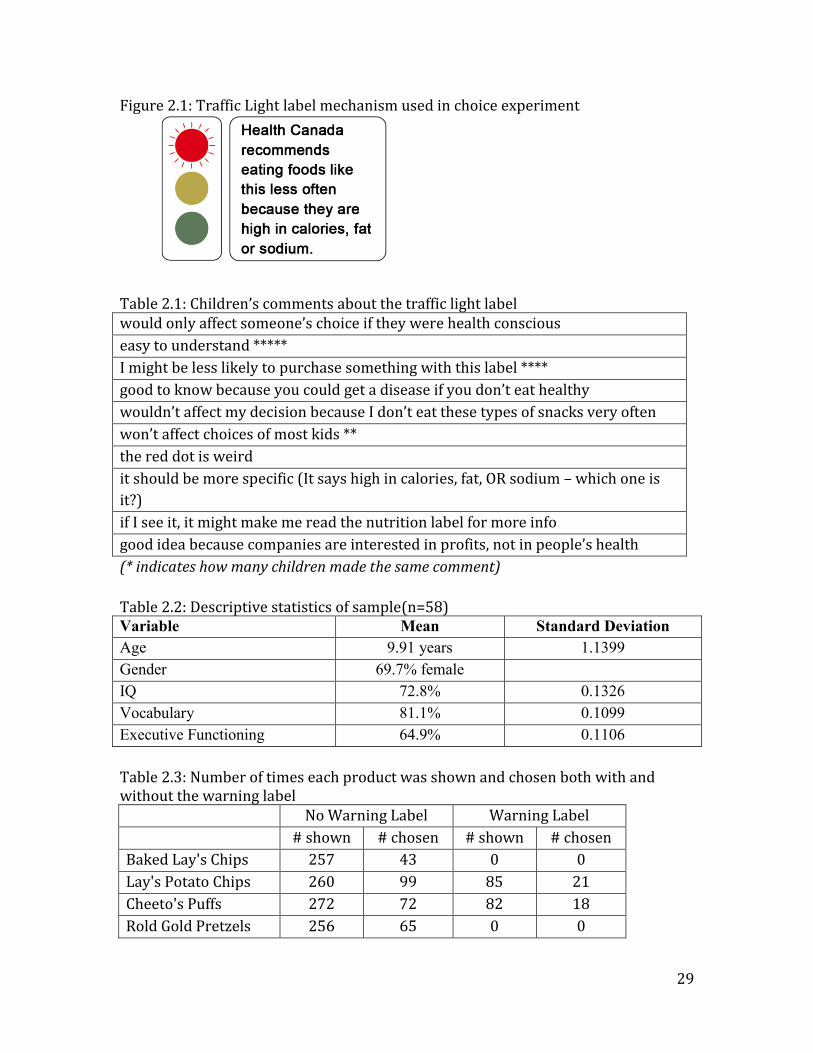
29
Figure 2.1: Traffic Light label mechanism used in choice experiment
Table 2.1: Children’s comments about the traffic light label would only affect someone’s choice if they were health conscious
easy to understand *****
I might be less likely to purchase something with this label ****
good to know because you could get a disease if you don’t eat healthy
wouldn’t affect my decision because I don’t eat these types of snacks very often
won’t affect choices of most kids **
the red dot is weird
it should be more specific (It says high in calories, fat, OR sodium – which one is
it?)
if I see it, it might make me read the nutrition label for more info
good idea because companies are interested in profits, not in people’s health
(* indicates how many children made the same comment)
Table 2.2: Descriptive statistics of sample(n=58) Variable Mean Standard Deviation
Age 9.91 years 1.1399
Gender 69.7% female
IQ 72.8% 0.1326
Vocabulary 81.1% 0.1099
Executive Functioning 64.9% 0.1106
Table 2.3: Number of times each product was shown and chosen both with and without the warning label
No Warning Label Warning Label
# shown # chosen # shown # chosen
Baked Lay's Chips 257 43 0 0
Lay's Potato Chips 260 99 85 21
Cheeto's Puffs 272 72 82 18
Rold Gold Pretzels 256 65 0 0
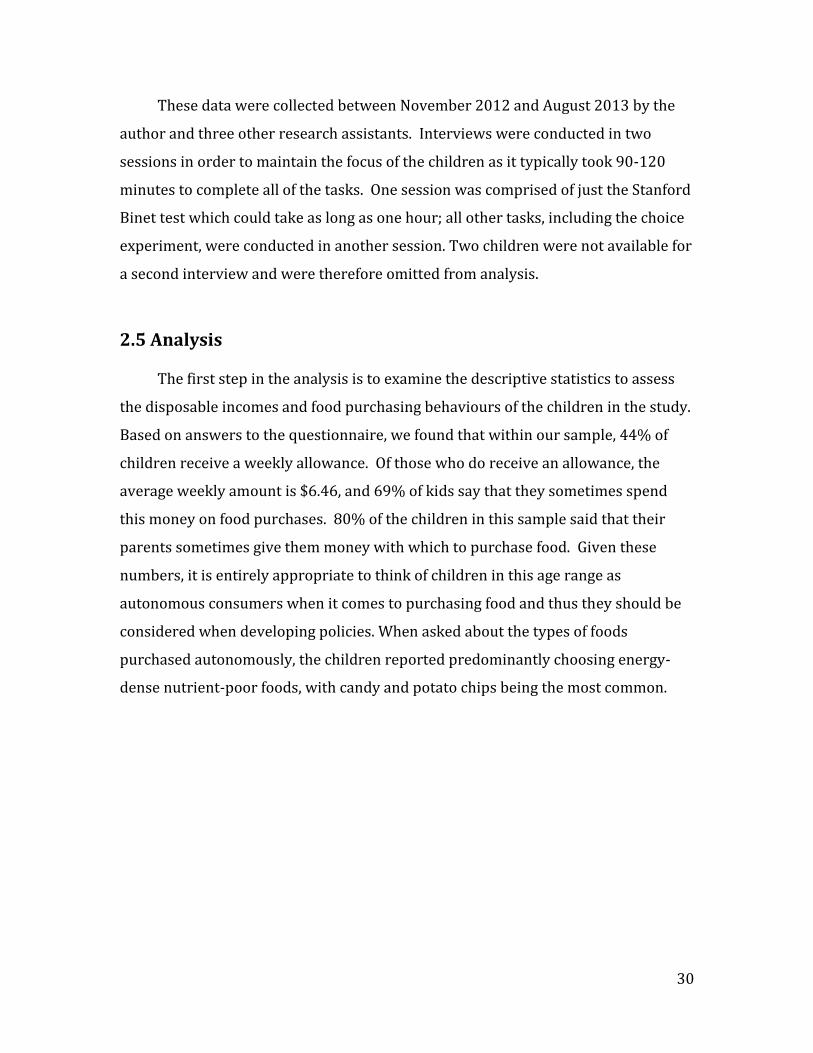
30
These data were collected between November 2012 and August 2013 by the
author and three other research assistants. Interviews were conducted in two
sessions in order to maintain the focus of the children as it typically took 90-120
minutes to complete all of the tasks. One session was comprised of just the Stanford
Binet test which could take as long as one hour; all other tasks, including the choice
experiment, were conducted in another session. Two children were not available for
a second interview and were therefore omitted from analysis.
2.5 Analysis
The first step in the analysis is to examine the descriptive statistics to assess
the disposable incomes and food purchasing behaviours of the children in the study.
Based on answers to the questionnaire, we found that within our sample, 44% of
children receive a weekly allowance. Of those who do receive an allowance, the
average weekly amount is $6.46, and 69% of kids say that they sometimes spend
this money on food purchases. 80% of the children in this sample said that their
parents sometimes give them money with which to purchase food. Given these
numbers, it is entirely appropriate to think of children in this age range as
autonomous consumers when it comes to purchasing food and thus they should be
considered when developing policies. When asked about the types of foods
purchased autonomously, the children reported predominantly choosing energy-
dense nutrient-poor foods, with candy and potato chips being the most common.
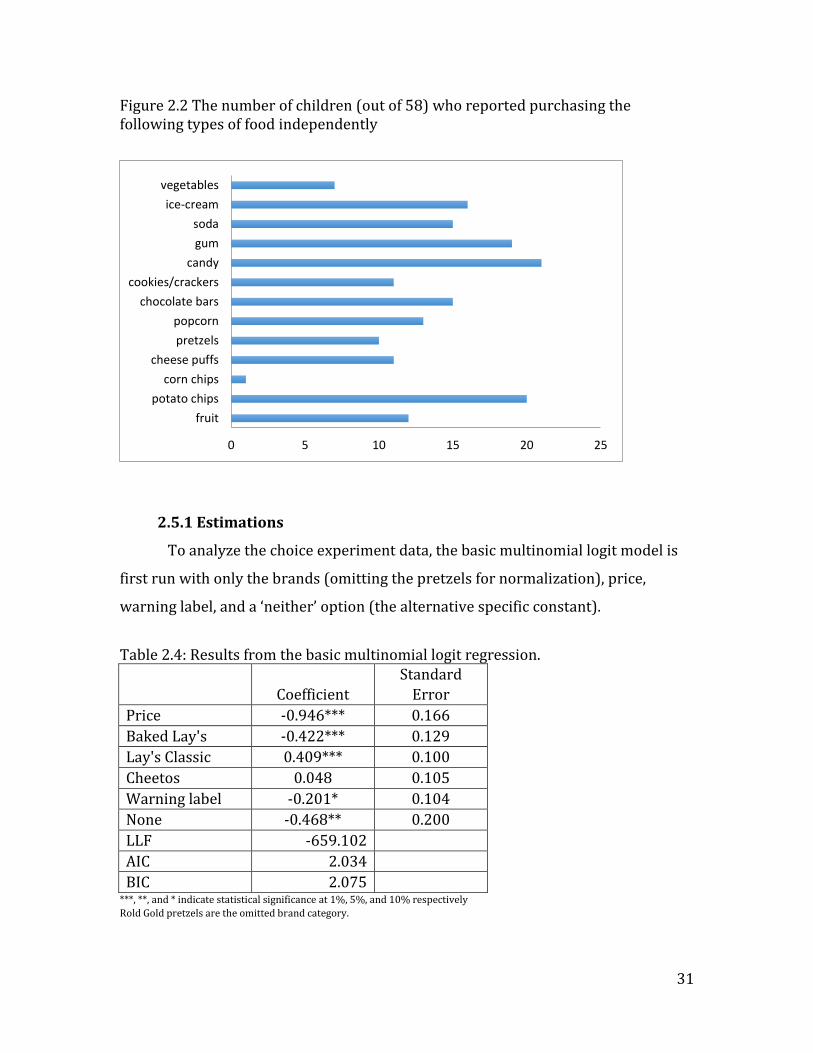
31
Figure 2.2 The number of children (out of 58) who reported purchasing the following types of food independently
2.5.1 Estimations
To analyze the choice experiment data, the basic multinomial logit model is
first run with only the brands (omitting the pretzels for normalization), price,
warning label, and a ‘neither’ option (the alternative specific constant).
Table 2.4: Results from the basic multinomial logit regression.
Coefficient
Standard
Error
Price -0.946*** 0.166
Baked Lay's -0.422*** 0.129
Lay's Classic 0.409*** 0.100
Cheetos 0.048 0.105
Warning label -0.201* 0.104
None -0.468** 0.200
LLF -659.102
AIC 2.034
BIC 2.075
***, **, and * indicate statistical significance at 1%, 5%, and 10% respectively
Rold Gold pretzels are the omitted brand category.
0 5 10 15 20 25
fruit
potato chips
corn chips
cheese puffs
pretzels
popcorn
chocolate bars
cookies/crackers
candy
gum
soda
ice-cream
vegetables
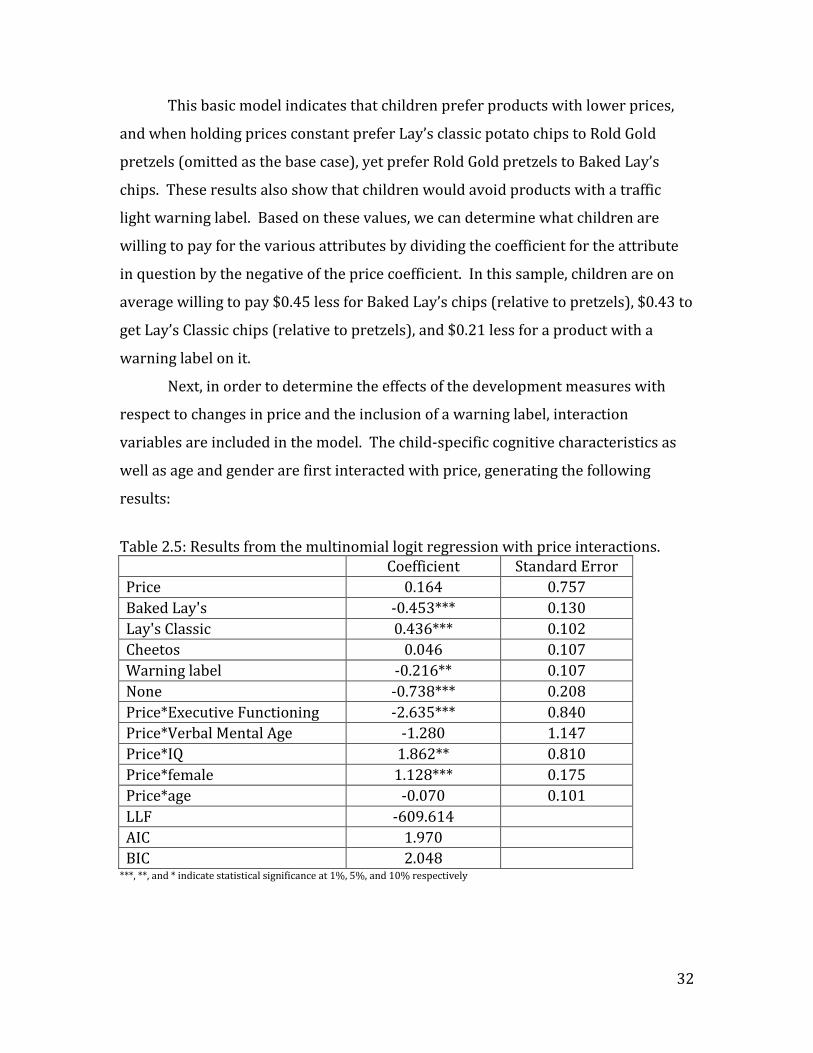
32
This basic model indicates that children prefer products with lower prices,
and when holding prices constant prefer Lay’s classic potato chips to Rold Gold
pretzels (omitted as the base case), yet prefer Rold Gold pretzels to Baked Lay’s
chips. These results also show that children would avoid products with a traffic
light warning label. Based on these values, we can determine what children are
willing to pay for the various attributes by dividing the coefficient for the attribute
in question by the negative of the price coefficient. In this sample, children are on
average willing to pay $0.45 less for Baked Lay’s chips (relative to pretzels), $0.43 to
get Lay’s Classic chips (relative to pretzels), and $0.21 less for a product with a
warning label on it.
Next, in order to determine the effects of the development measures with
respect to changes in price and the inclusion of a warning label, interaction
variables are included in the model. The child-specific cognitive characteristics as
well as age and gender are first interacted with price, generating the following
results:
Table 2.5: Results from the multinomial logit regression with price interactions.
Coefficient Standard Error
Price 0.164 0.757
Baked Lay's -0.453*** 0.130
Lay's Classic 0.436*** 0.102
Cheetos 0.046 0.107
Warning label -0.216** 0.107
None -0.738*** 0.208
Price*Executive Functioning -2.635*** 0.840
Price*Verbal Mental Age -1.280 1.147
Price*IQ 1.862** 0.810
Price*female 1.128*** 0.175
Price*age -0.070 0.101
LLF -609.614
AIC 1.970
BIC 2.048
***, **, and * indicate statistical significance at 1%, 5%, and 10% respectively

33
Table 2.6: Results from the multinomial logit regression with warning label interactions.
Coefficient Standard Error
Price -0.946*** 0.168
Baked Lay's -0.432*** 0.130
Lay's Classic 0.418*** 0.101
Cheetos 0.052 0.107
Warning label -0.010 0.955
None -0.544*** 0.202
Warning Label*Executive Functioning -1.207 1.144
Warning Label*Verbal Mental Age -2.010 1.609
Warning Label*IQ 1.335 1.073
Warning Label*female 0.216 0.219
Warning Label*age 0.110 0.139
LLF -638.090
AIC 1.298
BIC 1.359
***, **, and * indicate statistical significance at 1%, 5%, and 10% respectively
In addition to providing the same inferences as the basic model, these results
also indicate that children with higher executive functioning scores are more price
sensitive and children with higher IQs are less price sensitive. It also shows that
boys are also more price sensitive than girls in our sample.
The same child-specific characteristics were also interacted with the warning
label, but the lack of statistically significant interaction coefficients in this model
showed that children with differing cognitive abilities, age, or gender do not
respond differently to a red traffic light label (see Table 2.5). Having said that,
because there is heterogeneity in price response, different groups do have differing
WTP’s for different product attributes.
2.5.2 WTP calculations
Using the estimates from Table 2.4, price coefficients were calculated for
children with different characteristics and these were subsequently used to
calculate their WTP for the different brands and for the traffic light warning label.
Price coefficients are shown in Table 2.6 while WTP values are shown in Table 2.7.
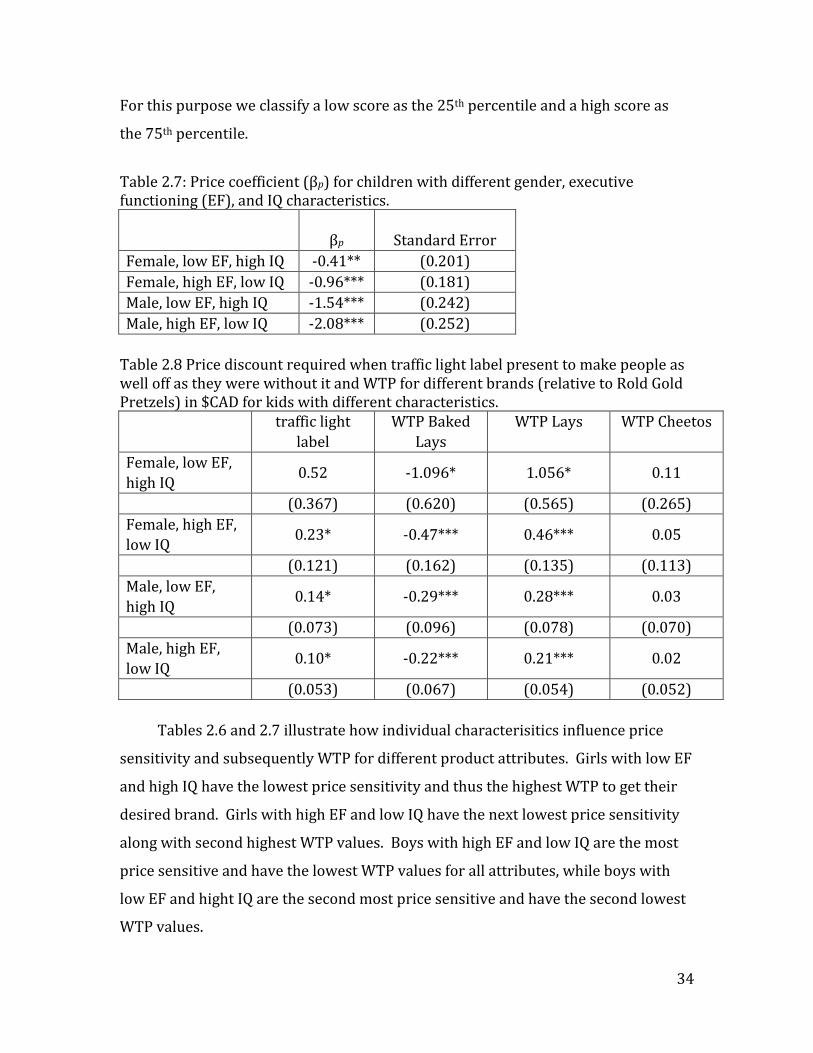
34
For this purpose we classify a low score as the 25th percentile and a high score as
the 75th percentile.
Table 2.7: Price coefficient (βp) for children with different gender, executive functioning (EF), and IQ characteristics.
βp Standard Error
Female, low EF, high IQ -0.41** (0.201)
Female, high EF, low IQ -0.96*** (0.181)
Male, low EF, high IQ -1.54*** (0.242)
Male, high EF, low IQ -2.08*** (0.252)
Table 2.8 Price discount required when traffic light label present to make people as well off as they were without it and WTP for different brands (relative to Rold Gold Pretzels) in $CAD for kids with different characteristics.
traffic light
label
WTP Baked
Lays
WTP Lays WTP Cheetos
Female, low EF,
high IQ 0.52 -1.096* 1.056* 0.11
(0.367) (0.620) (0.565) (0.265)
Female, high EF,
low IQ 0.23* -0.47*** 0.46*** 0.05
(0.121) (0.162) (0.135) (0.113)
Male, low EF,
high IQ 0.14* -0.29*** 0.28*** 0.03
(0.073) (0.096) (0.078) (0.070)
Male, high EF,
low IQ 0.10* -0.22*** 0.21*** 0.02
(0.053) (0.067) (0.054) (0.052)
Tables 2.6 and 2.7 illustrate how individual characterisitics influence price
sensitivity and subsequently WTP for different product attributes. Girls with low EF
and high IQ have the lowest price sensitivity and thus the highest WTP to get their
desired brand. Girls with high EF and low IQ have the next lowest price sensitivity
along with second highest WTP values. Boys with high EF and low IQ are the most
price sensitive and have the lowest WTP values for all attributes, while boys with
low EF and hight IQ are the second most price sensitive and have the second lowest
WTP values.
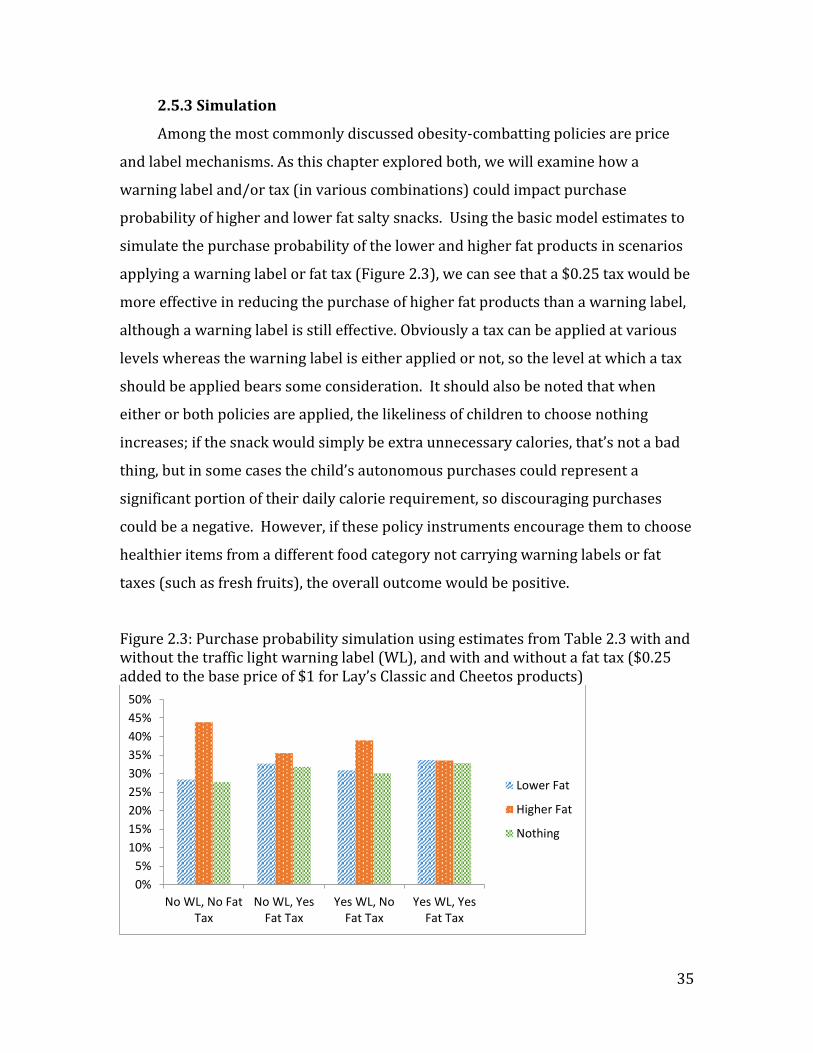
35
2.5.3 Simulation
Among the most commonly discussed obesity-combatting policies are price
and label mechanisms. As this chapter explored both, we will examine how a
warning label and/or tax (in various combinations) could impact purchase
probability of higher and lower fat salty snacks. Using the basic model estimates to
simulate the purchase probability of the lower and higher fat products in scenarios
applying a warning label or fat tax (Figure 2.3), we can see that a $0.25 tax would be
more effective in reducing the purchase of higher fat products than a warning label,
although a warning label is still effective. Obviously a tax can be applied at various
levels whereas the warning label is either applied or not, so the level at which a tax
should be applied bears some consideration. It should also be noted that when
either or both policies are applied, the likeliness of children to choose nothing
increases; if the snack would simply be extra unnecessary calories, that’s not a bad
thing, but in some cases the child’s autonomous purchases could represent a
significant portion of their daily calorie requirement, so discouraging purchases
could be a negative. However, if these policy instruments encourage them to choose
healthier items from a different food category not carrying warning labels or fat
taxes (such as fresh fruits), the overall outcome would be positive.
Figure 2.3: Purchase probability simulation using estimates from Table 2.3 with and without the traffic light warning label (WL), and with and without a fat tax ($0.25 added to the base price of $1 for Lay’s Classic and Cheetos products)
0%
5%
10%
15%
20%
25%
30%
35%
40%
45%
50%
No WL, No FatTax
No WL, YesFat Tax
Yes WL, NoFat Tax
Yes WL, YesFat Tax
Lower Fat
Higher Fat
Nothing
36
2.6 Discussion
The overall objective of this dissertation is to explore mechanisms to improve
children’s diets. One important component of this is to help children make healthier
food choices for themselves when they are not with a parent or guardian. The goal
of this paper was to explore whether food price interventions and traffic light style
labels might be effective in encouraging children to choose healthier snack foods
when making autonomous purchasing decisions, and whether this effectiveness
would differ based on the individual level of cognitive development.
In order to address this, we conducted choice experiments, cognitive
assessment tasks, and food questionnaires with children aged 8 to 12. This data set,
although not overly large, is considerably unique and thorough in the sense that it
combines various facets of cognitive development (verbal mental age, IQ, and
executive functioning) with information about decision-making. This study,
therefore, provides novel insight into how cognitive development affects food
choices and price sensitivity. The results suggest that both taxes and traffic light
warning labels could be effective tools in encouraging children to purchase healthier
snacks, but that the effect of taxes would likely not be uniform across children with
different cognitive abilities, while labels appear to have a more homogeneous effect
(assuming prices are held constant). It should also be noted that taxes could be
applied at various levels, giving policy makers more flexibility, whereas the traffic
light warning label is either present or not.
Although making less healthy foods more expensive could encourage children
to make better food choices, this approach would need to be balanced against the
overall affordability of food offerings available to children as their autonomous
snack purchases may play a non-trivial role in meeting their basic caloric intake
needs. Therefore this could be an effective policy tool in situations where healthy
options are available at a low price, for example in a school cafeteria. In situations
where it is infeasible to make healthy options available at an affordable price,
potentially in a vending machine, utilizing a label mechanism would be a good
37
approach since kids could still afford to eat but the information on the label might
encourage them to either choose something different which might be marginally
healthier or to plan ahead in future situations and bring healthier snacks with them
from home. Either mechanism could help to improve the food choices children make
for themselves. This study has provided evidence as to how children would respond
to two types of diet-improving policy instruments; policy makers can use this
information to determine which would better suit their individual situation in order
to promote healthy choices among their young constituents.
38
Chapter 3: Parental response to label interventions
3.1 Introduction
The policy tools proposed to improve children’s diets affect various avenues
through which children obtain food. The previous chapter examined children’s food
purchases direct from retailers. The general finding was that they would respond to
both price and label mechanisms, but that price sensitivity varied between children
based on gender and cognitive development while the effect of the warning label
was more homogeneous. This chapter shifts the focus from children’s choices to
parents’ choices. Parents not only purchase and prepare food for their children, but
they also influence long term dietary preferences and habits that could play a role in
their child’s health throughout their life. Utilizing similar types of mechanisms as
the previous study (price and label – although this label is purely text-based and
more explicit), this chapter examines how parents would respond to different
measures and how these responses differ by individual characteristics. More
specifically the policy instrument being investigated in this study is a text-based
explicit warning label being placed on the front of the boxes of breakfast cereals
high in sugar. This is particularly relevant right now because Health Canada is
currently working on the implementation of some type of front-of-package warning
label to be applied to products high in sugar, sodium, and/or saturated fat, (current
designs being considered can be viewed at link provided in Young 2018) but there is
limited evidence pertaining to how consumers will react to this type of mechanism
on food products.
It is possible that a warning label indicating that a product is inappropriate for
regular consumption by children due to poor nutritional content will affect a
parent’s willingness to purchase it due to the disutility caused by the label. Some
parents might still be willing to purchase a product carrying a label if it were
discounted, or some might just purchase it less frequently. The economic objective
of this paper is to determine whether this is the case and if so, assess how this
reaction varies by individual characteristics such as nutrition knowledge or income
level. If only certain segments of the parent population react to the warning label or

39
are still willing to purchase products carrying it when discounted, the label could
prove to be an inequitable regulation.
The analysis for this study will be done in a similar fashion to that of the
previous study for ease of comparison. First a basic multinomial logit regression
with brands of cereal chosen as the dependent variable is estimated, followed by
regressions containing individual interaction and brand interaction variables. Next,
WTP for the different product attributes is calculated for parents with different
characteristics and for different brands. Finally, a simulation of purchase
probabilities for the higher and lower sugar products under the different
mechanisms is conducted. This study also included the participation of 30 children
of the respondents so that within family comparisons could be done.
Following this introduction a literature review focusing primarily on warning
labels and choice experiments, then survey design and data collection are discussed.
This is followed by the analysis and results section, then finally the discussion.
3.2 Literature review
3.2.1.What makes an effective warning label?
Warning labels serve two main purposes. “The first goal is to inform people so
they appreciate potential hazards. The second goal is to change behavior, that is, to
redirect people away from performing unsafe acts that they might otherwise
perform.” (Wogalter and Laughery 1996 p.33) For a warning to be successful, it
must first be noticed and understood, then it should coincide with the person’s
existing attitudes or at least be persuasive enough to make the person change their
opinion, and lastly should motivate the person to comply (Wogalter and Laughery
1996).
In a meta-analysis of text-based warning label effectiveness on a variety of
consumer products, Argo and Main (2004) find that consumer attention to warning
labels is moderated by vividness-enhancing characteristics, the location on the
package, and familiarity of product, but not by type of product. Of great relevance to
this study, they also find that product familiarity and compliance cost affect whether
40
or not people comply with the warning. Frantz and Rhoades (1993) found that the
placement of a warning was significant with large variation in subjects who noticed
and complied with warnings based on where it was located. Bzostek and Wogalter
(1999) found that the presence of an icon and colour reduced the time it took
people to notice product warnings and that they found warnings presented in red to
be more noticeable. In a study examining how warning label style affected
perceived urgency, Adams and Edworthy (1995) found that font size, amount of
white space around the warning, and border width around the warning all had an
increasing linear impact on perceived urgency with text size having the largest
impact followed by border width. They also found that a warning in black text had
to be twice as large as red text to achieve the same level of perceived urgency.
Laughery et al (1993) found that consumers noticed warnings printed horizontally
faster than warnings printed vertically but that the amount of clutter on the label
increased the time it took people to notice a warning. They also found that
warnings on the front of the package were more noticeable as were warnings
printed in colour and those with a border. Braun and Silver (1995) found that
consumers were more likely to wear protective gloves when using household
chemicals that had a warning printed in red than in green or black. In a recent
meta-analysis, Purmehdi et al (2017) found that labels addressing the safe use of a
product had stronger effects in changing behavior than did a label targeting
cessation or moderation.
3.2.2 Warning labels on products intended for adults
With products intended for use by adults, warnings usually pertain to the
hazards of misuse or improper handling of products such as cleaning chemicals,
electrical appliances, or prescription medicine. In contrast, alcohol and tobacco are
required to have warnings stating the dangers of consuming the product as
intended. Many studies have been conducted evaluating the effectiveness of
warning labels on tobacco products, especially since Canada imposed mandatory
graphic warnings on cigarettes in 2000 (Hammond et al 2004). Canadian laws
41
require that warning labels on cigarettes are on the front of the package and occupy
30% of its area (Givel 2007).
In a study evaluating the effectiveness of text vs. graphic warning labels among
adolescents, Sabbane et al (2009) found that Canadian teens were most discouraged
from smoking by the graphic labels but that these were the least effective among
American teens. Thrasher et al (2007) found that graphic warning labels elicited
negative price premiums for cigarettes among Mexican adults when compared to
text only warnings. O’Hegarty et al (2006) found that graphic warning labels on
cigarette packages were a stronger deterrent than text-only warnings among
smoking and formerly smoking young American adults. Nan et al (2015) also found
that graphic warning labels were perceived as stronger in argument strength and
generally more effective than their text-only counterparts.
3.2.3 Warning labels on products intended for children
When it comes to products intended for use by children, warning labels are
intended to make parents aware of the dangers associated with the product when a
child puts it in their mouth, pokes themself with it, hits another child with it, leaves
it close to a heat source, plays with the packaging instead of the toy, or a variety of
other things children do all the time. In Canada, the Canada Consumer Product
Safety Act regulates the warnings that are required on children’s products. Virtually
every product intended for use by children or babies requires a warning label,
including cribs, playpens, sleepwear, shampoos, toys, high chairs, etc. According to
Kulak and Stein (2016), there are two essential components of safety labeling in
children’s products. The first, which is mandatory, is safety labeling for hazards
such as balloons or small parts that could present a choking risk. The second is age-
labeling, which describes the age of child for which the product is intended, and this
is largely discretionary. In addition to helping protect the consumer, these warning
labels are motivated in part to protect the product manufacturer from potential
lawsuits arising from injuries or deaths involving their product.
42
3.2.4 Food packaging
There are several regulations imposed on food packaging requirements by
Health Canada which were last updated in 2007, including the mandatory nutrition
facts panel (which must include trans-fat content) the ingredient list, product name
and quantity, expiry date, etc., along with optional nutrition claims. Health Canada
also makes the rules about health and nutrient claims as well as what foods must
carry a nutrition facts panel and which are exempt. Health Canada is currently
evaluating 4 potential warning labels to determine which one will be used on
packaged foods in Canada. The chosen warning label will be applied to foods that
have more than 15% of the recommended daily value of sugar, sodium, or saturated
fat – 30% is the threshold if it’s a pre-packaged meal or main dish (Health Canada
2018).
In 2007, 16 food companies formed the Canadian Children’s Food and
Beverage Advertising Initiative to implement voluntary advertising standards to
support healthy eating practices (Dietitians of Canada 2010). Although this is a
positive development in that firms are voluntarily establishing industry guidelines
intended to protect children, these standards are only voluntary, and food packaging
is not considered advertising and thus is not subject to these rules. As such, licensed
characters such as Dora the Explorer, Sponge Bob Square Pants, Disney Princesses,
and the Simpsons can be found on many food products targeted to children, and
many of these products are high in sodium and/or sugar.
Globally, infant formulas must adhere to the international code of marketing of
breast-milk substitutes set forth by the WHO in 1981 to ensure that mothers are not
discouraged from breastfeeding (WHO 2015). But again this only pertains to
advertising, not to product packaging. In 2013, South Africa implemented
regulation R991 which prohibits the use of images of babies or any humans on the
packaging of infant formulas (SA Dept of Health 2013).
Similar to warning labels on non-food products, a warning label on less
healthy foods would not only inform the consumer about the potential risks of
consuming a product but could protect producers from liability. Text based explicit
warning labels are now being used for various food products in several countries.
43
Most countries in the EU require a warning label on foods containing synthetic dyes
(Perry 2010), and although Denmark was the first to implement mandatory warning
labels on energy drinks, the rest of the EU adopted the same labeling policy in 2014
(Meister 2014). In 2014, the California senate introduced a bill requiring warning
labels on sugar-sweetened beverages (Zuraw 2014), but the bill died in the Senate
Appropriations Committee in 2018 (Racker 2018). Chile and Ecuador both require
warning labels on certain food products that exceed a certain level of several
nutrients including sodium (Campbell et al 2014). Since the 1980’s, Finland has
required products containing more than a given level of salt to carry a high salt
warning, and this has resulted in many food companies reformulating their products
to lower their sodium content and subsequently avoid the warning label (Pietinen et
al 2008). In 2015 the New York City Health Department proposed that chain
restaurants be required to put a warning label on menu items containing more than
2300mg of sodium (Grynbaum 2015). Health Canada will soon be implementing a
warning label on food products that are high in sugar, sodium, and/or saturated fat
(Health Canada 2018), but how this will affect consumer’s food choices is yet
unknown, which makes the current research project particularly timely.
3.2.5 Previous studies on effectiveness of warning labels
In general, research on warnings is hampered by the fact that direct
observation of behaviour is difficult because the events in question are infrequent
and sporadic, there are ethical concerns with allowing potentially hazardous
behaviour to proceed, and because laboratory experiments which allow for
complete control of the situation may not be generalizable to real world settings
(Wogalter and Laughery 1996). As such, there is limited evidence as to the
effectiveness of warning labels, most of which are currently concerned with either
alcohol or tobacco consumption. In a 1998 review of empirical research, Stewart
and Martin (1994) found that warning labels are not so much persuasive as they are
informative to consumers, that consumers only selectively heed them, and that they
lose effectiveness with frequent use (both in terms of how many times they see a
warning on the same product and how often they see warning labels in general). In
44
a review of policies designed to reduce the harm caused by alcohol consumption,
Anderson et al (2009) found that warning labels only reduced the amount of alcohol
people intended to consume, but not how much they actually consumed. As
mentioned in the previous section, graphic warning labels on cigarette packages
have had some success in decreasing consumption (Sabbane et al 2009; Thrasher et
al 2007; O’Hegarty et al 2006).
Most of the evidence found pertaining to the effectiveness of explicit, text-
based warning labels on food packaging was published somewhat recently.
Lacanilao et al (2011) found that a warning label on snack foods (a text-based,
explicit warning generated specifically for the study) had heterogeneous effects
among consumers, specifically that the consumers policy makers would be hoping
to target are less responsive to the mechanism in question. In a study examining
how warning labels (such as “consumption of this product could lead to heart
disease”) vs. nutrient content labels (such as “one serving of this product contains
25% of the daily recommended amount of saturated fat”) affected food choices,
Bushman (1998) found that nutrient content labels were more effective when
dealing with credible and familiar risks such as fat content. With respect to sugar
sweetened beverages, Roberto et al (2016) found that significantly fewer parents
would purchase them for their children when they displayed a warning label.
VanEpps and Roberto (2016) also found that American adolescents were less likely
to purchase sugar sweetened beverages when a warning label was present. Arrua et
al (2017) found that both a traffic light label and a standardized Chilean warning
label were effective in affecting children’s choices of cookies and juice. In a study of
Brazilian adults, Khandpur et al (2018) found that a warning label was more
effective than a traffic light label in assisting people to identify the healthier product
and improving their understanding of excess nutrient content.
Also of interest are colour-coding and traffic-light style labels, but these could
be seen as recommendations or guidelines, rather than warnings. Three recent
studies comparing warning labels and traffic light style labels were found. In a
study comparing Brazilian consumer understanding and purchase intentions
between foods with warning labels and traffic light style labels, Khandpur et al
45
(2018) found that the warning labels were more effective in helping people
correctly identify the healthier product. Also comparing warning labels to traffic
light style labels, Arrua et al (2017) found that the two label mechanisms performed
equally well in enabling respondents to identify the healthiest product, both being
an improvement over no label mechanism. Similarly, Machin et al (2018) found no
significant difference in the healthfulness of choices between Chilean respondents
who saw traffic light style labels versus warning labels. It should be noted that
these studies focused on how these label mechanisms enabled consumers to identify
the healthier products; they did not explore how they would affect the probability
that people would purchase products with or without them. It is possible that an
explicit warning label could increase awareness and perceived seriousness among
consumers that over-consumption of a given product or nutrient could be harmful
to their (or their children’s) health. This study endeavors to better understand how
implementing a warning label on the front of food packaging will affect its likelihood
of being purchased via a choice experiment, the background of which is discussed
next.
3.2.6 Choice Experiment Design
One of the commonly used methods for eliciting consumer preferences for
product attributes (including label attributes such as warning labels and third party
certification logos) is to conduct a choice experiment, which is a type of stated
preference experiment. Many discrete choice experiments have been utilized in a
food product context. Balcombe et al (2009) used choice experiments to determine
consumer responses to the traffic light system on a basket of food products. Choice
experiments were used by Gracia et al (2009) to explore if consumers placed a
higher value on nutrition facts panels or nutrient claims. Mueller and Umberger
(2010) used choice experiments to determine consumer valuation of the “Pick the
Tick” health certification logo on both beef steaks and seafood. Also using a choice
experiment, Goddard et al (2012) elicited consumer WTP for the “Health CheckTM“
certification logo on turkey sandwiches.
46
Stated preference experiments are very useful in determining consumer
preferences for goods which are not available in the market. Revealed preference
data, when available for market goods, should be more accurate than stated
preference data, as it reveals actual purchases rather than hypothetical choices.
Given that there are currently no warning labels for food in Canada (although this
may soon change), revealed preference data is nonexistent. It should be noted that
there are currently breakfast cereals in Canada bearing the Whole Grain logo.
Because of the nature of choice experiments, they provide a thorough description of
tradeoffs respondents are willing to make between various product attributes, such
as price and nutritional quality, thereby revealing whether or not individuals are
sensitive to attribute levels or even to the attributes themselves; the attributes
present and their levels can both be adjusted to meet the researcher’s objective
(Adamowicz et al 1995, Dhar and Simonson 2003). A weakness of choice
experiments is that due to their lack of consequentiality, respondents may
inaccurately represent their sensitivity to the various attributes and the subsequent
estimations may not translate to the real market due to the differing number of
options available, prices, or attributes (Dhar and Simonson 2003, Adamowicz et al
1995). In addition, when answering a survey, participants often have strategic
incentives to answer in a certain way that may not reflect their true preferences
(Carson and Groves 2007). For example, if an individual is aware that the
government is considering imposing a warning label on foods and they’re
completing a choice experiment that includes warning labels on foods, they may
over-represent their sensitivity to the warning if they think the government should
impose them or under-represent their sensitivity if they oppose the idea.
One of the challenges in designing a choice experiment is balancing the ability
of respondents to trade off attributes with statistical efficiency (Johnston et al
2017). Standard consumer theory assumes that individuals are able to fully process
information, that they are perfectly aware of their preferences, and that they
consistently use this information to make choices between alternatives (Grafton et
al 2004). This is rarely the case in reality, especially when a product is unfamiliar or
when an overwhelming amount of information is given (Ohler et al 2000). Thus
47
some consideration in determining how many choice scenarios each individual is
given, the number of alternatives per scenario, and the number and levels of
attributes needs to take into account the limited amount of information a person can
process. If choice sets are too complex, meaningful results will be hard to obtain.
One of the most important things to determine is the number and levels of
attributes (Janssen and Bridges 2017). In a study examining attribute non-
attendance (when participants simply ignore certain attributes) Hensher et al
(2012) find that the range and levels of attributes may be such that to some
respondents, certain levels of an attribute may simply not matter, until a given
threshold is reached at which point the attribute is deemed relevant. In an effort to
decrease the cognitive burden on participants, de Bekker-Grob et al (2012) found
that in the health economics field, the mean number of attributes included in choice
experiments has decreased from 7 to 5. With regards to price levels, according to
Haab and McConnell (2002), the optimal levels should be close to the true mean
WTP. Given that WTP is generally unknown (or else the experiment would be
redundant), it must be estimated based on current prices and evidence. Hanley et al
(2005) found that range of the price vector in a choice experiment did not
significantly impact the estimated coefficients or WTP measures. Johnston et al
(2017) point out that investigators should choose price levels with consideration for
range and spacing, making sure that the amounts seem realistic to respondents.
Another issue is that of how many alternatives should be included in a choice set.
Deshazo and Fermo (2002) found that giving respondents more alternatives to
choose from initially decreased the variance, but once a certain number of
alternatives were reached, the increased complexity increased the overall variance.
Once the choice sets along with their attributes and levels have been
determined, the researcher still needs to decide how many choice sets each
respondent should answer. Most studies have respondents answer one to sixteen
choice sets, with the average being around eight (Bech et al 2011; Deshazo and
Fermo 2002). In a review of choice experiments used in health economics, de
Bekker-Grob et al (2012) found that the mean number of choice sets shown to each
participant has increased from 12 to 14.
48
Attribute levels are usually presented to respondents in a table, but in many
real-world food-purchasing situations, consumers have to discern a product’s
attributes by reading the packaging. Green and Srinivasan (1990) note that using
pictorial materials rather than paragraph descriptions make the task more engaging
for the respondent and provide a less ambiguous, easier way of conveying
information, allowing a greater number of attributes to be used without causing
statistical issues. Graphically represented choice sets are becoming very popular as
they more realistically portray what a consumer would be looking at purchasing in
an actual shopping scenario. Cherchi and Hensher (2015) note that the use of
images can be used to improve realism in stated preference experiments so long as
they are controlled to only allow for variation in the attributes of interest.
3.3 Objectives and Research Question
The overall objective of this dissertation is to evaluate the effectiveness of
potential government mandated policies to improve children’s diets, positively
impacting their long-term health and reducing the financial burden of diet-related
diseases on health care. This paper specifically aims to determine how parents of 8-
12 year old children would respond to an explicit text-based warning label, similar
to that proposed by Health Canada, on high sugar breakfast cereals. The main
objective is to determine how effective a warning label might be in reducing the
consumption of high sugar products as well as to see how the response to a warning
label differs between parents by individual specific characteristics such as income
or nutrition knowledge or by brand. As such, the parental willingness to pay for
products with and without warning labels are what will be measured using choice
experiments for breakfast cereals to determine whether a warning label is a strong
enough incentive to choose a less preferred but healthier brand. If parents prefer
products without warning labels and either switch away from products with
warning labels or choose them less frequently, positive dietary outcomes could be
elicited by mandating warning labels on products high in over-consumed nutrients.
49
3.4 Data
In order to address this objective, surveys were conducted primarily online
with parents as well as in person for a sub-sample, and included questions
pertaining to current consumption patterns, who makes food decisions, nutrition
knowledge, and a choice experiment where the main attribute of interest was the
presence of an explicit text-based warning label. Ten of the most highly purchased
cereal products by adults aged 25-49 in Canada (as identified by the Print
Measurement Bureau from 2009-2015) were used in the choice experiments to
ensure familiar products were under consideration. In order to keep it from being
obvious to participants what our attribute of interest is, we also included the “Whole
Grain Council” logo as a label attribute in addition to the proposed warning label. It
is of interest to see how consumers respond to this whole grain logo since Mancino
and Buzby (2005) found that most Americans were not consuming the
recommended level of whole grains, and it is likely this is also true for Canadians.
Price was also varied so that sensitivity to price as well as relative importance of
warning label to price could be assessed. It is possible that some families would
want to primarily avoid products with warning labels, but for those with lower
incomes, price could be the most important determinant in their choices.
It is important to consider that multiple breakfast cereals are often purchased
at the same time, sometimes because the consumer desires variety, they are
purchasing it for different members of the household, or just so they have a large
enough quantity to last until the subsequent shopping trip. As such, a traditional
discrete choice experiment where the participant chooses only one from a subset of
choices may be inappropriate to examine breakfast cereal choices. In addition,
changing the product attributes might change the relative proportions of cereals
they choose rather than influencing them to switch from one type to another for all
of their purchases. One example in the breakfast cereal context could be that if a
mother is unaware of the high amount of sugar in cereal x, she purchases it for her
children to eat every morning, but if a warning label alerts her to the high amount of
sugar, she may substitute to a healthier product for the weekdays but still allow her

50
children to eat product x on weekends or for snacks. As such, rather than asking
participants to choose either product A or B, participants will be shown a condensed
grocery aisle which is composed of ten of the most frequently consumed cereals,
then asked to imagine that they are purchasing all of the cereal for their household
for one month, and to choose the quantity of each to purchase. The resulting data
has non-negative integer values for each cereal along with the product specific
attributes associated with these frequency choices.
This type of choice data is called ‘frequency’ data and can be modeled using the
traditional random utility framework but rather than the dependent variable being
limited to 0 or 1, it can take any nonnegative integer value (Greene 2007).
Frequency choice analysis is often used in research examining recreation site
choices where data on number of visits to sites is available.
3.4.1 Questionnaire Design
The objectives of this study are to determine the effectiveness of warning
labels on less healthy food products and how it differs between parents by
individual specific characteristics such as nutrition knowledge and income and
whether it is consistent from one brand to another. The choice experiment portion
of the survey elicited information about sensitivity to warning labels and is
discussed in the subsequent section. The parent and child surveys can be found in
Appendices 3A and 3B respectively.
The nutrition knowledge questions are a subset of the General Nutrition
Knowledge Questionnaire for Adults developed by Parmenter and Wardle (1999)
which was demonstrated as a reliable and valid measure of nutrition knowledge
among adults in the UK. Within this scale are 4 subscales (dietary
recommendations, sources of nutrients, choosing everyday foods, and diet-disease
relationships) all of which demonstrated test-retest reliability over 0.7 and a
Cronbach’s alpha between 0.7-0.97 for internal consistency. For this survey, we
used the dietary recommendations and sources of nutrients subscales, as did
Carrillo et al (2012). A score of 1 was assigned to each correct response and a score
of 0 assigned to each incorrect response to generate a total nutrition knowledge
51
score, a method employed by several other studies (Cooke and Papadaki 2014;
Carrillo et al 2012; Cannoosamy et al 2014; Drichoutis et al 2005). Some changes
were made to make the foods used in the questionnaire more culturally appropriate
for Canadians, for example switching blood sausage to salami. In total we used 14
questions, several of which had multiple parts, to address knowledge about salt,
sugar, fat, protein, and fibre, the sources of these nutrients, the consequences of
over- or under-consuming them, and foods that according to nutritionists should be
eaten more or less often. Questions asked and descriptive statistics of responses are
discussed further in section 3.4.4.2.
The questionnaire also had questions about whether the respondent’s child
received an allowance, whether they were ever given money with which to purchase
food, and the foods typically purchased autonomously by the child. Grocery
shopping habits and the child’s input on grocery purchases were addressed, as were
typical breakfast cereal purchases for the household. General behaviours including
the average amount of physical activity and screen time the child had per week and
their propensity to try new foods were elicited. The parent’s use of labels (such as
nutrition facts on food packaging and warnings on toys) was explored. Finally, the
decision making dynamics between the parents and children were addressed by
asking which party (or possibly both) make the choices in various meal scenarios,
incorporating different meals, locations, and days of the week.
A parallel questionnaire was also designed to be completed by the children of
a subset (n=30) of the participants. It contained similar questions but was shorter
and written at a lower reading level. This was done in order to compare how
children and parents in the same family would respond to some of the purchasing
behaviour questions as well as to the warning label in the choice experiment.
3.4.2 Choice Experiment Design
As described in the previous section, a binary discrete choice experiment is
likely not the most realistic representation of breakfast cereal purchasing decisions,
and as such a multiple discrete continuous choice experiment was constructed
where respondents could purchase positive quantities of multiple products. This
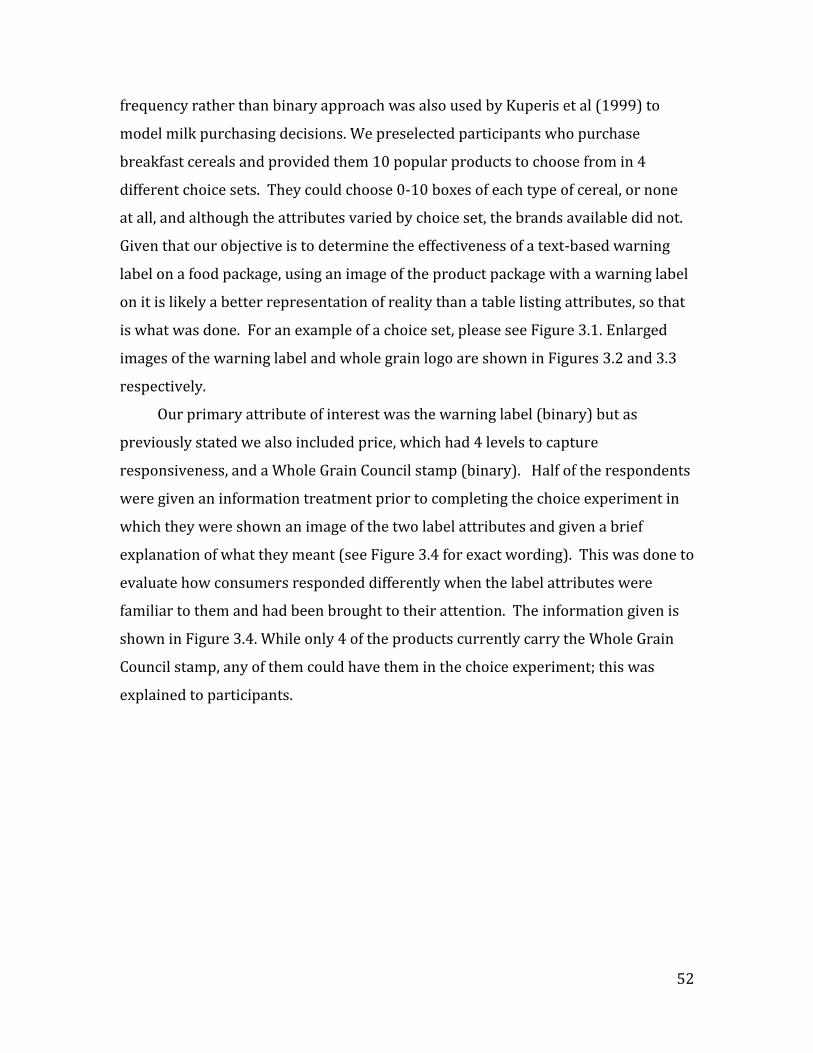
52
frequency rather than binary approach was also used by Kuperis et al (1999) to
model milk purchasing decisions. We preselected participants who purchase
breakfast cereals and provided them 10 popular products to choose from in 4
different choice sets. They could choose 0-10 boxes of each type of cereal, or none
at all, and although the attributes varied by choice set, the brands available did not.
Given that our objective is to determine the effectiveness of a text-based warning
label on a food package, using an image of the product package with a warning label
on it is likely a better representation of reality than a table listing attributes, so that
is what was done. For an example of a choice set, please see Figure 3.1. Enlarged
images of the warning label and whole grain logo are shown in Figures 3.2 and 3.3
respectively.
Our primary attribute of interest was the warning label (binary) but as
previously stated we also included price, which had 4 levels to capture
responsiveness, and a Whole Grain Council stamp (binary). Half of the respondents
were given an information treatment prior to completing the choice experiment in
which they were shown an image of the two label attributes and given a brief
explanation of what they meant (see Figure 3.4 for exact wording). This was done to
evaluate how consumers responded differently when the label attributes were
familiar to them and had been brought to their attention. The information given is
shown in Figure 3.4. While only 4 of the products currently carry the Whole Grain
Council stamp, any of them could have them in the choice experiment; this was
explained to participants.
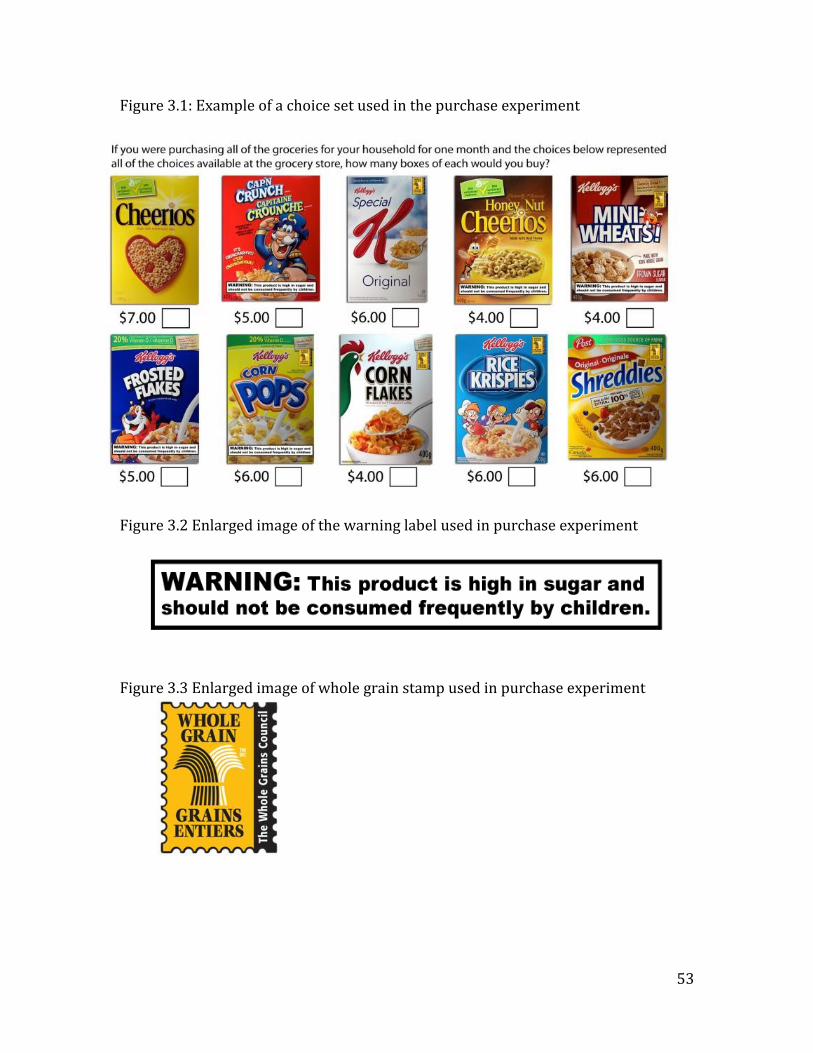
53
Figure 3.1: Example of a choice set used in the purchase experiment
Figure 3.2 Enlarged image of the warning label used in purchase experiment
Figure 3.3 Enlarged image of whole grain stamp used in purchase experiment

54
Figure 3.4 Information given along with labels prior to respondents completing the choice experiment for those receiving the information treatment
Since we were showing respondents a grocery aisle with 10 options, which is
much more to consider than the typical 2 or 3 used in most discrete choice
experiments, only 4 choice sets were given. This number was determined by pilot
testing the choice experiment; most respondents stopped paying attention around
the fourth to sixth choice set, either not completing the rest or simply choosing 1 for
everything. The full experimental design (an efficient design generated in Ngene)
used for the main data collection, along with the estimates used to generate it, is
shown in Appendix 3C. There were 16 choice sets in total broken down into 4
blocks of 4, 2 of which received the information treatment. Details about the
attributes and levels are shown in Table 3.1.
Table 3.1 Attribute levels in choice experiment Attribute Levels Restrictions
Price $4, $5, $6, $7 None – any price could appear on any product.
Warning label On/off Could only appear on products that are
over 20% sugar (by weight).
Whole grain logo On/off None – could appear on any product even
if the product doesn’t currently qualify
for it. At the time the experiment was
conducted, 4 of the included products were qualified to (and did) carry it.
Whole Grain Stamp: The following Whole Grain Stamp was created by the Whole Grains Council to
indicate that the product bearing it contains at least 8 grams of whole grains per serving. In this survey,
we are occasionally applying the Whole Grain Stamp to any breakfast cereal, although in reality they
may not all qualify for it.
Warning Label: The World Health Organization has stated that breakfast cereals containing more than
15 grams of sugar in a 100 gram portion should not be marketed to children. In this survey, we are
occasionally applying the following high-sugar warning label to breakfast cereals that contain 20 grams
or more of sugar in a 100 gram portion.
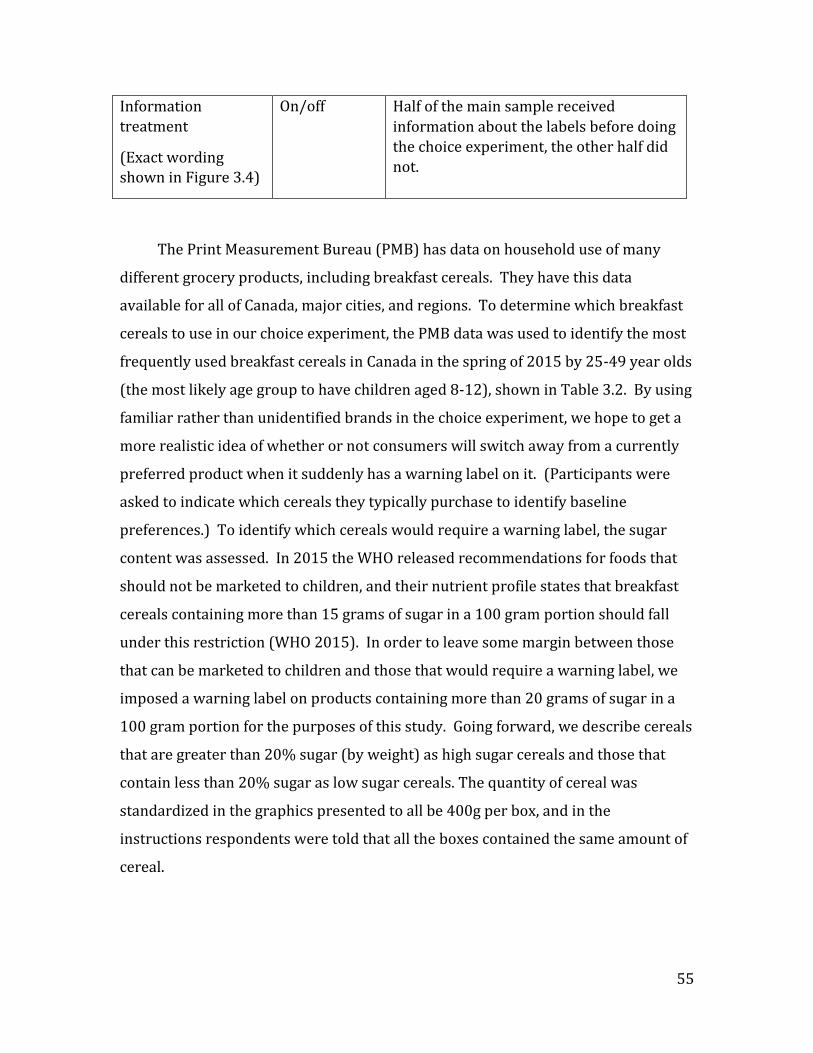
55
Information
treatment
(Exact wording shown in Figure 3.4)
On/off Half of the main sample received
information about the labels before doing
the choice experiment, the other half did
not.
The Print Measurement Bureau (PMB) has data on household use of many
different grocery products, including breakfast cereals. They have this data
available for all of Canada, major cities, and regions. To determine which breakfast
cereals to use in our choice experiment, the PMB data was used to identify the most
frequently used breakfast cereals in Canada in the spring of 2015 by 25-49 year olds
(the most likely age group to have children aged 8-12), shown in Table 3.2. By using
familiar rather than unidentified brands in the choice experiment, we hope to get a
more realistic idea of whether or not consumers will switch away from a currently
preferred product when it suddenly has a warning label on it. (Participants were
asked to indicate which cereals they typically purchase to identify baseline
preferences.) To identify which cereals would require a warning label, the sugar
content was assessed. In 2015 the WHO released recommendations for foods that
should not be marketed to children, and their nutrient profile states that breakfast
cereals containing more than 15 grams of sugar in a 100 gram portion should fall
under this restriction (WHO 2015). In order to leave some margin between those
that can be marketed to children and those that would require a warning label, we
imposed a warning label on products containing more than 20 grams of sugar in a
100 gram portion for the purposes of this study. Going forward, we describe cereals
that are greater than 20% sugar (by weight) as high sugar cereals and those that
contain less than 20% sugar as low sugar cereals. The quantity of cereal was
standardized in the graphics presented to all be 400g per box, and in the
instructions respondents were told that all the boxes contained the same amount of
cereal.
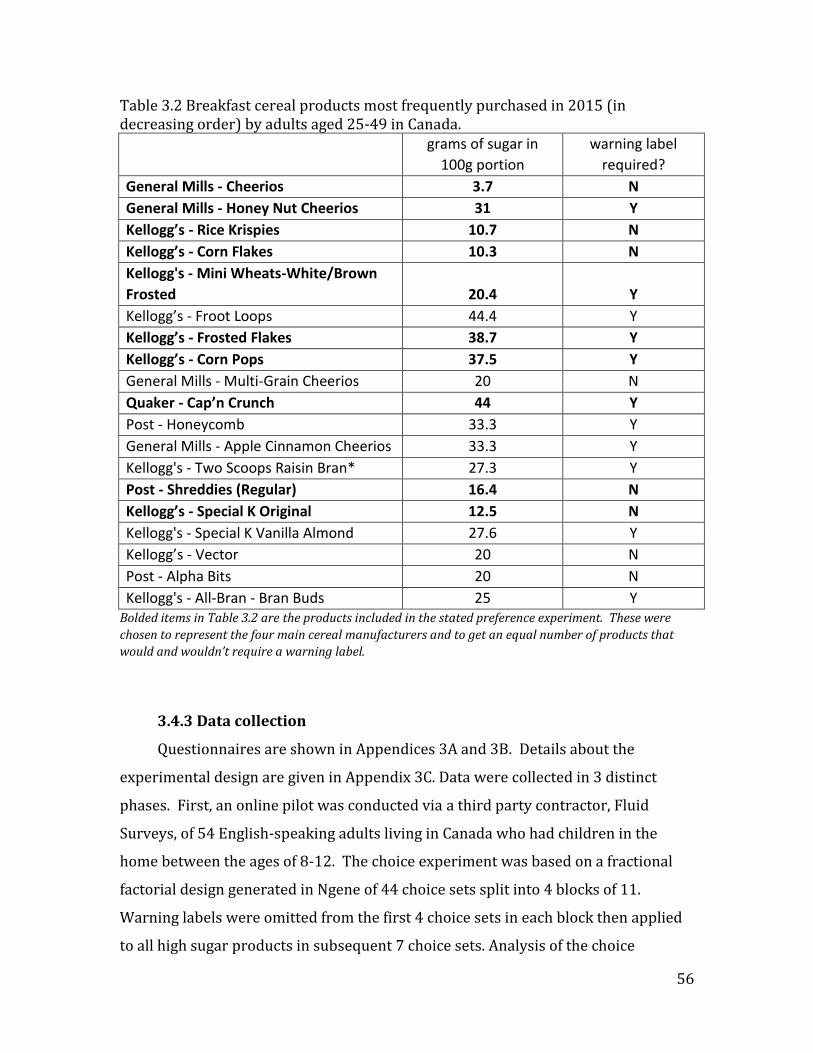
56
Table 3.2 Breakfast cereal products most frequently purchased in 2015 (in decreasing order) by adults aged 25-49 in Canada.
grams of sugar in
100g portion
warning label
required?
General Mills - Cheerios 3.7 N
General Mills - Honey Nut Cheerios 31 Y
Kellogg’s - Rice Krispies 10.7 N
Kellogg’s - Corn Flakes 10.3 N
Kellogg's - Mini Wheats-White/Brown
Frosted 20.4 Y
Kellogg’s - Froot Loops 44.4 Y
Kellogg’s - Frosted Flakes 38.7 Y
Kellogg’s - Corn Pops 37.5 Y
General Mills - Multi-Grain Cheerios 20 N
Quaker - Cap’n Crunch 44 Y
Post - Honeycomb 33.3 Y
General Mills - Apple Cinnamon Cheerios 33.3 Y
Kellogg's - Two Scoops Raisin Bran* 27.3 Y
Post - Shreddies (Regular) 16.4 N
Kellogg’s - Special K Original 12.5 N
Kellogg's - Special K Vanilla Almond 27.6 Y
Kellogg’s - Vector 20 N
Post - Alpha Bits 20 N
Kellogg's - All-Bran - Bran Buds 25 Y Bolded items in Table 3.2 are the products included in the stated preference experiment. These were
chosen to represent the four main cereal manufacturers and to get an equal number of products that
would and wouldn’t require a warning label.
3.4.3 Data collection
Questionnaires are shown in Appendices 3A and 3B. Details about the
experimental design are given in Appendix 3C. Data were collected in 3 distinct
phases. First, an online pilot was conducted via a third party contractor, Fluid
Surveys, of 54 English-speaking adults living in Canada who had children in the
home between the ages of 8-12. The choice experiment was based on a fractional
factorial design generated in Ngene of 44 choice sets split into 4 blocks of 11.
Warning labels were omitted from the first 4 choice sets in each block then applied
to all high sugar products in subsequent 7 choice sets. Analysis of the choice
57
experiment data indicated that respondents were not noticing (or reacting to) the
warning label or whole grain logo and were given too many choice sets. Follow up
questions in the pilot phase asking respondents what label attributes they noticed in
the choice experiment images showed that about 80% of respondents hadn’t
noticed the warning labels at all. Additionally, after around 4 - 6 choice sets
respondents either stopped answering the choice sets or simply chose 1 of each
product. With these findings, it was decided to make the size of the warning label
and whole grain logos larger relative to the size of the cereal boxes, as well as to
limit the number of choice sets each respondent received to 4. The coefficient
estimates from the pilot were used as priors to generate an efficient experimental
design in Ngene for subsequent rounds of data collection (shown in Table 3C.1).
The second round of data collection was conducted in person at the Saville
Community Sports Centre on the University of Alberta South Campus. Thirty
families were recruited to participate, each having one parent complete the survey
as well as at least one child aged 8-12 complete the child’s version (both versions
included the choice experiment). The parent portion will be discussed descriptively
in this section. An efficient design of 4 blocks of 4 choice sets was generated in
Ngene which omitted warning labels from the first choice sets. One of these blocks
of choice sets was given to each respondent. Warning labels were applied to all high
sugar products in choice sets 2-4. Price and whole grain logo were determined by
experimental design. Estimates from this round of data collection were combined
with those from the pilot round to update the prior estimates in generating another
efficient design of 16 choice sets in Ngene for the third round of data collection
(shown in Table 3C.1 in Appendix 3C).
The third round of data collection was conducted online through Survey
Gizmo with 550 English-speaking Canadian parents of children aged 8-12. Survey
Gizmo maintains a panel of adults across Canada, which is what our sample was
drawn from. It should be noted that while the survey was only offered in English,
panel members from Quebec weren’t prevented from participating. Qualifying
questions were included at the beginning of the survey to ensure that respondents
had children in the correct age range. The sample was split into 2 groups, one of
58
which received an information treatment before the choice experiment, showing
and explaining the warning label (Figure 3.2) and whole grain logo (Figure 3.3). The
other group did not receive any information about the logos at any point in the
survey. A description of which choice sets were contained in each block and which
blocks received the information treatment are given in Table 3C.2 in Appendix 3C. In
the experimental design of 4 blocks of 4 choice sets, warning labels were allowed to
appear in any choice set on any of the 5 high sugar products. The presence of a
whole grain logo and the price level were again determined by the experimental
design. Only main effects were considered in the experimental design; no
interactions were included. A summary of how many times each brand was shown
in a choice set with the various combinations of attributes is shown in Table 3C.3,
Appendix 3C. The full experimental design is shown in Table 3C.4. Unless otherwise
noted, the main sample is what is used for subsequent analysis.
3.4.4 Descriptive Statistics
For the full questionnaire given to parents (including information treatment,
full wording of questions, and response options), please see Appendix 3A. The
questionnaire given to the children for the in-person subsample is in Appendix 3B.
Table 3.3 describes the different samples based on how participants responded to
items in the questionnaire.
All samples had an average age of around 39 years old and had more women
than men, especially the in-person sample which was 84% women. Most families
had 2 adults and 2 - 3 children in the household. The in-person group had a slightly
higher average education level although all were between three (college or technical
diploma) and four (undergraduate degree). The household income level was much
higher for the in-person group at $155,926 than for the pilot and main samples.
Compared to the Canadian census, our sample had more two parent and multiple
children households and higher income and education levels. Approximately half of
families in our sample give their children an allowance, the most being 66% in the
no information treatment of the main sample, with the average amount being much
higher in the pilot sample at $11.90/week. Between 32% and 63% of parents say
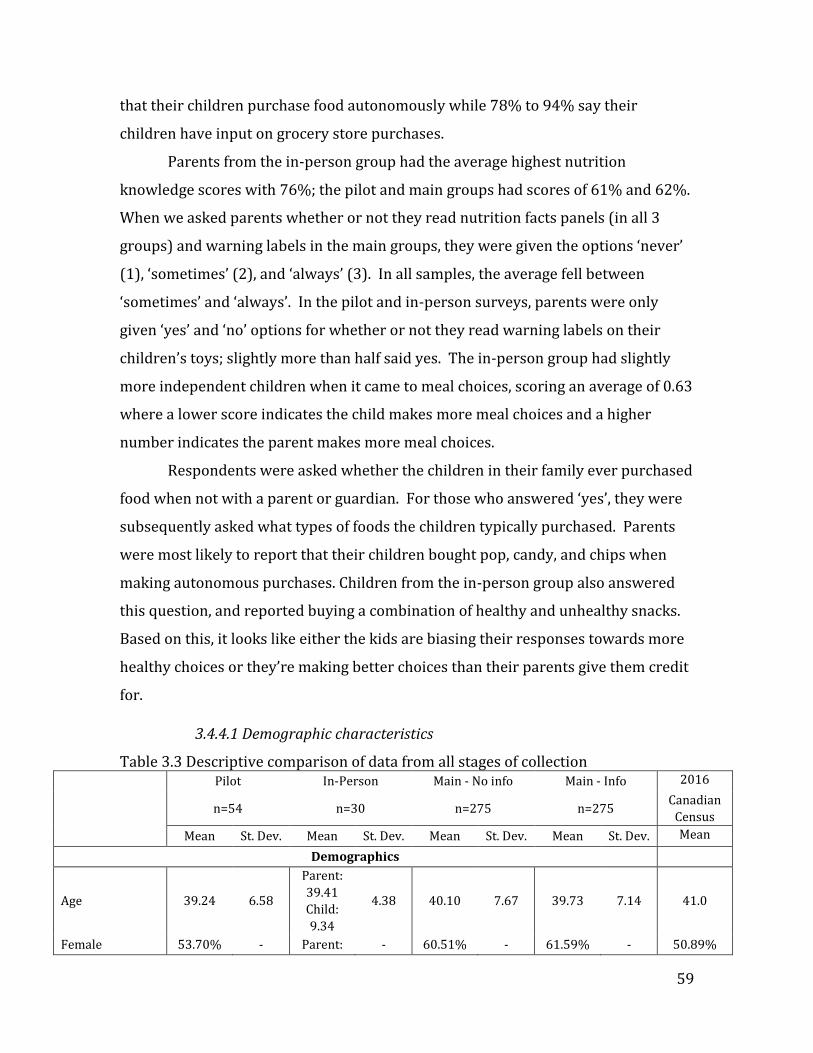
59
that their children purchase food autonomously while 78% to 94% say their
children have input on grocery store purchases.
Parents from the in-person group had the average highest nutrition
knowledge scores with 76%; the pilot and main groups had scores of 61% and 62%.
When we asked parents whether or not they read nutrition facts panels (in all 3
groups) and warning labels in the main groups, they were given the options ‘never’
(1), ‘sometimes’ (2), and ‘always’ (3). In all samples, the average fell between
‘sometimes’ and ‘always’. In the pilot and in-person surveys, parents were only
given ‘yes’ and ‘no’ options for whether or not they read warning labels on their
children’s toys; slightly more than half said yes. The in-person group had slightly
more independent children when it came to meal choices, scoring an average of 0.63
where a lower score indicates the child makes more meal choices and a higher
number indicates the parent makes more meal choices.
Respondents were asked whether the children in their family ever purchased
food when not with a parent or guardian. For those who answered ‘yes’, they were
subsequently asked what types of foods the children typically purchased. Parents
were most likely to report that their children bought pop, candy, and chips when
making autonomous purchases. Children from the in-person group also answered
this question, and reported buying a combination of healthy and unhealthy snacks.
Based on this, it looks like either the kids are biasing their responses towards more
healthy choices or they’re making better choices than their parents give them credit
for.
3.4.4.1 Demographic characteristics
Table 3.3 Descriptive comparison of data from all stages of collection
Pilot In-Person Main - No info Main - Info 2016
n=54 n=30 n=275 n=275 Canadian
Census
Mean St. Dev. Mean St. Dev. Mean St. Dev. Mean St. Dev. Mean
Demographics
Age 39.24 6.58
Parent:
39.41
Child:
9.34
4.38 40.10 7.67 39.73 7.14 41.0
Female 53.70% - Parent: - 60.51% - 61.59% - 50.89%
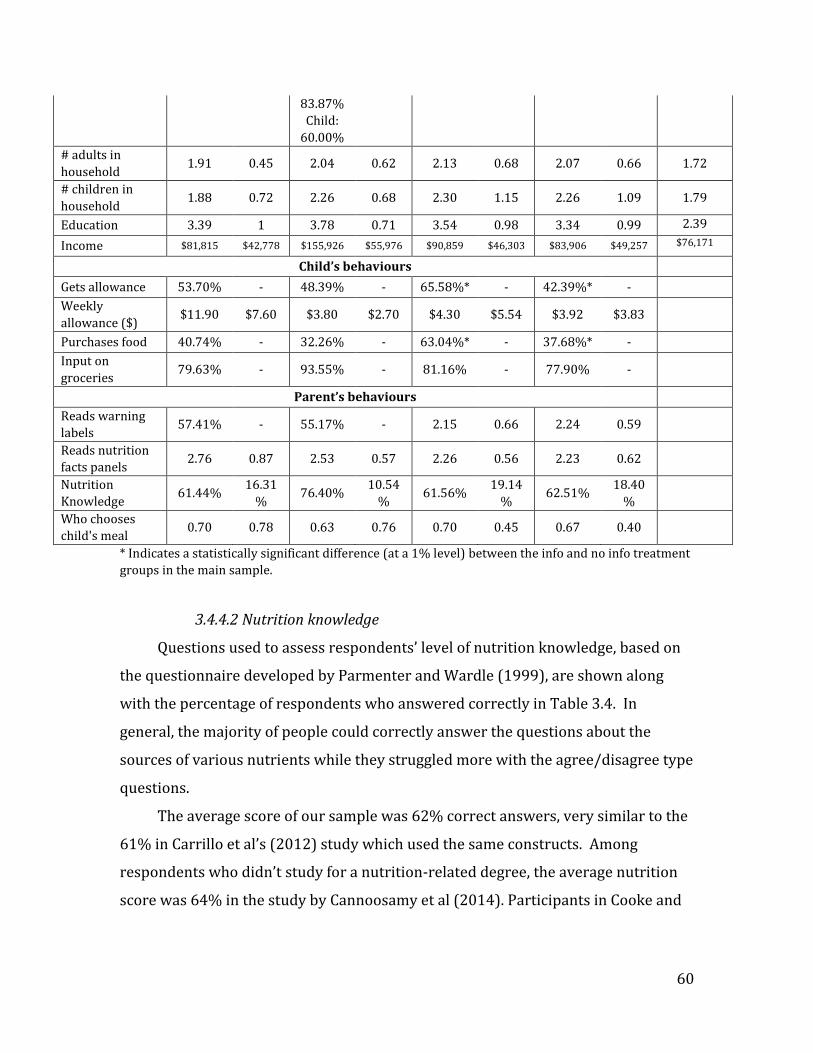
60
83.87%
Child:
60.00%
# adults in
household 1.91 0.45 2.04 0.62 2.13 0.68 2.07 0.66 1.72
# children in
household 1.88 0.72 2.26 0.68 2.30 1.15 2.26 1.09 1.79
Education 3.39 1 3.78 0.71 3.54 0.98 3.34 0.99 2.39
Income $81,815 $42,778 $155,926 $55,976 $90,859 $46,303 $83,906 $49,257 $76,171
Child’s behaviours
Gets allowance 53.70% - 48.39% - 65.58%* - 42.39%* -
Weekly
allowance ($) $11.90 $7.60 $3.80 $2.70 $4.30 $5.54 $3.92 $3.83
Purchases food 40.74% - 32.26% - 63.04%* - 37.68%* -
Input on
groceries 79.63% - 93.55% - 81.16% - 77.90% -
Parent’s behaviours
Reads warning
labels 57.41% - 55.17% - 2.15 0.66 2.24 0.59
Reads nutrition
facts panels 2.76 0.87 2.53 0.57 2.26 0.56 2.23 0.62
Nutrition
Knowledge 61.44%
16.31
% 76.40%
10.54
% 61.56%
19.14
% 62.51%
18.40
%
Who chooses
child's meal 0.70 0.78 0.63 0.76 0.70 0.45 0.67 0.40
* Indicates a statistically significant difference (at a 1% level) between the info and no info treatment
groups in the main sample.
3.4.4.2 Nutrition knowledge
Questions used to assess respondents’ level of nutrition knowledge, based on
the questionnaire developed by Parmenter and Wardle (1999), are shown along
with the percentage of respondents who answered correctly in Table 3.4. In
general, the majority of people could correctly answer the questions about the
sources of various nutrients while they struggled more with the agree/disagree type
questions.
The average score of our sample was 62% correct answers, very similar to the
61% in Carrillo et al’s (2012) study which used the same constructs. Among
respondents who didn’t study for a nutrition-related degree, the average nutrition
score was 64% in the study by Cannoosamy et al (2014). Participants in Cooke and

61
Papadaki’s (2014) study had an average nutrition score of 65% while the average in
the study by Drichoutis et al (2015) was 58%.
Table 3.4 Summary of nutrition knowledge questions and scores
Question
Proportion of correct
responses
Do you think health experts recommend that people should be eating more,
the same amount, or less of these foods?
Vegetables 74.1%
Sugary foods 75.0%
Meat 53.8%
Starch foods 34.6%
Fatty foods 69.6%
High fibre foods 67.2%
Fruit 71.6%
Salty foods 67.8%
Do you think these are high or low in sugar?
Peanuts 69.0%
Unflavoured yogurt 73.6%
Ice cream 87.5%
Orange juice 71.6%
Ketchup 69.9%
Do you think these are high or low in fat?
Pasta (without sauce) 58.2%
Baked beans 60.7%
Salami 74.1%
Honey 67.0%
Hard boiled eggs 62.5%
Nuts 52.4%
Cottage cheese 36.6%
Polyunsaturated margarine 61.2%
Do you think these are high or low in salt?
Sausages 81.5%
Pasta (without sauce) 65.2%
Red meat 58.9%
Frozen vegetables 71.9%
Cheese 57.2%
Canned soup 81.0%
Do you think these are high or low in protein?
Chicken 85.0%
Cheese 63.9%
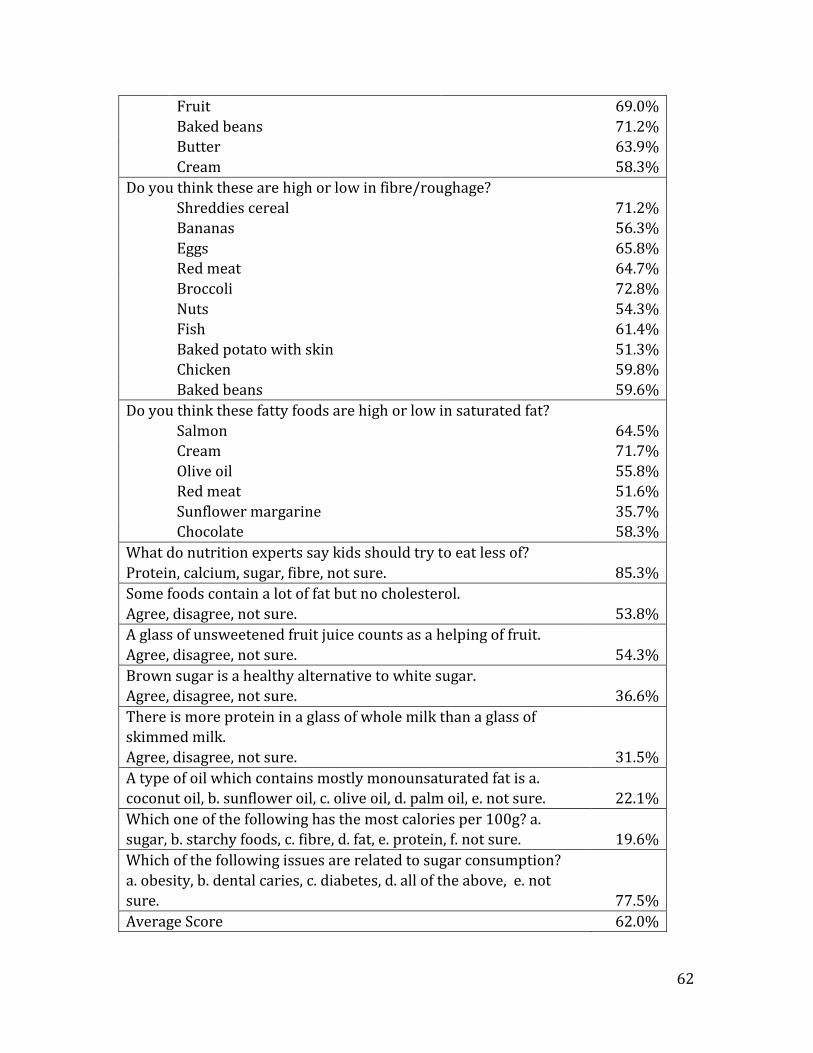
62
Fruit 69.0%
Baked beans 71.2%
Butter 63.9%
Cream 58.3%
Do you think these are high or low in fibre/roughage?
Shreddies cereal 71.2%
Bananas 56.3%
Eggs 65.8%
Red meat 64.7%
Broccoli 72.8%
Nuts 54.3%
Fish 61.4%
Baked potato with skin 51.3%
Chicken 59.8%
Baked beans 59.6%
Do you think these fatty foods are high or low in saturated fat?
Salmon 64.5%
Cream 71.7%
Olive oil 55.8%
Red meat 51.6%
Sunflower margarine 35.7%
Chocolate 58.3%
What do nutrition experts say kids should try to eat less of?
Protein, calcium, sugar, fibre, not sure. 85.3%
Some foods contain a lot of fat but no cholesterol.
Agree, disagree, not sure. 53.8%
A glass of unsweetened fruit juice counts as a helping of fruit.
Agree, disagree, not sure. 54.3%
Brown sugar is a healthy alternative to white sugar.
Agree, disagree, not sure. 36.6%
There is more protein in a glass of whole milk than a glass of
skimmed milk.
Agree, disagree, not sure. 31.5%
A type of oil which contains mostly monounsaturated fat is a.
coconut oil, b. sunflower oil, c. olive oil, d. palm oil, e. not sure. 22.1%
Which one of the following has the most calories per 100g? a.
sugar, b. starchy foods, c. fibre, d. fat, e. protein, f. not sure. 19.6%
Which of the following issues are related to sugar consumption?
a. obesity, b. dental caries, c. diabetes, d. all of the above, e. not
sure. 77.5%
Average Score 62.0%
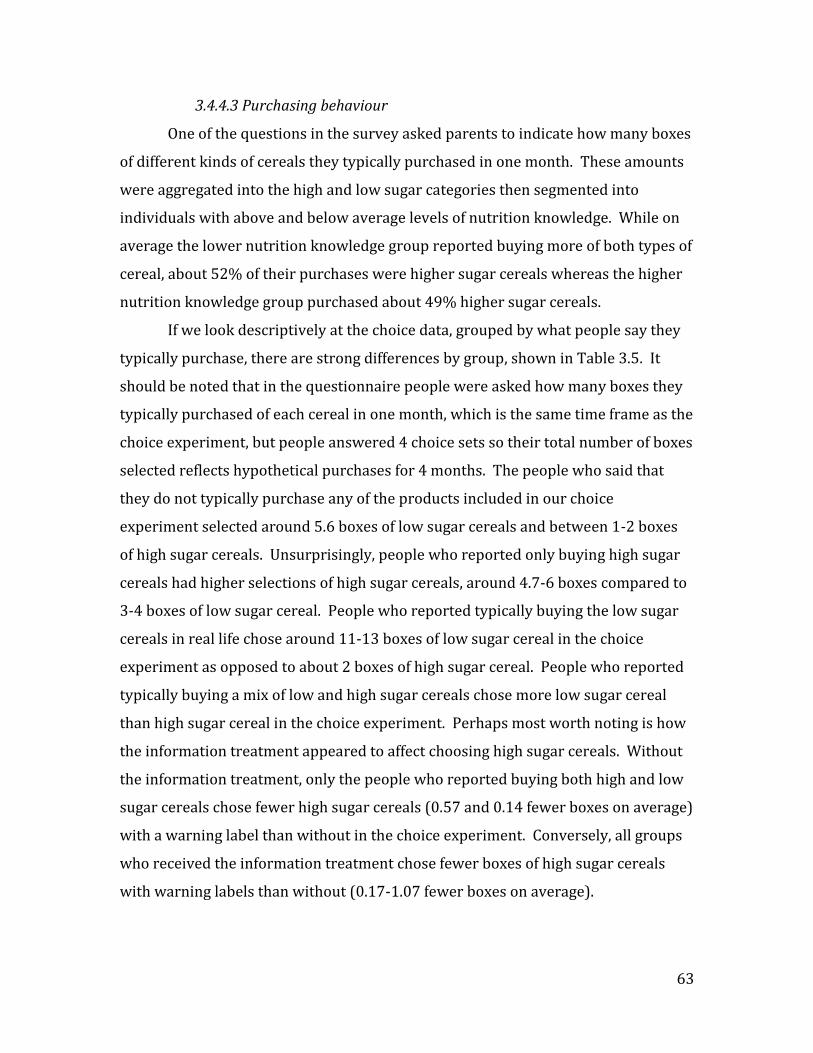
63
3.4.4.3 Purchasing behaviour
One of the questions in the survey asked parents to indicate how many boxes
of different kinds of cereals they typically purchased in one month. These amounts
were aggregated into the high and low sugar categories then segmented into
individuals with above and below average levels of nutrition knowledge. While on
average the lower nutrition knowledge group reported buying more of both types of
cereal, about 52% of their purchases were higher sugar cereals whereas the higher
nutrition knowledge group purchased about 49% higher sugar cereals.
If we look descriptively at the choice data, grouped by what people say they
typically purchase, there are strong differences by group, shown in Table 3.5. It
should be noted that in the questionnaire people were asked how many boxes they
typically purchased of each cereal in one month, which is the same time frame as the
choice experiment, but people answered 4 choice sets so their total number of boxes
selected reflects hypothetical purchases for 4 months. The people who said that
they do not typically purchase any of the products included in our choice
experiment selected around 5.6 boxes of low sugar cereals and between 1-2 boxes
of high sugar cereals. Unsurprisingly, people who reported only buying high sugar
cereals had higher selections of high sugar cereals, around 4.7-6 boxes compared to
3-4 boxes of low sugar cereal. People who reported typically buying the low sugar
cereals in real life chose around 11-13 boxes of low sugar cereal in the choice
experiment as opposed to about 2 boxes of high sugar cereal. People who reported
typically buying a mix of low and high sugar cereals chose more low sugar cereal
than high sugar cereal in the choice experiment. Perhaps most worth noting is how
the information treatment appeared to affect choosing high sugar cereals. Without
the information treatment, only the people who reported buying both high and low
sugar cereals chose fewer high sugar cereals (0.57 and 0.14 fewer boxes on average)
with a warning label than without in the choice experiment. Conversely, all groups
who received the information treatment chose fewer boxes of high sugar cereals
with warning labels than without (0.17-1.07 fewer boxes on average).
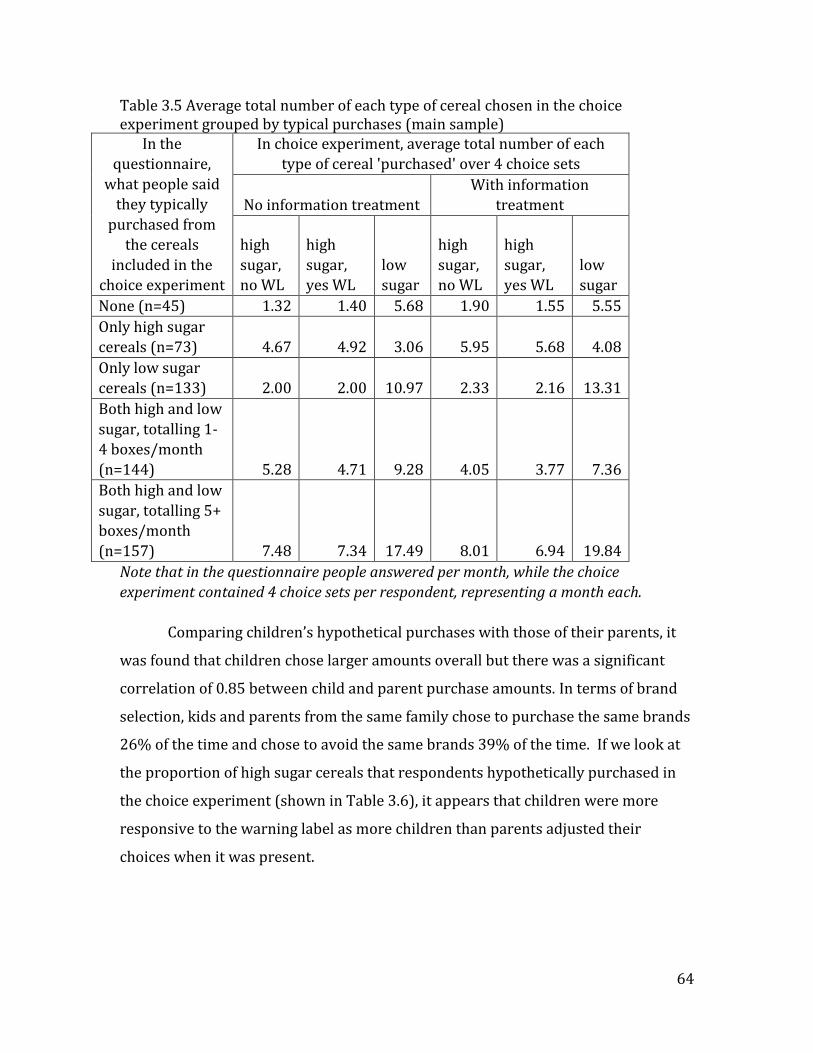
64
Table 3.5 Average total number of each type of cereal chosen in the choice experiment grouped by typical purchases (main sample)
In the
questionnaire,
what people said
they typically
purchased from
the cereals
included in the
choice experiment
In choice experiment, average total number of each
type of cereal 'purchased' over 4 choice sets
No information treatment
With information
treatment
high
sugar,
no WL
high
sugar,
yes WL
low
sugar
high
sugar,
no WL
high
sugar,
yes WL
low
sugar
None (n=45) 1.32 1.40 5.68 1.90 1.55 5.55
Only high sugar
cereals (n=73) 4.67 4.92 3.06 5.95 5.68 4.08
Only low sugar
cereals (n=133) 2.00 2.00 10.97 2.33 2.16 13.31
Both high and low
sugar, totalling 1-
4 boxes/month
(n=144) 5.28 4.71 9.28 4.05 3.77 7.36
Both high and low
sugar, totalling 5+
boxes/month
(n=157) 7.48 7.34 17.49 8.01 6.94 19.84
Note that in the questionnaire people answered per month, while the choice
experiment contained 4 choice sets per respondent, representing a month each.
Comparing children’s hypothetical purchases with those of their parents, it
was found that children chose larger amounts overall but there was a significant
correlation of 0.85 between child and parent purchase amounts. In terms of brand
selection, kids and parents from the same family chose to purchase the same brands
26% of the time and chose to avoid the same brands 39% of the time. If we look at
the proportion of high sugar cereals that respondents hypothetically purchased in
the choice experiment (shown in Table 3.6), it appears that children were more
responsive to the warning label as more children than parents adjusted their
choices when it was present.
65
Table 3.6: Breakdown of high sugar breakfast cereals chosen in choice experiment by children and parents. Parents Children
% high sugar cereals without warning label 43% 49%
% high sugar cereals with warning label 47% 42%
# of respondents who chose fewer high sugar
cereals when warning labels were added
3 14
The choice experiment data were examined descriptively to identify trends
in the data before analysis was conducted and it was found that approximately 25%
of the sample made the exact same breakfast cereal choices in each of the 4 choice
sets despite varying prices and label attributes. Analysis was thus conducted using
two samples; all of the respondents from the main round of data collection
(henceforth referred to as the whole sample – WS) and the respondents from the
main round of data collection whose answers did not stay exactly the same for all
four choice experiments (henceforth referred to as the reduced sample – RS).
3.5 Analysis and Results
3.5.1 Empirical Model
To analyze the choice experiment data, random utility theory is employed.
Random utility theory is used to elicit non-market valuations for attributes which
cannot be purchased independently of each other. It builds on Lancaster’s (1966)
theory which considers goods to be bundles of attributes rather than homogeneous.
The main assumption of the random utility model is that each respondent will select
the option (or combination of options) from the set of alternatives that gives them
the most utility. The attributes of which the chosen alternative is comprised
determines the utility derived from the given option. This utility can be expressed
as:
Uj = U(Xj)
where X is the vector of attributes in an alternative. Alternative j will be chosen if Uj
> Ui for all j i. The researcher will have information about the attributes (X) and
some information about the respondent’s (i) characteristics (Ai). The researcher

66
will not, however, have complete knowledge of the individual’s decision-making
process. The systematic utility (Vj) will be expressed as:
Vij = V(Xj, Ai)
where (Uij Vij). Therefore, utility must be distilled down to a systematic
component (Vij) and a random component (ij) which is expressed as:
Uij = V(Xj, Ai) + ij
The above random utility estimation can be conducted using a multinomial
logit model where utility from the ith individual facing a choice among j alternatives
can be represented as (Verbeek 2008 pg.221):
Uij = β’iVij + εij
where βi is a vector of parameters and Vij is the systematic portion of the individual’s
utility function. Εij is the error term.
The most general form of the multinomial logit probability is (Greene 2007 pg.
N3-18):
𝑃(𝑗|𝑦𝑖) = exp (∝𝑗𝑖+ 𝜃𝑖
′𝑧𝑖 + 𝜙𝑖′𝑓𝑗𝑖 + 𝛽𝑗𝑖
′ 𝑥𝑗𝑖)
∑ exp (∝𝑗𝑖+ 𝜃𝑖′𝑧𝑖 + 𝜙𝑖
′𝑓𝑗𝑖 + 𝛽𝑗𝑖′ 𝑥𝑗𝑖)𝐽
𝑗=1
Where U(j,i) = ∝ji+ θ'jzi + ϕ'
jfji + β'jixji, j=1,…,Ji alternatives in individual i's choice
set,
∝𝑗𝑖 is an alternative specific constant which may be fixed or random, ∝𝑗𝑖= 0,
Ɵj is a vector of nonrandom (fixed) coefficients, 𝜃′𝑗 = 0,
ɸj is a vector of nonrandom (fixed) coefficients,
βji is a coefficient vector that is randomly distributed across individuals;
vi enters βji,
zi is a set of choice invariant individual characteristics such as age or income,
fji is a vector of M individual and choice varying attributes of choices,
multiplied by ɸj,
xji is a vector of L individual and choice varying attributes of choices,
multiplied by βji.
67
The basic model can be shown as the following equation, where Uij is the utility
individual i derives from choice j, Bp is the price parameter, Bw is the warning label
parameter, Bg is the whole grain stamp parameter, Bj is the parameter for brand j,
and εij is the error term.
Uij = Bp*pricej + Bw*warning label + Bwi*warning label*info dummy + Bg*whole grain
stamp + Bgi*whole grain stamp*info dummy + Bj*brand j dummy + εij
A traditional discrete choice experiment would have the respondent choosing
one of the alternatives, generating a binary dependent variable. In this study, they
were able to select positive amounts of multiple products from the set of
alternatives, generating non-negative integer frequency values for the dependent
variable. This type of data can be analyzed using the multinomial logit code in
Nlogit simply by including a ‘frequency’ specification.
Several different specifications of the model were estimated to gain a better
understanding of the variation of preferences within our data set. In all models,
Cheerios is the brand omitted, thus all brand coefficients are relative to Cheerios.
The basic model henceforth refers to the model containing only the brands, price,
and label attributes, with the information treatment dummy interacted with
warning label and whole grain. The individual interacted model refers to a model
where the attributes (price, warning label, and whole grain) are interacted with
individual specific characteristics determined by log likelihood tests. The purpose
of the individual interacted model is to determine how individuals with different
characteristics might respond differently to the label attributes. While the
individual interacted model allows for heterogeneity among individuals, it assumes
constant effects of the label attributes on the different brands. Thus a third model
was included, the brand interacted model, which has interactions between the label
attributes and the individual brands. This model allows for heterogeneity in the
effects of label attributes between brands. The individual and brand interacted MNL
models will be used to calculate WTP for cereals with different label attributes. The
basic model will be used for a simulation of purchase probability. Unless stated
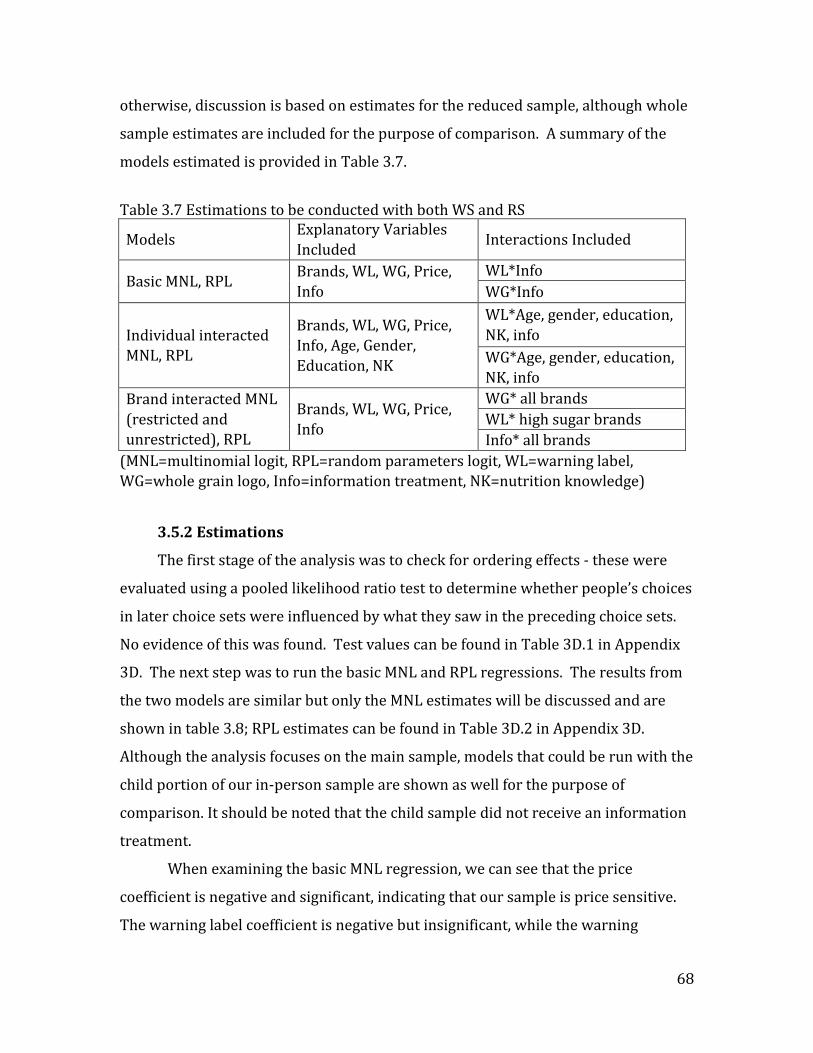
68
otherwise, discussion is based on estimates for the reduced sample, although whole
sample estimates are included for the purpose of comparison. A summary of the
models estimated is provided in Table 3.7.
Table 3.7 Estimations to be conducted with both WS and RS
Models Explanatory Variables
Included Interactions Included
Basic MNL, RPL Brands, WL, WG, Price,
Info
WL*Info
WG*Info
Individual interacted
MNL, RPL
Brands, WL, WG, Price,
Info, Age, Gender,
Education, NK
WL*Age, gender, education,
NK, info
WG*Age, gender, education,
NK, info
Brand interacted MNL
(restricted and
unrestricted), RPL
Brands, WL, WG, Price,
Info
WG* all brands
WL* high sugar brands
Info* all brands
(MNL=multinomial logit, RPL=random parameters logit, WL=warning label,
WG=whole grain logo, Info=information treatment, NK=nutrition knowledge)
3.5.2 Estimations
The first stage of the analysis was to check for ordering effects - these were
evaluated using a pooled likelihood ratio test to determine whether people’s choices
in later choice sets were influenced by what they saw in the preceding choice sets.
No evidence of this was found. Test values can be found in Table 3D.1 in Appendix
3D. The next step was to run the basic MNL and RPL regressions. The results from
the two models are similar but only the MNL estimates will be discussed and are
shown in table 3.8; RPL estimates can be found in Table 3D.2 in Appendix 3D.
Although the analysis focuses on the main sample, models that could be run with the
child portion of our in-person sample are shown as well for the purpose of
comparison. It should be noted that the child sample did not receive an information
treatment.
When examining the basic MNL regression, we can see that the price
coefficient is negative and significant, indicating that our sample is price sensitive.
The warning label coefficient is negative but insignificant, while the warning
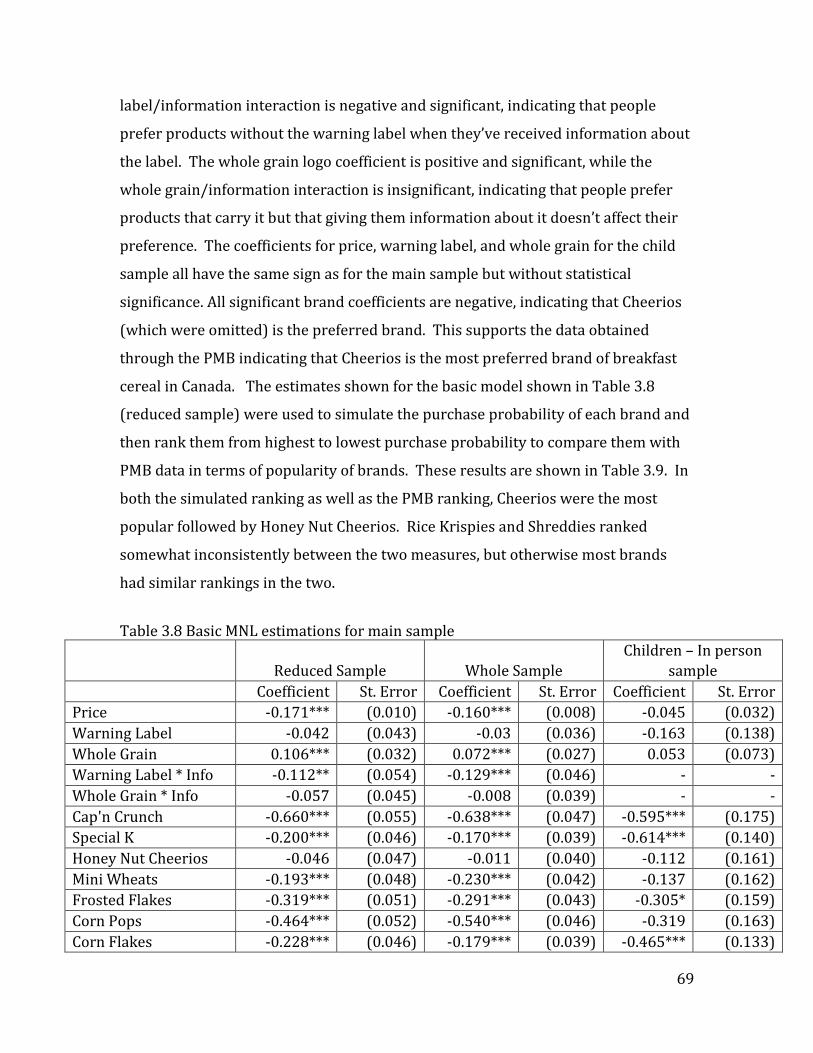
69
label/information interaction is negative and significant, indicating that people
prefer products without the warning label when they’ve received information about
the label. The whole grain logo coefficient is positive and significant, while the
whole grain/information interaction is insignificant, indicating that people prefer
products that carry it but that giving them information about it doesn’t affect their
preference. The coefficients for price, warning label, and whole grain for the child
sample all have the same sign as for the main sample but without statistical
significance. All significant brand coefficients are negative, indicating that Cheerios
(which were omitted) is the preferred brand. This supports the data obtained
through the PMB indicating that Cheerios is the most preferred brand of breakfast
cereal in Canada. The estimates shown for the basic model shown in Table 3.8
(reduced sample) were used to simulate the purchase probability of each brand and
then rank them from highest to lowest purchase probability to compare them with
PMB data in terms of popularity of brands. These results are shown in Table 3.9. In
both the simulated ranking as well as the PMB ranking, Cheerios were the most
popular followed by Honey Nut Cheerios. Rice Krispies and Shreddies ranked
somewhat inconsistently between the two measures, but otherwise most brands
had similar rankings in the two.
Table 3.8 Basic MNL estimations for main sample
Reduced Sample Whole Sample
Children – In person
sample
Coefficient St. Error Coefficient St. Error Coefficient St. Error
Price -0.171*** (0.010) -0.160*** (0.008) -0.045 (0.032)
Warning Label -0.042 (0.043) -0.03 (0.036) -0.163 (0.138)
Whole Grain 0.106*** (0.032) 0.072*** (0.027) 0.053 (0.073)
Warning Label * Info -0.112** (0.054) -0.129*** (0.046) - -
Whole Grain * Info -0.057 (0.045) -0.008 (0.039) - -
Cap'n Crunch -0.660*** (0.055) -0.638*** (0.047) -0.595*** (0.175)
Special K -0.200*** (0.046) -0.170*** (0.039) -0.614*** (0.140)
Honey Nut Cheerios -0.046 (0.047) -0.011 (0.040) -0.112 (0.161)
Mini Wheats -0.193*** (0.048) -0.230*** (0.042) -0.137 (0.162)
Frosted Flakes -0.319*** (0.051) -0.291*** (0.043) -0.305* (0.159)
Corn Pops -0.464*** (0.052) -0.540*** (0.046) -0.319 (0.163)
Corn Flakes -0.228*** (0.046) -0.179*** (0.039) -0.465*** (0.133)

70
Rice Krispies -0.120*** (0.044) -0.113*** (0.038) 0.146 (0.113)
Shreddies -0.314*** (0.047) -0.366*** (0.041) -0.291** (0.126)
LLF -18974.73
-25684.802
-2470.007
AIC/N 24.282
24.429
35.712
***, **, and * indicate statistical significance at 1%, 5%, and 10% respectively
Table 3.9 Comparison of breakfast cereal popularity ranking between PMB data and purchase probability simulation based on basic MNL model estimates.
Brand
Rankings by
PMB data
Rankings by
simulation
Cheerios 1 1
Honey Nut Cheerios 2 2
Rice Krispies 3 6
Corn Flakes 4 5
Mini Wheats 5 4
Frosted Flakes 6 7
Corn Pops 7 10
Cap'n Crunch 8 9
Shreddies 9 3
Special K 10 8
The next step in the analysis was to run the MNL and RPL with individual-
specific characteristics interacted with product attributes. Initially, the variables
interacted with the product attributes were information treatment (info), education
level, age, income, gender, and nutrition knowledge (NK). The log likelihood tests,
however, indicated that income did not add significantly to the model and was thus
subsequently omitted. The test values can be found in table 3D.3 in Appendix D.
MNL results are shown in Table 3.8 and are discussed here; RPL results are shown
in Table 3D.4.
In this individual interacted model (Table 3.10), the price coefficient became
positive (in the basic model it was negative) but older individuals, females, and
people with higher levels of nutrition knowledge were more price sensitive. The
warning label coefficient also became positive when the interactions were added (it
was negative but insignificant in the basic model) but people who had received the
information treatment and who had higher levels of nutrition knowledge were more
likely to avoid a product bearing it. The whole grain coefficient was positive and

71
insignificant, but the positive significant interaction between whole grain and
nutrition knowledge indicated that people with higher levels of nutrition knowledge
were more likely to choose a product carrying a whole grain logo. The only
significant interaction when a similar model was run with the child sample was for
age and price, which had a negative coefficient, indicating that older children were
more price sensitive. The significant brand coefficients remained negative,
consistently indicating that Cheerios and Honey Nut Cheerios are jointly preferred
to other brands in our sample.
Table 3.10 Individual interacted MNL estimations
Reduced Sample Whole Sample
Coefficient St. Error Coefficient St. Error
Price 0.172** (0.078) 0.218*** (0.066)
Price*Info -0.001 (0.020) -0.012 (0.017)
Price*Education 0.018* (0.011) 0.004 (0.009)
Price*Age -0.002* (0.001) -0.002** (0.001)
Price*Female -0.056*** (0.021) -0.056*** (0.017)
Price*NK -0.467*** (0.056) -0.438*** (0.048)
Warning Label 1.362*** (0.211) 1.117*** (0.177)
WL*Info -0.130** (0.054) -0.156*** (0.047)
WL*Education -0.117*** (0.030) -0.100*** (0.024)
WL*Age -0.013*** (0.004) -0.009*** (0.003)
WL*Female -0.202*** (0.056) -0.127*** (0.047)
WL*NK -0.639*** (0.148) -0.634*** (0.127)
Whole Grain 0.25 (0.172) 0.182 (0.146)
WG*Info -0.069 (0.045) -0.024 (0.039)
WG*Education -0.028 (0.025) -0.033* (0.020)
WG*Age -0.003 (0.003) -0.003 (0.002)
WG*Female -0.055 (0.046) -0.056 (0.039)
WG*NK 0.197 (0.123) 0.278*** (0.106)
Cap’n Crunch -0.657*** (0.055) -0.636*** (0.047)
Special K -0.201*** (0.046) -0.171*** (0.039)
Honey Nut Cheerios -0.052 (0.047) -0.016 (0.040)
Mini Wheats -0.204*** (0.049) -0.239*** (0.042)
Frosted Flakes -0.313*** (0.051) -0.286*** (0.043)
Corn Pops -0.465*** (0.052) -0.540*** (0.046)
Corn Flakes -0.232*** (0.046) -0.179*** (0.039)
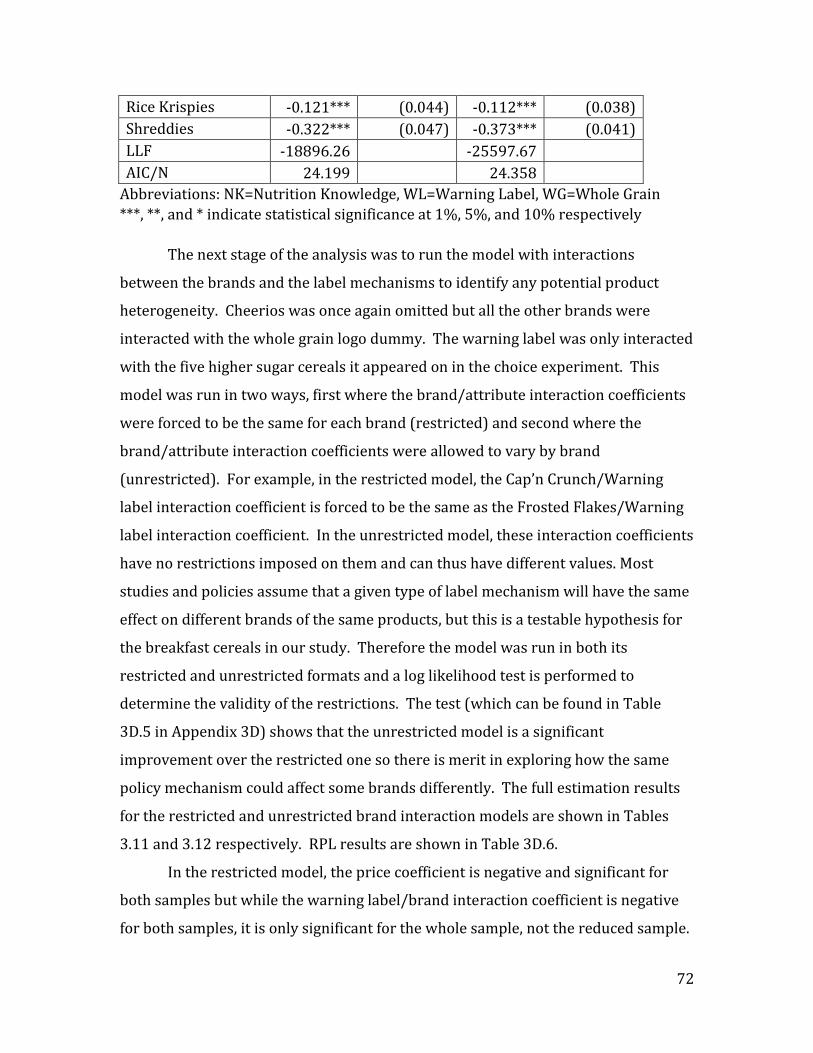
72
Rice Krispies -0.121*** (0.044) -0.112*** (0.038)
Shreddies -0.322*** (0.047) -0.373*** (0.041)
LLF -18896.26
-25597.67
AIC/N 24.199
24.358
Abbreviations: NK=Nutrition Knowledge, WL=Warning Label, WG=Whole Grain
***, **, and * indicate statistical significance at 1%, 5%, and 10% respectively
The next stage of the analysis was to run the model with interactions
between the brands and the label mechanisms to identify any potential product
heterogeneity. Cheerios was once again omitted but all the other brands were
interacted with the whole grain logo dummy. The warning label was only interacted
with the five higher sugar cereals it appeared on in the choice experiment. This
model was run in two ways, first where the brand/attribute interaction coefficients
were forced to be the same for each brand (restricted) and second where the
brand/attribute interaction coefficients were allowed to vary by brand
(unrestricted). For example, in the restricted model, the Cap’n Crunch/Warning
label interaction coefficient is forced to be the same as the Frosted Flakes/Warning
label interaction coefficient. In the unrestricted model, these interaction coefficients
have no restrictions imposed on them and can thus have different values. Most
studies and policies assume that a given type of label mechanism will have the same
effect on different brands of the same products, but this is a testable hypothesis for
the breakfast cereals in our study. Therefore the model was run in both its
restricted and unrestricted formats and a log likelihood test is performed to
determine the validity of the restrictions. The test (which can be found in Table
3D.5 in Appendix 3D) shows that the unrestricted model is a significant
improvement over the restricted one so there is merit in exploring how the same
policy mechanism could affect some brands differently. The full estimation results
for the restricted and unrestricted brand interaction models are shown in Tables
3.11 and 3.12 respectively. RPL results are shown in Table 3D.6.
In the restricted model, the price coefficient is negative and significant for
both samples but while the warning label/brand interaction coefficient is negative
for both samples, it is only significant for the whole sample, not the reduced sample.
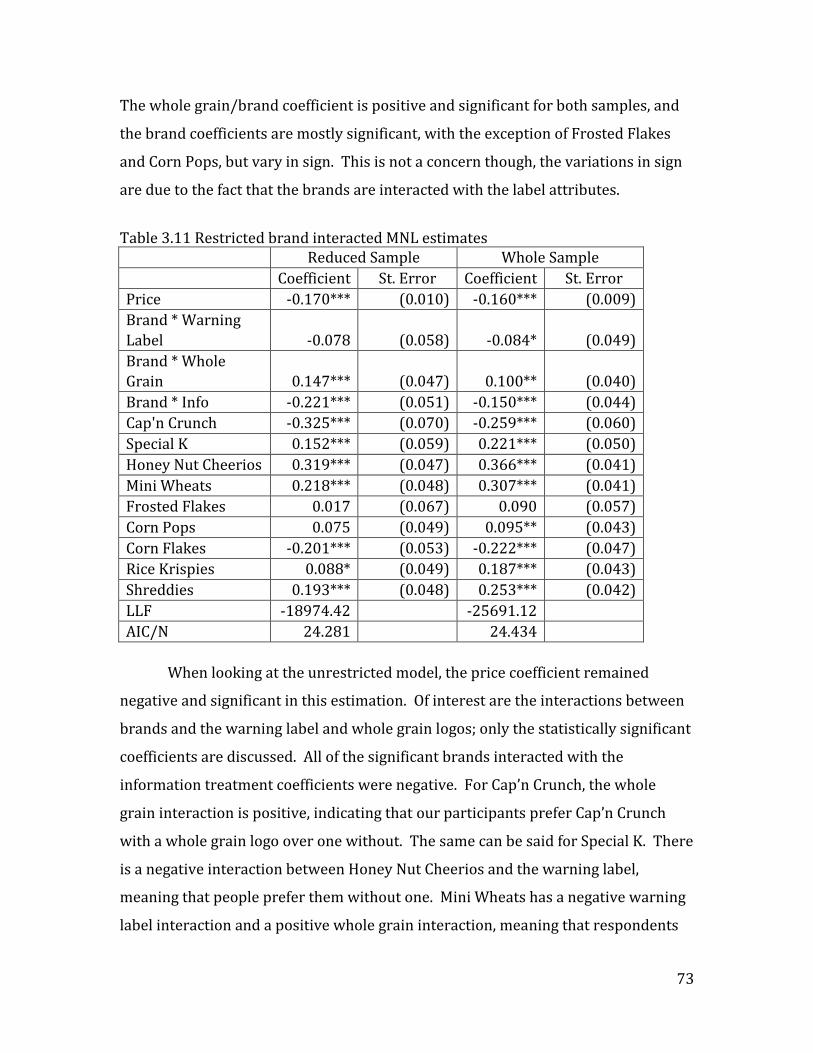
73
The whole grain/brand coefficient is positive and significant for both samples, and
the brand coefficients are mostly significant, with the exception of Frosted Flakes
and Corn Pops, but vary in sign. This is not a concern though, the variations in sign
are due to the fact that the brands are interacted with the label attributes.
Table 3.11 Restricted brand interacted MNL estimates
Reduced Sample Whole Sample
Coefficient St. Error Coefficient St. Error
Price -0.170*** (0.010) -0.160*** (0.009)
Brand * Warning
Label -0.078 (0.058) -0.084* (0.049)
Brand * Whole
Grain 0.147*** (0.047) 0.100** (0.040)
Brand * Info -0.221*** (0.051) -0.150*** (0.044)
Cap'n Crunch -0.325*** (0.070) -0.259*** (0.060)
Special K 0.152*** (0.059) 0.221*** (0.050)
Honey Nut Cheerios 0.319*** (0.047) 0.366*** (0.041)
Mini Wheats 0.218*** (0.048) 0.307*** (0.041)
Frosted Flakes 0.017 (0.067) 0.090 (0.057)
Corn Pops 0.075 (0.049) 0.095** (0.043)
Corn Flakes -0.201*** (0.053) -0.222*** (0.047)
Rice Krispies 0.088* (0.049) 0.187*** (0.043)
Shreddies 0.193*** (0.048) 0.253*** (0.042)
LLF -18974.42
-25691.12
AIC/N 24.281
24.434
When looking at the unrestricted model, the price coefficient remained
negative and significant in this estimation. Of interest are the interactions between
brands and the warning label and whole grain logos; only the statistically significant
coefficients are discussed. All of the significant brands interacted with the
information treatment coefficients were negative. For Cap’n Crunch, the whole
grain interaction is positive, indicating that our participants prefer Cap’n Crunch
with a whole grain logo over one without. The same can be said for Special K. There
is a negative interaction between Honey Nut Cheerios and the warning label,
meaning that people prefer them without one. Mini Wheats has a negative warning
label interaction and a positive whole grain interaction, meaning that respondents
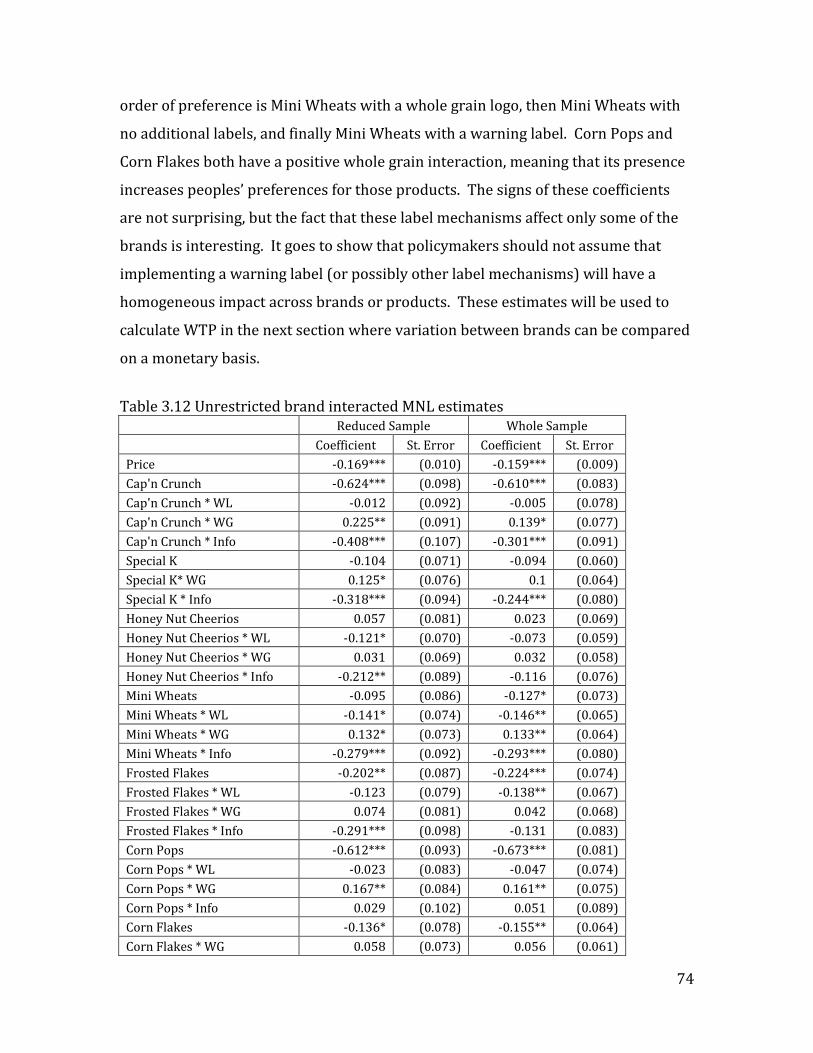
74
order of preference is Mini Wheats with a whole grain logo, then Mini Wheats with
no additional labels, and finally Mini Wheats with a warning label. Corn Pops and
Corn Flakes both have a positive whole grain interaction, meaning that its presence
increases peoples’ preferences for those products. The signs of these coefficients
are not surprising, but the fact that these label mechanisms affect only some of the
brands is interesting. It goes to show that policymakers should not assume that
implementing a warning label (or possibly other label mechanisms) will have a
homogeneous impact across brands or products. These estimates will be used to
calculate WTP in the next section where variation between brands can be compared
on a monetary basis.
Table 3.12 Unrestricted brand interacted MNL estimates
Reduced Sample Whole Sample
Coefficient St. Error Coefficient St. Error
Price -0.169*** (0.010) -0.159*** (0.009)
Cap'n Crunch -0.624*** (0.098) -0.610*** (0.083)
Cap'n Crunch * WL -0.012 (0.092) -0.005 (0.078)
Cap'n Crunch * WG 0.225** (0.091) 0.139* (0.077)
Cap'n Crunch * Info -0.408*** (0.107) -0.301*** (0.091)
Special K -0.104 (0.071) -0.094 (0.060)
Special K* WG 0.125* (0.076) 0.1 (0.064)
Special K * Info -0.318*** (0.094) -0.244*** (0.080)
Honey Nut Cheerios 0.057 (0.081) 0.023 (0.069)
Honey Nut Cheerios * WL -0.121* (0.070) -0.073 (0.059)
Honey Nut Cheerios * WG 0.031 (0.069) 0.032 (0.058)
Honey Nut Cheerios * Info -0.212** (0.089) -0.116 (0.076)
Mini Wheats -0.095 (0.086) -0.127* (0.073)
Mini Wheats * WL -0.141* (0.074) -0.146** (0.065)
Mini Wheats * WG 0.132* (0.073) 0.133** (0.064)
Mini Wheats * Info -0.279*** (0.092) -0.293*** (0.080)
Frosted Flakes -0.202** (0.087) -0.224*** (0.074)
Frosted Flakes * WL -0.123 (0.079) -0.138** (0.067)
Frosted Flakes * WG 0.074 (0.081) 0.042 (0.068)
Frosted Flakes * Info -0.291*** (0.098) -0.131 (0.083)
Corn Pops -0.612*** (0.093) -0.673*** (0.081)
Corn Pops * WL -0.023 (0.083) -0.047 (0.074)
Corn Pops * WG 0.167** (0.084) 0.161** (0.075)
Corn Pops * Info 0.029 (0.102) 0.051 (0.089)
Corn Flakes -0.136* (0.078) -0.155** (0.064)
Corn Flakes * WG 0.058 (0.073) 0.056 (0.061)
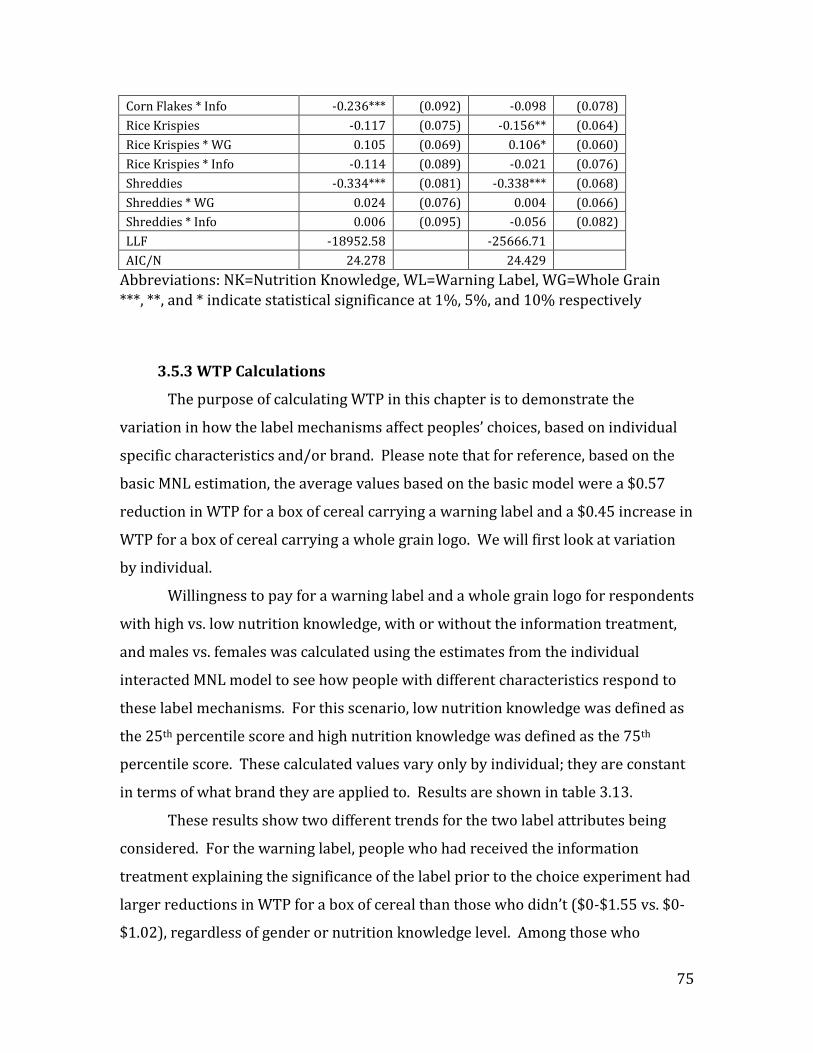
75
Corn Flakes * Info -0.236*** (0.092) -0.098 (0.078)
Rice Krispies -0.117 (0.075) -0.156** (0.064)
Rice Krispies * WG 0.105 (0.069) 0.106* (0.060)
Rice Krispies * Info -0.114 (0.089) -0.021 (0.076)
Shreddies -0.334*** (0.081) -0.338*** (0.068)
Shreddies * WG 0.024 (0.076) 0.004 (0.066)
Shreddies * Info 0.006 (0.095) -0.056 (0.082)
LLF -18952.58
-25666.71
AIC/N 24.278
24.429
Abbreviations: NK=Nutrition Knowledge, WL=Warning Label, WG=Whole Grain
***, **, and * indicate statistical significance at 1%, 5%, and 10% respectively
3.5.3 WTP Calculations
The purpose of calculating WTP in this chapter is to demonstrate the
variation in how the label mechanisms affect peoples’ choices, based on individual
specific characteristics and/or brand. Please note that for reference, based on the
basic MNL estimation, the average values based on the basic model were a $0.57
reduction in WTP for a box of cereal carrying a warning label and a $0.45 increase in
WTP for a box of cereal carrying a whole grain logo. We will first look at variation
by individual.
Willingness to pay for a warning label and a whole grain logo for respondents
with high vs. low nutrition knowledge, with or without the information treatment,
and males vs. females was calculated using the estimates from the individual
interacted MNL model to see how people with different characteristics respond to
these label mechanisms. For this scenario, low nutrition knowledge was defined as
the 25th percentile score and high nutrition knowledge was defined as the 75th
percentile score. These calculated values vary only by individual; they are constant
in terms of what brand they are applied to. Results are shown in table 3.13.
These results show two different trends for the two label attributes being
considered. For the warning label, people who had received the information
treatment explaining the significance of the label prior to the choice experiment had
larger reductions in WTP for a box of cereal than those who didn’t ($0-$1.55 vs. $0-
$1.02), regardless of gender or nutrition knowledge level. Among those who
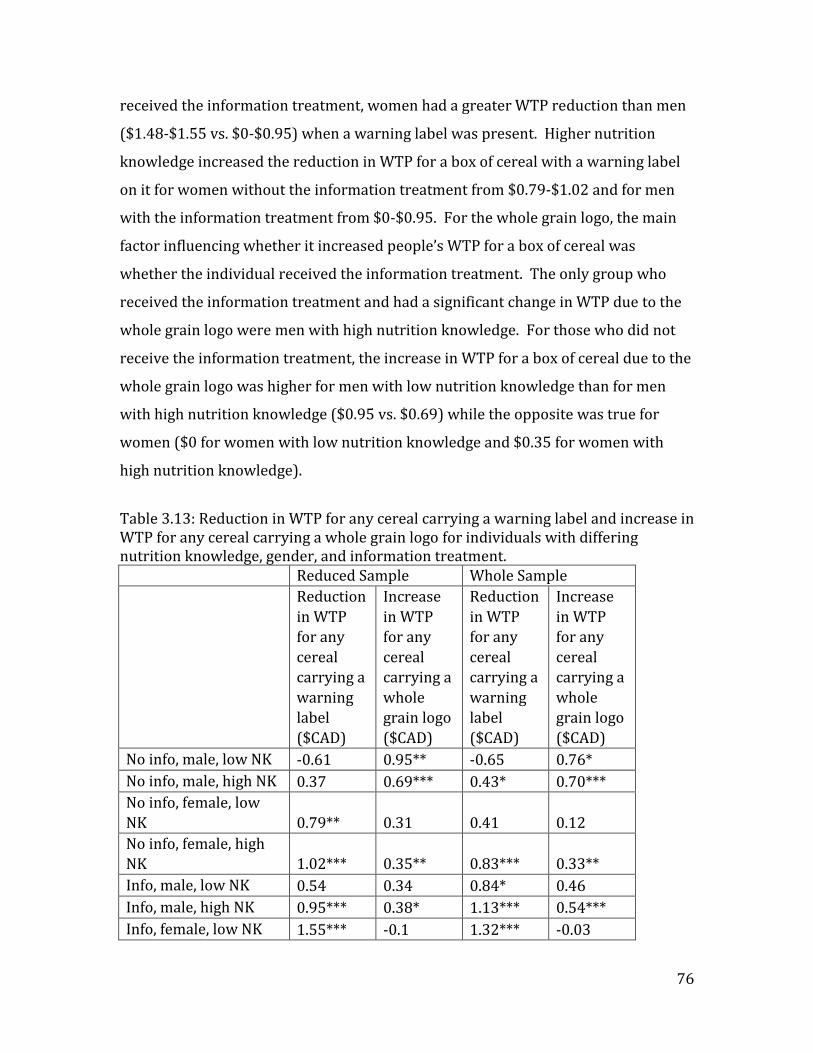
76
received the information treatment, women had a greater WTP reduction than men
($1.48-$1.55 vs. $0-$0.95) when a warning label was present. Higher nutrition
knowledge increased the reduction in WTP for a box of cereal with a warning label
on it for women without the information treatment from $0.79-$1.02 and for men
with the information treatment from $0-$0.95. For the whole grain logo, the main
factor influencing whether it increased people’s WTP for a box of cereal was
whether the individual received the information treatment. The only group who
received the information treatment and had a significant change in WTP due to the
whole grain logo were men with high nutrition knowledge. For those who did not
receive the information treatment, the increase in WTP for a box of cereal due to the
whole grain logo was higher for men with low nutrition knowledge than for men
with high nutrition knowledge ($0.95 vs. $0.69) while the opposite was true for
women ($0 for women with low nutrition knowledge and $0.35 for women with
high nutrition knowledge).
Table 3.13: Reduction in WTP for any cereal carrying a warning label and increase in WTP for any cereal carrying a whole grain logo for individuals with differing nutrition knowledge, gender, and information treatment.
Reduced Sample Whole Sample
Reduction
in WTP
for any
cereal
carrying a
warning
label
($CAD)
Increase
in WTP
for any
cereal
carrying a
whole
grain logo
($CAD)
Reduction
in WTP
for any
cereal
carrying a
warning
label
($CAD)
Increase
in WTP
for any
cereal
carrying a
whole
grain logo
($CAD)
No info, male, low NK -0.61 0.95** -0.65 0.76*
No info, male, high NK 0.37 0.69*** 0.43* 0.70***
No info, female, low
NK 0.79** 0.31 0.41 0.12
No info, female, high
NK 1.02*** 0.35** 0.83*** 0.33**
Info, male, low NK 0.54 0.34 0.84* 0.46
Info, male, high NK 0.95*** 0.38* 1.13*** 0.54***
Info, female, low NK 1.55*** -0.1 1.32*** -0.03
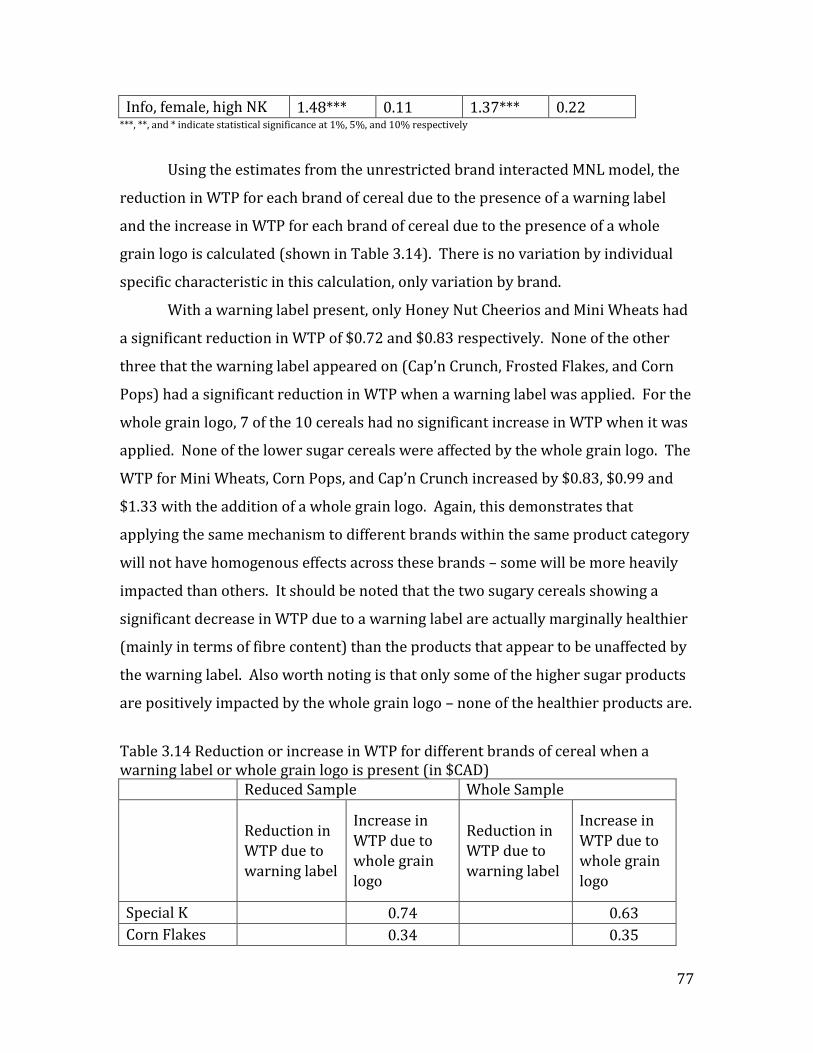
77
Info, female, high NK 1.48*** 0.11 1.37*** 0.22 ***, **, and * indicate statistical significance at 1%, 5%, and 10% respectively
Using the estimates from the unrestricted brand interacted MNL model, the
reduction in WTP for each brand of cereal due to the presence of a warning label
and the increase in WTP for each brand of cereal due to the presence of a whole
grain logo is calculated (shown in Table 3.14). There is no variation by individual
specific characteristic in this calculation, only variation by brand.
With a warning label present, only Honey Nut Cheerios and Mini Wheats had
a significant reduction in WTP of $0.72 and $0.83 respectively. None of the other
three that the warning label appeared on (Cap’n Crunch, Frosted Flakes, and Corn
Pops) had a significant reduction in WTP when a warning label was applied. For the
whole grain logo, 7 of the 10 cereals had no significant increase in WTP when it was
applied. None of the lower sugar cereals were affected by the whole grain logo. The
WTP for Mini Wheats, Corn Pops, and Cap’n Crunch increased by $0.83, $0.99 and
$1.33 with the addition of a whole grain logo. Again, this demonstrates that
applying the same mechanism to different brands within the same product category
will not have homogenous effects across these brands – some will be more heavily
impacted than others. It should be noted that the two sugary cereals showing a
significant decrease in WTP due to a warning label are actually marginally healthier
(mainly in terms of fibre content) than the products that appear to be unaffected by
the warning label. Also worth noting is that only some of the higher sugar products
are positively impacted by the whole grain logo – none of the healthier products are.
Table 3.14 Reduction or increase in WTP for different brands of cereal when a warning label or whole grain logo is present (in $CAD)
Reduced Sample Whole Sample
Reduction in
WTP due to
warning label
Increase in
WTP due to
whole grain
logo
Reduction in
WTP due to
warning label
Increase in
WTP due to
whole grain
logo
Special K
0.74
0.63
Corn Flakes
0.34
0.35
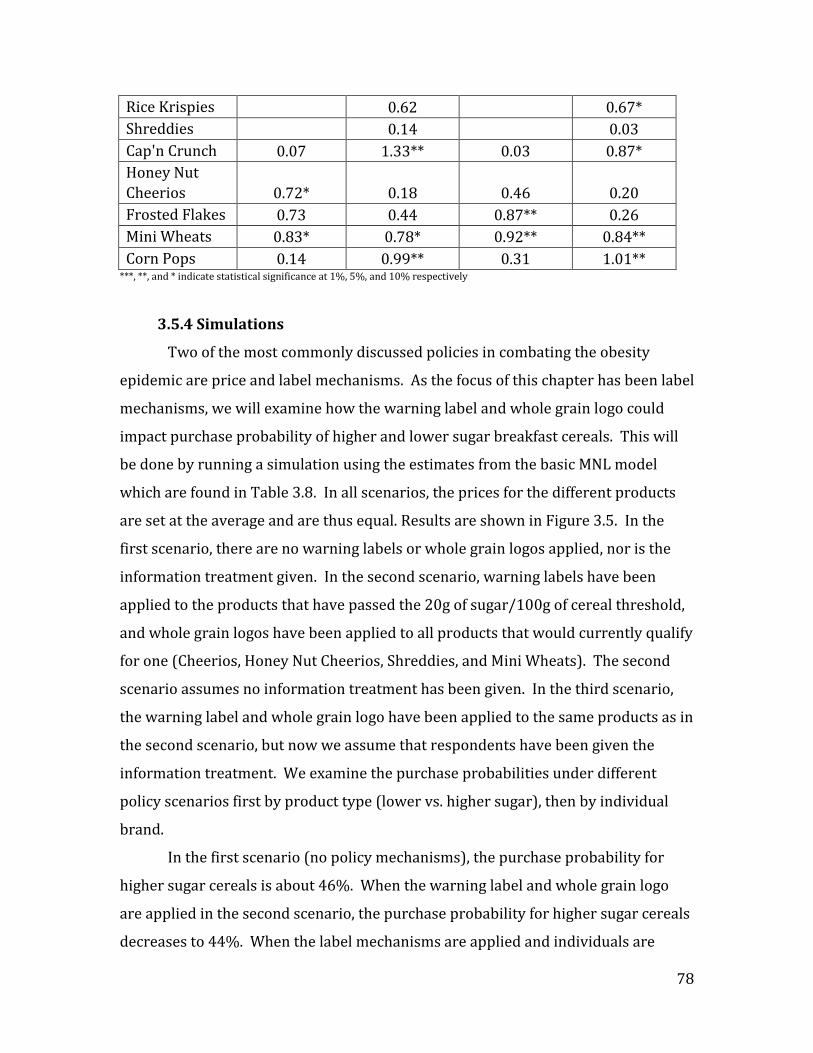
78
Rice Krispies
0.62
0.67*
Shreddies
0.14
0.03
Cap'n Crunch 0.07 1.33** 0.03 0.87*
Honey Nut
Cheerios 0.72* 0.18 0.46 0.20
Frosted Flakes 0.73 0.44 0.87** 0.26
Mini Wheats 0.83* 0.78* 0.92** 0.84**
Corn Pops 0.14 0.99** 0.31 1.01** ***, **, and * indicate statistical significance at 1%, 5%, and 10% respectively
3.5.4 Simulations
Two of the most commonly discussed policies in combating the obesity
epidemic are price and label mechanisms. As the focus of this chapter has been label
mechanisms, we will examine how the warning label and whole grain logo could
impact purchase probability of higher and lower sugar breakfast cereals. This will
be done by running a simulation using the estimates from the basic MNL model
which are found in Table 3.8. In all scenarios, the prices for the different products
are set at the average and are thus equal. Results are shown in Figure 3.5. In the
first scenario, there are no warning labels or whole grain logos applied, nor is the
information treatment given. In the second scenario, warning labels have been
applied to the products that have passed the 20g of sugar/100g of cereal threshold,
and whole grain logos have been applied to all products that would currently qualify
for one (Cheerios, Honey Nut Cheerios, Shreddies, and Mini Wheats). The second
scenario assumes no information treatment has been given. In the third scenario,
the warning label and whole grain logo have been applied to the same products as in
the second scenario, but now we assume that respondents have been given the
information treatment. We examine the purchase probabilities under different
policy scenarios first by product type (lower vs. higher sugar), then by individual
brand.
In the first scenario (no policy mechanisms), the purchase probability for
higher sugar cereals is about 46%. When the warning label and whole grain logo
are applied in the second scenario, the purchase probability for higher sugar cereals
decreases to 44%. When the label mechanisms are applied and individuals are

79
given information about the significance of them, the purchase probability of higher
sugar cereals decreases further to 41%.
Figure 3.5 Purchase probability simulation for higher and lower sugar breakfast cereals with different policy mechanisms using basic MNL estimations
Looking at individual brands (shown in Figure 3.6) all lower sugar products
increased in purchase probability with a simulated warning label policy, with
greater effects seen when the information treatment was applied. Increases in
purchase probability ranged from 0.4% for Shreddies to 1.1% for Corn Flakes. All
higher sugar products decreased in purchase probability under the simulated
warning label policy, again with greater effects under the information treatment.
The biggest decreases in purchase probability were for the two healthier products
within the higher sugar category, Honey Nut Cheerios (1.5%) and Mini Wheats
(1.2%). Other higher sugar cereals decreased by 0.3% to 0.6%. Given that the
purchase probabilities for all higher sugar cereals decreased while that for all lower
0%
10%
20%
30%
40%
50%
60%
70%
No WG No WL No Info Yes WG Yes WL No Info Yes WG Yes WL Yes Info
Highersugar
Lowersugar

80
sugar cereals increased, we cannot claim that these policies would induce switching
to different brands within the same category, at least not aggregately.
Figure 3.6 Purchase probability simulation for individual brands with different policy mechanisms using basic MNL estimations
3.6 Discussion
The overall objective of this dissertation is to evaluate the effectiveness of
potential policies to improve children’s diets in order to improve their long-term
health outcomes and reduce the financial burden that diet-related diseases place on
the health care system. This chapter specifically examined how parents of 8-12 year
old children would respond to an explicit text-based warning label on high-sugar
breakfast cereals, with consideration given to how responses would differ by both
individual and brand. The analysis showed that parents would be less likely to
purchase a high-sugar product if it carried a warning label, but the effects are
heterogeneous. Firstly, parents with higher levels of nutrition knowledge as well as
-1.0%
1.0%
3.0%
5.0%
7.0%
9.0%
11.0%
13.0%
15.0%
No WG No WL No Info Yes WG Yes WL No Info Yes WG Yes WL Yes Info
Cheerios Shreddies
Corn Flakes Rice Krispies
Special K Honey Nut Cheerios
Mini Wheats Frosted Flakes
Cap'n Crunch Corn Pops

81
women would be more responsive to a high sugar warning label. This means that
households where a woman or someone with high nutrition knowledge is the
primary grocery shopper will be more positively impacted by a warning label policy
as our results show that these people are more likely to decrease the amounts of
products they buy that carry a warning label. Overall, men would be more
responsive to a whole grain logo. In addition, getting information about the labels
increased responsiveness to the warning label but not the whole grain logo.
Descriptive analysis of the choice experiment data implied that children would be
more responsive to a warning label than their parents would be. In addition, it was
found that older children are more price sensitive. Secondly, although the basic MNL
model shows that parents would be willing to pay $0.57 less for a product with a
warning label and $0.45 to purchase a product with a whole grain logo, these
averages don’t account for the fact that consumers would not respond to these label
attributes to the same extent for different cereals. This is demonstrated by the
brand interacted model estimates, where differences in WTP for a product with or
without a warning label vary by $0.83/box and by $1.33/box for products with or
without a whole grain logo. It should be noted that the brands most affected by the
warning label were those with a healthy reputation (Honey Nut Cheerios and Mini
Wheats). The brands that most people realize are high in sugar were less affected.
This is consistent with the findings of Araya et al (2018) where purchases of juices
and cereals were impacted by a warning label in Chile but purchases of chocolates,
candies, and cookies were not, and is supported by the theory of Loewenstein, et al
(2014), which posits that additional information will only affect decisions if it was
previously unknown. Thus prior to the warning label, respondents thought that
Honey Nut Cheerios and Mini Wheats were healthy but recognized that the other
high sugar options were not; when this perception was corrected, they adjusted
their choices accordingly.
The issue around consequentiality and design of this experiment, while not
causing concerns for internal validity, can have implications for external validity. It
should also be noted that overall, responsiveness to a warning label is likely
overstated in an experimental setting; in real life parents’ response to a warning
82
label will be somewhat mitigated by their child’s preferences and/or the child
pestering them to buy certain products. This is an important reason to consider
how children will react to a warning label, as it might influence their preferences.
However, it could be argued that because the choice experiment was set up in a way
that people could adjust the proportions of each cereal they chose as the attributes
changed rather than only being able to choose one product each time, the estimates
are likely more realistic. If a warning label were suddenly implemented on
breakfast cereals (or some other commonly consumed food product), it is more
likely that people will react by buying less of the product in question or buying it
more infrequently than ceasing purchases of it altogether. Therefore the frequency
format of the choice experiment likely has more external validity than a traditional
binary choice format would for this scenario. Future research on how policies may
affect the consumption of frequently purchased products should consider allowing
for more flexibility in consumer reactions by choosing experimental designs that
don’t force respondents to react in a binary manner. This frequency approach to
choice experiments in the field of food choice and public nutrition deserves further
exploration. In addition, the type of messaging on a warning label will likely impact
reactions to it, as found by Purmehdi et al (2017), so evaluating consumer response
to different wording strategies of warning labels would likely be a worthwhile
research activity.
When considering the effectiveness of the warning label, although any
reduction in the consumption of sugar is good, it would likely have greater benefits
for public health if it were the greater consumers of sugar whose consumption was
decreased. Our results show, however, that people with lower levels of nutrition
knowledge purchase more high-sugar cereals than do people with higher levels of
nutrition knowledge, indicating that a policy targeted at individuals with low
nutrition knowledge would be more effective. Unfortunately, our results also
indicated that people with lower nutrition knowledge would be less responsive to a
warning label, so Health Canada’s pending warning label may be less effective than
hoped for, but this doesn’t mean that it’s not worth trying. Even if it doesn’t reduce
sugar consumption to the extent hoped for, its mere presence might increase
83
consumer awareness about nutrition and healthy food choices which could improve
public health in the long run. It could also motivate manufacturers to adjust their
product formulation to avoid the warning label.
In addition, it is important to consider how such a warning label will impact
how consumers perceive food products and their nutritional value. On one hand, if
people see a warning label on a product, they may be surprised and investigate
further by reading the nutrition facts panel, possibly comparing the product to other
similar offerings, or start paying more attention to food and nutrition in general,
improving their overall food choices. On the other hand, people might see all
products with a warning label as bad and not differentiate between them. In our
study, Mini Wheats, which is the healthiest product that merited the warning label
(lower in sugar, higher in fibre and iron), was the most negatively impacted with the
application of the warning label. So if someone sees the warning label and assumes
that all of the products carrying it are uniformly unhealthy, they might end up
making worse choices if they don’t avoid the products with the label.
In general, consumers will be more responsive to a label mechanism if they
have some prior awareness and/or understanding of it. Health Canada has made a
good start towards this in engaging the public’s feedback on the design of the
upcoming warning label, but they will need to find other ways to enlighten
consumers as to the significance of it when they see it on products they are
considering purchasing (Cohen and Lesser 2016). Ways to do this could include
giving information on their website, providing pamphlets in grocery stores, utilizing
social media, television or radio commercials, or even teaching children about it in
school, as we have seen that approximately 80% of children play a role in grocery
store decisions (as shown in Table 3.3). That way when an individual sees it on a
food package, they don’t have to exert any time or cognitive effort in interpreting it,
they will already know what it signifies which increases the likelihood that it affects
their choice.
Although Health Canada needs to be consistent in how they apply the
impending high sugar/sodium/saturated fat warning label, they should expect that
the warning labels will have more impact not only on some types of products, but
84
also on some specific brands. This difference in response to a policy mechanism
based on individual brand is also an area that merits further research. Firms could
react to this warning label in several different ways depending on its effects on their
products. If demand for a product is largely unaffected by the warning label, they
may do nothing. If, however, a firm anticipates that demand for their product will
decline if a warning label is applied to it, they may preemptively decrease its
sugar/sodium/saturated fat content. If a firm takes no action prior to the warning
label implementation then suffers from it, they may decide to discount the product
to increase its appeal to consumers. How this warning label will affect the choices
made by both consumers and manufacturers remains to be seen, but will
undoubtedly merit further research. While these first two studies have focused on
choices made by consumers, the next chapter will shift the focus to the food
manufacturers to further explore the factors impacting their decision-making and
the subsequent nutritional quality of their food.
85
Chapter 4: Nutritional trends in the breakfast cereal industry
4.1 Introduction
The overall objective of this thesis is to determine the effectiveness of
potential policy tools in improving the diets of children. Thus far, policies aiming to
influence the choices of consumers (both children and their parents) have been
discussed. Another potential approach is to bypass consumer decision-making and
address the issue at the source, regulating the food manufacturers. In general,
regulation of manufacturing activities is utilized to ensure consumer safety, such as
in the production of electrical appliances, children’s toys, and protective headgear.
In the food industry, regulations have addressed labeling requirements, food safety
concerns (such as protecting consumers from food-borne illnesses by pasteurization
of milk or minimum heating requirements for canning food), and mandatory
fortification of some products to address population-level deficiencies (such as
iodine in salt to prevent goiter). Thus far, the nutritional content of foods has
largely been unregulated (with the exception of the recent trans fat ban), which is a
policy decision in and of itself. The type of regulation on food manufacturers being
discussed here could pertain to product formulation, such as placing limits on
undesirable components like sugar and sodium, or using taxes/subsidies to
incentivize firms to improve the nutritional quality of their food. It could also
pertain to labelling requirements which could lead to voluntary reformulation as
disclosure of information often does. It is possible, however, that food
manufacturers already perceive a demand for healthy foods, and have already
improved the nutritional profile of their products in response to the demand. In the
US, 16 major packaged food and beverage manufacturers voluntarily pledged to
remove 1 trillion calories collectively between 2007 and 2012, eliciting a drop of 56
calories purchased per household per day in that time frame (Slining et al 2013). In
their 2016 Corporate Responsibility Report, Kellogg’s states that they are 90%
complete in their goal to ensure that by 2020, 90% of their cereals have 10g or less
of sugar per 30g of cereal.
86
If enough manufacturers continue to improve their products in this fashion,
responding to societal concerns for diet and health, committing government
resources to imposing and enforcing new regulations would be inefficient, but if the
trend is short lived, not adopted by enough firms, or only implemented in
convenient products, regulations on food manufacturers could be helpful in
improving children’s diets. The negative aspect of a policy regulating product
formulation is that it could be viewed as paternalistic and infringing upon
consumers’ rights to choose. The positive is that all consumers of the regulated
product would benefit from a health perspective provided that they consume the
healthier formulations in reasonable quantities. Overall, a policy like this might be
more effective because many consumers might not respond in an economically
rational way to a price mechanism (Miljkovic et al 2008). If input prices are the main
drivers of production decisions, then taxes or subsidies on ingredients could be a
more effective approach to attain desired outcomes. A study by Miao et al (2012)
found that taxing sugar as an input at the firm level would be a more efficient
approach to decreasing sugar intake than adding a tax onto high sugar products at
the consumer level.
This study focuses on the firms that manufacture ready to eat cold breakfast
cereals. Some breakfast cereals are relatively healthy foods, being high in fibre and
vitamins while being low in saturated fat and cholesterol, and when consumed with
milk increase calcium and vitamin D intake. The consumption of breakfast cereal
has been shown to have positive effects on micronutrient and fibre intakes (Barton
et al 2005; Galvin et al 2003). Other cereals, however, have high levels of sugar
which make them inappropriate for regular consumption, especially for children.
Using nutritional data on breakfast cereals, this paper explores whether breakfast
cereal portfolios have improved or deteriorated over the last 20 years by
manufacturer from a nutritional perspective, and whether these trends are
associated with media coverage on nutrition issues or input prices. The firm’s
decisions around new or existing products could affect the price charged for the
cereal, the quality (nutritional content), and/or the advertising budget for the
individual cereal products.
87
This chapter will first reviews of the literature on how public awareness of
nutrition impacts the food industry, firm behavior with respect to product quality,
price, and advertising, and an overview of the breakfast cereal industry. Next, the
objectives and research questions are defined, then the data and all of the various
sources it was obtained from are described. Finally, the data is examined in a
variety of ways, both aggregated by firm and nutritional quality as well as
disaggregated into individual products to see how quality, price, and advertising
correspond with each other and how public awareness of specific nutrients as well
as input prices play a role. Examining the data from various angles in different
categories allows us to better understand the strategy of food manufacturers and
identify where regulations could be beneficial. Potential issues that could require
policy measures include healthier products being more expensive, encouraging the
consumption of less healthy products, higher levels of advertising for less healthy
products, encouraging their consumption, or an increasing segmentation of
products in terms of nutritional quality which could increase health inequities.
4.2 Literature Review
4.2.1 Impacts of public nutrition awareness on industry
The links between diet and health have become increasingly well understood
in recent years, eliciting a high level of consumer interest. Media coverage
describing the benefits of the newest superfood like chia or the evils of high-fructose
corn syrup can be seen regularly in newspapers and magazines. Task forces
addressing public consumption of trans-fats (2005-2010) and sodium (2007-2011)
have been created and disbanded by the Canadian government. During their tenure,
the Canadian trans fat task force made various industry focused recommendations
to reduce trans fat consumption among Canadians, many of which were voluntarily
adopted by food manufacturers. There is evidence (L’Abbe et al 2009) that trans fat
consumption did in fact decrease following the labeling requirements and
production recommendations, and L’Abbe et al emphasize the importance of active
media interest in increasing consumer awareness about trans fats and increasing
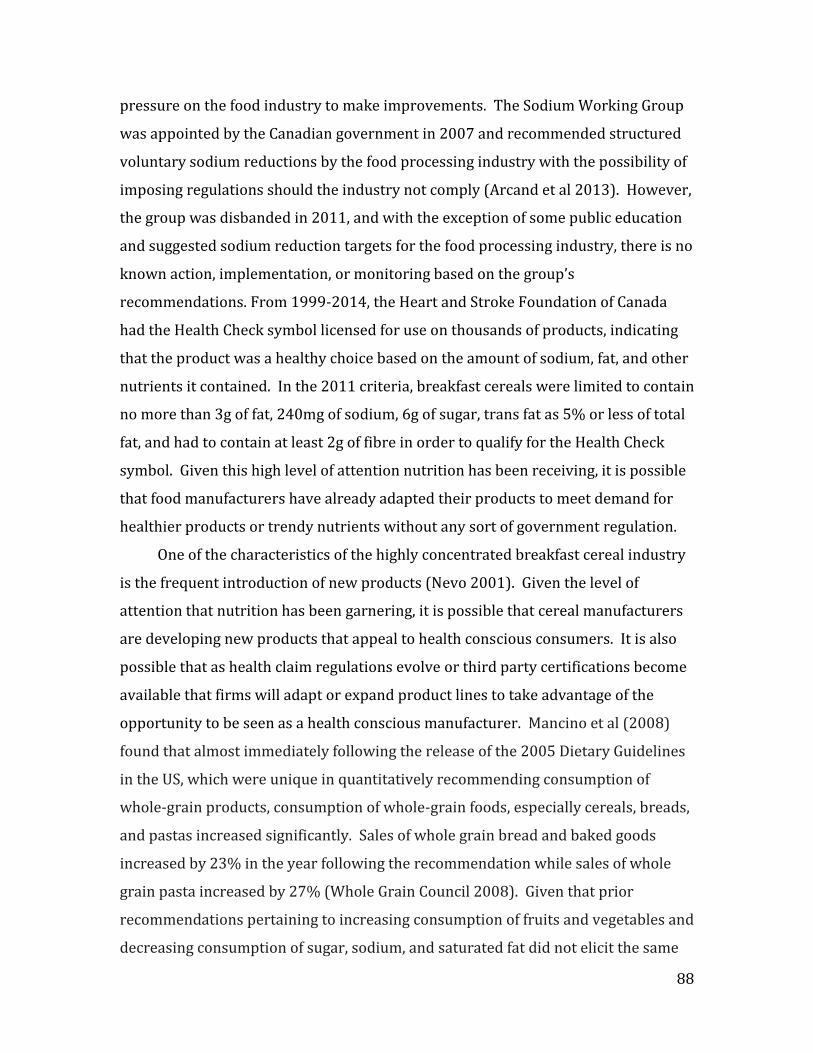
88
pressure on the food industry to make improvements. The Sodium Working Group
was appointed by the Canadian government in 2007 and recommended structured
voluntary sodium reductions by the food processing industry with the possibility of
imposing regulations should the industry not comply (Arcand et al 2013). However,
the group was disbanded in 2011, and with the exception of some public education
and suggested sodium reduction targets for the food processing industry, there is no
known action, implementation, or monitoring based on the group’s
recommendations. From 1999-2014, the Heart and Stroke Foundation of Canada
had the Health Check symbol licensed for use on thousands of products, indicating
that the product was a healthy choice based on the amount of sodium, fat, and other
nutrients it contained. In the 2011 criteria, breakfast cereals were limited to contain
no more than 3g of fat, 240mg of sodium, 6g of sugar, trans fat as 5% or less of total
fat, and had to contain at least 2g of fibre in order to qualify for the Health Check
symbol. Given this high level of attention nutrition has been receiving, it is possible
that food manufacturers have already adapted their products to meet demand for
healthier products or trendy nutrients without any sort of government regulation.
One of the characteristics of the highly concentrated breakfast cereal industry
is the frequent introduction of new products (Nevo 2001). Given the level of
attention that nutrition has been garnering, it is possible that cereal manufacturers
are developing new products that appeal to health conscious consumers. It is also
possible that as health claim regulations evolve or third party certifications become
available that firms will adapt or expand product lines to take advantage of the
opportunity to be seen as a health conscious manufacturer. Mancino et al (2008)
found that almost immediately following the release of the 2005 Dietary Guidelines
in the US, which were unique in quantitatively recommending consumption of
whole-grain products, consumption of whole-grain foods, especially cereals, breads,
and pastas increased significantly. Sales of whole grain bread and baked goods
increased by 23% in the year following the recommendation while sales of whole
grain pasta increased by 27% (Whole Grain Council 2008). Given that prior
recommendations pertaining to increasing consumption of fruits and vegetables and
decreasing consumption of sugar, sodium, and saturated fat did not elicit the same
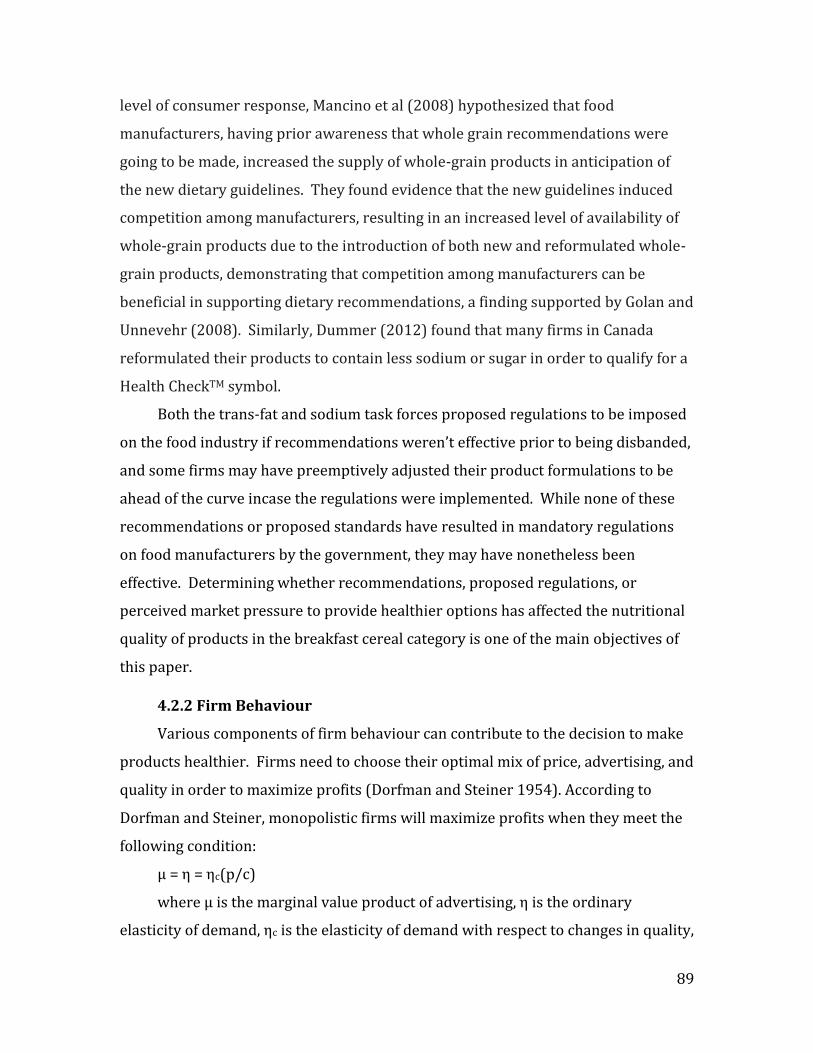
89
level of consumer response, Mancino et al (2008) hypothesized that food
manufacturers, having prior awareness that whole grain recommendations were
going to be made, increased the supply of whole-grain products in anticipation of
the new dietary guidelines. They found evidence that the new guidelines induced
competition among manufacturers, resulting in an increased level of availability of
whole-grain products due to the introduction of both new and reformulated whole-
grain products, demonstrating that competition among manufacturers can be
beneficial in supporting dietary recommendations, a finding supported by Golan and
Unnevehr (2008). Similarly, Dummer (2012) found that many firms in Canada
reformulated their products to contain less sodium or sugar in order to qualify for a
Health CheckTM symbol.
Both the trans-fat and sodium task forces proposed regulations to be imposed
on the food industry if recommendations weren’t effective prior to being disbanded,
and some firms may have preemptively adjusted their product formulations to be
ahead of the curve incase the regulations were implemented. While none of these
recommendations or proposed standards have resulted in mandatory regulations
on food manufacturers by the government, they may have nonetheless been
effective. Determining whether recommendations, proposed regulations, or
perceived market pressure to provide healthier options has affected the nutritional
quality of products in the breakfast cereal category is one of the main objectives of
this paper.
4.2.2 Firm Behaviour
Various components of firm behaviour can contribute to the decision to make
products healthier. Firms need to choose their optimal mix of price, advertising, and
quality in order to maximize profits (Dorfman and Steiner 1954). According to
Dorfman and Steiner, monopolistic firms will maximize profits when they meet the
following condition:
μ = η = ηc(p/c)
where μ is the marginal value product of advertising, η is the ordinary
elasticity of demand, ηc is the elasticity of demand with respect to changes in quality,
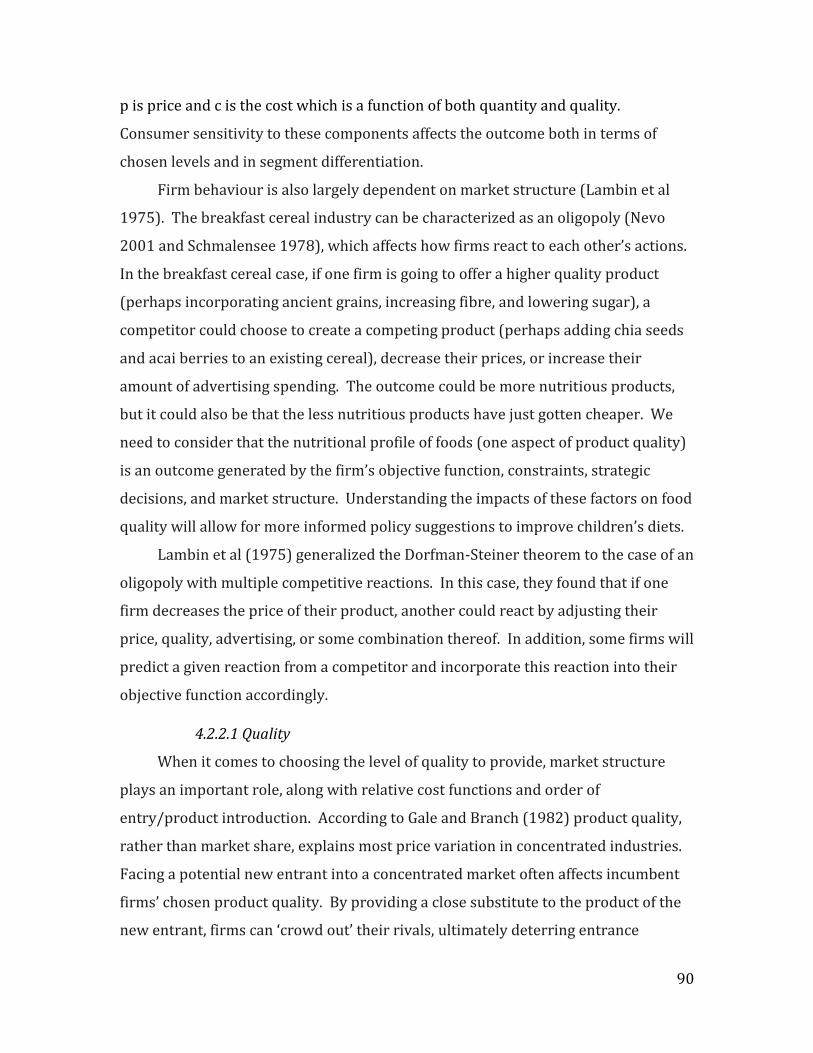
90
p is price and c is the cost which is a function of both quantity and quality.
Consumer sensitivity to these components affects the outcome both in terms of
chosen levels and in segment differentiation.
Firm behaviour is also largely dependent on market structure (Lambin et al
1975). The breakfast cereal industry can be characterized as an oligopoly (Nevo
2001 and Schmalensee 1978), which affects how firms react to each other’s actions.
In the breakfast cereal case, if one firm is going to offer a higher quality product
(perhaps incorporating ancient grains, increasing fibre, and lowering sugar), a
competitor could choose to create a competing product (perhaps adding chia seeds
and acai berries to an existing cereal), decrease their prices, or increase their
amount of advertising spending. The outcome could be more nutritious products,
but it could also be that the less nutritious products have just gotten cheaper. We
need to consider that the nutritional profile of foods (one aspect of product quality)
is an outcome generated by the firm’s objective function, constraints, strategic
decisions, and market structure. Understanding the impacts of these factors on food
quality will allow for more informed policy suggestions to improve children’s diets.
Lambin et al (1975) generalized the Dorfman-Steiner theorem to the case of an
oligopoly with multiple competitive reactions. In this case, they found that if one
firm decreases the price of their product, another could react by adjusting their
price, quality, advertising, or some combination thereof. In addition, some firms will
predict a given reaction from a competitor and incorporate this reaction into their
objective function accordingly.
4.2.2.1 Quality
When it comes to choosing the level of quality to provide, market structure
plays an important role, along with relative cost functions and order of
entry/product introduction. According to Gale and Branch (1982) product quality,
rather than market share, explains most price variation in concentrated industries.
Facing a potential new entrant into a concentrated market often affects incumbent
firms’ chosen product quality. By providing a close substitute to the product of the
new entrant, firms can ‘crowd out’ their rivals, ultimately deterring entrance
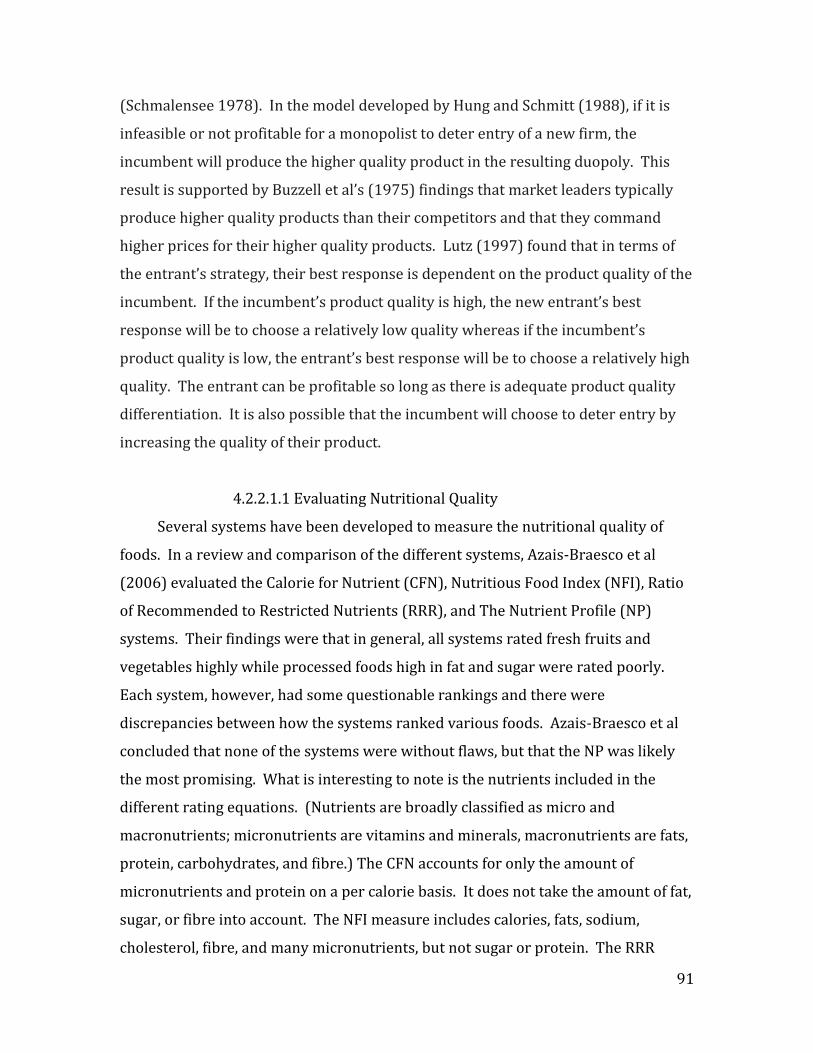
91
(Schmalensee 1978). In the model developed by Hung and Schmitt (1988), if it is
infeasible or not profitable for a monopolist to deter entry of a new firm, the
incumbent will produce the higher quality product in the resulting duopoly. This
result is supported by Buzzell et al’s (1975) findings that market leaders typically
produce higher quality products than their competitors and that they command
higher prices for their higher quality products. Lutz (1997) found that in terms of
the entrant’s strategy, their best response is dependent on the product quality of the
incumbent. If the incumbent’s product quality is high, the new entrant’s best
response will be to choose a relatively low quality whereas if the incumbent’s
product quality is low, the entrant’s best response will be to choose a relatively high
quality. The entrant can be profitable so long as there is adequate product quality
differentiation. It is also possible that the incumbent will choose to deter entry by
increasing the quality of their product.
4.2.2.1.1 Evaluating Nutritional Quality
Several systems have been developed to measure the nutritional quality of
foods. In a review and comparison of the different systems, Azais-Braesco et al
(2006) evaluated the Calorie for Nutrient (CFN), Nutritious Food Index (NFI), Ratio
of Recommended to Restricted Nutrients (RRR), and The Nutrient Profile (NP)
systems. Their findings were that in general, all systems rated fresh fruits and
vegetables highly while processed foods high in fat and sugar were rated poorly.
Each system, however, had some questionable rankings and there were
discrepancies between how the systems ranked various foods. Azais-Braesco et al
concluded that none of the systems were without flaws, but that the NP was likely
the most promising. What is interesting to note is the nutrients included in the
different rating equations. (Nutrients are broadly classified as micro and
macronutrients; micronutrients are vitamins and minerals, macronutrients are fats,
protein, carbohydrates, and fibre.) The CFN accounts for only the amount of
micronutrients and protein on a per calorie basis. It does not take the amount of fat,
sugar, or fibre into account. The NFI measure includes calories, fats, sodium,
cholesterol, fibre, and many micronutrients, but not sugar or protein. The RRR
92
takes into account the ratio of calories, saturated fats, sugar, sodium, cholesterol,
protein, and fibre as well as vitamins A and C as well as calcium and iron (all of
which are mandatory to include on food packaging in Canada and the US). It does
not include any of the B vitamins, magnesium, phosphorous, or potassium. The NP
includes the same macronutrients as the RRR but does not include cholesterol or
any micronutrients (as is mandatory for labeling in the EU).
Given that more vs. less healthy breakfast cereals are distinguished largely by
their sugar content, it is important for this study to choose a nutrition measurement
that accounts for sugar. As such, the RRR or NP are more appropriate than the CFN
or NFI. Because breakfast cereals are an important source of several
micronutrients, the RRR, which takes several micronutrients into account, generates
a more comprehensive comparison of breakfast cereals than the NP which ignores
all micronutrients. Although ratio-based scores such as the RRR have been
criticized as too complex for consumers to utilize at the point-of-purchase
(Drewnowski and Fulgoni 2014), they are relatively straightforward to calculate
using a spreadsheet. Therefore, the nutrition scores of breakfast cereals for this
study were evaluated using the RRR system, developed by Scheidt and Daniel
(2004).
One of the benefits of the RRR system is that it can be calculated using only the
information provided on the nutrition facts panel which is mandatory on all
processed foods in Canada and many other countries. The concept is quite straight-
forward; the average of % daily value of recommended nutrients (protein, fibre,
calcium, iron, vitamin A, and vitamin C) is in the numerator, while the average of %
daily value of restricted nutrients (calories, sugar, cholesterol, saturated fat, and
sodium) is in the denominator. Therefore a product which contains a higher level of
beneficial nutrients than harmful ones will have a score greater than 1. If two
products are equal in their level of beneficial nutrients but one is higher in sugar,
the item with less sugar will have a higher score. This score is especially useful in
comparing similar products to see which is healthier. Several studies have
employed the RRR to evaluate the nutritional quality of various products (Byrd-
Bredbenner et al 2009, Byrd-Bredbenner et al 2012, Roseman et al 2014, Heller et al
93
2011). Specific to cereal, Roth (2016) used the RRR to compare how nutritious
national brands, organic brands, store brands, and basic brands were in the UK.
Roth found that when aggregated and averaged by brand type, basic brands had the
highest RRR, followed by national then store brands while organic brands had the
lowest average RRR.
4.2.2.2 Price
Classical economic theory suggests that firms in an oligopolistic industry can
compete through quantity (Cournot) or price (Bertrand), each approach having its
own outcomes. When price competition is assumed, Bertrand’s result is that each
firm sets price equal to marginal cost which is the same as the perfectly competitive
outcome. This result depends on several assumptions, however, which are not
necessarily realistic in a real world setting; product homogeneity, identical
production costs, and capacity constraints are all required for the Bertrand result.
According to Schulz and Stahl (1996), with differentiated products sold by
multi-product firms, the oligopolistic prices are higher than the monopolistic prices,
and monopolistic firms offer a larger number of variants than does an oligopolistic
industry. Singh and Vives (1984) find that when goods are substitutes, duopolistic
firms will have higher profits when they compete in quantity rather than price.
Hackner (2000), however, points out that when they extend this model to a larger
number of firms, the advantage of price vs. quantity competition is less clear but
depends somewhat on the degree of quality differentiation. In an experiment on
oligopolistic price competition, Dufwenberg and Gneezy (2000) found that in a
duopoly, prices remained higher than theory predicted, but when 3 or 4 competitors
were present, there was much less cooperation and prices converged rapidly to
theoretical predictions. Kadiyali et al (1996) summarize key findings on price
strategy as 1) the effects of price cuts on market shares are asymmetric, 2) price
behaviour is influenced by a firm’s proportion of loyal customers vs. switchers, and
3) weaker brands should offer price promotions more frequently than a stronger
brand.

94
4.2.2.3 Advertising
When considering the optimal level of advertising, Nelson (1974) points out
that false advertising with respect to search goods of a product will not induce
purchases because consumers can verify claims before purchasing. The same is not
true for experience goods because misleading claims can lead to trial purchases.
Because higher quality brands will garner more repeat purchases than lower quality
ones, ceteris paribus, and thus have higher present values of trial purchases, firms
selling higher quality brands will spend more on advertising them. As such, the
level of advertising, and not the advertising message itself, is an indicator of quality
to many consumers. Schmalensee (1978) agrees that high quality brands have
higher probability of repeat purchases and thus higher present value returns on
advertising, resulting in higher equilibrium market shares. However, depending on
some model parameters, there exist possible equilibria where lower quality brands
have higher advertising expenditures, larger market shares and higher profits than
higher quality brands. Considering the relative advantage of leaders versus
followers, Schmalensee (1982) suggests a model where consumers are skeptical
upon initial introduction of a new brand, but when they are convinced of its quality,
new brands are judged against it. Therefore later entrants have a harder time
convincing consumers to try them than does the first brand. This suggests that
there is an advantage to early product differentiation that is not a function of
advertising. The new entrants who are successful will typically have adequately
differentiated their product from other earlier products to be perceived as
‘pioneering’ to some segment of consumers.
4.2.2.3.1 Corporate Social Responsibility
Corporate Social Responsibility (CSR) has been defined in the business and
economics literature as firms contributing to society in some positive way beyond
the profit-maximizing objective (McWilliams 2000). It can also be viewed as a
marketing tool, providing the consumer with an incentive to purchase a particular
firm’s product regardless of the product’s specific attributes. The most common
approaches to CSR involve environmental protection, community development, and
95
charitable donations, and the food industry participates heavily in the CSR game.
Across Canada, Tim Horton’s sponsors children’s hockey and soccer. McDonald’s
maintains the Ronald McDonald House charity, providing a place for families to stay
when a child needs to be hospitalized away from home. Coca-Cola has incorporated
positive recycling messages into their television commercials. Firms can use many
different ways of contributing positively to society to increase their appeal to
consumers and investors, and to increase their impact, they may choose to focus on
current issues prevalent in the public’s mind. For example, immediately following
the FIFA World Cup in Brazil, Coca-Cola invested in a program developing the skills
of Brazilian youth growing up in Rio De Janeiro’s favelas.
The obesity issue has become a CSR concern which most food companies are
reluctant to ignore, partly due to the threat of regulatory measures, partly to
maintain a positive image in the public’s eye (Lee et al 2013). Whether or not they
felt they had a choice, food companies have reacted to this issue through a variety of
measures including provision of nutrition information, decreasing portion sizes, and
product reformulation. Whole Foods Market offers products differentiated as
healthier and is consistently growing sales and profits while doing it (Galbreath
2009). By expressing concern for the health and well-being of the population, a food
manufacturing firm can secure brand value and consumer goodwill (Herrick 2009).
CSR measures taken by food companies have been negatively received by many,
however, who claim that their main approach is to transfer responsibility to
personal willpower (Lee et al 2013). According to Richards et al (2015), the
manufacturers of processed ‘junk’ foods and beverages use “public relations
campaigns and public statements to state company concerns about the health of
their customers and populations… [then utilize] tactical campaigns that emphasize
freedom of choice and personal responsibility to encourage consumers to oppose
regulation of the industry” (pg. 550). One example of this is Coca-Cola’s two-minute
television commercial emphasizing that they have low-calorie options available and
that overconsumption of calories will lead to weight gain.
Many companies discuss their CSR approaches in their annual reports which
are available online for those which are publicly traded. Coca-Cola Enterprises Inc.
96
states that their CSR focus is “from recycling, water use, and climate change, to our
product portfolio and encouraging active healthy living in our workplace and
communities”(pg.13). Tim Horton’s CSR section of their 2014 Sustainability and
Responsibility Report focused mainly on charitable activities and environmental
impact goals. The nutrition section mentioned the reduction of sodium in their
menu items as well as increasing the number of healthier options available. In their
2015 Global Responsibility Report, General Mills highlighted the number of food
donations they make to food banks and disaster relief efforts, as well as the fact that
they fund cooking classes, nutrition education, and active living programs in the US,
and have improved over 850 of their products from a nutritional standpoint since
2005. Kellogg’s 2014 corporate responsibility report discussed their commitments
to the environment, sustainable sourcing of ingredients, and charitable donations,
along with their goals to increase the fibre and protein content of their products
while lowering the sugar and sodium content. They also highlighted the fact that
they support nutrition research and education.
4.2.2.4 Product Line Extensions
Product line extensions are an important facet of a firm’s strategy, especially in
the market for nondurable goods (Kadiayli et al 1998, Bayus and Putsis 1999,
Draganska and Jain 2005). In the food industry, product line extensions are
typically new varieties of goods already in the firm’s portfolio, such as a lower-fat,
probiotic, or different flavoured yogurts by Yoplait. In 1991, 89% of new
(nondurable) products sold by retailers were extensions of existing lines (Kadiayli
et al 1998). Line extensions can be used to meet the demands of different consumer
segments, to give consumers variety, to increase the firm’s shelf space, to
cannibalize lagging or competing products, or to compete with a new product of a
rival firm. Having large product lines can also deter entry by new firms, potentially
allowing the incumbent firm to raise prices (Bayus and Putsis 1999). In response to
a line extension, a rival firm may adjust their price or advertising strategy, target
new consumer segments, or extend one of their existing product lines. In a case
study on Yoplait and Dannon yogurts, Kadiayli et al found that when Yoplait
extended its product line, it won price-setting power from Dannon, and this shift led
97
to higher prices, margins, and profits for both firms despite cannibalization of pre-
extension sales. Also examining the market for yogurt, Draganska and Jain (2005)
found that there are decreasing returns to length of product line. In the breakfast
cereal industry, price competition is avoided and rivalry is channeled largely into
product line extensions, which tends to deter entry by new firms (Schmalensee
1978).
4.2.3 Breakfast cereal industry
According to Nevo (2001), the breakfast cereal industry is highly concentrated,
has high advertising to sales ratios, has high price cost margins, and has frequent
introduction of new products. In 1972, the US Federal Trade Commission issued a
complaint against the top four breakfast cereal manufacturers in the US: Kellogg’s,
General Mills, Post, and Quaker Oats for using product differentiation, brand
proliferation, and trademark promotion through intensive advertising to create high
barriers to entry in the breakfast cereal market (Schmalensee 1978). Despite claims
that collusive pricing behaviour exists in the breakfast cereal industry, Nevo (2001)
was able to separate the price cost margins into that which is due to 1) product
differentiation, 2) multi-product firm pricing, and 3) potential price collusion. He
concluded that the industry is non-collusive in its pricing behaviour and that the
high price cost margins can be attributed to differentiated product portfolios and
using advertising to enhance perceived product quality. Advertising to sales ratios
in the breakfast cereal industry were approximately 13% in 2001 (as high as 18%
for well established brands), relatively higher than the typical 2-4% of other food
products (Nevo 2001). He further states that the main firms in the industry neither
compete nor collude in prices but rather that rivalry is channeled into aggressive
new product introduction and advertising. The frequent product introductions by
the main multi-product firms result in high product differentiation with many
available products of varying degrees of quality. (For the purposes of this paper,
quality in the context of breakfast cereals will be with respect to nutrition.)
Therefore, given how concentrated the industry is, established firms may deter
entry to new firms by providing healthy cereal options if they anticipate new firms
98
focusing on health. In addition, Anderson and de Palma (1992) show that consumers
have heterogeneous preferences for variety and that in an oligopolistic industry, the
amount of variety desired by consumers influences the number of firms that can
operate within that product space. Connor (1999) points out that the cereal
industry has a unique mixture of incredibly long-running brands – Kellogg’s Corn
Flakes have been around since 1902 – and varieties that are available for very short
times, often less than a year. He also posits that new product introductions are one
of the main ways that breakfast cereal manufacturers affect price increases. While
the role of breakfast cereals in the North American diet has been changing in recent
years, with some people moving towards more convenient, grab-and-go options
(Harris, 2017), a 2018 poll found that 90% of Canadians still eat cereal, with over
50% consuming it one to three times per week (Food in Canada 2018).
It should be noted that both Kellogg’s and General Mills (the firms we will be
more closely examining) are very old companies with different strategies. Kellogg’s
was founded in 1898 and its focus has generally been on breakfast cereals, also
adding snack categories since around 2000, purchasing the Keebler company,
Cheez-it, Famous Amos, and Pringles since then. In 2016, Kellogg’s CEO reported
that its cereal business now contributes around 42% to their product portfolio
(Davis 2016). General Mills was founded in 1928 and has been involved in a
broader range of product categories over the years. They’ve ventured into toys
(Parker Bros), aeronautical research, and TV shows. In 1970 they acquired the five
unit restaurant chain Red Lobster and expanded it, also adding Good Earth and Olive
Garden into their restaurant portfolio over the years. This branch of the company
was spun off into Darden Restaurants in 1995. Around this time, General Mills
decided to refocus on foods, and now owns Pillsbury, Betty Crocker, Bisquick,
Bugles, Nature Valley, Old El Paso, Hamburger Helper, Haagen Dazs, and a
controlling share in Yoplait. In 2016, General Mills became the third largest
producer of organic food in the US (General Mills 2018). In the US, cereal is now
their second largest product category, just behind meal offerings such as soups, taco
ingredients, pizza, and dinner kits.
99
Given that breakfast cereals compete largely through advertising, Clark (2007)
explored the possibility that the ban on advertising to children in Quebec could have
resulted in unintentionally hindering competition. He found that the prices of
children’s cereals in Quebec were higher than in the rest of Canada despite the
prices of adult and family cereals being consistent across the country. This is likely
explained by the absence of informative advertising resulting in higher perceived
product differentiation which hinders price competition. Established children’s
brands thus benefit from the advertising ban because newer products cannot
advertise to announce their existence to children.
Canadians spend about $1.4 billion annually on breakfast cereals
(Euromonitor 2014), eating a little over 4kg of cereal per capita annually (Precision
Nutrition 2015), however other types of breakfast such as breakfast sandwiches and
yogurt based meals are increasing the competition breakfast cereals face. In 2009,
79% of households reported consuming cereal in the past 6 months, but this
number dropped to 67.1%by 2015 (PMB 2015). The main drivers of breakfast food
choices are health and convenience, according to the 2008 NPD Eating Patterns in
Canada Report (AAF 2009). Kellogg’s Canada Inc., General Mills Canada Corp, and
Pepsi-QTG Canada Inc. (producer of Quaker Oats products) together account for
75% of the breakfast cereal sales in Canada, with Kellogg’s Special K being having
the highest value share at 12% (Euromonitor 2014). Data collected by the Print
Measurement Bureau shows the most common types of cereal used in Canada are
multigrain and bran, while General Mills’ Cheerios are the most frequently
consumed (PMB 2015). In 2013 in the US alone, over $500 million was spent on
advertising breakfast cereals (Nestle 2013). The advertising of nutritionally poor
foods to children has been touted as one of the causes of the rising incidence of
childhood obesity (Veerman et al 2009). Schwartz et al (2008) found that breakfast
cereals marketed towards children were higher in sugar and lower in fibre and
protein than those targeted at adults. LoDolce et al (2013) found that high-sugar
breakfast cereals were the most commonly advertised packaged food to children on
TV.
100
While many cereal manufacturers are modifying their products targeted at
children to be healthier, they continue to target advertising of their least healthy
products towards children (Baertlein 2012). This isn’t always done through
traditional media; it is often achieved through the use of cartoon characters and
bright colours to appeal to children. Breakfast cereal manufacturers General Mills,
Kellogg’s, and Post are among the companies that are part of the voluntary, self-
regulated Council of Better Business Bureaus’ Children’s Food and Beverage
Advertising Initiative (CFBAI), in which the participants have agreed to only
advertise products meeting an industry-created nutrient criteria to children under
12. On the one hand, critics have argued that the standards (especially sugar limits)
are not good enough, and thus high sugar products are being promoted to children,
but on the other hand, many firms have reduced the amount of sugar in their
products to meet this standard (Baertlein 2012). A study examining the foods
targeted at children based on their packaging found that 90% of the breakfast
cereals targeting children were rated as nutritionally poor based on the high sugar
content (Elliott 2008).
4.3 Objectives and Research Question
The overall goal of this dissertation is to evaluate the effectiveness of potential
policy instruments in improving children’s diets. This study explores firm
behaviour in the breakfast cereal industry to see how various factors influence the
nutritional profile of food products and how the top breakfast cereal manufacturers
compare in terms of nutritional quality. Firms may reformulate their products in
response to public awareness of different nutrients, in which case educating
consumers about nutrition would result in healthier food products being
maunfactured. It is possible that the primary determinant of a food’s nutritional
profile is simply the relative prices of inputs. Recommendations and regulations
(such as those to reduce sodium in the food supply or mandatory labeling of trans
fats) could also influence how firms choose to formulate their products. We also
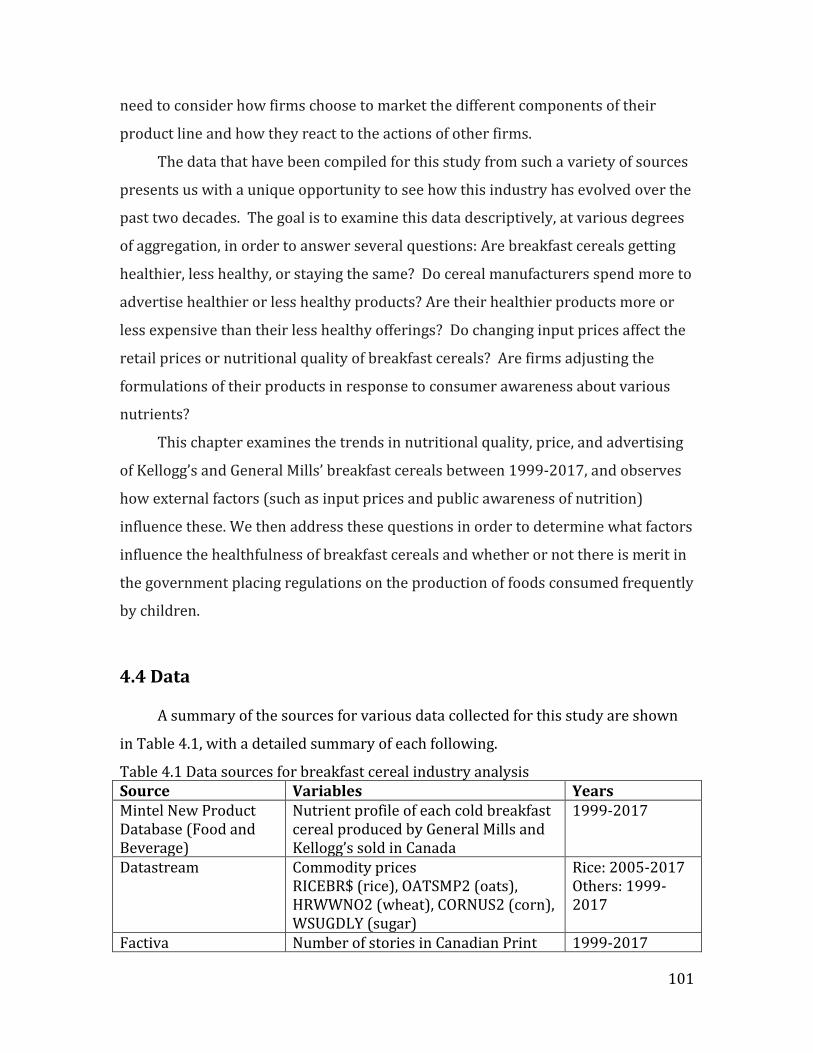
101
need to consider how firms choose to market the different components of their
product line and how they react to the actions of other firms.
The data that have been compiled for this study from such a variety of sources
presents us with a unique opportunity to see how this industry has evolved over the
past two decades. The goal is to examine this data descriptively, at various degrees
of aggregation, in order to answer several questions: Are breakfast cereals getting
healthier, less healthy, or staying the same? Do cereal manufacturers spend more to
advertise healthier or less healthy products? Are their healthier products more or
less expensive than their less healthy offerings? Do changing input prices affect the
retail prices or nutritional quality of breakfast cereals? Are firms adjusting the
formulations of their products in response to consumer awareness about various
nutrients?
This chapter examines the trends in nutritional quality, price, and advertising
of Kellogg’s and General Mills’ breakfast cereals between 1999-2017, and observes
how external factors (such as input prices and public awareness of nutrition)
influence these. We then address these questions in order to determine what factors
influence the healthfulness of breakfast cereals and whether or not there is merit in
the government placing regulations on the production of foods consumed frequently
by children.
4.4 Data
A summary of the sources for various data collected for this study are shown
in Table 4.1, with a detailed summary of each following.
Table 4.1 Data sources for breakfast cereal industry analysis Source Variables Years Mintel New Product Database (Food and Beverage)
Nutrient profile of each cold breakfast cereal produced by General Mills and Kellogg’s sold in Canada
1999-2017
Datastream Commodity prices RICEBR$ (rice), OATSMP2 (oats), HRWWNO2 (wheat), CORNUS2 (corn), WSUGDLY (sugar)
Rice: 2005-2017 Others: 1999-2017
Factiva Number of stories in Canadian Print 1999-2017
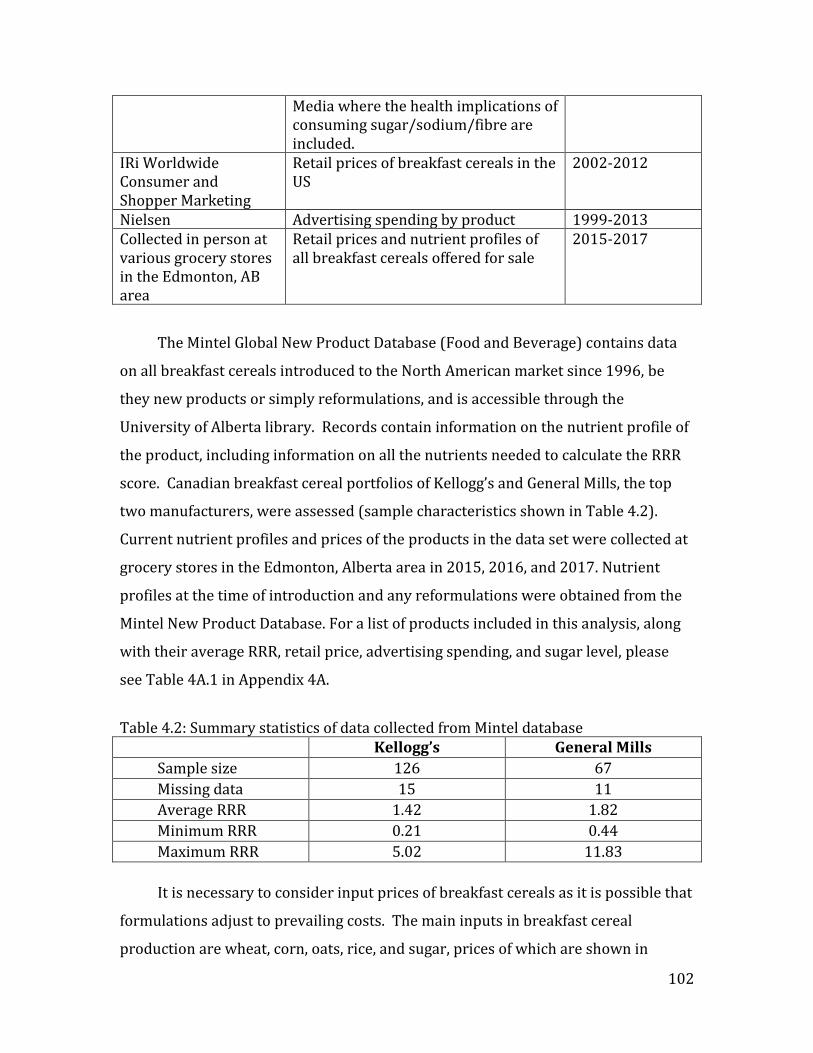
102
Media where the health implications of consuming sugar/sodium/fibre are included.
IRi Worldwide Consumer and Shopper Marketing
Retail prices of breakfast cereals in the US
2002-2012
Nielsen Advertising spending by product 1999-2013 Collected in person at various grocery stores in the Edmonton, AB area
Retail prices and nutrient profiles of all breakfast cereals offered for sale
2015-2017
The Mintel Global New Product Database (Food and Beverage) contains data
on all breakfast cereals introduced to the North American market since 1996, be
they new products or simply reformulations, and is accessible through the
University of Alberta library. Records contain information on the nutrient profile of
the product, including information on all the nutrients needed to calculate the RRR
score. Canadian breakfast cereal portfolios of Kellogg’s and General Mills, the top
two manufacturers, were assessed (sample characteristics shown in Table 4.2).
Current nutrient profiles and prices of the products in the data set were collected at
grocery stores in the Edmonton, Alberta area in 2015, 2016, and 2017. Nutrient
profiles at the time of introduction and any reformulations were obtained from the
Mintel New Product Database. For a list of products included in this analysis, along
with their average RRR, retail price, advertising spending, and sugar level, please
see Table 4A.1 in Appendix 4A.
Table 4.2: Summary statistics of data collected from Mintel database Kellogg’s General Mills
Sample size 126 67
Missing data 15 11
Average RRR 1.42 1.82
Minimum RRR 0.21 0.44
Maximum RRR 5.02 11.83
It is necessary to consider input prices of breakfast cereals as it is possible that
formulations adjust to prevailing costs. The main inputs in breakfast cereal
production are wheat, corn, oats, rice, and sugar, prices of which are shown in
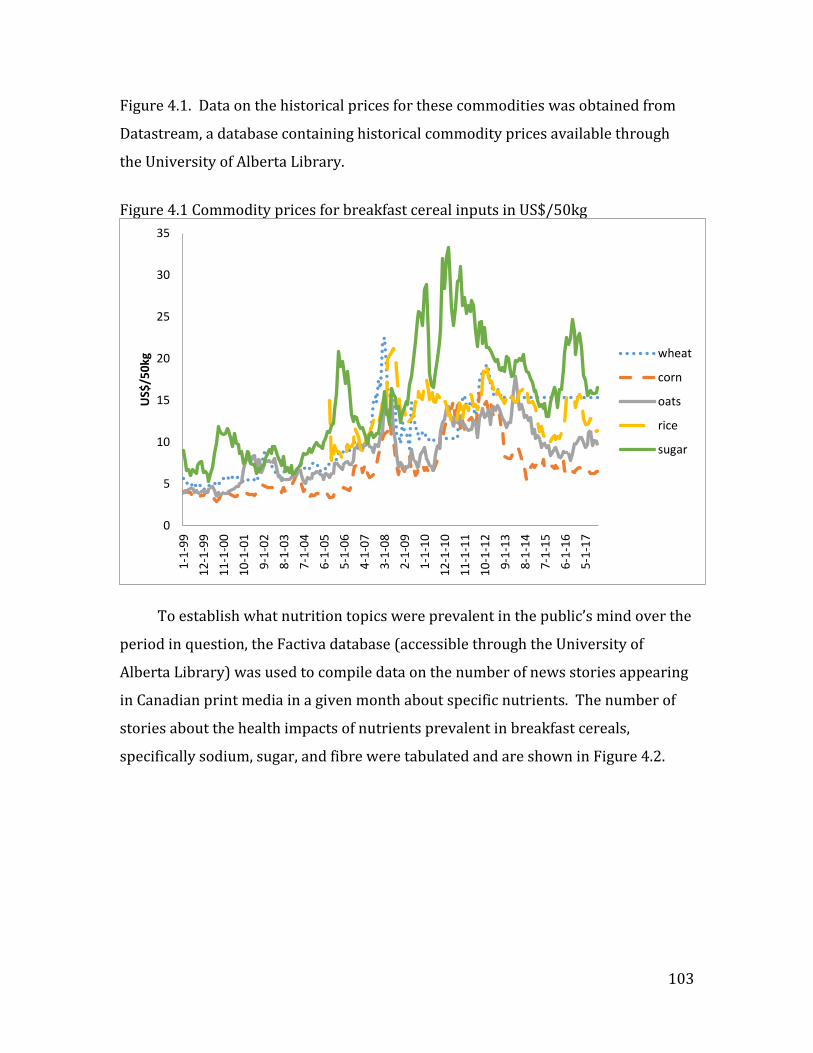
103
Figure 4.1. Data on the historical prices for these commodities was obtained from
Datastream, a database containing historical commodity prices available through
the University of Alberta Library.
Figure 4.1 Commodity prices for breakfast cereal inputs in US$/50kg
To establish what nutrition topics were prevalent in the public’s mind over the
period in question, the Factiva database (accessible through the University of
Alberta Library) was used to compile data on the number of news stories appearing
in Canadian print media in a given month about specific nutrients. The number of
stories about the health impacts of nutrients prevalent in breakfast cereals,
specifically sodium, sugar, and fibre were tabulated and are shown in Figure 4.2.
0
5
10
15
20
25
30
35
1-1
-99
12
-1-9
9
11
-1-0
0
10
-1-0
1
9-1
-02
8-1
-03
7-1
-04
6-1
-05
5-1
-06
4-1
-07
3-1
-08
2-1
-09
1-1
-10
12
-1-1
0
11
-1-1
1
10
-1-1
2
9-1
-13
8-1
-14
7-1
-15
6-1
-16
5-1
-17
US$
/50
kg
wheat
corn
oats
rice
sugar
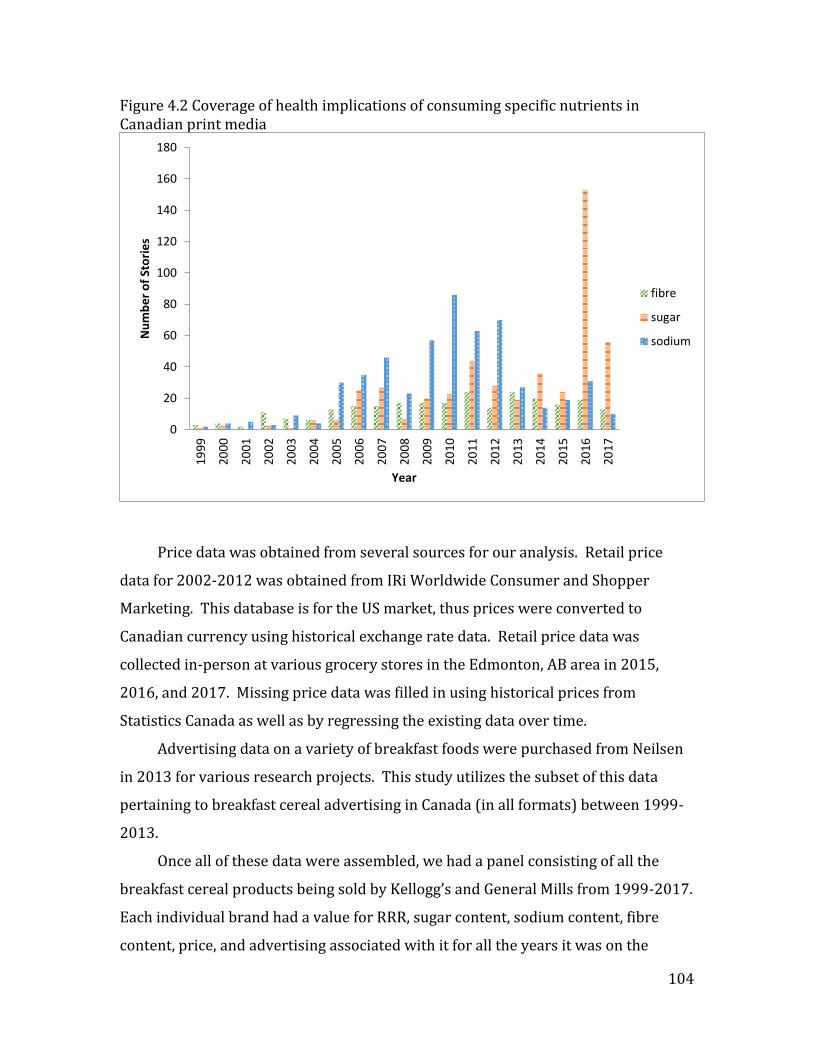
104
Figure 4.2 Coverage of health implications of consuming specific nutrients in Canadian print media
Price data was obtained from several sources for our analysis. Retail price
data for 2002-2012 was obtained from IRi Worldwide Consumer and Shopper
Marketing. This database is for the US market, thus prices were converted to
Canadian currency using historical exchange rate data. Retail price data was
collected in-person at various grocery stores in the Edmonton, AB area in 2015,
2016, and 2017. Missing price data was filled in using historical prices from
Statistics Canada as well as by regressing the existing data over time.
Advertising data on a variety of breakfast foods were purchased from Neilsen
in 2013 for various research projects. This study utilizes the subset of this data
pertaining to breakfast cereal advertising in Canada (in all formats) between 1999-
2013.
Once all of these data were assembled, we had a panel consisting of all the
breakfast cereal products being sold by Kellogg’s and General Mills from 1999-2017.
Each individual brand had a value for RRR, sugar content, sodium content, fibre
content, price, and advertising associated with it for all the years it was on the
0
20
40
60
80
100
120
140
160
180
19
99
20
00
20
01
20
02
20
03
20
04
20
05
20
06
20
07
20
08
20
09
20
10
20
11
20
12
20
13
20
14
20
15
20
16
20
17
Nu
mb
er
of
Sto
rie
s
Year
fibre
sugar
sodium
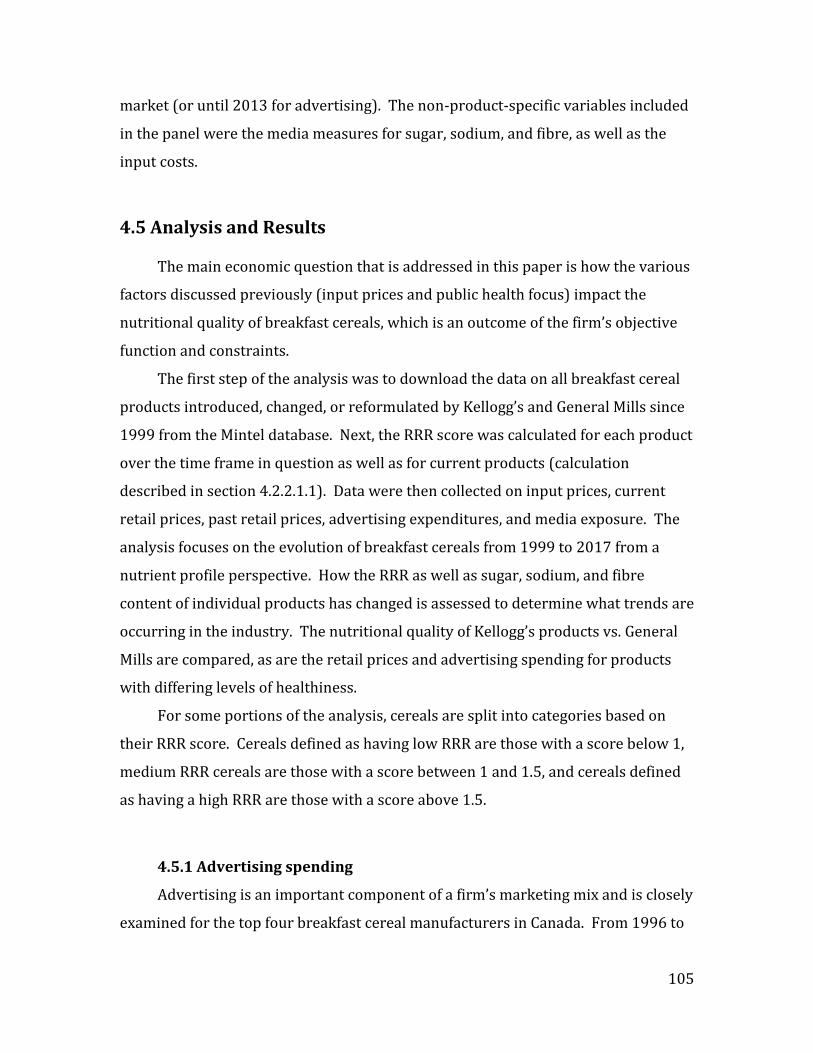
105
market (or until 2013 for advertising). The non-product-specific variables included
in the panel were the media measures for sugar, sodium, and fibre, as well as the
input costs.
4.5 Analysis and Results
The main economic question that is addressed in this paper is how the various
factors discussed previously (input prices and public health focus) impact the
nutritional quality of breakfast cereals, which is an outcome of the firm’s objective
function and constraints.
The first step of the analysis was to download the data on all breakfast cereal
products introduced, changed, or reformulated by Kellogg’s and General Mills since
1999 from the Mintel database. Next, the RRR score was calculated for each product
over the time frame in question as well as for current products (calculation
described in section 4.2.2.1.1). Data were then collected on input prices, current
retail prices, past retail prices, advertising expenditures, and media exposure. The
analysis focuses on the evolution of breakfast cereals from 1999 to 2017 from a
nutrient profile perspective. How the RRR as well as sugar, sodium, and fibre
content of individual products has changed is assessed to determine what trends are
occurring in the industry. The nutritional quality of Kellogg’s products vs. General
Mills are compared, as are the retail prices and advertising spending for products
with differing levels of healthiness.
For some portions of the analysis, cereals are split into categories based on
their RRR score. Cereals defined as having low RRR are those with a score below 1,
medium RRR cereals are those with a score between 1 and 1.5, and cereals defined
as having a high RRR are those with a score above 1.5.
4.5.1 Advertising spending
Advertising is an important component of a firm’s marketing mix and is closely
examined for the top four breakfast cereal manufacturers in Canada. From 1996 to
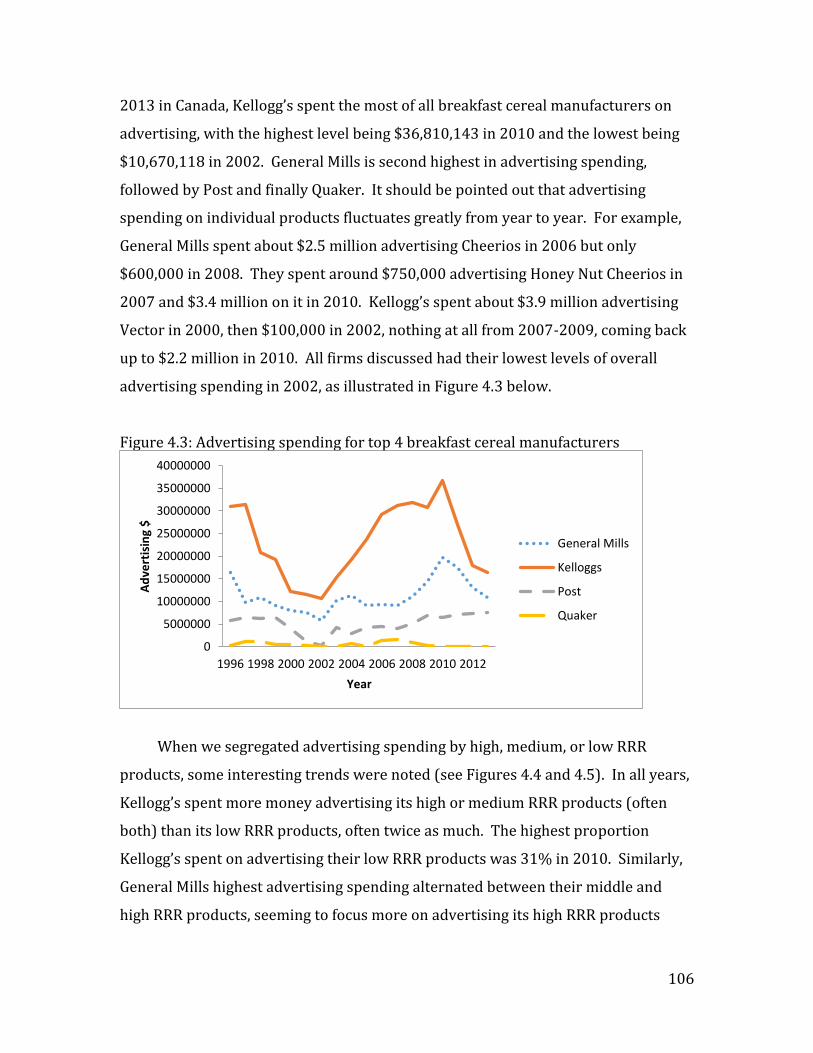
106
2013 in Canada, Kellogg’s spent the most of all breakfast cereal manufacturers on
advertising, with the highest level being $36,810,143 in 2010 and the lowest being
$10,670,118 in 2002. General Mills is second highest in advertising spending,
followed by Post and finally Quaker. It should be pointed out that advertising
spending on individual products fluctuates greatly from year to year. For example,
General Mills spent about $2.5 million advertising Cheerios in 2006 but only
$600,000 in 2008. They spent around $750,000 advertising Honey Nut Cheerios in
2007 and $3.4 million on it in 2010. Kellogg’s spent about $3.9 million advertising
Vector in 2000, then $100,000 in 2002, nothing at all from 2007-2009, coming back
up to $2.2 million in 2010. All firms discussed had their lowest levels of overall
advertising spending in 2002, as illustrated in Figure 4.3 below.
Figure 4.3: Advertising spending for top 4 breakfast cereal manufacturers
When we segregated advertising spending by high, medium, or low RRR
products, some interesting trends were noted (see Figures 4.4 and 4.5). In all years,
Kellogg’s spent more money advertising its high or medium RRR products (often
both) than its low RRR products, often twice as much. The highest proportion
Kellogg’s spent on advertising their low RRR products was 31% in 2010. Similarly,
General Mills highest advertising spending alternated between their middle and
high RRR products, seeming to focus more on advertising its high RRR products
0
5000000
10000000
15000000
20000000
25000000
30000000
35000000
40000000
1996 1998 2000 2002 2004 2006 2008 2010 2012
Ad
vert
isin
g $
Year
General Mills
Kelloggs
Post
Quaker
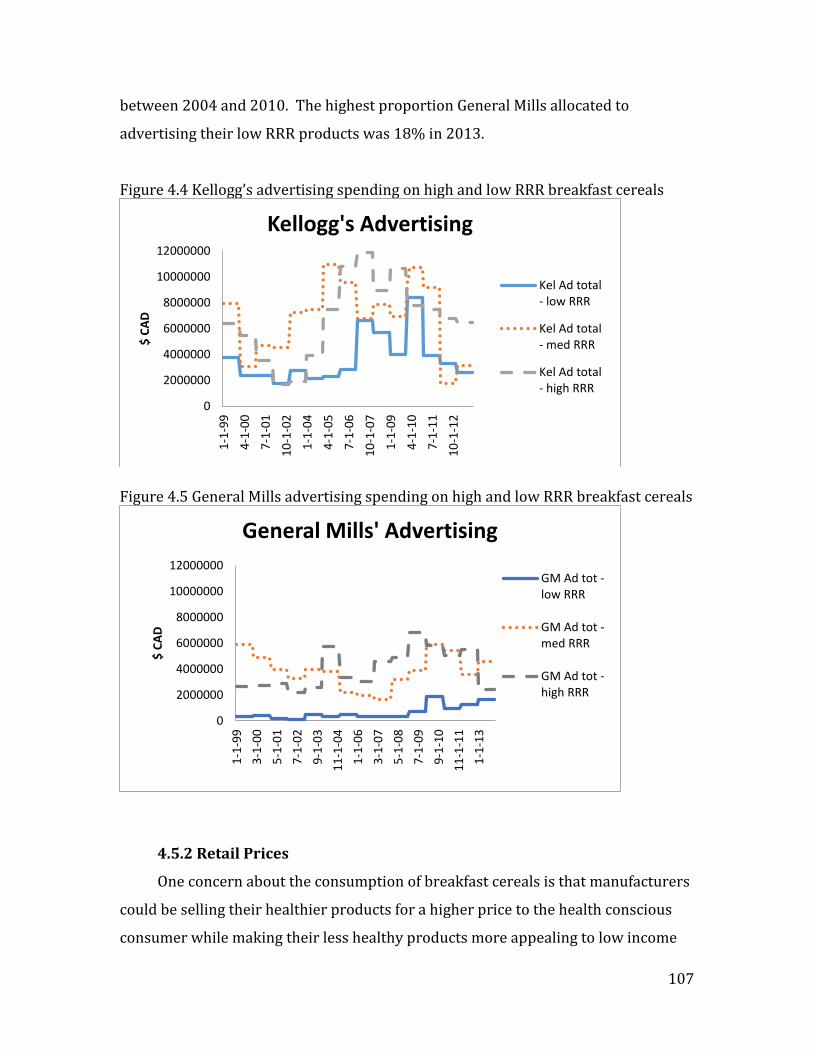
107
between 2004 and 2010. The highest proportion General Mills allocated to
advertising their low RRR products was 18% in 2013.
Figure 4.4 Kellogg’s advertising spending on high and low RRR breakfast cereals
Figure 4.5 General Mills advertising spending on high and low RRR breakfast cereals
4.5.2 Retail Prices
One concern about the consumption of breakfast cereals is that manufacturers
could be selling their healthier products for a higher price to the health conscious
consumer while making their less healthy products more appealing to low income
0
2000000
4000000
6000000
8000000
10000000
12000000
1-1
-99
4-1
-00
7-1
-01
10
-1-0
2
1-1
-04
4-1
-05
7-1
-06
10
-1-0
7
1-1
-09
4-1
-10
7-1
-11
10
-1-1
2
$ C
AD
Kellogg's Advertising
Kel Ad total- low RRR
Kel Ad total- med RRR
Kel Ad total- high RRR
0
2000000
4000000
6000000
8000000
10000000
12000000
1-1
-99
3-1
-00
5-1
-01
7-1
-02
9-1
-03
11
-1-0
4
1-1
-06
3-1
-07
5-1
-08
7-1
-09
9-1
-10
11
-1-1
1
1-1
-13
$ C
AD
General Mills' Advertising
GM Ad tot -low RRR
GM Ad tot -med RRR
GM Ad tot -high RRR
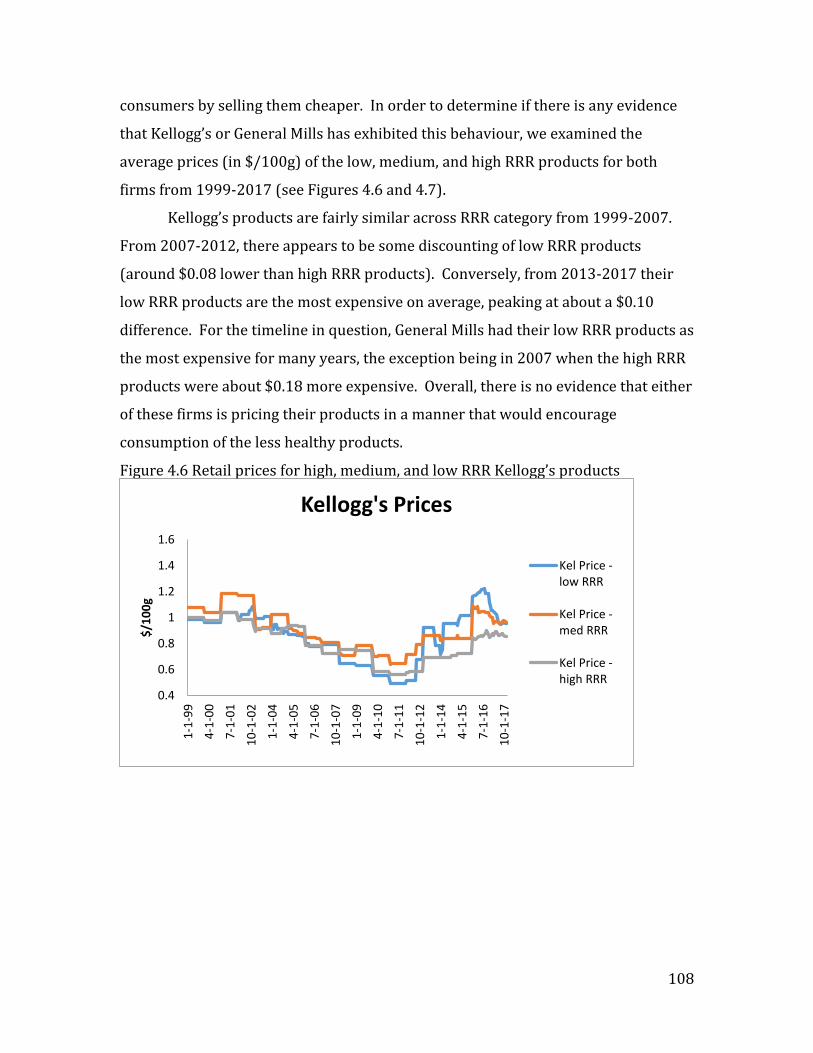
108
consumers by selling them cheaper. In order to determine if there is any evidence
that Kellogg’s or General Mills has exhibited this behaviour, we examined the
average prices (in $/100g) of the low, medium, and high RRR products for both
firms from 1999-2017 (see Figures 4.6 and 4.7).
Kellogg’s products are fairly similar across RRR category from 1999-2007.
From 2007-2012, there appears to be some discounting of low RRR products
(around $0.08 lower than high RRR products). Conversely, from 2013-2017 their
low RRR products are the most expensive on average, peaking at about a $0.10
difference. For the timeline in question, General Mills had their low RRR products as
the most expensive for many years, the exception being in 2007 when the high RRR
products were about $0.18 more expensive. Overall, there is no evidence that either
of these firms is pricing their products in a manner that would encourage
consumption of the less healthy products.
Figure 4.6 Retail prices for high, medium, and low RRR Kellogg’s products
0.4
0.6
0.8
1
1.2
1.4
1.6
1-1
-99
4-1
-00
7-1
-01
10
-1-0
2
1-1
-04
4-1
-05
7-1
-06
10
-1-0
7
1-1
-09
4-1
-10
7-1
-11
10
-1-1
2
1-1
-14
4-1
-15
7-1
-16
10
-1-1
7
$/1
00
g
Kellogg's Prices
Kel Price -low RRR
Kel Price -med RRR
Kel Price -high RRR
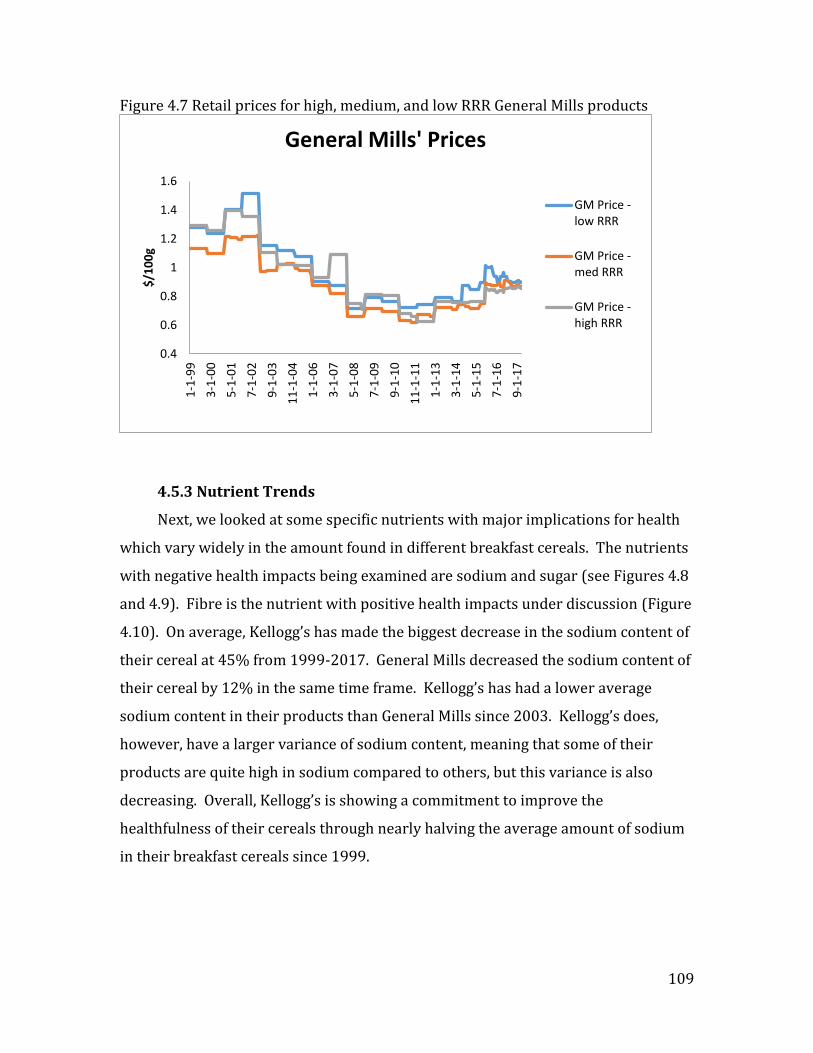
109
Figure 4.7 Retail prices for high, medium, and low RRR General Mills products
4.5.3 Nutrient Trends
Next, we looked at some specific nutrients with major implications for health
which vary widely in the amount found in different breakfast cereals. The nutrients
with negative health impacts being examined are sodium and sugar (see Figures 4.8
and 4.9). Fibre is the nutrient with positive health impacts under discussion (Figure
4.10). On average, Kellogg’s has made the biggest decrease in the sodium content of
their cereal at 45% from 1999-2017. General Mills decreased the sodium content of
their cereal by 12% in the same time frame. Kellogg’s has had a lower average
sodium content in their products than General Mills since 2003. Kellogg’s does,
however, have a larger variance of sodium content, meaning that some of their
products are quite high in sodium compared to others, but this variance is also
decreasing. Overall, Kellogg’s is showing a commitment to improve the
healthfulness of their cereals through nearly halving the average amount of sodium
in their breakfast cereals since 1999.
0.4
0.6
0.8
1
1.2
1.4
1.61
-1-9
9
3-1
-00
5-1
-01
7-1
-02
9-1
-03
11
-1-0
4
1-1
-06
3-1
-07
5-1
-08
7-1
-09
9-1
-10
11
-1-1
1
1-1
-13
3-1
-14
5-1
-15
7-1
-16
9-1
-17
$/1
00
gGeneral Mills' Prices
GM Price -low RRR
GM Price -med RRR
GM Price -high RRR
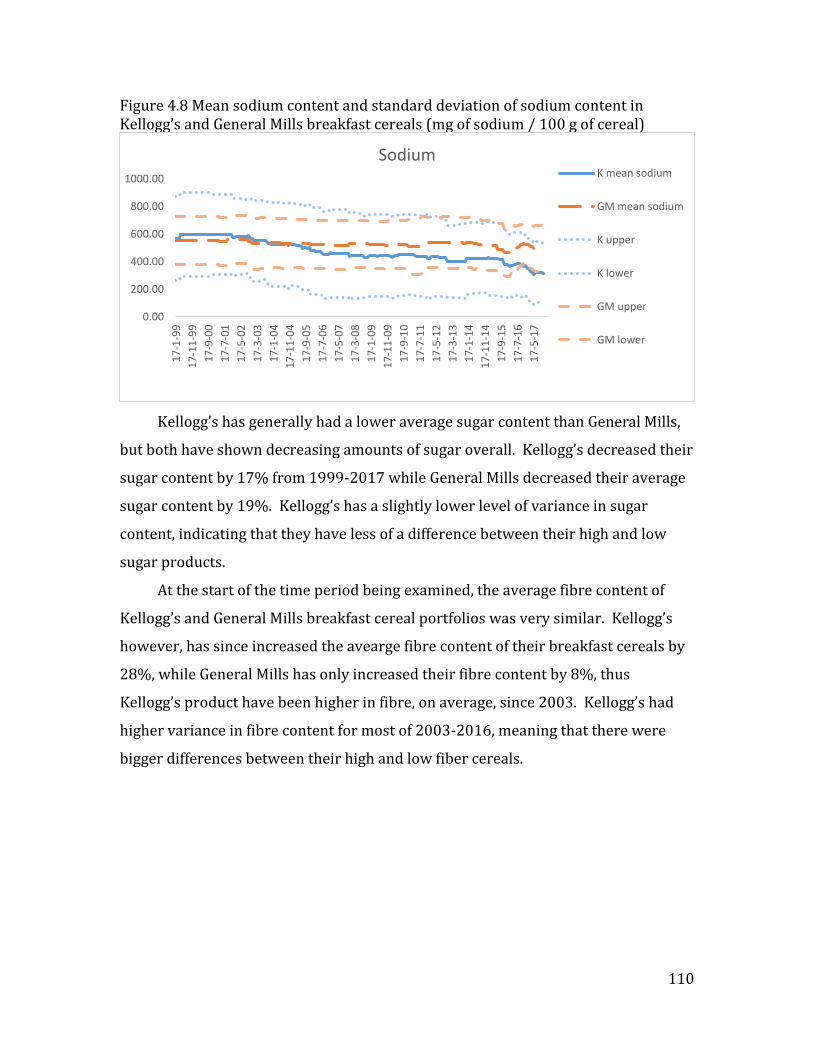
110
Figure 4.8 Mean sodium content and standard deviation of sodium content in Kellogg’s and General Mills breakfast cereals (mg of sodium / 100 g of cereal)
Kellogg’s has generally had a lower average sugar content than General Mills,
but both have shown decreasing amounts of sugar overall. Kellogg’s decreased their
sugar content by 17% from 1999-2017 while General Mills decreased their average
sugar content by 19%. Kellogg’s has a slightly lower level of variance in sugar
content, indicating that they have less of a difference between their high and low
sugar products.
At the start of the time period being examined, the average fibre content of
Kellogg’s and General Mills breakfast cereal portfolios was very similar. Kellogg’s
however, has since increased the avearge fibre content of their breakfast cereals by
28%, while General Mills has only increased their fibre content by 8%, thus
Kellogg’s product have been higher in fibre, on average, since 2003. Kellogg’s had
higher variance in fibre content for most of 2003-2016, meaning that there were
bigger differences between their high and low fiber cereals.
0.00
200.00
400.00
600.00
800.00
1000.001
7-1
-99
17
-11
-99
17
-9-0
0
17
-7-0
1
17
-5-0
2
17
-3-0
3
17
-1-0
4
17
-11
-04
17
-9-0
5
17
-7-0
6
17
-5-0
7
17
-3-0
8
17
-1-0
9
17
-11
-09
17
-9-1
0
17
-7-1
1
17
-5-1
2
17
-3-1
3
17
-1-1
4
17
-11
-14
17
-9-1
5
17
-7-1
6
17
-5-1
7
SodiumK mean sodium
GM mean sodium
K upper
K lower
GM upper
GM lower
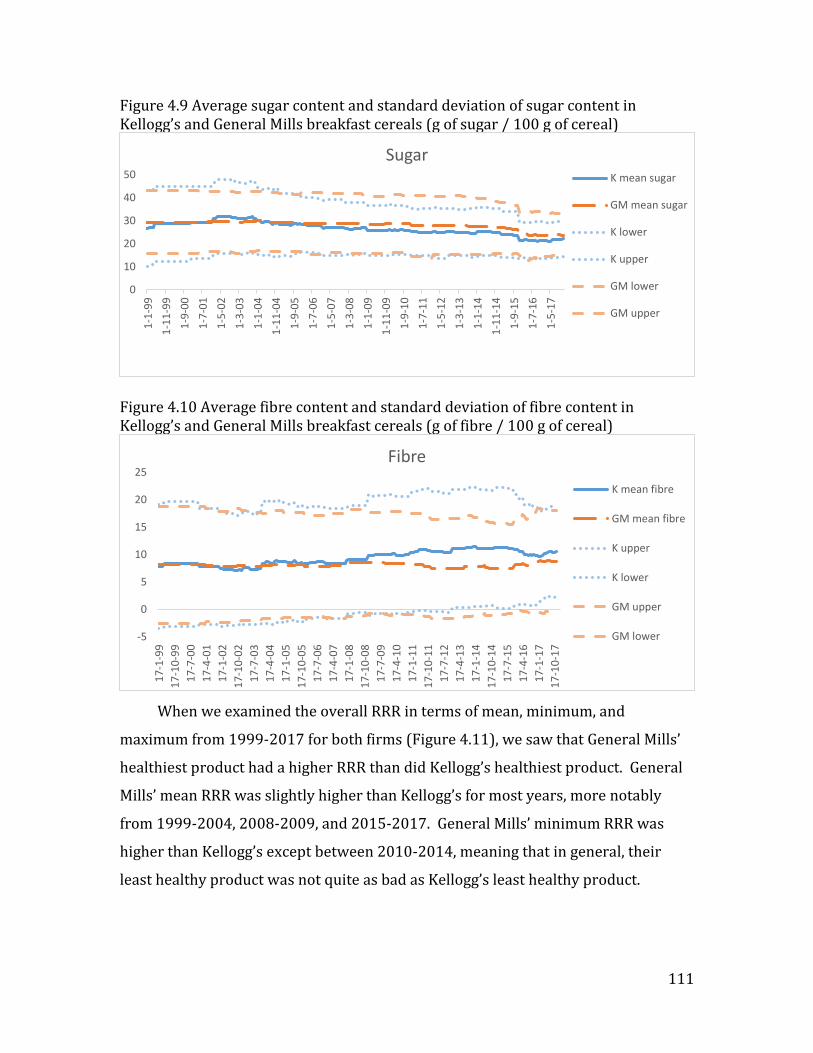
111
Figure 4.9 Average sugar content and standard deviation of sugar content in Kellogg’s and General Mills breakfast cereals (g of sugar / 100 g of cereal)
Figure 4.10 Average fibre content and standard deviation of fibre content in Kellogg’s and General Mills breakfast cereals (g of fibre / 100 g of cereal)
When we examined the overall RRR in terms of mean, minimum, and
maximum from 1999-2017 for both firms (Figure 4.11), we saw that General Mills’
healthiest product had a higher RRR than did Kellogg’s healthiest product. General
Mills’ mean RRR was slightly higher than Kellogg’s for most years, more notably
from 1999-2004, 2008-2009, and 2015-2017. General Mills’ minimum RRR was
higher than Kellogg’s except between 2010-2014, meaning that in general, their
least healthy product was not quite as bad as Kellogg’s least healthy product.
0
10
20
30
40
50
1-1
-99
1-1
1-9
9
1-9
-00
1-7
-01
1-5
-02
1-3
-03
1-1
-04
1-1
1-0
4
1-9
-05
1-7
-06
1-5
-07
1-3
-08
1-1
-09
1-1
1-0
9
1-9
-10
1-7
-11
1-5
-12
1-3
-13
1-1
-14
1-1
1-1
4
1-9
-15
1-7
-16
1-5
-17
SugarK mean sugar
GM mean sugar
K lower
K upper
GM lower
GM upper
-5
0
5
10
15
20
25
17
-1-9
9
17
-10
-99
17
-7-0
0
17
-4-0
1
17
-1-0
2
17
-10
-02
17
-7-0
3
17
-4-0
4
17
-1-0
5
17
-10
-05
17
-7-0
6
17
-4-0
7
17
-1-0
8
17
-10
-08
17
-7-0
9
17
-4-1
0
17
-1-1
1
17
-10
-11
17
-7-1
2
17
-4-1
3
17
-1-1
4
17
-10
-14
17
-7-1
5
17
-4-1
6
17
-1-1
7
17
-10
-17
Fibre
K mean fibre
GM mean fibre
K upper
K lower
GM upper
GM lower
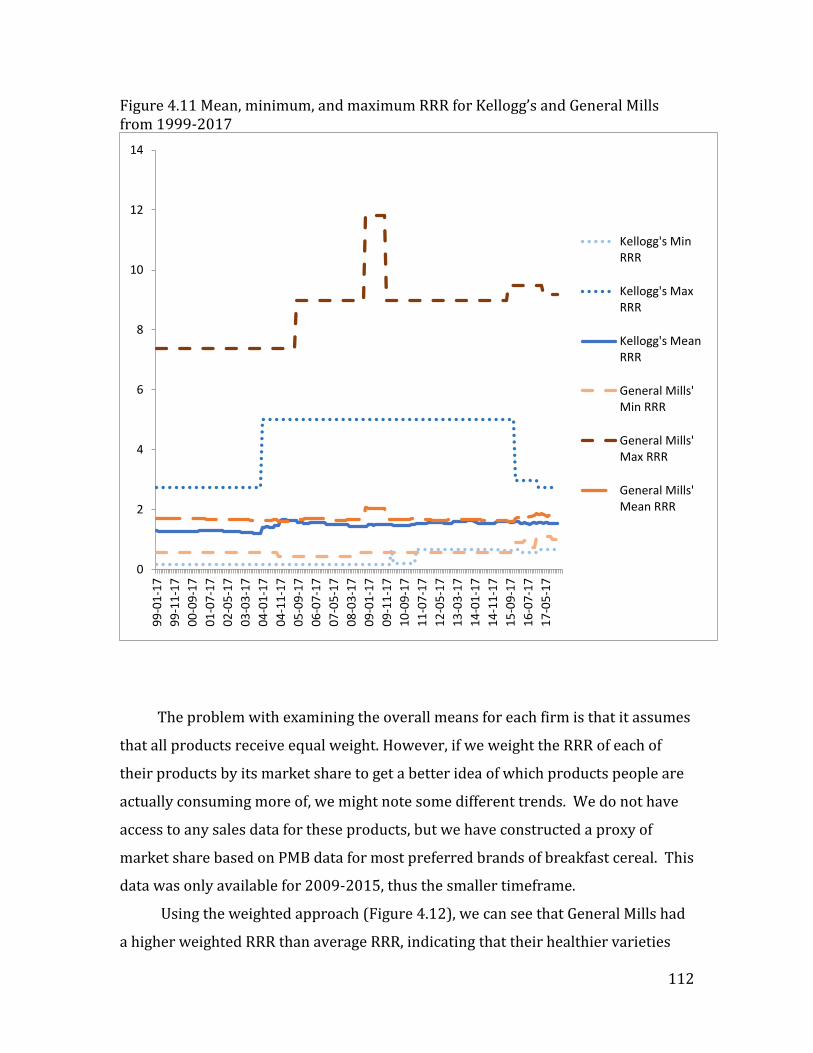
112
Figure 4.11 Mean, minimum, and maximum RRR for Kellogg’s and General Mills from 1999-2017
The problem with examining the overall means for each firm is that it assumes
that all products receive equal weight. However, if we weight the RRR of each of
their products by its market share to get a better idea of which products people are
actually consuming more of, we might note some different trends. We do not have
access to any sales data for these products, but we have constructed a proxy of
market share based on PMB data for most preferred brands of breakfast cereal. This
data was only available for 2009-2015, thus the smaller timeframe.
Using the weighted approach (Figure 4.12), we can see that General Mills had
a higher weighted RRR than average RRR, indicating that their healthier varieties
0
2
4
6
8
10
12
149
9-0
1-1
7
99
-11
-17
00
-09
-17
01
-07
-17
02
-05
-17
03
-03
-17
04
-01
-17
04
-11
-17
05
-09
-17
06
-07
-17
07
-05
-17
08
-03
-17
09
-01
-17
09
-11
-17
10
-09
-17
11
-07
-17
12
-05
-17
13
-03
-17
14
-01
-17
14
-11
-17
15
-09
-17
16
-07
-17
17
-05
-17
Kellogg's MinRRR
Kellogg's MaxRRR
Kellogg's MeanRRR
General Mills'Min RRR
General Mills'Max RRR
General Mills'Mean RRR
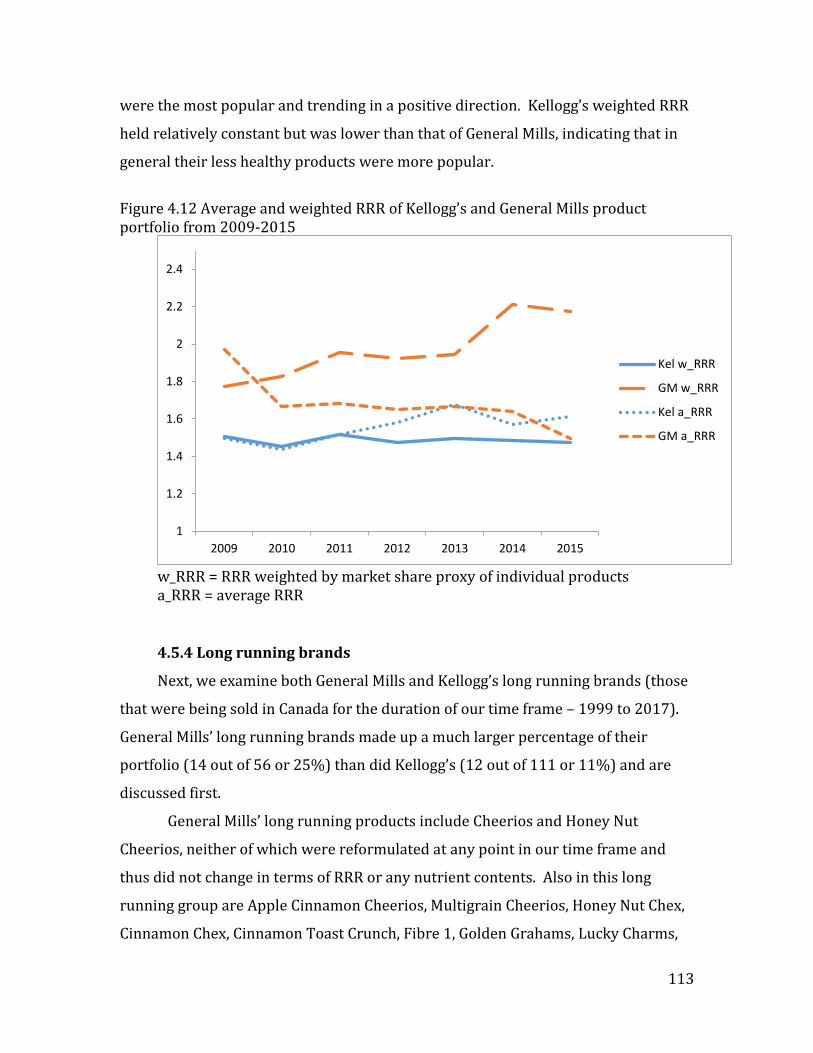
113
were the most popular and trending in a positive direction. Kellogg’s weighted RRR
held relatively constant but was lower than that of General Mills, indicating that in
general their less healthy products were more popular.
Figure 4.12 Average and weighted RRR of Kellogg’s and General Mills product portfolio from 2009-2015
w_RRR = RRR weighted by market share proxy of individual products a_RRR = average RRR
4.5.4 Long running brands
Next, we examine both General Mills and Kellogg’s long running brands (those
that were being sold in Canada for the duration of our time frame – 1999 to 2017).
General Mills’ long running brands made up a much larger percentage of their
portfolio (14 out of 56 or 25%) than did Kellogg’s (12 out of 111 or 11%) and are
discussed first.
General Mills’ long running products include Cheerios and Honey Nut
Cheerios, neither of which were reformulated at any point in our time frame and
thus did not change in terms of RRR or any nutrient contents. Also in this long
running group are Apple Cinnamon Cheerios, Multigrain Cheerios, Honey Nut Chex,
Cinnamon Chex, Cinnamon Toast Crunch, Fibre 1, Golden Grahams, Lucky Charms,
1
1.2
1.4
1.6
1.8
2
2.2
2.4
2009 2010 2011 2012 2013 2014 2015
Kel w_RRR
GM w_RRR
Kel a_RRR
GM a_RRR
114
Reese Puffs, Fibre 1 Honey Clusters, Maple Nut Oatmeal Crisp, and Nesquik cereal.
In terms of RRR, 8 of the 14 cereals improved over this time period while 3 got
nutritionally worse (Lucky Charms, Reese Puffs, and Fibre 1 Honey Clusters) and 3
stayed the same (Multigrain, Honey Nut, and regular Cheerios). Overall, the average
RRR for General Mills’ long run brands increased from 1.88 to 2.11 between 1999
and 2017.
In terms of sugar, 2 of General Mills’ long running brands (Apple Cinnamon
Cheerios and Fibre1 Honey Clusters) increased their sugar content in this time
frame. As previously mentioned, the sugar content of Cheerios and Honey Nut
Cheerios stayed the same, while all of the other 10 brands decreased their sugar
content. The average sugar content for these products decreased from 27.1g/100g
to 23.5g/100g from 1999 to 2017.
General Mills increased the sodium content in 3 of their long running brands
(Fibre 1 Honey Clusters, Apple Cinnamon Cheerios, and Multigrain Cheerios) over
our time frame. Cheerios and Honey Nut Cheerios stayed the same in terms of
sodium content, and the other 10 products decreased their sodium content. The
average sodium content of General Mills long running brands decreased from
581mg/100g in 1999 to 530.6mg/100g in 2017.
Looking at the fibre content of General Mills’ long running brands, 11
products increased, 2 stayed the same, and 2 (Cinnamon Chex and Multigrain
Cheerios) decreased. The average fibre content went from 8.97g/100g in 1999 to
10.86g/100g in 2017. Overall, it appears as though General Mills has been making
efforts to improve the healthfulness of their long run brands.
Kellogg’s only long running brands that were not reformulated at any point
during our time frame are All Bran Original and Corn Flakes. Their other long
running products are All Bran Buds, All Bran Flakes, Corn Pops, Froot Loops,
Frosted Flakes, Frosted Mini Wheats, Raisin Bran, Rice Krispies, Special K, and
Vector. Three of Kellogg’s long running brands (Frosted Flakes, Vector, and All Bran
Buds) have declined in terms of RRR. Corn Flakes and All Bran Original have stayed
the same. The other 7 products improved in terms of RRR.
115
When examining sugar content, 3 of Kellogg’s long running products have
increased (Rice Krispies, Frosted Flakes, and All Bran Flakes), 4 have stayed the
same (Special K, Vector, All Bran Original, and Corn Flakes), and the other 5 have
decreased their sugar content. The average sugar content of Kellogg’s long running
brands was 23.7g/100g in 1999, reached a maximum of 25.4g/100g in 2008, and
had declined to 22.2g/100g by 2017.
None of Kellogg’s long running products increased their sodium content
during this time frame. Three products (Frosted Mini Wheats, Corn Flakes, and All
Bran Original) maintained the same sodium content. It should be noted however
that Mini Wheats had 0mg of sodium throughout the timeframe, so it would have
been impossible to reduce the sodium in that product. The other 9 long running
Kellogg’s products decreased their sodium contents over this time frame. The
average sodium content of Kellogg’s long running products decreased from
634mg/100g in 1999 to 473mg/100g in 2017.
Kellogg’s increased the fibre content in 4 of their long running products
(Raisin Bran, Frosted Mini Wheats, Froot Loops, and Corn Pops) and decreased the
fibre content in 4 of their long running products (All Bran Buds, All Bran Flakes,
Frosted Flakes, and Vector). Of the remaining 4 that stayed the same, 3 of them had
absolutely no fibre at all at any point in our time frame. The average fibre content of
Kellogg’s long running products has increased slightly from 10.4g/100g in 1999 to
11g/100g in 2017.
Kellogg’s has shown some effort in improving the healthfulness of their long
run products, but it has focused more on sodium reduction than sugar reduction or
increasing fibre.
4.5.5 Correlations between nutrition and other factors
The next step of this analysis was to examine the correlation between
nutritional quality and the other factors under discussion – price, advertising, price
of sugar (only input included since it is the main ingredient impacting the RRR),
media coverage of sugar, sodium, and fibre, and the competitor’s RRR, price, and
116
advertising. These correlations were done separately for each firm to identify
differences in relationships, and are shown in Tables 4.3 and 4.4.
Both firms show a negative correlation between RRR and price, indicating that
the higher the nutritional quality of a product, the lower the price, more so for
Kellogg’s. General Mills shows a positive correlation between advertising and RRR,
demonstrating that they spend more to advertise their products with higher
nutritional quality. Both firms also demonstrate a positive correlation between the
price of sugar and RRR, indicating that as the cost of sugar goes up, their products
get healthier. Just to put this into perspective, sugar can account for as low as
around 5% of ingredient costs in healthier cereals like Cheerios or as high as around
40% of ingredient costs for sugary cereals like Honey Nut Cheerios (based on 2017
commodity prices). This relationship is stronger for Kellogg’s than for General Mills.
Larger differences between firms were noted when examining correlation between
RRR and media coverage of nutrients. While both firms have a positive correlation
between RRR and media coverage of sugar, it is stronger for Kellogg’s. Kellogg’s also
has a positive correlation between media coverage of fibre and sodium in the media
and RRR, meaning that they have made their products healthier as public nutrition
awareness has increased. No significant correlation was found between General
Mills’ RRR and media coverage of fibre or sodium. There is also evidence that
Kellogg’s RRR moves in the opposite direction of General Mills’ average retail price
and that General Mills RRR moves in the same direction as Kellogg’s advertising.
There are a few other notable relationships. Both firms have a negative
correlation between retail price and the cost of sugar, media coverage of nutrients,
and competitor’s RRR. They also both have a positive relationship between their
own retail price and their competitor’s retail price. Kellogg’s demonstrates a
negative correlation between advertising and the cost of sugar which General Mills
does not. Kellogg’s level of advertising appears to be related to media coverage on
sugar and sodium which General Mills’ does not. How they adjust their advertising
spending in relation to their competitor’s actions also differs; Kellogg’s increases it
when General Mills increases their RRR or decreases their advertising. General Mills
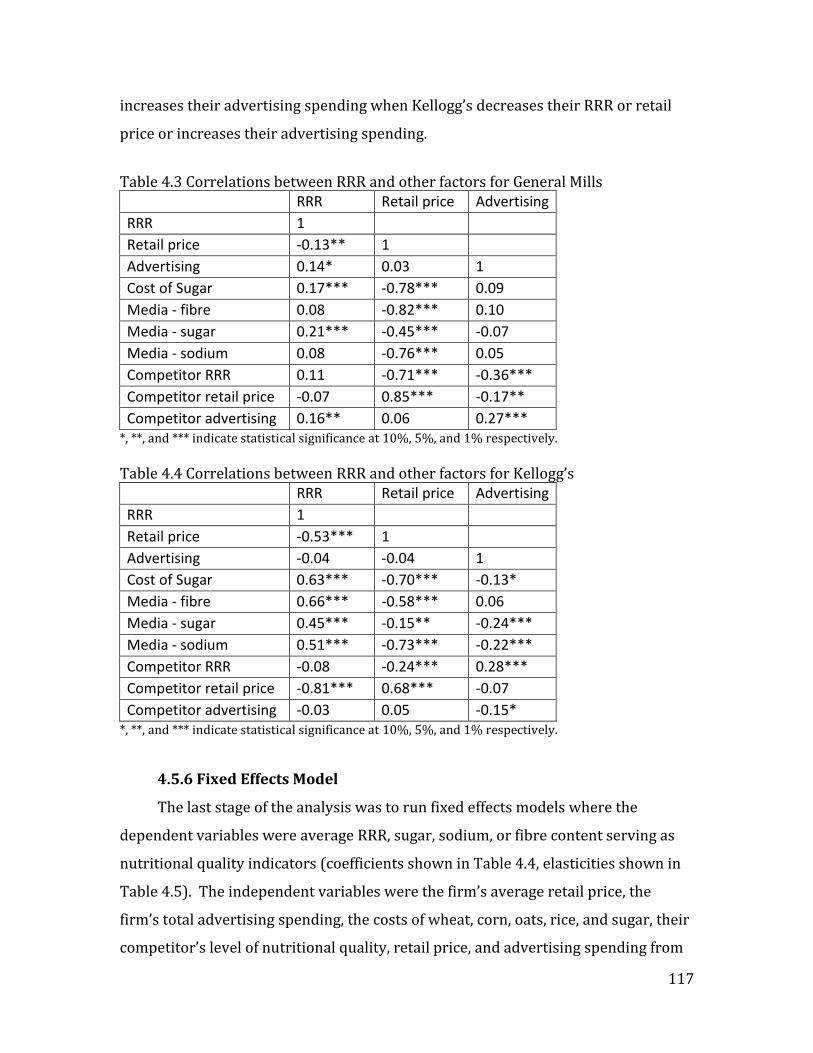
117
increases their advertising spending when Kellogg’s decreases their RRR or retail
price or increases their advertising spending.
Table 4.3 Correlations between RRR and other factors for General Mills
RRR Retail price Advertising
RRR 1
Retail price -0.13** 1
Advertising 0.14* 0.03 1
Cost of Sugar 0.17*** -0.78*** 0.09
Media - fibre 0.08 -0.82*** 0.10
Media - sugar 0.21*** -0.45*** -0.07
Media - sodium 0.08 -0.76*** 0.05
Competitor RRR 0.11 -0.71*** -0.36***
Competitor retail price -0.07 0.85*** -0.17**
Competitor advertising 0.16** 0.06 0.27*** *, **, and *** indicate statistical significance at 10%, 5%, and 1% respectively.
Table 4.4 Correlations between RRR and other factors for Kellogg’s
RRR Retail price Advertising
RRR 1
Retail price -0.53*** 1
Advertising -0.04 -0.04 1
Cost of Sugar 0.63*** -0.70*** -0.13*
Media - fibre 0.66*** -0.58*** 0.06
Media - sugar 0.45*** -0.15** -0.24***
Media - sodium 0.51*** -0.73*** -0.22***
Competitor RRR -0.08 -0.24*** 0.28***
Competitor retail price -0.81*** 0.68*** -0.07
Competitor advertising -0.03 0.05 -0.15* *, **, and *** indicate statistical significance at 10%, 5%, and 1% respectively.
4.5.6 Fixed Effects Model
The last stage of the analysis was to run fixed effects models where the
dependent variables were average RRR, sugar, sodium, or fibre content serving as
nutritional quality indicators (coefficients shown in Table 4.4, elasticities shown in
Table 4.5). The independent variables were the firm’s average retail price, the
firm’s total advertising spending, the costs of wheat, corn, oats, rice, and sugar, their
competitor’s level of nutritional quality, retail price, and advertising spending from

118
the previous year, and the media coverage of sugar, sodium, and fibre from the
previous year. Effects are fixed by firm. The nutritional quality indicators are the
average amounts of the item in question of all the products in the firm’s portfolio for
the time period in question. So although products are not reformulated frequently,
variance in these variables is present due to new product introductions and product
discontinuations in addition to reformulations. Price is also an average across the
portfolio, while advertising spending is aggregated for each firm’s entire portfolio of
breakfast cereals. It was decided to lag the competitor’s actions and media coverage
as firms cannot adjust product formulation instantaneously when reacting to public
awareness or their competitors. It should be noted that time dummy variables were
initially included but created convergence issues so were thus omitted.
It was found that sugar content was positively associated with retail price,
meaning that products get more expensive when the sugar content goes up. The
opposite is true for sodium, with the sodium content decreasing as retail prices go
up. Sugar content is increasing as advertising spending increases. The fibre content
decreases as the cost of wheat goes up, which is not surprising given that wheat is
one of the primary sources of fibre in breakfast cereals. The overall RRR decreases
as the cost of oats goes up, which again makes sense because oats would have the
highest nutritional score among the grains used as inputs. The sodium content
decreases while the fibre content increases as the cost of rice increases. The sugar
content goes down and fibre content goes up as the cost of sugar increases. If we
look at the nutritional indicator of the competitor, we see a negative association in
every model, meaning that firms react to their competitor’s nutrient input decisions
by doing the opposite. It is hard to say exactly what the strategy is that is being seen
here, but it is possible that firms are looking to fill a niche that is not already
occupied. So for example, if Kellogg’s is focusing on decreasing their sodium
content, rather than compete for the low sodium consumers, General Mills focuses
on decreasing their sugar content, potentially appealing to a different consumer
segment. Although competitor’s price does not appear to affect a firm’s RRR, it does
significantly affect sugar, sodium, and fibre content. As the competitor’s retail price
increases, the sugar and sodium content of the other firm increase while their fibre
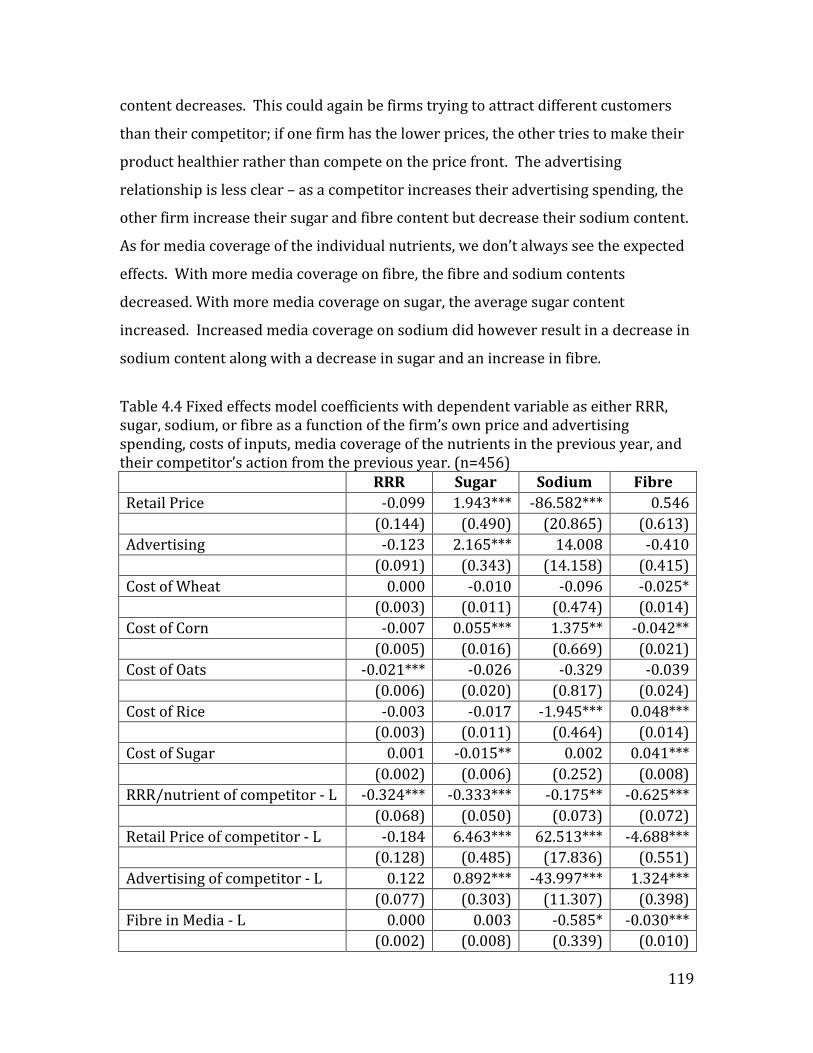
119
content decreases. This could again be firms trying to attract different customers
than their competitor; if one firm has the lower prices, the other tries to make their
product healthier rather than compete on the price front. The advertising
relationship is less clear – as a competitor increases their advertising spending, the
other firm increase their sugar and fibre content but decrease their sodium content.
As for media coverage of the individual nutrients, we don’t always see the expected
effects. With more media coverage on fibre, the fibre and sodium contents
decreased. With more media coverage on sugar, the average sugar content
increased. Increased media coverage on sodium did however result in a decrease in
sodium content along with a decrease in sugar and an increase in fibre.
Table 4.4 Fixed effects model coefficients with dependent variable as either RRR, sugar, sodium, or fibre as a function of the firm’s own price and advertising spending, costs of inputs, media coverage of the nutrients in the previous year, and their competitor’s action from the previous year. (n=456)
RRR Sugar Sodium Fibre
Retail Price -0.099 1.943*** -86.582*** 0.546
(0.144) (0.490) (20.865) (0.613)
Advertising -0.123 2.165*** 14.008 -0.410
(0.091) (0.343) (14.158) (0.415)
Cost of Wheat 0.000 -0.010 -0.096 -0.025*
(0.003) (0.011) (0.474) (0.014)
Cost of Corn -0.007 0.055*** 1.375** -0.042**
(0.005) (0.016) (0.669) (0.021)
Cost of Oats -0.021*** -0.026 -0.329 -0.039
(0.006) (0.020) (0.817) (0.024)
Cost of Rice -0.003 -0.017 -1.945*** 0.048***
(0.003) (0.011) (0.464) (0.014)
Cost of Sugar 0.001 -0.015** 0.002 0.041***
(0.002) (0.006) (0.252) (0.008)
RRR/nutrient of competitor - L -0.324*** -0.333*** -0.175** -0.625***
(0.068) (0.050) (0.073) (0.072)
Retail Price of competitor - L -0.184 6.463*** 62.513*** -4.688***
(0.128) (0.485) (17.836) (0.551)
Advertising of competitor - L 0.122 0.892*** -43.997*** 1.324***
(0.077) (0.303) (11.307) (0.398)
Fibre in Media - L 0.000 0.003 -0.585* -0.030***
(0.002) (0.008) (0.339) (0.010)
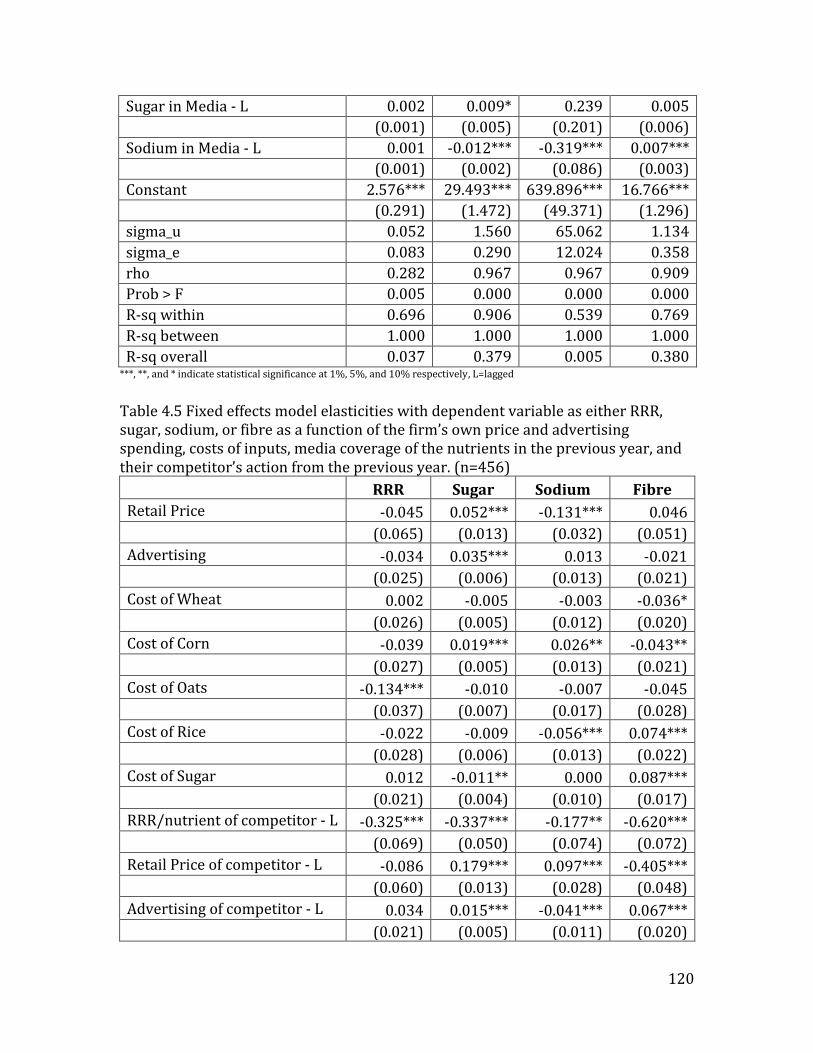
120
Sugar in Media - L 0.002 0.009* 0.239 0.005
(0.001) (0.005) (0.201) (0.006)
Sodium in Media - L 0.001 -0.012*** -0.319*** 0.007***
(0.001) (0.002) (0.086) (0.003)
Constant 2.576*** 29.493*** 639.896*** 16.766***
(0.291) (1.472) (49.371) (1.296)
sigma_u 0.052 1.560 65.062 1.134
sigma_e 0.083 0.290 12.024 0.358
rho 0.282 0.967 0.967 0.909
Prob > F 0.005 0.000 0.000 0.000
R-sq within 0.696 0.906 0.539 0.769
R-sq between 1.000 1.000 1.000 1.000
R-sq overall 0.037 0.379 0.005 0.380 ***, **, and * indicate statistical significance at 1%, 5%, and 10% respectively, L=lagged
Table 4.5 Fixed effects model elasticities with dependent variable as either RRR, sugar, sodium, or fibre as a function of the firm’s own price and advertising spending, costs of inputs, media coverage of the nutrients in the previous year, and their competitor’s action from the previous year. (n=456)
RRR Sugar Sodium Fibre
Retail Price -0.045 0.052*** -0.131*** 0.046
(0.065) (0.013) (0.032) (0.051)
Advertising -0.034 0.035*** 0.013 -0.021
(0.025) (0.006) (0.013) (0.021)
Cost of Wheat 0.002 -0.005 -0.003 -0.036*
(0.026) (0.005) (0.012) (0.020)
Cost of Corn -0.039 0.019*** 0.026** -0.043**
(0.027) (0.005) (0.013) (0.021)
Cost of Oats -0.134*** -0.010 -0.007 -0.045
(0.037) (0.007) (0.017) (0.028)
Cost of Rice -0.022 -0.009 -0.056*** 0.074***
(0.028) (0.006) (0.013) (0.022)
Cost of Sugar 0.012 -0.011** 0.000 0.087***
(0.021) (0.004) (0.010) (0.017)
RRR/nutrient of competitor - L -0.325*** -0.337*** -0.177** -0.620***
(0.069) (0.050) (0.074) (0.072)
Retail Price of competitor - L -0.086 0.179*** 0.097*** -0.405***
(0.060) (0.013) (0.028) (0.048)
Advertising of competitor - L 0.034 0.015*** -0.041*** 0.067***
(0.021) (0.005) (0.011) (0.020)
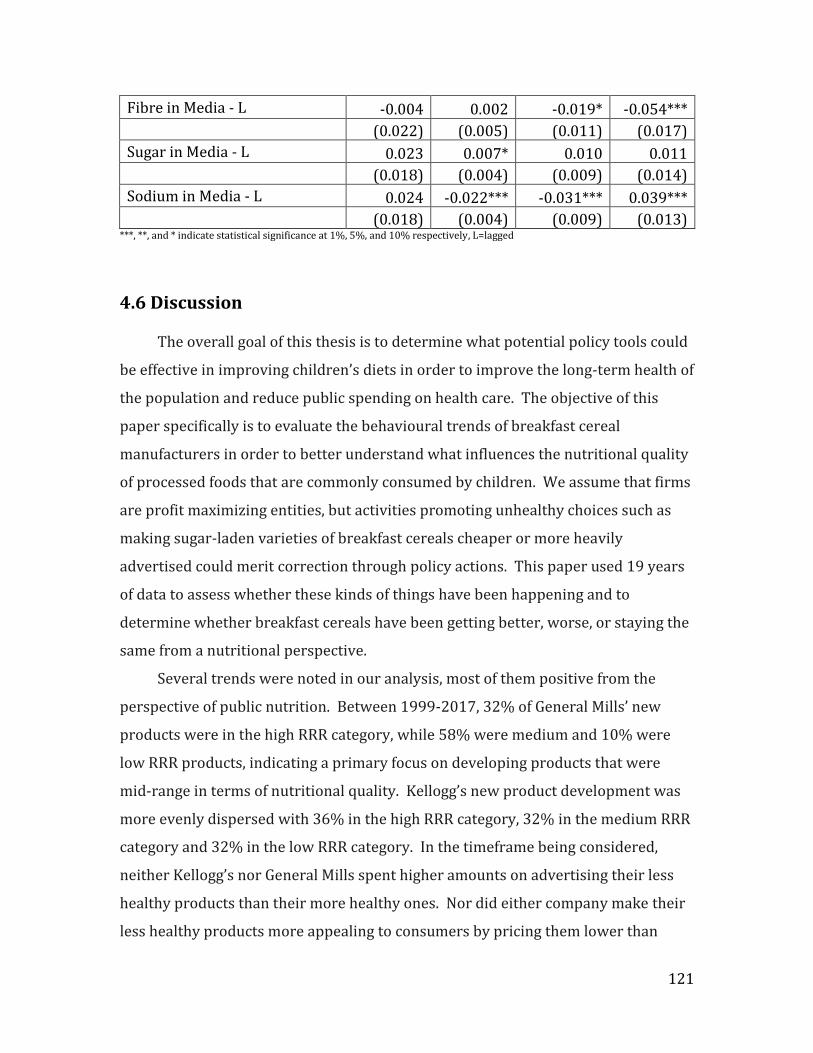
121
Fibre in Media - L -0.004 0.002 -0.019* -0.054***
(0.022) (0.005) (0.011) (0.017)
Sugar in Media - L 0.023 0.007* 0.010 0.011
(0.018) (0.004) (0.009) (0.014)
Sodium in Media - L 0.024 -0.022*** -0.031*** 0.039***
(0.018) (0.004) (0.009) (0.013)
***, **, and * indicate statistical significance at 1%, 5%, and 10% respectively, L=lagged
4.6 Discussion
The overall goal of this thesis is to determine what potential policy tools could
be effective in improving children’s diets in order to improve the long-term health of
the population and reduce public spending on health care. The objective of this
paper specifically is to evaluate the behavioural trends of breakfast cereal
manufacturers in order to better understand what influences the nutritional quality
of processed foods that are commonly consumed by children. We assume that firms
are profit maximizing entities, but activities promoting unhealthy choices such as
making sugar-laden varieties of breakfast cereals cheaper or more heavily
advertised could merit correction through policy actions. This paper used 19 years
of data to assess whether these kinds of things have been happening and to
determine whether breakfast cereals have been getting better, worse, or staying the
same from a nutritional perspective.
Several trends were noted in our analysis, most of them positive from the
perspective of public nutrition. Between 1999-2017, 32% of General Mills’ new
products were in the high RRR category, while 58% were medium and 10% were
low RRR products, indicating a primary focus on developing products that were
mid-range in terms of nutritional quality. Kellogg’s new product development was
more evenly dispersed with 36% in the high RRR category, 32% in the medium RRR
category and 32% in the low RRR category. In the timeframe being considered,
neither Kellogg’s nor General Mills spent higher amounts on advertising their less
healthy products than their more healthy ones. Nor did either company make their
less healthy products more appealing to consumers by pricing them lower than
122
their healthier counterparts. Although we found no evidence of it in the breakfast
cereal industry, making sure that firms aren’t discounting their less healthy
products or advertising them more across a variety of food sectors would be an
important activity going forward. Of course, this type of monitoring would only
make sense for firms producing foods with a variety of nutritional profiles; if a
company only makes candy, it would be a waste of time and energy to worry about
which product they’re advertising more.
Across their product portfolios, both firms showed marked decreases in their
sugar content, which is a positive outcome from a public health perspective. Also
good is that Kellogg’s showed a major decrease in the average sodium content of
their products, likely as a response to growing awareness of the negative
consequences of overconsuming sodium. Kellogg’s also gradually increased their
average fibre content. General Mills, on the other hand, showed only minimal
improvements in the sodium and fibre categories. While Kellogg’s had more
improvement on average throughout their portfolio, General Mills had more
improvement in their long-running brands which make up a larger percentage of
their portfolio. We also see that the firms do react to each other’s actions through
their product formulations, moving in the opposite direction of their competitor,
nutrient-wise. The fixed effects models showed that the costs of inputs do affect the
amounts of nutrients contained in breakfast cereals. Specifically, when the cost of
sugar increased, the average amount of sugar in breakfast cereals decreased. These
findings are both important to keep in mind when making policy decisions. While
we see that a policy mechanism affecting the relative cost of inputs will likely affect
change in product formulation, we also see that these two firms tend to move in
opposite directions of each other in terms of their product placement. So if one firm
reacts to a sugar tax, for example, by reducing the amount of sugar they use, the
other might react by adjusting their advertising or pricing strategy and leaving the
sugar content unchanged. How firms react both to policies and to each other’s
actions will determine the impact of a given policy.
There is no evidence of firms over-promoting their less healthy offerings via
price or advertising decisions. It also appears that in general, nutritional
123
improvements are being made. The question is whether they are good enough,
happening fast enough, and will they continue? If firms are going to continue on this
trajectory, regulation would likely be inefficient and possibly unnecessary. Kellogg’s
has committed to improving its breakfast cereal portfolio by reducing its sugar and
sodium content, but their target of reducing sugar content to no more than 33% of
the cereal’s weight is still more than twice as high as the WHO’s recommendation
that cereals higher than 15% sugar not be marketed to children. In other words, if
they stop at this goal, they haven’t done well enough. Both firms still have an
average sugar content of over 20%, with well over half of their products above the
15% WHO threshold. The issue of how quickly changes are being made is not as
easy to criticize. Firms need to make incremental changes so as not to offend the
palates of their customers. Therefore if breakfast cereal manufacturers wish to
avoid targeted policy measures, they don’t necessarily need to speed up changes,
but they do need to maintain the positive momentum they’ve shown in terms of
improving the nutritional profile of their products.
It is a worthwhile endeavour to monitor the food processing industry to
ensure that improvements continue to be made beyond their current targets, both
in the breakfast cereal industry as well as in other categories. Given the increasing
level of public awareness about food and nutrition, the demand for healthier foods
will likely continue to grow which provides food manufacturers with an incentive to
make their products healthier, or at least to provide some healthy products. There
was a focus in the media on the negative impacts of consuming sodium from 2005-
2013, during which time Kellogg’s decreased their average sodium content by 25%.
This was a major improvement for which Kellogg’s should be commended. Sugar
took over as the nutrition villain in 2014, which is likely one of the reasons for the
13.5% decrease in the sugar content of both firms’ products since then. These
observations emphasize the impact that nutrition education, media attention, and
overall awareness can have on firms’ decision making.
One of the potential downsides to a more restrictive policy where the
government regulates the composition of food is that if the imposed regulations are
too strict, the products could become unpalatable. This could result in a shift in the
124
types of products people consume, which could be less healthy than the original
product. Firms are better off adjusting their product formulations gradually so that
their consumers’ palates can adjust over time with the product. If the government
wants to incentivize food manufacturers to improve their products without directly
regulating product composition, they could consider taxing unhealthy inputs such as
sugar or salt, or implementing some type of label mechanism disclosing information
about the amount of unhealthy nutrients. Our analysis showed that there was a
statistically significant relationship between the cost of sugar manufacturers faced
and the average amount of sugar their products. Also supporting this approach are
the findings of Miao et al (2012), which showed that taxing sugar at a firm level
would have a greater impact on the population’s sugar consumption than would a
retail level sugar tax. We don’t know with any certainty whether firms would
actually reformulate their products if relative input costs changed or if they would
shift additional costs to the consumer. They might respond by shifting their
advertising spending to their healthier products as those profit margins would
increase relative to those high in sugar (or whatever the taxed nutrient is). There is
also substantial evidence that firms will reformulate products in response to
information disclosure related policies (see section 4.2.1).
The bottom line is that firms are profit maximizing entities that produce what
they think consumers want to purchase. If firms perceive a demand for breakfast
cereals that are lower in sugar and sodium, they will manufacture them. But if the
healthier products don’t sell, they won’t last long. If only adults are consuming the
healthier products, children are no better off. So in order to improve the diets of
children, not only do manufacturers need to produce healthy options, but either kids
or their parents need to recognize the healthier products and choose them, and then
the kids need to actually eat them instead of the less healthy products. This is an
important reason to improve the public’s level of nutrition knowledge (including at
the elementary school level), regardless of whether policies aimed at food
manufacturers are implemented.
Another area of research that would be worthwhile is to evaluate price
elasticities for different cereal products to anticipate how price changes might alter
125
consumption; do people react more to price changes in high sugar cereals than low
sugar ones or to price changes in new products compared to long-running familiar
brands? If consumers don’t react the same way to a policy implemented in various
products (as was seen with warning labels on breakfast cereals), this would be an
important outcome to consider.
It is important to acknowledge some limitations of the data used in this study;
the price data was pieced together from various sources, some of which were
American (converted using historical exchange rates), but all of which are observed
product prices at retail locations on various dates. We have no way of confirming
that these observed prices are representative of national averages. In addition, we
have information about when products were introduced to the market, but no
information about when they were discontinued. (Information about a few
discontinued products was found online, but was only available for a limited
number of products.) Generally it was assumed that if a product had several data
points throughout our timeframe, and is still currently available, it was available for
purchase for the duration of 1999-2017. In cases where the product is no longer
available, a change in price from some positive value to no data was used to indicate
discontinuation. These proxies, although not perfect, are the best available method
we had to identify product discontinuation dates. Therefore it is possible that some
products are represented in our data set for longer or shorter durations than is
accurate.
126
Chapter 5: Synopsis of dissertation
5.1 Summary of background and objectives
As has been well established, an individual’s diet has long-term health
implications, with current consumption decisions potentially generating
externalities that may not be realized until years later. In the North American diet,
the main issues are the overconsumption of sugar, sodium, saturated fat, and
calories, which contribute to a myriad of health problems including diabetes,
cardiovascular disease, and cancer (Grosso et al 2017; McGuire 2016; Yang et al
2014; Johnson et al 2007). The relationship between diet and health is complex, and
because it can be decades before the negative impacts of dietary choices are felt by
an individual, it may be difficult for people to make what are lifetime utility
maximizing choices. Also, in many countries an individual does not bear the full cost
of their own health care, thus poor dietary choices may pose an externality on
society in the form of increased government spending on health care.
Many have argued that this justifies the use of policy measures to address the
externality, but these measures could take a variety of forms, some of which could
be viewed as informative (label mechanisms) while others could be seen as
paternalistic (regulations). When Health Canada mandated that the trans-fat
content of foods had to be listed on the nutrition facts panel in 2004, many
companies reformulated their products to reduce or eliminate their trans-fat
content and thus avoid negative reactions from consumers who read the back of the
package. This was an informative policy mechanism that had a positive outcome,
but evidently the effect was not large enough as Health Canada implemented the
more paternalistic ban on putting trans-fats in foods as of September 17, 2018
(Health Canada 2018). The effectiveness of this ban in Canada remains to be seen,
but a similar ban has been effective in reducing the risk of cardiovascular disease in
Denmark (Stender et al 2006).
When it comes to public policy, it is important to note that not all population
groups are treated equally. Of particular interest in this research are children, and
there are far more policies protecting children than there are adults as they are not
127
expected to be capable of protecting themselves (though with the exception of
advertising there are no current policies protecting children from unhealthy foods).
Despite this there are no federal policies as of yet pertaining to protecting children
from poor dietary choices, although the province of Quebec has restricted
advertising to children since 1980 (Dhar and Bayliss 2011). A bill banning the
marketing of unhealthy foods to children across Canada was passed in September
2018 but has since stalled and is currently in limbo (Robertson 2018).
In addition to the problem of long-term health repercussions of an unhealthy
diet, there is also increasing evidence that diet-related health problems once
assumed to be exclusive to adults are being seen more frequently in children.
Therefore it is increasingly important that children should be protected from poor
diets just as they are protected from tobacco use, unsafe toys, and inadequate
seatbelts. Also important to consider is that dietary habits and preferences
developed in childhood can persist into adulthood, so improving children’s diets will
likely improve their dietary choices and overall health throughout their lives. Given
that children merit higher levels of protection as consumers than adults do, policies
to improve the diets of children and protect them from high levels of sugar, sodium,
saturated fat, and excess calories are being advocated by many parties, both to
correct the health care spending externality as well as to improve the population’s
long-term health and quality of life. Among the suggested policy measures are
financial mechanisms (such as soda taxes), label mechanisms (which will soon be
implemented by Health Canada on foods high in sugar, sodium, and saturated fats),
and direct regulation of food manufacturers (similar to the trans-fat ban). Thus far
the only federal policy targeted at protecting children from unhealthy diets is the
proposed ban on advertising unhealthy foods to children. The incoming Health
Canada warning label will be on a variety of products, not just those targeted at
children, though it may affect their preferences.
The objective of this study is to explore the underlying decision-making that
impacts the effectiveness of potential policies that could be implemented by the
government in an effort to improve children’s diets and subsequent health
outcomes. Under investigation are how choices are affected by the following types
128
of policies: 1) a price mechanism at the retail level, 2) a warning label mechanism
similar to one that will soon be found on foods in Canada, and 3) the necessity for
policies targeting food manufacturers. The price and label mechanisms could
influence parents’ or children’s food choices, but likely would not affect all
consumers’ choices equally. Some might place more importance on price while
others on preferences and still others on nutrition information. How both parents
and children with different characteristics are affected by these mechanisms is
important to explore and were explored in the first two studies discussed in this
dissertation. In terms of food manufacturers, getting a better grasp on their
strategic behavior will help to identify what types of policy measures could be
effective in improving the nutritional quality of their products, specifically the
nutritional quality of foods commonly consumed by children. The last study in this
dissertation examines how breakfast cereal manufacturers choose a combination of
price, advertising, and nutritional quality for the products in their portfolio and how
these decisions correspond to input prices and consumer awareness of nutrition.
By examining the findings from these three studies, we can start to discern
what policy approaches to improve children’s diets hold promise, and whether a
policy option that respects consumer sovereignty could be effective. Will warning
labels on foods be effective in reducing the probability that children will choose
unhealthy products? Will they reduce the probability of parents choosing them?
Will the effect differ between parents and children? Is there any merit in imposing
regulations on the manufacturers of children’s foods? The findings from each study
are now discussed in an effort to answer these questions, followed by overall
implications, limitations, and areas for further research.
5.2 Children’s choices
Although various other parties play a role in providing children with food, it is
the children themselves who ultimately choose whether or not to consume it. In
some situations, we need to consider that children could be purchasing food
independently, which is justified both by the literature as well as by our own
findings indicating that 80% of our sample of 8-12 year olds purchase food

129
autonomously. Given that our overall objective is to evaluate the effectiveness of
potential policy tools to improve children’s diets, it is critical that we consider
children’s food purchasing decisions and their responses to these policies. Children
are rarely studied as consumers in the economics literature as they are in this study,
which is what makes this research an important contribution.
The economic objective of this study was to explore how children, as
autonomous consumers, respond to two of the proposed policy instruments: price
and label mechanisms. What we really want to know is if a child decided to buy a
snack at a vending machine or in a convenience store, would their choice be affected
by the price or something they saw on the label? If it was, we could use this
information to help increase the likelihood that children will buy the healthier
options. To address this, a simulated purchase environment where a child was
choosing a pre-packaged salty snack was created with legitimate, recognizable
brands. In order to determine whether the children exhibit any sensitivity to price
changes or a traffic light style warning label, prices were varied and the traffic light
label was applied to the products higher in saturated fat and calories on some
occasions. Given that children develop at different rates and that they have a wide
range of cognitive abilities, it was also of interest to consider whether the policies
would elicit an equitably distributed change or if only some segments of the child
population would be affected. Therefore, measures of cognitive development (IQ,
vocabulary, and executive functioning) in addition to age and gender were used to
explain variation in responses to pricing and label interventions.
The results from this experiment suggest that both taxes and traffic light style
labels could be effective tools in encouraging children to purchase healthier snacks,
but that the effect of taxes would likely not be uniform across children. The analysis
showed that children with higher executive functioning skills and boys would be
more responsive to price changes while children with higher IQs and girls would be
less sensitive to price changes. Traffic light style labels appear to have a more
homogeneous effect, on the other hand, showing no significant interaction between
the children’s characteristics and how sensitive they would be to the label
mechanism. Additionally, in the breakfast cereal choice study, children reduced the
130
number of high sugar cereals chosen when the text-based warning label was
applied, so similar to what Arrua et al (2017) found, either label type would likely be
effective among children.
When considering which policy should be recommended, it should be noted
that taxes could be applied at various levels, giving policy makers more flexibility,
whereas the traffic light style label is either present or not. Since this study was
completed, however, Health Canada announced that it would be implementing
warning labels not dissimilar from the traffic light label used in this experiment on
foods high in sugar, sodium, and/or saturated fat. If consistent with our findings,
this warning label should have a somewhat uniform effect on children’s autonomous
food purchases across different age, gender, and cognitively developed groups. It
also has the added benefit of improving their awareness as to what foods they
should be eating more and less often which could carry over to future consumption
decisions. If a tax on unhealthy foods were to be considered, it should be ensured
that children can still afford enough food to meet their caloric needs – in other
words there need to be healthy alternatives that are not more expensive for them to
purchase in an absolute sense, not just relatively speaking. Many people have
suggested that the success of soda taxes (which are under some debate) justify the
implementation of taxes on junk foods. It is critical to realize, however, that if
someone is thirsty and can’t afford soda, there is a widely available and usually free
substitute: water. The same does not hold true for food, thus implementing taxes on
foods should be done with the utmost caution.
5.3 Parents’ choices
The policy tools proposed to improve children’s diets affect various avenues
through which children obtain food. The first study examined children’s
autonomous food purchases. The second study shifted the focus from children’s
choices to parents’ choices. Parents not only purchase and prepare food for their
children, but they also influence long-term dietary preferences and habits that could
play a role in their child’s health throughout their life. Utilizing the same types of
131
mechanisms as the first study, this study examined how parents would respond to
different policy measures and how these responses differ by individual
characteristics. More specifically the label mechanism being investigated in this
study is a text-based explicit warning label being placed on the front of boxes of
breakfast cereals high in sugar. This is particularly timely given that Health Canada
is currently working on the implementation of a front-of-package warning label to
be applied to products high in sugar, sodium, and/or saturated fat, but there is
limited evidence pertaining to how consumers will react to this type of mechanism
on food products.
It is possible that a warning label indicating that a product is inappropriate for
regular consumption by children due to poor nutritional content would affect a
parent’s willingness to purchase it, or perhaps just the amount they’d be willing to
pay for it. The economic objective of this study was to determine how parents of 8-
12 year olds would alter their purchasing behavior if a warning label were present
on high sugar breakfast cereals and how parents with different characteristics might
react differently or how different products might be affected differently.
In order to address this objective, a choice experiment was carried out with 10
of the most popular breakfast cereals in Canada, with warning labels applied to
products with a sugar content above 20% (by weight) and whole grain council logos
applied to any of the products. In addition, respondents were asked about typical
purchasing behavior, their child’s role in choosing foods, and nutrition knowledge.
The analysis showed that parents would be less likely to purchase a high-sugar
product if it carried a warning label, but the effects are heterogeneous. Firstly,
parents with higher levels of nutrition knowledge as well as women would be more
responsive to a high sugar warning label. Overall, men would be more responsive to
a whole grain logo. In addition, getting information about the labels increased
responsiveness to the warning label overall but did not affect responsiveness to the
whole grain logo. Secondly, although the basic MNL model shows that parents
would be willing to pay $0.57 less for a product with a warning label and $0.45 more
to purchase a product with a whole grain logo, these averages don’t account for the
fact that consumers would not respond to these label attributes to the same extent
132
for different cereals. This is demonstrated by the brand interacted model estimates,
where decrease in WTP due to a warning label is not significantly different than zero
for some products while it is as much as $0.83/box for others. The difference
between cereals in the increase in WTP due to a whole grain logo varies even more.
Simulations showed that imposing a warning label on high-sugar breakfast cereals
would reduce their purchase probability from 46% to either 44% or 41%,
depending on whether we assume an information campaign accompanies the policy
implementation.
These findings suggest that Health Canada’s forthcoming warning label could
reduce the consumption of high-sugar cereals (and likely other less healthy
products as well) but that the effect will likely not be that large, nor is it likely to
impact the choices of people with low levels of nutrition knowledge as much as their
higher nutrition knowledge counterparts. In addition, to be effective the label will
have to be large enough to be noticed, and even if noticeable the effect could wear
off over time. One would hope that a warning label would decrease the cognitive
effort or ability required to identify healthy choices and thus decrease nutritional
disparities between the different demographic sectors, but unfortunately our
evidence showed that people with lower nutrition knowledge were less responsive
to the warning label. In addition, the warning label will likely not affect preferences
for all brands (within the same product category) equally – thus the aggregate
effects are impossible to estimate a priori. This doesn’t mean that the warning label
is without merit, but its anticipated effects on public health should not be
overestimated.
5.4 Food manufacturer behaviour
As previously stated, the overall objective of this thesis is to determine the
effectiveness of potential policy tools in improving the diets of children. Thus far,
policies aiming to influence the choices of consumers (both children and their
parents) have been discussed. Another potential approach is to bypass consumer
decision-making and address the issue at the source, imposing policies on the food
133
manufacturers. Until the recent ban on trans-fats, the nutritional content of foods
has been largely unregulated with the exception of micronutrient fortification to
address population level deficiencies. Placing limits on the levels of sugar or sodium
put in foods targeted at children is one type of policy that could be imposed on food
manufacturers, while a less restrictive approach would be to implement a tax on
undesirable inputs, a subsidy on healthy ones, or some kind of label mechanism.
Either way, imposing a policy on manufacturers would consume a considerable
amount of time and resources, so its necessity should be evaluated before such
action could be recommended. If manufacturers perceive a demand for healthier
products or want to improve their public image, they may choose to improve their
foods’ nutritional quality on their own. If this is the case, committing government
resources to imposing and enforcing policy measures on manufacturers would be
inefficient, but if the trend is short lived, not adopted by enough firms, or only
implemented in convenient products, policies targeting the manufacturers of foods
consumed frequently by children could be helpful in improving children’s diets.
This study explored firm behaviour in the breakfast cereal industry (as
breakfast cereals are commonly consumed by children) to see how various factors
influence the nutritional profile of food products and how the top breakfast cereal
manufacturers compare in terms of nutritional quality. We looked for evidence that
firms reformulate their products in response to public awareness of different
nutrients, in which case educating consumers about nutrition would result in
healthier food products being manufactured. We also looked at whether a food’s
nutritional profile is related to the price of sugar (a primary input). We considered
how firms choose to market the different components of their product line, how
they price their different products, and how these relate to the nutritional quality of
their products. By examining the trends in nutritional quality, price, and advertising
of Kellogg’s and General Mills’ breakfast cereals between 1999-2017, and observing
how external factors like input prices and public awareness of nutrition influence
these, we can determine what factors influence the healthfulness of breakfast
cereals and whether companies are improving their product categories
134
independently or whether there is merit in the government imposing policies on the
production of foods consumed frequently by children.
Several trends were noted in our analysis, most of them positive from the
perspective of public nutrition and children’s diets. In the timeframe being
considered, neither firm spent higher amounts on advertising their less healthy
products than their more healthy ones, nor did they make their less healthy
products cheaper. If legislation banning the advertising of unhealthy foods to kids is
implemented, how firms spend their advertising dollars will likely shift, but how is
not yet known. Across their product portfolios, both firms have shown marked
decreases in their sugar content. Kellogg’s has also shown notable decreases in
their sodium content and increases in their fibre content, as has General Mills but to
a lesser extent. While Kellogg’s has shown more improvement on average
throughout their portfolio, General Mills has shown more improvement in their
long-running (and most popular) brands which make up a larger percentage of their
sales portfolio. It was found that input costs were associated with nutritional
quality, making firm level taxes or subsidies a viable policy option. There was also
evidence in the fixed effects model that firms decreased their products’ sodium
content as public awareness of the harms of sodium overconsumption increased,
but the same could not be said for the levels of sugar or fibre.
Our analysis shows that improvements are being made. Given the increasing
level of public awareness about food and nutrition, the demand for healthier foods
will likely continue to grow which provides food manufacturers with an incentive to
make their products healthier. If firms are going to continue on this trajectory,
regulation would likely be inefficient and possibly unnecessary, but it would be
worthwhile to monitor the food processing industry to ensure that improvements
continue to be made and that improvements are aligned with dietary guidelines.
5.5 Implications
The overall goal of this dissertation was to examine how different policy
measures might help improve the diets of children, improving their long-term
135
health and quality of life while reducing the externality that diet-related diseases
impose on public health care spending. We have identified several measures that
show some promise in working towards this goal that do not infringe on consumer
choice, but it should be emphasized that no one policy will have huge success on its
own. If real improvements are going to be made, it will take a multi-faceted
approach that takes into account a variety of issues including, but not limited to,
food environments, availability and affordability of healthy and unhealthy foods,
food marketing, the composition of food products, consumer awareness of nutrition
and healthy choices, and societal norms around food consumption.
The main research question addressed by this dissertation is what policies
might be effective in improving children’s diets. To answer this, some key research
findings are as follows: Both children and parents are responsive to warning labels
and taxes. Children appear somewhat homogeneous in their response to warning
labels while their reaction to price changes depends on various characteristics.
Parents have differing responses to both taxes and warning labels that vary based
on their individual characteristics. The decrease in simulated purchase probability
of less healthy snacks among our child sample when a warning label was applied
was 5%, whereas with parents it was 2%. However, due to their lower price
sensitivity, parents were willing to pay $0.90 on average to avoid a product with a
warning label while children were only willing to pay $0.21. Therefore, a policy
targeting either children or their parents in the form of price or label mechanisms
could be effective in improving food choices, and would likely be more efficient
given that manufacturers are improving the nutrition profiles of their product lines
independently. Given this finding, imposing regulations on product formulation is
not recommended at this time, but the food industry should continue to be
monitored to ensure that improvements continue to be made in the long run.
Health Canada will soon be applying a warning label to products that are high
in sugar, sodium, and/or saturated fat. Based on our findings, this warning label
could influence both children and their parents to choose healthier options that
don’t have the warning, but the decrease in purchase probability for the less healthy
options will likely only be around 5% or lower, and changes in purchasing behavior
136
will probably be heterogeneous across both consumer categories and different
brands. While any reduction in the consumption of less healthy products is a good
thing, it will likely take a multifaceted policy approach achieve significant
improvements in public health. However, the warning label could affect other
changes that we can’t yet quantify. It could impact consumer perceptions about
entire food categories, causing a shift in the types of foods people are choosing, not
only the specific brands. The size of the effect could largely depend on consumer’s
perceptions about different products, as Loewenstein et al (2014) point out that
warnings will typically only impact behaviour if they provide new information. It
could also incentivize firms to reformulate their products so as to not require the
warning label, similar to what happened with trans-fat labeling in North America
and sodium warnings in Finland.
The government could also consider imposing financial mechanisms at either
the retail or manufacturing level as both children and parents were found to be
price sensitive in food purchases and the nutritional quality of breakfast cereals was
found to be correlated with the cost of sugar as an input. Our data showed that
children’s reactions to taxes varied by gender and level of cognitive development
while parents’ reactions varied by gender, age, education level, and nutrition
knowledge. It can’t be ignored, therefore, that not only is imposing a tax at the retail
level regressive and would impact low-income consumers the most (Allais et al
2010; Chouinard et al 2005), but it would have different levels of effectiveness
among various population groups. As far as taxing the inputs of manufacturers, we
don’t know with any certainty whether firms would actually reformulate their
products if input costs changed or if they would rather shift the additional cost to
the consumer. Perhaps they would respond by shifting their advertising spending
to their healthier products as those profit margins would increase relative to those
high in sugar (or whatever the taxed nutrient is). As previously noted, Miao et al
(2012) found that a firm level sugar tax would be more effective in decreasing sugar
consumption than a retail level tax would be.
Regulations on food manufacturers could be imposed in manners other than
using financial mechanisms or warning labels, such as in the form of product
137
formulation requirements or stricter rules around advertising. As previously
mentioned, Canada has a pending bill banning the advertising of junk food to
children. Canada has also recently banned trans fats from foods. However, it
appears as though the manufacturers of breakfast cereals are improving the
nutritional content of their foods, likely in response to growing concern with and
awareness of nutrition, so it could be inefficient to regulate them at a product
category level. Imposing a warning label may have unanticipated effects – we would
expect demand for products carrying one to decrease, but companies might pre-
emptively reformulate products to avoid the label, leaving demand relatively
constant. This is similar to what happened with a high sodium warning label in
Finland and with trans-fat labelling in North America. This outcome wouldn’t be
negative, as all consumers of the products in question would be better off from a
dietary perspective, but this type of firm reaction is difficult to anticipate
quantitatively.
One thing Health Canada should consider as it rolls out the new warning label
is that consumers will be more responsive to a label mechanism if they have some
prior understanding of it. This was demonstrated by the significant effect of the
information treatment on sensitivity to the warning label in chapter 3. They could
do this in a variety of ways, including putting information on their website,
providing pamphlets in grocery stores, utilizing social media, television or radio
commercials, or even teaching children about it in school. Informing both children
and adults about the label would be beneficial, given that both groups
independently displayed some level of sensitivity to a warning label in our choice
experiments. By familiarizing the public with the warning label, they will make it
easy for people to identify it and know what it means without having to commit
additional time or cognitive effort when making their purchasing decisions, thus
increasing the likelihood that it will affect their choices. It should also be considered
that our study only addressed the initial impacts of warning labels on people’s
purchasing behaviours; long term trends have not been addressed. It is possible
that people could get used to seeing the warning label and stop paying attention to it
after a while. It is also possible that a warning label on one product could transfer to
138
individuals’ perceptions about other products from the same company. For
example, if someone sees a warning label on a Quaker granola bar, will their
subconscious transfer that negative health perception to Quaker cereal products? Or
will the presence of a warning label shift the consumption from one product
category to another category entirely rather than within the same category? There
are many possible complex outcomes, both in the short and long term, of which the
surface has only been scratched in this research. Additionally, if Health Canada
really wants to improve diet-related health outcomes, the warning label should only
be a starting point; other policies addressing public nutrition will also be needed.
5.6 Limitations of study
The research discussed in this study has several limitations that should be
considered. The first is that the first two studies, focusing on children’s and parents’
choices are both based on choice experiment data which always has its limitations.
In the children’s study one of the 12 choices was binding so there was
consequentiality and therefore motivation for participants to indicate their true
preferences. For the parents however, all choices were hypothetical and thus
inconsequential, so there was little motivation for the respondents to ensure that
their choices were representative of their true purchasing behaviour. In addition,
people may have felt obliged or pressured to choose fewer products with a warning
label than they normally would (social desirability bias), leading to our results
overestimating the effectiveness of such a mechanism.
There are also some limitations to the data used in this dissertation. The
sample size for the children’s study was only 58 due to the amount of time it took
(approximately two hours) to complete the choice experiment, questionnaire, and
all of the cognitive assessment tasks for each child. The small sample size limited
the types of analysis that could be done (for example it could not support a scaled
generalized multinomial logit model), but it was still large enough to generate
significant estimates for the models presented. In the parent study, the
experimental design was only generated to estimate main effects, interaction effects
139
were not accounted for, but the data collected was able to support models with
interactions so they were conducted nonetheless. In the firm behavior study, retail
price data were only available for the US for some years. Given that there are no
trade barriers on breakfast cereals between Canada and the US, it was decided that
it would be acceptable to use the American data and convert it to Canadian currency
using historical exchange rates, but it is possible that some differences in prices
between countries existed that were not accounted for.
5.7 Future research
There are several areas this dissertation has explored that merit further
research. The first and most obvious area is the effect of warning labels on
consumers’ food choices. Our examination of this topic was based on hypothetical
purchases in a choice experiment, which is the only type of data available when a
product (such as food with a warning label) doesn’t exist in the marketplace.
However, warning labels will soon be mandated in Canada on foods high in sugar,
sodium, and/or saturated fat by Health Canada, which presents a unique
opportunity for a natural experiment with revealed preference data. Comparing
purchasing and consumption patterns pre- and post-warning label will provide
excellent insight into consumer decision-making and the effect of information
provision on dietary choices. Evaluating the effectiveness of the warning label will
help to inform future policy decisions both in Canada and internationally. It will
also present an opportunity to see how the warning label indirectly affects the food
industry, be it through manufacturer reformulations, other changes in firm strategy,
or consumers’ changing perceptions about what are healthy foods. It is possible
that consumers might view all products with warning labels as equally bad and
switch to worse products if they have no intention of avoiding the warning. There
are always unanticipated consequences to policy measures, and identifying them is
an important role of researchers.
Another area of interest for future research is the frequency rather than
binary set up of the choice experiment. Most research in the consumer choice field
140
has an experimental design that only allows respondents to choose one alternative
(or none) from a set of 2-4 options. This makes sense in a situation where a
consumer would only ever choose one product (such as a car), but for non-durable
goods that are purchased and consumed frequently, this likely wouldn’t represent
actual purchasing behavior. Policy-makers can’t assume that a mechanism such as a
warning label on food products will have an all-or-nothing effect, which is what a
binary choice framework implies. If a warning label were suddenly implemented on
breakfast cereals (or some other commonly consumed food product), it is more
likely that people will react by buying less of the product in question or buying it
more infrequently than ceasing purchases of it altogether. Perhaps high sugar
cereals would become a weekend-only food in some households. Utilizing a
frequency framework allows researchers and policy-makers to better capture these
nuances thus improving the accuracy of estimated effectiveness or costs and
benefits of such a program and should be explored further.
Finally, the first study in this dissertation collected data on children’s
autonomous food purchases and provided evidence that they do in fact purchase
food independently, but one thing it does not investigate is whether children exhibit
compensatory behaviour. For example, if a child is fed mostly healthy food at home,
does this shape their preferences that determine what they purchase when out in
the world on their own, increasing the likelihood that they make healthy choices
independently? Or does it create the opposite effect, where children don’t get
unhealthy foods from their parents so seek them out when given the chance to make
autonomous food choices? Further research on this topic could increase the
understanding of children’s food choices.
141
References:
Adamowicz, W., P. Boxall, M. Williams, and J. Louviere. 1995. Stated preference
approaches for measuring passive use values: Choice experiments versus
contingent valuation. Staff Paper 95-03. Department of Rural Economy.
Adams, A. S., & Edworthy, J. (1995). Quantifying and predicting the effects of basic
text display variables on the perceived urgency of warning labels: tradeoffs
involving font size, border weight and colour. Ergonomics, 38(11), 2221-2237.
Alberta Agriculture and Forestry. (2009). Consumer Corner – Breakfast Trends in
Canada. Available at:
http://www1.agric.gov.ab.ca/$department/deptdocs.nsf/all/sis12787
Allais, O., Bertail, P., & Nichèle, V. (2010). The effects of a fat tax on French
households’ purchases: a nutritional approach. American Journal of
Agricultural Economics, 92(1), 228-245.
Anderson, P., Chisholm, D., & Fuhr, D. C. (2009). Effectiveness and cost-effectiveness
of policies and programmes to reduce the harm caused by alcohol. The Lancet,
373(9682), 2234-2246.
Anderson, S. P., & De Palma, A. (1992). The logit as a model of product
differentiation. Oxford Economic Papers, 44(1), 51-67.
Andreyeva, T., Long, M. W., & Brownell, K. D. (2010). The impact of food prices on
consumption: a systematic review of research on the price elasticity of
demand for food. American journal of public health, 100(2), 216.
Angell, S. Y., Silver, L. D., Goldstein, G. P., Johnson, C. M., Deitcher, D. R., Frieden, T. R.,
& Bassett, M. T. (2009). Cholesterol control beyond the clinic: New York City's
trans fat restriction. Annals of Internal Medicine, 151(2), 129-134.
Araya, S., Elberg, A., Noton, C., & Schwartz, D. (2018). Identifying Food Labeling Effects on Consumer Behavior.
Arcand, J., Mendoza, J., Qi, Y., Henson, S., Lou, W., & L'Abbe, M. R. (2013). Results of a
national survey examining Canadians' concern, actions, barriers, and support
for dietary sodium reduction interventions. Canadian Journal of Cardiology,
29(5), 628-631.
Argo, J. J., & Main, K. J. (2004). Meta-analyses of the effectiveness of warning labels.
Journal of public policy and marketing, 23(2), 193-208.
142
Arrúa, A., Curutchet, M. R., Rey, N., Barreto, P., Golovchenko, N., Sellanes, A., ... & Ares,
G. (2017). Impact of front-of-pack nutrition information and label design on
children's choice of two snack foods: Comparison of warnings and the traffic-
light system. Appetite, 116, 139-146.
ASC. (2014). Children’s Advertising Clearance Services. Available at:
http://www.adstandards.com/en/advertisingpreclearance/childrens.aspx
Astrup, A., Dyerberg, J., Elwood, P., Hermansen, K., Hu, F. B., Jakobsen, M. U., ... &
Willett, W. C. (2011). The role of reducing intakes of saturated fat in the
prevention of cardiovascular disease: where does the evidence stand in 2010?.
The American journal of clinical nutrition, 93(4), 684-688.
Azais-Braesco, V., Goffi, C., & Labouze, E. (2006). Nutrient profiling: comparison and
critical analysis of existing systems. Public health nutrition, 9(05), 613-622.
Baertlein, L. (2012). Kids’ cereals are healthier, ads aren’t: study. Reuters, US
edition, Health. Available at:
http://www.reuters.com/article/2012/06/22/us-cereal-advertising-
idUSBRE85L0O520120622
Balcombe, K. and I. Fraser. 2010. Traffic lights and food choice: A choice
experiment examining the relationship between nutritional food labels and
price. Food Policy 35(3):211-220.
Barton, B. A., Eldridge, A. L., Thompson, D., Affenito, S. G., Striegel-Moore, R. H.,
Franko, D. L., ... & Crockett, S. J. (2005). The relationship of breakfast and cereal
consumption to nutrient intake and body mass index: the National Heart, Lung,
and Blood Institute Growth and Health Study. Journal of the American Dietetic
Association, 105(9), 1383-1389.
Bastell, R.R. and J.J. Louviere. 1991. Experimental Analysis of Choice. Marketing
Letters, 2:199-214.
Batis, C., Rivera, J. A., Popkin, B. M., & Taillie, L. S. (2016). First-year evaluation of
Mexico’s tax on nonessential energy-dense foods: an observational study. PLoS
medicine, 13(7), e1002057.
Bayer, A. 2010. New European law requires warning labels on foods with artificial
colors. Available at: http://www.examiner.com/article/new-european-law-
requires-warning-labels-on-foods-with-artificial-colors

143
Bayus, B. L., & Putsis Jr, W. P. (1999). Product proliferation: An empirical analysis of
product line determinants and market outcomes. Marketing Science, 18(2),
137-153.
Bech, M., Kjaer, T., & Lauridsen, J. (2011). Does the number of choice sets matter?
Results from a web survey applying a discrete choice experiment. Health
economics, 20(3), 273-286.
Belot, M., & James, J. (2011). Healthy school meals and educational outcomes.
Journal of health economics, 30(3), 489-504.
Berning, J. P., Chouinard, H. H., & McCluskey, J. J. (2008). Consumer preferences for
detailed versus summary formats of nutrition information on grocery store
shelf labels. Journal of Agricultural & Food Industrial Organization, 6(1).
Bettinger, E., & Slonim, R. (2007). Patience among children. Journal of Public
Economics, 91(1), 343-363.
Bhat, C. R. (2008). The multiple discrete-continuous extreme value (MDCEV) model:
role of utility function parameters, identification considerations, and model
extensions. Transportation Research Part B: Methodological, 42(3), 274-303.
Bødker, M., Pisinger, C., Toft, U., & Jørgensen, T. (2015). The Danish fat tax—Effects
on consumption patterns and risk of ischaemic heart disease. Preventive
medicine, 77, 200-203.
Bollard, T., Maubach, N., Walker, N., & Mhurchu, C. N. (2016). Effects of plain
packaging, warning labels, and taxes on young people’s predicted sugar-
sweetened beverage preferences: an experimental study. international journal
of behavioral nutrition and physical activity, 13(1), 95.
Boncinelli, F., Gerini, F., Pagnotta, G., & Alfnes, F. (2017). Warning labels on junk
food: experimental evidence. International Journal of Consumer Studies, 41(1),
46-53.
Boseley, S. (2017). First US sugar tax sees soft drink sales fall by almost 10%, study
shows. The Guardian. Available at:
https://www.theguardian.com/society/2017/apr/18/first-us-sugar-tax-sees-
soft-drink-sales-fall-by-almost-10-study-shows
Boyland, E. J., & Whalen, R. (2015). Food advertising to children and its effects on
diet: review of recent prevalence and impact data. Pediatric diabetes, 16(5),
331-337.
144
Braun, C. C., & Silver, N. C. (1995). Interaction of signal word and colour on warning
labels: differences in perceived hazard and behavioural compliance.
Ergonomics, 38(11), 2207-2220.
Brownell, K. D., & Frieden, T. R. (2009). Ounces of prevention—the public policy
case for taxes on sugared beverages. New England Journal of Medicine, 360(18),
1805-1808.
Bruemmer, B., Krieger, J., Saelens, B. E., & Chan, N. (2012). Energy, saturated fat, and
sodium were lower in entrées at chain restaurants at 18 months compared
with 6 months following the implementation of mandatory menu labeling
regulation in King County, Washington. Journal of the Academy of Nutrition and
Dietetics, 112(8), 1169-1176.
Brunello, G., Michaud, P. C., & Sanz-de-Galdeano, A. (2009). The rise of obesity in
Europe: an economic perspective. Economic Policy, 24(59), 551-596.
Burghardt, J., Gordon, A., Chapman, N., Gleason, P., & Fraker, T. (1993). The School
Nutrition Dietary Assessment Study: school food service, meals offered, and
dietary intakes. Mathematica Policy Research.
Bushman, B. J. (1998). Effects of warning and information labels on consumption of
full-fat, reduced-fat, and no-fat products. Journal of Applied Psychology, 83(1),
97.
Buzzell, R. D., Gale, B. T., & Sultan, R. G. (1975). Market share-a key to profitability.
Harvard Business Review, 53(1), 97-106.
Byrd-Bredbenner, C., Abbot, J. M., & Cussler, E. (2009). Nutrient profile of household
food supplies of families with young children. Journal of the American Dietetic
Association, 109(12), 2057-2062.
Byrd-Bredbenner, C., Johnson, M., Quick, V. M., Walsh, J., Greene, G. W., Hoerr, S., ... &
Horacek, T. M. (2012). Sweet and salty. An assessment of the snacks and
beverages sold in vending machines on US post-secondary institution
campuses. Appetite, 58(3), 1143-1151.
Bzostek, J. A., & Wogalter, M. S. (1999, September). Measuring visual search time for
a product warning label as a function of icon, color, column and vertical
placement. In Proceedings of the Human Factors and Ergonomics Society Annual
Meeting (Vol. 43, No. 16, pp. 888-892). SAGE Publications.
145
Campbell, N., Legowski, B., Legetic, B., Ferrante, D., Nilson, E., Campbell, C., & L'Abbé,
M. (2014). Targets and timelines for reducing salt in processed food in the
Americas. The Journal of Clinical Hypertension, 16(9), 619-623.
Cannoosamy, K., Pugo-Gunsam, P., & Jeewon, R. (2014). Consumer knowledge and attitudes toward nutritional labels. Journal of nutrition education and behavior, 46(5), 334-340.
Carrillo, E., Varela, P., & Fiszman, S. (2012). Effects of food package information and
sensory characteristics on the perception of healthiness and the acceptability
of enriched biscuits. Food Research International, 48(1), 209-216.
Cash, S. B., & Lacanilao, R. D. (2007). Taxing food to improve health: economic
evidence and arguments. Agricultural and Resource Economics Review, 36(2),
174-182.
Cash, S.B., D.L. Sunding, and D. Zilberman. (2005) Fat taxes and thin subsidies:
prices, diet, and health outcomes. Acta Agriculturae Scand Section C 2.3-4:167-
174.
Cawley, J., & Frisvold, D. E. (2017). The Pass‐Through of Taxes on Sugar‐Sweetened
Beverages to Retail Prices: The Case of Berkeley, California. Journal of Policy
Analysis and Management, 36(2), 303-326.
Cherchi, E., & Hensher, D. A. (2015). Workshop synthesis: Stated preference surveys
and experimental design, an audit of the journey so far and future research
perspectives. Transportation Research Procedia, 11, 154-164.
Chouinard, H. H., Davis, D. E., LaFrance, J. T., & Perloff, J. M. (2005). The effects of a
fat tax on dairy products. Department of Agricultural & Resource Economics,
UCB.
Cisse‐Egbuonye, N., Liles, S., Schmitz, K. E., Kassem, N., Irvin, V. L., & Hovell, M. F.
(2016). Availability of vending machines and school stores in California
schools. Journal of School Health, 86(1), 48-53.
Clark, C. R. (2007). Advertising restrictions and competition in the children’s
breakfast cereal industry. Journal of Law and Economics, 50(4), 757-780.
Clark, H. R., Goyder, E., Bissell, P., Blank, L., & Peters, J. (2007). How do parents'
child-feeding behaviours influence child weight? Implications for childhood
obesity policy. Journal of Public Health, 29(2), 132-141.
Claro RM, Levy RB, Popkin BM, Monteiro CA. Sugar-sweetened beverage taxes in
Brazil. Am J Public Health. 2012;102(1):178-83.
146
Coca-Cola Enterprises Inc. 2014 Annual Report, available at:
http://ir.cokecce.com/phoenix.zhtml?c=117435&p=irol-reportsannual
Cohen, D. A., & Lesser, L. I. (2016). Obesity prevention at the point of
purchase. Obesity Reviews, 17(5), 389-396.
Colchero, M. A., Rivera-Dommarco, J., Popkin, B. M., & Ng, S. W. (2017). In Mexico,
evidence of sustained consumer response two years after implementing a
sugar-sweetened beverage tax. Health Affairs, 36(3), 564-571.
Connor, J. M. (1999). Breakfast cereals: The extreme food industry. Agribusiness: An
International Journal, 15(2), 247-259.
Cooke, R., & Papadaki, A. (2014). Nutrition label use mediates the positive
relationship between nutrition knowledge and attitudes towards healthy
eating with dietary quality among university students in the UK. Appetite, 83, 297-303.
Creel, M., & Loomis, J. (1992). Recreation value of water to wetlands in the San
Joaquin Valley: linked multinomial logit and count data trip frequency models.
Water resources research, 28(10), 2597-2606.
Daniels, S. R. (2006). The consequences of childhood overweight and obesity. The
future of children, 16(1), 47-67.
Darmon, N., & Drewnowski, A. (2015). Contribution of food prices and diet cost to
socioeconomic disparities in diet quality and health: a systematic review and
analysis. Nutrition Reviews, 73(10), 643-660.
de Bekker‐Grob, E. W., Ryan, M., & Gerard, K. (2012). Discrete choice experiments in
health economics: a review of the literature. Health economics, 21(2), 145-172.
Debnam, J. (2017). Selection Effects and Heterogeneous Demand Responses to the
Berkeley Soda Tax Vote. American Journal of Agricultural Economics, 99(5),
1172-1187.
Dellaert, B.G.C., J.D. Brazell and J.J. Louviere. 1999. The effect of attribute variation
on consumer choice consistency. Marketing Letters 10(2):139-147.
Dennisuk, L. A., Coutinho, A. J., Suratkar, S., Surkan, P. J., Christiansen, K., Riley, M., ...
& Gittelsohn, J. (2011). Food expenditures and food purchasing among low-
income, urban, African-American youth. American journal of preventive
medicine, 40(6), 625-628.
147
Department of Health, South Africa. (2012). Regulations relating to foodstuffs for
infants and young children. Available at:
http://blogs.sun.ac.za/iplaw/files/2013/12/ZAF-2012-Regulations-relating-
to-foodstuffs-for-infants-and-young-children-R.-No.-991-of-2012_0.pdf
DeShazo, J.R. and G. Fermo. 2002. Designing choice sets for stated preference
methods: The effects of complexity on choice consistency. Journal of
Environmental Economics and Management 44(1):123-143.
Dhar, T. and K. Bayliss. (2011) Fast-Food Consumption and the Ban on advertising
Targeting Children: The Quebec Experience. Journal of Marketing Research
48(5):799-813.
Dieticians of Canada. (2010). Advertising of Food and Beverages to Children;
Position of Dieticians of Canada. Available at:
https://www.dietitians.ca/Downloads/Public/Advertising-to-Children-
position-paper.aspx
Dixon, H. G., Scully, M. L., Wakefield, M. A., White, V. M., & Crawford, D. A. (2007). The
effects of television advertisements for junk food versus nutritious food on
children's food attitudes and preferences. Social science & medicine, 65(7),
1311-1323.
Dorfman, R., & Steiner, P. O. (1954). Optimal advertising and optimal quality. The
American Economic Review, 826-836.
Draganska, M., & Jain, D. C. (2005). Product‐Line Length as a Competitive Tool.
Journal of Economics & Management Strategy, 14(1), 1-28.
Drewnowski, A., & Darmon, N. (2005). Food choices and diet costs: an economic
analysis. The Journal of nutrition, 135(4), 900-904.
Drewnowski, A., & Fulgoni, V. L. (2014). Nutrient density: principles and evaluation
tools. The American journal of clinical nutrition, 99(5), 1223S-1228S.
Drichoutis, A. C., Lazaridis, P., & Nayga, R. M. (2005). Nutrition knowledge and
consumer use of nutritional food labels. European Review of Agricultural
Economics, 32(1), 93-118.
Dufwenberg, M., & Gneezy, U. (2000). Price competition and market concentration:
an experimental study. International Journal of Industrial Organization, 18(1),
7-22.
Dummer, J. (2012). Sodium reduction in Canadian food products with the health check program. Canadian Journal of Dietetic Practice and Research 73(1),
148
227-232.
Ehmke, M. D. (2012). Relating Behavioral Elements of Household Food Negotiation to
Childhood Overweight and Obesity1 (Doctoral dissertation, University of
Wyoming).
Ehmke, M. D., Morgan, K., Schroeter, C., Larson-Meyer, E., & Ballenger, N. (2007).
Using Experimental Economics to Measure the Role of Parental Generosity and
Food Control in Childhood Obesity. Revue Francais d'Economie.
Elliott, C. (2008). Assessing ‘fun foods’: nutritional content and analysis of
supermarket foods targeted at children. Obesity Reviews, 9(4), 368-377.
Epstein, L. H., Dearing, K. K., Handley, E. A., Roemmich, J. N., & Paluch, R. A. (2006).
Relationship of mother and child food purchases as a function of price: a pilot
study. Appetite, 47(1), 115-118.
Epstein, L. H., Valoski, A., Wing, R. R., & McCurley, J. (1990). Ten-year follow-up of
behavioral, family-based treatment for obese children. Jama, 264(19), 2519-
2523.
Euromonitor. (2014). Breakfast Cereals in Canada. Available at:
http://www.euromonitor.com/breakfast-cereals-in-canada/report
Falbe J, Rojas N, Grummon AH, Madsen KA. Higher retail prices of sugar-sweetened
beverages 3 months after implementation of an excise tax in Berkeley,
California. Am J Public Health. 2015;105(11):2194-201.
Faulkner, G. E., Grootendorst, P., Nguyen, V. H., Andreyeva, T., Arbour-Nicitopoulos,
K., Auld, M. C., ... & Dubé, L. (2011). Economic instruments for obesity
prevention: results of a scoping review and modified Delphi
survey. International Journal of Behavioral Nutrition and Physical Activity, 8(1),
109.
FDA. (2018). Final Determination Regarding Partially Hydrogenated Oils
(Removing Trans Fat). Available at:
https://www.fda.gov/food/ingredientspackaginglabeling/foodadditivesingre
dients/ucm449162.htm
Fenko, A., Nicolaas, I., & Galetzka, M. (2018). Does attention to health labels predict a
healthy food choice? An eye-tracking study. Food quality and preference.
Finch, M., Sutherland, R., Harrison, M., & Collins, C. (2006). Canteen purchasing
practices of year 1–6 primary school children and association with SES and
149
weight status. Australian and New Zealand journal of public health, 30(3), 247-
251.
Finkelstein, E., French, S., Variyam, J. N., & Haines, P. S. (2004). Pros and cons of
proposed interventions to promote healthy eating. American journal of
preventive medicine, 27(3), 163-171.
Folkvord, F., Anschütz, D. J., Boyland, E., Kelly, B., & Buijzen, M. (2016). Food
advertising and eating behavior in children. Current Opinion in Behavioral
Sciences, 9, 26-31.
Food in Canada (2018). Nine out of 10 Canadians eat cereal, says Kellogg Canada.
Available at: https://www.foodincanada.com/food-in-canada/nine-10-
canadians-eat-cereal-says-kellogg-canada-139229/
Fowler, F. J. Jr. (2009). 3 Sampling. In Survey Research Methods (4th ed.). (4th, pp. 18-
48). Thousand Oaks, CA: SAGE Publications, Inc. doi:
http://dx.doi.org.login.ezproxy.library.ualberta.ca/10.4135/9781452230184.
n3
Fox, M. K., Crespinsek, M. K., Connor, P., & Battaglia, M. (2004). School Nutrition
Dietary Assessment Study II: Summary of Findings. Cambridge, Mass: Abs
Associates; 2001. Report CN-01-SNDAII. Available at: http://www. fns. usda.
gov/oane/menu/published/cnp/files/sndaiifindsum. htm. Accessed June 8.
Franks, P. W., Hanson, R. L., Knowler, W. C., Sievers, M. L., Bennett, P. H., & Looker, H.
C. (2010). Childhood obesity, other cardiovascular risk factors, and premature
death. New England Journal of Medicine, 362(6), 485-493.
Frantz, J. P., & Rhoades, T. P. (1993). A task-analytic approach to the temporal and
spatial placement of product warnings. Human Factors: The Journal of the
Human Factors and Ergonomics Society, 35(4), 719-730.
Freire, W. B., Waters, W. F., Rivas-Mariño, G., Nguyen, T., & Rivas, P. (2017). A
qualitative study of consumer perceptions and use of traffic light food labelling
in Ecuador. Public health nutrition, 20(5), 805-813.
Gabriel, Y., & Lang, T. (2006). The unmanageable consumer. Sage.
Galbreath, J. (2009). Building corporate social responsibility into strategy. European
business review, 21(2), 109-127.
Gale, B. T., & Branch, B. S. (1982). Concentration versus market share: Which
determines performance and why does it matter. Antitrust Bull., 27, 83.
https://www.foodincanada.com/food-in-canada/nine-10-canadians-eat-cereal-says-kellogg-canada-139229/
150
Galvin, M. A., Kiely, M., & Flynn, A. (2003). Impact of ready-to-eat breakfast cereal
(RTEBC) consumption on adequacy of micronutrient intakes and compliance
with dietary recommendations in Irish adults. Public health nutrition, 6(04),
351-363.
Garson, A., & Engelhard, C. L. (2007). Attacking obesity: lessons from smoking.
Journal of the American College of Cardiology, 49(16), 1673-1675.
General Mills Global Responsibility 2015 Report, available at:
https://www.generalmills.com/en/Responsibility/Overview
Givel, M. (2007). A comparison of the impact of US and Canadian cigarette pack
warning label requirements on tobacco industry profitability and the public
health. Health Policy, 83(2-3), 343-352.
Gleason, P., & Suitor, C. (2001). Children's diets in the mid-1990s: dietary intake and
its relationship with school meal participation (No. 2443). Mathematica Policy
Research.
Goddard, E., Drescher, L. S., & Fernando, J. (2012). The potential impact of the Health
Check™ on diet quality of food away from home purchases. In 2012
AAEA/EAAE Food Environment Symposium, May 30-31, Boston, MA (No.
123523). Agricultural and Applied Economics Association.
Golan, E., & Unnevehr, L. (2008). Food product composition, consumer health, and
public policy: introduction and overview of special section. Food Policy, 33(6),
465-469.
Gracia, A., Loureiro, M. L., & Nayga, R. M. (2009). Consumers’ valuation of nutritional
information: a choice experiment study. Food Quality and Preference, 20(7),
463-471.
Grafton, R.Q., W. Adamowicz, D. Dupont, H. Nelson, R.J. Hill and S. Renzetti. 2004.
The economimcs of the environment and natural resources. Blackwell
Publishing Ltd, Malden, MA, USA.
Grantham-McGregor, S., & Ani, C. (2001). A review of studies on the effect of iron
deficiency on cognitive development in children. The Journal of nutrition,
131(2), 649S-668S.
Green, P.E. and V. Srinivasan. 1990. Conjoint analysis in marketing: New
developments with implications for research and practice. Journal of
Marketing 54(4):3-19.

151
Greene, W.H. 2007. NLOGIT Version 4.0 Reference Guide. Econometric Software,
Inc. Plainview, NY, USA.
Grosso, G., Bella, F., Godos, J., Sciacca, S., Del Rio, D., Ray, S., ... & Giovannucci, E. L.
(2017). Possible role of diet in cancer: Systematic review and multiple meta-
analyses of dietary patterns, lifestyle factors, and cancer risk. Nutrition
reviews, 75(6), 405-419.
Grynbaum, M. (2015). De blasio administration wants high-sodium warnings on
menus. New York Times, 9 June 2015. Available online:
http://www.nytimes.com/2015/06/10/nyregion/de-blasio-administration-
wants-high-sodium-warnings-on-menus.html
Gunter, B., & Furnham, A. (1998). Children as consumers: A psychological analysis of
the young people's market. Psychology Press.
Haab, T.C. and K.E. McConnell. 2002. Valuing environmental and natural resources:
The econometrics of non-market valuation. Edward Elgar Publishing.
Häckner, J. (2000). A note on price and quantity competition in differentiated
oligopolies. Journal of Economic Theory, 93(2), 233-239.
Halford, J. C., Gillespie, J., Brown, V., Pontin, E. E., & Dovey, T. M. (2004). Effect of
television advertisements for foods on food consumption in
children. Appetite, 42(2), 221-225.
Hammond, D., Fong, G. T., McDonald, P. W., Brown, K. S., & Cameron, R. (2004).
Graphic Canadian cigarette warning labels and adverse outcomes: evidence
from Canadian smokers. American Journal of Public Health, 94(8), 1442-1445.
Han, J. C., Lawlor, D. A., & Kimm, S. Y. (2010). Childhood obesity. The Lancet,
375(9727), 1737-1748.
Hanley, N., W. Adamowicz and R.E. Wright. 2005. Price vector effects in choice
experiments: an empirical test. Resource and Energy Economics 27(3):227-
234.
Harbaugh, W. T., Krause, K., & Berry, T. R. (2001). GARP for kids: On the
development of rational choice behavior. The American economic review, 91(5),
1539-1545.
Harbaugh, W. T., Krause, K., & Liday, S. J. (2003). Bargaining by children. University
of Oregon Economics Working Paper, (2002-4).
152
Harris, J. L., Thompson, J. M., Schwartz, M. B., & Brownell, K. D. (2011). Nutrition-
related claims on children's cereals: what do they mean to parents and do they
influence willingness to buy?. Public health nutrition, 14(12), 2207-2212.
Harris, S. (2017) Breakfast sandwich sales boom as time-starved Canadians shun
cereal at home. CBC News. Available at:
https://www.cbc.ca/news/business/breakfast-sandwich-sales-breakfast-
time-1.4119951
He, M., Tucker, P., Gilliland, J., Irwin, J. D., Larsen, K., & Hess, P. (2012). The influence
of local food environments on adolescents’ food purchasing behaviors.
International journal of environmental research and public health, 9(4), 1458-
1471.
Health Canada. (2018). Canadian Ban on Trans Fats Comes into Force Today.
Available at: https://www.canada.ca/en/health-
canada/news/2018/09/canadian-ban-on-trans-fats-comes-into-force-
today.html
Health Canada. 2018. Consultation on front-of-package nutrition labeling.
Available online: https://www.canada.ca/en/health-canada/programs/front-
of-package-nutrition-labelling.html
Healthy Alberta. 2012. Healthy Eating for Children in Childcare Centres. Available
at: https://open.alberta.ca/dataset/d373681c-96af-4dc6-b32b-
bb86a1e03097/resource/17ede4c5-2f5b-4811-a596-
3b49ad5ca9df/download/nutrition-healthy-eating-ab-childcarecentres.pdf
Heller, R., Quick, V., & Byrd-Bredbenner, C. (2011). Where’s the fruit? Temporal
changes in children’s television advertisements for “fruit containing” foods. J.
Media Commun. Stud, 3(1), 16-21.
Hensher, D. A. (2004). Identifying the influence of stated choice design
dimensionality on willingness to pay for travel time savings. Journal of
Transport Economics and Policy (JTEP), 38(3), 425-446.
Hensher, D. A., Rose, J. M., & Greene, W. H. (2012). Inferring attribute non-
attendance from stated choice data: implications for willingness to pay
estimates and a warning for stated choice experiment design. Transportation,
39(2), 235-245.
Herrick, C. (2009). Shifting blame/selling health: corporate social responsibility in
the age of obesity. Sociology of health & illness, 31(1), 51-65.

153
Hung, N. M., & Schmitt, N. (1988). Quality competition and threat of entry in
duopoly. Economics Letters, 27(3), 287-292.
Jacobson, M. F., & Brownell, K. D. (2000). Small taxes on soft drinks and snack foods
to promote health. American journal of public health, 90(6), 854.
Janssen, E. M., & Bridges, J. F. (2017). Art and science of instrument development for
stated-preference methods.
Johnson, R. J., Segal, M. S., Sautin, Y., Nakagawa, T., Feig, D. I., Kang, D. H., ... &
Sánchez-Lozada, L. G. (2007). Potential role of sugar (fructose) in the epidemic
of hypertension, obesity and the metabolic syndrome, diabetes, kidney disease,
and cardiovascular disease. The American journal of clinical nutrition, 86(4),
899-906.
Jones, N. R., Conklin, A. I., Suhrcke, M., & Monsivais, P. (2014). The growing price gap
between more and less healthy foods: analysis of a novel longitudinal UK
dataset. PLoS One, 9(10), e109343.
Just, D. R., & Price, J. (2013). Using incentives to encourage healthy eating in
children. Journal of Human resources, 48(4), 855-872.
Kadiyali, V., Vilcassim, N. J., & Chintagunta, P. K. (1996). Empirical analysis of
competitive product line pricing decisions: Lead, follow, or move together?.
Journal of Business, 459-487.
Kadiyali, V., Vilcassim, N., & Chintagunta, P. (1998). Product line extensions and
competitive market interactions: An empirical analysis. Journal of
Econometrics, 89(1), 339-363.
Kaphingst, K. M., & French, S. "The role of schools in obesity prevention." The Future
of Children 16.1 (2006): 109-142.
Keating, C.P. (1990). Adolescent thinking.
Kellogg Company 2014 Corporate Responsibility Report, available at:
http://www.kelloggcompany.com/content/dam/kelloggcompanyus/corporat
e_responsibility/pdf/2015/Kelloggs_CRR_2014_FINAL.pdf
Kellogg Company 2016 Corporate Responsibility Report, available at:
file:///Users/Allen13MBP/Downloads/2156221.pdf
Kelly, B., C. Hughes, K. Chapman, J.C. Louie, H. Dixon, J. Crawford, L. King, M. Daube,
and T. Slevin. 2009. Consumer testing of the acceptability and effectiveness of
154
front-of-pack food labeling systems for the Australian grocery market. Health
Promotion International 24(2):120-129.
Khandpur, N., de Morais Sato, P., Mais, L. A., Bortoletto Martins, A. P., Spinillo, C. G.,
Garcia, M. T., ... & Jaime, P. C. (2018). Are Front-of-Package Warning Labels
More Effective at Communicating Nutrition Information than Traffic-Light
Labels? A Randomized Controlled Experiment in a Brazilian
Sample. Nutrients, 10(6), 688.
Klompenhouwer, T., & van den Belt, H. (2003). Regulating functional foods in the
European Union: informed choice versus consumer protection?. Journal of
Agricultural and Environmental Ethics, 16(6), 545-556.
Komlos, J., P.K. Smith, and B. Bogin. 2004. Obesity and the Rate of Time Preference:
Is There a Connection? Journal of Biosocial Science 36:209–19.
Kovacic, W. E., & Rosch, J. T. (2008). Marketing Food to Children and Adolescents. A
Review of Industry Expenditures, Activities, and Self-Regulation. Washington:
Federal Trade Comission.
Kuchler, F., Tegene, A., & Harris, J. M. (2005). Taxing snack foods: Manipulating diet
quality or financing information programs?. Applied Economic Perspectives and
Policy, 27(1), 4-20.
Kulak, S., & Stein, R. E. (2016). Toy age-labeling: an overview for pediatricians of
how toys receive their age safety and developmental
designations. Pediatrics, 138(1), e20151803.
Kuperis, P., Veeman, M. M., & Adamowicz, W. L. (1999). Consumers' responses to the
potential use of bovine somatotrophin in canadian dairy production. Canadian
Journal of Agricultural Economics, 47(2), 151-164.
L'Abbé, M. R., Stender, S., Skeaff, C. M., & Tavella, M. (2009). Approaches to removing
trans fats from the food supply in industrialized and developing countries.
European Journal of Clinical Nutrition, 63, S50-S67.
Lacanilao, R. D., Cash, S. B., & Adamowicz, W. L. (2011). Heterogeneous consumer
responses to snack food taxes and warning labels. Journal of Consumer Affairs,
45(1), 108-122.
Lambin, J. J., Naert, P. A., & Bultez, A. (1975). Optimal marketing behavior in
oligopoly. European Economic Review, 6(2), 105-128.
Lancaster, K. 1966. A new approach to consumer theory. Journal of Political
Economy 74:132-157.
155
Laughery, K. R., Young, S. L., Vaubel, K. P., & Brelsford Jr, J. W. (1993). The
noticeability of warnings on alcoholic beverage containers. Journal of Public
Policy & Marketing, 38-56.
Lawlor, M. A., & Prothero, A. (2011). Pester power–A battle of wills between
children and their parents. Journal of Marketing Management, 27(5-6), 561-
581.
Lee, H. H. M., Van Dolen, W., & Kolk, A. (2013). On the role of social media in the
‘responsible’food business: blogger buzz on health and obesity issues. Journal
of business ethics, 118(4), 695-707.
Leonard, P. S. (2017). Do school junk food bans improve student health? Evidence
from Canada. Canadian Public Policy, 43(2), 105-119.
Lobstein, T., & Dibb, S. (2005). Evidence of a possible link between obesogenic food
advertising and child overweight. Obesity reviews, 6(3), 203-208.
LoDolce, M. E., Harris, J. L., & Schwartz, M. B. (2013). Sugar as part of a balanced
breakfast? What cereal advertisements teach children about healthy eating.
Journal of health communication, 18(11), 1293-1309.
Loewenstein, G., Sunstein, C.R., & Golman, R. (2014). Disclosure: Psychology Changes
Everything. Annual Review of Economics, 6, 391-419.
Loureiro, M. L., Gracia, A., & Nayga, R. M. (2006). Do consumers value nutritional
labels?. European Review of Agricultural Economics, 33(2), 249-268.
Louviere, J.J. 1988a. Analyzing Decision Making: Metric Conjoint Analysis. Sage
Publications (paper 67), Newbury Park, CA.
Louviere, J.J. 1988b. Conjoint analysis modeling of stated preferences: a review of
theory, methods, recent developments and external validity. Journal of
Transport Economics and Policy 22(1):93-119.
Louviere, J.J. 1991. Experimental choice analysis: introduction and overview.
Journal of Business Research 23:291-297.
Louviere, J.J., D.A. Hensher, and J.D. Swait. 2000. Stated Choice Methods: Analysis and
Applications. Cambridge University Press.
Lundberg, S., Romich, J.L., & Tsang, K.P. (2009). Decision-making by children.
Review of Economics of the Household, 7(1), 1-30.
156
Lutz, S. (1997). Vertical product differentiation and entry deterrence. Journal of
Economics, 65(1), 79-102.
Madden, D. (2015). The Poverty Effects Of A ‘Fat‐Tax’In Ireland. Health
economics, 24(1), 104-121.
Magarey, A.M., Daniels, L.A., Boulton, T.J., Cockington, R.A. (2003). Predicting
obesity in early adulthood from childhood and parental obesity. International
Journal of Obesity Related Metabolic Disorders, 27, 505– 513,2003 .
Mancino, L., & Buzby, J. (2005). Americans’ Whole Grain Consumption Below
Guidelines. Amber Waves, 3(2), 5.
Mancino, L., Kuchler, F., & Leibtag, E. (2008). Getting consumers to eat more whole-
grains: the role of policy, information, and food manufacturers. Food Policy,
33(6), 489-496.
Marshall, T., Kennedy, E., & Offutt, S. (2000). Exploring a fiscal food policy: the case
of diet and ischaemic heart diseaseCommentary: Alternative nutrition
outcomes using a fiscal food policy. Bmj, 320(7230), 301-305.
Mayer-Davis, E. J., Lawrence, J. M., Dabelea, D., Divers, J., Isom, S., Dolan, L., ... &
Pihoker, C. (2017). Incidence trends of type 1 and type 2 diabetes among
youths, 2002–2012. New England Journal of Medicine, 376(15), 1419-1429.
McGuire, S. (2016). World cancer report 2014. Geneva, Switzerland: World Health
Organization, international agency for research on cancer, WHO Press, 2015.
McNeal, J. U., OPS., Kellogg, F. W., & Centros para el Control y la Prevención de
Enfermedades (CDC). (2000). Children as consumers of commercial and social
products. Washington, DC: Pan American Health Organization.
McWilliams, A. (2000). Corporate Social Responsibility. Wiley Encyclopedia of
Management.
Meister, M. 2014. Many children and adolescents get too much caffeine from energy
drinks. DTU Food, National Food Institute, available at:
http://www.food.dtu.dk/english/News/2014/12/Many-children-and-
adolescents-get-too-much-caffeine-from-energy-drinks
Miao, Z., Beghin, J. C., & Jensen, H. H. (2012). Taxing sweets: sweetener input tax or
final consumption tax?. Contemporary Economic Policy, 30(3), 344-361.
157
Miljkovic, D., Nganje, W., & de Chastenet, H. (2008). Economic factors affecting the
increase in obesity in the United States: Differential response to price. Food
Policy, 33(1), 48-60.
Mueller, S. C., & Umberger, W. J. (2010, September). “Pick the Tick” The Impact of
Health Endorsements on Consumers’ Food Choices. In 115th Joint EAAE/AAEA
Seminar, September 15-17, 2010, Freising-Weihenstephan, Germany (No.
116436). European Association of Agricultural Economists & Agricultural and
Applied Economics Association.
Mytton, O., Gray, A., Rayner, M., & Rutter, H. (2007). Could targeted food taxes
improve health?. Journal of epidemiology and community health, 61(8), 689-
694.
Mytton, O. T., Clarke, D., & Rayner, M. (2012). Taxing unhealthy food and drinks to
improve health. BMJ, 344.
Nan, X., Zhao, X., Yang, B., & Iles, I. (2015). Effectiveness of cigarette warning labels:
examining the impact of graphics, message framing, and temporal
framing. Health communication, 30(1), 81-89.
Nanney MS, MacLehose RF, Kubik MY, Davey CS, O’Connell MJ, Grannon KY, Nelson TF. School Obesity Prevention Policies and Practices in Minnesota and Student Outcomes: A Longitudinal Cohort Study. Am J Prev Med. 2016;51(5):656-63.
Nelson, P. (1974). Advertising as information. The journal of political economy, 729-
754.
Nestle, M. (2013). Food politics: How the food industry influences nutrition and health
(Vol. 3). Univ of California Press.
Neumark-Sztainer, D., Story, M., Perry, C., & Casey, M.A. (1999). Factors influencing
food choices of adolescents: findings from focus-group discussions with
adolescents. Journal of the American dietetic association, 99(8), 929-937.
Nevo, A. (2001). Measuring market power in the ready‐to‐eat cereal industry.
Econometrica, 69(2), 307-342.
O’Connor, A. (2012). Bans on School Junk Food Pay Off in California. The New York
Times. Available at: https://well.blogs.nytimes.com/2012/05/08/bans-on-
school-junk-food-pay-off-in-california/
O’Hegarty, M., Pederson, L. L., Nelson, D. E., Mowery, P., Gable, J. M., & Wortley, P.
(2006). Reactions of young adult smokers to warning labels on cigarette
packages. American journal of preventive medicine, 30(6), 467-473.
158
Ohler, T., A. Le, J. Louviere and J. Swait. 2000. Attribute range effects in binary
response tasks. Marketing Letters 11(3):249-260.
Oostindjer, M., Aschemann-Witzel, J., Wang, Q., Skuland, S. E., Egelandsdal, B.,
Amdam, G. V., ... & Lengard Almli, V. (2017). Are school meals a viable and
sustainable tool to improve the healthiness and sustainability of children´ s
diet and food consumption? A cross-national comparative perspective. Critical
reviews in food science and nutrition, 57(18), 3942-3958.
Parmenter, K., & Wardle, J. (1999). Development of a general nutrition knowledge
questionnaire for adults. European Journal of Clinical Nutrition, 53(4), 298-308.
Patrick, H., & Nicklas, T. A. (2005). A review of family and social determinants of
children’s eating patterns and diet quality. Journal of the American College of
Nutrition, 24(2), 83-92.
Perry, S. (2010). Food-dye warning labels are now required in Europe; will the FDA
do the same? Minnpost. Available at: https://www.minnpost.com/second-
opinion/2010/07/food-dye-warning-labels-are-now-required-europe-will-
fda-do-same
Pietinen, P., Valsta, L. M., Hirvonen, T., & Sinkko, H. (2008). Labelling the salt content
in foods: a useful tool in reducing sodium intake in Finland. Public health
nutrition, 11(04), 335-340.
Powell, L. M., & Chaloupka, F. J. (2009). Food prices and obesity: evidence and policy
implications for taxes and subsidies. The Milbank Quarterly, 87(1), 229-257.
Purmehdi, M., Legoux, R., Carrillat, F., & Senecal, S. (2017). The effectiveness of
warning labels for consumers: a meta-analytic investigation into their
underlying process and contingencies. Journal of Public Policy &
Marketing, 36(1), 36-53.
Precision Nutrition. (2015). All About Breakfast Cereals. Available at:
http://www.precisionnutrition.com/all-about-breakfast-cereals
Print Measurement Bureau. (2015). 2015 Spring 2 year database (DE). Groceries;
Cold Cereals.
Racker, M. (2018). Bill requiring warning labels for sugary beverages in California
dies in legislative committee. Los Angeles Times, August 16, 2018. Available at:
https://www.latimes.com/politics/essential/la-pol-ca-essential-politics-may-
2018-plan-to-add-warning-labels-to-sugary-1534453981-htmlstory.html
159
Ratnayake, W. M. N., L'abbe, M. R., & Mozaffarian, D. (2009). Nationwide product
reformulations to reduce trans fatty acids in Canada: when trans fat goes out,
what goes in?. European journal of clinical nutrition, 63(6), 808-811.
Roberto, C. A., Wong, D., Musicus, A., & Hammond, D. (2016). The influence of sugar-
sweetened beverage health warning labels on parents’
choices. Pediatrics, 137(2), e20153185.
Robertson, D. (2018). Feds target junk food ads for kids. Winnipeg Free Press,
September 20, 2018. Available at:
https://www.winnipegfreepress.com/local/feds-target-junk-food-ads-for-kids-
493897011.html
Roseman, M. G., Poor, M., & Stephenson, T. J. (2014). A content analysis of food
references in television programming specifically targeting viewing audiences
aged 11 to 14 years. Journal of nutrition education and behavior, 46(1), 20-25.
Roth, Y. (2016). Do Brands Serve as Reliable Signals of Nutritional Quality? The Case
of Breakfast Cereals. Journal of Food Products Marketing, 1-23.
Richards, Z., Thomas, S. L., Randle, M., & Pettigrew, S. (2015). Corporate Social
Responsibility programs of Big Food in Australia: a content analysis of
industry documents. Australian and New Zealand journal of public health.
Rubinstein, A., Elorriaga, N., Garay, O. U., Poggio, R., Caporale, J., Matta, M. G., ... &
Mozaffarian, D. (2015). Eliminating artificial trans fatty acids in Argentina:
estimated effects on the burden of coronary heart disease and costs. Bulletin of
the World Health Organization.
Sabbane, L. I., Lowrey, T. M., & CHEBAT, J. C. (2009). The effectiveness of cigarette
warning label threats on nonsmoking adolescents. Journal of Consumer Affairs,
43(2), 332-345.
Sacks, G., J.L. Veerman, M. Moodie, and B. Swinburn. 2011. ‘Traffic-light’ nutrition
labeling and ‘junk-food’ tax: a modeled comparison of cost-effectiveness for
obesity prevention. International Journal of Obesity 35:1001-1009.
Sassi, F., Cecchini, M., Lauer, J., & Chisholm, D. (2009). Improving lifestyles, tackling
obesity: the health and economic impact of prevention strategies.
Scheibehenne, B., Greifeneder, R., & Todd, P. M. (2010). Can there ever be too many
options? A meta-analytic review of choice overload. Journal of Consumer
Research, 37(3), 409-425.
160
Scheidt, D. M., & Daniel, E. (2004). Composite index for aggregating nutrient density
using food labels: ratio of recommended to restricted food components.
Journal of nutrition education and behavior, 36(1), 35-39.
Schmalensee, R. (1978). Entry deterrence in the ready-to-eat breakfast cereal
industry. The Bell Journal of Economics, 305-327.
Schmalensee, R. (1982). Product differentiation advantages of pioneering brands.
The American Economic Review, 349-365.
Schor J. Born to buy: The commercialized child and the new consumer culture. Simon
and Schuster; 2004.
Schroeter, C., Lusk, J., & Tyner, W. (2008). Determining the impact of food price and
income changes on body weight. Journal of health economics, 27(1), 45-68.
Schulz, N., & Stahl, K. (1996). Do consumers search for the highest price? Oligopoly
equilibrium and monopoly optimum in differentiated-products markets. The
RAND Journal of Economics, 542-562.
Schwartz, M. B., Vartanian, L. R., Wharton, C. M., & Brownell, K. D. (2008). Examining
the nutritional quality of breakfast cereals marketed to children. Journal of the
American Dietetic Association, 108(4), 702-705.
Singh, N., & Vives, X. (1984). Price and quantity competition in a differentiated
duopoly. The RAND Journal of Economics, 546-554.
Slining, M. M., Ng, S. W., & Popkin, B. M. (2013). Food companies' calorie-reduction
pledges to improve US diet. American journal of preventive medicine, 44(2),
174-184.
Smed, S., Scarborough, P., Rayner, M., & Jensen, J. D. (2016). The effects of the Danish
saturated fat tax on food and nutrient intake and modelled health outcomes:
an econometric and comparative risk assessment evaluation. European journal
of clinical nutrition, 70(6), 681.
Smith, P.K., B. Bogin, and D. Bishai. 2005. Are Time Preference and Body Mass Index
Associated? Evidence from the National Longitudinal Survey of Youth.
Economics and Human Biology 3:259–70.
Stewart, D. W., & Martin, I. M. (1994). Intended and unintended consequences of
warning messages: A review and synthesis of empirical research. Journal of
Public Policy & Marketing, 1-19.
Sommer, A. (2001). Vitamin A deficiency. John Wiley & Sons, Ltd.
161
Sonntag, D., Schneider, S., Mdege, N., Ali, S., & Schmidt, B. (2015). Beyond food
promotion: a systematic review on the influence of the food industry on
obesity-related dietary behaviour among children. Nutrients, 7(10), 8565-
8576.
Statista. (2014). Advertising spending of the food and beverage industry in the
United States in 2013 by medium (in thousand U.S. dollars). Available at:
https://www.statista.com/statistics/319053/food-beverage-ad-spend-
medium/
Stephensen, C. B. (2001). Vitamin A, infection, and immune function*. Annual review
of nutrition, 21(1), 167-192.
Stender, S., Dyerberg, J., & Astrup, A. (2006). Consumer protection through a
legislative ban on industrially produced trans fatty acids in foods in Denmark.
Scandinavian Journal of Food and Nutrition-Incl Supplement, 50(4), 155.
Story, M., Nanney, M. S., & Schwartz, M. B. (2009). Schools and obesity prevention:
creating school environments and policies to promote healthy eating and
physical activity. Milbank Quarterly, 87(1), 71-100.
Strazzullo, P., D’Elia, L., Kandala, N. B., & Cappuccio, F. P. (2009). Salt intake, stroke,
and cardiovascular disease: meta-analysis of prospective studies. Bmj, 339.
Suarez-Balcazar, Y., Redmond, L., Kouba, J., Hellwig, M., Davis, R., Martinez, L. I., &
Jones, L. (2007). Introducing systems change in the schools: the case of school
luncheons and vending machines. American Journal of Community Psychology,
39(3-4), 335-345.
Swinburn, B., & Egger, G. (2002). Preventive strategies against weight gain and
obesity. Obesity reviews, 3(4), 289-301.
Taillie, L. S., Rivera, J. A., Popkin, B. M., & Batis, C. (2017). Do high vs. low purchasers
respond differently to a nonessential energy-dense food tax? Two-year
evaluation of Mexico's 8% nonessential food tax. Preventive medicine, 105, S37-
S42.
Tandon, P. S., Zhou, C., Chan, N. L., Lozano, P., Couch, S. C., Glanz, K., ... & Saelens, B. E.
(2011). The impact of menu labeling on fast-food purchases for children and
parents. American journal of preventive medicine, 41(4), 434-438.
The Economist. (2017). Fizzled Chicago’s soda tax is repealed. The Economist.
Available at: https://www.economist.com/democracy-in-
america/2017/10/13/chicagos-soda-tax-is-repealed
162
Thorndike, A. N., Riis, J., Sonnenberg, L. M., & Levy, D. E. (2014). Traffic-light labels
and choice architecture: promoting healthy food choices. American journal of
preventive medicine, 46(2), 143-149.
Thrasher, J. F., Rousu, M. C., Anaya-Ocampo, R., Reynales-Shigematsu, L. M., Arillo-
Santillán, E., & Hernández-Ávila, M. (2007). Estimating the impact of different
cigarette package warning label policies: The auction method. Addictive
behaviors, 32(12), 2916-2925.
Tiffin, R., & Arnoult, M. (2011). The public health impacts of a fat tax. European
journal of clinical nutrition, 65(4), 427-433.
Tim Horton’s 2014 Sustainability and Responsibility Report, available at:
http://www.timhortons.com/us/en/social/coffee-partnership-sustainability-
and-responsibility.php
Unnevehr, L. J., & Jagmanaite, E. (2008). Getting rid of trans fats in the US diet:
policies, incentives and progress. Food Policy, 33(6), 497-503.
VanEpps, E. M., & Roberto, C. A. (2016). The influence of sugar-sweetened beverage
warnings: a randomized trial of adolescents’ choices and beliefs. American
journal of preventive medicine, 51(5), 664-672.
VanEpps, E. M., Roberto, C. A., Park, S., Economos, C. D., & Bleich, S. N. (2016).
Restaurant menu labeling policy: Review of evidence and
controversies. Current obesity reports, 5(1), 72-80.
Variyam, J. N. (2001). Overweight children: is parental nutrition knowledge a
factor?. FOOD REVIEW-WASHINGTON DC-, 24(2), 18-22.
Veerman, J. L., Van Beeck, E. F., Barendregt, J. J., & Mackenbach, J. P. (2009). By how
much would limiting TV food advertising reduce childhood obesity?. The
European Journal of Public Health, ckp039.
Veling, H., Aarts, H., & Stroebe, W. (2013). Using stop signals to reduce impulsive
choices for palatable unhealthy foods. British journal of health psychology,
18(2), 354-368.
Verbeek, M. 2008. A Guide to Modern Econometrics, Third Edition. John Wiley &
Sons, Ltd. England.
Wagner, H. S., Howland, M., & Mann, T. (2015). Effects of subtle and explicit health
messages on food choice. Health Psychology, 34(1), 79.
163
Wansink, B., Hanks, A., Cawley, J., & Just, D. (2014). From coke to coors: a field study
of a fat tax and its unintended consequences.
Weeks, C. (2018). Canadian industry giants fight proposed bill banning junk-food
ads targeting children. The Globe and Mail. Available at:
https://www.theglobeandmail.com/canada/article-canadian-industry-giants-
fight-proposed-bill-banning-junk-food-ads/
Whole Grain Council. (2008). Whole Grain Statistics. Available at:
http://www.wholegrainscouncil.org/newsroom/whole-grain-statistics
Wing, R. R., Goldstein, M. G., Acton, K. J., Birch, L. L., Jakicic, J. M., Sallis, J. F., ... &
Surwit, R. S. (2001). Behavioral science research in diabetes lifestyle changes
related to obesity, eating behavior, and physical activity. Diabetes care, 24(1),
117-123.
Wogalter, M. S., & Laughery, K. R. (1996). Warning! Sign and label effectiveness.
Current Directions in Psychological Science, 33-37.
World Health Organization. (1981). International code of marketing of breast-milk
substitutes.
World Health Organization. (2015). WHO Regional Office for Europe nutrient profile
model.
Wrotniak, B. H., Epstein, L. H., Paluch, R. A., & Roemmich, J. N. (2004). Parent weight
change as a predictor of child weight change in family-based behavioral
obesity treatment. Archives of pediatrics & adolescent medicine, 158(4), 342-
347.
Wu, G., Fang, Y. Z., Yang, S., Lupton, J. R., & Turner, N. D. (2004). Glutathione
metabolism and its implications for health. The Journal of nutrition, 134(3),
489-492.
Yach, D., Hawkes, C., Epping-Jordan, J. E., & Galbraith, S. (2003). The World Health
Organization's Framework Convention on Tobacco Control: implications for
global epidemics of food-related deaths and disease. Journal of Public Health
Policy, 24(3-4), 274-290.
Yale Rudd Center for Food Policy & Obesity. 2012. Limited progress in the nutrition
quality and marketing of children’s cereals. Available at:
http://cerealfacts.org/media/Cereal_FACTS_Report_2012_7.12.pdf
164
Yang, Q., Zhang, Z., Gregg, E. W., Flanders, W. D., Merritt, R., & Hu, F. B. (2014). Added
sugar intake and cardiovascular diseases mortality among US adults. JAMA
internal medicine, 174(4), 516-524.
Yen, S. T., & Adamowicz, W. L. (1994). Participation, Trip Frequency and Site Choice:
A Multinomial‐Poisson Hurdle Model of Recreation Demand. Canadian Journal
of Agricultural Economics/Revue canadienne d'agroeconomie, 42(1), 65-76.
Young, L. (2018). Health Canada wants to make sure you know your food is high in
sugar, sodium and saturated fat. Global News. Available at:
https://globalnews.ca/news/4016526/health-canada-warning-labels-sugar-
sodium-saturated-fat/
Zarnowiecki, D., Sinn, N., Petkov, J., & Dollman, J. (2012). Parental nutrition
knowledge and attitudes as predictors of 5–6-year-old children's healthy food
knowledge. Public health nutrition, 15(07), 1284-1290.
Zuraw, L. 2014. California Senate Passes Bill Requiring Warning Labels on Some
Sugar-Sweetened Drinks. Food Safety News, available at:
http://www.foodsafetynews.com/2014/06/ca-senate-passes-bill-for-
warning-label-on-sugary-drinks/#.VRH6LSipzKN

165
Appendix 2A - Questionnaire
Questionnaire: Usual Snack Food Purchases
1. Do you get a regular allowance?
o YES
o NO
2. (If yes to #1) How much do you get per week? $_________
3. (If yes to #1) Do you ever buy yourself food with this money?
o YES
o NO
4. Do your parent(s) ever give you money to buy a snack and let you choose something for yourself?
o YES
o NO
5. (If yes to #3 or #4) What types of snack food products do you usually buy on your own? Please check all that apply:
o Fruit
o Potato chips
o Corn chips
o Cheese puffs
o Pretzels
o Popcorn
o Chocolate bars
o Cookies or crackers
o Candy
o Gum
o Soda
o Ice-cream
o Vegetables
o Others (please list): _______________________________________________________
166
Appendix 2B – Information and Consent Forms
Influence of Developmental Differences on Children’s Response to Information on Food
Investigators:
Vic Adamowicz Sean Cash Anna McAlister
501 General Services Bldg Room 127 Jaharis Room 309, Communication Arts &
Sciences Bldg
University of Alberta 150 Harrison Avenue 404 Wilson Road
Edmonton, AB T6G 2H1 Tufts University Michigan State University
Tel: (780) 492-4603 Boston, MA 02111 East Lansing, MI 48824
[email protected] Tel: (617) 636-6822 Tel: (517) 355-6666
[email protected] [email protected]
Shannon Allen Stephanie Simpson
515 General Services Bldg 515 General Services Bldg
University of Alberta University of Alberta
Edmonton, AB T6G 2H1 Edmonton, AB T6G 2H1
Tel: (780) 492-1518 Tel: (780) 492-1518
[email protected] [email protected]
Purpose: The purpose of this project is to learn about the connections between
children’s food choices and their language, math and reasoning skills. By understanding
how children and adolescents make food choices, we can help to inform policies that
attempt to improve public health in Canada by reducing the incidence of childhood
obesity. We are inviting your child to participate because he/she is between 8 and 12
years old, which is the age range we are focusing on in our study. A companion study of
this sort was conducted in the United States by the three researchers listed at the top of
this page. These individuals are now conducting this parallel study in Canada for
comparative purposes.
Methods: If your child participates, he/she will meet with the researcher in a room at
their after school care facility that is free from distractions. We will complete 7 short
activities (5-25 minutes each). These activities will feel like conversations or games. All
together, these activities take around 1.25 hours to complete – if your child participates,
we are able to split the activities into multiple sessions if need be.
Below are descriptions of the 7 activities your child will be asked to complete should
he/she participate:
The Peabody Picture Vocabulary Test: This test asks the child to listen and make choices. The researcher will say a word that corresponds to an image on the page of a book. The child will be asked to indicate which image on that page matches the researcher’s words.

167
The Stanford Binet Intelligence Scales: These scales ask the child to play lots of small, fun games. This is a standardized test that assesses IQ and cognitive abilities.
The Sort Task: This task asks the child to use his/her hands to sort shapes that he/she is unable to see.
The Tower of London Task: This task asks the child to move pieces on a game to match a picture.
The Circle Trace Task: This task asks the child to trace over a circle that is printed on letter-sized paper. The child is asked to trace the circle as slowly as possible, while the researcher records the time they take to complete the task.
The Stroop Test: This test asks the child to read words and name colours on a page. The researcher will time the child as he/she completes the task using a stopwatch and will use a tape recorder to record the words the child says. This recording will be used to make sure the researcher’s scoring of the test is correct, as the activity moves quickly. The researcher will erase the recording in 48 hours or less.
The Purchase Exercise: This exercise asks the child to make a series of hypothetical purchasing decisions between different types of snack foods. The child will be given a small amount of money ($5 or less) and one of the purchasing decisions will be randomly chosen to be binding. For that decision, the child will use their money to buy the snack they had indicated they would purchase. The child will also answer some questions about his/her snack-buying habits.
Confidentiality: If your child participates, all information your child provides will be
considered confidential and will be grouped with responses from other participants.
Names will not be associated with responses. Access to the data will be restricted to
investigators. Your child’s data, without any identifying features, will be stored on a
secure server at the University of Alberta.
Benefits: Survey participants will assist the researchers in learning about the ways in
which children and adolescents make food choices. This information may help policy
makers determine ways to improve adolescent health. In thanks for participating, your
child will be permitted to keep the snack he/she chooses to purchase as well as any of
the allotted money he/she may have remaining after making the purchase.
Risks: If your child participates, he/she will have the opportunity to purchase real food.
If your child has any known or suspected food allergies, intolerances or
sensitivities, please alert the research team to these allergies in advance of your
child’s participation in this study. For their safety, any child with known or
suspected allergies, intolerances or sensitivities to any types of foods will not be
included in this study.
Withdrawal from the Study: Participation in this study is voluntary. If you or your
child wishes, he/she may decline to answer any questions or participate in any
component of the study. Further, you or your child may decide to withdraw your child
from this study at any time and may do so without any penalty.

168
Use of Your Information: Information collected as part of this study will be used in
academic papers and publications as well as conference presentations. If your child is
withdrawn during the survey, the information he/she provided will be deleted from the
data set as it cannot be used in the analysis.
Questions: If you have any questions about the study, please contact the investigator,
Vic Adamowicz ([email protected] or 780-492-4603).
If you would like to talk with someone about your child’s rights as a potential research
participant or would like to report concerns, complaints or consequences, please
contact the University of Alberta’s Research Ethics Office at:
Research Ethics Office
University of Alberta
Edmonton, Alberta, Canada T6G 2H1
Phone: 780-492-2615

169
Influence of Developmental Differences on Children’s Response to Information on
Food
Investigators:
Vic Adamowicz Sean Cash Anna McAlister
501 General Services Building Tufts University Michigan State
University
Tel: (780) 492-4603 Tel: (617) 636-6822 Tel: (517) 355-6666
[email protected] [email protected] [email protected]
Shannon Allen Stephanie Simpson
515 General Services Building 515 General Services Building
Tel: (780) 492-1518 Tel: (780) 492-1518
[email protected] [email protected]
Please circle your answers.
1. Do you understand that your child has been asked to participate in a study?
2. Have you received and read the Information Sheet?
3. Do you understand the benefits and risks involved in permitting your child to take part in this study as outlined in the Information Sheet?
4. Do you understand that you or your child can withdraw your child from the study at any time? There is no penalty for withdrawing and no reason has to be provided for withdrawing from the study.
5. Do you understand who will be able to see or hear what your child says or does during the study?
6. Do you understand that an audio recording of your child will be made during the Stroop Test?
7. Do you know what the information your child provides will be used for?
8. Do you give us permission to use your child’s data for the purposes specified?
9. Does your child have known/suspected food allergies, intolerances or sensitivities?
a. If you answered yes to the question above, please list all known/suspected food allergies, intolerances or sensitivities:
____________________________________________________________________
10. Do you consent to your child participating in this study?
YES NO
YES NO
YES NO
YES NO
YES NO
YES NO
YES NO
YES NO
YES NO
YES NO
__________________________________ __________________________________
Name of Child Date
__________________________________ __________________________________
Name of Parent/Guardian (printed) Signature of Parent/Guardian

170
Influence of Developmental Differences on Children’s Response to Information on
Food
Investigators:
Vic Adamowicz Sean Cash Anna McAlister
501 General Services Building Tufts University Michigan State
University
Tel: (780) 492-4603 Tel: (617) 636-6822 Tel: (517) 355-6666
[email protected] [email protected] [email protected]
Shannon Allen Stephanie Simpson
515 General Services Building 515 General Services Building
Tel: (780) 492-1518 Tel: (780) 492-1518
[email protected] [email protected]
Please circle your answers.
1. Do you understand that you have been asked to take part in a study?
2. Have you read the Information Sheet?
3. Do you understand that we will record what you say during one of the tasks?
4. Do you understand that you are allowed to stop doing the tasks at any time? You won’t be punished for stopping. You don’t have to tell us why you want to stop.
5. Are you, or do you think you might be, allergic, intolerant or sensitive to some kinds of foods?
a. Please list all of the foods you are or think you might be allergic, intolerant or sensitive to:
____________________________________________________________________
6. Do you agree to take part in this study?
YES NO
YES NO
YES NO
YES NO
YES NO
YES NO
__________________________________
Name of Child (printed)

171
Appendix 3A – Parent Questionnaire In order to view some of the graphics properly, we recommend using a computer rather than a tablet or smartphone to complete this survey. 1) How many years old are you?* _________________________________________________ 2) Do you identify as* ( ) Male ( ) Female ( ) Other: _________________________________________________ 3) How many adults live in your household?* ( ) 1 ( ) 2 ( ) 3 ( ) 4 ( ) More than 4 4) How many children live in your household?* ( ) 1 ( ) 2 ( ) 3 ( ) 4 ( ) More than 4 ( ) Not applicable/ No children live in my house 5) In what age groups are your child(ren)?* [ ] under 2 [ ] 2-3 [ ] 4-5 [ ] 6-7 [ ] 8-9 [ ] 9-10 [ ] 11-12 [ ] 13-14 [ ] 15-16 [ ] 17+
172
Information and Consent Research Investigator: Shannon Allen 515 General Services Building University of Alberta Edmonton, Alberta T6G 2H1 Supervisor: Ellen Goddard 515 General Services Building University of Alberta Edmonton, Alberta T6G 2H1 Background You are being invited to participate in this study because we are investigating parental food choices. The results of this study will be used as a portion of Shannon Allen’s PhD dissertation and potentially for research articles to be submitted to scholarly journals and conference presentations. Purpose The purpose of this research is to better understand what influences parents’ choices when purchasing food for their children. Study Procedures We are asking participants to complete an online survey which explores food choices and gives several food shopping scenarios and asks which product(s) you would choose under the described circumstances. The survey takes approximately 15-30 minutes to complete. Benefits The benefits of participating in this study are solely financial. Society could benefit from this research if it allows us to gain a better understanding of how parents choose foods for their children. Risk There is no known risk of participating in this study. Voluntary Participation You are under no obligation to participate in this study. Your participation is completely voluntary.

173
Even if you agree to be in the study you can change your mind and withdraw by contacting Shannon Allen at [email protected] within one week of participating. Confidentiality and Anonymity This research will be used in Shannon Allen’s PhD dissertation as well as in conference presentations and research articles. No participants will be personally identifiable in any of these uses. The data collected will be kept confidential and accessible only to the lead researcher and supervisor. It will be stored on a secure server and password protected for a minimum of 5 years following completion of the research project. After this time period, the data will be destroyed. We may use the data we collect from this study in future research, but if we do this it will first have to be approved by a Research Ethics Board. Further Information If you have any further questions regarding this study, please do not hesitate to contact Lead researcher: Shannon Allen at [email protected] or Supervisor: Ellen Goddard at [email protected] The plan for this study has been reviewed for its adherence to ethical guidelines by a Research Ethics Board at the University of Alberta. For questions regarding participant rights and ethical conduct of research, contact the Research Ethics Office at 780-492-2615. Consent By completing this survey you are implying that you have read the above information and consent to participating in our study.
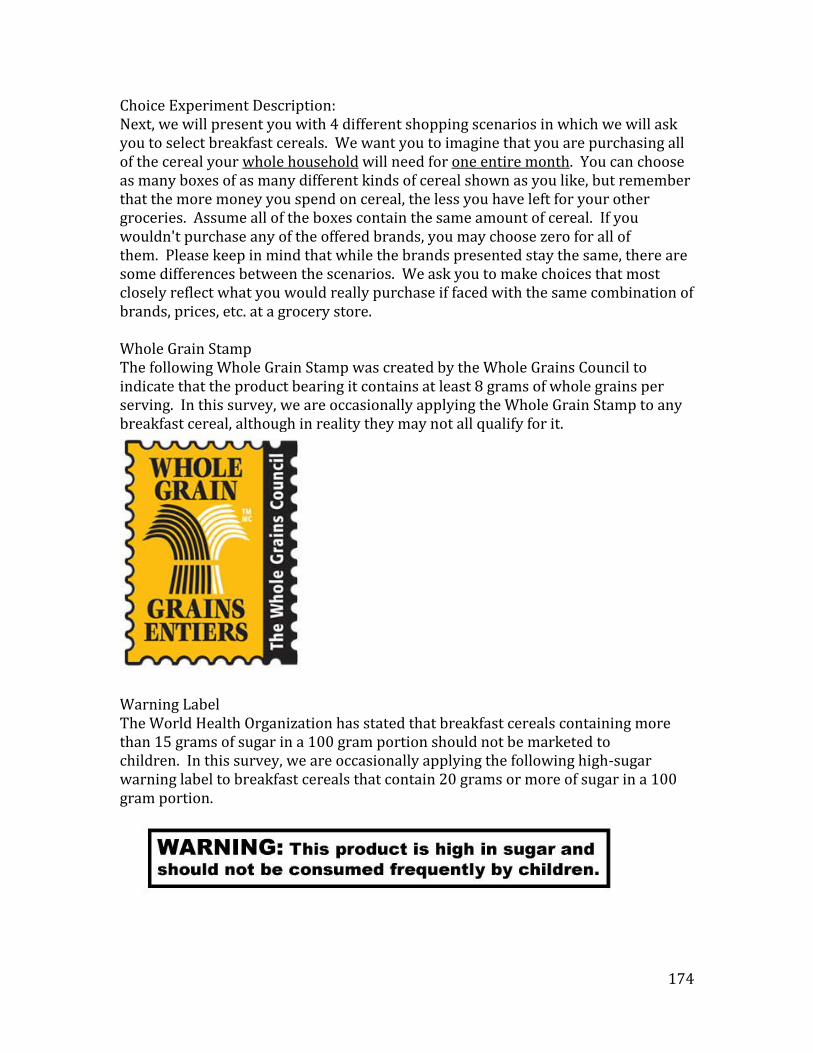
174
Choice Experiment Description: Next, we will present you with 4 different shopping scenarios in which we will ask you to select breakfast cereals. We want you to imagine that you are purchasing all of the cereal your whole household will need for one entire month. You can choose as many boxes of as many different kinds of cereal shown as you like, but remember that the more money you spend on cereal, the less you have left for your other groceries. Assume all of the boxes contain the same amount of cereal. If you wouldn't purchase any of the offered brands, you may choose zero for all of them. Please keep in mind that while the brands presented stay the same, there are some differences between the scenarios. We ask you to make choices that most closely reflect what you would really purchase if faced with the same combination of brands, prices, etc. at a grocery store. Whole Grain Stamp The following Whole Grain Stamp was created by the Whole Grains Council to indicate that the product bearing it contains at least 8 grams of whole grains per serving. In this survey, we are occasionally applying the Whole Grain Stamp to any breakfast cereal, although in reality they may not all qualify for it.
Warning Label The World Health Organization has stated that breakfast cereals containing more than 15 grams of sugar in a 100 gram portion should not be marketed to children. In this survey, we are occasionally applying the following high-sugar warning label to breakfast cereals that contain 20 grams or more of sugar in a 100 gram portion.
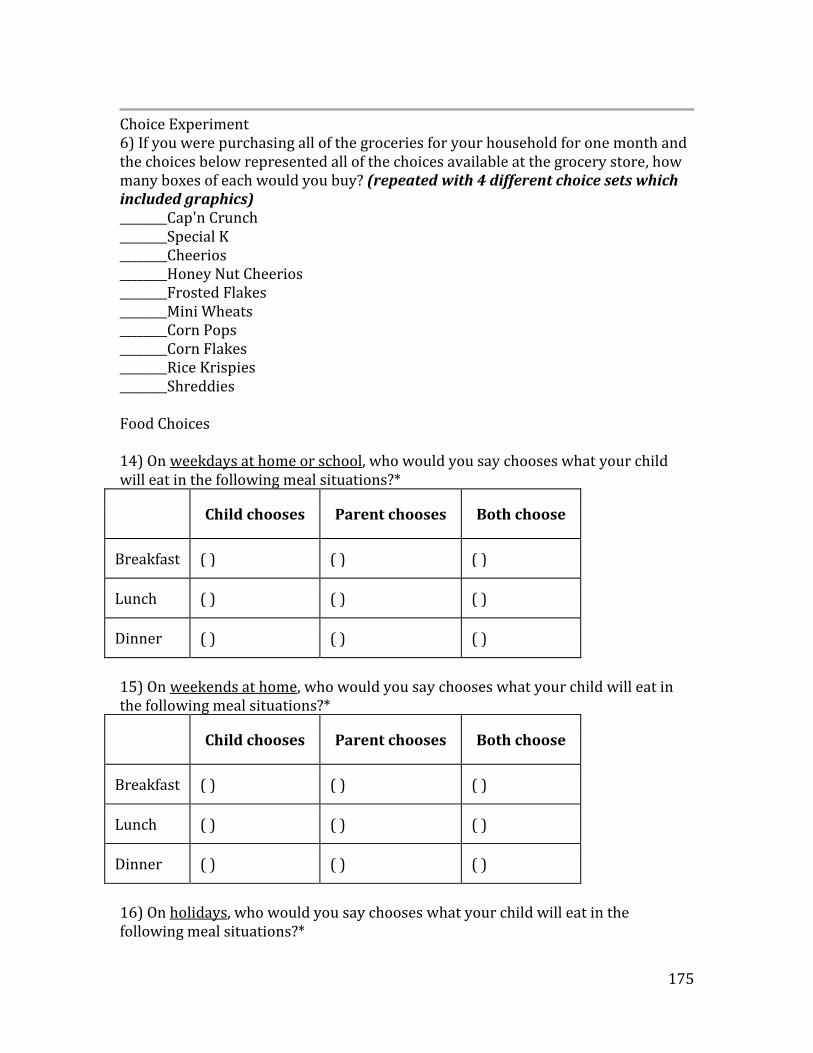
175
Choice Experiment 6) If you were purchasing all of the groceries for your household for one month and the choices below represented all of the choices available at the grocery store, how many boxes of each would you buy? (repeated with 4 different choice sets which included graphics) ________Cap'n Crunch ________Special K ________Cheerios ________Honey Nut Cheerios ________Frosted Flakes ________Mini Wheats ________Corn Pops ________Corn Flakes ________Rice Krispies ________Shreddies Food Choices 14) On weekdays at home or school, who would you say chooses what your child will eat in the following meal situations?*
Child chooses Parent chooses Both choose
Breakfast ( ) ( ) ( )
Lunch ( ) ( ) ( )
Dinner ( ) ( ) ( )
15) On weekends at home, who would you say chooses what your child will eat in the following meal situations?*
Child chooses Parent chooses Both choose
Breakfast ( ) ( ) ( )
Lunch ( ) ( ) ( )
Dinner ( ) ( ) ( )
16) On holidays, who would you say chooses what your child will eat in the following meal situations?*
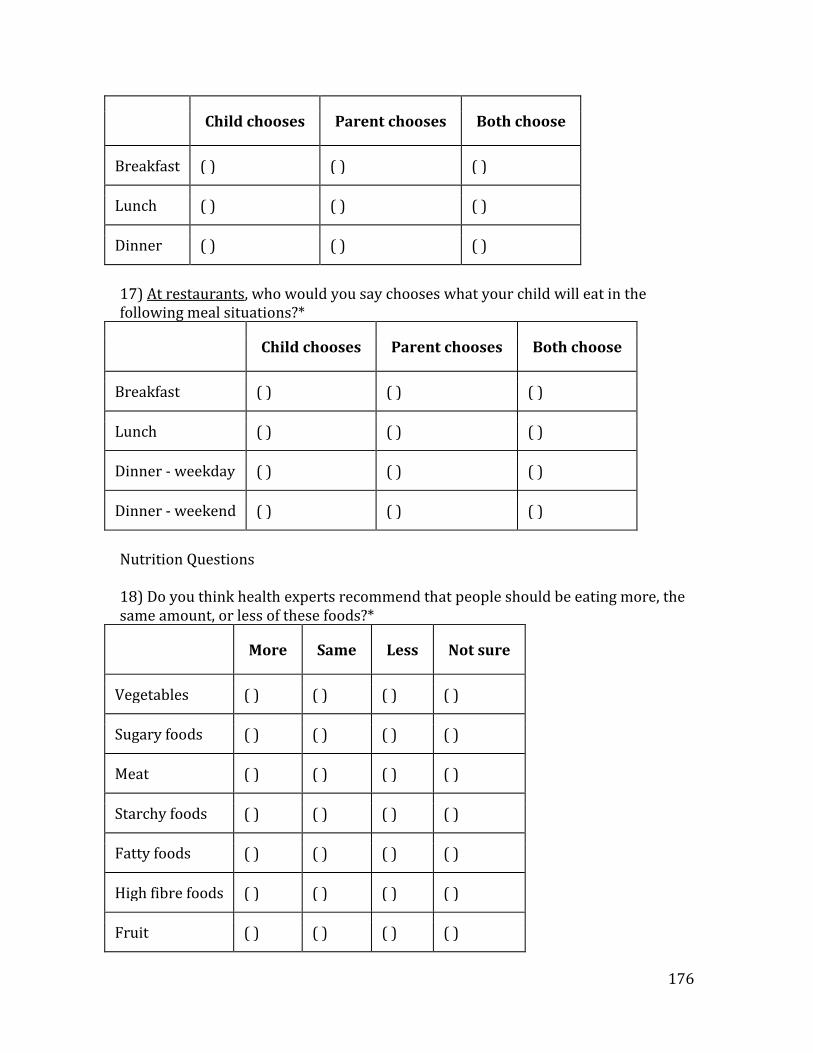
176
Child chooses Parent chooses Both choose
Breakfast ( ) ( ) ( )
Lunch ( ) ( ) ( )
Dinner ( ) ( ) ( )
17) At restaurants, who would you say chooses what your child will eat in the following meal situations?*
Child chooses Parent chooses Both choose
Breakfast ( ) ( ) ( )
Lunch ( ) ( ) ( )
Dinner - weekday ( ) ( ) ( )
Dinner - weekend ( ) ( ) ( )
Nutrition Questions 18) Do you think health experts recommend that people should be eating more, the same amount, or less of these foods?*
More Same Less Not sure
Vegetables ( ) ( ) ( ) ( )
Sugary foods ( ) ( ) ( ) ( )
Meat ( ) ( ) ( ) ( )
Starchy foods ( ) ( ) ( ) ( )
Fatty foods ( ) ( ) ( ) ( )
High fibre foods ( ) ( ) ( ) ( )
Fruit ( ) ( ) ( ) ( )
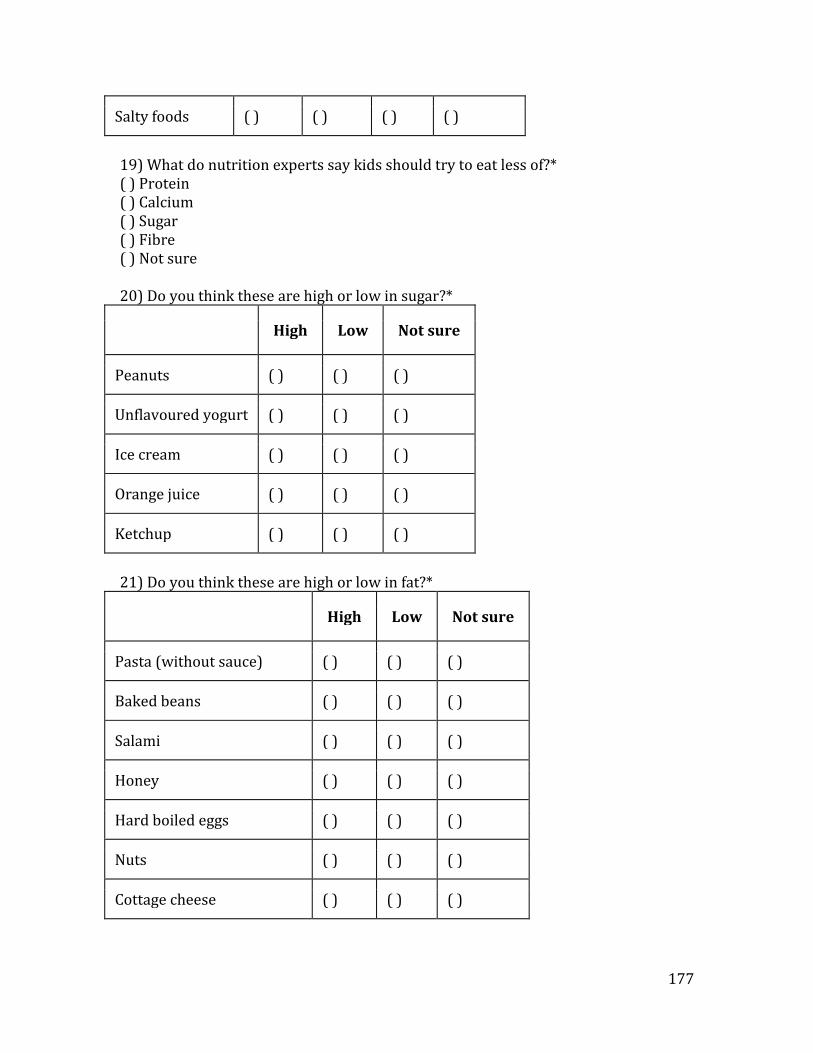
177
Salty foods ( ) ( ) ( ) ( )
19) What do nutrition experts say kids should try to eat less of?* ( ) Protein ( ) Calcium ( ) Sugar ( ) Fibre ( ) Not sure 20) Do you think these are high or low in sugar?*
High Low Not sure
Peanuts ( ) ( ) ( )
Unflavoured yogurt ( ) ( ) ( )
Ice cream ( ) ( ) ( )
Orange juice ( ) ( ) ( )
Ketchup ( ) ( ) ( )
21) Do you think these are high or low in fat?*
High Low Not sure
Pasta (without sauce) ( ) ( ) ( )
Baked beans ( ) ( ) ( )
Salami ( ) ( ) ( )
Honey ( ) ( ) ( )
Hard boiled eggs ( ) ( ) ( )
Nuts ( ) ( ) ( )
Cottage cheese ( ) ( ) ( )
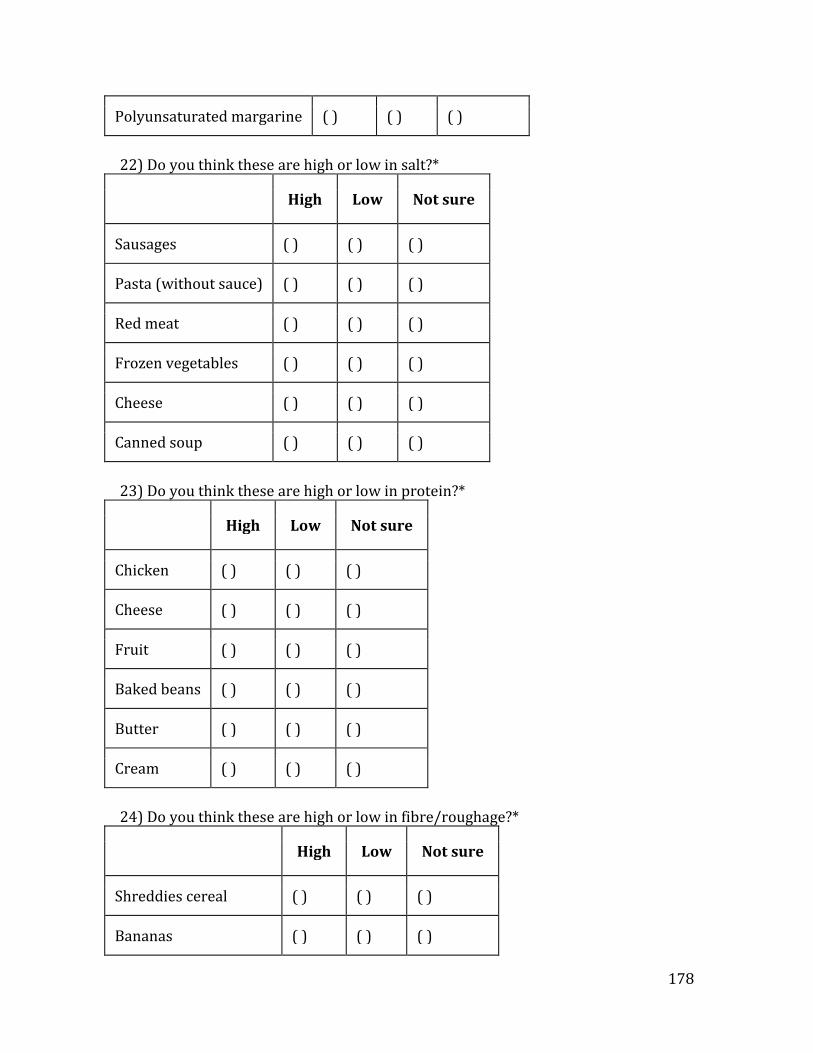
178
Polyunsaturated margarine ( ) ( ) ( )
22) Do you think these are high or low in salt?*
High Low Not sure
Sausages ( ) ( ) ( )
Pasta (without sauce) ( ) ( ) ( )
Red meat ( ) ( ) ( )
Frozen vegetables ( ) ( ) ( )
Cheese ( ) ( ) ( )
Canned soup ( ) ( ) ( )
23) Do you think these are high or low in protein?*
High Low Not sure
Chicken ( ) ( ) ( )
Cheese ( ) ( ) ( )
Fruit ( ) ( ) ( )
Baked beans ( ) ( ) ( )
Butter ( ) ( ) ( )
Cream ( ) ( ) ( )
24) Do you think these are high or low in fibre/roughage?*
High Low Not sure
Shreddies cereal ( ) ( ) ( )
Bananas ( ) ( ) ( )
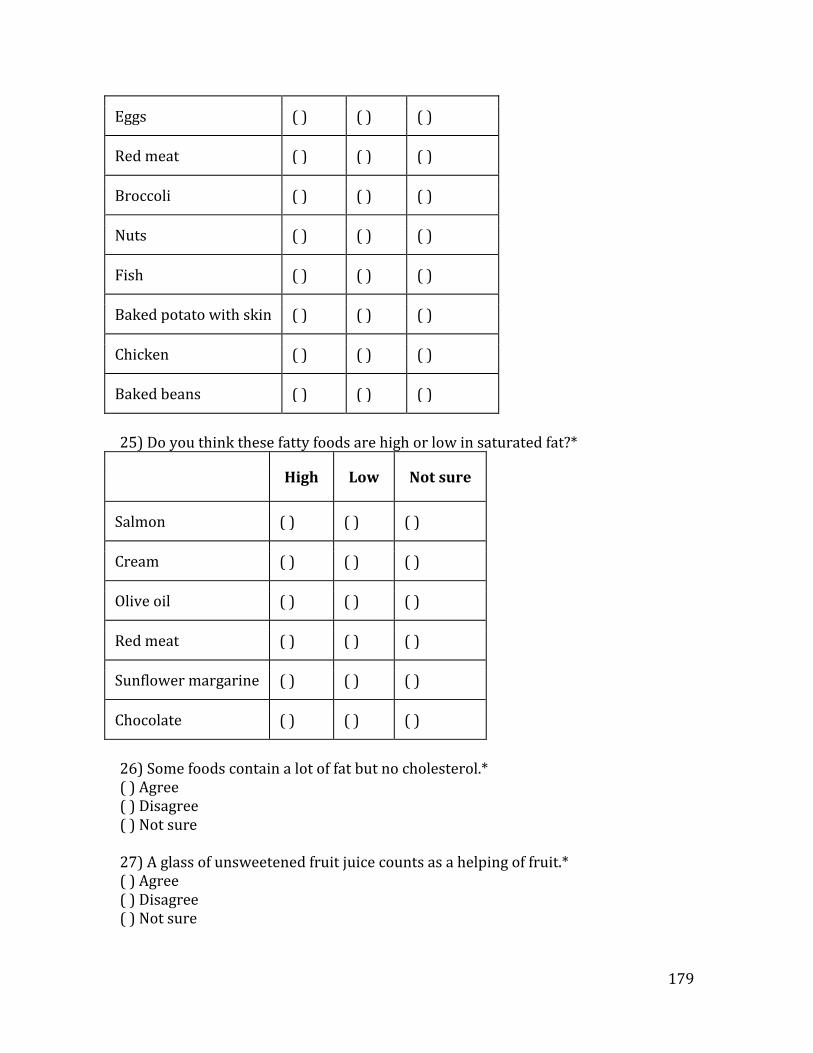
179
Eggs ( ) ( ) ( )
Red meat ( ) ( ) ( )
Broccoli ( ) ( ) ( )
Nuts ( ) ( ) ( )
Fish ( ) ( ) ( )
Baked potato with skin ( ) ( ) ( )
Chicken ( ) ( ) ( )
Baked beans ( ) ( ) ( )
25) Do you think these fatty foods are high or low in saturated fat?*
High Low Not sure
Salmon ( ) ( ) ( )
Cream ( ) ( ) ( )
Olive oil ( ) ( ) ( )
Red meat ( ) ( ) ( )
Sunflower margarine ( ) ( ) ( )
Chocolate ( ) ( ) ( )
26) Some foods contain a lot of fat but no cholesterol.* ( ) Agree ( ) Disagree ( ) Not sure 27) A glass of unsweetened fruit juice counts as a helping of fruit.* ( ) Agree ( ) Disagree ( ) Not sure

180
28) Brown sugar is a healthy alternative to white sugar.* ( ) Agree ( ) Disagree ( ) Not sure 29) There is more protein in a glass of whole milk than in a glass of skimmed milk.* ( ) Agree ( ) Disagree ( ) Not sure 30) A type of oil which contains mostly monounsaturated fat is:* ( ) Coconut oil ( ) Sunflower oil ( ) Olive oil ( ) Palm oil ( ) Not sure 31) Which of the following has the most calories per 100g?* ( ) Sugar ( ) Starchy foods ( ) Fibre ( ) Fat ( ) Protein ( ) Not sure 32) Which of the following issues are related to sugar consumption?* ( ) Obesity ( ) Dental caries (cavities) ( ) Diabetes ( ) All of the above ( ) Not sure General Behaviours 33) How often does your child eat cereal for breakfast?* ( ) Less than once per week ( ) 1 - 3 times per week ( ) 4 - 6 times per week ( ) Every day 34) Does your child participate in any athletic activities? (not including gym class at school)* ( ) Yes ( ) No 35) If yes, how often?*
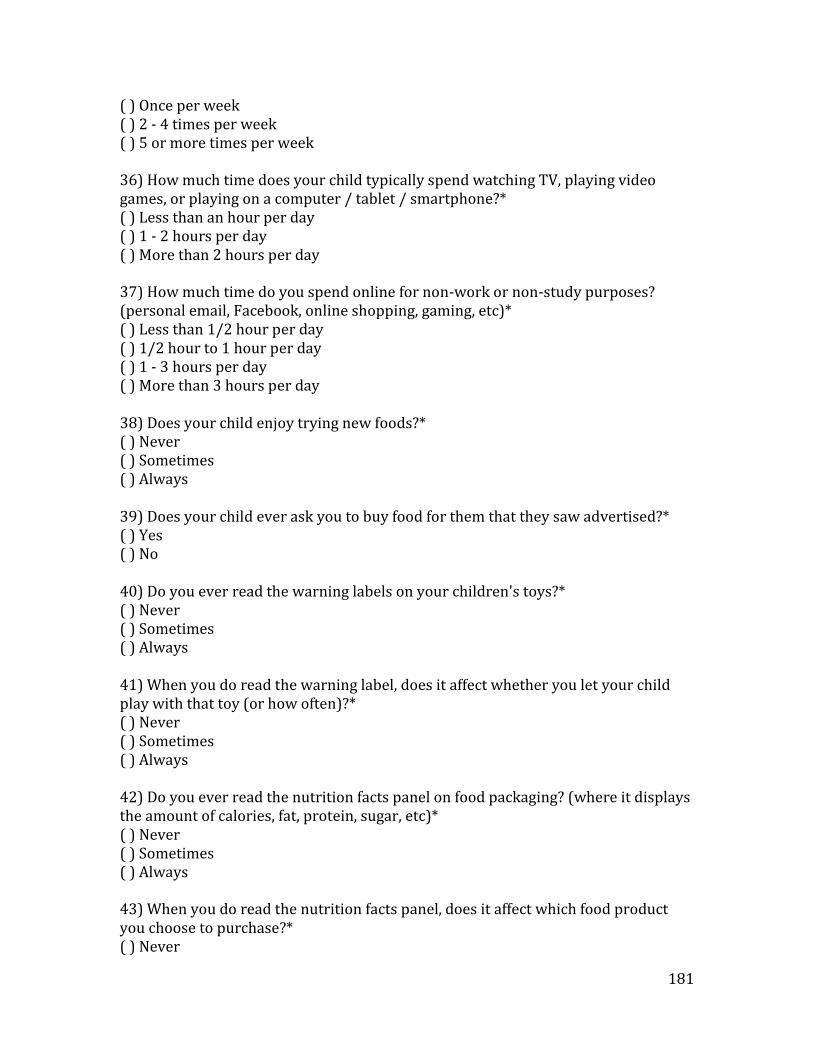
181
( ) Once per week ( ) 2 - 4 times per week ( ) 5 or more times per week
36) How much time does your child typically spend watching TV, playing video games, or playing on a computer / tablet / smartphone?* ( ) Less than an hour per day ( ) 1 - 2 hours per day ( ) More than 2 hours per day
37) How much time do you spend online for non-work or non-study purposes? (personal email, Facebook, online shopping, gaming, etc)* ( ) Less than 1/2 hour per day ( ) 1/2 hour to 1 hour per day ( ) 1 - 3 hours per day ( ) More than 3 hours per day 38) Does your child enjoy trying new foods?* ( ) Never ( ) Sometimes ( ) Always 39) Does your child ever ask you to buy food for them that they saw advertised?* ( ) Yes ( ) No 40) Do you ever read the warning labels on your children's toys?* ( ) Never ( ) Sometimes ( ) Always 41) When you do read the warning label, does it affect whether you let your child play with that toy (or how often)?* ( ) Never ( ) Sometimes ( ) Always 42) Do you ever read the nutrition facts panel on food packaging? (where it displays the amount of calories, fat, protein, sugar, etc)* ( ) Never ( ) Sometimes ( ) Always
43) When you do read the nutrition facts panel, does it affect which food product you choose to purchase?* ( ) Never

182
( ) Sometimes ( ) Always Grocery Shopping
44) How often do you go grocery shopping?* ( ) 1-3 times per month ( ) 1-2 times per week ( ) 3-4 times per week ( ) 5 times or more per week
45) How long would you say a typical trip to the grocery store lasts for you?* ( ) Less than 15 minutes ( ) 15 - 30 minutes ( ) 30 - 60 minutes ( ) More than 60 minutes
46) How rushed (in a hurry) do you feel when grocery shopping?* ( ) Not at all rushed ( ) Somewhat rushed ( ) Very rushed 47) Does your child ever participate in making food choices at the grocery store?* ( ) Yes ( ) No 48) If yes, which of the following types of foods does your child choose? (check all that apply)* [ ] Fruit (like apples, bananas, or grapes) [ ] Snacks (like crackers, granola bars, chips) [ ] Treats (like cookies, candy, or ice cream) [ ] Drinks (like juice, milk, or pop) [ ] Vegetables (like carrots, broccoli, or celery) [ ] Breakfast cereal [ ] Yogurt 49) According to Statistics Canada, the average household in 2014 spent $8,109 on groceries ($675.75 per month or $155.94 per week). Would you say that your household spends* ( ) More ( ) Less ( ) About the same

183
Allowance 50) Do you give your child an allowance?* ( ) Yes ( ) No 51) If yes, how much do you give them per week?* _________________________________________________ Child's food purchases 52) Does your child ever purchase food when they are not with a parent/guardian?* ( ) Yes ( ) No 53) If yes, what foods does your child typically purchase when not with a parent/guardian?* [ ] Fruit [ ] Chips / Cheesies / Pretzels [ ] Popcorn [ ] Chocolate [ ] Cookies [ ] Candy [ ] Pop / Sports drinks [ ] Ice cream [ ] Vegetables [ ] Cereal [ ] Yogurt [ ] Cheese [ ] Pizza [ ] Pasta [ ] Fries [ ] Hamburgers [ ] Chicken fingers / nuggets [ ] White milk [ ] Juice [ ] Flavoured milk (chocolate, strawberry, etc) Usual Breakfast Cereals 54) What kind of cereal(s) do the kids in your household usually eat? (check all that apply)* [ ] Cheerios [ ] Honey Nut Cheerios [ ] Other Cheerios (frosted, chocolate, multigrain, etc) [ ] Rice Krispies
184
[ ] Corn Flakes [ ] Mini Wheats - Frosted [ ] Other Mini Wheats (strawberry, cinnamon, etc) [ ] Froot Loops [ ] Frosted Flakes [ ] Corn Pops [ ] Lucky Charms [ ] Cap'n Crunch [ ] Honeycomb [ ] Nature's Path Organic (any variety) [ ] Raisin Bran [ ] Shreddies [ ] Special K Original [ ] Other Special K (vanilla almond, red berries, etc) [ ] Vector [ ] Alpha Bits [ ] All Bran [ ] None of these 55) What kind of cereal(s) do the adults in your household usually eat? (check all that apply)* [ ] Cheerios [ ] Honey Nut Cheerios [ ] Other Cheerios (frosted, chocolate, multigrain, etc) [ ] Rice Krispies [ ] Corn Flakes [ ] Mini Wheats - Frosted [ ] Other Mini Wheats (strawberry, cinnamon, etc) [ ] Froot Loops [ ] Frosted Flakes [ ] Corn Pops [ ] Lucky Charms [ ] Cap'n Crunch [ ] Honeycomb [ ] Nature's Path Organic (any variety) [ ] Raisin Bran [ ] Shreddies [ ] Special K Original [ ] Other Special K (vanilla almond, red berries, etc) [ ] Vector [ ] Alpha Bits [ ] All Bran [ ] None of these

185
56) In a typical month, how many of each of the following cereals would you buy for your household?*
0 1 2 3 4+
Cheerios
Honey Nut Cheerios
Other Cheerios (frosted, chocolate, multigrain, etc)
Rice Krispies
Corn Flakes
Frosted Mini Wheats
Other Mini Wheats (strawberry, cinnamon, etc)
Froot Loops
Frosted Flakes
Corn Pops
Lucky Charms
Cap'n Crunch
Honeycomb
Nature's Path Organic (any variety)
Raisin Bran
Shreddies
Special K Original
Other Special K (vanilla almond, red berries, etc)
Vector

186
Alpha Bits
All Bran
Respondent Characteristics 57) What is the highest level of education you've completed?* ( ) Elementary school ( ) Secondary (high) school ( ) Technical / college diploma ( ) University degree ( ) Post graduate degree 58) What is the approximate range of your total annual household income?* ( ) $24,999 or under ( ) Between $25,000 and $39,999 ( ) Between $40,000 and $59,999 ( ) Between $60,000 and $79,999 ( ) Between $80,000 and $99,999 ( ) Between $100,000 and $149,999 ( ) $150,000 or more 59) Were you born in Canada?* ( ) Yes ( ) No 60) Were your parents born in Canada?* ( ) Neither ( ) One ( ) Both Follow Up 61) Please rank how important the following factors were in choosing which cereals to purchase in this survey.* ________Price ________Brand ________Warning Label ________Whole Grain Stamp 62) Did you notice the Whole Grain Stamp that sometimes appeared on the breakfast cereals?* ( ) Yes ( ) No

187
63) Did the Whole Grain Stamp ever affect your choice?* ( ) Yes ( ) No 64) Did you notice the warning label that sometimes appeared on the breakfast cereals?* ( ) Yes ( ) No 65) Did the warning label ever affect your choice?* ( ) Yes ( ) No 66) Do you believe that your answers in this survey will have any affect on whether or not the government decides to implement warning labels on high sugar foods?* ( ) No ( ) Maybe ( ) Probably ( ) Yes Thank You! Thank you for taking our survey. Your response is very important to us.

188
Appendix 3B – Children’s Questionnaire 1. Do you get an allowance?
☐ Yes
☐ No
2. If yes, how much do you get per week? _______________ 3. Do you ever buy food when you’re not with your parents?
☐ Yes
☐ No 4. If yes, which of the following do you typically buy when you’re not with a
parent? (check all that apply) ☐ fruit
☐ chips/cheesies/ pretzels
☐ popcorn
☐ chocolate
☐ cookies
☐ candy
☐ pop/sports drinks
☐ ice cream
☐ vegetables
☐ cereal
☐ yogurt
☐ cheese
☐ pizza
☐ pasta
☐ fries
☐ hamburgers
☐ chicken fingers/nuggets
☐ white milk
☐ juice
☐ flavoured milk (like chocolate or strawberry milk) 5. Do you ever help choose what foods to buy at the grocery store?
☐ Yes
☐ No
6. If yes, which of the following foods do you typically choose? ☐ fruit (like apples, bananas, grapes)
☐ snacks (like crackers, granola bars, or chips)

189
☐ treats (like cookies, candy, or ice cream)
☐ drinks (like juice, milk, or pop)
☐ vegetables (like carrots, broccoli, celery)
☐ breakfast cereal
☐ yogurt 7. What kind of breakfast cereal(s) do you usually eat?
8. How often do you eat cereal for breakfast?
☐ Less than once per week
☐ 1-3 times per week
☐ 4-6 times per week
☐ 7 or more times per week 9. Have you learned about nutrition or healthy eating at school?
☐ Yes
☐ No
☐ Not sure 10. Do you participate in any sports (other than gym class at school)?
☐ Yes
☐ No 11. If yes, how often?
☐ Once per week
☐ 2-4 times per week
☐ 5 or more times per week 12. How much time do you usually spend watching TV, playing video games, or
on a computer, tablet, or smartphone? ☐ Less than an hour per day
☐ 1-2 hours per day
☐ more than 2 hours per day

190
13. Do you enjoy trying new foods?
☐ Never
☐ Sometimes
☐ Always 14. How often do you see commercials for food? (this could include on TV, on the
computer, in magazines, or other places) ☐ Never
☐ 1-3 times per month
☐ 1-3 times per week
☐ 4-6 times per week
☐ every day
15. How often do you see commercials for cereal? (this could include on TV, on the computer, in magazines, or other places)
☐ Never
☐ 1-3 times per month
☐ 1-3 times per week
☐ 4-6 times per week
☐ every day 16. When you see commercials for food, does it make you want to try that food?
☐ Never
☐ Sometimes
☐ Always 17. Do you ever read the nutrition facts panel on food packaging? (where it says
how many grams of protein, sugar, and other stuff is in the food) ☐ Never
☐ Sometimes
☐ Always 18. If you do, does it affect what food you choose?
☐ Never
☐ Sometimes
☐ Always 19. If you do, what nutrients do you look for information on? (check all that
apply) ☐ Protein

191
☐ Fat
☐ Calcium
☐ Sugar
☐ Iron
☐ Fibre
☐ Vitamins
☐ Calories
20. Have you ever noticed a warning label on any of your toys? ☐ Yes
☐ No 21. If yes, does it affect how (or if) you play with that toy?
☐ Yes
☐ No 22. How old are you? _______________________
23. Are you a
☐ boy
☐ girl 24. How many grown-ups live in your house? _____________________
25. How many kids live in your house? ______________________ Next, we would like to ask you some questions about food and nutrition. 26. To which of the following food groups does an apple belong? a. vegetables and fruit b. grain products c. milk and alternatives d. meat and alternatives 27. To which of the following food groups does yogurt belong? a. vegetables and fruit b. grain products c. milk and alternatives d. meat and alternatives 28. To which of the following food groups do eggs belong? a. vegetables and fruit b. grain products c. milk and alternatives

192
d. meat and alternatives 29. To which of the following food groups does breakfast cereal belong? a. vegetables and fruit b. grain products c. milk and alternatives d. meat and alternatives
30. Which nutrient is important in building strong muscles? a. carbohydrates b. iron c. protein d. calcium 31. Which nutrient is important for healthy bones? a. carbohydrates b. iron c. protein d. calcium 32. What do nutrition experts say kids should try to eat less of? a. Protein b. Calcium c. Sugar d. Fibre e. Not sure 33. Which of the following do you think would be the healthiest snack? a. a chocolate bar and milk b. a granola bar and juice box c. pretzels and raisins d. apple slices and yogurt 34. Can a person eat enough protein to be healthy without eating meat? a. yes b. no 35. If you were given the following choices for lunch at a restaurant, which do
you think would be the healthiest? a. a hamburger (or veggie burger) with carrot sticks and milk b. a hamburger (or veggie burger) with French fries and milk c. a hamburger (or veggie burger) with carrot sticks and pop d. a hamburger (or veggie burger) with French fries and pop 36. Do you think these foods are high or low in sugar? Peanuts ☐High ☐Low ☐Not sure
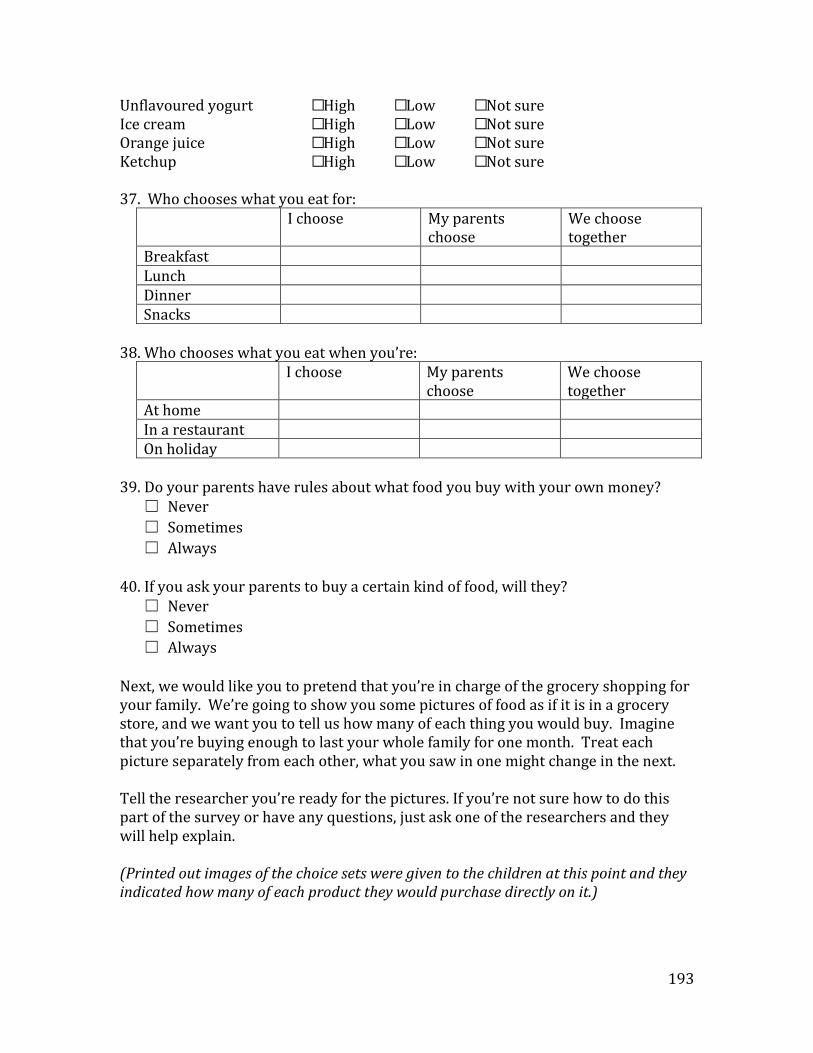
193
Unflavoured yogurt ☐High ☐Low ☐Not sure Ice cream ☐High ☐Low ☐Not sure Orange juice ☐High ☐Low ☐Not sure Ketchup ☐High ☐Low ☐Not sure 37. Who chooses what you eat for:
I choose My parents choose
We choose together
Breakfast Lunch Dinner Snacks
38. Who chooses what you eat when you’re: I choose My parents
choose We choose together
At home In a restaurant On holiday
39. Do your parents have rules about what food you buy with your own money? ☐ Never
☐ Sometimes
☐ Always
40. If you ask your parents to buy a certain kind of food, will they? ☐ Never
☐ Sometimes
☐ Always
Next, we would like you to pretend that you’re in charge of the grocery shopping for your family. We’re going to show you some pictures of food as if it is in a grocery store, and we want you to tell us how many of each thing you would buy. Imagine that you’re buying enough to last your whole family for one month. Treat each picture separately from each other, what you saw in one might change in the next. Tell the researcher you’re ready for the pictures. If you’re not sure how to do this part of the survey or have any questions, just ask one of the researchers and they will help explain. (Printed out images of the choice sets were given to the children at this point and they indicated how many of each product they would purchase directly on it.)
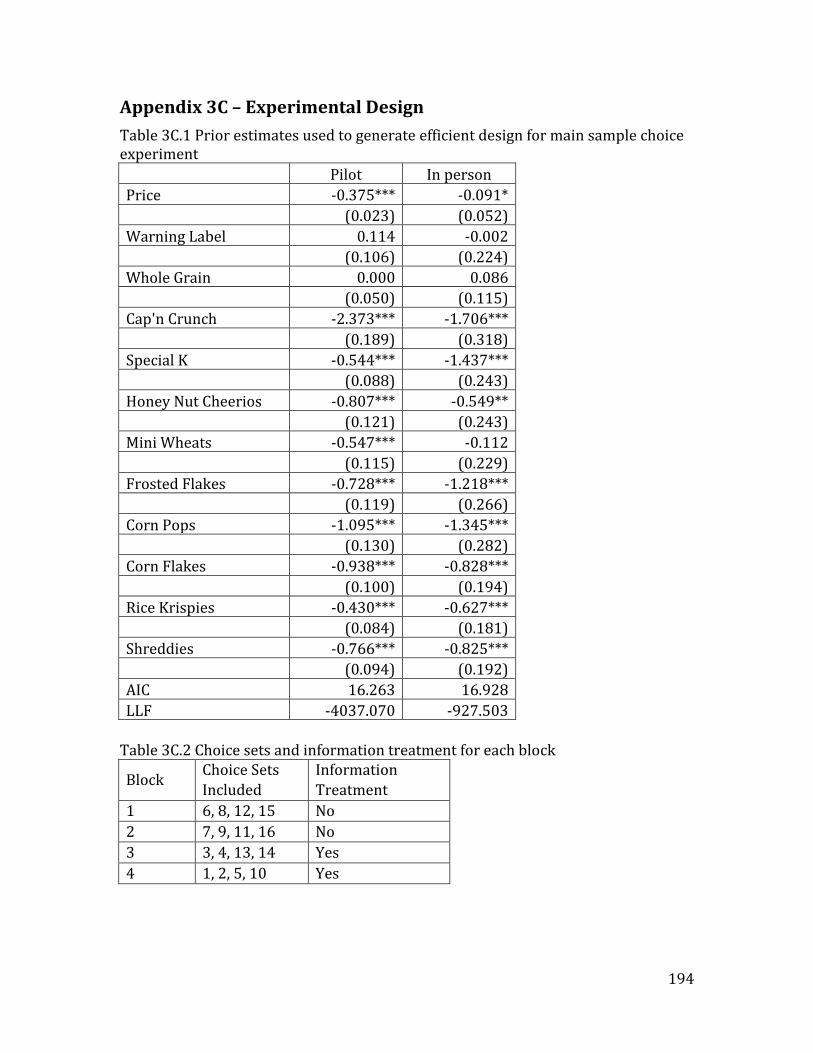
194
Appendix 3C – Experimental Design
Table 3C.1 Prior estimates used to generate efficient design for main sample choice experiment
Pilot In person
Price -0.375*** -0.091*
(0.023) (0.052)
Warning Label 0.114 -0.002
(0.106) (0.224)
Whole Grain 0.000 0.086
(0.050) (0.115)
Cap'n Crunch -2.373*** -1.706***
(0.189) (0.318)
Special K -0.544*** -1.437***
(0.088) (0.243)
Honey Nut Cheerios -0.807*** -0.549**
(0.121) (0.243)
Mini Wheats -0.547*** -0.112
(0.115) (0.229)
Frosted Flakes -0.728*** -1.218***
(0.119) (0.266)
Corn Pops -1.095*** -1.345***
(0.130) (0.282)
Corn Flakes -0.938*** -0.828***
(0.100) (0.194)
Rice Krispies -0.430*** -0.627***
(0.084) (0.181)
Shreddies -0.766*** -0.825***
(0.094) (0.192)
AIC 16.263 16.928
LLF -4037.070 -927.503
Table 3C.2 Choice sets and information treatment for each block
Block Choice Sets
Included
Information
Treatment
1 6, 8, 12, 15 No
2 7, 9, 11, 16 No
3 3, 4, 13, 14 Yes
4 1, 2, 5, 10 Yes
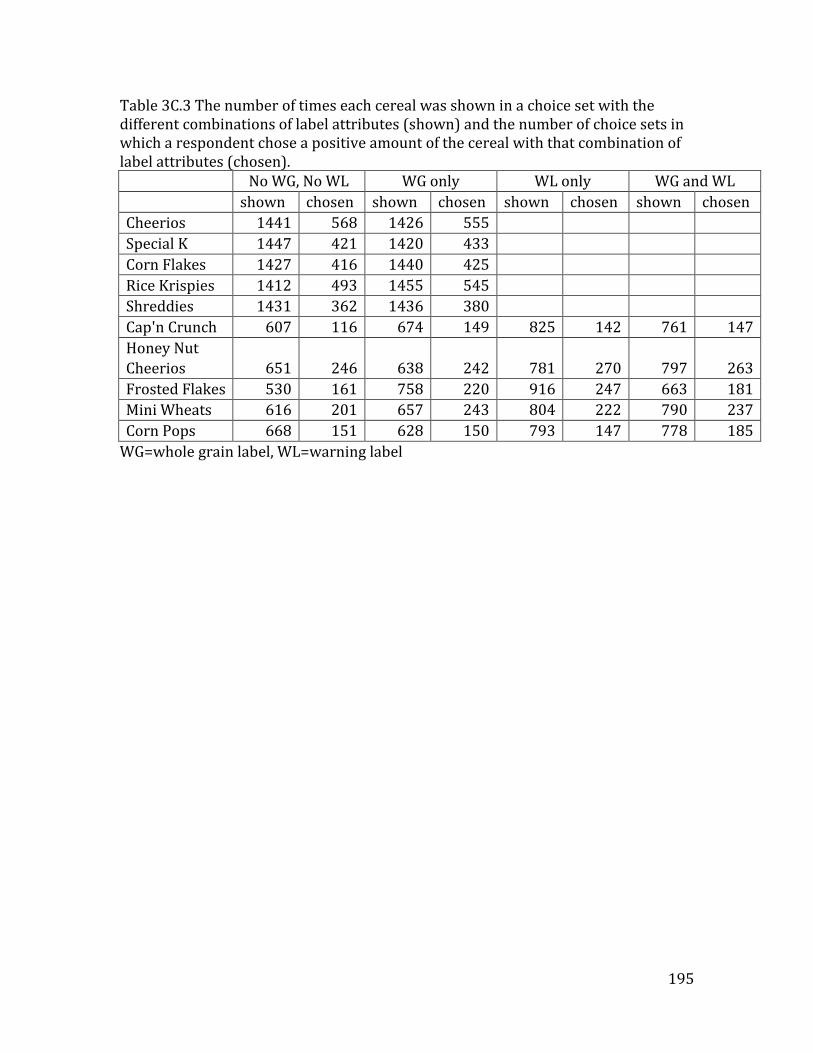
195
Table 3C.3 The number of times each cereal was shown in a choice set with the different combinations of label attributes (shown) and the number of choice sets in which a respondent chose a positive amount of the cereal with that combination of label attributes (chosen).
No WG, No WL WG only WL only WG and WL
shown chosen shown chosen shown chosen shown chosen
Cheerios 1441 568 1426 555
Special K 1447 421 1420 433
Corn Flakes 1427 416 1440 425
Rice Krispies 1412 493 1455 545
Shreddies 1431 362 1436 380
Cap'n Crunch 607 116 674 149 825 142 761 147
Honey Nut
Cheerios 651 246 638 242 781 270 797 263
Frosted Flakes 530 161 758 220 916 247 663 181
Mini Wheats 616 201 657 243 804 222 790 237
Corn Pops 668 151 628 150 793 147 778 185
WG=whole grain label, WL=warning label
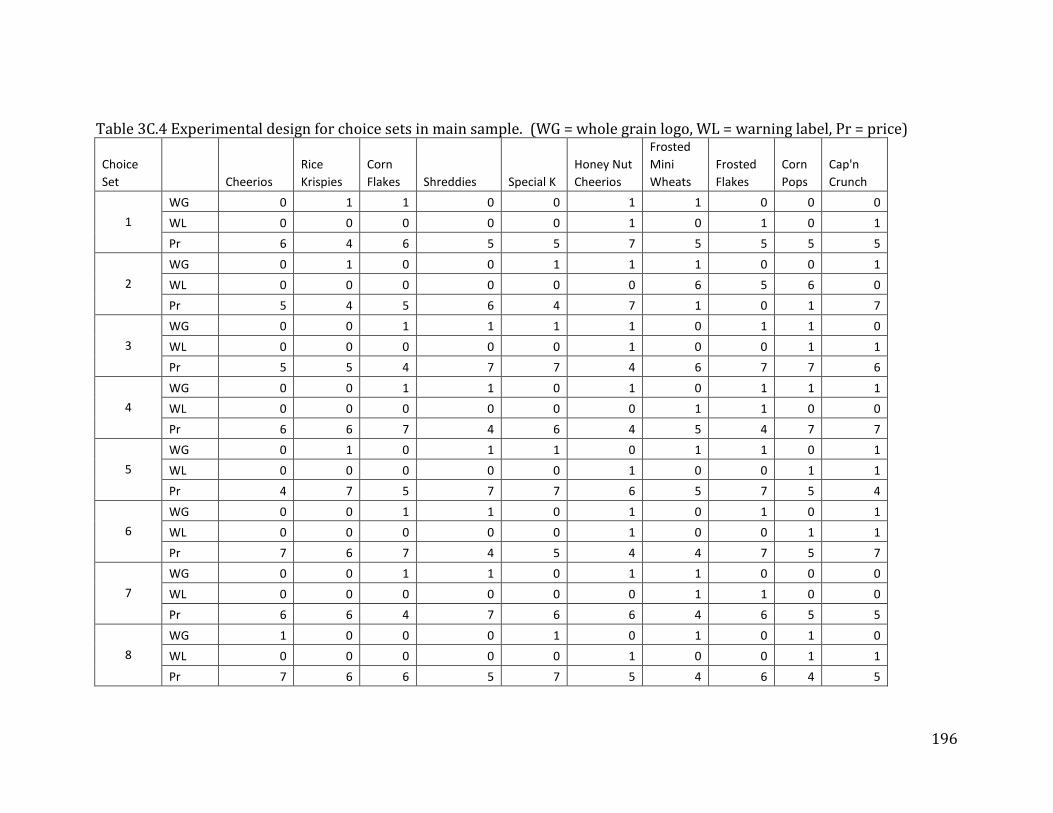
196
Table 3C.4 Experimental design for choice sets in main sample. (WG = whole grain logo, WL = warning label, Pr = price)
Choice
Set
Cheerios
Rice
Krispies
Corn
Flakes Shreddies Special K
Honey Nut
Cheerios
Frosted
Mini
Wheats
Frosted
Flakes
Corn
Pops
Cap'n
Crunch
1
WG 0 1 1 0 0 1 1 0 0 0
WL 0 0 0 0 0 1 0 1 0 1
Pr 6 4 6 5 5 7 5 5 5 5
2
WG 0 1 0 0 1 1 1 0 0 1
WL 0 0 0 0 0 0 6 5 6 0
Pr 5 4 5 6 4 7 1 0 1 7
3
WG 0 0 1 1 1 1 0 1 1 0
WL 0 0 0 0 0 1 0 0 1 1
Pr 5 5 4 7 7 4 6 7 7 6
4
WG 0 0 1 1 0 1 0 1 1 1
WL 0 0 0 0 0 0 1 1 0 0
Pr 6 6 7 4 6 4 5 4 7 7
5
WG 0 1 0 1 1 0 1 1 0 1
WL 0 0 0 0 0 1 0 0 1 1
Pr 4 7 5 7 7 6 5 7 5 4
6
WG 0 0 1 1 0 1 0 1 0 1
WL 0 0 0 0 0 1 0 0 1 1
Pr 7 6 7 4 5 4 4 7 5 7
7
WG 0 0 1 1 0 1 1 0 0 0
WL 0 0 0 0 0 0 1 1 0 0
Pr 6 6 4 7 6 6 4 6 5 5
8
WG 1 0 0 0 1 0 1 0 1 0
WL 0 0 0 0 0 1 0 0 1 1
Pr 7 6 6 5 7 5 4 6 4 5
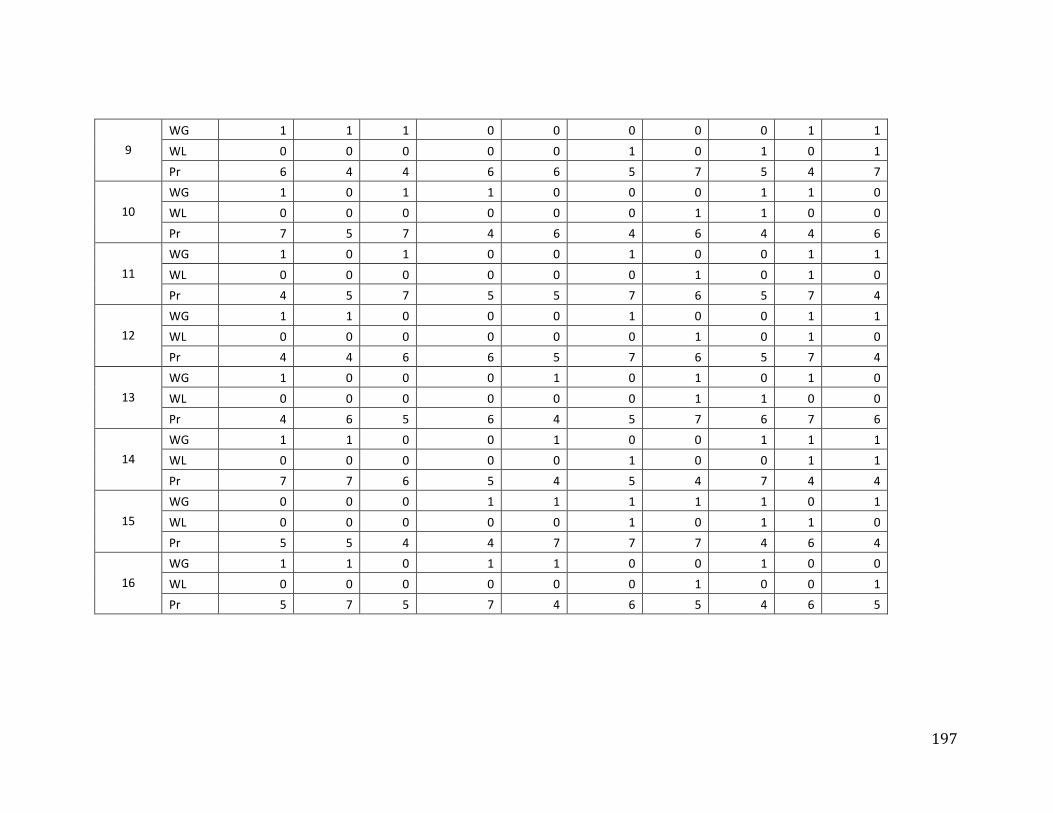
197
9
WG 1 1 1 0 0 0 0 0 1 1
WL 0 0 0 0 0 1 0 1 0 1
Pr 6 4 4 6 6 5 7 5 4 7
10
WG 1 0 1 1 0 0 0 1 1 0
WL 0 0 0 0 0 0 1 1 0 0
Pr 7 5 7 4 6 4 6 4 4 6
11
WG 1 0 1 0 0 1 0 0 1 1
WL 0 0 0 0 0 0 1 0 1 0
Pr 4 5 7 5 5 7 6 5 7 4
12
WG 1 1 0 0 0 1 0 0 1 1
WL 0 0 0 0 0 0 1 0 1 0
Pr 4 4 6 6 5 7 6 5 7 4
13
WG 1 0 0 0 1 0 1 0 1 0
WL 0 0 0 0 0 0 1 1 0 0
Pr 4 6 5 6 4 5 7 6 7 6
14
WG 1 1 0 0 1 0 0 1 1 1
WL 0 0 0 0 0 1 0 0 1 1
Pr 7 7 6 5 4 5 4 7 4 4
15
WG 0 0 0 1 1 1 1 1 0 1
WL 0 0 0 0 0 1 0 1 1 0
Pr 5 5 4 4 7 7 7 4 6 4
16
WG 1 1 0 1 1 0 0 1 0 0
WL 0 0 0 0 0 0 1 0 0 1
Pr 5 7 5 7 4 6 5 4 6 5
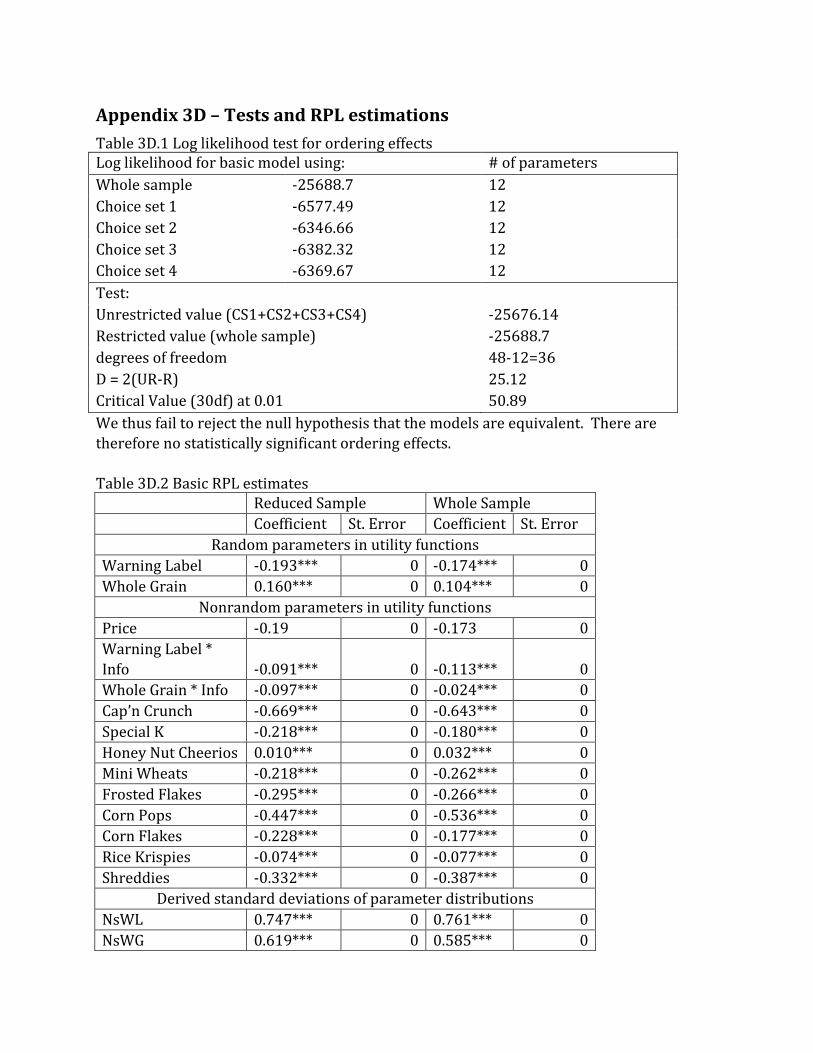
Appendix 3D – Tests and RPL estimations
Table 3D.1 Log likelihood test for ordering effects Log likelihood for basic model using: # of parameters
Whole sample -25688.7 12
Choice set 1 -6577.49 12
Choice set 2 -6346.66 12
Choice set 3 -6382.32 12
Choice set 4 -6369.67 12
Test:
Unrestricted value (CS1+CS2+CS3+CS4) -25676.14
Restricted value (whole sample) -25688.7
degrees of freedom 48-12=36
D = 2(UR-R) 25.12
Critical Value (30df) at 0.01 50.89
We thus fail to reject the null hypothesis that the models are equivalent. There are
therefore no statistically significant ordering effects.
Table 3D.2 Basic RPL estimates
Reduced Sample Whole Sample
Coefficient St. Error Coefficient St. Error
Random parameters in utility functions
Warning Label -0.193*** 0 -0.174*** 0
Whole Grain 0.160*** 0 0.104*** 0
Nonrandom parameters in utility functions
Price -0.19 0 -0.173 0
Warning Label *
Info -0.091*** 0 -0.113*** 0
Whole Grain * Info -0.097*** 0 -0.024*** 0
Cap’n Crunch -0.669*** 0 -0.643*** 0
Special K -0.218*** 0 -0.180*** 0
Honey Nut Cheerios 0.010*** 0 0.032*** 0
Mini Wheats -0.218*** 0 -0.262*** 0
Frosted Flakes -0.295*** 0 -0.266*** 0
Corn Pops -0.447*** 0 -0.536*** 0
Corn Flakes -0.228*** 0 -0.177*** 0
Rice Krispies -0.074*** 0 -0.077*** 0
Shreddies -0.332*** 0 -0.387*** 0
Derived standard deviations of parameter distributions
NsWL 0.747*** 0 0.761*** 0
NsWG 0.619*** 0 0.585*** 0
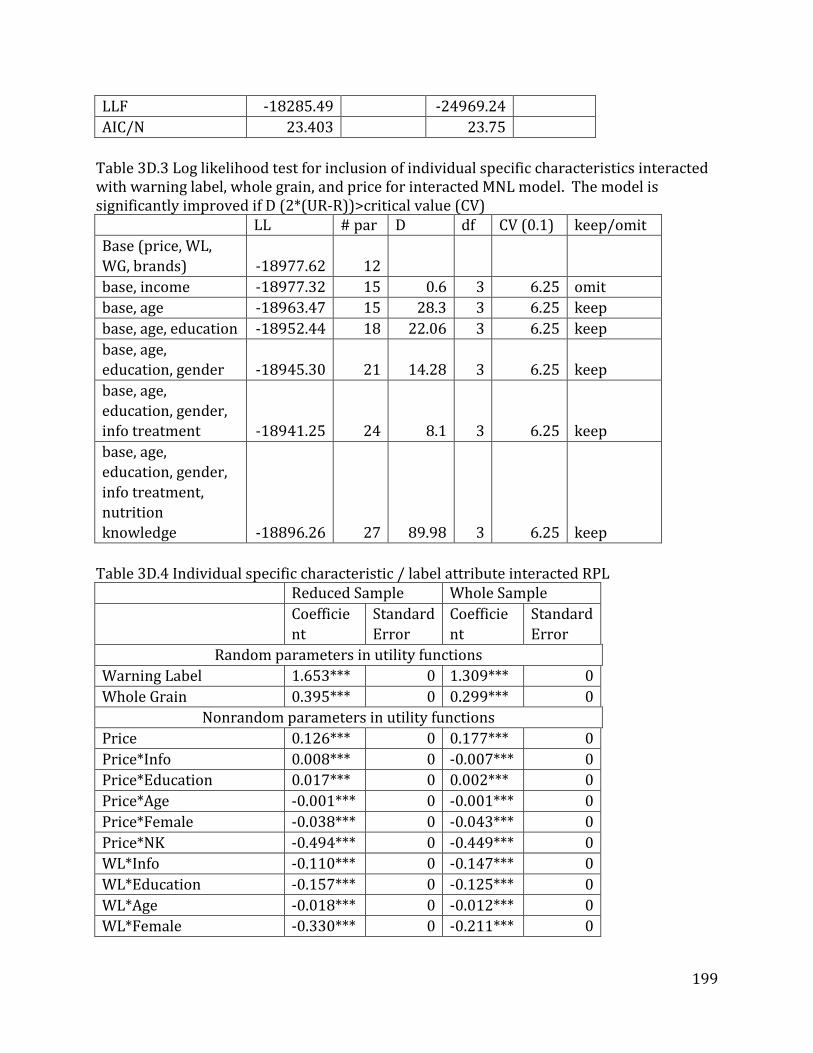
199
LLF -18285.49
-24969.24
AIC/N 23.403
23.75
Table 3D.3 Log likelihood test for inclusion of individual specific characteristics interacted with warning label, whole grain, and price for interacted MNL model. The model is significantly improved if D (2*(UR-R))>critical value (CV)
LL # par D df CV (0.1) keep/omit
Base (price, WL,
WG, brands) -18977.62 12
base, income -18977.32 15 0.6 3 6.25 omit
base, age -18963.47 15 28.3 3 6.25 keep
base, age, education -18952.44 18 22.06 3 6.25 keep
base, age,
education, gender -18945.30 21 14.28 3 6.25 keep
base, age,
education, gender,
info treatment -18941.25 24 8.1 3 6.25 keep
base, age,
education, gender,
info treatment,
nutrition
knowledge -18896.26 27 89.98 3 6.25 keep
Table 3D.4 Individual specific characteristic / label attribute interacted RPL
Reduced Sample Whole Sample
Coefficie
nt
Standard
Error
Coefficie
nt
Standard
Error
Random parameters in utility functions
Warning Label 1.653*** 0 1.309*** 0
Whole Grain 0.395*** 0 0.299*** 0
Nonrandom parameters in utility functions
Price 0.126*** 0 0.177*** 0
Price*Info 0.008*** 0 -0.007*** 0
Price*Education 0.017*** 0 0.002*** 0
Price*Age -0.001*** 0 -0.001*** 0
Price*Female -0.038*** 0 -0.043*** 0
Price*NK -0.494*** 0 -0.449*** 0
WL*Info -0.110*** 0 -0.147*** 0
WL*Education -0.157*** 0 -0.125*** 0
WL*Age -0.018*** 0 -0.012*** 0
WL*Female -0.330*** 0 -0.211*** 0
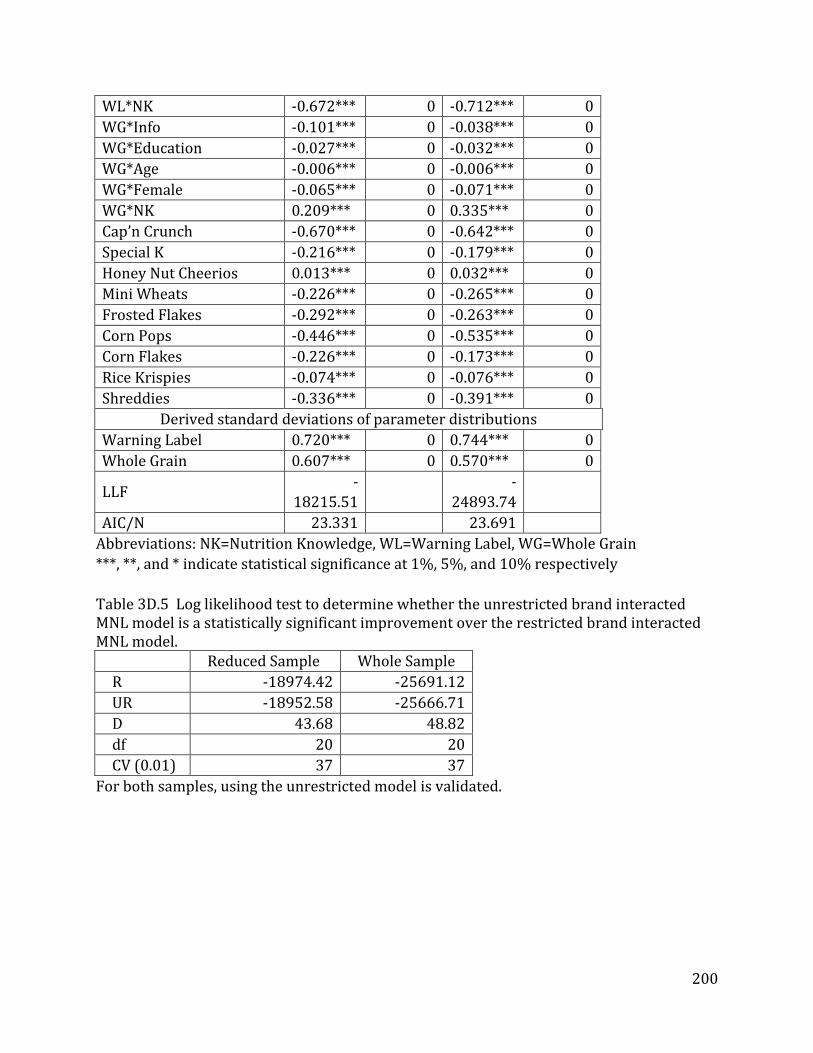
200
WL*NK -0.672*** 0 -0.712*** 0
WG*Info -0.101*** 0 -0.038*** 0
WG*Education -0.027*** 0 -0.032*** 0
WG*Age -0.006*** 0 -0.006*** 0
WG*Female -0.065*** 0 -0.071*** 0
WG*NK 0.209*** 0 0.335*** 0
Cap’n Crunch -0.670*** 0 -0.642*** 0
Special K -0.216*** 0 -0.179*** 0
Honey Nut Cheerios 0.013*** 0 0.032*** 0
Mini Wheats -0.226*** 0 -0.265*** 0
Frosted Flakes -0.292*** 0 -0.263*** 0
Corn Pops -0.446*** 0 -0.535*** 0
Corn Flakes -0.226*** 0 -0.173*** 0
Rice Krispies -0.074*** 0 -0.076*** 0
Shreddies -0.336*** 0 -0.391*** 0
Derived standard deviations of parameter distributions
Warning Label 0.720*** 0 0.744*** 0
Whole Grain 0.607*** 0 0.570*** 0
LLF -
18215.51
-
24893.74
AIC/N 23.331
23.691
Abbreviations: NK=Nutrition Knowledge, WL=Warning Label, WG=Whole Grain
***, **, and * indicate statistical significance at 1%, 5%, and 10% respectively
Table 3D.5 Log likelihood test to determine whether the unrestricted brand interacted MNL model is a statistically significant improvement over the restricted brand interacted MNL model.
Reduced Sample Whole Sample
R -18974.42 -25691.12
UR -18952.58 -25666.71
D 43.68 48.82
df 20 20
CV (0.01) 37 37
For both samples, using the unrestricted model is validated.
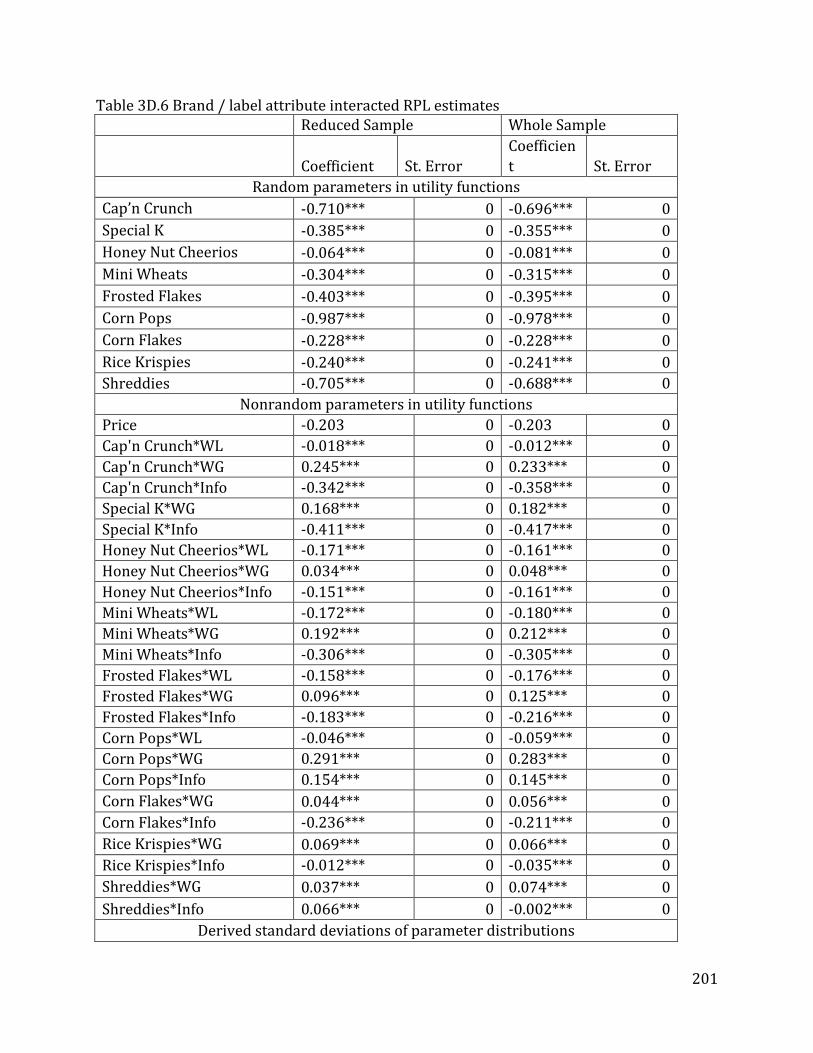
201
Table 3D.6 Brand / label attribute interacted RPL estimates
Reduced Sample Whole Sample
Coefficient St. Error
Coefficien
t St. Error
Random parameters in utility functions
Cap’n Crunch -0.710*** 0 -0.696*** 0
Special K -0.385*** 0 -0.355*** 0
Honey Nut Cheerios -0.064*** 0 -0.081*** 0
Mini Wheats -0.304*** 0 -0.315*** 0
Frosted Flakes -0.403*** 0 -0.395*** 0
Corn Pops -0.987*** 0 -0.978*** 0
Corn Flakes -0.228*** 0 -0.228*** 0
Rice Krispies -0.240*** 0 -0.241*** 0
Shreddies -0.705*** 0 -0.688*** 0
Nonrandom parameters in utility functions
Price -0.203 0 -0.203 0
Cap'n Crunch*WL -0.018*** 0 -0.012*** 0
Cap'n Crunch*WG 0.245*** 0 0.233*** 0
Cap'n Crunch*Info -0.342*** 0 -0.358*** 0
Special K*WG 0.168*** 0 0.182*** 0
Special K*Info -0.411*** 0 -0.417*** 0
Honey Nut Cheerios*WL -0.171*** 0 -0.161*** 0
Honey Nut Cheerios*WG 0.034*** 0 0.048*** 0
Honey Nut Cheerios*Info -0.151*** 0 -0.161*** 0
Mini Wheats*WL -0.172*** 0 -0.180*** 0
Mini Wheats*WG 0.192*** 0 0.212*** 0
Mini Wheats*Info -0.306*** 0 -0.305*** 0
Frosted Flakes*WL -0.158*** 0 -0.176*** 0
Frosted Flakes*WG 0.096*** 0 0.125*** 0
Frosted Flakes*Info -0.183*** 0 -0.216*** 0
Corn Pops*WL -0.046*** 0 -0.059*** 0
Corn Pops*WG 0.291*** 0 0.283*** 0
Corn Pops*Info 0.154*** 0 0.145*** 0
Corn Flakes*WG 0.044*** 0 0.056*** 0
Corn Flakes*Info -0.236*** 0 -0.211*** 0
Rice Krispies*WG 0.069*** 0 0.066*** 0
Rice Krispies*Info -0.012*** 0 -0.035*** 0
Shreddies*WG 0.037*** 0 0.074*** 0
Shreddies*Info 0.066*** 0 -0.002*** 0
Derived standard deviations of parameter distributions
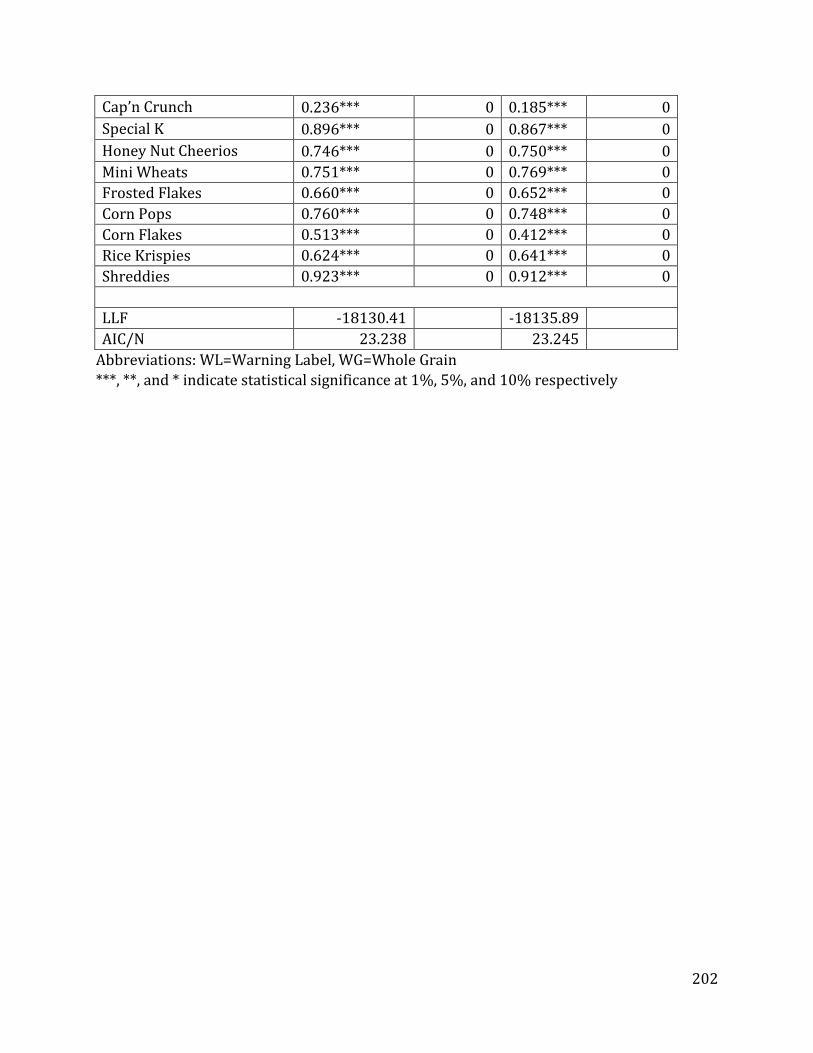
202
Cap’n Crunch 0.236*** 0 0.185*** 0
Special K 0.896*** 0 0.867*** 0
Honey Nut Cheerios 0.746*** 0 0.750*** 0
Mini Wheats 0.751*** 0 0.769*** 0
Frosted Flakes 0.660*** 0 0.652*** 0
Corn Pops 0.760*** 0 0.748*** 0
Corn Flakes 0.513*** 0 0.412*** 0
Rice Krispies 0.624*** 0 0.641*** 0
Shreddies 0.923*** 0 0.912*** 0
LLF -18130.41
-18135.89
AIC/N 23.238
23.245
Abbreviations: WL=Warning Label, WG=Whole Grain
***, **, and * indicate statistical significance at 1%, 5%, and 10% respectively

203
Appendix 4A – Summary of Breakfast Cereals
Table 4A.1 Summary of all products included in Chapter 4 analysis. Note: Values provided for RRR, Sugar, Price, and Advertising are means for the years in
which the product was present in our sample, with standard deviations shown below in
parentheses. RRR category indicates which group the products were included in for the
comparative analyses discussed in section 4.5. High sugar warning label indicates which of
the products would require a warning label based on the criteria used for the breakfast
cereal choice experiment discussed in Chapter 3. (GM=General Mills, Kel=Kellogg’s)
Company RRR
Sugar (g/
100g)
Price ($/
100g) Advertising
($/year) Years RRR
category
High sugar warning
label
Cheerios GM 2.64 3.7 0.85 1995583 1999-2017 high no
(0.00) (0.00) (0.08) (671651)
Honey Nut Cheerios
GM 1.35 31.0 0.81 2257510 1999-2017 med yes
(0.00) (0.00) (0.16) (732196)
Apple Cinnamon Cheerios
GM 1.13 26.8 0.86 197959 1999-2017 med yes
(0.06) (2.30) (0.18) (448590)
Multigrain Cheerios
GM 1.80 23.7 1.27 514721 1999-2017 high yes
(0.00) (1.28) (0.47) (720360)
Frosted Cheerios
GM 1.34 32.1 0.74 28634 1999-2016 med yes
(0.02) (0.01) (0.14) (83044)
Fruity Cheerios
GM 2.74 9.3 0.88 240871 2006-2017 high no
(0.39) (6.27) (0.10) (420378)
Oat Cluster Crunch Cheerios
GM 1.36 29.2 0.80 210535 2007-2017 med yes
(0.05) (0.93) (0.09) (374466)
Banana Nut Cheerios
GM 1.35 31.0 0.86 152242 2009-2015 med yes
(0.00) (0.00) (0.10) (183375)
Chocolate Cheerios
GM 1.32 31.0 0.68 404194 2010-2017 med yes
(0.02) (0.02) (0.11) (381518)
Multigrain Peanut Butter Cheerios
GM 1.42 30.8 0.88 0 2012-2015 med yes
(0.00) (0.00) (0.04) (0)
Protein Cheerios
GM 1.35 25.0 0.82 0 2014-2015 med yes
(0.00) (0.00) (0.00) (0)
Ancient Grain Cheerios
GM 1.60 24.1 0.88 0 2015 high yes
(0.00) (0.00) (0.00) (0)
Gluten Free Cheerios
GM 2.64 3.7 0.77 0 2016 high no
(0.00) (0.00) (0.01) (0)
Maple Cheerios
GM 1.46 32.1 0.77 0 2017 med yes
(0.00) (0.00) (0.01) (0)
Berry Burst Cheerios
GM 1.44 36.7 1.57 720866 2004-2005 med yes
(0.00) (0.00) (0.12) (730592)
Rice Chex
GM 1.84 7.1 0.74 0 2011-2017 high no
(0.16) (0.00) (0.21) (0)
Honey Nut Chex
GM 1.04 31.4 0.84 132208 1999-2017 med yes
(0.03) (0.72) (0.19) (292083)
Cinnamon Chex GM 1.19 25.5 0.84 0 1999-2017 med yes
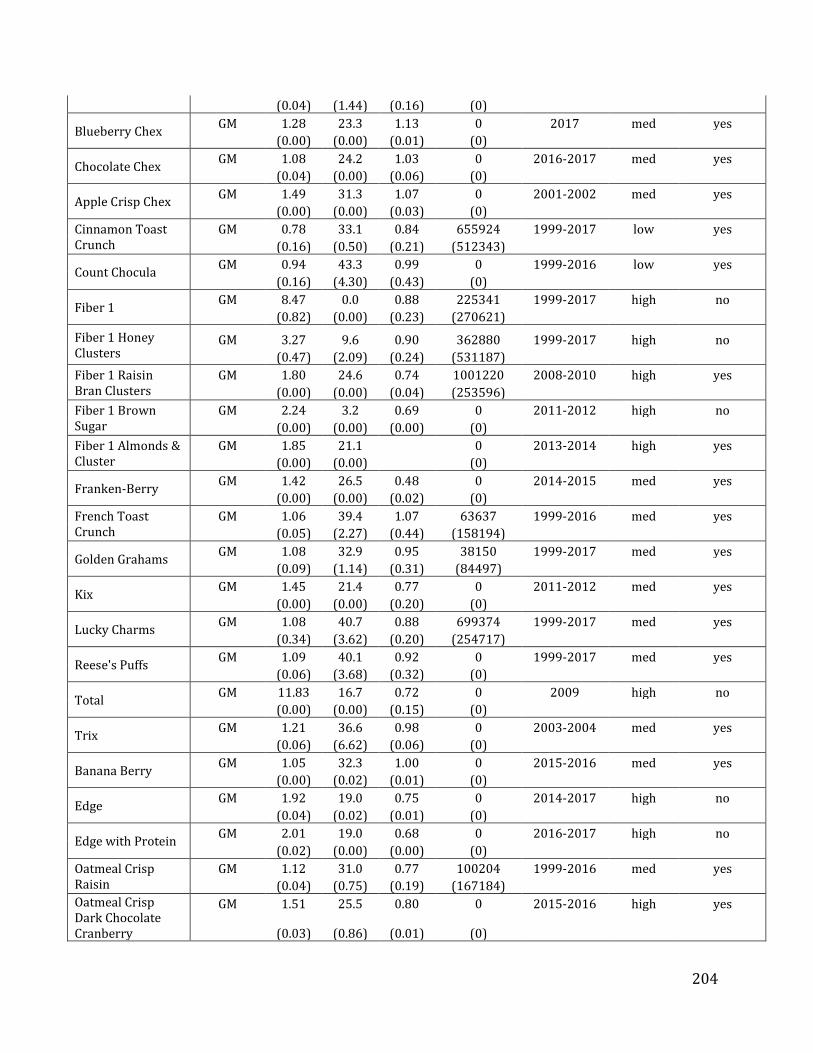
204
(0.04) (1.44) (0.16) (0)
Blueberry Chex
GM 1.28 23.3 1.13 0 2017 med yes
(0.00) (0.00) (0.01) (0)
Chocolate Chex
GM 1.08 24.2 1.03 0 2016-2017 med yes
(0.04) (0.00) (0.06) (0)
Apple Crisp Chex
GM 1.49 31.3 1.07 0 2001-2002 med yes
(0.00) (0.00) (0.03) (0)
Cinnamon Toast Crunch
GM 0.78 33.1 0.84 655924 1999-2017 low yes
(0.16) (0.50) (0.21) (512343)
Count Chocula
GM 0.94 43.3 0.99 0 1999-2016 low yes
(0.16) (4.30) (0.43) (0)
Fiber 1
GM 8.47 0.0 0.88 225341 1999-2017 high no
(0.82) (0.00) (0.23) (270621)
Fiber 1 Honey Clusters
GM 3.27 9.6 0.90 362880 1999-2017 high no
(0.47) (2.09) (0.24) (531187)
Fiber 1 Raisin Bran Clusters
GM 1.80 24.6 0.74 1001220 2008-2010 high yes
(0.00) (0.00) (0.04) (253596)
Fiber 1 Brown Sugar
GM 2.24 3.2 0.69 0 2011-2012 high no
(0.00) (0.00) (0.00) (0)
Fiber 1 Almonds & Cluster
GM 1.85 21.1
0 2013-2014 high yes
(0.00) (0.00)
(0)
Franken-Berry
GM 1.42 26.5 0.48 0 2014-2015 med yes
(0.00) (0.00) (0.02) (0)
French Toast Crunch
GM 1.06 39.4 1.07 63637 1999-2016 med yes
(0.05) (2.27) (0.44) (158194)
Golden Grahams
GM 1.08 32.9 0.95 38150 1999-2017 med yes
(0.09) (1.14) (0.31) (84497)
Kix
GM 1.45 21.4 0.77 0 2011-2012 med yes
(0.00) (0.00) (0.20) (0)
Lucky Charms
GM 1.08 40.7 0.88 699374 1999-2017 med yes
(0.34) (3.62) (0.20) (254717)
Reese's Puffs
GM 1.09 40.1 0.92 0 1999-2017 med yes
(0.06) (3.68) (0.32) (0)
Total
GM 11.83 16.7 0.72 0 2009 high no
(0.00) (0.00) (0.15) (0)
Trix
GM 1.21 36.6 0.98 0 2003-2004 med yes
(0.06) (6.62) (0.06) (0)
Banana Berry
GM 1.05 32.3 1.00 0 2015-2016 med yes
(0.00) (0.02) (0.01) (0)
Edge
GM 1.92 19.0 0.75 0 2014-2017 high no
(0.04) (0.02) (0.01) (0)
Edge with Protein
GM 2.01 19.0 0.68 0 2016-2017 high no
(0.02) (0.00) (0.00) (0)
Oatmeal Crisp Raisin
GM 1.12 31.0 0.77 100204 1999-2016 med yes
(0.04) (0.75) (0.19) (167184)
Oatmeal Crisp Dark Chocolate Cranberry
GM 1.51 25.5 0.80 0 2015-2016 high yes
(0.03) (0.86) (0.01) (0)
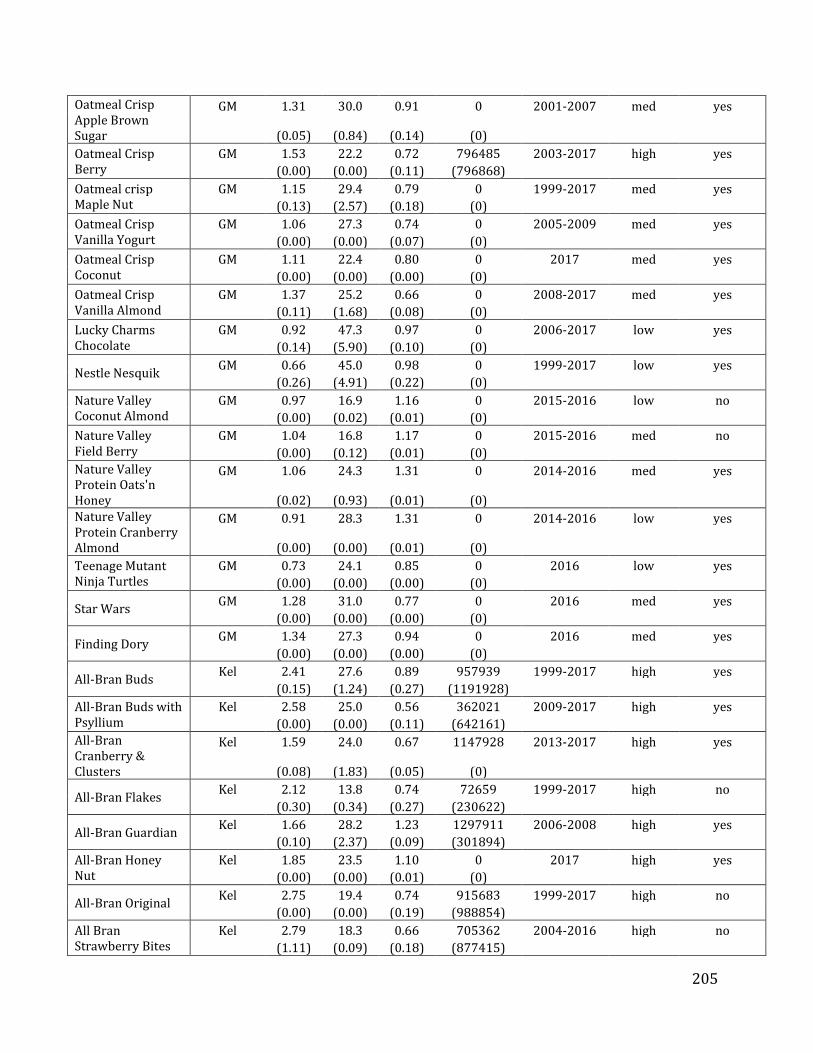
205
Oatmeal Crisp Apple Brown Sugar
GM 1.31 30.0 0.91 0 2001-2007 med yes
(0.05) (0.84) (0.14) (0)
Oatmeal Crisp Berry
GM 1.53 22.2 0.72 796485 2003-2017 high yes
(0.00) (0.00) (0.11) (796868)
Oatmeal crisp Maple Nut
GM 1.15 29.4 0.79 0 1999-2017 med yes
(0.13) (2.57) (0.18) (0)
Oatmeal Crisp Vanilla Yogurt
GM 1.06 27.3 0.74 0 2005-2009 med yes
(0.00) (0.00) (0.07) (0)
Oatmeal Crisp Coconut
GM 1.11 22.4 0.80 0 2017 med yes
(0.00) (0.00) (0.00) (0)
Oatmeal Crisp Vanilla Almond
GM 1.37 25.2 0.66 0 2008-2017 med yes
(0.11) (1.68) (0.08) (0)
Lucky Charms Chocolate
GM 0.92 47.3 0.97 0 2006-2017 low yes
(0.14) (5.90) (0.10) (0)
Nestle Nesquik
GM 0.66 45.0 0.98 0 1999-2017 low yes
(0.26) (4.91) (0.22) (0)
Nature Valley Coconut Almond
GM 0.97 16.9 1.16 0 2015-2016 low no
(0.00) (0.02) (0.01) (0)
Nature Valley Field Berry
GM 1.04 16.8 1.17 0 2015-2016 med no
(0.00) (0.12) (0.01) (0)
Nature Valley Protein Oats'n Honey
GM 1.06 24.3 1.31 0 2014-2016 med yes
(0.02) (0.93) (0.01) (0)
Nature Valley Protein Cranberry Almond
GM 0.91 28.3 1.31 0 2014-2016 low yes
(0.00) (0.00) (0.01) (0)
Teenage Mutant Ninja Turtles
GM 0.73 24.1 0.85 0 2016 low yes
(0.00) (0.00) (0.00) (0)
Star Wars
GM 1.28 31.0 0.77 0 2016 med yes
(0.00) (0.00) (0.00) (0)
Finding Dory
GM 1.34 27.3 0.94 0 2016 med yes
(0.00) (0.00) (0.00) (0)
All-Bran Buds
Kel 2.41 27.6 0.89 957939 1999-2017 high yes
(0.15) (1.24) (0.27) (1191928)
All-Bran Buds with Psyllium
Kel 2.58 25.0 0.56 362021 2009-2017 high yes
(0.00) (0.00) (0.11) (642161)
All-Bran Cranberry & Clusters
Kel 1.59 24.0 0.67 1147928 2013-2017 high yes
(0.08) (1.83) (0.05) (0)
All-Bran Flakes
Kel 2.12 13.8 0.74 72659 1999-2017 high no
(0.30) (0.34) (0.27) (230622)
All-Bran Guardian
Kel 1.66 28.2 1.23 1297911 2006-2008 high yes
(0.10) (2.37) (0.09) (301894)
All-Bran Honey Nut
Kel 1.85 23.5 1.10 0 2017 high yes
(0.00) (0.00) (0.01) (0)
All-Bran Original
Kel 2.75 19.4 0.74 915683 1999-2017 high no
(0.00) (0.00) (0.19) (988854)
All Bran Strawberry Bites
Kel 2.79 18.3 0.66 705362 2004-2016 high no
(1.11) (0.09) (0.18) (877415)
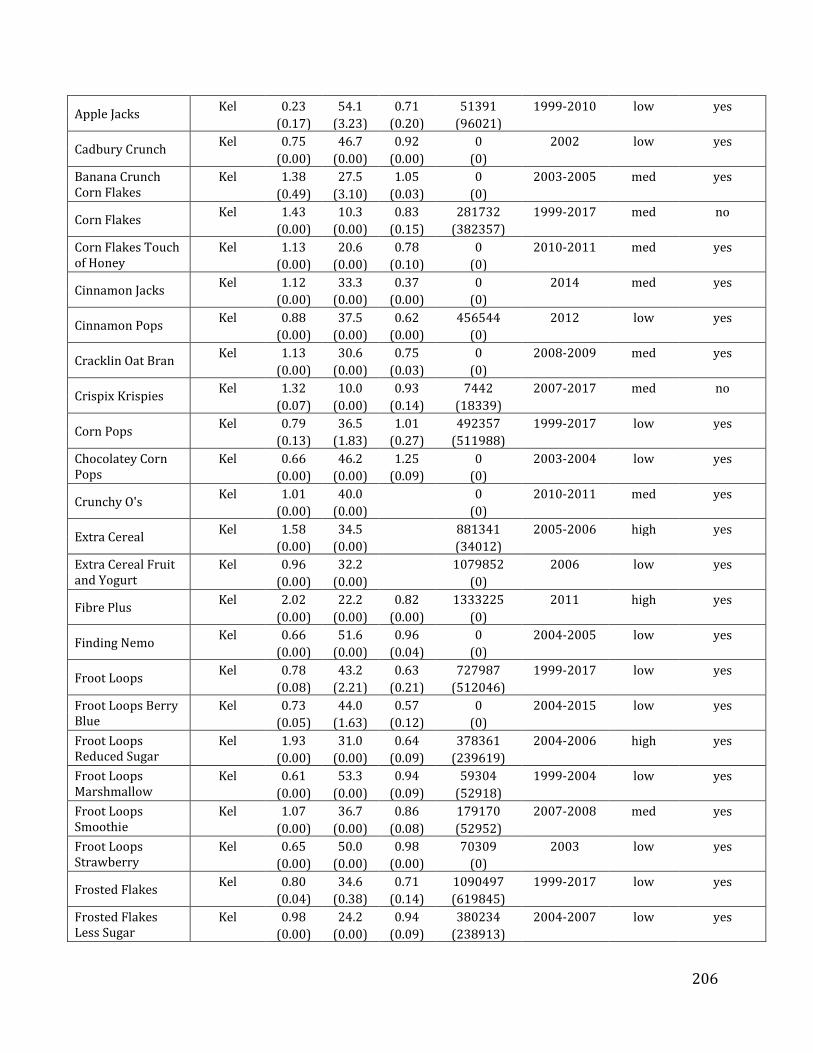
206
Apple Jacks Kel 0.23 54.1 0.71 51391 1999-2010 low yes
(0.17) (3.23) (0.20) (96021)
Cadbury Crunch
Kel 0.75 46.7 0.92 0 2002 low yes
(0.00) (0.00) (0.00) (0)
Banana Crunch Corn Flakes
Kel 1.38 27.5 1.05 0 2003-2005 med yes
(0.49) (3.10) (0.03) (0)
Corn Flakes
Kel 1.43 10.3 0.83 281732 1999-2017 med no
(0.00) (0.00) (0.15) (382357)
Corn Flakes Touch of Honey
Kel 1.13 20.6 0.78 0 2010-2011 med yes
(0.00) (0.00) (0.10) (0)
Cinnamon Jacks
Kel 1.12 33.3 0.37 0 2014 med yes
(0.00) (0.00) (0.00) (0)
Cinnamon Pops
Kel 0.88 37.5 0.62 456544 2012 low yes
(0.00) (0.00) (0.00) (0)
Cracklin Oat Bran
Kel 1.13 30.6 0.75 0 2008-2009 med yes
(0.00) (0.00) (0.03) (0)
Crispix Krispies
Kel 1.32 10.0 0.93 7442 2007-2017 med no
(0.07) (0.00) (0.14) (18339)
Corn Pops
Kel 0.79 36.5 1.01 492357 1999-2017 low yes
(0.13) (1.83) (0.27) (511988)
Chocolatey Corn Pops
Kel 0.66 46.2 1.25 0 2003-2004 low yes
(0.00) (0.00) (0.09) (0)
Crunchy O's
Kel 1.01 40.0
0 2010-2011 med yes
(0.00) (0.00)
(0)
Extra Cereal
Kel 1.58 34.5
881341 2005-2006 high yes
(0.00) (0.00)
(34012)
Extra Cereal Fruit and Yogurt
Kel 0.96 32.2
1079852 2006 low yes
(0.00) (0.00)
(0)
Fibre Plus
Kel 2.02 22.2 0.82 1333225 2011 high yes
(0.00) (0.00) (0.00) (0)
Finding Nemo
Kel 0.66 51.6 0.96 0 2004-2005 low yes
(0.00) (0.00) (0.04) (0)
Froot Loops
Kel 0.78 43.2 0.63 727987 1999-2017 low yes
(0.08) (2.21) (0.21) (512046)
Froot Loops Berry Blue
Kel 0.73 44.0 0.57 0 2004-2015 low yes
(0.05) (1.63) (0.12) (0)
Froot Loops Reduced Sugar
Kel 1.93 31.0 0.64 378361 2004-2006 high yes
(0.00) (0.00) (0.09) (239619)
Froot Loops Marshmallow
Kel 0.61 53.3 0.94 59304 1999-2004 low yes
(0.00) (0.00) (0.09) (52918)
Froot Loops Smoothie
Kel 1.07 36.7 0.86 179170 2007-2008 med yes
(0.00) (0.00) (0.08) (52952)
Froot Loops Strawberry
Kel 0.65 50.0 0.98 70309 2003 low yes
(0.00) (0.00) (0.00) (0)
Frosted Flakes
Kel 0.80 34.6 0.71 1090497 1999-2017 low yes
(0.04) (0.38) (0.14) (619845)
Frosted Flakes Less Sugar
Kel 0.98 24.2 0.94 380234 2004-2007 low yes
(0.00) (0.00) (0.09) (238913)
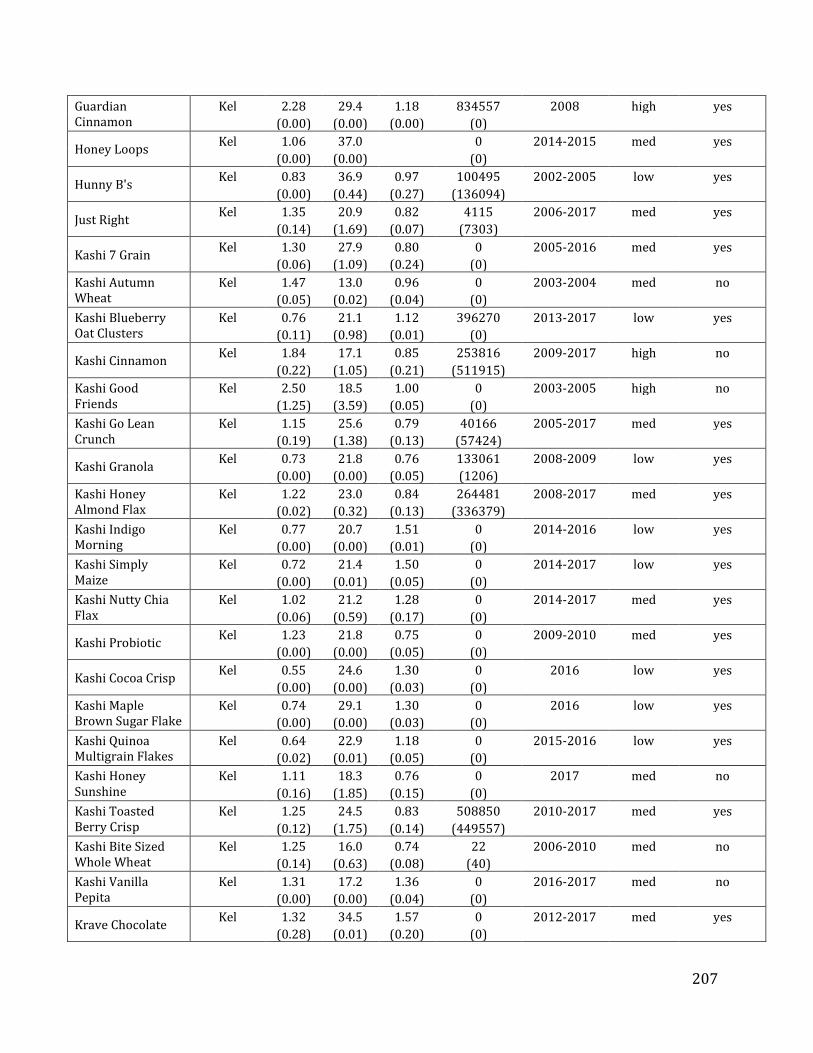
207
Guardian Cinnamon
Kel 2.28 29.4 1.18 834557 2008 high yes
(0.00) (0.00) (0.00) (0)
Honey Loops
Kel 1.06 37.0
0 2014-2015 med yes
(0.00) (0.00)
(0)
Hunny B's
Kel 0.83 36.9 0.97 100495 2002-2005 low yes
(0.00) (0.44) (0.27) (136094)
Just Right
Kel 1.35 20.9 0.82 4115 2006-2017 med yes
(0.14) (1.69) (0.07) (7303)
Kashi 7 Grain
Kel 1.30 27.9 0.80 0 2005-2016 med yes
(0.06) (1.09) (0.24) (0)
Kashi Autumn Wheat
Kel 1.47 13.0 0.96 0 2003-2004 med no
(0.05) (0.02) (0.04) (0)
Kashi Blueberry Oat Clusters
Kel 0.76 21.1 1.12 396270 2013-2017 low yes
(0.11) (0.98) (0.01) (0)
Kashi Cinnamon
Kel 1.84 17.1 0.85 253816 2009-2017 high no
(0.22) (1.05) (0.21) (511915)
Kashi Good Friends
Kel 2.50 18.5 1.00 0 2003-2005 high no
(1.25) (3.59) (0.05) (0)
Kashi Go Lean Crunch
Kel 1.15 25.6 0.79 40166 2005-2017 med yes
(0.19) (1.38) (0.13) (57424)
Kashi Granola
Kel 0.73 21.8 0.76 133061 2008-2009 low yes
(0.00) (0.00) (0.05) (1206)
Kashi Honey Almond Flax
Kel 1.22 23.0 0.84 264481 2008-2017 med yes
(0.02) (0.32) (0.13) (336379)
Kashi Indigo Morning
Kel 0.77 20.7 1.51 0 2014-2016 low yes
(0.00) (0.00) (0.01) (0)
Kashi Simply Maize
Kel 0.72 21.4 1.50 0 2014-2017 low yes
(0.00) (0.01) (0.05) (0)
Kashi Nutty Chia Flax
Kel 1.02 21.2 1.28 0 2014-2017 med yes
(0.06) (0.59) (0.17) (0)
Kashi Probiotic
Kel 1.23 21.8 0.75 0 2009-2010 med yes
(0.00) (0.00) (0.05) (0)
Kashi Cocoa Crisp
Kel 0.55 24.6 1.30 0 2016 low yes
(0.00) (0.00) (0.03) (0)
Kashi Maple Brown Sugar Flake
Kel 0.74 29.1 1.30 0 2016 low yes
(0.00) (0.00) (0.03) (0)
Kashi Quinoa Multigrain Flakes
Kel 0.64 22.9 1.18 0 2015-2016 low yes
(0.02) (0.01) (0.05) (0)
Kashi Honey Sunshine
Kel 1.11 18.3 0.76 0 2017 med no
(0.16) (1.85) (0.15) (0)
Kashi Toasted Berry Crisp
Kel 1.25 24.5 0.83 508850 2010-2017 med yes
(0.12) (1.75) (0.14) (449557)
Kashi Bite Sized Whole Wheat
Kel 1.25 16.0 0.74 22 2006-2010 med no
(0.14) (0.63) (0.08) (40)
Kashi Vanilla Pepita
Kel 1.31 17.2 1.36 0 2016-2017 med no
(0.00) (0.00) (0.04) (0)
Krave Chocolate
Kel 1.32 34.5 1.57 0 2012-2017 med yes
(0.28) (0.01) (0.20) (0)
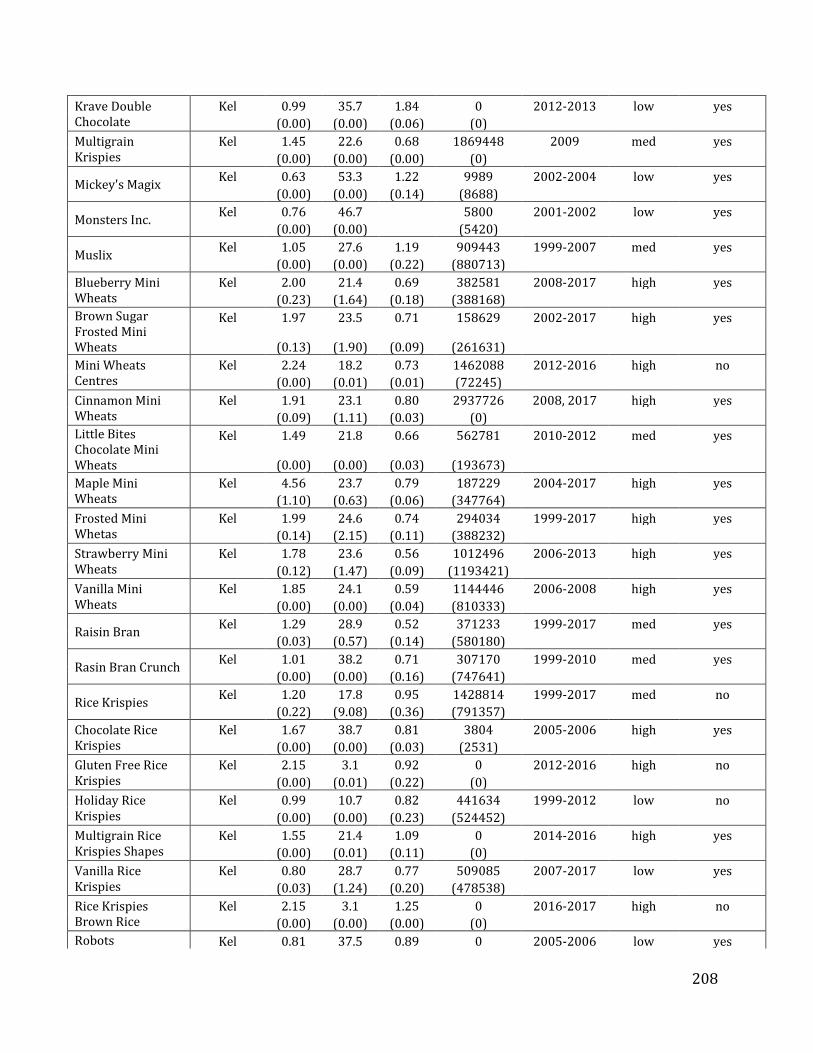
208
Krave Double Chocolate
Kel 0.99 35.7 1.84 0 2012-2013 low yes
(0.00) (0.00) (0.06) (0)
Multigrain Krispies
Kel 1.45 22.6 0.68 1869448 2009 med yes
(0.00) (0.00) (0.00) (0)
Mickey's Magix
Kel 0.63 53.3 1.22 9989 2002-2004 low yes
(0.00) (0.00) (0.14) (8688)
Monsters Inc.
Kel 0.76 46.7
5800 2001-2002 low yes
(0.00) (0.00)
(5420)
Muslix
Kel 1.05 27.6 1.19 909443 1999-2007 med yes
(0.00) (0.00) (0.22) (880713)
Blueberry Mini Wheats
Kel 2.00 21.4 0.69 382581 2008-2017 high yes
(0.23) (1.64) (0.18) (388168)
Brown Sugar Frosted Mini Wheats
Kel 1.97 23.5 0.71 158629 2002-2017 high yes
(0.13) (1.90) (0.09) (261631)
Mini Wheats Centres
Kel 2.24 18.2 0.73 1462088 2012-2016 high no
(0.00) (0.01) (0.01) (72245)
Cinnamon Mini Wheats
Kel 1.91 23.1 0.80 2937726 2008, 2017 high yes
(0.09) (1.11) (0.03) (0)
Little Bites Chocolate Mini Wheats
Kel 1.49 21.8 0.66 562781 2010-2012 med yes
(0.00) (0.00) (0.03) (193673)
Maple Mini Wheats
Kel 4.56 23.7 0.79 187229 2004-2017 high yes
(1.10) (0.63) (0.06) (347764)
Frosted Mini Whetas
Kel 1.99 24.6 0.74 294034 1999-2017 high yes
(0.14) (2.15) (0.11) (388232)
Strawberry Mini Wheats
Kel 1.78 23.6 0.56 1012496 2006-2013 high yes
(0.12) (1.47) (0.09) (1193421)
Vanilla Mini Wheats
Kel 1.85 24.1 0.59 1144446 2006-2008 high yes
(0.00) (0.00) (0.04) (810333)
Raisin Bran
Kel 1.29 28.9 0.52 371233 1999-2017 med yes
(0.03) (0.57) (0.14) (580180)
Rasin Bran Crunch
Kel 1.01 38.2 0.71 307170 1999-2010 med yes
(0.00) (0.00) (0.16) (747641)
Rice Krispies
Kel 1.20 17.8 0.95 1428814 1999-2017 med no
(0.22) (9.08) (0.36) (791357)
Chocolate Rice Krispies
Kel 1.67 38.7 0.81 3804 2005-2006 high yes
(0.00) (0.00) (0.03) (2531)
Gluten Free Rice Krispies
Kel 2.15 3.1 0.92 0 2012-2016 high no
(0.00) (0.01) (0.22) (0)
Holiday Rice Krispies
Kel 0.99 10.7 0.82 441634 1999-2012 low no
(0.00) (0.00) (0.23) (524452)
Multigrain Rice Krispies Shapes
Kel 1.55 21.4 1.09 0 2014-2016 high yes
(0.00) (0.01) (0.11) (0)
Vanilla Rice Krispies
Kel 0.80 28.7 0.77 509085 2007-2017 low yes
(0.03) (1.24) (0.20) (478538)
Rice Krispies Brown Rice
Kel 2.15 3.1 1.25 0 2016-2017 high no
(0.00) (0.00) (0.00) (0)
Robots Kel 0.81 37.5 0.89 0 2005-2006 low yes
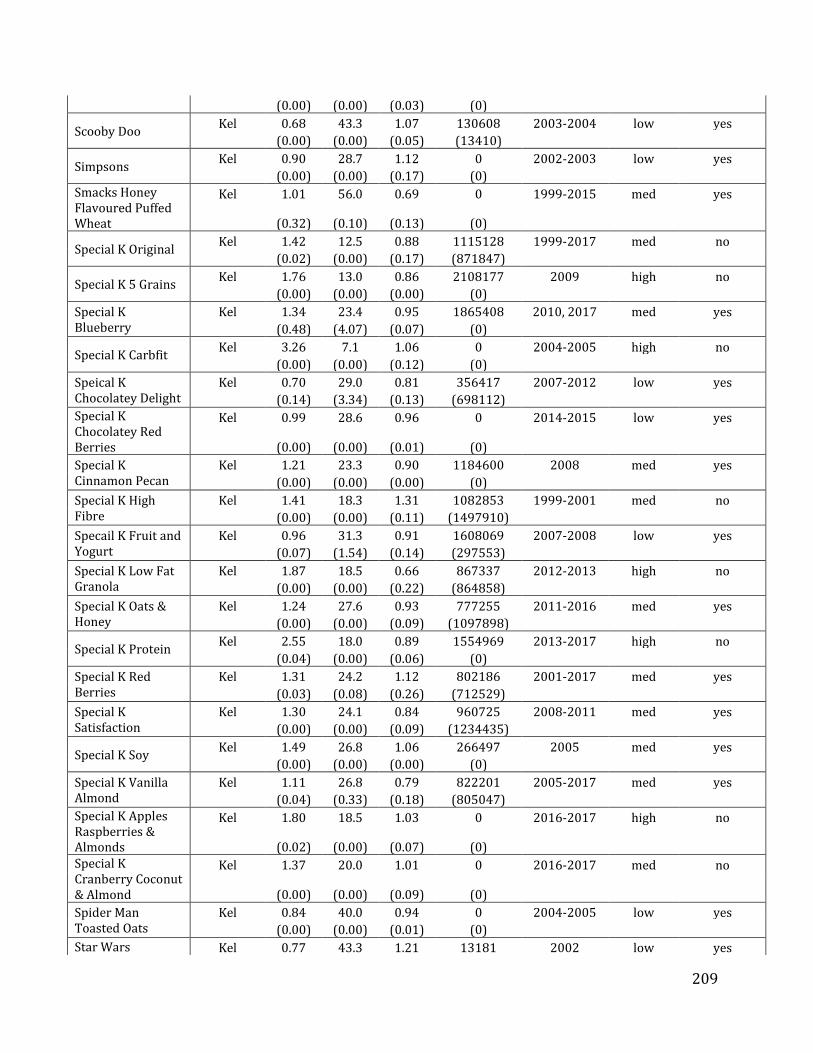
209
(0.00) (0.00) (0.03) (0)
Scooby Doo
Kel 0.68 43.3 1.07 130608 2003-2004 low yes
(0.00) (0.00) (0.05) (13410)
Simpsons
Kel 0.90 28.7 1.12 0 2002-2003 low yes
(0.00) (0.00) (0.17) (0)
Smacks Honey Flavoured Puffed Wheat
Kel 1.01 56.0 0.69 0 1999-2015 med yes
(0.32) (0.10) (0.13) (0)
Special K Original
Kel 1.42 12.5 0.88 1115128 1999-2017 med no
(0.02) (0.00) (0.17) (871847)
Special K 5 Grains
Kel 1.76 13.0 0.86 2108177 2009 high no
(0.00) (0.00) (0.00) (0)
Special K Blueberry
Kel 1.34 23.4 0.95 1865408 2010, 2017 med yes
(0.48) (4.07) (0.07) (0)
Special K Carbfit
Kel 3.26 7.1 1.06 0 2004-2005 high no
(0.00) (0.00) (0.12) (0)
Speical K Chocolatey Delight
Kel 0.70 29.0 0.81 356417 2007-2012 low yes
(0.14) (3.34) (0.13) (698112)
Special K Chocolatey Red Berries
Kel 0.99 28.6 0.96 0 2014-2015 low yes
(0.00) (0.00) (0.01) (0)
Special K Cinnamon Pecan
Kel 1.21 23.3 0.90 1184600 2008 med yes
(0.00) (0.00) (0.00) (0)
Special K High Fibre
Kel 1.41 18.3 1.31 1082853 1999-2001 med no
(0.00) (0.00) (0.11) (1497910)
Specail K Fruit and Yogurt
Kel 0.96 31.3 0.91 1608069 2007-2008 low yes
(0.07) (1.54) (0.14) (297553)
Special K Low Fat Granola
Kel 1.87 18.5 0.66 867337 2012-2013 high no
(0.00) (0.00) (0.22) (864858)
Special K Oats & Honey
Kel 1.24 27.6 0.93 777255 2011-2016 med yes
(0.00) (0.00) (0.09) (1097898)
Special K Protein
Kel 2.55 18.0 0.89 1554969 2013-2017 high no
(0.04) (0.00) (0.06) (0)
Special K Red Berries
Kel 1.31 24.2 1.12 802186 2001-2017 med yes
(0.03) (0.08) (0.26) (712529)
Special K Satisfaction
Kel 1.30 24.1 0.84 960725 2008-2011 med yes
(0.00) (0.00) (0.09) (1234435)
Special K Soy
Kel 1.49 26.8 1.06 266497 2005 med yes
(0.00) (0.00) (0.00) (0)
Special K Vanilla Almond
Kel 1.11 26.8 0.79 822201 2005-2017 med yes
(0.04) (0.33) (0.18) (805047)
Special K Apples Raspberries & Almonds
Kel 1.80 18.5 1.03 0 2016-2017 high no
(0.02) (0.00) (0.07) (0)
Special K Cranberry Coconut & Almond
Kel 1.37 20.0 1.01 0 2016-2017 med no
(0.00) (0.00) (0.09) (0)
Spider Man Toasted Oats
Kel 0.84 40.0 0.94 0 2004-2005 low yes
(0.00) (0.00) (0.01) (0)
Star Wars Kel 0.77 43.3 1.21 13181 2002 low yes
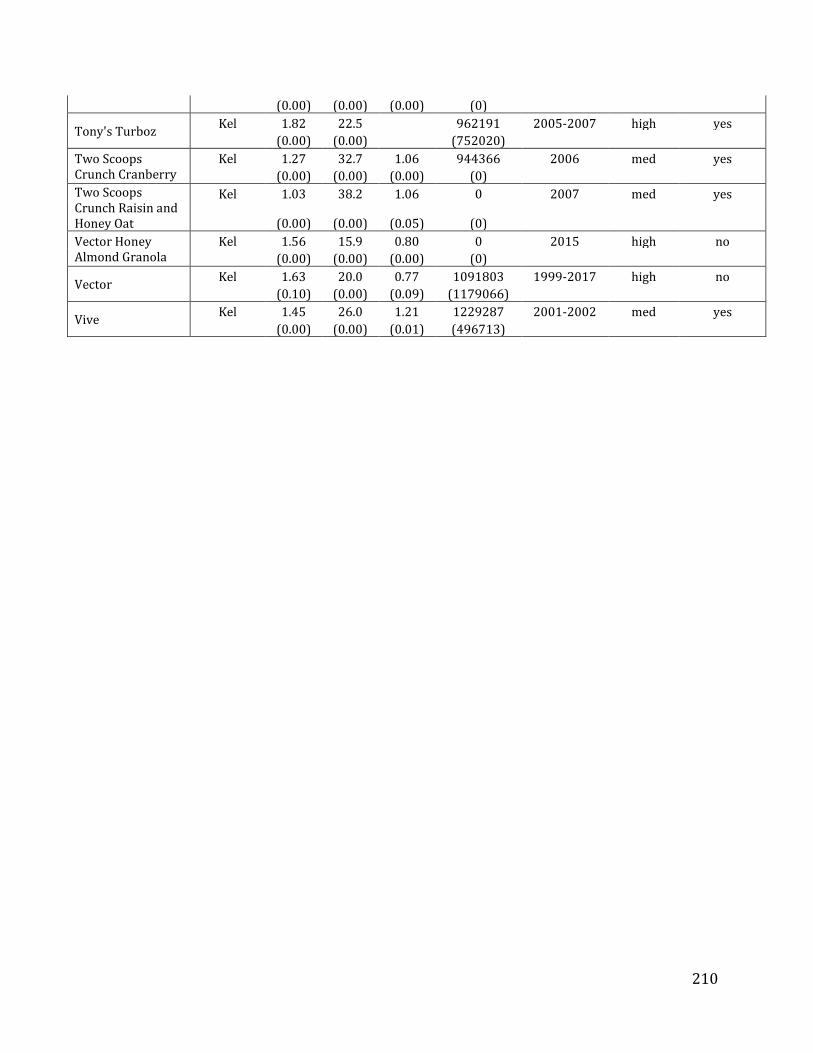
210
(0.00) (0.00) (0.00) (0)
Tony's Turboz
Kel 1.82 22.5
962191 2005-2007 high yes
(0.00) (0.00)
(752020)
Two Scoops Crunch Cranberry
Kel 1.27 32.7 1.06 944366 2006 med yes
(0.00) (0.00) (0.00) (0)
Two Scoops Crunch Raisin and Honey Oat
Kel 1.03 38.2 1.06 0 2007 med yes
(0.00) (0.00) (0.05) (0)
Vector Honey Almond Granola
Kel 1.56 15.9 0.80 0 2015 high no
(0.00) (0.00) (0.00) (0)
Vector
Kel 1.63 20.0 0.77 1091803 1999-2017 high no
(0.10) (0.00) (0.09) (1179066)
Vive
Kel 1.45 26.0 1.21 1229287 2001-2002 med yes
(0.00) (0.00) (0.01) (496713)