A direct borohydride fuel cell employing a sago gel polymer electrolyte

Journal of Biomolecular NMR, 12: 259–276, 1998.KLUWER/ESCOM© 1998Kluwer Academic Publishers. Printed in the Netherlands.
259
Some NMR experiments and a structure determination employing a{15N,2H} enriched protein
T.K. Mal, S.J. Matthewsa, H. Kovacs, I.D. Campbell & J. BoydOxford Centre for Molecular Sciences and Department of Biochemistry, University of Oxford, South Parks Road,Oxford, OX1 3QU, U.K.a Department of Biochemistry, Imperial College of Science and Technology and Medicine, Exhibition Road, SouthKensington, London, SW7 2AY, U.K.
Received 26 November 1997; Accepted 26 March 1998
Key words: isotopic enrichment {15N,2H}, 1H relaxation, structure calculations, isotope shifts, solvent interactions
Abstract
We present the results of studies of an aqueous sample of a highly {15N,2H} enriched protein, the SH3 domainfrom Fyn. Measurements of1H relaxation and interactions between H2O solvent and exchangeable protons aregiven, as well as a method for increasing the effective longitudinal relaxation of solvent exchangeable protonresonances. The long-range isotope shifts are measured, for1H and 15N, which arise due to perdeuteration.Simulations, which employed a 7 or 8 spin relaxation matrix analysis, were compared to the experimental datafrom a time series of 2D NOESY datasets for some resonances. The agreement between experiment and simulationsuggest that, with this1H dilute sample, relatively long mixing times (up to 1.2 s) can be used to detect specificdipolar interactions between amide protons up to about 7Å apart. A set of 155 inter-amide NOEs and 7 sidechain NOEs were thus identified in a series of 3D HSQC-NOESY-HSQC experiments. These data, alone and incombination with previously collected restraints, were used to calculate sets of structures using X-PLOR. Theseresults are compared to the available X-ray and NMR structures of the Fyn SH3 domain.
Abbreviations:1D, one-dimensional; 2D, two-dimensional; 3D, three-dimensional; NOESY, nuclear Overhauserenhancement spectroscopy; HSQC, heteronuclear single quantum correlation; SA, simulated annealing; Tris-HCl, tris(hydroxymethyl)aminomethane-hydrochloride; SDS-PAGE, sodium dodecylsulphate-polyacrylamide geleletrophoresis; PBS, buffered saline; CSA, chemical shift anisotropy; DSSP, define secondary structure of proteins.
Introduction
Several groups have explored the use of fully or par-tially 2H isotopically enriched proteins (Crespi et al.,1968; Markley et al., 1968; Torchia et al., 1988;LeMaster et al., 1988; Tsang et al., 1990) in com-bination with15N enrichment (Grzesiek et al., 1995)and 15N and13C enrichment (Grzesiek et al., 1993;Markus et al., 1994; Yamazaki et al., 1994; Farmerand Venters, 1995; Venters et al., 1995; Venters et al.,1996; Nietlispach et al., 1996; Gardner et al., 1997;Yamazaki et al., 1997; Sattler et al., 1997, Yu et al.,1997). The primary focus of these papers was to es-
tablish a route to the structure determination of largerproteins than is possible with15N and 13C isotopicenrichment alone. Examples are a Trp repressor-DNAcomplex (Zhang et al., 1994), Shc phosphotyrosinebinding domain (Zhou et al., 1995), and the proteinBcl-XL (Muchmore et al., 1996).
In this paper we use an aqueous sample of FynSH3 domain, where some effort was made to obtain ashigh a level of {15N,2H} enrichment as possible. Thestructure of the Fyn SH3 domain from the Fyn tyrosinekinase (Cooke and Perlmutter, 1989) has been deter-mined by both X-ray crystallography (Noble et al.,1993) and NMR (Morton et al., 1996) and shown to

260
have two 3-stranded antiparallelβ sheets with a singleturn of 310 helix. The aim of the current work was tocharacterise the effects of complete deuteration on var-ious parameters, including the1H amide longitudinaland transverse relaxation rates. We have also measuredthe long-range isotope shifts which occur with deuter-ation and report some experiments which probe theinteraction of water with the solvent-exposed amidesand hydroxyl groups. An important feature of thisstudy was prior knowledge of the amide1H and15Nresonance assignments from previous studies with aseparate protonated15N enriched sample (Morton etal., 1996).
It has previously been suggested that a restrictedNOE dataset from a deuterated sample might providea method for establishing the global fold of a protein(Venters et al., 1995; Smith et al., 1996). Here weexploit the relatively slow1H longitudinal relaxationrate between the isotopically dilute1H spins to record2D homonuclear NOESY (Wüthrich, 1986) and 3D1H-15N HSQC-NOESY-HSQC (Frenkiel et al., 1990)datasets over a wide range of mixing times. These 2Dand 3D NOESY experiments have made possible thedetection of specific dipolar interactions over signif-icantly larger distances than can be obtained from asample without2H labelling. The observed NOE in-tensities were divided into three broad classes whichwere converted into distance upper-limit constraints of3 Å, 4 Å and 6.8 Å. 155 amide-amide and 7 side chain-amide NOEs were identified. Structure calculationswere carried out using either this set of NOE restraintsalone, or with the inclusion of previously determined3J (HN,Hα) vicinal coupling constants (Morton et al.,1996). The resulting family of backbone NMR struc-tures with their relative statistics are compared to theX-ray structure as well as a new family of NMRstructures, computed using the previous restraints listaugmented with the new NOE restraints.
Materials and Methods
Protein preparation
The pGEX-2T plasmid containing the gene for FynSH3 domain was transformed in theE. Coli cell lineBL21 and then grown in vitamin supplemented M9minimal medium (6 g/l Na2HPO4, 3 g/l KH2PO4,0.5 g/l NaCl, 1 ml of 1M MgSO4, 1 ml of 0.1MCaCl2, 1 ml of 1M thiamine, 25 ml 20% glucoseand 10 ml ofE. coli trace elements) with15NH4Cl as
the sole nitrogen source. The resulting bacterial cellswere recultured in M9 minimal medium containingsodium acetate and15NH4Cl as the sole carbon andnitrogen sources, respectively. The bacterial cells ob-tained from this cell growth were transferred to 50%deuterated M9 minimal medium. Finally these cellswere grown, at 37◦C with vigorous aeration, in 3 lof fully deuterated M9 minimal medium, which con-tained CD3COONa and15ND4Cl. All the componentsused in this M9 minimal medium had been fully ex-changed with deuterium before use. The bacterial cellswere found to grow approximately one quarter as fastas those grown under similar conditions in aqueousmedium. Bacterial cell growth was monitored until theoptical density at 600 nm was 0.5. The cells were in-duced with isopropyl-β-D-thiogalactopyranoside (fi-nal concentraition, 120 mg/l) for 6 h and harvestedby centrifugation at 4◦C before suspending in ice-cooled PBS lysis buffer (140 mM NaCl, 2.7 mM KCl,10 mM Na2HPO4, 1.8 mM KH2PO4 and 0.5 mMphenylmethylsulfonylfluoride). The bacterial cell sus-pension was sonicated for 1 min with an interval of2 min for 6 cycles at 0◦C. The resulting cell debriswas pelletted using centrifugation for 45 min at 15krpm and 4◦C. The supernatant was passed througha Glutathione Sepharose 4B affinity column (Phar-macia Biotech) which had been pre-equilibrated withPBS buffer. After extensive washing with PBS (8 bedvolumes) the protein was eluted with buffer (50 mMTris-HCl and 10 mM reduced glutathione, pH 8.4).The protein-containing solution was then incubatedwith thrombin at room temperature and the cleavagewas monitored by SDS-PAGE electrophoresis. Thecleaved proteins were directly loaded onto a Sephacryls-100 gel filtration column (2.6 cm× 90 cm) whichhad been pre-equilibrated with elution buffer 50 mMTris-HCl and 150 mM NaCl, pH 8.4. The proteinwas collected, dialysed against water and freeze-dried.At the end of the purification procedure all the ex-changeable deuterons were found to have completelyexchanged to protons as judged by mass spectroscopy.The D2O, 99.8%, was purchased from Isotec Inc.
As judged by SDS-PAGE the {15N,2H} enrichedFyn SH3 sample was pure. The molecular weight of8919.0 daltons, experimentally determined using elec-trospray mass spectroscopy, was consistent with thatcalculated from the amino acid sequence assumingcomplete15N and2H labelling (8914.6 daltons).
261
NMR methods
For NMR the {15N,2H} labelled SH3 sample was dis-solved to 1 mM, pH 6 in 95%/5% H2O/D2O and thesolution transferred to a Shigemi NMR tube (ShigemiCo., Ltd.).
NMR spectra were obtained on a home built spec-trometer interfaced to an Oxford Instruments 750 MHzsuperconducting magnet. A homemade RF probehead(Soffe et al., 1995) with a 3 axis gradient set was used.All NMR spectra were obtained using a probeheadtemperature of 283 K.
Thirteen 2D NOESY spectra were collected withvariable mixing times (25 ms, 100 ms, 200 ms,300 ms, 400 ms, 600 ms, 800 ms, 1 s, 1.4 s, 2 s,2.6 s, 3.2 s, 3.8 s) employing 128 and 2048 complexpoints with dwell times of 250µs and 80µs for t1 andt2, respectively, four scans/point, a recycle delay of15 s and the pulse scheme of Huang and Shaka (Huangand Shaka, 1995) followed the longitudinal relaxationperiod. Five 3D HSQC-NOESY-HSQC spectra werecollected with variable mixing times (10 ms, 300 ms,600 ms, 900 ms, 1.2 s) employing 32, 32 and 1024complex points with dwell times of 500µs, 500µsand 80µs fort1(15N), t2 (15N) andt3 (1H) respectively,four scans/point, a recycle delay of 4.4 s and usinggradient coherence selection with sensitivity enhance-ment (Kay et al., 1992) following thet2 evolutionperiod. 2D15N-1H HSQC spectra (Bodenhausen andRuben, 1980) were collected employing 256 and 4096complex points with dwell times of 250µs and 80µsfor t1 and t2, respectively, 64 scans/point, a recycledelay of 5 s and using gradient coherence selectionwith sensitivity enhancement (Kay et al., 1992).
The NMR data were processed with FELIX (FE-LIX2.3, Biosym Technologies, Inc.) and spectralanalysis was carried out using the program XEASY(Bartels et al., 1995).
Structure calculations
The structure calculations reported here were donewithin the programme X-PLORv. 3.1 (Brünger, 1992)employing theab initio simulated annealing proto-col. The calculation starts from an extended structurewith ideal covalent geometry and randomised sidechains with sum averaging applied to the NOE con-straints. The energy mimimisation routine employed‘floating chirality’, in which prochiral groups withoutstereospecific assignment, such as valine and leucinemethyl groups and methylene hydrogens, were al-lowed to interchange positions during the course of the
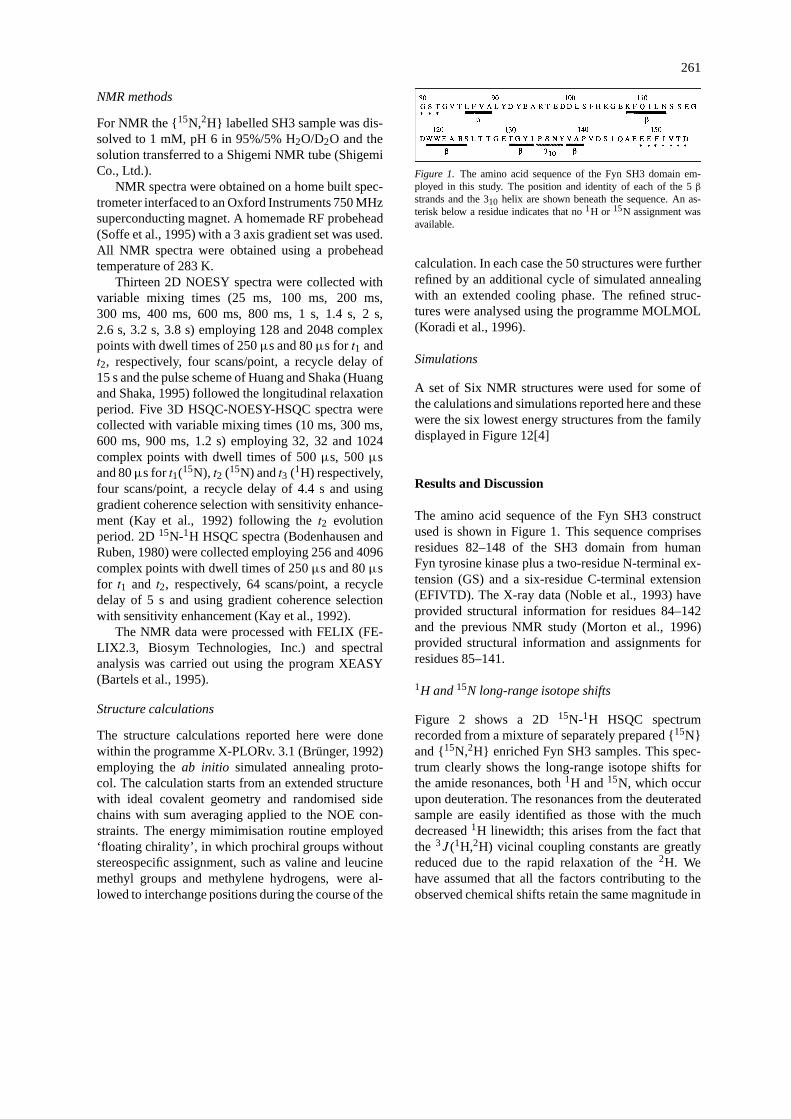
Figure 1. The amino acid sequence of the Fyn SH3 domain em-ployed in this study. The position and identity of each of the 5β
strands and the 310 helix are shown beneath the sequence. An as-terisk below a residue indicates that no1H or 15N assignment wasavailable.
calculation. In each case the 50 structures were furtherrefined by an additional cycle of simulated annealingwith an extended cooling phase. The refined struc-tures were analysed using the programme MOLMOL(Koradi et al., 1996).
Simulations
A set of Six NMR structures were used for some ofthe calulations and simulations reported here and thesewere the six lowest energy structures from the familydisplayed in Figure 12[4]
Results and Discussion
The amino acid sequence of the Fyn SH3 constructused is shown in Figure 1. This sequence comprisesresidues 82–148 of the SH3 domain from humanFyn tyrosine kinase plus a two-residue N-terminal ex-tension (GS) and a six-residue C-terminal extension(EFIVTD). The X-ray data (Noble et al., 1993) haveprovided structural information for residues 84–142and the previous NMR study (Morton et al., 1996)provided structural information and assignments forresidues 85–141.
1H and15N long-range isotope shifts
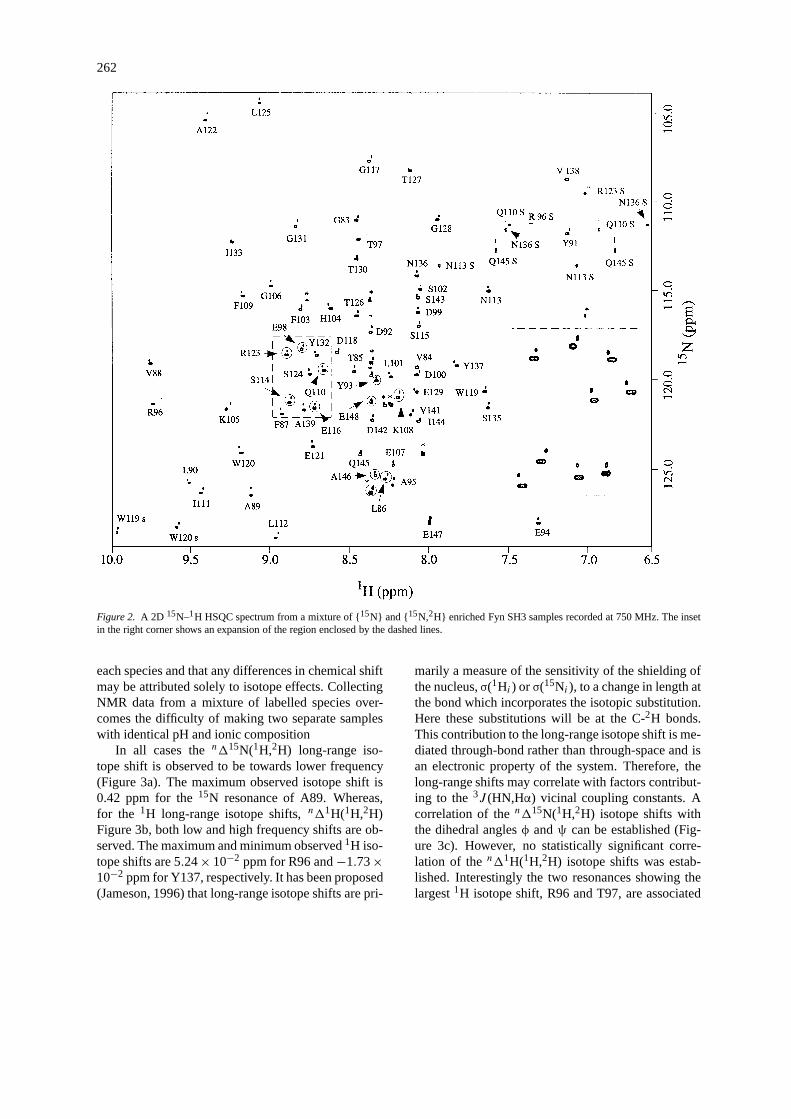
Figure 2 shows a 2D15N-1H HSQC spectrumrecorded from a mixture of separately prepared {15N}and {15N,2H} enriched Fyn SH3 samples. This spec-trum clearly shows the long-range isotope shifts forthe amide resonances, both1H and15N, which occurupon deuteration. The resonances from the deuteratedsample are easily identified as those with the muchdecreased1H linewidth; this arises from the fact thatthe 3J (1H,2H) vicinal coupling constants are greatlyreduced due to the rapid relaxation of the2H. Wehave assumed that all the factors contributing to theobserved chemical shifts retain the same magnitude in
262
Figure 2. A 2D 15N–1H HSQC spectrum from a mixture of {15N} and {15N,2H} enriched Fyn SH3 samples recorded at 750 MHz. The insetin the right corner shows an expansion of the region enclosed by the dashed lines.
each species and that any differences in chemical shiftmay be attributed solely to isotope effects. CollectingNMR data from a mixture of labelled species over-comes the difficulty of making two separate sampleswith identical pH and ionic composition
In all cases then115N(1H,2H) long-range iso-tope shift is observed to be towards lower frequency(Figure 3a). The maximum observed isotope shift is0.42 ppm for the15N resonance of A89. Whereas,for the 1H long-range isotope shifts,n11H(1H,2H)Figure 3b, both low and high frequency shifts are ob-served. The maximum and minimum observed1H iso-tope shifts are 5.24× 10⁻² ppm for R96 and−1.73×10⁻² ppm for Y137, respectively. It has been proposed(Jameson, 1996) that long-range isotope shifts are pri-
marily a measure of the sensitivity of the shielding ofthe nucleus,σ(1Hi ) or σ(15Ni ), to a change in length atthe bond which incorporates the isotopic substitution.Here these substitutions will be at the C-2H bonds.This contribution to the long-range isotope shift is me-diated through-bond rather than through-space and isan electronic property of the system. Therefore, thelong-range shifts may correlate with factors contribut-ing to the3J (HN,Hα) vicinal coupling constants. Acorrelation of then115N(1H,2H) isotope shifts withthe dihedral anglesφ andψ can be established (Fig-ure 3c). However, no statistically significant corre-lation of then11H(1H,2H) isotope shifts was estab-lished. Interestingly the two resonances showing thelargest1H isotope shift, R96 and T97, are associated

263
Figure 3. (a) The 15N long-range isotope shifts versus residuenumber. The average shift of 0.237 ppm is shown by the solidline. (b) The1H long-range isotope shifts as a function of residuenumber. The average shift of 3.47× 10⁻³ ppm is shown by thesolid line. The residues involved in secondary structure elementsare shown by black bars. (c) A plot of the calculated and pre-dicted n115N(1H,2H) isotope shifts. The calculated data werederived from a best fit to an equation of the form (Ottiger and Bax,1997) n115N(1H,2 H)(i) = 0.191+ 0.065 sin(φi + 156)− 0.035sin(ψi + 61) ppm whereφi andψi are the dihedral angles, whichwere obtained using the X-ray structure. Fifty data points were used(residues 85–141 excluding all G, P and V138) and the correlationcoefficient is 0.32. For this number of data points, statistical signifi-cance at the 97.5% confidence level requires a correlation coefficient> 0.28 (Devore, 1991).
with much increased1H linewidths suggesting thatthe isotope shifts can be influenced by factors such aschemical exchange. We did not observe a correlationof long-range isotope shift with amino acid type.
1H amide transverse relaxation rates
There are several relaxation mechanisms expected tocontribute to amide1H transverse relaxation rates,1/T2 (= R2), in an aqueous sample of a {15N,2H}enriched protein. These are dipole–dipole interac-tions amongst all the solvent exchangeable1H–1H(R2(Hi–Hj )) and 1H-15N (R2(Hi–15Ni)) spin pairs,anisotropic chemical shift of the1H amide nuclei(R2(Hi CSA)) and a contribution from dipole–dipole
relaxation amongst the1H–2H spin pairs (R2(Hi–2Hj )). For a sample at pH 6.0 and 283 K, intermolec-ular chemical exchange with solvent may contributesignificantly to relaxation of those amide protonswhich are: (i) exposed to the solvent; (ii) have ap-propriate near neighbours (Bai et al., 1993); and (iii)are not involved in long-lived hydrogen bonds in ele-ments of secondary structure. A further contribution to1H line broadening may arise from exchange betweenseveral well populated sites at rates that only partiallyaverage any1H chemical shift differences.
The 1H transverse relaxation rate of an individ-ual amide, R2(Hi), can be expressed as the sumof the contributions from these individual relaxationprocesses. For this direct summation (Equation 1),1H-15N decoupling is assumed. Various possible crosscorrelations, transverse cross-relaxation from partiallyoverlapped resonances (Anet and O’Leary, 1990),intramolecular chemical exchange, the influence ofany remaining unresolvednJ (1H,2H) scalar couplingsvia scalar relaxation and the dynamic frequency shift(Werbelow, 1996; Tjandra et al., 1996) have beenneglected.
R2(Hi ) = R2(Hi −Hj )+ R2(Hi −2 Hj )
+R2(Hi −15 Ni)+ R2(HiCSA)
+kex+ R∗2 (1)
kex is a pseudo-first-order exchange rate with thesolvent;R∗2 represents a contribution to the lineshapefrom B0 inhomogeneities and incomplete15N decou-pling (Shaka et al., 1983). The individual relaxationterms can be defined in terms of spectral densities,Equations 2–5 (Abragam, 1960; McConnell, 1987),
R2(Hi −Hj ) ={(6π/5)(µ0/4π)2γ4
Hh̄2}
{5/6J (0)+ 3/2J (ωH)
+J (2ωH)}∑i 6=j
1/r6ij (2)
R2(Hi −2 Hj ) ={(16π/5)(µ0/4π)2γ2
Hγ2Dh̄
2}
{2/3J (0)+ 1/6J (ωH − ωD)
+J (ωD)+ 0.5J (ωH)+ J (ωH
+ωD)}∑j
1/r6ij (3)
264
R2(Hi −15 Ni) ={(6π/5)(µ0/4π)2γ2
Hγ2N
h̄2/r6NH
}{2/3J (0)
+1/6J (ωH − ωN)
+J (ωN)+ 0.5J (ωH)
+J (ωH + ωN)} (4)
R2(Hi CSA) = (8π/15)γ2HB
201σ(Hi)
2
{2/3J (0)+ 0.5J (ωH)} . (5)
In the equations above, and for all the followingcalculations and simulations, we neglect any inter-nal motions and assume a rigid protein undergoingisotropic motion. In this case the real part of the spec-tral density isJ (aω) = (1/4π) τr /(1+(aωτr)2); Equa-tion 5 assumes axial symmetry for the1H chemicalshift tensor.
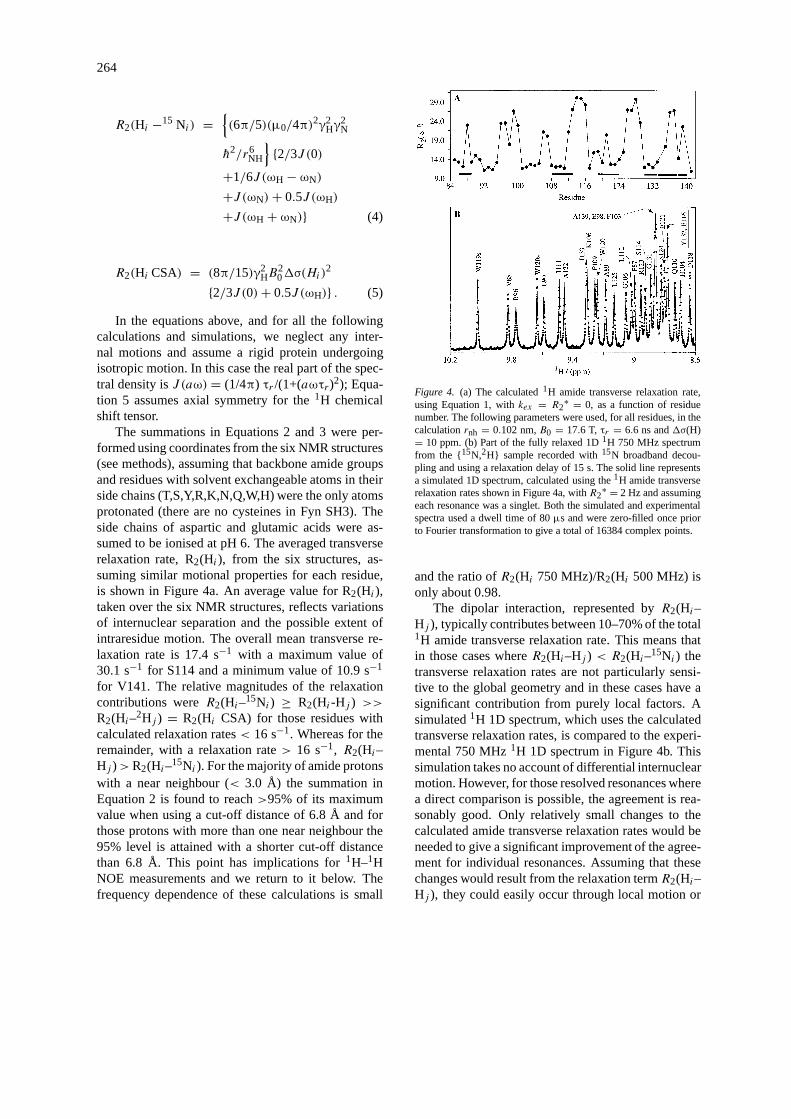
The summations in Equations 2 and 3 were per-formed using coordinates from the six NMR structures(see methods), assuming that backbone amide groupsand residues with solvent exchangeable atoms in theirside chains (T,S,Y,R,K,N,Q,W,H) were the only atomsprotonated (there are no cysteines in Fyn SH3). Theside chains of aspartic and glutamic acids were as-sumed to be ionised at pH 6. The averaged transverserelaxation rate, R2(Hi), from the six structures, as-suming similar motional properties for each residue,is shown in Figure 4a. An average value for R2(Hi),taken over the six NMR structures, reflects variationsof internuclear separation and the possible extent ofintraresidue motion. The overall mean transverse re-laxation rate is 17.4 s−1 with a maximum value of30.1 s−1 for S114 and a minimum value of 10.9 s−1
for V141. The relative magnitudes of the relaxationcontributions wereR2(Hi–15Ni) ≥ R2(Hi-Hj ) >>R2(Hi–2Hj ) = R2(Hi CSA) for those residues withcalculated relaxation rates< 16 s−1. Whereas for theremainder, with a relaxation rate> 16 s−1, R2(Hi–Hj )>R2(Hi–15Ni ). For the majority of amide protonswith a near neighbour (< 3.0 Å) the summation inEquation 2 is found to reach>95% of its maximumvalue when using a cut-off distance of 6.8 Å and forthose protons with more than one near neighbour the95% level is attained with a shorter cut-off distancethan 6.8 Å. This point has implications for1H–1HNOE measurements and we return to it below. Thefrequency dependence of these calculations is small
Figure 4. (a) The calculated1H amide transverse relaxation rate,using Equation 1, withkex = R2
∗ = 0, as a function of residuenumber. The following parameters were used, for all residues, in thecalculationrnh = 0.102 nm,B0 = 17.6 T, τr = 6.6 ns and1σ(H)= 10 ppm. (b) Part of the fully relaxed 1D1H 750 MHz spectrumfrom the {15N,2H} sample recorded with15N broadband decou-pling and using a relaxation delay of 15 s. The solid line representsa simulated 1D spectrum, calculated using the1H amide transverserelaxation rates shown in Figure 4a, withR2
∗ = 2 Hz and assumingeach resonance was a singlet. Both the simulated and experimentalspectra used a dwell time of 80µs and were zero-filled once priorto Fourier transformation to give a total of 16384 complex points.
and the ratio ofR2(Hi 750 MHz)/R2(Hi 500 MHz) isonly about 0.98.
The dipolar interaction, represented byR2(Hi–Hj ), typically contributes between 10–70% of the total1H amide transverse relaxation rate. This means thatin those cases whereR2(Hi–Hj ) < R2(Hi–15Ni ) thetransverse relaxation rates are not particularly sensi-tive to the global geometry and in these cases have asignificant contribution from purely local factors. Asimulated1H 1D spectrum, which uses the calculatedtransverse relaxation rates, is compared to the experi-mental 750 MHz1H 1D spectrum in Figure 4b. Thissimulation takes no account of differential internuclearmotion. However, for those resolved resonances wherea direct comparison is possible, the agreement is rea-sonably good. Only relatively small changes to thecalculated amide transverse relaxation rates would beneeded to give a significant improvement of the agree-ment for individual resonances. Assuming that thesechanges would result from the relaxation termR2(Hi–Hj ), they could easily occur through local motion or
265
because the set of NMR structures used for the cal-culations is not quite representative of local geometry.Relatively small changes to the internuclear distances,of about 10%, would be sufficient to improve the fitssignificantly. The rest of the 1D spectrum is not sim-ulated because of the dual problems of unassignedresonances and because some of the amide resonanceshave the same chemical shift as broad resonances fromside chains.
1H amide longitudinal relaxation rates
The longitudinal relaxation of a system of dipolarcoupled spins, assuming no dipolar cross correlationsor chemical exchange, is governed by the system ofcoupled differential equations, Equation 7, (Solomon,1955; Abragam, 1961)
d[I iz(t)
]/dt = −ρi(I iz(t)− I iz(∞))
−∑i 6=j
σij (Ijz (t)− I jz (∞)) (7)
whereI iz(t) andI jz (t) are the expectation values of the
Zeeman operatorsI iz and I jz ; I z(∞) refers to thermalequilibrium,ρi is the self-relaxation rate of spin i andσij is the cross-relaxation rate. Bothρi andσij can beexpressed in terms of spectral densities, Equations 8and 9,
ρi ={(6π/5)(µ0/4π)2γ4
Hh̄2}{1/3J (0)
+J (ωH)+ 2J (2ωH)}∑i 6=j
1/r6ij (8)
σij ={(6π/5)(µ0/4π)2γ4
Hh2}{−1/3J (0)
+2J (2ωH)} 1/r6ij . (9)
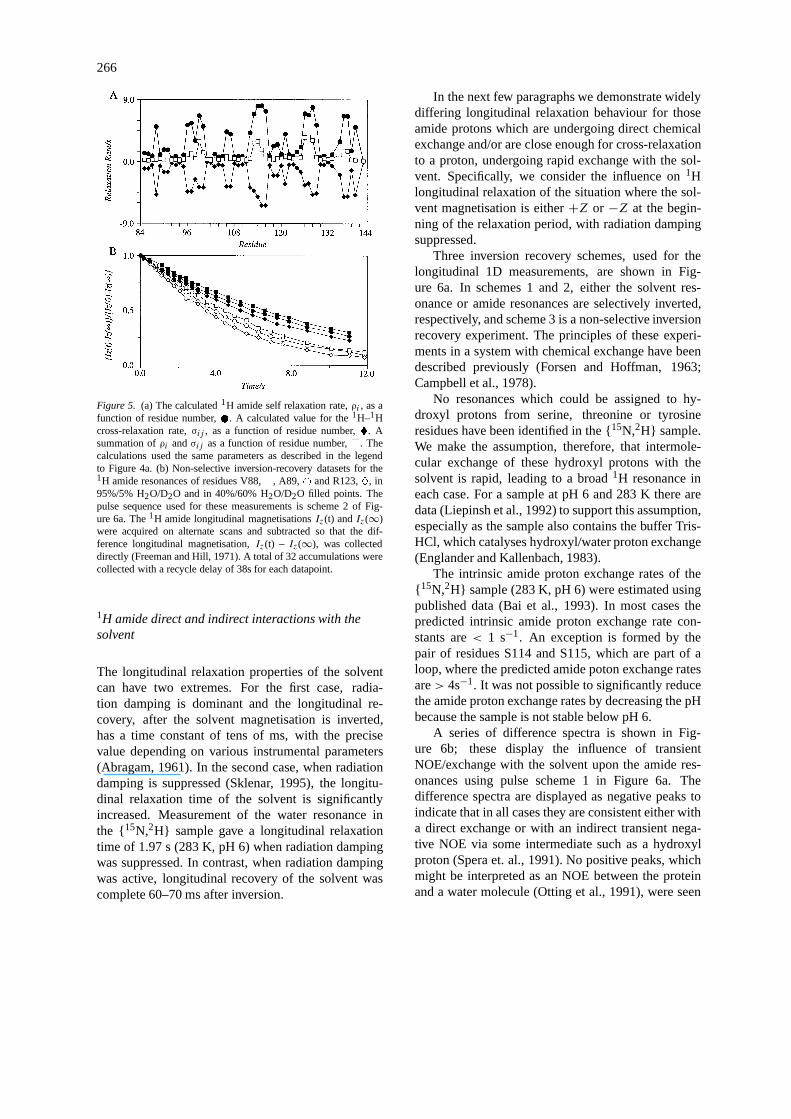
Employing a similar approach to that used for the cal-culation of the1H amide transverse relaxation rates,and with the same coordinate sets, the average calcu-lated value ofρi for the amide protons is shown inFigure 5a. Additional small contributions to the self-relaxation rate,ρi , of each amide have been addedfrom the dipolar1H–15N interaction, from1H chem-ical shift anisotropy and from a summation over the1H–2H spin pairs. In contrast to the1H amide trans-verse relaxation rates, the dipolar interactions betweenamide protons now contributes approximately 95%to the total amide self-relaxation rate. It is there-fore expected that both the self-relaxation rate and
the cross-relaxation rate will be sensitive to globalgeometry, with 4–10 neighbouring protons contribut-ing significantly to the longitudinal dipolar relaxation.Also shown in Figure 5a is a value, averaged overthe six coordinate sets, for the cross-relaxation rate,σij ; this calculation used only the nearest neighbourto the amide proton from each coordinate set to per-form the average. A summation of these two quantitiesis also shown. Some experimental data, recorded us-ing a non-selective inversion recovery sequence, areshown in Figure 5b. These examples are from amideprotons known to be involved in long-lived secondarystructure. Consequently there is negligible exchangebetween the amide proton and the solvent over the du-ration of these experiments. These decay curves areexpected to be non-exponential (Campbell and Free-man, 1973) and the solid lines are shown only to aidthe visualisation of each dataset. The decay of1H lon-gitudinal magnetisation for these resonances is seento be very slow compared to a fully protonated pro-tein. The longitudinal relaxation times can be furtherincreased simply by changing the solvent composition.In a 40%/60% H2O/D2O solvent mixture full longitu-dinal recovery for these protons would not be completeuntil after about 20 s (Figure 5b), and with this sol-vent composition the relative importance of the1H–1Hdipolar interactions is reduced compared to the otherrelaxation mechanisms.
For a fully protonated protein, cross-relaxationbetween protons is an important mechanism for longi-tudinal relaxation and this eventually leads to similarrelaxation rates being observed throughout the sam-ple (Kalk and Berendsen, 1976). In contrast, thedata from the non-selective inversion recovery experi-ment (95%/5% H2O/D2O) reported here show a widerange of1H relaxation rates. Complete proton recov-ery was observed to fall within the range of 2 s to15 s. This wide range of longitudinal relaxation ratesis consistent with slower relaxation processes, which,because of fewer spins at increased distances, do notgive sufficient time during the relaxation period foran equalisation of these rates. Consequently the lon-gitudinal relaxation of an amide proton is expectedto be dominated by the distance to the near neigh-bours and their relative motion. Before presenting datafrom homonuclear 2D NOESY experiments in supportof this proposal we highlight how chemical exchangeprocesses with the solvent can significantly reducethe longitudinal relaxation time of some amide1Hresonances and demonstrate how to increase this time.
266
Figure 5. (a) The calculated1H amide self relaxation rate,ρi , as afunction of residue number, . A calculated value for the1H–1Hcross-relaxation rate,σij , as a function of residue number,�. Asummation ofρi andσij as a function of residue number,�. Thecalculations used the same parameters as described in the legendto Figure 4a. (b) Non-selective inversion-recovery datasets for the1H amide resonances of residues V88,�, A89,# and R123,�, in95%/5% H2O/D2O and in 40%/60% H2O/D2O filled points. Thepulse sequence used for these measurements is scheme 2 of Fig-ure 6a. The1H amide longitudinal magnetisationsIz(t) andIz(∞)were acquired on alternate scans and subtracted so that the dif-ference longitudinal magnetisation,Iz(t) – Iz(∞), was collecteddirectly (Freeman and Hill, 1971). A total of 32 accumulations werecollected with a recycle delay of 38s for each datapoint.
1H amide direct and indirect interactions with thesolvent
The longitudinal relaxation properties of the solventcan have two extremes. For the first case, radia-tion damping is dominant and the longitudinal re-covery, after the solvent magnetisation is inverted,has a time constant of tens of ms, with the precisevalue depending on various instrumental parameters(Abragam, 1961). In the second case, when radiationdamping is suppressed (Sklenar, 1995), the longitu-dinal relaxation time of the solvent is significantlyincreased. Measurement of the water resonance inthe {15N,2H} sample gave a longitudinal relaxationtime of 1.97 s (283 K, pH 6) when radiation dampingwas suppressed. In contrast, when radiation dampingwas active, longitudinal recovery of the solvent wascomplete 60–70 ms after inversion.
In the next few paragraphs we demonstrate widelydiffering longitudinal relaxation behaviour for thoseamide protons which are undergoing direct chemicalexchange and/or are close enough for cross-relaxationto a proton, undergoing rapid exchange with the sol-vent. Specifically, we consider the influence on1Hlongitudinal relaxation of the situation where the sol-vent magnetisation is either+Z or −Z at the begin-ning of the relaxation period, with radiation dampingsuppressed.
Three inversion recovery schemes, used for thelongitudinal 1D measurements, are shown in Fig-ure 6a. In schemes 1 and 2, either the solvent res-onance or amide resonances are selectively inverted,respectively, and scheme 3 is a non-selective inversionrecovery experiment. The principles of these experi-ments in a system with chemical exchange have beendescribed previously (Forsen and Hoffman, 1963;Campbell et al., 1978).
No resonances which could be assigned to hy-droxyl protons from serine, threonine or tyrosineresidues have been identified in the {15N,2H} sample.We make the assumption, therefore, that intermole-cular exchange of these hydroxyl protons with thesolvent is rapid, leading to a broad1H resonance ineach case. For a sample at pH 6 and 283 K there aredata (Liepinsh et al., 1992) to support this assumption,especially as the sample also contains the buffer Tris-HCl, which catalyses hydroxyl/water proton exchange(Englander and Kallenbach, 1983).
The intrinsic amide proton exchange rates of the{ 15N,2H} sample (283 K, pH 6) were estimated usingpublished data (Bai et al., 1993). In most cases thepredicted intrinsic amide proton exchange rate con-stants are< 1 s−1. An exception is formed by thepair of residues S114 and S115, which are part of aloop, where the predicted amide poton exchange ratesare> 4s−1. It was not possible to significantly reducethe amide proton exchange rates by decreasing the pHbecause the sample is not stable below pH 6.
A series of difference spectra is shown in Fig-ure 6b; these display the influence of transientNOE/exchange with the solvent upon the amide res-onances using pulse scheme 1 in Figure 6a. Thedifference spectra are displayed as negative peaks toindicate that in all cases they are consistent either witha direct exchange or with an indirect transient nega-tive NOE via some intermediate such as a hydroxylproton (Spera et. al., 1991). No positive peaks, whichmight be interpreted as an NOE between the proteinand a water molecule (Otting et al., 1991), were seen

267
Figure 6. (a) The 3 pulse sequences used to monitor the longitudinal relaxation properties of the amide1H resonances. The first two columnsindicate which resonances are to be inverted prior to the longitudinal relaxation period.represents a selective 180◦, 2 ms, Gaussian-shapedRF waveform centred at the water frequency, andis a 180◦ non-selective RF pulse which is assumed to affect the water and amide resonancesidentically. The third column indicates the longitudinal relaxation period, which immediately follows the RF pulses and the fourth columnindicates the sequence of RF pulses applied after the longitudinal relaxation period prior to data collection. For the inversion recovery sequenceshown in scheme 3 the non-selective RF pulse is shown twice purely to indicate that both the water and amide resonances are inverted. Radiationdamping of the water magnetisation was suppressed, in those experiments where the water magnetisation can be described as−Iz just priorto the longitudinal relaxation period, by applying a weak single axis field gradient, Gz (0.002 Tm−1) (Sklenar 1995). G1SG1G2SG2 is thedouble pulse field gradient spin echo sequence of Huang and Shaka (Huang and Shaka, 1995) and included CYCLOPS (Hoult and Richards,1975) phase cycling. The acquisition period, Acq, includes broadband15N waltz16 decoupling. TheZ magnetisation of the solvent after theRF pulses and just prior to the longitudinal relaxation period was measured to be−0.95M0, 0.93M0 and−0.95M0 for pulse sequences 1, 2 and3 respectively. (b) A time series showing the amide proton resonances as a function of the longitudinal relaxation period recorded using pulsesequence 1 of Figure 6a. The resolution-enhanced 1D spectrum is also shown with the annotation indicating the assignment of the resonancesappearing in this time series (a S following a residue label indicates a resonance from a side chain). The1H amide longitudinal magnetisationswere acquired on alternate scans either with or without selective inversion of the water resonance and subtracted. A total of 160 accumulationswere collected for each dataset with a recycle delay of 15 s and the duration of the longitudinal relaxation period is indicated.
268
during the time course. The1H resonance assigned toS114 at 8.93ppm can be seen to have a large pertur-bation. These data also show that many resonancesare unperturbed, even with mixing times of severalseconds.
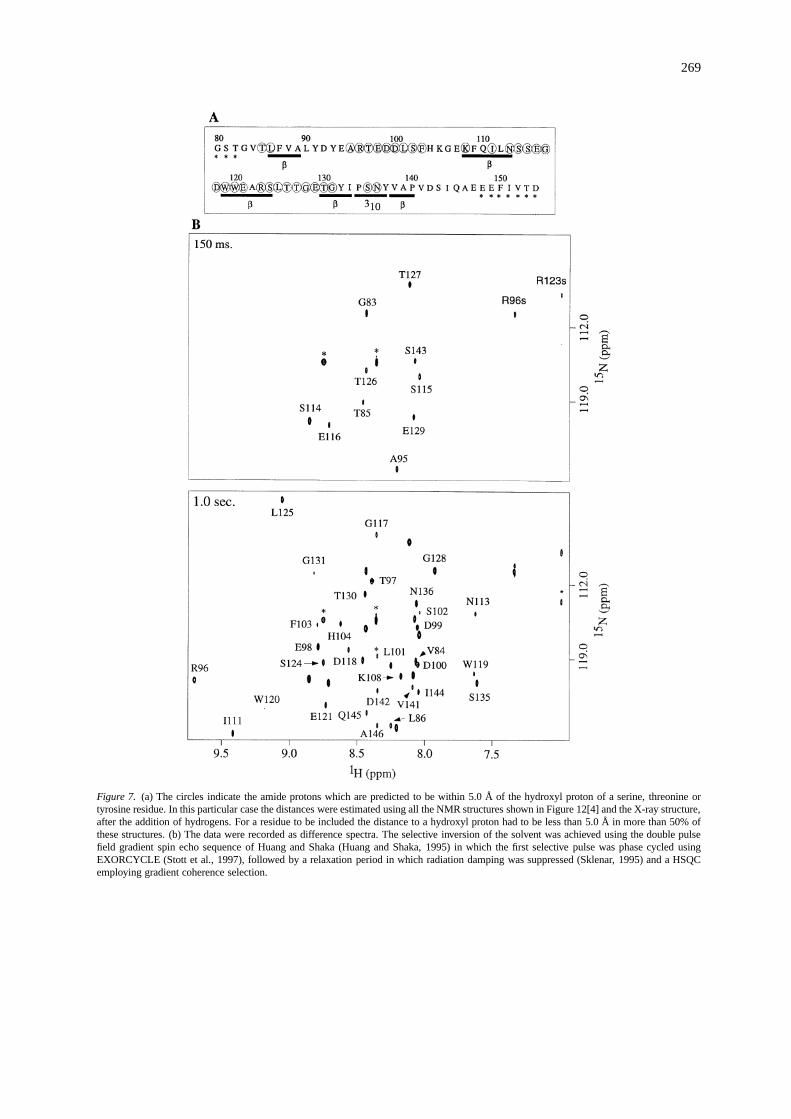
The amide protons predicted to be within 5.0 Åof a hydroxyl proton, from serine, threonine and ty-rosine, are indicated in Figure 7a. An improvementto the resolution is afforded by recording 2D15N–1H HSQC spectra at different longitudinal relaxationperiods after selective inversion of the solvent (Grze-siek and Bax, 1993; Wang et al., 1996). Two 2D15N–1H HSQC datasets are shown in Figure 7b. BothS114 and S115 give quite intense peaks after only ashort longitudinal relaxation delay. All of the assignedpeaks in these spectra, with two exceptions (H104and R123), are either from amides contained withinloops where the protons are presumably exposed tothe solvent, or are from amide protons predicted to bewithin 5.0 Å of a hydroxyl proton, from which signif-icant cross-relaxation could occur. For H104rNH,OHis, on average, calculated to be> 5 Å in 86% of thestructures and a resonance was observed, whereas, forR123,rNH,OH was calculated to be< 5 Å in 57% ofthe structures and no resonance was observed. For thisanalysis, we have only considered those amide reso-nances which have NMR or X-ray coordinates, whichexcludes some assigned resonances from the N- andC-termini which give rise to peaks in these spectra.
Figures 8a and 8b show inversion recovery timecourses for the amide protons of residues L125 andS114 as a function of the three separate pulse schemes.These data show that amide longitudinal recovery isslowed when both sets of resonances are inverted andsolvent radiation damping is supressed. Amide longi-tudinal magnetisation recovery is faster if the solventmagnetisation is aligned along+Z during the timecourse. In each case the solid lines are simulationswhich used different initial conditions and assumedsimilar motional properties for all the nuclei involved.For the simulations a longitudinal relaxation matrixwas constructed employing five of the nearest protonneighbours and the solvent. For S114 the five nearneighbours are the amide protons of N113, S115 andE116 with the side chain hydroxyl protons of S114and S115. For L125 the five neighbours are the amideprotons of S124, T126, and T127 with the side chainhydroxyl protons of S124 and T126. In most of thesix NMR structures these near neighbours were foundto make the primary contribution to1H-1H dipolar re-laxation. When averaged over the six NMR and X-ray
coordinate sets these five near-neighbour protons arecalculated to contribute about 57% and 88% to thetotal 1H–1H dipolar interactions of S114 and L125,respectively. For the simulations only the X-ray struc-ture was used to generate the inter-proton distances forthe calculation of the self- and cross-relaxation rates,via Equations 8 and 9. The other parameters used inthe simulations are shown in the legend to Figure 8. Itwas found that if the value used in the simulations forthe hydroxyl/proton exchange rate,koh, was> 25 s−1,the results were independent of whether the particularhydroxyl resonance is considered to have a chemicalshift in the amide region or at the solvent frequency.Simply by changing the initial conditions of the sim-ulations, the same parameters for either L125 or S114can simultaneously provide the fit for each experimen-tal dataset. A rather large number of parameters arerequired for these simulations, some of which have notbeen experimentally measured, so we do not proposethat the precise values are important, rather that thethree separate datasets can be modelled satisfactorilyin each case.
Those amide protons, from residues such as V88 orA89 which do not exchange with the solvent and arefurther than 5.0 Å from a hydroxyl group show no sig-nificant difference in longitudinal relaxation behaviourwhen using either pulse scheme 2 or 3 of Figure 6a(data not shown). We have thus demonstrated thatthe amide1H longitudinal relaxation rate can be verysensitive to the relaxation properties of the solvent.
2D NOESY spectra recorded with variable mixingtime
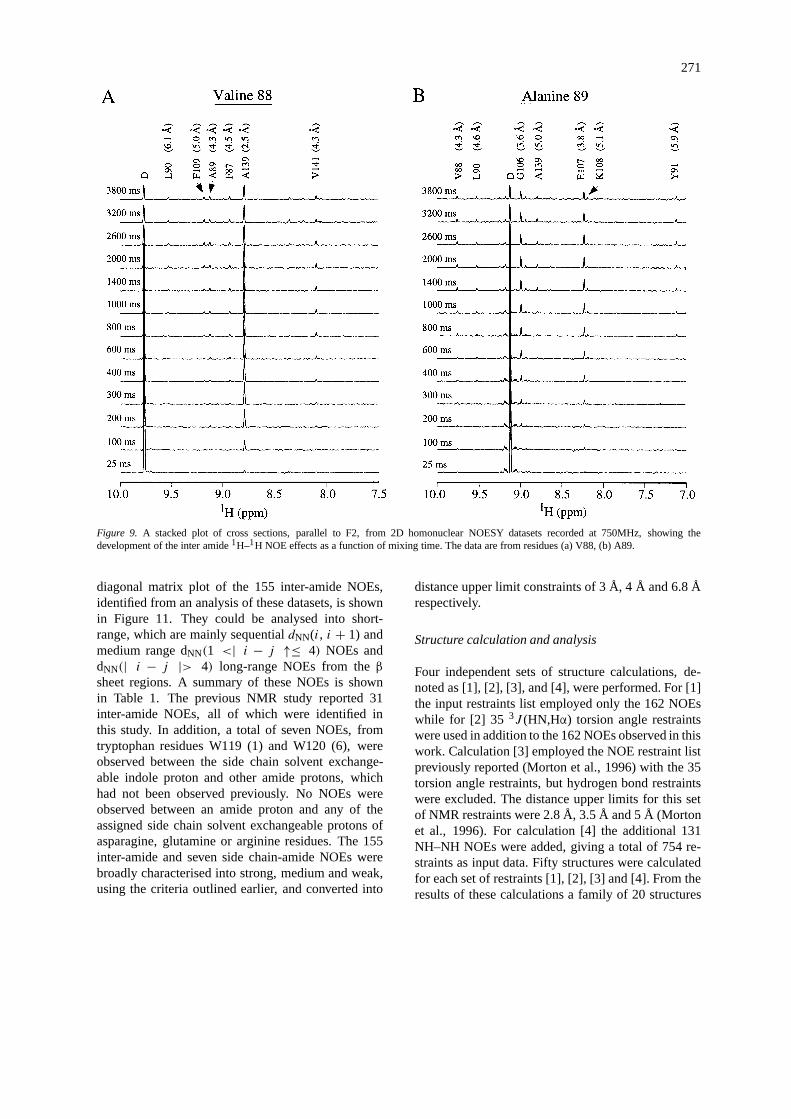
The data in Figure 9 illustrate the effect of varyingthe mixing time on the time dependence of the tran-sient inter-amide NOE effects for two residues, V88and A89. The mixing times range from 25ms to 3.8s,leading to identification of six and seven cross peaksfor V88 and A89, respectively. The numbers in brack-ets represent the distance, calculated from the X-raystructure after the addition of hydrogens (using X-PLOR), from the amide proton of either V88 or A89to the particular amide proton giving rise to the crosspeak. The observed cross peaks are localised to theamides within a distance of about 6.1 Å. Even at thelong mixing times these spectra retain the specificityof the local environment. Employing the NMR andX-ray coordinate sets shows that the indicated crosspeaks for V88 and A89 account for 99% and 93% ofthe total1H–1H dipolar interactions, respectively.
269
Figure 7. (a) The circles indicate the amide protons which are predicted to be within 5.0 Å of the hydroxyl proton of a serine, threonine ortyrosine residue. In this particular case the distances were estimated using all the NMR structures shown in Figure 12[4] and the X-ray structure,after the addition of hydrogens. For a residue to be included the distance to a hydroxyl proton had to be less than 5.0 Å in more than 50% ofthese structures. (b) The data were recorded as difference spectra. The selective inversion of the solvent was achieved using the double pulsefield gradient spin echo sequence of Huang and Shaka (Huang and Shaka, 1995) in which the first selective pulse was phase cycled usingEXORCYCLE (Stott et al., 1997), followed by a relaxation period in which radiation damping was suppressed (Sklenar, 1995) and a HSQCemploying gradient coherence selection.

270
Figure 8. (a) Inversion recovery measurements for the amide pro-ton of S114.�, selective inversion of the solvent using scheme1, , selective inversion of the amides using scheme 2,#,non-selective inversion using scheme 3. The solid lines are simula-tions to the experimental data which used the following parametersrNH = 0.102 nm,B0 = 17.6 T, τr = 6.6 ns,1σ(H) = 10 ppm,ρhoh = 0.507s−1, ρoh = 0.5s−1, koh = 35s−1, k114 = 2s−1,k115 = 1s−1, k116 = 0.2s−1 andk113 = 0.4s−1. For this simu-lation and that of Figure 8b the longitudinal relaxation matrix wasnot symmetric; however, all the eigenvalues and eigenvectors werereal in both cases. In order to improve the agreement between thesimulated and experimental data it was necessary to change theself relaxation rates from the values calculated using Equation 8.(b) Inversion recovery measurements for the amide proton of L125.The labelling of the separate datasets is similar to that above. Thesolid lines are simulations to the experimental data with parame-ters similar to above except,k125 = k126 = k127 = 0.1s−1 andk124= 0s−1.
The two sets of spectra are a representative selec-tion of the complete dataset. From other cross sectionsa few cross peaks were noted to occur between amideswith predicted separations up to about 7.0 Å. This isconsistent with the summations used to generate thedata for Figure 5, where it was noted that for themajority of the amide protons the summations hadreached at least 95% of their maximum value whenusing a cut-off distance of 6.8 Å. Cross peaks arenot expected between amides with separations muchgreater than 7.0 Å. From these and other cross sec-tions it is clear that, when using a mixing time ofabout 300 ms, the strong intensity cross peaks are fromneighbours withrij < 3 Å. Medium intensity crosspeaks, corresponding to distances in the range 3 Å< rij < 4 Å, become apparent with mixing times ofabout 600ms and weak cross peaks, corresponding to
distances in the range 4 Å< rij < 7 Å, are detectableat mixing times of about 1.2 s.
Figure 10 shows the diagonal and cross peak in-tensities, for some of the resonances of Figure 9, asa function of mixing time. Also shown in this figureare data from a non selective inversion recovery mea-surement. The solid lines are simulations employing7- and 8-spin longitudinal relaxation matrices incorpo-rating the amide protons from {V88, F87, A89, L90,F109, A139, V141} and {A89, V88, L90, Y91, G106,E107, K108, A139} for V88 and A89, respectively,and similar motional properties were assumed for allthe spins involved. For the calculation of the self andcross-relaxation rates with Equations 8 and 9, the X-ray coordinates were used to generate the necessaryinter-amide proton distances. All cross-correlation andchemical exchange effects were ignored. A contribu-tion to the self-relaxation rate was added from1Hchemical shift anisotropy,1H–15N dipolar interactionand from a summation over all possible1H–2H spinpairs. To improve the fits between the simulationsand the experimental data it was found necessary,for some residues, to adjust the value of the self-relaxation rates in the relaxation matrix from the valuecalculated using Equation 8. The values for the cross-relaxation rates were not altered from those calculatedusing equation 9. These changes arise in part becausethe data are being modelled as a rigid sphere un-dergoing isotropic motion. Once a set of parameterswas found, both the transient NOE time developmentand the inversion recovery measurements could befitted simultaneously, merely by changing the initialconditions in the simulation.
The reasonable agreement between the data andthe simulations indicates that even when employinglong mixing times the data can be interpreted satisfac-torily using only relatively few protons from the localenviroment. This is quite unlike the situation whichholds for a fully protonated protein, where for mixingtimes> 200 ms, the spectra become dominated bycross relaxation processes which would require muchlarger groupings of spins for their analysis (Kalk andBerendesen, 1976; James, 1994). We conclude thatit is possible to record NOESY spectra from a highlyenriched {15N,2H} labelled protein with long mixingtimes.
Collection of conformational restraints
3D HSQC-NOESY-HSQC datasets were collectedwith mixing times ranging from 10 ms to 1.2 s. A
271
Figure 9. A stacked plot of cross sections, parallel to F2, from 2D homonuclear NOESY datasets recorded at 750MHz, showing thedevelopment of the inter amide1H–1H NOE effects as a function of mixing time. The data are from residues (a) V88, (b) A89.
diagonal matrix plot of the 155 inter-amide NOEs,identified from an analysis of these datasets, is shownin Figure 11. They could be analysed into short-range, which are mainly sequentialdNN(i, i + 1) andmedium range dNN(1 <| i − j ↑≤ 4) NOEs anddNN(| i − j |> 4) long-range NOEs from theβsheet regions. A summary of these NOEs is shownin Table 1. The previous NMR study reported 31inter-amide NOEs, all of which were identified inthis study. In addition, a total of seven NOEs, fromtryptophan residues W119 (1) and W120 (6), wereobserved between the side chain solvent exchange-able indole proton and other amide protons, whichhad not been observed previously. No NOEs wereobserved between an amide proton and any of theassigned side chain solvent exchangeable protons ofasparagine, glutamine or arginine residues. The 155inter-amide and seven side chain-amide NOEs werebroadly characterised into strong, medium and weak,using the criteria outlined earlier, and converted into
distance upper limit constraints of 3 Å, 4 Å and 6.8 Årespectively.
Structure calculation and analysis
Four independent sets of structure calculations, de-noted as [1], [2], [3], and [4], were performed. For [1]the input restraints list employed only the 162 NOEswhile for [2] 35 3J (HN,Hα) torsion angle restraintswere used in addition to the 162 NOEs observed in thiswork. Calculation [3] employed the NOE restraint listpreviously reported (Morton et al., 1996) with the 35torsion angle restraints, but hydrogen bond restraintswere excluded. The distance upper limits for this setof NMR restraints were 2.8 Å, 3.5 Å and 5 Å (Mortonet al., 1996). For calculation [4] the additional 131NH–NH NOEs were added, giving a total of 754 re-straints as input data. Fifty structures were calculatedfor each set of restraints [1], [2], [3] and [4]. From theresults of these calculations a family of 20 structures
272
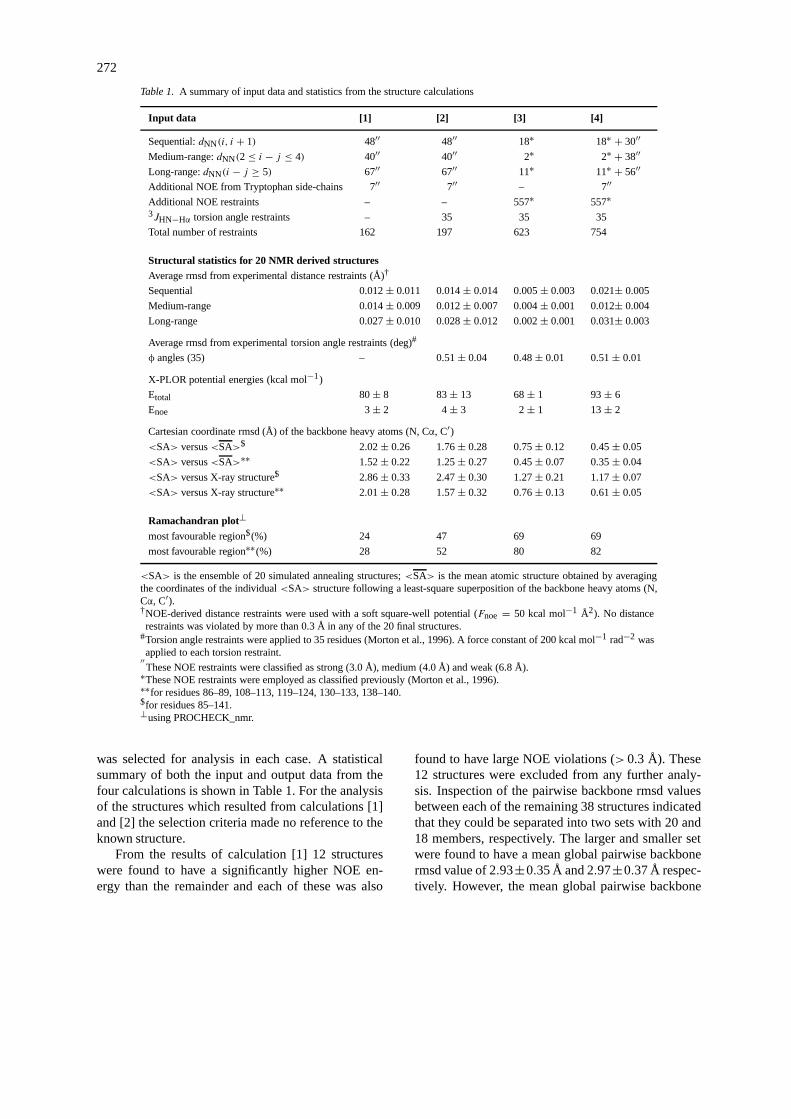
Table 1. A summary of input data and statistics from the structure calculations
Input data [1] [2] [3] [4]
Sequential:dNN(i, i + 1) 48′′ 48′′ 18∗ 18∗ + 30′′Medium-range:dNN(2≤ i − j ≤ 4) 40′′ 40′′ 2∗ 2∗ + 38′′Long-range:dNN(i − j ≥ 5) 67′′ 67′′ 11∗ 11∗ + 56′′Additional NOE from Tryptophan side-chains 7′′ 7′′ – 7′′Additional NOE restraints – – 557∗ 557∗3JHN−Hα torsion angle restraints – 35 35 35
Total number of restraints 162 197 623 754
Structural statistics for 20 NMR derived structuresAverage rmsd from experimental distance restraints (Å)†
Sequential 0.012± 0.011 0.014± 0.014 0.005± 0.003 0.021± 0.005
Medium-range 0.014± 0.009 0.012± 0.007 0.004± 0.001 0.012± 0.004
Long-range 0.027± 0.010 0.028± 0.012 0.002± 0.001 0.031± 0.003
Average rmsd from experimental torsion angle restraints (deg)#
φ angles (35) – 0.51± 0.04 0.48± 0.01 0.51± 0.01
X-PLOR potential energies (kcal mol−1)
Etotal 80± 8 83± 13 68± 1 93± 6
Enoe 3± 2 4± 3 2± 1 13± 2
Cartesian coordinate rmsd (Å) of the backbone heavy atoms (N, Cα, C′)<SA> versus<SA>$ 2.02± 0.26 1.76± 0.28 0.75± 0.12 0.45± 0.05
<SA> versus<SA>∗∗ 1.52± 0.22 1.25± 0.27 0.45± 0.07 0.35± 0.04
<SA> versus X-ray structure$ 2.86± 0.33 2.47± 0.30 1.27± 0.21 1.17± 0.07
<SA> versus X-ray structure∗∗ 2.01± 0.28 1.57± 0.32 0.76± 0.13 0.61± 0.05
Ramachandran plot⊥most favourable region$(%) 24 47 69 69
most favourable region∗∗(%) 28 52 80 82
<SA> is the ensemble of 20 simulated annealing structures;<SA> is the mean atomic structure obtained by averagingthe coordinates of the individual<SA> structure following a least-square superposition of the backbone heavy atoms (N,Cα, C′).†NOE-derived distance restraints were used with a soft square-well potential (Fnoe = 50 kcal mol−1 Å2). No distancerestraints was violated by more than 0.3 Å in any of the 20 final structures.
#Torsion angle restraints were applied to 35 residues (Morton et al., 1996). A force constant of 200 kcal mol−1 rad−2 wasapplied to each torsion restraint.′′These NOE restraints were classified as strong (3.0 Å), medium (4.0 Å) and weak (6.8 Å).∗These NOE restraints were employed as classified previously (Morton et al., 1996).∗∗for residues 86–89, 108–113, 119–124, 130–133, 138–140.$for residues 85–141.⊥using PROCHECK_nmr.
was selected for analysis in each case. A statisticalsummary of both the input and output data from thefour calculations is shown in Table 1. For the analysisof the structures which resulted from calculations [1]and [2] the selection criteria made no reference to theknown structure.
From the results of calculation [1] 12 structureswere found to have a significantly higher NOE en-ergy than the remainder and each of these was also
found to have large NOE violations (> 0.3 Å). These12 structures were excluded from any further analy-sis. Inspection of the pairwise backbone rmsd valuesbetween each of the remaining 38 structures indicatedthat they could be separated into two sets with 20 and18 members, respectively. The larger and smaller setwere found to have a mean global pairwise backbonermsd value of 2.93±0.35 Å and 2.97±0.37 Å respec-tively. However, the mean global pairwise backbone

273
Figure 10. (a) Dependence of the diagonal and some cross peakintensities for V88, using the data from Figure 9, as a function ofmixing time. V88 diagonal peak , A139 cross peak�, V141 crosspeak�, F109 cross peak�, L90 cross peak�, non-selective inver-sion recovery o. The solid lines are simulations to the experimentaldata withrNH = 0.102 nm,B0 = 17.6 T, τr = 6.6 ns,1σ(H) =10 ppm. (b) Dependence of the diagonal and some cross peak inten-sities for A89, using the data from Figure 9, as a function of mixingtime. A89 diagonal peak , G106 cross peak�, E107 cross peak�, Y91 cross peak�, V88 cross peak�, non-selective inversionrecovery o. The solid lines are simulations to the experimental datawhich used similar parameters to those for Figure 10a.
Figure 11. A diagonal plot representing the 162 inter-amide NOEsidentified from an analysis of 3D HSQC-NOESY-HSQC datasets.The inter-amide NOEs established in the previous NMR study(Morton et al., 1996) are shown as black circles. The filled trian-gles represent the NOEs involving the tryptophan side chain indoleprotons of residues W119 and W120.
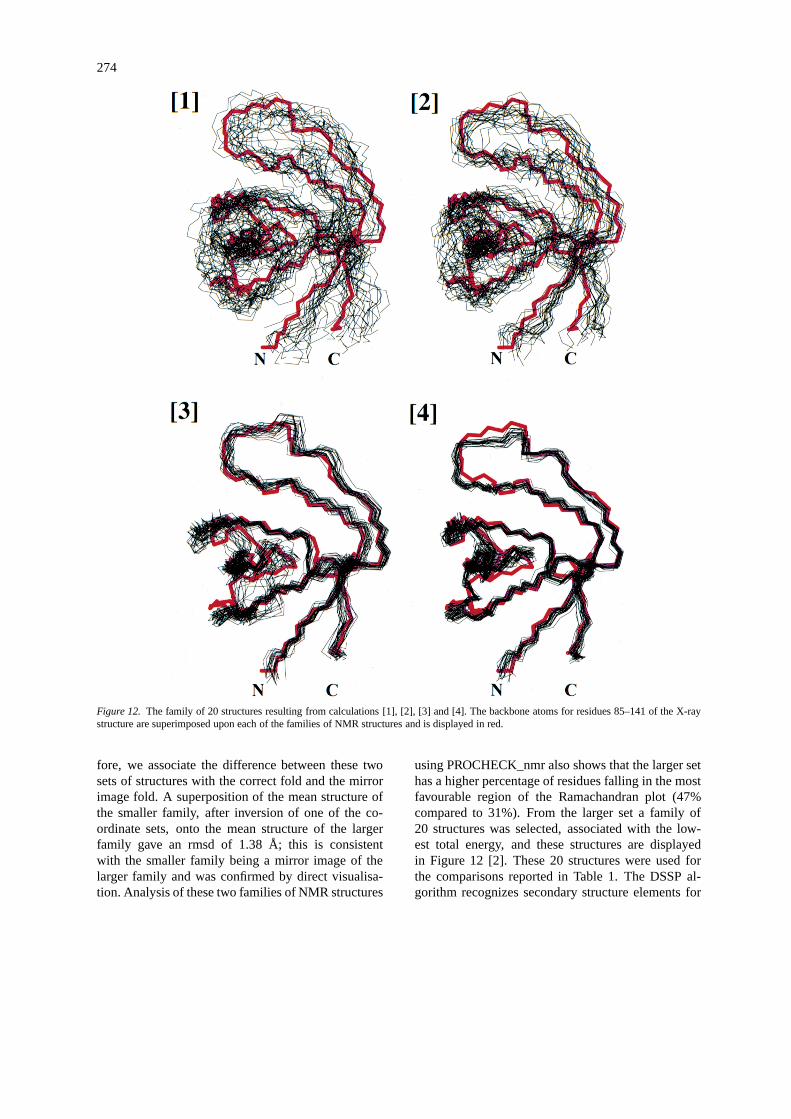
rmsd between these two sets was 6.31±3.30 Å. We as-sociate the difference between these two sets of struc-tures with the correct fold and the mirror image fold. Asuperposition of the mean structure of the smaller fam-ily, after inversion of one of the coordinate sets, ontothe mean structure of the larger family gave an rmsdof 1.01 Å; this is consistent with the smaller familybeing a mirror image of the larger family and was con-firmed by direct visualisation. Analysis of these twofamilies of NMR structures using PROCHECK_nmr(Laskowski et al., 1993) shows that the larger set hasa higher percentage of residues falling in the mostfavourable region of the Ramachandran plot (24%compared to 17%). From the larger set all 20 structureswere selected, and these are displayed in Figure 12 [1].The backbone atoms from the X-ray structure are alsodisplayed in Figure 12 [1] and this comparison showsthat the larger set of NMR structures is associated withthe correct fold. These 20 structures were used for thecomparisons reported in Table 1. The global fold ofthe compactβ barrel, which consists of two orthogonalβ-sheets (Noble et al. 1993 and Morton et al. 1996),is readily discernable in Figure 12 [1]. However, theDSSP algorithm of Kabsch and Sander (1983) doesnot completely identify the known secondary structureelements for any of the 20 NMR structures. We havecalculated much larger sets of structures than thosereported above, and in all cases it was found that theresulting family of structures could be separated intotwo classes, with the larger set always being identifiedwith the correct fold. Venters et al. (1995) have alsopointed out that, if a resonable number of inter-amideNOEs could be observed between protons up to about7 Å apart, then this NOE data set could be used tocalculate the global fold of a protein. The global foldhas been established here using, on average, 2.84 NOErestraints per residue.
From the results of calculation [2] ten structureswere found to have significantly higher NOE ener-gies than the remainder and each of these was alsofound to have a large NOE violation (>0.3 Å) with asignificantly higher total energy. These ten structureswere excluded from any further analysis. Inspectionof the pairwise backbone rmsd values between each ofthe remaining 40 structures indicated that they couldbe separated into two sets with 23 and 17 members,respectively. The larger and smaller set were foundto have a mean global pairwise backbone rmsd valueof 2.56± 0.37 Å and 2.97± 0.37 Å, respectively.However, the mean global pairwise backbone rmsdbetween these two sets was 6.02± 3.33 Å. As be-
274
Figure 12. The family of 20 structures resulting from calculations [1], [2], [3] and [4]. The backbone atoms for residues 85–141 of the X-raystructure are superimposed upon each of the families of NMR structures and is displayed in red.
fore, we associate the difference between these twosets of structures with the correct fold and the mirrorimage fold. A superposition of the mean structure ofthe smaller family, after inversion of one of the co-ordinate sets, onto the mean structure of the largerfamily gave an rmsd of 1.38 Å; this is consistentwith the smaller family being a mirror image of thelarger family and was confirmed by direct visualisa-tion. Analysis of these two families of NMR structures
using PROCHECK_nmr also shows that the larger sethas a higher percentage of residues falling in the mostfavourable region of the Ramachandran plot (47%compared to 31%). From the larger set a family of20 structures was selected, associated with the low-est total energy, and these structures are displayedin Figure 12 [2]. These 20 structures were used forthe comparisons reported in Table 1. The DSSP al-gorithm recognizes secondary structure elements for
275
residues 87–89, 109–111, 119–124, 131–133 and138–140. Thus, the additional backboneφ dihedralangle restraints based on the previously determinedexperimental3J (HN–Hα) values, have improved theprecision of the structure determination which is alsoevident from Table 1.
From the results of calculation [3] 20 structures,with the lowest total and NOE energies, were se-lected and these are shown in Figure 12 [3]. These 20structures were used for the comparisons reported inTable 1. These structures are similar to those reportedpreviously (Morton et al. 1996).
From the results of calculation [4] 20 structureswere selected with the lowest total energy and theseare shown in Figure 12 [4]. Analysis of the 20 fi-nal structures from calculations [3] and [4], usingPROCHECK_nmr, shows very little improvement inthe quality of stuctures after addition of extra in-teramide NOEs. This occurs because the NMR struc-tures from calculation [3] already show very few viola-tions of the Ramachandran allowed regions. However,the extra NOEs have reduced the rmsd compared tothe NMR structures from calculation [3] (see Table 1).Furthermore, within each family of 20 structures fromcalculations [3] and [4] the average pairwise back-bone rmsd for all residues was found to be 1.08 Åand 0.65 Å, respectively. This decrease to the pair-wise backbone rmsd value indicates that the addi-tional NOEs have improved the precision of the NMRstructures.
Conclusion
We have shown that studies of a highly enriched{ 15N,2H} protein can yield interesting new informa-tion. The accepted model for the spin diffusion limitin normal 1H-rich proteins, whereωτr � 1 is thatthe 1H relaxation of all the spins becomes uniform(Kalk and Berendsen, 1976). This is not observed ina sample with dilute1H spins and has allowed thedetection of local dipolar interactions between amideprotons up to 6 to 7 Å apart. This additional long-rangeNOE information can be used to provide additionalstructural restraints in the NMR structure refinementprocess. A second advantage is the significantly im-proved spectral resolution in the1H dimension of aperdeuterated sample; this may be particularly impor-tant in those systems, such as partially folded proteins,where the chemical shift dispersion is poor. We havealso shown that perdeuterated samples allow analy-
sis of the1H self-, cross- and transverse-relaxationcharacteristics. The results shown here suggest thatperdeuterated samples might also prove useful foriterative back-calculation structure refinements.
Acknowledgements
This work is a contribution from the Oxford Centrefor Molecular Sciences (OCMS), which is supportedby the BBSRC, EPSRC and MRC. The 750 MHzNMR instrument was partly funded by the LINKprotein engineering project with industrial partnersZeneca and Oxford Instruments. I.D.C. also thanksthe Wellcome Trust for financial support. T.K.M.thanks the INLAKS foundation for financial support.H.K. acknowledges funding from OCMS. We thankDr. C. Redfield for providing the program to calculateintrinsic amide exchange rates.
References
Abragam, A. (1961)Principles of Nuclear Magnetism, ClarendonPress, Oxford, U.K.
Anet, F.A.L. and O’Leary, D.J. (1990)J. Magn. Reson., 86, 358–370.
Bai, Y., Milne, J.S., Mayne, L. and Englander, S.W. (1993)Proteins,17, 75–86.
Bartels, C., Xia, T., Billeter, M., Güntert, P. and Wüthrich, K. (1995)J. Biomol. NMR, 6, 1–10.
Bodenhausen, G. and Ruben, D.J. (1980)Chem. Phys. Letts., 69,185–189.
Brünger, A.T. (1992)X-PLOR Manual v.3.1, Yale University, NewHaven, CT, USA.
Campbell, I.D. and Freeman, R. (1973)J. Magn. Reson., 11,143–162.
Campbell, I.D., Dobson, C.M., Ratcliffe, R.G and Williams, R.J.P.(1978)J. Magn. Reson., 29, 397–417.
Chothia, C. (1979)Nature, 254, 304–308.Cooke, M.P. and Perlmutter, R.M. (1989)New Biol., 1, 66–74.Crespi, H.L., Rosenberg, R.M. and Katz, J.J. (1968)Science, 161,
795–796.Devore, J.L. (1991)Probability and Statistics for Engineering and
Sciences, Duxbury Press, Belmont, California.Englander, S.W. and Kallenbach, N.R. (1983)Q. Rev. Biophys., 16,
521–655.Farmer, B.T. and Venters, R.A. (1995)J. Am. Chem. Soc., 117,
4187–4188.Forsen, S.H. and Hoffman, R.A. (1963)J. Chem. Phys., 39, 2892–
2901.Freeman, R. and Hill, H.D.W. (1971)J. Chem. Phys., 54, 3367–
3377.Frenkiel, T., Bauer, C., Carr, M.D., Birdsall, B. and Feeney, J.
(1990)J. Magn. Reson., 90, 420–425.Garcia de la Torre, J. and Bloomfield, V.A. (1981)Quart. Rev.
Biophys., 14, 81–139Garcia de la Torre, J., Navarro, S., Lopez Martinez, M.C., Diaz, F.G.
and Lopez Cascales, J.J. (1994)Biophys. J., 67, 530–531.
276
Gardner, K.H., Rosen, M.K., and Kay, L.E. (1997)Biochemistry,36, 1389–1401.
Grzesiek, S. and Bax, A. (1993)J. Am. Chem. Soc., 115, 12593–12594.
Grzesiek, S. and Bax, A. (1993)J. Biomol. NMR, 3, 627–638.Grzesiek, S., Wingfield, P., Stahl, S., Kaufman, J.D. and Bax, A.
(1995)J. Am. Chem. Soc., 117, 9594–9595.Hoult, D.J. and Richards, R.E. (1975)Proc. R. Soc. London A, 344,
311–340.Huang, T. and Shaka, A.J. (1995)J. Magn. Reson. Ser. A, 112, 275–
279.James, T.L. (1994)Methods of Enzymology, Volume 239C, p. 416.Jameson, C.J. (1996)Encyclopaedia of Nuclear Magnetic Reso-
nance, (Ed.) Grant, D.M. and Harris, R.R.Isotope Effects onChemical Shifts and Coupling constants, pp. 2638–2655.
Kabsch W. and Sander C. (1983)Biopolymers, 22, 2577–2637.Kalk, A. and Berendson, H.J.C. (1976)J. Magn. Reson., 24, 343–
365.Kay, L.E., Keifer, P., and Saarinen, T. (1992)J. Am. Chem. Soc.,
114, 10663–10665.Koradi, R., Billeter, M. and Wuthrich, K. (1996)J. Mol. Graphics.,
14, 51–55.Laskowski, R.A., MacArthur, M.W., Moss, D.S., and Thornton,
J.M. (1993)J. Appl. Crystallogr., 26, 283–291.Le Master, D.M. and Richards, F.M. (1988)Biochemistry, 27, 142–
150.Liepinsh, E., Otting, G. and Wuthrich, K. (1992)J. Biomol NMR, 2,
447–465.Markley, J.L., Putter, I. and Jardetzky, O. (1968)Science, 161,
1249–1251.Markus, M.A., Dayie, K.T., Mastsudaira, P. and Wagner, G. (1994)
J. Magn. Reson. Ser. B, 105, 192–195.McConnell, J. (Ed.) (1987)The Theory of Nuclear Magnetic Relax-
ation in Liquids, Cambridge University Press, Cambridge.Morton, C.J., Pugh, D.J.R., Brown, E.L.J., Kahmann, J.D., Renzoni,
D.A.C., and Campbell, I.D. (1996)Structure, 4, 705–714.Muchmore, S.W., Sattler, M., Liang, H., Meadows, R. P., Harlan,
J.E., Yoon, H.S., Nettesheim, D., Chang, B.S., Thompson, C.B.,Wong, S.L., Ng, S.C., and Fesik, S.W. (1996)Nature, 381, 355–341.
Nietlispach, D., Clowes, R.T., Broadhurst, W., Ito, Y., Keeler, J.,Kelly, M., Ashurst, J., Oschkinat, H., Doamille, P.J. and Laue,E.D. (1996)J. Am. Chem. Soc., 118, 407–415.
Noble, M.E.M., Musacchio, A., Saraste, M., Courtneidge, S.A. andWieranga, R.K. (1993)EMBO J., 12, 2617–2624.
Ottiger, M. and Bax, A. (1997)J. Am. Chem. Soc., 119, 8070–8075.Otting, G., Liepnish, E., Farmer II, B.T., and Wuthrich, K. (1991)J.
BioMol. NMR, 1, 209–215.Sattler, M., Liang, H., Nettesheim, D., Meadows, R.P., Harlan,
J.E., Eberstadt, M., Yoon, H.S., Shuker, S.B., Chang, B.S., Minn,
A.J., Thompson, C.B., and Fesik, S.W. (1997)Science, 275,983–986.
Shaka, A.J., Keeler, J. and Freeman, R. (1983)J. Magn. Reson., 53,313–340.
Sklenar, V. (1995)J. Magn. Reson. Ser. A, 114, 132–135.Smith, B.O., Ito, Y., Raine, A., Teichmann, S., Ben-Tovim, L., Ni-
etlispach, D. Broadhurst, R.W., Terada, T., Kelly, M., Oschkinat,H., Shibata, T., Yokoyama, S., and Laue, E.D. (1996)J. BioMol.NMR, 8, 360–368.
Soffe, N., Boyd, J., and Leonard, M. (1996)J. Magn. Reson. Ser. A,116, 117–121.
Solomon, I. (1955)Phys. Rev., 99, 559–565.Spera, S., Ikura, M., and Bax, A. (1991)J. Biomol. NMR, 1, 155–
165.Stott, K., Keeler, J., Van, N.Q., and Shaka, A.J. (1997)J. Magn.
Reson., 125, 302–324.Tjandra, N., Grzesiek, S., and Bax, A. (1996)J. Am. Chem. Soc.,
118, 6264–6272.Tjandra, N., Szabo, A., and Bax, A. (1996)J. Am. Chem. Soc., 118,
6986–6991.Torchia, D.A., Sparks, S.W., and Bax, A. (1988)J. Am. Chem. Soc.,
110, 2320–2321.Tsang, P., Wright, P.E., and Rance, M. (1990)J. Am. Chem. Soc.,
112, 8183–8185.Venters, R.A., Metzler, W.J., Spicer, L.D., Mueller, L., and Farmer,
B.T. (1995)J. Am. Chem. Soc., 117, 9592–9593.Venters, R.A., Farmer, B.T., Fierke, C.A., and Spicer, L.D. (1996)
J. Mol. Biol., 264, 1101–1116.Wang, Y., Darøon, F.I., Grzesiek, S., Torchia, D. A., Wingfield, P.T.,
Kaufman, J.D., Stahl, S.J., Chang, C. and Hodge, C.N. (1996)Biochemistry, 35, 12694–12704.
Werbelow, L. (1996)Encyclopaedia of Nuclear Magnetic Reso-nance, (Ed.) Grant, D.M. and Harris, R.R.Dynamic FrequencyShift, pp. 1776–1783.
Wüthrich, K (1986)NMR of Proteins and Nucleic Acids, Wiley,New York.
Yamazaki, T., Lee, W., Arrowsmith, C.H., Muhandiram, D.R., andKay, L.E. (1994)J. Am. Chem. Soc., 116, 11655–11666.
Yamazaki, T., Tochio, H., Furui, J., Aimoto, S., and Kyogoku, Y.(1997)J. Am. Chem. Soc., 119, 872–880.
Yu, L., Petros, A.M., Schnuchel, A., Zhong, P., Severin, J.M., Wal-ter, K., Holzman, T.F. and Fesik, S.W. (1997)Nat. Struct. Biol.,4, 483–489.
Zhang, H., Zhao, D., Revington, M., Lee, W., Jia, X., Arrowsmith,C. and Jardetzky, O. (1994)J. Mol. Biol., 238, 592–612.
Zhou, M.M, Ravichandran, K.S., Olejniczak, E.T., Petros, A.M.,Meadows, R.P., Sattler, M., Harlan, J. E., Wade, W.S., Burakoff,S.J. and Fesik, S.W. (1995)Nature, 378, 584–592.
Copyright © 2022 FDOKUMEN