Geometric Structure Determination of N694C Lipoxygenase: A Comparative Near-Edge X-Ray Absorption...
19
Geometric Structure Determination of N694C Lipoxygenase: A Comparative XAS Near-Edge and EXAFS Study Ritimukta Sarangi § , Rosalie K. Hocking † , Michael L. Neidig † , Maurizio Benfatto ‡,* , Theodore R Holman ⊥ , Edward I. Solomon †,§ , Keith O. Hodgson †,§ , and Britt Hedman §,* † Department of Chemistry, Stanford University, Stanford, CA, 94305, USA ‡ Laboratori Nazionali di Frascati dell’ INFN, C.P. 13, 00044 Frascati, Italy ⊥ Department of Chemistry and Biochemistry, University of California, Santa Cruz, California 95064 § Stanford Synchrotron Radiation Laboratory, SLAC, Stanford University, Stanford, CA, 94309, USA Abstract The mononuclear non-heme iron active site of N694C soybean lipoxygenase (sLO1) has been investigated in the resting ferrous form using a combination of Fe K-pre-edge, near-edge (using MXAN full multiple-scattering approach) and EXAFS methods. The results indicate that the active site is six coordinate (6C) with a large perturbation in the first shell bond distances in comparison to the more ordered octahedral site in wild type sLO1. Upon mutation of the asparigine to cystiene, the short Fe-O interaction with asparigine is replaced by a weak Fe-(H 2 O) which leads to a distorted 6C site with an effective 5C ligand field. In addition, it is shown that near-edge multiple scattering analysis can give important three-dimensional structural information, which usually cannot be accessed using EXAFS analysis. It is further shown that relative to EXAFS, near-edge analysis is more sensitive to partial coordination numbers and can be potentially used as a tool for structure determination in a mixture of chemical species. 1. Introduction Extended X-ray absorption fine structure is a powerful technique for local structure determination on systems in both solution and solid (amorphous and crystalline) states. 1–3 Traditionally EXAFS has been applied to a broad range of scientific fields, especially for systems that cannot be obtained in the crystalline form for X-ray diffraction measurements. The EXAFS region typically extends from ~50 to 1500 eV above the edge inflection of the X- ray absorption spectrum, however, the magnitude of the EXAFS signal is reduced rapidly with energy. This imposes potential limitations, for example, i) at low absorber concentration, sufficient signal-to-noise at higher energies may not be obtained, constraining the data range, ii) photoreduction and beam damage may impair multiple scan averaging for low-concentration samples or, iii) inherently weak EXAFS signals, which inhibit data collection to high energies. These limitations are in particular applicable to non-heme iron proteins, which usually have irregular first shell (N/O) ligation and cannot be obtained at higher concentrations. 3 The near- edge region of an XAS spectrum (~−10 to 200 eV) successfully overcomes the concentration and weak signal limitations in such systems. Also, since good quality near-edge data can be collected significantly faster, beam damage and photoreduction can be minimized. The near- edge fitting methodology implemented into the MXAN code (Minuit X-ray Absorption Near- *Authors to whom correspondence should be addressed. E-mail: [email protected] (B.H.); [email protected] (M.B). NIH Public Access Author Manuscript Inorg Chem. Author manuscript; available in PMC 2009 December 15. Published in final edited form as: Inorg Chem. 2008 December 15; 47(24): 11543–11550. doi:10.1021/ic800580f. NIH-PA Author Manuscript NIH-PA Author Manuscript NIH-PA Author Manuscript
Transcript of Geometric Structure Determination of N694C Lipoxygenase: A Comparative Near-Edge X-Ray Absorption...
Geometric Structure Determination of N694C Lipoxygenase: AComparative XAS Near-Edge and EXAFS Study
Ritimukta Sarangi§, Rosalie K. Hocking†, Michael L. Neidig†, Maurizio Benfatto‡,*, TheodoreR Holman⊥, Edward I. Solomon†,§, Keith O. Hodgson†,§, and Britt Hedman§,*† Department of Chemistry, Stanford University, Stanford, CA, 94305, USA‡ Laboratori Nazionali di Frascati dell’ INFN, C.P. 13, 00044 Frascati, Italy⊥ Department of Chemistry and Biochemistry, University of California, Santa Cruz, California 95064§ Stanford Synchrotron Radiation Laboratory, SLAC, Stanford University, Stanford, CA, 94309, USA
AbstractThe mononuclear non-heme iron active site of N694C soybean lipoxygenase (sLO1) has beeninvestigated in the resting ferrous form using a combination of Fe K-pre-edge, near-edge (usingMXAN full multiple-scattering approach) and EXAFS methods. The results indicate that the activesite is six coordinate (6C) with a large perturbation in the first shell bond distances in comparison tothe more ordered octahedral site in wild type sLO1. Upon mutation of the asparigine to cystiene, theshort Fe-O interaction with asparigine is replaced by a weak Fe-(H2O) which leads to a distorted 6Csite with an effective 5C ligand field. In addition, it is shown that near-edge multiple scatteringanalysis can give important three-dimensional structural information, which usually cannot beaccessed using EXAFS analysis. It is further shown that relative to EXAFS, near-edge analysis ismore sensitive to partial coordination numbers and can be potentially used as a tool for structuredetermination in a mixture of chemical species.
1. IntroductionExtended X-ray absorption fine structure is a powerful technique for local structuredetermination on systems in both solution and solid (amorphous and crystalline) states.1–3
Traditionally EXAFS has been applied to a broad range of scientific fields, especially forsystems that cannot be obtained in the crystalline form for X-ray diffraction measurements.The EXAFS region typically extends from ~50 to 1500 eV above the edge inflection of the X-ray absorption spectrum, however, the magnitude of the EXAFS signal is reduced rapidly withenergy. This imposes potential limitations, for example, i) at low absorber concentration,sufficient signal-to-noise at higher energies may not be obtained, constraining the data range,ii) photoreduction and beam damage may impair multiple scan averaging for low-concentrationsamples or, iii) inherently weak EXAFS signals, which inhibit data collection to high energies.These limitations are in particular applicable to non-heme iron proteins, which usually haveirregular first shell (N/O) ligation and cannot be obtained at higher concentrations.3 The near-edge region of an XAS spectrum (~−10 to 200 eV) successfully overcomes the concentrationand weak signal limitations in such systems. Also, since good quality near-edge data can becollected significantly faster, beam damage and photoreduction can be minimized. The near-edge fitting methodology implemented into the MXAN code (Minuit X-ray Absorption Near-
*Authors to whom correspondence should be addressed. E-mail: [email protected] (B.H.); [email protected](M.B).
NIH Public AccessAuthor ManuscriptInorg Chem. Author manuscript; available in PMC 2009 December 15.
Published in final edited form as:Inorg Chem. 2008 December 15; 47(24): 11543–11550. doi:10.1021/ic800580f.
NIH
-PA Author Manuscript
NIH
-PA Author Manuscript
NIH
-PA Author Manuscript
Edge) which has been developed by Benfatto et al., has been successfully applied to severalsmall inorganic molecules.4–7 In a recent study, the full multiple scattering theory implementedin MXAN was applied to [Cu(TMPA)(OH2)](ClO4), which is a model complex that mimicsthe active site of cytochrome c oxidase (CcO).8 It was shown that MXAN was successful insimulating the near-edge spectrum and in describing the complex multiple-scattering from theTMPA ligand system. In addition, it was shown that the multiple scattering approach issensitive to small structural and angular variations.
Lipoxygenases (LO’s),9–13 which are non-heme iron containing enzymes with mixed N/Odonor ligands, are systems challenged by the abovementioned EXAFS limitations. Althoughtwo different crystal structures of soybean lipoxygenase (sLO) have described the restingferrous active site as six-coordinate (6C) (three histidine ligands (His), the C-terminalisoleucine (Ile) ligated to the Fe with the free carboxylate oxygen, H2O and a weakly coupledasparigine (Asn) ligand)14,15 and/or strongly distorted four-coordinate (4C) (considering onlythe four strongly coordinating first shell ligands, i.e. three His and the free carboxylate oxygenof the C-terminal Ile),16 a combination of CD (circular dichroism) and MCD (magnetic circulardichroism) studies,17 which is a powerful technique to identify the coordination number basedon ligand field analysis, indicated that the ferrous site is a mixture of five-coordinate (5C) andsix-coordinate (6C), in a 40/60 ratio which becomes 6C upon glycerol addition. This has beenconfirmed by EXAFS measurements on WT sLO in the presence of 30% glycerol.17
In this study, the MXAN near-edge multiple-scattering method has been used, at the Fe K edge,in combination with pre-edge and EXAFS analysis to study the ferrous form of the N694Cmutant of lipoxygenase. In this mutant, the weakly coordinating first-coordination sphereamino acid Asn694 has been replaced by a potentially strongly coordinating cysteine ligand.CD and MCD studies indicate that the ferrous site is 5C and remains 5C upon glycerol binding.18 However, in the absence of a crystal structure there are several structural possibilities for a5C site. These structural possibilities (elaborated in the Results and Analysis section) havebeen evaluated using this combined XAS analysis approach. The results indicate that the activesite is distorted 5+1C with a weakly coordinated axial H2O at an Fe-O distance of 2.5 Å, andthat this weak coordination of the water molecule to the ferrous center retains an approximately5C ligand field (in the presence of glycerol). It is shown that the near-edge multiple scatteringapproach can differentiate between structural models proposed by EXAFS and can be used asa powerful structural tool if adequate EXAFS data are not available.
2. Experimental Section2.1 Sample Preparation
Site-directed mutagenesis, overexpression, and purification of N694C sLO followed a protocoloutlined previously.19 N694C was purified with a yield of 2–4 mg/L, with a metal content of55 ± 10%. N694C was concentrated and 30% (v/v) glycerol was added to form an opticalquality glass with a final FeII concentration of ~ 1 mM. The enzyme sample was then transferredunder an inert atmosphere wet-box to an XAS sample cell and frozen immediately in liquidnitrogen.
2.2 X-ray Absorption SpectroscopyThe X-ray absorption spectra of N694C mutant of LO were measured at the StanfordSynchrotron Radiation Laboratory on the focused 16-pole 2.0 T wiggler beam line 9-3 and theunfocussed 8-pole 1.8 T wiggler beam line 7-3 under standard ring conditions of 3 GeV and60–100 mA. A Si(220) double crystal monochromator was used for energy selection. A Rh-coated harmonic rejection mirror and a cylindrical Rh-coated bent focusing mirror were usedfor beam line 9-3 whereas the monochromator was detuned 50% at 7998 eV on beam line 7-3
Sarangi et al. Page 2
Inorg Chem. Author manuscript; available in PMC 2009 December 15.
NIH
-PA Author Manuscript
NIH
-PA Author Manuscript
NIH
-PA Author Manuscript
to reject components of higher harmonics. The protein solutions were loaded into 1 mm luciteXAS cells with X-ray transparent ~37 μm Kapton windows. The samples were immediatelyfrozen thereafter and stored under liquid N2 conditions. During data collection, the sample wasmaintained at a constant temperature of 10 K using an Oxford Instruments CF 1208 liquidhelium cryostat. Fluorescence mode was used to measure data to k = 15 Å−1 using a 30-elementGe solid-state detector windowed on the Fe Kα signal. Internal energy calibration wasaccomplished by simultaneous measurement of the absorption of an Fe-foil placed betweentwo ionization chambers situated after the sample. The first inflection point of the foil spectrumwas assigned to 7111.2 eV.
Data represented here are a 21-scan average spectrum, which was processed by fitting a second-order polynomial to the pre-edge region and subtracting this from the entire spectrum asbackground. A three-region spline of orders 2, 3 and 3 was used to model the smoothly decayingpost-edge region. The data were normalized by subtracting the cubic spline and by assigningthe edge jump to 1.0 at 7120 eV using the SPLINE program in the XFIT suite of programs.20
2.3 Pre-Edge Data AnalysisLeast squares fit were performed using the EDG_FIT program21 to quantify the intensity andenergy of the pre-edge feature. The pre-edge features were modeled using 50:50Lorentzian:Gaussian pseudo-Voigt functions. The rising-edge background was modeled usinga pseudo-Voigt function, which mimicked the white line associated with the edge transition.Additional pseudo-Voigt peaks were also used to mimic shoulders on the rising edge. The datawere fit over several different energy regions. The least-square error and a comparison of thesecond derivatives of the data and fit were used to determine the goodness of fit. The standarddeviations in energy and intensity over all successful fits were used to quantify errors in theseparameters.
2.4 Near-Edge Data AnalysisThe near-edge simulations were performed using MXAN,4,7 which performs a full multiple-scattering analysis of the data to obtain structural information.7,22 The following programs areintegrated in MXAN: VGEN, a generator of Muffin-tin potential, the CONTINUUM code forfull multiple-scattering cross-section calculation and the MINUIT routines of the CERN libraryfor parameter optimization. The starting structures used in the simulations were generated bymodifying the crystal structure of wild-type sLO.15 Several starting structures were consideredwhich included both five-coordinate (5C) and six-coordinate (6C) Fe centers. The data werefit over the −5 eV to 190 eV energy range (0 eV is defined at 7130 eV). In the refinement, allatoms belonging to the histidine rings were moved rigidly linked to the N atom coordinated tothe Fe. In the first step of the optimization process, only the bond distances were allowed tofloat. In subsequent steps the dihedral angles were also allowed to float. After each step ofstructural parameter refinement, a non-structural parameter refinement was performed. Manyapplications of MXAN to small molecule XAS data indicate that the correlation betweenstructural and non-structural parameters is small. Nevertheless, the refinements were closelymonitored for any large fluctuations in the structural and non-structural parameters during therefinement process. No large deviations in either the structural or the non-structural parameterswere observed. The least-square error and a visual comparison of data and fit were used todetermine the goodness of fit.
2.5 EXAFS Data AnalysisTheoretical EXAFS signals χ(k) were calculated using FEFF (version 7.0)23,24 and the crystalstructure of wild-type LO as initial model, and were fit to the data using EXAFSPAK (G. N.George, SSRL).21 Theoretical paths corresponding to Fe-S and Fe-O distances of 2.1–3.0 Å(in 0.1 Å steps) were also calculated to simulate contributions of the S(Cys) to the EXAFS
Sarangi et al. Page 3
Inorg Chem. Author manuscript; available in PMC 2009 December 15.
NIH
-PA Author Manuscript
NIH
-PA Author Manuscript
NIH
-PA Author Manuscript

signal. For both paths, the best fit distance was added to the active site in the crystal structureof wild-type LO and a new set of theoretical χ(k) were calculated using FEFF and the data refitusing the new parameters. The structural parameters varied during the fitting process were thebond distance (R) and the bond variance σ2, which is related to the Debye-Waller factorresulting from thermal motion, and static disorder. The non-structural parameter E0 (the energyat which k =0) was also allowed to vary but was restricted to a common value for everycomponent in a given fit. Coordination numbers were systematically varied in the course ofthe fit but were fixed within a given fit.
3. Results and Analysis3.1 Fe K Pre-Edge
The Fe K pre-edge results from a quadrupole-allowed dipole-forbidden 1s→3d transition.These transitions are usually very weak (~100 times weaker than the edge) but can gainintensity when the coordination deviates from centrosymmetry and gains dipole-allowedcharacter due to Fe 4p mixing into the Fe 3d orbitals, as 1s→4p transitions are electric-dipoleallowed.25 It has been shown by extensive studies on small molecule model complexes thatthe energy position and intensity pattern of the pre-edge transitions are signatures of theoxidation state and ligand coordination, respectively.25–27 Ferrous 6C (Oh) complexestypically have a total integrated area of ~4 units over the pre-edge transition range. In 4C and5C complexes the center of inversion is absent, leading to more intense pre-edge transitions,typically by a factor of 3–4. 4C and 5C complexes can be differentiated on the basis of theintensity distribution of the pre-edge transitions.
The Fe K pre-edge spectrum of ferrous N694C LO is compared to that of ferrous PAHT (wild-type phenylalanine hydroxylase (PAH)) and PAHR (substrate and cofactor bound PAH) inFigure 1 (Inset).28 It has been shown using X-ray absorption, circular dichroism (CD) andmagnetic circular dichroism (MCD) studies that the Fe center in PAHT and PAHR are 6C and5C, respectively.29 The total integrated area under the pre-edge transitions of N694C LO,PAHT and PAHR are 11.8(0.8), 8.1(0.4) and 13.9(0.8), respectively.30 The individual peakenergy and intensity of N694C LO, PAHT and PAHR are listed in Table 1. The total integratedintensity of N694C LO is similar to that of PAHR indicating that the active site Fe is 5C. Theseresults are consistent with MCD data for N694C LO, which also indicate that the active site inN694C LO is consistent with a 5C ligand field.18 However, the intensity ratio of the two pre-edge features is 1.44, which is closer to a 6C complex than a 5C complex (the intensity ratioof the pre-edge features in PAHR and PAHT are 1.61 and 1.39, respectively, see Figure S1).In strictly 5C C4v complexes, the lower energy pre-edge feature associated with an Fe 1s→dz
2 (A1 symmetry) transition, gains intensity due to Fe 4pz (A1 symmetry) mixing with thedz
2 orbital. However, in protein environments the active site can deviate considerably from anideal C4v geometry due to differences in ligands or the presence of a weak sixth ligand.31 Thislowers the symmetry and the higher energy pre-edge feature can also gain intensity throughFe 4px,y mixing with the dx
2-y2 orbital. This indicates that the active site in N694C LO is more
distorted than that in PAHR.
Figure 1 shows a comparison of the rising edge region of N694C LO, PAHT and PAHR. Theintensity of the peak at ~7126 eV is lower and similar for N694C LO and PAHR compared toPAHT. Since the intensity of this peak is characteristic of the number and type of first shellligands,32 the edge data of N694C LO indicates a ligand field consistent with a 5C structureand with the pre-edge data and MCD studies.
Sarangi et al. Page 4
Inorg Chem. Author manuscript; available in PMC 2009 December 15.
NIH
-PA Author Manuscript
NIH
-PA Author Manuscript
NIH
-PA Author Manuscript
3.2 EXAFS RegionThe EXAFS data for N694C LO was Fourier transformed over k = 2–12.5 Å−1. The EXAFSand the Fourier transform data are compared with that of the wild type (WT) sLO in Figure2.33 The EXAFS for WT sLO has a phase-shift to lower k relative N694C sLO similar to therelative phase shift in PAHT (6C) and PAHR (5C).29 The first shell Fourier transform intensityhas decreased by almost a factor of two in N694C LO relative to WT sLO. Both the WT sLOand N694C sLO data were collected in the presence of ~30% glycerol as the glassing agent.In the case of WT sLO, it has been shown using CD, MCD and K-pre-edge studies that in thepresence of glycerol (or alcohols) the active site structure shifts from a 5C/6C (40%/60%)mixture to a purely 6C form. First shell Fourier-filtered EXAFS fits were also consistent withthese results indicating 6 Fe-O/N contributions at ~2.16 Å17 The EXAFS fits have been refinedhere using a full multiple scattering approach. The best fit to the WT-LO EXAFS and thecorresponding Fourier transforms are presented in Figure S2, with the fit parameters given inTable S1. The first shell is fit using 6 Fe-O/N contributions at 2.18 Å.
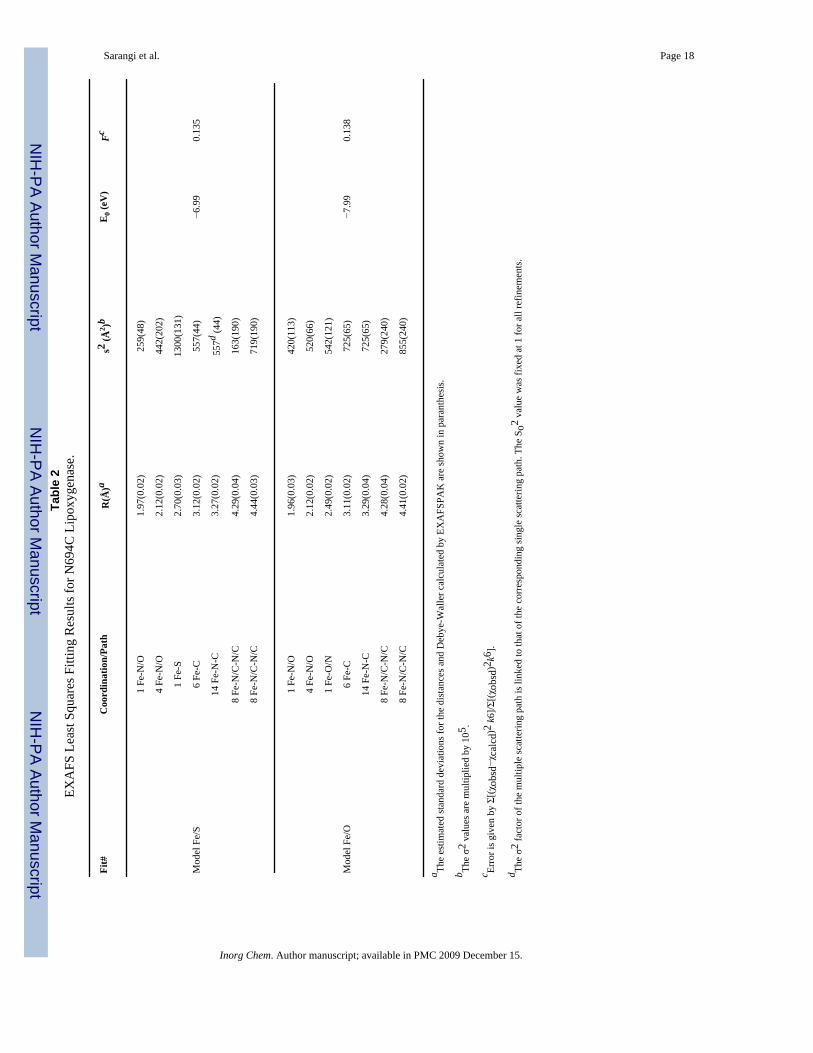
In N694C LO, asparigine 694 is replaced by a cysteine residue. Thus, the weakly coordinatingamide oxygen is replaced by a thiolate S(Cys) group which can potentially coordinate stronglywith the Fe atom. However, due to the smaller size of S(Cys) relative to O(Asn), its approachto the ferrous center is restricted by the backbone in N694C sLO, compared to the more flexibleapproach of the amide O of asparigine in the WT sLO. This might create a possible pocket fora H2O molecule in N694C sLO which can coordinate to the Fe atom as a sixth ligand.34 Boththese possibilities were explored using appropriate models to generate theoretical EXAFSsignals χ(k) using FEFF. The fits to the EXAFS data using both these models and thecorresponding Fourier transforms are shown in Figure 3A and 3B. The best-fit parameters arepresented in Table 2. The Fe/S model was generated by including an Fe-S contribution at 2.7Å in the input structure.35 Using this model, the first shell was fit using 1 Fe-O/N path at 1.97Å, 4 Fe-O/N paths at 2.12 Å and 1 Fe-S at 2.70 Å.36 The second and third shells were fit usingsingle and multiple scattering contributions arising from the histidine ring N and C atoms. Theσ2 value for the Fe-S path (Table 2) was high indicating that, if present, the long Fe-Scontribution is disordered. Fits using a coordination number of less than 1 for the Fe-S pathimproved the σ2 value but did not affect the goodness of the fit, consistent with a putativedisordered Fe-S bond. For the fits to the Fe/O model, which was generated using a structurethat included an Fe-O path at 2.5 Å, the best fit was consistent with 1 Fe-O path at 1.96 Å, 4Fe-O/N paths at 2.12 Å and 1 Fe-O path at 2.49 Å. The second and third shells were fit usingsingle and multiple scattering contributions arising from the histidine ring N and C atoms.Good fits were obtained when the third shell was been modeled with two sets of 8 Fe-N/C-N/C multiple scattering components (adding the single scattering path did not improve the fit).However, the correlation between the bond distances and the σ2-factors for these two multiplescattering paths were quite high, which might lead to the unusually low σ2-factor value for themultiple scattering path at 4.28/4.29 Å. The correlation matrix obtained from the EXAFS fitsto both the Fe/O and Fe/S model are included in the supporting information (bond distance=correlation between parameters 32 and 37 and sigma values= correlation parameters 33 and38).
The σ2 value of the Fe-O path at 2.5 Å is moderately high which also indicates that, if the Ois present, the Fe-O bond is disordered. The goodness of fit was very similar for both the Fe/S and Fe/O models. Thus, the EXAFS study indicates that the first shell is composed of 1+4Fe-N/O paths and a weakly coordinated Fe-O or Fe-S path, which is disordered. This isconsistent with the observed intensity distribution and the total area for the pre-edge transitions,since a five-coordinate site with a weak sixth interaction would have a symmetry lower thanOh and would gain allowed character from 4p mixing into the 3d manifold, which would
Sarangi et al. Page 5
Inorg Chem. Author manuscript; available in PMC 2009 December 15.
NIH
-PA Author Manuscript
NIH
-PA Author Manuscript
NIH
-PA Author Manuscript
increase the intensity; and the presence of a weak interaction would change the intensitydistribution from that observed for a pure C4v species.
Thus, the EXAFS analysis indicates that the structure is distorted 6C with a weak sixth ligand,which can either be a distant Fe-O or Fe-S interaction. The Fe-S interaction would result fromthe S(Cys694) while the Fe-O interaction could result from two possibilities: i) a watermolecule or, ii) reorientation of the ligated carboxylate group of the isoleucine to bind in anasymmetric bidentate fashion. Since the angular information available from EXAFS analysisis limited, both structural models for the Fe/O case are possible.
3.3 Near-Edge RegionTo investigate the presence and nature of the weak sixth ligand, near-edge simulations wereperformed using MXAN, which uses a multiple scattering approach to simulate the edge region.4 The N694C LO data were fit to 200 eV above the edge. Fits were first performed using the5C active site structure obtained from the WT crystal structure. An iterative fit process ofstructural and non-structural parameters was performed, with the goodness-of-fit assessed asthe square residual error (Rsq).8 The Rsq for the 5C fit was 1.2. Figure S3 shows the best fitusing the 5C structure, with the structural parameters given in Table S2 (SupportingInformation). Fits were then performed by using both the Fe/S and Fe/O models (see theEXAFS section). For the Fe/S model, the simulations were very sensitive to the inclusion ofan Fe-S component between 2.3–3.0 Å and the resultant fits were considerably worse (Figure4A) with an Rsq value of 3.9. Compared to the XAS spectra of a metal with O/N only ligands,there is usually a dramatic change in the XAS spectra of metal-S containing molecules, bothin the rising edge and the near-edge region which is usually associated with an increase incovalent interaction between the metal and sulfur. Since the near-edge fit results cannotaccommodate an Fe-S interaction, it provides a clear indication that Cys694 is not ligated toFe in the resting ferrous state. Using the Fe/O model, two input structures were generated. Inthe WT crystal structure the carboxylate group (Ile) is asymmetrically coordinated with 1 Fe-O at 2.28 Å and the second Fe-O at 3.49 Å. The loss of the Asn ligand in N694C sLO mightlead to a perturbation in the two Fe-O(Ile) bond distances, which can become shorter tocompensate for the loss of the axial asparigine while still retaining their asymmetriccoordination. Thus, the first input structure generated has two carboxylate Fe-O distances at2.1 Å and 2.5 Å consistent with the two Fe-O bond distances obtained from the EXAFS dataanalysis. The second input structure consisted of a 6C structure with an axial Fe-O interactionat 2.5 Å representing an additional water molecule. Near-edge simulations using theasymmetric bidentate carboxylate structure resulted in an Rsq value of 3.7 (Figure 4B). Thisindicates that the carboxylate is coordinated in a monodentate fashion to the ferrous center witha sixth weak water ligand. Since the 6C fit with an asymmetric isoleucine carboxylate is worsethan the 5C fit, near-edge simulations were performed with a sixth axial interaction at 2.5 Å(the equatorial plane is described by the 2 N(His), 1 O(Glu) and 1 O(H2O)). It has been shownthat such axial M-O bonds are sensitive to dihedral angle made by the M-O bond with theequatorial plane.8 Thus, the structure obtained from the 5C best fit was modified to obtainvarious 6C structures which included an Fe-O component at 2.5 Å and made different dihedralangles with the equatorial plane (see Figure S4, Supporting Information). These structures werethen used to obtain structural and non-structural fits to the near-edge data. Figure 5 shows thedata and best-fit spectrum. The inset shows the optimized structure, and the structuralparameters are presented in Table 2.37 The best fit corresponds to an axial Fe-O distance of2.50 Å, which is in good agreement with the EXAFS data. All the other first shell bond distancesare in reasonable agreement with the EXAFS result. The Rsq value is 0.53, which isconsiderably better than that for the bidentate carboxylate, and the Fe/S model stronglyindicating the presence of a weak long Fe-O coordination. It should be noted that since thenear-edge calculations are performed within the full multiple scattering approach, i.e., since
Sarangi et al. Page 6
Inorg Chem. Author manuscript; available in PMC 2009 December 15.
NIH
-PA Author Manuscript
NIH
-PA Author Manuscript
NIH
-PA Author Manuscript
the inverse of the scattering path operator was computed exactly, (avoiding any ‘a-priori’selection of the relevant multiple scattering paths) the individual contribution of the histidinemultiple scattering paths cannot be obtained. However, as seen from the insets in Figure 3 and4 (and cartesian coordinates given in supporting information), the orientation of the histidinerings remain reasonably similar in fits to the Fe/O and Fe/S models indicating that the increasein error value on going from the Fe/O to the Fe/S model results predominantly due to thereplacement of the Fe-O with the Fe-S contribution. It is interesting to note that fits to both theFe/O and Fe/S models are reasonably good in the low R region in the EXAFS analysis butdiffer significantly in the near-edge analysis. This is accounted for by the following factors: a)It has been previously observed that an Fe-S contributions affect the edge significantly due toconsiderable changes in the electronic structure. This is exploited by near-edge fitting routineimplemented in MXAN, which calculates the inverse of the scattering path operator, exactlyand treats the low energy region better; b) the Debye-Waller damping factor is not applicableto the near-edge fitting method using MXAN, thus, a “forced adjustment” of a longer Fe-Sbond is not possible using a large sigma value and c) the EXAFS data are only available to k=12.5 Å−1 (typical for dilute non-heme iron proteins) which restricts our ability to distinguishbetween theoretically generated models with small differences.
Fits to EXAFS data usually give a 25% error in coordination number due to the strongcorrelation between the σ2 value and the bond distance. In addition, partial coordination(presence of a mixture of two components) can be explored using non-integer coordinationnumbers in the EXAFS fits. However, an exact two-component fit is currently unavailable innear-edge simulations using MXAN. To explore a 5C/6C mixture in N694C LO using near-edge simulations, a linear combination of the best fit 5+1C and the 5C model was performedwithin a window of 10%6C/90%5C and 90%6C/10%5C. These simulations were then
compared to the data and the error (e) was obtained as .
Figure S5 (black line) (Supporting Information) shows the change in error value with anincrease in the 5C component. A corresponding EXAFS fit with non-integer Fe-O coordinationwas also performed and the change in error value with an increase in 5C component is shownin Figure S5 (red line). These results clearly indicate that the molecule is 5+1C with noobservable pure 5C component. Interestingly, the error for 10% to 50% 5C component (higheramount of 5C component leads to unreasonable σ2 values) remains very similar for the EXAFSfits while that for MXAN shows a clear decrease in the goodness of fit. This indicates thatedge-fitting is more sensitive to partial coordination number. Thus, these results emphasize thesensitivity of the multiple scattering method in fitting the near-edge region and obtaininggeometric structure information, in particular angular information, which is usuallyinaccessible using EXAFS.
4. Discussion4.1 Geometric Structure of N694C sLO1
In this study, a combination of pre-edge, near-edge and EXAFS studies have been performedon N694C sLO to determine the active site geometric structure. These results indicate that theferrous center is 5+1C with a weak Fe-O(H2O) coordination at 2.5 Å. It is interesting to notethat the MCD results indicate that the site is 5C with two ligand field bands at 6050 cm−1 and11450 cm−1, although the MCD studies indicate a small increase in the ligand-field on goingfrom WT to N694C sLO. This discrepancy in the MCD and XAS results stem from the factthat a long Fe-O distance at 2.5 Å does not affect the bonding significantly enough to be seenas a coordination number change in MCD. However the small shift in the MCD bands to higherenergy indicates an increase in ligand field, reflecting a presence of a weak sixth ligand.
Sarangi et al. Page 7
Inorg Chem. Author manuscript; available in PMC 2009 December 15.
NIH
-PA Author Manuscript
NIH
-PA Author Manuscript
NIH
-PA Author Manuscript

Both the WT and N694C sLO EXAFS data were measured in the presence of ~30% glycerol.It has been shown in previous studies that glycerol converts the resting site (5C) to 6C, whichis similar to the structural change observed upon substrate binding.17 This indicates thatmutation of the weakly coordinated asparigine ligand to the smaller S(Cys) ligand removes theability of the protein to convert into a 6C structure upon substrate binding. This is importantin the reactivity of the protein since this 5C to 6C conversion, which is attributed to thecoordination flexibility in the site, plays a key role in the catalytic rate. The weakly boundH2O molecule keeps the site 5+1C in both resting and substrate bound forms in N694C sLO1.The presence of this H2O molecule likely modifies the H-bonding network between the secondsphere residues by introducing a H-bond between E697 and the H2O molecule.38 This H-bondreplaces the one lost between E697 and N694 due to mutation. Thus, although the substratedocking associated with the H-bond network might not be perturbed significantly, the substratebound active site structure (simulated by the presence of glycerol) changes dramaticallybetween WT and N694C sLO as observed from a comparison of the EXAFS data (see Figure2). This leads to the observed ~3000 fold decrease in the catalytic rate in N694C lipoxygenaserelative to WT sLO.18
4.2 Comparison of Edge and EXAFS AnalysisThe results presented in this study show that near-edge analysis can be used to complementEXAFS results and even give structural information inaccessible by EXAFS analysis. InN694C lipoxygenase the two six-coordinate models involving a sixth oxygen atom, an axialwater or a bidentate carboxylate of the Ile residue, can only be evaluated using a full multiplescattering approach, which is capable of determining three-dimensional structural information.At this point it is important to evaluate the maximum number of independent parameters (IP)and the reliability of the fit for the EXAFS and near-edge MXAN analysis. In the EXAFS
region IP can be directly calculated using the relation . 39 For the N694Clipoxygenase EXAFS data IP is ~20. The Ip number used in the EXAFS analysis presentedhere is 15, which is well within the upper-limit of Ip that can be used to obtain an acceptableEXAFS fit.
In the edge region, however, since the mean free path of the photoelectron is very large, themultiple scattering contributions can extend up to ~10 Å. This can exponentially increase thenumber of possible single- and multiple-scattering contributions to the edge region. Inclusionof all these paths can lead to structure-optimization problems since the possibility of reachinga local minimum for a system with a large number of independent parameters also increasesrapidly. In the near-edge analysis presented here, single and multiple scattering contributionsup to 4.5 Å have been considered, using 18 structural and 4 non-structural parameters,respectively. It has been shown that the structural and non-structural parameters have very lowcorrelation, thus, the number of independent structural parameters in this analysis is ~18. Tojustify the use of atoms up to 4.5 Å from the central ferrous atom, a shell-by-shell analysis ispresented in Figure 6, which shows multiple scattering contribution up to 2.6 Å (Figure 6A),3.5 Å (Figure 6B) and 4.5 Å (Figure 6C, final fit). For each shell, the structural parameterswere allowed to float. The 2.6 Å fit is very poor with an Rsq of 6.5. While the 3.5 Å modelreasonably fits the experimental spectral features (Rsq =1.7), the final 4.5 Å fit range (Rsq=0.53) is essential to obtain the double-peak feature between 50–80 eV. Thus, the resultsindicate that multiple-scattering contributions up to 4.5 Å are essential to successfully modelthe rising-edge and near-edge region. This is in agreement with the EXAFS data, which requiremultiple-scattering contribution from the Cβ and Nβ in the 4–4.5 Å range for a good fit.However, it is not sufficient to show that multiple-scattering contributions from atoms at agiven distance are important to fit the edge-data. Structural parameters in a fit can be highlycorrelated leading to fits that do not represent the global minimum. The correlation matrix
Sarangi et al. Page 8
Inorg Chem. Author manuscript; available in PMC 2009 December 15.
NIH
-PA Author Manuscript
NIH
-PA Author Manuscript
NIH
-PA Author Manuscript
between the free parameters can be obtained using the MINUIT code implemented in theMXAN package and that for the best-fit shown in Figure 6C and Figure 5 is presented in theSupporting Information. The matrix indicates low correlation between most parameters andsupports the fact that the structural fit obtained using MXAN is physically justifiable. It isimportant to note that examination of the correlation-matrix is important in EXAFS fittingprocedures also, and can give an estimate of the softness of the best-fit structural parameters.Often, a particular bond distance in the EXAFS fit is closely correlated with its correspondingσ2 value. Since the a-priori estimation of σ2s for individual systems is not yet possible, anacceptable range of values is available for any particular absorber-scatterer pair based onEXAFS analysis on small models. However, this range of acceptable σ2 values is quite largeand, in some cases can lead to large errors in bond-distance estimation, especially in the caseof second and third shell single- and multiple-scattering. In most cases, a combination ofchemical knowledge and close inspection of the statistical parameters at every step of the fittingprocess is important for accurate structure determination.
In summary, this study describes the application of multiple-scattering edge-fittingmethodology to a non-heme ferrous active site of the N694C mutant of lipoxygenase. It isshown that edge-fitting analysis can give important three-dimensional structural information,which usually cannot be accessed using EXAFS analysis. In particular, for systems which aresubject to limitations that can severely affect the resolution and accuracy of EXAFS analysis.In addition, since the σ2 damping terms in the XANES energy region are almost temperature-independent, atomic vibrations have negligible effects and do not interfere with structuredetermination. This allows precise determination of partial coordination numbers and can behelpful in determining different compositions in mixtures.
Supplementary MaterialRefer to Web version on PubMed Central for supplementary material.
AcknowledgmentsThis work was supported by NIH grants RR-01209 (K.O.H.), DK-31450 (E.I.S.) and GM56062-06 (T.R.H.). SSRLoperations are funded by the Department of Energy, Office of Basic Energy Sciences. The SSRL Structural MolecularBiology program is supported by the National Institutes of Health, National Center for Research Resources, BiomedicalTechnology Program and by the Department of Energy, Office of Biological and Environmental Research.
References1. Stern, EA. EXAFS, SEXAFS and XANES. Koningsberger, DC.; Prins, R., editors. John Wiley & Sons;
New York: 1988. p. 12. Teo, BK. EXAFS: Basic Principles and Data Analysis. Springer-Verlag; 1986.3. Zhang, HH.; Hedman, B.; Hodgson, KO. Inorganic Electronic Structure and Spectroscopy, Volume
1: Methodology. Solomon, EI.; Lever, ABP., editors. Vol. 1. John Wiley & Sons; New York: 1999.p. 514-554.
4. Benfatto M, Della Longa S. J Synchrotron Rad 2001;8:1087–1094.5. Benfatto M, Della Longa S, D’Angelo P. Phys Scr 2005;T115:28–30.6. Benfatto M, Della Longa S, Natoli CR. J Synchrotron Rad 2003;10:51–57.7. Hayakawa K, Hatada K, D’Angelo P, Della Longa S, Natoli CR, Benfatto M. J Am Chem Soc
2004;126:15618–15623. [PubMed: 15563192]8. Sarangi R, Benfatto M, Hayakawa K, Bubacco L, Solomon EI, Hodgson KO, Hedman B. Inorg Chem
2005;44:9652–9659. [PubMed: 16363833]9. Ford-Hutchinson AW, Gresser M, Young RN. Annu Rev Biochem 1994;63:383–417. [PubMed:
7979243]10. Glickman MH, Klinman JP. Biochemistry 1996;35:12882–12892. [PubMed: 8841132]
Sarangi et al. Page 9
Inorg Chem. Author manuscript; available in PMC 2009 December 15.
NIH
-PA Author Manuscript
NIH
-PA Author Manuscript
NIH
-PA Author Manuscript

11. Solomon EI, Brunold TC, Davis MI, Kemsley JN, Lee SK, Lehnert N, Neese F, Skulan AJ, YangYS, Zhou J. Chem Rev 2000;100:235–349. [PubMed: 11749238]
12. Brash AR. J Biol Chem 1999;274:23679–23682. [PubMed: 10446122]13. Solomon EI, Zhou J, Neese F, Pavel EG. Chem Biol 1997;4:795–808. [PubMed: 9384534]14. Minor W, Steczko J, Stec B, Otwinowski Z, Bolin JT, Walter R, Axelrod B. Biochemistry
1996;35:10687–10701. [PubMed: 8718858]15. Tomchick DR, Phan P, Cymborowski M, Minor W, Holman TR. Biochemistry 2001;40:7509–7517.
[PubMed: 11412104]16. Boyington JC, Gaffney BJ, Amzel LM. Science 1993;260:1482–1486. [PubMed: 8502991]17. Pavlosky MA, Zhang Y, Westre TE, Gan QF, Pavel EG, Campochiaro C, Hedman B, Hodgson KO,
Solomon EI. J Am Chem Soc 1995;117:4316–4327.18. Neidig ML, Wecksler AT, Schenk G, Holman TR, Solomon EI. J Am Chem Soc 2007;129:7531–
7537. [PubMed: 17523638]19. Holman TR, Zhou J, Solomon EI. J Am Chem Soc 1998;120:12564–12572.20. Ellis PJ, Freeman HC. J Synchrotron Rad 1995;2:190–195.21. George, GN. EXAFSPAK & EDG_FIT; Stanford, CA 94309: Stanford Synchrotron Radiation
Laboratory, Stanford Linear Accelerator Center, Stanford University; 2000.22. Tyson TA, Hodgson KO, Natoli CR, Benfatto M. Phys Rev B: Condens Matter 1992;46:5997–6019.
[PubMed: 10002283]23. Mustre de Leon J, Rehr JJ, Zabinsky SI, Albers RC. Phys Rev B 1991;44:4146–4156.24. Rehr JJ, Mustre de Leon J, Zabinsky SI, Albers RC. J Am Chem Soc 1991;113:5135–5140.25. Westre TE, Kennepohl P, DeWitt JG, Hedman B, Hodgson KO, Solomon EI. J Am Chem Soc
1997;119:6297–6314.26. Randall CR, Shu LJ, Chiou YM, Hagen KS, Ito M, Kitajima N, Lachicotte RJ, Zang Y, Que L Jr.
Inorg Chem 1995;34:1036–1039.27. Roe AL, Schneider DJ, Mayer RJ, Pyrz JW, Widom J, Que L Jr. J Am Chem Soc 1984;106:1676–
1681.28. The pre-edge data for PAHT and PAHR have been reproduced from reference 29.29. Wasinger EC, Mitíc N, Hedman B, Caradonna J, Solomon EI, Hodgson KO. Biochemistry
2002;41:6211–6217. [PubMed: 12009881]30. The Fe-K pre-edge data of the 6C site in PAHT has been refit with two peaks to determine the intensity
ratio.31. Davis MI, Wasinger EC, Westre TE, Zaleski JM, Orville AM, Lipscomb JD, Hedman B, Hodgson
KO, Solomon EI. Inorg Chem 1999;38:3676–3683. [PubMed: 11671125]32. DeWitt JG, Rosenzweig AC, Salifloglou A, Hedman B, Lippard SJ, Hodgson KO. Inorg Chem
1995;34:2505–2515.33. The EXAFS data for WT sLO1 presented here have been previously reported in Reference 17.34. Segraves EN, Chruszcz M, Neidig ML, Ruddat V, Zhou J, Wecksler AT, Minor W, Solomon EI,
Holman TR. Biochemistry 2006;45:10233–10242. [PubMed: 16922498]35. Several Fe/S models with Fe-S distance ranging from 2.5 Å to 3.0 Å were used to generate theoretical
paths. The best fit was obtained using the model with an Fe-S distance of ~2.7 Å36. A strong Fe-S(Cys) bond could lead to weakening of the H2O ligand bond, leading to a distorted 5C
structure with 4 Fe-O/N, 1 Fe-S and 1 long Fe-O interaction. However, EXAFS data could not bereasonably fit using a structural model reflecting this geometry.
37. The experimental and core-hole broadening values obtained from the non-structural parameter fit are1.04 eV and 0.98 eV, respectively, yielding a total broadening of ~2 eV, which is consistent with thebroadening observed at the Fe K-edge (~7100 eV).
38. Schenk G, Neidig ML, Zhou J, Holman TR, Solomon EI. Biochemistry 2003;42:7294–7302.[PubMed: 12809485]
39. Stern EA. Phys Rev B 1993;48:9825–9827.
Sarangi et al. Page 10
Inorg Chem. Author manuscript; available in PMC 2009 December 15.
NIH
-PA Author Manuscript
NIH
-PA Author Manuscript
NIH
-PA Author Manuscript
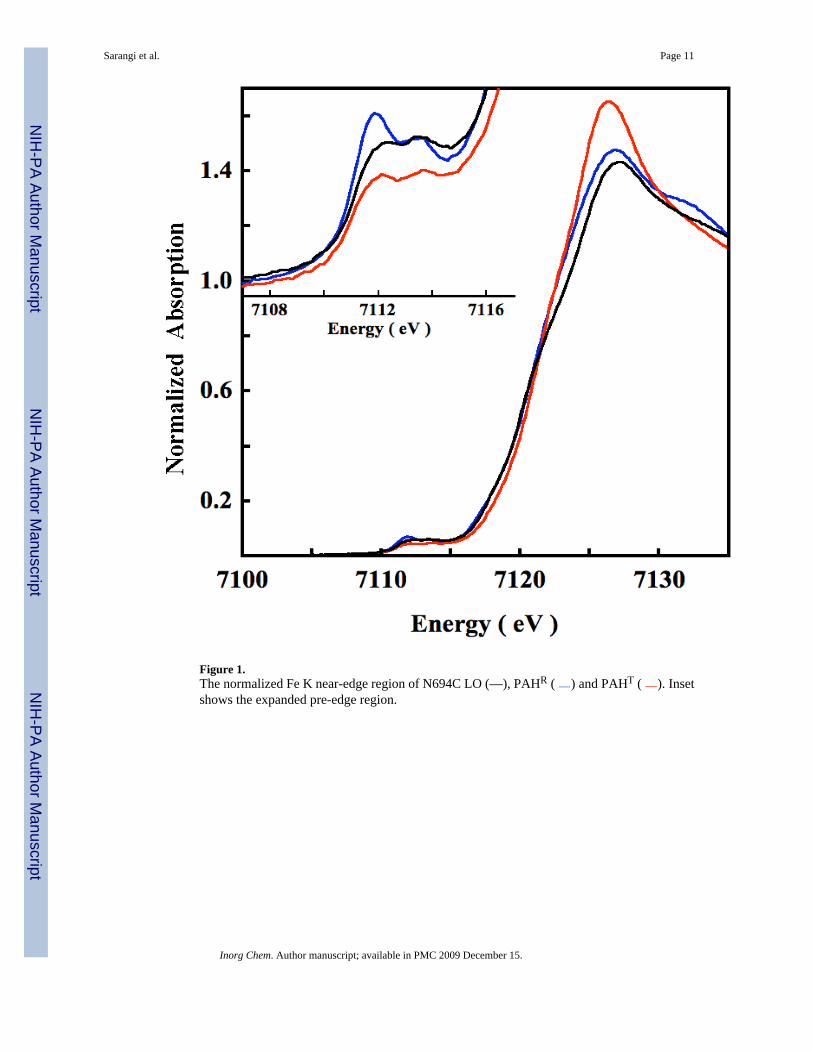
Figure 1.The normalized Fe K near-edge region of N694C LO (—), PAHR ( ) and PAHT ( ). Insetshows the expanded pre-edge region.
Sarangi et al. Page 11
Inorg Chem. Author manuscript; available in PMC 2009 December 15.
NIH
-PA Author Manuscript
NIH
-PA Author Manuscript
NIH
-PA Author Manuscript
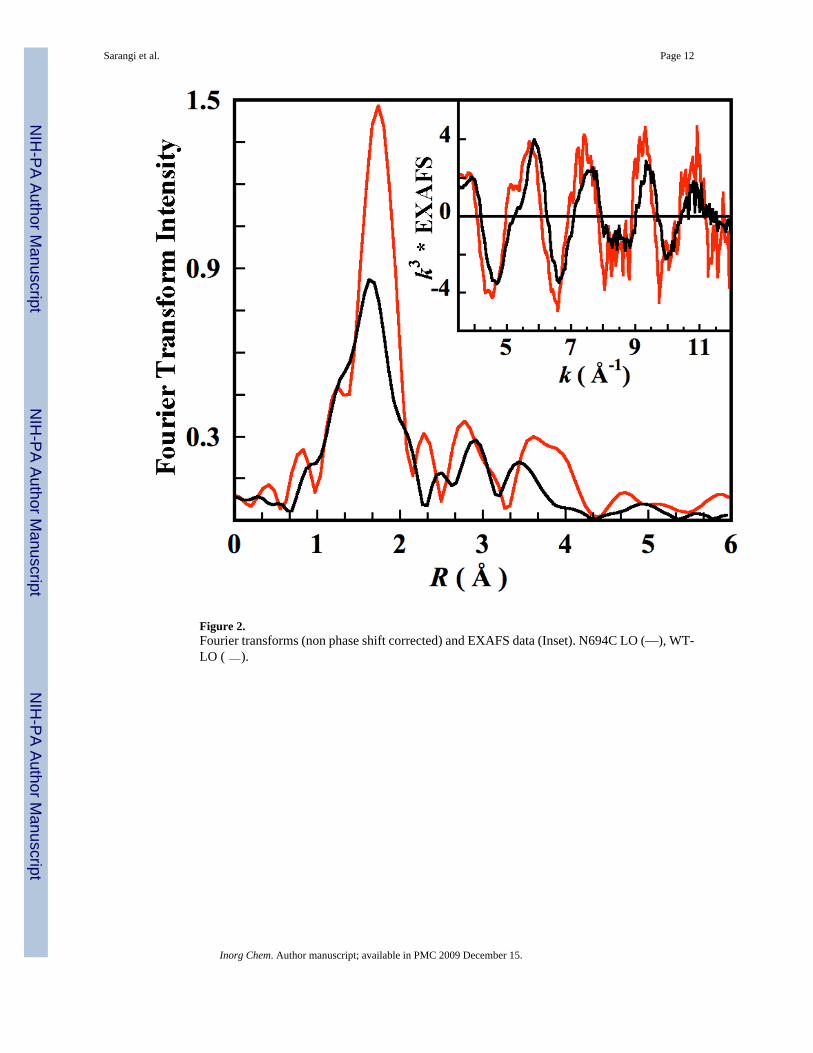
Figure 2.Fourier transforms (non phase shift corrected) and EXAFS data (Inset). N694C LO (—), WT-LO ( ).
Sarangi et al. Page 12
Inorg Chem. Author manuscript; available in PMC 2009 December 15.
NIH
-PA Author Manuscript
NIH
-PA Author Manuscript
NIH
-PA Author Manuscript
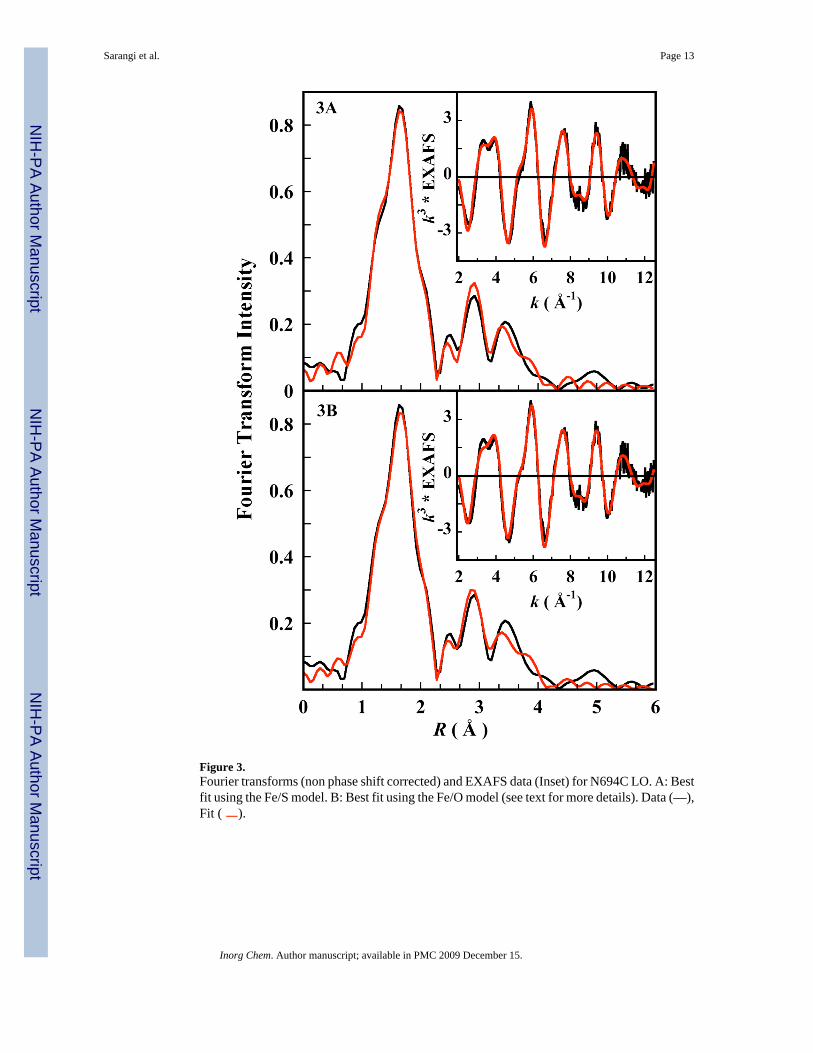
Figure 3.Fourier transforms (non phase shift corrected) and EXAFS data (Inset) for N694C LO. A: Bestfit using the Fe/S model. B: Best fit using the Fe/O model (see text for more details). Data (—),Fit ( ).
Sarangi et al. Page 13
Inorg Chem. Author manuscript; available in PMC 2009 December 15.
NIH
-PA Author Manuscript
NIH
-PA Author Manuscript
NIH
-PA Author Manuscript
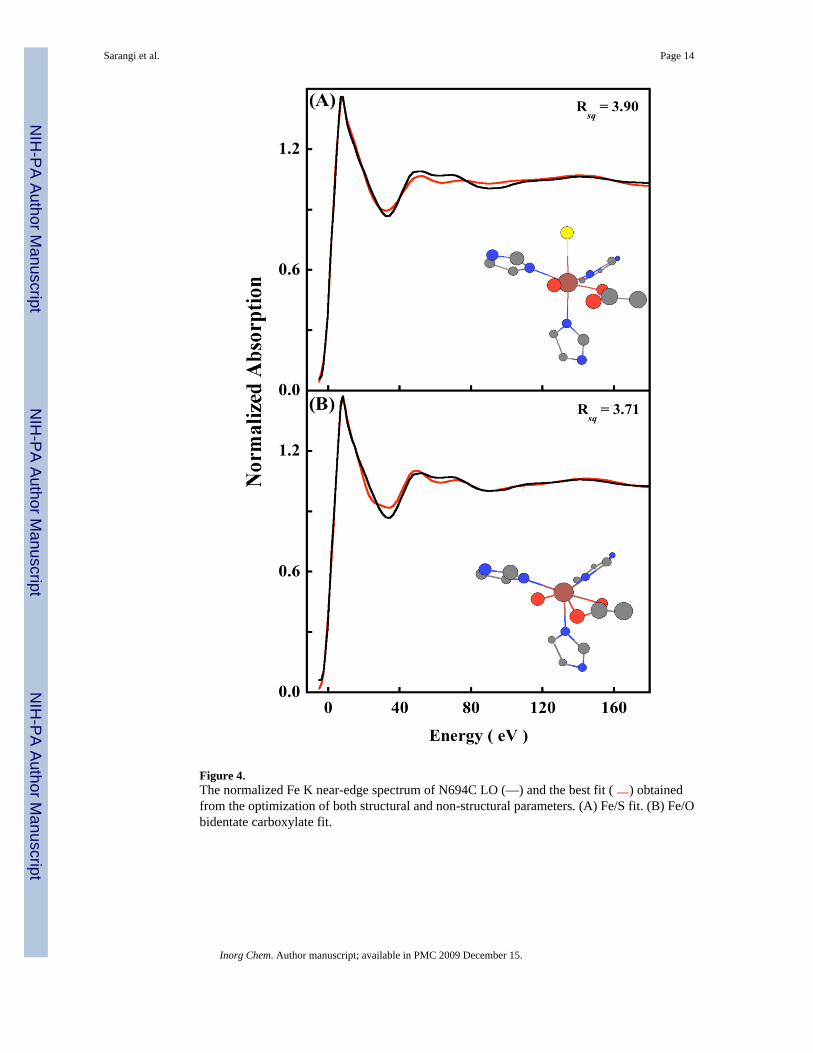
Figure 4.The normalized Fe K near-edge spectrum of N694C LO (—) and the best fit ( ) obtainedfrom the optimization of both structural and non-structural parameters. (A) Fe/S fit. (B) Fe/Obidentate carboxylate fit.
Sarangi et al. Page 14
Inorg Chem. Author manuscript; available in PMC 2009 December 15.
NIH
-PA Author Manuscript
NIH
-PA Author Manuscript
NIH
-PA Author Manuscript
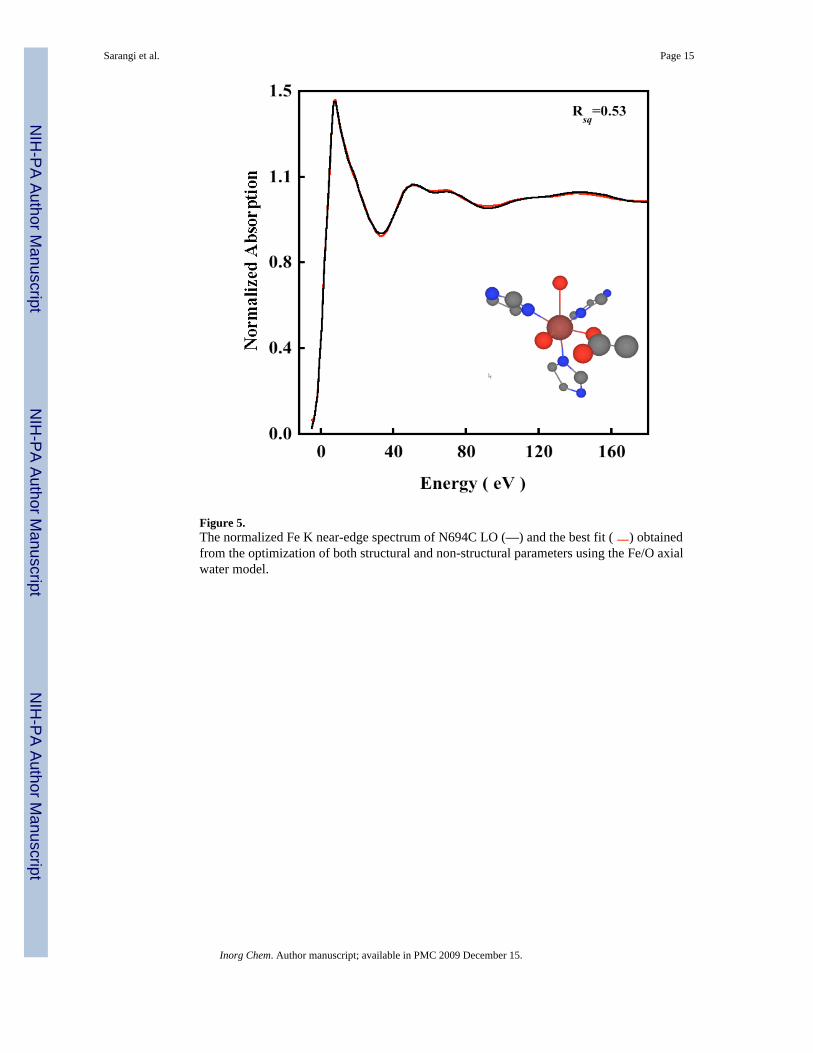
Figure 5.The normalized Fe K near-edge spectrum of N694C LO (—) and the best fit ( ) obtainedfrom the optimization of both structural and non-structural parameters using the Fe/O axialwater model.
Sarangi et al. Page 15
Inorg Chem. Author manuscript; available in PMC 2009 December 15.
NIH
-PA Author Manuscript
NIH
-PA Author Manuscript
NIH
-PA Author Manuscript
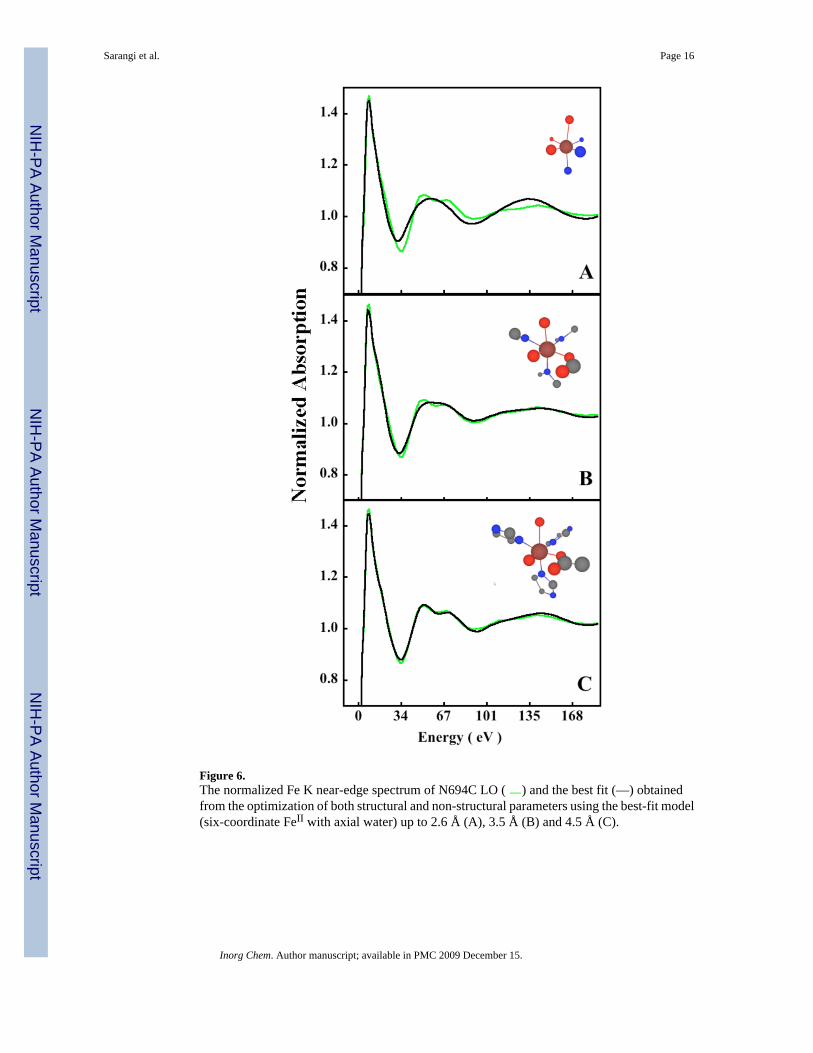
Figure 6.The normalized Fe K near-edge spectrum of N694C LO ( ) and the best fit (—) obtainedfrom the optimization of both structural and non-structural parameters using the best-fit model(six-coordinate FeII with axial water) up to 2.6 Å (A), 3.5 Å (B) and 4.5 Å (C).
Sarangi et al. Page 16
Inorg Chem. Author manuscript; available in PMC 2009 December 15.
NIH
-PA Author Manuscript
NIH
-PA Author Manuscript
NIH
-PA Author Manuscript

NIH
-PA Author Manuscript
NIH
-PA Author Manuscript
NIH
-PA Author Manuscript
Sarangi et al. Page 17
Table 1Fe-K Pre-edge Analysis.
N694C-LO PAHR PAHTb
Peak 1 (eV) 7111.7 7111.7 7111.8
Peak 2 (eV) 7113.5 7113.5 7113.7
Total Areac 11.8(0.4) 13.9(0.8) 8.1(0.4)
Pre-edge Ratio 1.44 1.61 1.39
Edge maxima (eV) 7126.3 7126.4 7125.7
aValues in parentheses are the statistical standard deviations calculated from the individual acceptable fits used in the analysis.
bThe first two peaks in PAHT are in the limit of resolution and hence treated as a single peak for relative ratio estimations.
cThe reported values are multiplied by 100 for convenience.
Inorg Chem. Author manuscript; available in PMC 2009 December 15.
NIH
-PA Author Manuscript
NIH
-PA Author Manuscript
NIH
-PA Author Manuscript
Sarangi et al. Page 18Ta
ble
2EX
AFS
Lea
st S
quar
es F
ittin
g R
esul
ts fo
r N69
4C L
ipox
ygen
ase.
Fit#
Coo
rdin
atio
n/Pa
thR
(Å)a
s2 (Å2 )b
E0 (
eV)
Fc
1 Fe
-N/O
1.97
(0.0
2)25
9(48
)
4 Fe
-N/O
2.12
(0.0
2)44
2(20
2)
1 Fe
-S2.
70(0
.03)
1300
(131
)
Mod
el F
e/S
6 Fe
-C3.
12(0
.02)
557(
44)
−6.9
90.
135
14 F
e-N
-C3.
27(0
.02)
557d (4
4)
8 Fe
-N/C
-N/C
4.29
(0.0
4)16
3(19
0)
8 Fe
-N/C
-N/C
4.44
(0.0
3)71
9(19
0)
1 Fe
-N/O
1.96
(0.0
3)42
0(11
3)
4 Fe
-N/O
2.12
(0.0
2)52
0(66
)
1 Fe
-O/N
2.49
(0.0
2)54
2(12
1)
Mod
el F
e/O
6 Fe
-C3.
11(0
.02)
725(
65)
−7.9
90.
138
14 F
e-N
-C3.
29(0
.04)
725(
65)
8 Fe
-N/C
-N/C
4.28
(0.0
4)27
9(24
0)
8 Fe
-N/C
-N/C
4.41
(0.0
2)85
5(24
0)
a The
estim
ated
stan
dard
dev
iatio
ns fo
r the
dis
tanc
es a
nd D
ebye
-Wal
ler c
alcu
late
d by
EX
AFS
PAK
are
show
n in
par
anth
esis
.
b The σ2
val
ues a
re m
ultip
lied
by 1
05.
c Erro
r is g
iven
by Σ[
(χob
sd−χ
calc
d)2
k6]/Σ
[(χ o
bsd)
2 k6 ]
.
d The σ2
fact
or o
f the
mul
tiple
scat
terin
g pa
th is
link
ed to
that
of t
he c
orre
spon
ding
sing
le sc
atte
ring
path
. The
So2
valu
e w
as fi
xed
at 1
for a
ll re
finem
ents
.
Inorg Chem. Author manuscript; available in PMC 2009 December 15.
NIH
-PA Author Manuscript
NIH
-PA Author Manuscript
NIH
-PA Author Manuscript
Sarangi et al. Page 19Ta
ble
3Fe
K E
dge
Ana
lysi
s.
Path
Fe-O
Fe-O
bFe
-Neq
Fe-N
eqFe
-Nax
Fe-O
ax
R (Å
)2.
042.
042.
092.
192.
342.
50
The
estim
ated
stan
dard
dev
iatio
n fo
r the
dis
tanc
es is
±0.
01 Å
and
bon
d an
gles
(not
show
n) is
4°.
a The
stru
ctur
al a
nd n
on-s
truct
ural
par
amet
ers a
re o
btai
ned
by a
ltern
ate
fittin
g of
eac
h se
t pf p
aram
eter
s sep
arat
ely.
Thi
s is p
ossi
ble
due
to th
e lo
w c
orre
latio
n be
twee
n th
ese
para
met
ers.
Nax
=axi
al N
(His
), N
eq=e
quat
oria
l N(H
is).
b Fe-O
CO− (
Ile).
Inorg Chem. Author manuscript; available in PMC 2009 December 15.


![X-ray diffraction, extended x-ray absorption fine structure and Raman spectroscopy studies of WO[sub 3] powders and (1−x)WO[sub 3−y]⋅xReO[sub 2] mixtures](https://static.fdokumen.com/doc/165x107/63332eb79d8fc1106803ae67/x-ray-diffraction-extended-x-ray-absorption-fine-structure-and-raman-spectroscopy.jpg)