Parallel formulations of decision-tree classification algorithms

Structure-Based Algorithms for Microvessel ClassificationAMY F. SMITH,*,† TIMOTHY W. SECOMB,† AXEL R. PRIES,‡ NICOLAS P. SMITH,§,¶ ANDREBECCA J. SHIPLEY**
*Oxford Centre for Collaborative Applied Mathematics, Mathematical Institute, University of Oxford, Oxford, UK; †Department of Physiology,University of Arizona, Tucson, Arizona, USA; ‡Department of Physiology, Charit!e-Universit€atsmedizin Berlin, Berlin, Germany; §Department ofBiomedical Engineering, King’s College London, St. Thomas Hospital, London, UK; ¶Faculty of Engineering, The University of Auckland, Auckland,New Zealand; **Department of Mechanical Engineering, University College London, London, UKAddress for correspondence: Rebecca J. Shipley, Department of Mechanical Engineering, University College London, Torrington Place, London WC1E7JE, UK. E-mail: [email protected]
Received 30 July 2014; accepted 13 November 2014.
ABSTRACT
Objective: Recent developments in high-resolution imaging tech-niques have enabled digital reconstruction of three-dimensionalsections of microvascular networks down to the capillary scale. Tobetter interpret these large data sets, our goal is to distinguishbranching trees of arterioles and venules from capillaries.Methods: Two novel algorithms are presented for classifyingvessels in microvascular anatomical data sets without requiringflow information. The algorithms are compared with a classificationbased on observed flow directions (considered the gold standard),and with an existing resistance-based method that relies only onstructural data.Results: The first algorithm, developed for networks with onearteriolar and one venular tree, performs well in identifyingarterioles and venules and is robust to parameter changes, but
incorrectly labels a significant number of capillaries as arterioles orvenules. The second algorithm, developed for networks withmultiple inlets and outlets, correctly identifies more arterioles andvenules, but is more sensitive to parameter changes.Conclusions: The algorithms presented here can be used to classifymicrovessels in large microvascular data sets lacking flow informa-tion. This provides a basis for analyzing the distinct geometricalproperties and modelling the functional behavior of arterioles,capillaries, and venules.
KEY WORDS: vessel classification, discrete algorithms, microvascularnetworks
Abbreviations used: 3D, three-dimensional; FPA, false-positive
arterioles; FPV, false-positive venules; TPA, true-positive arterioles;
TPV, true-positive venules.
Please cite this paper as: Smith AF, Secomb TW, Pries AR, Smith NP, Shipley RJ. Structure-based algorithms for microvessel classification. Microcirculation 22:
99–108, 2015.
INTRODUCTION
A wealth of detailed, high-resolution information about the3D spatial arrangement of the microvasculature is nowavailable due to recent advances in ex vivo vascular castingand image-processing technologies [1,5,8]. However, com-plete flow and pressure measurements cannot be obtained inindividual vessels within 3D microvascular networks, usingcurrent in vivo imaging techniques. Mathematical modelingtechniques offer methods to address the challenge ofinterpreting and exploiting anatomical data in order to gaininsight into microvascular function.
The vessels forming the microcirculation are generallyclassified as arterioles, capillaries, and venules. Arteriolar andvenular vessel segments connected at vascular branch points(nodes) typically form dichotomous branching trees with ahierarchy of vessel diameters. The capillaries form an
interconnected network, with diameters of approximately5–7 lm in mammalian heart and other tissues [6]. Theprimary role of the arterioles and venules is the convectivetransport of blood through the tissue, while capillaries carryblood close to every tissue cell, allowing for diffusiveexchange of materials [18].
The identification of vessel types within digitally recon-structed microvascular data sets is needed for the develop-ment of theoretical models based on such data sets thatincorporate functional differences between vessel types.Examples include models for flow regulation [15], whereactive responses to vasodilator signals occur only in thearterioles, and models in which the capillary mesh isrepresented as a porous medium [16], which may be coupledto an explicit description of arteriolar network hemodynam-ics. Although arterioles, venules, and capillaries may bedistinguished by their vessel wall structure [4], current
DOI:10.1111/micc.12181
Original Article
ª 2014 The Authors. Microcirculation published by John Wiley & Sons Ltd 99This is an open access article under the terms of the Creative Commons Attribution-NonCommercial-NoDerivs License, which permits use anddistribution in any medium, provided the original work is properly cited, the use is non-commercial and no modifications or adaptations are made.
imaging techniques are not capable of extracting this level ofdetail whilst simultaneously determining the structure oflarge microvascular networks. Alternative methods musttherefore be employed to classify microvessels. Such methodsshould make use of available information about the topo-logical and geometrical properties of the network, and useobserved flow information where that is available.
Current microvessel classification methods include thoseof Pries, Ley, and Gaehtgens [10], in which connecteddiverging and converging trees are identified based onobserved flow directions, and Roy, Pries, and Secomb [15],which uses the same approach but with all vessels below acertain diameter classified as capillaries. In the following,the latter method is referred to as the “Pries–Roy” method.However, data on flow directions in all segments are rarelyavailable for extensive geometrical data sets. Furthermore,capillary flow directions are not necessarily predetermined.Opposing flow directions have been observed in neigh-boring capillaries [7], and flow patterns in capillarynetworks may also be subject to temporal fluctuationsdue to changes in upstream pressure (e.g., followingdilation of arterioles), contraction of the surroundingtissue or the particulate nature of blood which isspecifically relevant to capillary-sized vessels [2,9]. In astructure-based algorithm developed by Cassot et al. [1],the arteriolar and venular trees are identified as connectedvessel segments with resistance lower than a thresholdvalue. This algorithm does not require flow direction data,but is likely to be strongly sensitive to the thresholdresistance value chosen.
Once the segments forming a vessel network have beenclassified as arterioles, venules or capillaries, previouslyestablished methods are available to further analyze thestructures of the venular and arteriolar trees, including theHorton–Strahler (centripetal) scheme and the generation(centrifugal) scheme. The advantages and disadvantages ofthese schemes have been discussed previously [12].
In this paper, our objective is to develop algorithms thatexploit microvascular network geometry and topology toidentify arterioles and venules within large anatomical datasets, applicable to networks for which flow measurements arenot available. Two novel algorithms are presented andapplied to data sets from five rat mesentery networks forwhich flow data are available [10,13], allowing comparisonwith the flow-based Pries–Roy method. Our goal is tocorrectly identify more arterioles and venules whilst improv-ing the robustness to parameter changes relative to theapproach of Cassot et al. [1]. Networks 1–4 contain one ortwo main arteriolar trees and one or two main venular trees,whereas network 5 has several inlets and outlets. Algorithm 1was motivated by the study of networks with few inlets andoutlets. Algorithm 2, an adaptation of the first algorithm, wasdeveloped for networks with multiple inlets in order toaddress the problem of extracting separate arteriolar andvenular trees when these trees are located in close proximitywithin the network.
MATERIALS AND METHODS
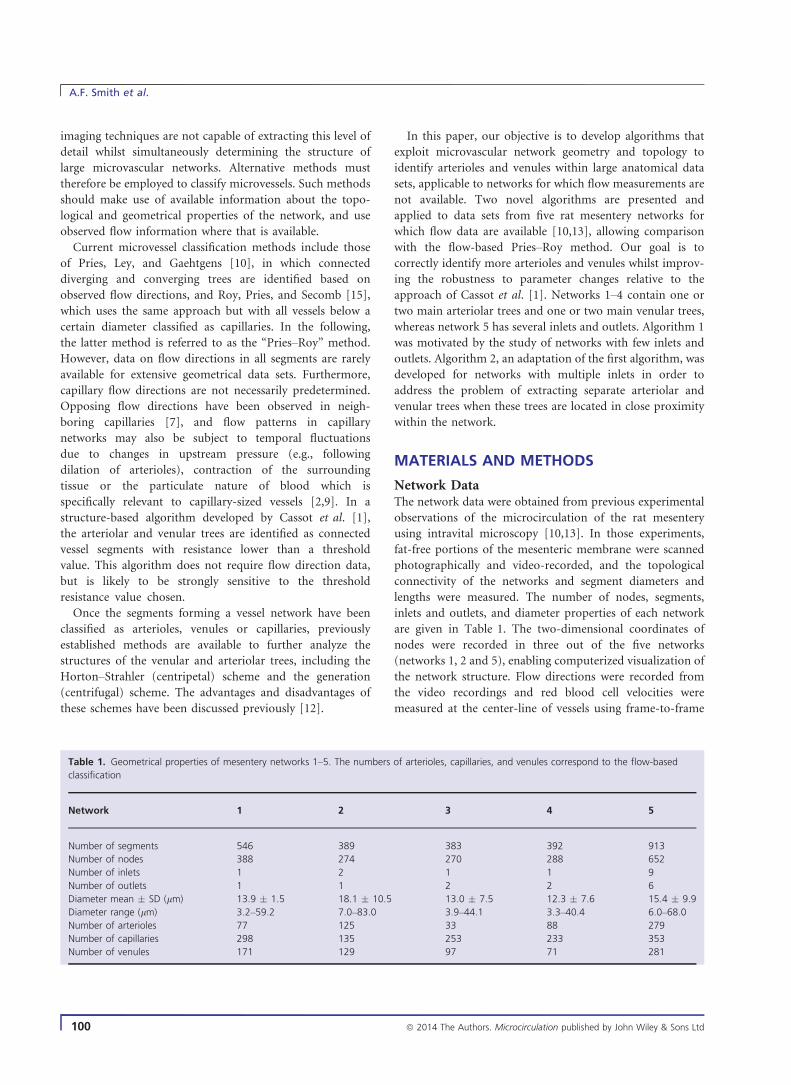
Network DataThe network data were obtained from previous experimentalobservations of the microcirculation of the rat mesenteryusing intravital microscopy [10,13]. In those experiments,fat-free portions of the mesenteric membrane were scannedphotographically and video-recorded, and the topologicalconnectivity of the networks and segment diameters andlengths were measured. The number of nodes, segments,inlets and outlets, and diameter properties of each networkare given in Table 1. The two-dimensional coordinates ofnodes were recorded in three out of the five networks(networks 1, 2 and 5), enabling computerized visualization ofthe network structure. Flow directions were recorded fromthe video recordings and red blood cell velocities weremeasured at the center-line of vessels using frame-to-frame
Table 1. Geometrical properties of mesentery networks 1–5. The numbers of arterioles, capillaries, and venules correspond to the flow-basedclassification
Network 1 2 3 4 5
Number of segments 546 389 383 392 913Number of nodes 388 274 270 288 652Number of inlets 1 2 1 1 9Number of outlets 1 1 2 2 6Diameter mean ! SD (lm) 13.9 ! 1.5 18.1 ! 10.5 13.0 ! 7.5 12.3 ! 7.6 15.4 ! 9.9Diameter range (lm) 3.2–59.2 7.0–83.0 3.9–44.1 3.3–40.4 6.0–68.0Number of arterioles 77 125 33 88 279Number of capillaries 298 135 253 233 353Number of venules 171 129 97 71 281
A.F. Smith et al.
100 ª 2014 The Authors. Microcirculation published by John Wiley & Sons Ltd

correlation, with values averaged over about four seconds toremove the effect of pulsatile fluctuations from the velocitydata. When measured velocities were converted to flows,conservation of mass was not precisely satisfied at all vesseljunctions. To obtain a network flow solution satisfying flowconservation at nodes, recorded segment flows and dischargehematocrits were assigned as boundary conditions within aniterative solver that uses the in vivo viscosity and bifurcationlaws of Pries et al. [9] and Pries, Neuhaus, and Gaehtgens[11], to obtain a unique solution [14].
The Pries–Roy MethodThis flow-based vessel classification method introduced byPries, Ley, and Gaehtgens [10], as modified by Roy, Pries,and Secomb [15], is here considered as the “gold standard”procedure for distinguishing arterioles, capillaries, andvenules. In this method, all vessels with diameter less than8.4 lm are labeled as capillaries; this criterion is discussedbelow. Segment flow directions (obtained in the networkflow solution as described above) are used to classify nodes asdiverging (one inflow, two outflows) or converging (twoinflows, one outflow). Vessels not already labeled as capil-laries and forming trees connecting diverging nodes with anarteriolar input of the network are labeled as arterioles. Thoseconnecting converging nodes with a venular output arelabeled as venules, and all remaining vessels are labeled ascapillaries.
The minimum arteriolar diameter criterion is relevant inthe context of regulation, because vessels of smaller diametertypically do not possess vascular smooth muscle and socannot actively vasoconstrict. Here, the mean diameter ofterminal arterioles (8.4 lm) in the rat intestinal muscle [17]was used; this could be replaced by an alternative value ifknown for the tissue under study. This diameter criterionleads to 25.5% fewer arterioles and 7.9% fewer venulesaveraged over the five mesentery networks, compared to theclassifications obtained without this criterion.
The number of arterioles, capillaries, and venules in eachnetwork according to the Pries–Roy method are listed inTable 1. Although this topological approach does notnecessarily provide a classification which is identical to ahistological identification of vessels as arterioles, capillariesor venules (which would require information on vessel wallstructure, as discussed above), it represents an accuratetopological description if vessel flow directions are known,and was used to test the structure-based algorithms that areintroduced next. All these algorithms require prior specifi-cation of the main arteriolar inlets and venular outlets.
Structure-Based Cassot MethodCassot et al. [1] extracted vascular trees (arterioles andvenules) from a reconstructed cerebral microvascular net-work using a structure-based vessel classification method.
Starting at the main inlets/outlets, the technique identifies anarteriolar/venular tree by following paths along vesselsegments with resistance lower than a specified critical value,Rc. Vascular resistance was defined as R = 128 lL/pD4,where L and D are vessel length and diameter, respectively,and l is the effective viscosity calculated via the in vitroviscosity law of Pries [11] with a uniform dischargehematocrit of 0.45. All other vessels with R > Rc (or withR < Rc but separated from the main arteriolar/venular treesby high resistance vessels) are labeled as capillaries. Thisapproach was motivated by the observation that arteriolesand venules have higher diameter, and thus lower resistance,than capillaries.
Structure-Based Algorithm for Networks withSingle Inlets (Algorithm 1)This algorithm (Algorithm 1) was developed to exploitintrinsic structural features of the microvasculature byidentifying the transition from branching structures (arteri-oles and venules) to loops, which are characteristic of theinterconnected capillary network. This is achieved byiteratively stepping through the vessels in a sequence thatdepends on both branching order and vessel diameter. Thealgorithm may be applied to an arbitrary network withvertices (nodes) connected by edges (segments). Therequired inputs are a connectivity matrix describingthe network topology (i.e., the start nodes and end nodesof each segment, where the direction is arbitrary), a list ofsegment diameters, and the indices of the main inlet andoutlet nodes, specifying the starting points of the algorithm.
The first parent segment p1 is the segment connected tothe main inlet node. At the ith step, the daughter segmentsconnected to all established parents (found using theconnectivity matrix) constitute a list of candidate parentsegments. This definition does not depend on flowdirections. The next parent pi is selected as the candidateparent segment with the largest diameter. By this proce-dure, vessels with larger diameters are successively con-nected to the arteriolar or venular tree, reflecting thecharacteristic that arterioles and venules generally havelarger diameters than capillaries. Each node is given a label0 or 1; all nodes are initially labeled 0, which is changed to1 when a segment connected to the node is found as adaughter segment. Parent vessel pi and its daughter vesselsare then classified as follows:" The end nodes of all daughter segments are labeled 1." If the end node of a daughter segment has already beenlabeled 1 on a previous iteration, this indicates that a loophas been formed in the identified network and thedaughter is labeled as a capillary. In that case, if thediameter ratio of the parent to the daughter is less than aspecified value Dr, then the parent is also labeled as acapillary.
Microvessel Classification Algorithms
ª 2014 The Authors. Microcirculation published by John Wiley & Sons Ltd 101

" If the parent is labeled as a capillary, then its otherdaughter is also labeled as capillary.
" If the parent is not labeled as a capillary, then it is labeledas an arteriole/venule.The algorithm ends when there are no more candidate
parents. The use of the criterion based on Dr enablesretrospective labeling of the current parent segment when acapillary loop is reached, if the diameter of the parent is notmuch larger than (i.e., within a factor Dr of) the diameter ofthe daughter vessel. Note that Dr is scale-invariant, and so itsvalue is expected to be more consistent across differentnetworks than an absolute metric such as the criticalresistance Rc used in the Cassot method.
The algorithm is repeated starting from the main outlet(which becomes the new p1) to identify the venular network.Finally, any vessels not labeled as arterioles or venules aremarked as capillaries. Since the algorithm is run separately toselect arteriolar and venular trees, it is possible that somevessels are labeled as both arterioles and venules. This issuewill be addressed in the development of Algorithm 2 in thesection Structure-Based Algorithm for Networks with Multi-ple Inlets.
During the process of developing this algorithm, theselection of vessels with higher diameter as parent segmentswas found to increase the number of identified arterioles and(more notably) venules that coincided with the flow-basedclassification, compared to an earlier version of the algorithmin which parent segments were selected only by generationnumber (defined as the number of branching points i.e.,nodes from p1 to the current segment). The inclusion of thecriterion based on the parent–daughter diameter ratiofurther improved results.
A two-dimensional visualization of the classificationprocess was developed to qualitatively evaluate the meth-ods, and is used to illustrate specific stages of Algorithm 1when applied to identify arterioles in mesentery network 1.The outline of the identified arteriolar tree at step 26 isshown in Figure 1A. The 1st and 3rd steps are shown inFigure 1B and C, illustrating that larger diameter vesselsare preferentially added to the arteriolar tree. The regionof interest for p26 is shown Figure 1D. At the 27th step,the daughter vessels of p27 are labeled d1 and d2. The endnode of daughter vessel d2 was already reached on theprevious step, and d2 was therefore labeled a capillary. Theuse of the parameter Dr is depicted in Figure 1F and G forsteps 42 and 43 with an example value of Dr = 2. Here,daughter vessel d1 formed a loop and was labeled as acapillary; the diameter of the parent vessel (12.6 lm) wasless than twice the diameter of d1 (14.7 lm), and so theparent vessel p43 was also labeled as a capillary. Since theparent was a capillary, d2 was also labeled as a capillary, asillustrated in Figure 1G.
Structure-Based Algorithm for Networks withMultiple Inlets (Algorithm 2)Algorithm 1 was developed for networks with one or twomain arteriolar and venular trees. When Algorithm 1 wasapplied to network 5, which contains multiple, closelypositioned inlets and outlets, it did not perform well, asdiscussed below. Therefore, Algorithm 1 was adapted toclassify all trees simultaneously, in the following procedure(Algorithm 2):" Starting segments (inlets and outlets) were sorted in orderof descending diameter.
ArteriolesCapillariesCandidate parentNode label 1
p1 p2 p3A
B C
ED
F
p26 p26p27
d2 d1
p42
B,C
D,E
F,G Gp43d2d1
p42
Figure 1. Illustration of steps in vessel classification using Algorithm 1. (A) Overview of mesentery network 1 at step 26, with the location of magnifiedregions indicated. (B) The first step, with first parent segment p1. (C) The third step, with parent vessels p1, p2, and p3. (D) Step 26. (E) One step later, p27has two daughter vessels, one of which (d2) forms a loop and so is labeled as a capillary. (F) Step 42. (G) One step later, daughter vessel d1 forms a loopand so is labeled as a capillary. The ratio of the diameters of p43 and d1 is less than Dr, so parent p43 is also labeled as a capillary, and consequently also d2.
A.F. Smith et al.
102 ª 2014 The Authors. Microcirculation published by John Wiley & Sons Ltd

" Beginning at the largest-diameter starting segment, Algo-rithm 1 was implemented while parent segment pi haddiameter D ≥ Dmin, where Dmin is a minimum diameterthreshold which must be specified.
" Daughter segments with D < Dmin were added to the listof candidate parent segments, but their end-nodes werenot labeled 1 (so that they could not be used to form acapillary loop).
" Steps 2 and 3 were repeated for all remaining startingsegments.
" Following this stage, Algorithm 1 was continued on thefirst tree for one step only before moving to the next tree.This was repeated until there were no more candidateparent segments.
Comparison of AlgorithmsTo evaluate the results of the three structure-based methods,vessels labeled as arterioles by both the structure-basedmethod under consideration and the Pries–Roy method weremarked as true positives (TPA), whereas vessels marked asarterioles by the structure-based method but not by thePries–Roy method were marked as false positives (FPA). Thiswas repeated for the venules (TPV and FPV). As a metric ofthe success of each classification, a total score was defined asthe number of TPA and TPV, minus the sum of FPA andFPV. The parameter values in each algorithm (Rc in theCassot method, Dr in Algorithm 1 and Dr and Dmin inAlgorithm 2) were chosen to maximize this metric. Thesensitivity of the number of true and false positive arterioles/venules and the number of overlapping segments (classifiedas both arterioles and venules) to a !10% change inparameter values was determined. All algorithms and thequantitative comparison of their results were implemented inMATLAB R2013b on a personal computer (The Math-Works, Inc., Natick, MA, USA).
RESULTS
The Cassot MethodThe number of vessels classified as each type defined above(TPA, FPA, TPV, and FPV) and the total score are shown inFigure 2A as functions of the assumed critical resistance Rc.IncreasingRc led to an increase in both the number of TPA andTPV and the number of FPA and FPV. The maximum totalscore summed over all five networks was 588, at Rc = 280kg/mm4/sec. Figure 2B shows the dependence of the numberof overlapping vessels on Rc. The decline in the total scorecoincides with the onset of overlapping with increasing Rc
above this value. The classifications of segments in networks 1,2 and 5 with Rc = 280 kg/mm4/sec are illustrated in Fig-ure 3A, Figure 4A, and Figure 5A, respectively.
Results of the classifications by all three structure-basedmethods are summarized in Table 2. According to the
Cassot method with Rc = 280 kg/mm4/sec, 22.7% of arte-rioles and 64.8% of venules were true positive as aproportion of the arterioles/venules classified according tothe Roy method over all five networks, while there were0.2 FPA and 6.6 FPV on average. Results for the sensitivityof the various algorithms to parameter values are shown inTable 3. Notably, a 10% increase in Rc resulted in a treeoverlap of 42.0 vessels, 29.6 more FPAs, and 12.8 moreFPV on average.
Algorithm 1The free parameter in Algorithm 1 is the parent–daughterdiameter ratio, Dr. With increasing Dr, the number ofTPA/TPV and FPA/FPV decreased (see Figure 6A). Themaximum total score summed over all five networks was570, for Dr = 3.175. At this value, there was no overlapbetween arteriolar and venular trees in networks 1–4, but
Num
ber o
f seg
men
ts
–1500
–1000
–500
0
500
1000
TPA
TPV
FPA
FPVScore
Critical resistance, kg/mm4s0 500 1000 1500 2000
Num
ber o
f ove
rlapp
ing
segm
ents
0
200
400
600
800
Network 1
Network 4
Network 5
Network 3
Network 2
A
B
Figure 2. Results of the Cassot method. (A) The numbers of TPA, TPV,FPA, and FPV, and the total score summed over all five networks and (B)the numbers of overlapping segments (classified as both arterioles andvenules) in each network are plotted as functions of Rc (kg/mm4/sec).
Microvessel Classification Algorithms
ª 2014 The Authors. Microcirculation published by John Wiley & Sons Ltd 103

139 overlapping segments were present in network 5 (seeFigure 6B). In this network, the overlap typically occurredwhen arteriolar trees connected with and followed venulartrees. Algorithm 2, as described below, was developed toovercome this limitation. The final classifications fornetworks 1, 2, and 5 with Dr = 3.175 are illustrated inFigures 3B, 4B, and 5B. With this value, 47.9% ofarterioles and 68.0% of venules were true positives onaverage over all five networks, while 32.4 arterioles and 8.2venules were false positives. Algorithm 1 was moresuccessful than the Cassot method in identifying TPVand (more significantly) TPA, but also found many moreFPA. The large number of FPA was mainly due to 129venules according to the Roy method being falsely labeledas arterioles (of which 120 were also labeled as venules). A10% decrease in Dr led to 11.4 more overlapping vessels,with most importantly 9.6 more FPA averaged over all 5networks; hence Algorithm 1 was less sensitive to param-eter changes than the Cassot method.
Algorithm 2Network 5 differs from the other four networks, in that itcontains multiple inlets and outlets, and also a number oflarge-diameter vessels (“shunts”) linking arterioles andvenules. The application to Algorithm 1 to this networkresulted in a large number of “overlapping” vesselsclassified as both arterioles and venules, as noted above.
Such overlap was avoided in Algorithm 2 by analyzing allthe arteriolar and venular trees in parallel, choosing thelargest remaining candidate parent segment of each tree inturn. Algorithm 2 contained two free parameters: Dr (alsoused in Algorithm 1) and a diameter threshold, Dmin. Amaximum score of 771 was achieved with Dr = 1.25 andDmin = 16.5 lm. Results were not sensitive to !10%change to Dr with less than 7% change found in thenumber of TPA/TPV or FPA/FPV. Figure 7 shows theperformance of Algorithm 2 with Dr = 1.25 for a range ofDmin. Reducing Dmin by 10% from 16.5 lm led to adecrease in the number of TPA by 28.8 vessels on average,and an increase (by 14.4 vessels) in the number of FPV.However, increasing Dmin by 10% resulted in a decrease inonly 3.0 in the number of TPA, showing that thisalgorithm is not very sensitive to increases to Dmin, butis sensitive to a reduction in Dmin for Dmin < 16.5 lm.The final classifications for networks 1, 2 and 5 areillustrated in Figures 3C, 4C and 5C. At these parametervalues, 58.3% of arterioles and 84.0% of venules were truepositives as a percentage of the arterioles/venules accordingto the Roy method, while 9.2 arterioles and 24.6 venuleswere false positives on average over all five networks. Thus,Algorithm 2 identified many more TPA and TPV thaneither the Cassot method or Algorithm 1. Algorithm 2identified more FPA than the Cassot method but fewerthan Algorithm 1, and more FPV than either method.
CBA
Figure 3. Visualization of final network clas-sifications in network 1 using (A) the Cassotmethod, (B) Algorithm 1, and (C) Algorithm 2.Arrows indicate the location of inlets andoutlets. Red segments are arterioles, greenare capillaries, and blue are venules.
CBA
Figure 4. Visualization of final network clas-sifications in network 2 using (A) the Cassotmethod, (B) Algorithm 1, and (C) Algorithm 2.Arrows indicate the location of inlets andoutlets. Red segments are arterioles, greenare capillaries, and blue are venules.
A.F. Smith et al.
104 ª 2014 The Authors. Microcirculation published by John Wiley & Sons Ltd

DISCUSSION
In this paper, two novel structure-based algorithms weredeveloped to distinguish arteriolar or venular trees frominterconnected microvascular networks. Both algorithmswere motivated by the need to determine the transitionfrom arterioles and venules to capillaries based on purelygeometrical and topological features of the network, whenstudying large structural data sets without correspondingsimultaneously measured flow data.
Algorithm 1 depends on one parameter, the critical ratioDr between parent and daughter vessel diameters. Starting atspecified inlet or outlet vessels, arteriolar and venular treeswere identified separately and the number of vessels over-lapping between trees was recorded. An adapted version ofthis method (Algorithm 2) ran Algorithm 1 while vesseldiameters were greater than Dmin, and then alternatedbetween inlets/outlets identifying vascular trees in parallel,and thus avoiding any overlap between trees. This methodwas more appropriate for networks containing many closelyconnected arteriolar and venular trees.
BA
C
Figure 5. Visualization of final network clas-sifications in network 5 using (A) the Cassotmethod, (B) Algorithm 1 and (C) Algorithm 2.Arrows indicate the location of inlets andoutlets. Red segments are arterioles, greenare capillaries, and blue are venules.
Table 2. Number of TPA, TPV, FPA, FPV, and total score for theCassot method (with Rc = 280 kg/mm4/sec), Algorithm 1 (withDr = 3.175) and Algorithm 2 (with Dr = 1.25 and Dmin = 16.5)applied to networks 1–5
Metric Method
Network
Sum1 2 3 4 5
No. TPA Cassot 11 32 11 14 68 136Alg 1 36 41 16 61 118 272Alg 2 40 54 24 60 155 333
No. TPV Cassot 109 97 58 44 178 486Alg 1 121 80 68 52 180 501Alg 2 150 106 81 67 203 607
No. FPA Cassot 0 0 0 0 1 1Alg 1 0 1 0 7 154 162Alg 2 8 5 3 19 11 46
No. FPV Cassot 0 17 3 0 13 33Alg 1 10 3 2 2 24 41Alg 2 29 20 17 21 36 123
Total score Cassot 120 112 66 58 232 588Alg 1 147 117 82 104 120 570Alg 2 153 135 85 87 311 771
Microvessel Classification Algorithms
ª 2014 The Authors. Microcirculation published by John Wiley & Sons Ltd 105

These two algorithms and the existing structure-basedCassot method were implemented for five mesentery net-works for which segment flows were also recorded. A novel
approach was taken to test these three structure-basedmethods by comparison against the flow-based method,which uses measured flow directions to identify connecteddiverging or converging trees. Parameter values were chosenby maximizing the difference between the total number ofTPA and TPV, and the number of FPA and FPV. Althoughthe flow-based method is a topological and not a histologicalmicrovessel classification (the histological vessel type isunknown), this approach enables testing of the structure-based algorithms by exploiting the flow data available forthese networks.
The Cassot method performed poorly in identifyingarterioles as defined by the Pries–Roy method. The likelyreason is that arterioles generally have smaller diameter thancorresponding venules, and this can result in flow resistanceabove the threshold Rc. Nonetheless, the Cassot methodidentified fewer false positives than either Algorithm 1 or 2.The Cassot method was sensitive to an increase in Rc, with asignificant rise in the number of FPA and FPV, and thenumber of overlapping vessels. Note also that the Pries–Roymethod and the Cassot method both use diameter or
Table 3. Absolute change in the number of overlapping arterioles/venules, TPA, TPV, FPA, and FPV, and the total score, as a result of varyingparameter values by !10% in the three structure-based methods. Values are averaged over all five networks, and relative to Rc = 280 kg/mm4/sec inthe Cassot method, Dr = 3.175 in Algorithm 1, and Dr = 1.25 and Dmin = 16.5 lm in Algorithm 2
MethodCassot: Rc Alg. 1: Dr Alg. 2: Dr Alg. 2: Dmin
Parameter change #10% +10% #10% +10% #10% +10% #10% +10%
No. overlap #0.0 +42.0 +11.4 #0.0 – – – –No. TPA #5.2 +1.4 +0.0 #0.0 +4.4 #1.4 #28.8 #3.0No. TPV #3.2 +3.4 +2.6 #6.2 +3.2 #2.8 +6.6 #7.2No. FPA #0.2 +29.6 +9.6 #0.0 +2.4 #1.2 #1.0 #1.6No. FPV #2.2 +12.8 +0.4 #0.4 +6.4 #2.4 +14.4 #1.6Total score #6.0 #37.6 #7.4 #5.8 #1.2 #0.6 #35.6 #7.0
–800
–600
–400
–200
0
200
400
600
800
TPA
TPV
FPA
FPV
Score
Dr
0.0 0.5 1.0 1.5 2.0 2.5 3.0 3.5 4.00
100
200
300
400
500
600
Network 1
Network 4
Network 5
Network 3
Network 2
A
B
Num
ber o
f seg
men
tsN
umbe
r of o
verla
ppin
g se
gmen
ts
Figure 6. Results of Algorithm 1. (A) The numbers of TPA, TPV, FPA andFPV, and the total score summed over all five networks and (B) thenumbers of overlapping vessels (classified as both arterioles and venules)in each network are plotted as functions of Dr.
Dmin, µm12 14 16 18 20 22 24
Num
ber o
f seg
men
ts
–600
–400
–200
0
200
400
600
800
1000
TPA
TPV
FPA
FPV
Score
Figure 7. Results of Algorithm 2. The numbers of TPA, TPV, FPA, andFPV, and the total score summed over all five networks are plotted asfunctions of Dmin, for Dr = 1.25.
A.F. Smith et al.
106 ª 2014 The Authors. Microcirculation published by John Wiley & Sons Ltd

resistance-based criteria, which would most likely requireadjustment for other tissues with different typical capillarydiameters. On the other hand, the parent–daughter diameterratio in the algorithms introduced here could in theory beapplied to other networks without modification.
Comparing Algorithms 1 and 2, Algorithm 1 was shown tobe the less sensitive classification method overall. Algorithm2 was not as sensitive to changes in Dr as Algorithm 1, but adecrease in Dmin in Algorithm 2 led to a large decrease in thenumber of TPA and an increase in the number of FPV.Nonetheless, Algorithm 2 was much more successful thanAlgorithm 1 in correctly identifying arterioles and venules,found fewer FPA (though more FPV), and has the additionaladvantage of intrinsically avoiding classifying vessels as botharterioles and venules (overlap). For these reasons Algorithm2 is recommended for future application to other data setscontaining closely-located branching structures; however,this choice is network-specific and Algorithm 1 may be amore reliable option for networks with only one or two inletsand outlets.
The difference in optimal values for parameter Dr (3.175for Algorithm 1 and 1.25 for Algorithm 2) was due to thedistinction between the two methods. The value of Dr
determines which parent vessels are retroactively labeled ascapillaries. A larger Dr (i.e., a more inclusive diameter ratiocriterion) means that more parent vessels are labeled ascapillaries, which limits the extent of the arteriolar/venulartrees. In Algorithm 1, trees beginning from each inlet andoutlet are selected independently with results superimposedat the end. Thus, a high value of Dr is needed to restrict thearteriolar trees and avoid overlap with the venules. InAlgorithm 2, vessels are classified by switching between trees,inherently avoiding overlap of arterioles and venules. Thus,the Dr criterion may be enforced more restrictively, allowingthe selection of more extensive arteriolar trees.
All structure-based algorithms correctly identified a fairlylow proportion of arterioles relative to the Pries–Roy methode.g., only 43% TPA in network 2 via Algorithm 2. This maybe at least partly explained by considering that the firstcapillaries branching directly from arterioles would mostlikely continue to diverge the flow, and so would constitutepart of the arteriolar tree under the Pries–Roy method.
These same methods could in future be applied to largernetwork structures in two or three dimensions. A generallimitation of structure-based methods is that they requireuser input to specify the main inlets and outlets of thenetwork under study, if these are not known a priori as in themesentery networks considered here. Observation of vesseldiameters and distinctive anatomical features of arteriolesand venules may provide a basis for identifying the maininflowing and outflowing vessels. The performance of thesealgorithms for networks in tissues other than the mesenteryhas yet to be tested. The algorithm uses the occurrence ofloops to identify the capillary network. Therefore, it cannotbe applied to networks with arterial arcades [3], although itcould be applied to the arteriolar networks distal to thesearcades. These algorithms may require modification forapplication to other tissues. For instance, information onflow directions could be used to adjust the parameter values,or the method could be modified to make use of additionalinformation identifying vessel types. These methods repre-sent novel approaches to classifying micro-vessels usingdiscrete algorithms that do not rely on flow information, andprovide a basis for future development of more refinedmethods.
PERSPECTIVE
Significant advances in imaging and digital reconstructioncapabilities have provided large data sets on the 3D structureof microvascular networks down to the capillary level.Interpretation of these data is aided by the classification ofall microvessels as arterioles, capillaries or venules. Thealgorithms presented in this paper allow automated identi-fication of vessel type, in the absence of data on thedistribution of blood flow in the network.
ACKNOWLEDGMENTS
This study was supported by Award No. KUK-C1-013-04made by King Abdullah University of Science and Technol-ogy (KAUST), NIH grant HL070657, and a travel grant fromSt Anne’s College, Oxford.
REFERENCES
1. Cassot F, Lauwers F, Fouard C, Prohaska S,Lauwers-Cances V. A novel three-dimen-sional computer-assisted method for aquantitative study of microvascular net-works of the human cerebral cortex.Microcirculation 13: 1–18, 2006.
2. Ellis CG, Wrigley SM, Groom AC. Hetero-geneity of red blood cell perfusion incapillary networks supplied by a single
arteriole in resting skeletal muscle. CircRes 75: 357–368, 1994.
3. Gruionu G, Hoying JB, Gruionu LG, Laugh-lin MH, Secomb TW. Structural adaptationincreases predicted perfusion capacity aftervessel obstruction in arteriolar arcade net-work of pig skeletal muscle. Am J PhysiolHeart Circ Physiol 288: 2778–2784, 2005.
4. Henrikson R, Kaye G, Mazurkiewicz J.NMS Histology. Baltimore, MD: LippincottWilliams & Wilkins, 1997.
5. Kaneko N, Matsuda R, Toda M, ShimamotoK. Three-dimensional reconstruction of thehuman capillary network and the intramyo-cardial micronecrosis. Am J Physiol HeartCirc Physiol 300: H754–H761, 2011.
6. Kassab GS, Fung Y-CB. Topology anddimensions of pig coronary capillary net-work. Am J Physiol Heart Circ Physiol 267:H319–H325, 1994.
7. Kiyooka T, Hiramatsu O, Shigeto F, Na-kamoto H, Tachibana H, Yada T, Ogasaw-
Microvessel Classification Algorithms
ª 2014 The Authors. Microcirculation published by John Wiley & Sons Ltd 107

ara Y, Kajiya M, Morimoto T, Morizane Y,Mohri S, Shimizu J, Ohe T, Kajiya F. Directobservation of epicardial coronary capillaryhemodynamics during reactive hyperemiaand during adenosine administration byintravital video microscopy. Am J PhysiolHeart Circ Physiol 288: 1437–1443, 2005.
8. Lee J, Niederer S, Nordsletten D, Le Grice I,Smaill B, Kay D, Smith NP. Couplingcontraction, excitation, ventricular andcoronary blood flow across scale andphysics in the heart. Philos Trans A MathPhys Eng Sci 367: 2311–2331, 2009.
9. Pries AR, Ley K, Claassen M, Gaehtgens P.Red cell distribution at microvascular bifur-cations. Microvasc Res 38: 81–101, 1989.
10. Pries AR, Ley K, Gaehtgens P. Generaliza-tion of the F€ahraeus principle for micro-vessel networks. Am J Physiol Heart CircPhysiol 251: H1324–H1332, 1986.
11. Pries AR, Neuhaus D, Gaehtgens P. Bloodviscosity in tube flow: dependence ondiameter and hematocrit. Am J PhysiolHeart Circ Physiol 263: H1770–H1778,1992.
12. Pries AR, Secomb TW. Blood flow inmicrovascular networks. In: Handbook ofPhysiology: Microcirculation, edited byTuma RF, Duran WN, Ley K. San Diego,CA: Academic Press, 2008, p. 3–36.
13. Pries AR, Secomb TW, Gaehtgens P, GrossJF. Blood flow in microvascular networks.Experiments and simulation. Circ Res 67:826–834, 1990.
14. Pries AR, Secomb TW, Gessner T, Speran-dio MB, Gross JF, Gaehtgens P. Resistanceto blood flow in microvessels in vivo. CircRes 75: 904–915, 1994.
15. Roy TK, Pries AR, Secomb TW. Theoreticalcomparison of wall-derived and
erythrocyte-derived mechanisms for meta-bolic flow regulation in heteroge-neous microvascular networks. Am JPhysiol Heart Circ Physiol 302: H1945–H1952, 2012.
16. Smith AF, Shipley RJ, Lee J, Sands GB,Legrice IJ, Smith NP. Transmuralvariation and anisotropy of microvascularflow conductivity in the rat myocar-dium. Ann Biomed Eng 42: 1966–1977,2014.
17. Wiedeman MP, Tuma RF, Mayrovitz HN.An Introduction to Microcirculation. NewYork: Academic Press, 1981.
18. Zweifach BW. The microcirculatory module– myth or reality. In: Microvascular Net-works, Experimental and Theoretical Stud-ies, edited by Popel AS, Johnson PC. Basel:S. Karger, 1986, p. 1–14.
108 ª 2014 The Authors. Microcirculation published by John Wiley & Sons Ltd
A.F. Smith et al.
Copyright © 2022 FDOKUMEN