Maxillary bone necrosis following the use of formaldehyde ...
Upload
magaraibleoCategory
view
0download
0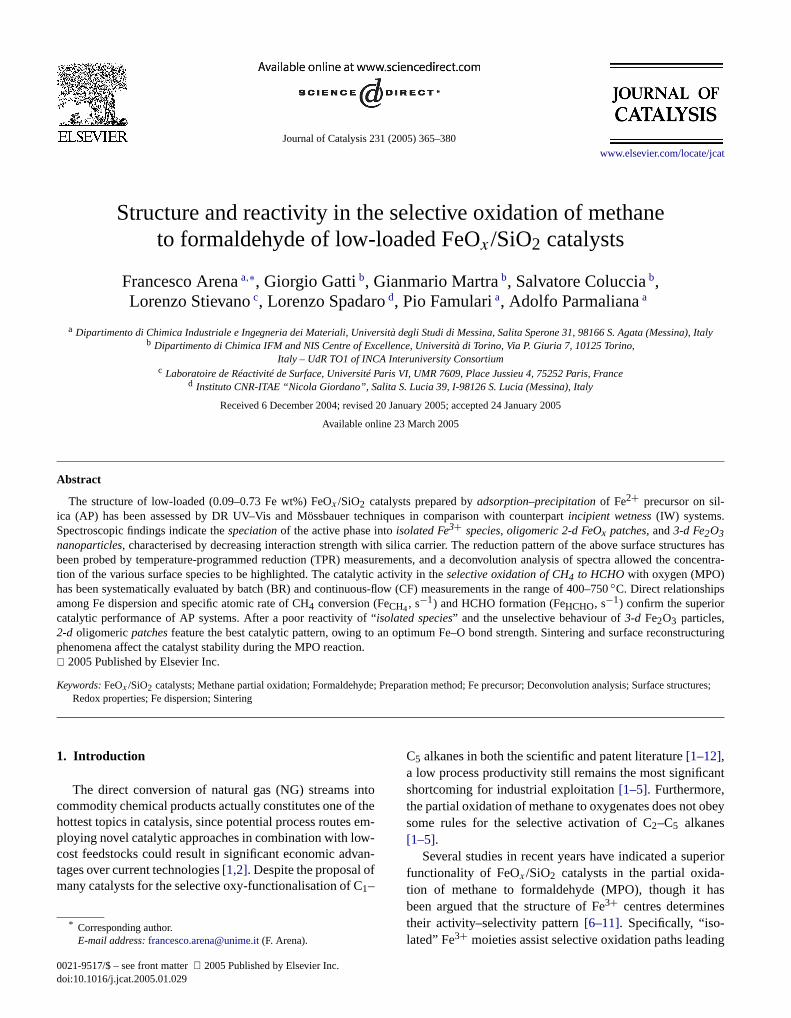
t
), Ita
ctures hasconcentra-
ructuring
ctures;
Journal of Catalysis 231 (2005) 365–380
www.elsevier.com/locate/jca
Structure and reactivity in the selective oxidation of methaneto formaldehyde of low-loaded FeOx/SiO2 catalysts
Francesco Arenaa,∗, Giorgio Gattib, Gianmario Martrab, Salvatore Colucciab,Lorenzo Stievanoc, Lorenzo Spadarod, Pio Famularia, Adolfo Parmalianaa
a Dipartimento di Chimica Industriale e Ingegneria dei Materiali, Università degli Studi di Messina, Salita Sperone 31, 98166 S. Agata (Messinalyb Dipartimento di Chimica IFM and NIS Centre of Excellence, Università di Torino, Via P. Giuria 7, 10125 Torino,
Italy – UdR TO1 of INCA Interuniversity Consortiumc Laboratoire de Réactivité de Surface, Université Paris VI, UMR 7609, Place Jussieu 4, 75252 Paris, France
d Instituto CNR-ITAE “Nicola Giordano”, Salita S. Lucia 39, I-98126 S. Lucia (Messina), Italy
Received 6 December 2004; revised 20 January 2005; accepted 24 January 2005
Available online 23 March 2005
Abstract
The structure of low-loaded (0.09–0.73 Fe wt%) FeOx /SiO2 catalysts prepared byadsorption–precipitationof Fe2+ precursor on sil-ica (AP) has been assessed by DR UV–Vis and Mössbauer techniques in comparison with counterpartincipient wetness(IW) systems.Spectroscopic findings indicate thespeciationof the active phase intoisolated Fe3+ species, oligomeric 2-d FeOx patches, and3-d Fe2O3nanoparticles, characterised by decreasing interaction strength with silica carrier. The reduction pattern of the above surface strubeen probed by temperature-programmed reduction (TPR) measurements, and a deconvolution analysis of spectra allowed thetion of the various surface species to be highlighted. The catalytic activity in theselective oxidation of CH4 to HCHOwith oxygen (MPO)has been systematically evaluated by batch (BR) and continuous-flow (CF) measurements in the range of 400–750◦C. Direct relationshipsamong Fe dispersion and specific atomic rate of CH4 conversion (FeCH4, s−1) and HCHO formation (FeHCHO, s−1) confirm the superiorcatalytic performance of AP systems. After a poor reactivity of “isolated species” and the unselective behaviour of3-d Fe2O3 particles,2-d oligomericpatchesfeature the best catalytic pattern, owing to an optimum Fe–O bond strength. Sintering and surface reconstphenomena affect the catalyst stability during the MPO reaction. 2005 Published by Elsevier Inc.
Keywords:FeOx /SiO2 catalysts; Methane partial oxidation; Formaldehyde; Preparation method; Fe precursor; Deconvolution analysis; Surface stru
Redox properties; Fe dispersion; Sinteringintotheemw-an-f
ant
bey
erior-as
1. Introduction
The direct conversion of natural gas (NG) streamscommodity chemical products actually constitutes one ofhottest topics in catalysis, since potential process routesploying novel catalytic approaches in combination with locost feedstocks could result in significant economic advtages over current technologies[1,2]. Despite the proposal omany catalysts for the selective oxy-functionalisation of C1–
* Corresponding author.E-mail address:[email protected](F. Arena).
0021-9517/$ – see front matter 2005 Published by Elsevier Inc.doi:10.1016/j.jcat.2005.01.029
-
C5 alkanes in both the scientific and patent literature[1–12],a low process productivity still remains the most significshortcoming for industrial exploitation[1–5]. Furthermore,the partial oxidation of methane to oxygenates does not osome rules for the selective activation of C2–C5 alkanes[1–5].
Several studies in recent years have indicated a supfunctionality of FeOx /SiO2 catalysts in the partial oxidation of methane to formaldehyde (MPO), though it h
3+
been argued that the structure of Fecentres determinestheir activity–selectivity pattern[6–11]. Specifically, “iso-lated” Fe3+ moieties assist selective oxidation paths leading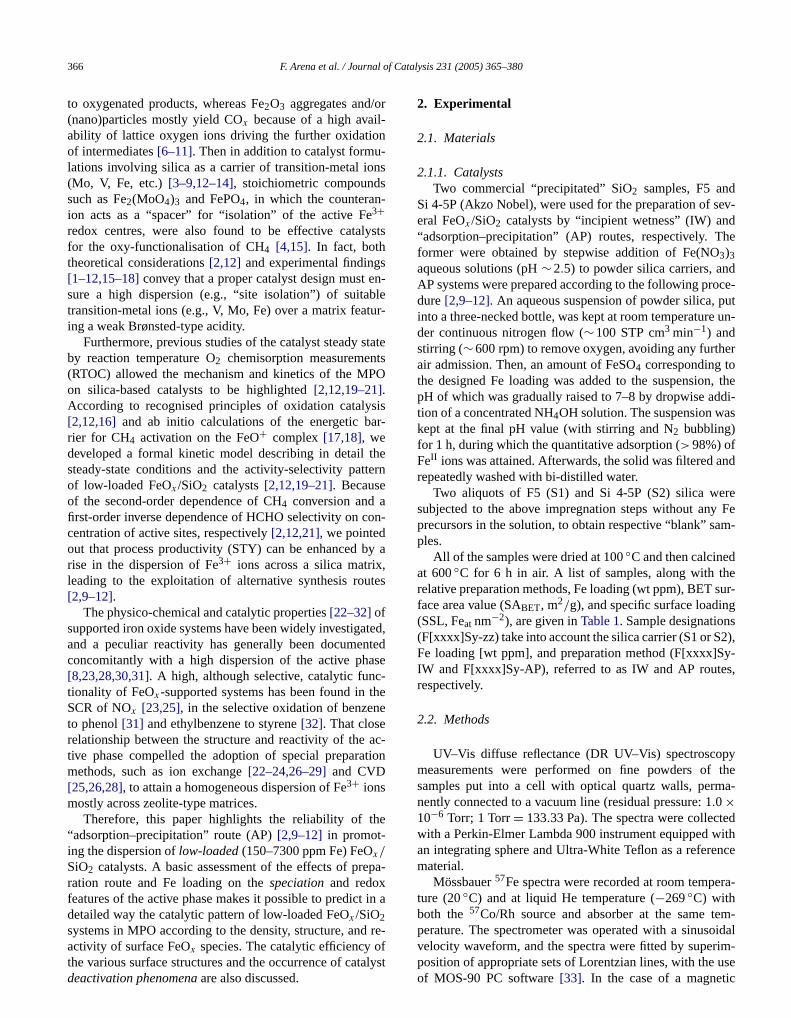
f Ca
rl-n-nss-
ysts
sen-bleur-
tatetsPO
sisar-
thetern
on-
y a,tes
tedntedse
c-thee
ac-tion
e
epa-
in a
re-
ev-dhe
dce-
putun-
er
, thedi-s
and
reFe
m-
eur-gs2),y-s,
pythea-
edithnce
ra-
em-oidal
366 F. Arena et al. / Journal o
to oxygenated products, whereas Fe2O3 aggregates and/o(nano)particles mostly yield COx because of a high avaiability of lattice oxygen ions driving the further oxidatioof intermediates[6–11]. Then in addition to catalyst formulations involving silica as a carrier of transition-metal io(Mo, V, Fe, etc.)[3–9,12–14], stoichiometric compoundsuch as Fe2(MoO4)3 and FePO4, in which the counteranion acts as a “spacer” for “isolation” of the active Fe3+redox centres, were also found to be effective catalfor the oxy-functionalisation of CH4 [4,15]. In fact, boththeoretical considerations[2,12] and experimental finding[1–12,15–18]convey that a proper catalyst design mustsure a high dispersion (e.g., “site isolation”) of suitatransition-metal ions (e.g., V, Mo, Fe) over a matrix feating a weak Brønsted-type acidity.
Furthermore, previous studies of the catalyst steady sby reaction temperature O2 chemisorption measuremen(RTOC) allowed the mechanism and kinetics of the Mon silica-based catalysts to be highlighted[2,12,19–21].According to recognised principles of oxidation cataly[2,12,16] and ab initio calculations of the energetic brier for CH4 activation on the FeO+ complex[17,18], wedeveloped a formal kinetic model describing in detailsteady-state conditions and the activity-selectivity patof low-loaded FeOx /SiO2 catalysts[2,12,19–21]. Becauseof the second-order dependence of CH4 conversion and afirst-order inverse dependence of HCHO selectivity on ccentration of active sites, respectively[2,12,21], we pointedout that process productivity (STY) can be enhanced brise in the dispersion of Fe3+ ions across a silica matrixleading to the exploitation of alternative synthesis rou[2,9–12].
The physico-chemical and catalytic properties[22–32]ofsupported iron oxide systems have been widely investigaand a peculiar reactivity has generally been documeconcomitantly with a high dispersion of the active pha[8,23,28,30,31]. A high, although selective, catalytic funtionality of FeOx-supported systems has been found inSCR of NOx [23,25], in the selective oxidation of benzento phenol[31] and ethylbenzene to styrene[32]. That closerelationship between the structure and reactivity of thetive phase compelled the adoption of special preparamethods, such as ion exchange[22–24,26–29]and CVD[25,26,28], to attain a homogeneous dispersion of Fe3+ ionsmostly across zeolite-type matrices.
Therefore, this paper highlights the reliability of th“adsorption–precipitation” route (AP)[2,9–12] in promot-ing the dispersion oflow-loaded(150–7300 ppm Fe) FeOx/
SiO2 catalysts. A basic assessment of the effects of prration route and Fe loading on thespeciationand redoxfeatures of the active phase makes it possible to predictdetailed way the catalytic pattern of low-loaded FeOx /SiO2systems in MPO according to the density, structure, and
activity of surface FeOx species. The catalytic efficiency ofthe various surface structures and the occurrence of catalysdeactivation phenomenaare also discussed.talysis 231 (2005) 365–380
,
2. Experimental
2.1. Materials
2.1.1. CatalystsTwo commercial “precipitated” SiO2 samples, F5 and
Si 4-5P (Akzo Nobel), were used for the preparation of seral FeOx /SiO2 catalysts by “incipient wetness” (IW) an“adsorption–precipitation” (AP) routes, respectively. Tformer were obtained by stepwise addition of Fe(NO3)3aqueous solutions (pH∼2.5) to powder silica carriers, anAP systems were prepared according to the following produre[2,9–12]. An aqueous suspension of powder silica,into a three-necked bottle, was kept at room temperatureder continuous nitrogen flow (∼100 STP cm3 min−1) andstirring (∼600 rpm) to remove oxygen, avoiding any furthair admission. Then, an amount of FeSO4 corresponding tothe designed Fe loading was added to the suspensionpH of which was gradually raised to 7–8 by dropwise adtion of a concentrated NH4OH solution. The suspension wakept at the final pH value (with stirring and N2 bubbling)for 1 h, during which the quantitative adsorption (>98%) ofFeII ions was attained. Afterwards, the solid was filteredrepeatedly washed with bi-distilled water.
Two aliquots of F5 (S1) and Si 4-5P (S2) silica wesubjected to the above impregnation steps without anyprecursors in the solution, to obtain respective “blank” saples.
All of the samples were dried at 100◦C and then calcinedat 600◦C for 6 h in air. A list of samples, along with threlative preparation methods, Fe loading (wt ppm), BET sface area value (SABET, m2/g), and specific surface loadin(SSL, Feat nm−2), are given inTable 1. Sample designation(F[xxxx]Sy-zz) take into account the silica carrier (S1 or SFe loading [wt ppm], and preparation method (F[xxxx]SIW and F[xxxx]Sy-AP), referred to as IW and AP routerespectively.
2.2. Methods
UV–Vis diffuse reflectance (DR UV–Vis) spectroscomeasurements were performed on fine powders ofsamples put into a cell with optical quartz walls, permnently connected to a vacuum line (residual pressure: 1.0×10⁻⁶ Torr; 1 Torr= 133.33 Pa). The spectra were collectwith a Perkin-Elmer Lambda 900 instrument equipped wan integrating sphere and Ultra-White Teflon as a referematerial.
Mössbauer57Fe spectra were recorded at room tempeture (20◦C) and at liquid He temperature (−269◦C) withboth the 57Co/Rh source and absorber at the same tperature. The spectrometer was operated with a sinus
tvelocity waveform, and the spectra were fitted by superim-position of appropriate sets of Lorentzian lines, with the useof MOS-90 PC software[33]. In the case of a magnetic

F. Arena et al. / Journal of Catalysis 231 (2005) 365–380 367
Table 1List of the studied catalysts
Code Support Preparation method Fe loading(wt ppm)
SABET(m2 g−1)
SSL(Feat nm−2)×102
S1 F5 – 150 607 0.27S2 Si 4-5P – 200 385 0.56F[1000]S1-IW F5 IW–FeIII 1000 593 1.8F[1000]S2-IW Si 4-5P IW–FeIII 1000 402 2.7F[4200]S1-IW F5 IW–FeIII 4200 586 7.7F[4300]S2-IW Si 4-5P IW–FeIII 4300 388 11.9F[3700]S2-AP Si 4-5P AP–FeII 3300 399 10.0F[1000]S1-AP F5 AP–FeII 1000 601 1.8F[1300]S1-AP F5 AP–FeII 1300 599 2.3F[3700]S1-AP F5 AP–FeII 3700 597 6.7
II
per-uch
wasm)
-urents
thea ofataion
de-ar
ionac-
her-
onti-tionzed
h astru-
if-in
omeasncee),t%is-
sis ofsed
ang toyls),
f1-aino--
argens
F[5900]S1-AP F5 AP–FeF[7300]S1-AP F5 AP–FeII
sextet, an asymmetric Gaussian distribution of the hyfine field was allowed for. The resulting parameters, sas average magnetic hyperfine fieldBhf, electric quadru-pole splitting QS, isomer shift IS (relative toα-Fe2O3),Lorentzian linewidth (LW), and resonance area,A, as a per-centage of the Fe content, are taken into account.
Temperature-programmed reduction (TPR) analysisperformed with a linear quartz microreactor (i.d. 4 mfed with a 6% H2/Ar reducing mixture flowing at 30STP cm3 min−1, timely purified of any O2 and H2O. Mea-surements were carried out in the range of 200–800◦C witha heating rate of 20◦C min−1, with an amount of catalyst corresponding to an Fe load of ca. 0.2 mg, to ensdifferential H2 consumption rates. Before measuremeall the catalyst samples were treated in situ at 600◦C for30 min under a 10% O2/He flow. The H2 consumption wasmonitored by a TCD connected by a ChromCard (Fisons In-struments) to a PC for data storage and processing, andresponse was quantitatively calibrated from the TPR areknown amounts of CuO. Under such conditions, TPR dwere reproducible in terms of both peak maximum posit(±10◦C) and extent of hydrogen consumption (±10%).
Modelling of TPR spectra has been performed byconvolution analysis of experimental profiles by a linecombination of Gaussian components[34–36], with the useof the “PeakFit” software package (Jandel Scientific).
Catalyst testing in the MPO under differential conversconditions was performed with a “recirculation batch retor” (BR) operating at 650◦C and 1.71 bar[8,9,19,20], at atotal flow rate of 1000 STP cm3 min−1 (He:N2:CH4:O2 =6:1:2:1) and with a catalyst sample of 0.05 g, unless otwise specified.
The performance of FeOx /SiO2 catalysts has been alsevaluated under integral conversion conditions by conuous-flow (CF) temperature-programmed catalytic reactests in the range of 400–750◦C [13], with the use of a quartmicro-reactor (i.d. 4 mm) containing 0.05 g of catalyst f
with a reaction mixture (CH4, 20%; O2, 10%; He, 70%)flowing at 50 STP cm3 min−1, unless otherwise specified.The temperature was ramped at rate of 10◦C min−1, en-5900 592 10.87300 581 13.5
abling a continuous scanning of reaction stream witquadrupole mass spectrometer (Thermolab, Fisons Inments) connected to the reactor by a heated (180◦C) inletcapillary system[13].
3. Results
3.1. Characterisation of the “fresh” catalysts
3.1.1. DR UV–Vis spectroscopyThe first, though qualitative, evidence of the rather d
ferent efficiencies of the employed preparation routespromoting the iron dispersion on silica carriers stems frthe different colours of the AP and IW catalysts. Whera typical brownish dye of the former signals the preseof Fe2O3 aggregates at any loading (0.1–0.43 wt% FAP samples look colourless up to a loading of 0.73 w(F[7300]S1-AP). However, a basic evaluation of the iron dpersion on the various catalysts can be made on the bathe DR UV–Vis spectra of the calcined samples outgasat room temperature (room temperature) (shown inFig. 1).Under such conditions Fe ions are expected to haveoctahedral coordination (e.g., six ligands correspondinoxygen atoms of the support and adsorbed water/hydroxand, after the calcination at 600◦C, their ON must be+3[27–30].
DR UV–Vis spectra for the bare S2 (a) and S1 (a′) sup-ports are shown inFig. 1A, including also the spectra othe F[1000]S2-IW (b), F[4300]S2-IW (c), and F[4200]SIW (d) catalysts. In the case of the silica support, a mband at 42,500 cm−1, two weaker and overlapped compnents at 36,500 and 32,500 cm−1, and a broad tail spanning the 30,000–15,000 cm−1 range, are observed (Fig. 1A,spectrum a). These absorptions can be attributed to chtransfer (CT) transitions involving titanium and iron iocontained as impurities[27,37]. Both isolated Ti4+ and Fe3+
in (distorted) tetrahedral coordination located in the SiO2bulk could be responsible for the main signal at 42,500 cm−1[27,37]. Notably, isolated Fe3+ ions in a (distorted) octa-
f Ca
ca;es.
P;at
ereaterpre-
res-l
par-es in
ionpro-at
cy
-andated
re-
rtheionss be-
e
icleseddi-of
ar-by a
S2-
rtedom-ando-
is-
AP-nent
snf the
the
A)pec-areisedthedru-entral-
368 F. Arena et al. / Journal o
(A)
(B)
Fig. 1. (A) DR UV–Vis absorption spectra of: (a) bare S2 sili(b) F[1000]S2-IW; (c) F[4300]S2-IW; and (d) F[4200]S1-IW samplFor comparison also the spectrum of the S1 silica (a′) is included.(B) DR UV–Vis spectra of: (a) S1; (b) F[1000]S1-AP; (c) F[3700]S1-Aand (d) F[7300]S1-AP samples.All the samples have been outgassedroom temperature for 1 h.
hedral symmetry at the surface of silica particles, whthey can expand their ligand sphere by adsorbing wmolecules, can also contribute significantly to this band,senting a partner component at 36,500 cm−1 [38]. This latterabsorption, however, might also be a monitor of the pence of surface isolated Ti4+ ions in (distorted) octahedracoordination[39]. Finally, the shoulder at 32,500 cm−1 andthe lower frequency tail can be attributed to TiOx and FeOxaggregates, ranging from “cluster-like” species to nanoticles; the corresponding electronic absorption decreasenergy as their size increases[40].
For the F[1000]S2-IW sample, the overall absorptintensity increases ca. 2.5 times, and the spectralfile is dominated by a broad band with a maximum41,000 cm−1, which is asymmetric on the lower frequen
side and is accompanied by a weak tail in the range of30,000–15,000 cm−1 (Fig. 1A, spectrum b). The main com-ponent at 41,000 cm−1 is assignable to the most intensetalysis 231 (2005) 365–380
CT band of isolated Fe3+ ions in octahedral coordination (the six ligands are oxygen atoms of the supportadsorbed water molecules/hydroxyls), with an associweaker partner in the 37,000–35,000 cm−1 range[38,41].The remaining part of the absorption profile at lower fquency reveals the presence of Fe3+ species in the formof oxidic dimers/oligomers (38,000–25,000 cm−1) and 3-dFe2O3 particles (25,000–10,000 cm−1) [27,42].
The components related to isolated Fe3+ species appeato be strongly reduced in intensity in the spectrum ofF[4300]S2-IW sample, whereas the intensity of absorptdue to aggregated species is significantly enhanced, thucoming the dominant feature (Fig. 1A, spectrum c). Theheavy shoulder at ca. 20,000 cm−1 monitors the massivpresence of nanometric Fe2O3 particles, after the spectrumof a silica-diluted hematite powder with an average partsize of 3 nm (Fig. 1A; see inset). A corresponding decreain absorption due to isolated species indicates that the ation of large amounts of Fe by IW involves a high degreeagglomeration of Fe3+ ions.
The effect of the specific surface area of the silica crier on dispersion of the iron species can be assessedcomparison of the spectra of the similarly loaded F[4300]IW (Fig. 1A, spectrum c) and F[4200]S1-IW (Fig. 1A,spectrum d) system. With respect to catalyst suppoon S2, the F[4200]S1-IW sample exhibits a spectrum dinated by a complex absorption with maxima at 43,00039,000 cm−1, resulting from overlapping components of islated octahedral Fe3+ species and octahedral Fe3+ species inthe form of oxidic dimers/oligomers, indicating a better dpersion of iron in this case.
For the differently loaded catalysts prepared via themethod on S1 silica (Fig. 1B), the DR UV–Vis patterns appear in any case to be dominated by a main compolocated at a frequency higher than 40,000 cm−1, even for aFe loading of 0.73 wt% (Fig. 1B, spectrum d). This indicatethat well-dispersed Fe3+ ions in an octahedral coordinatioare present on such systems. However, a regular shift oabsorption maximum from ca. 45,000 to 40,500 cm−1 sig-nals a rising degree of nuclearity of the iron species asloading increases.
3.1.2. 57Fe Mössbauer spectroscopyThe 57Fe Mössbauer spectra of the F[4300]S2-IW (
and F[7300]S1-AP (B) samples at room temperature (strum a) and at liquid helium temperature (spectrum b)shown inFig. 2, and the related parameters are summarin Table 2. In the case of the Fe[4300]S2-IW sample,spectrum at room temperature exhibits a simple quapole doublet with hyperfine parameters typical of trivalparamagnetic iron ions in a slightly distorted octahedenvironment (Fig. 2A, a), which is transformed almost completely into a six-line pattern at−269◦C (Fig. 2A, b),
indicating that almost all of the iron is present in the form ofsuperparamagnetic iron oxide nanoparticles with an averagesize of ca. 8 nm[43]. Although the hyperfine parameters of
F. Arena et al. / Journal of Catalysis 231 (2005) 365–380 369
Table 2Mössbauer parameters of the F[4300]S2-IW and F[7300]S1-AP catalysts
Sample T
(◦C)Bhf(T)
QS(mm/s)
IS(mm/s)
LW(mm/s)
A
(%)Iron species(at−269◦C)
F[4300]S2-IW 20 – 0.78 (1) 0.33 (1) 0.52 (1) 100−269 48.1 (1) −0.02 (1) 0.33 (1) – 96 (2) Iron oxide
– 1.08 (8) 0.39 (1) 0.43 (8) 4 (2) Paramagnetic Fe3+
F[7300]S1-AP 20 – 0.78 (5) 0.32 (3) 0.51 (1) 40 (20)– 1.08 (5) 0.38 (2) 0.82 (5) 60 (20)
−269 39.7 (2) −0.01 (3) 0.32 (2) – 52 (5) Iron oxide– 0.99 (1) 0.39 (1) 0.82 (1) 48 (5) Paramagnetic Fe3+
(A) (B)
(spec
ulk
this
-APhichS
rn is
ent
dif-
velyta,e
ect
Fig. 2.57Fe Mössbauer spectra at room temperature (spectra a) and−269◦Chave been outgassed at room temperature for 1 h.
this magnetic sextet are slightly different from those of bcrystalline α-Fe2O3 [44], previous studies on FeOx /SiO2
systems, bearing a higher Fe loading, suggest thatdiscrepancy could result either from the nano-size of theα-Fe2O3 crystals or from an amorphous character of Fe2O3
particles[45].The spectrum at room temperature of the Fe[7300]S1
sample consists of an asymmetric quadrupole doublet, wcan be fitted with two Fe(III) components with different Q(Fig. 2B, a), as shown inTable 2. At −269◦C, the coex-istence of a quadrupole doublet and a magnetic patte
observed (Fig. 2B, b). In particular, the resonance area of themagnetic component corresponds to ca. 50% of the overalltra b) of F[4300]S2-IW (A) and F[7300]S1-AP (B) catalysts.All the samples
spectrum, indicating that only about half of the iron contis in the form of superparamagnetic iron oxide species.
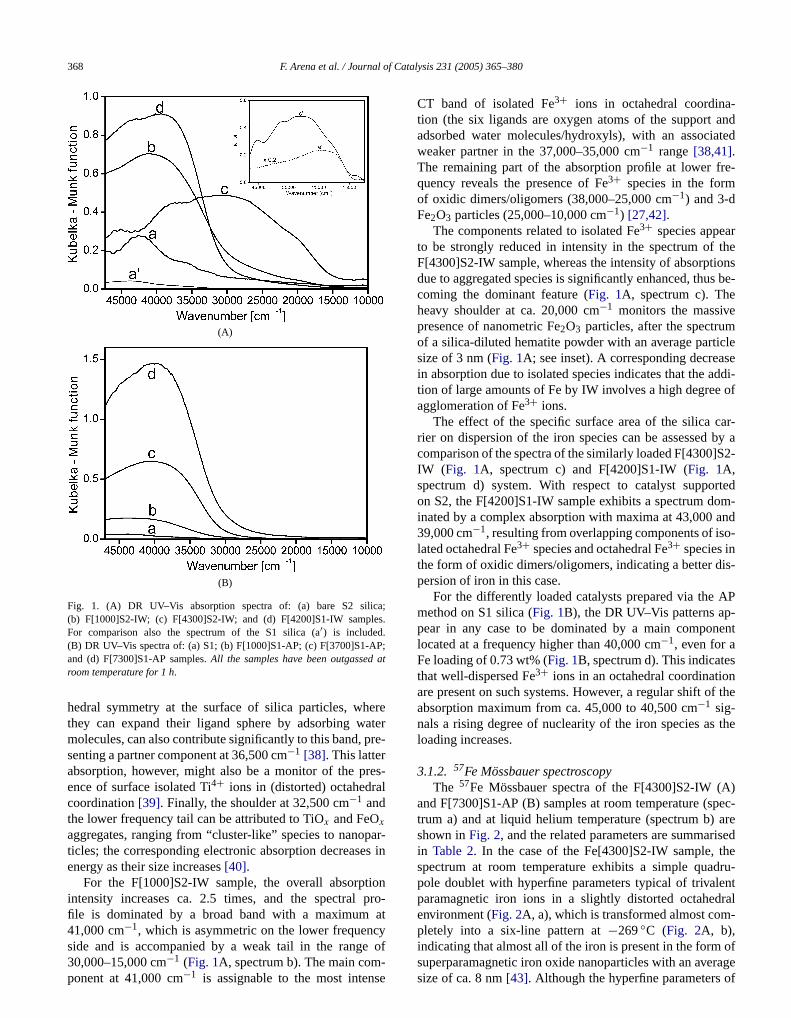
3.1.3. Temperature-programmed reductionTPR profiles (normalised to the integral peak area) of
ferently loaded FeOx /SiO2 catalysts, prepared by AP or IWmethods on both F5 and Si 4-5P silicas, are comparatishown inFig. 3. Quantitative hydrogen consumption daexpressed as the number of H2 molecules consumed per Fatom (H2/Fe), signal in any case a H2/Fe ratio close to 0.5(e.g., 0.42–0.56), thus denoting a “strong” inhibiting eff
2+ 0
of the matrix on the reduction of Fe ions to Fe.The influence of the Fe loading on the reduction patternof F[xxxx]S1-AP catalysts is shown inFig. 3A. The bare S1
370 F. Arena et al. / Journal of Catalysis 231 (2005) 365–380
(A) (B) (C)
200] b);the i
gn
umkly-in
of
eak
m-9de,ents
ar-7–
nd
les
ous
thansil-y at
onnl
pre-
, Fein-
rior
g
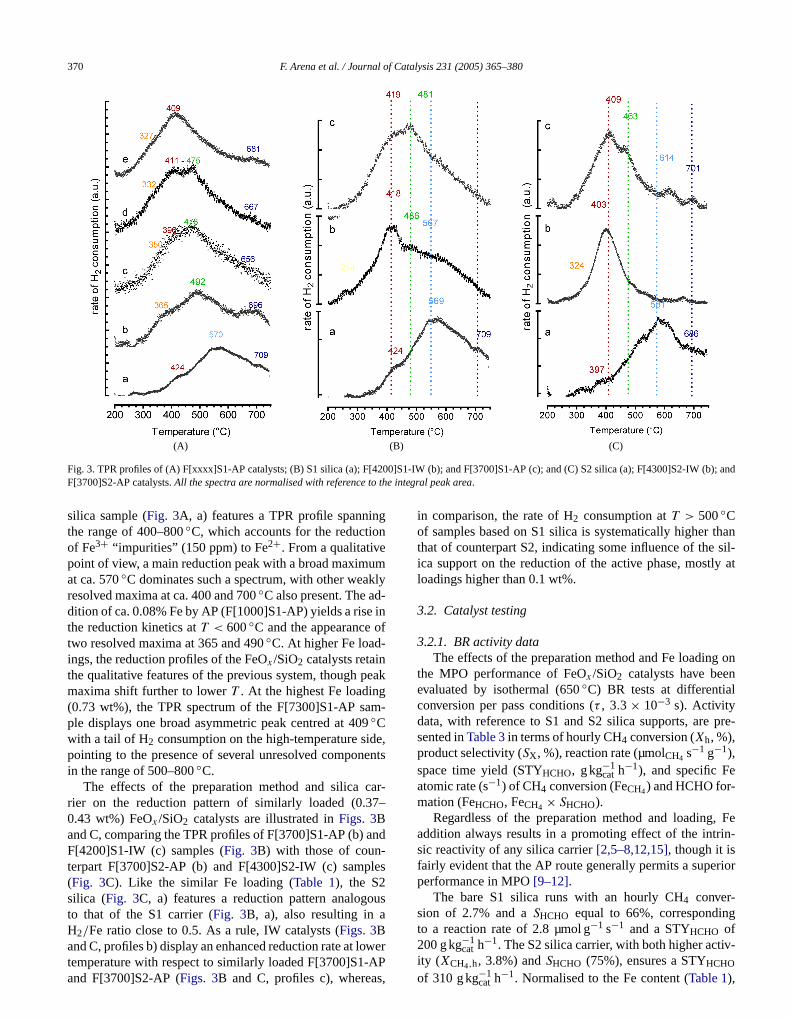
Fig. 3. TPR profiles of (A) F[xxxx]S1-AP catalysts; (B) S1 silica (a); F[4F[3700]S2-AP catalysts.All the spectra are normalised with reference to
silica sample (Fig. 3A, a) features a TPR profile spanninthe range of 400–800◦C, which accounts for the reductioof Fe3+ “impurities” (150 ppm) to Fe2+. From a qualitativepoint of view, a main reduction peak with a broad maximat ca. 570◦C dominates such a spectrum, with other wearesolved maxima at ca. 400 and 700◦C also present. The addition of ca. 0.08% Fe by AP (F[1000]S1-AP) yields a risethe reduction kinetics atT < 600◦C and the appearancetwo resolved maxima at 365 and 490◦C. At higher Fe load-ings, the reduction profiles of the FeOx /SiO2 catalysts retainthe qualitative features of the previous system, though pmaxima shift further to lowerT . At the highest Fe loading(0.73 wt%), the TPR spectrum of the F[7300]S1-AP saple displays one broad asymmetric peak centred at 40◦Cwith a tail of H2 consumption on the high-temperature sipointing to the presence of several unresolved componin the range of 500–800◦C.
The effects of the preparation method and silica crier on the reduction pattern of similarly loaded (0.30.43 wt%) FeOx /SiO2 catalysts are illustrated inFigs. 3Band C, comparing the TPR profiles of F[3700]S1-AP (b) aF[4200]S1-IW (c) samples (Fig. 3B) with those of coun-terpart F[3700]S2-AP (b) and F[4300]S2-IW (c) samp(Fig. 3C). Like the similar Fe loading (Table 1), the S2silica (Fig. 3C, a) features a reduction pattern analogto that of the S1 carrier (Fig. 3B, a), also resulting in aH2/Fe ratio close to 0.5. As a rule, IW catalysts (Figs. 3B
and C, profiles b) display an enhanced reduction rate at lowertemperature with respect to similarly loaded F[3700]S1-APand F[3700]S2-AP (Figs. 3B and C, profiles c), whereas,S1-IW (b); and F[3700]S1-AP (c); and (C) S2 silica (a); F[4300]S2-IW (andntegral peak area.
in comparison, the rate of H2 consumption atT > 500◦Cof samples based on S1 silica is systematically higherthat of counterpart S2, indicating some influence of theica support on the reduction of the active phase, mostlloadings higher than 0.1 wt%.
3.2. Catalyst testing
3.2.1. BR activity dataThe effects of the preparation method and Fe loading
the MPO performance of FeOx /SiO2 catalysts have beeevaluated by isothermal (650◦C) BR tests at differentiaconversion per pass conditions (τ , 3.3 × 10⁻³ s). Activitydata, with reference to S1 and S2 silica supports, aresented inTable 3in terms of hourly CH4 conversion (Xh, %),product selectivity (SX, %), reaction rate (µmolCH4 s−1 g−1),space time yield (STYHCHO, g kg−1
cat h−1), and specific Fe
atomic rate (s−1) of CH4 conversion (FeCH4) and HCHO for-mation (FeHCHO, FeCH4 × SHCHO).
Regardless of the preparation method and loadingaddition always results in a promoting effect of the intrsic reactivity of any silica carrier[2,5–8,12,15], though it isfairly evident that the AP route generally permits a supeperformance in MPO[9–12].
The bare S1 silica runs with an hourly CH4 conver-sion of 2.7% and aSHCHO equal to 66%, correspondinto a reaction rate of 2.8 µmol g−1 s−1 and a STYHCHO of
−1 −1
200 g kgcat h . The S2 silica carrier, with both higher activ-ity (XCH4,h, 3.8%) andSHCHO (75%), ensures a STYHCHOof 310 g kg−1cat h
−1. Normalised to the Fe content (Table 1),
F. Arena et al. / Journal of Catalysis 231 (2005) 365–380 371
Table 3BR data of FeOx /SiO2 catalysts in MPO at 650◦C. Effect of the preparation method and Fe loading
Sample XCH4,h(%)
SHCHO(%)
SCO(%)
SCO2(%)
Rate(µmol s−1 g−1)
STYHCHO(g kg−1
cat h−1)FeCH4
(s−1)
FeHCHO(s−1)
S2 3.8 75 16 6 3.8 310 1.06 0.75S1 2.7 66 26 8 2.8 200 1.05 0.66
F[1000]S1-IW 8.6 55 28 17 8.8 525 0.50 0.27F[1000]S2-IW 9.9 54 27 19 10.1 580 0.57 0.31F[4300]S2-IW 7.8 47 22 31 10.4 405 0.14 0.06
F[3700]S2-AP 37.2 33 29 38 37.9 1350 0.57 0.19F[1000]S1-AP 14.6 63 25 12 15.0 1020 0.84 0.53F[3700]S1-AP 34.2 36 37 27 35.1 1360 0.53 0.19
F[3700]S2-APa 4.6 55 23 22 47.3 2800 0.72 0.39
aar-c-insent
r.licaty
g-
the
F5-
o
oby
or-
vity
APfold
ofe
ontiv-
d-n istais,ity
der-e in
F[7300]S1-AP 4.8 54 23 23
a Catalyst testing at tenfold lower contact time (wcat, 0.005 g).
however, the two silica samples feature analogous FeCH4
(1.05–1.06 s−1) and FeHCHO (0.66–0.75 s−1) values.The addition of ca. 0.10 wt% Fe to the Si 4-5P c
rier by IW (F[1000]S2-IW) implies a threefold rise in ativity (XCH4,h, 9.9%) counterbalanced by a loweringSHCHO from 75 to 54%. Though there is a significant riin STYHCHO (580 g kg−1
cat h−1), the above figures accou
for a decrease in FeCH4 to 0.50 s−1 and, mostly, in theFeHCHO value (0.27 s−1) with reference to the S2 carrieThe same amount of Fe (0.1 wt%) put on the F5 siby IW (F[1000]S1-IW) attains a similar effect on activi(XCH4,h, 8.6%) and selectivity (SHCHO, 55%), also in termsof FeCH4 and FeHCHO (Table 3). The addition of 0.43 wt%Fe to S2 silica, still by the IW route, has a strongly neative impact on the MPO functionality of the FeOx /SiO2
system, as the F[4300]S2-IW attains aXh of 7.8%, result-ing in a very low FeCH4 value (0.14 s−1), coupled to aSHCHO of 47%. These figures account for a STYHCHO ofonly 405 g kg−1
cat h−1 and a FeHCHO value (0.06 s−1) that
is lower by about one order of magnitude than that ofF[1000]S2-IW sample.
The F[1000]S1-AP catalyst, bearing 0.1 wt% Fe onsilica by AP, is much more active (Xh, 14.6%) and selective (SHCHO, 63%) than previous ones, featuring FeCH4
(0.84 s−1) and FeHCHO (0.53 s−1) values comparable tthose of silica carriers and attaining a remarkable STYHCHO
of 1,020 g kg−1cat h
−1. A Fe content (3700 ppm) similar tthat of the F[4300]S2-IW sample, added to S2 silicaAP (F[3700]S2-AP), yields an activity (Xh, 37.2%) five-fold larger than that of the counterpart IW sample, cresponding to an FeCH4 value of 0.57 s−1. In spite ofthe “high” conversion level, this catalyst ensures aSHCHO
of 33%, accounting for a STYHCHO of 1350 g kg−1cat h
−1 anda FeHCHO value of 0.19 s−1. With FeCH4 (0.53 s−1), FeHCHO
(0.19 s−1), and STYHCHO (1360 gkg−1cat h
−1) values com-parable to those of the homologous F[3700]S2-AP, acti
data for the F[3700]S1-AP system confirm a slight, if any,effect of the silica carrier on activity, also at higher loadingof the active phase.49.2 2870 0.38 0.20
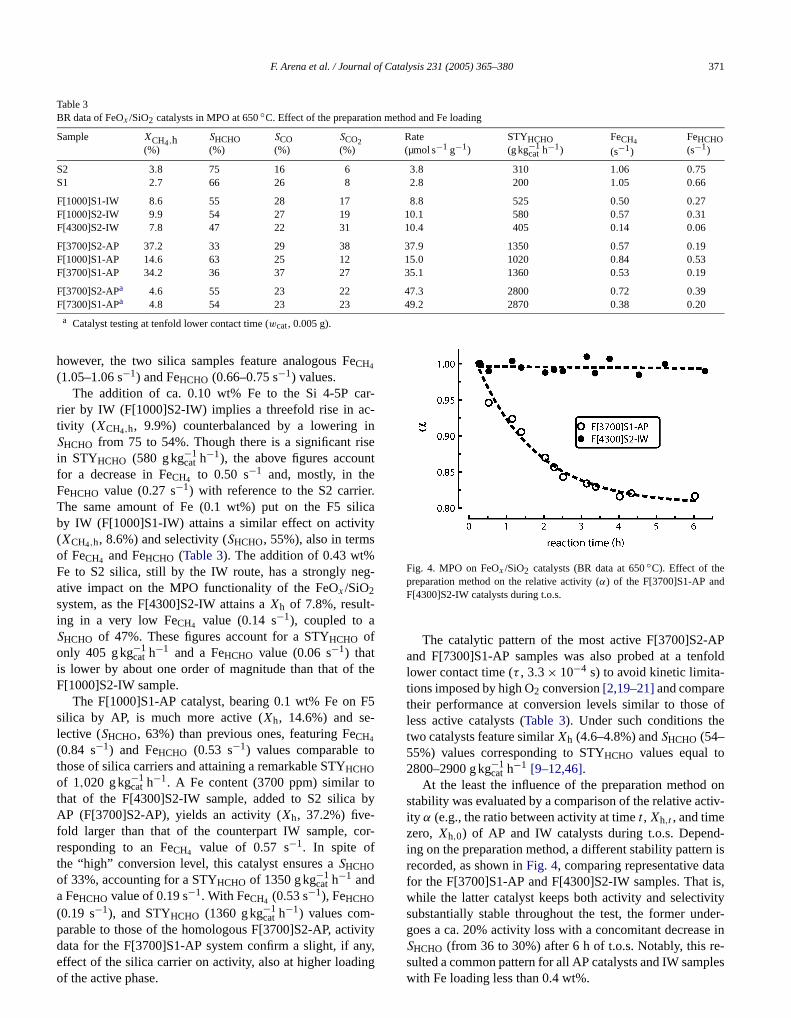
Fig. 4. MPO on FeOx /SiO2 catalysts (BR data at 650◦C). Effect of thepreparation method on the relative activity (α) of the F[3700]S1-AP andF[4300]S2-IW catalysts during t.o.s.
The catalytic pattern of the most active F[3700]S2-and F[7300]S1-AP samples was also probed at a tenlower contact time (τ , 3.3× 10⁻⁴ s) to avoid kinetic limita-tions imposed by high O2 conversion[2,19–21]and comparetheir performance at conversion levels similar to thoseless active catalysts (Table 3). Under such conditions thtwo catalysts feature similarXh (4.6–4.8%) andSHCHO (54–55%) values corresponding to STYHCHO values equal to2800–2900 g kg−1
cat h−1 [9–12,46].
At the least the influence of the preparation methodstability was evaluated by a comparison of the relative acity α (e.g., the ratio between activity at timet , Xh,t , and timezero, Xh,0) of AP and IW catalysts during t.o.s. Depening on the preparation method, a different stability patterrecorded, as shown inFig. 4, comparing representative dafor the F[3700]S1-AP and F[4300]S2-IW samples. Thatwhile the latter catalyst keeps both activity and selectivsubstantially stable throughout the test, the former ungoes a ca. 20% activity loss with a concomitant decreas
SHCHO (from 36 to 30%) after 6 h of t.o.s. Notably, this re-sulted a common pattern for all AP catalysts and IW sampleswith Fe loading less than 0.4 wt%.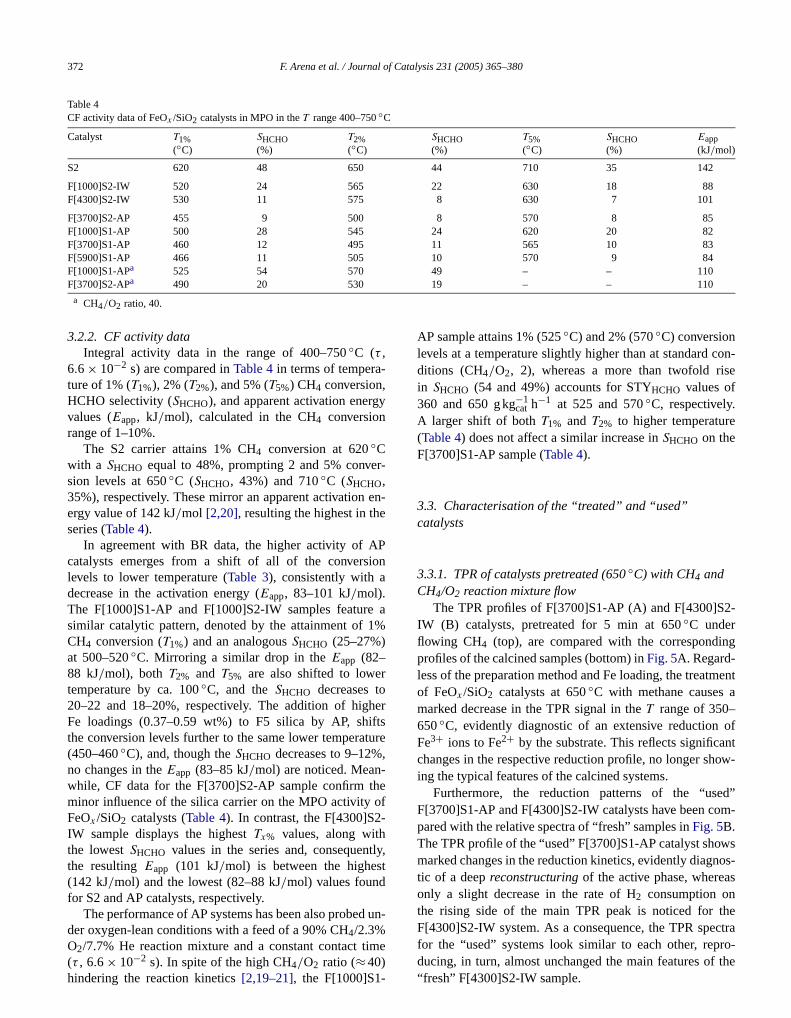
372 F. Arena et al. / Journal of Catalysis 231 (2005) 365–380
Table 4CF activity data of FeOx /SiO2 catalysts in MPO in theT range 400–750◦C
Catalyst T1%(◦C)
SHCHO(%)
T2%(◦C)
SHCHO(%)
T5%(◦C)
SHCHO(%)
Eapp(kJ/mol)
S2 620 48 650 44 710 35 142
F[1000]S2-IW 520 24 565 22 630 18 88F[4300]S2-IW 530 11 575 8 630 7 101
F[3700]S2-AP 455 9 500 8 570 8 85F[1000]S1-AP 500 28 545 24 620 20 82F[3700]S1-AP 460 12 495 11 565 10 83F[5900]S1-AP 466 11 505 10 570 9 84F[1000]S1-APa 525 54 570 49 – – 110
-
y
r-
en-e
Pion
e a1%
r
herftsture,
-theof-
tly,t
d un
con-se
e
2-
ing
menta
ofntow-
ed”om-
wsnos-s
thectraro-
F[3700]S2-APa 490 20 530
a CH4/O2 ratio, 40.
3.2.2. CF activity dataIntegral activity data in the range of 400–750◦C (τ ,
6.6 × 10⁻² s) are compared inTable 4in terms of temperature of 1% (T1%), 2% (T2%), and 5% (T5%) CH4 conversion,HCHO selectivity (SHCHO), and apparent activation energvalues (Eapp, kJ/mol), calculated in the CH4 conversionrange of 1–10%.
The S2 carrier attains 1% CH4 conversion at 620◦Cwith a SHCHO equal to 48%, prompting 2 and 5% convesion levels at 650◦C (SHCHO, 43%) and 710◦C (SHCHO,35%), respectively. These mirror an apparent activationergy value of 142 kJ/mol [2,20], resulting the highest in thseries (Table 4).
In agreement with BR data, the higher activity of Acatalysts emerges from a shift of all of the converslevels to lower temperature (Table 3), consistently with adecrease in the activation energy (Eapp, 83–101 kJ/mol).The F[1000]S1-AP and F[1000]S2-IW samples featursimilar catalytic pattern, denoted by the attainment ofCH4 conversion (T1%) and an analogousSHCHO (25–27%)at 500–520◦C. Mirroring a similar drop in theEapp (82–88 kJ/mol), both T2% and T5% are also shifted to lowetemperature by ca. 100◦C, and theSHCHO decreases to20–22 and 18–20%, respectively. The addition of higFe loadings (0.37–0.59 wt%) to F5 silica by AP, shithe conversion levels further to the same lower tempera(450–460◦C), and, though theSHCHO decreases to 9–12%no changes in theEapp (83–85 kJ/mol) are noticed. Meanwhile, CF data for the F[3700]S2-AP sample confirmminor influence of the silica carrier on the MPO activityFeOx /SiO2 catalysts (Table 4). In contrast, the F[4300]S2IW sample displays the highestTx% values, along withthe lowestSHCHO values in the series and, consequenthe resultingEapp (101 kJ/mol) is between the highes(142 kJ/mol) and the lowest (82–88 kJ/mol) values foundfor S2 and AP catalysts, respectively.
The performance of AP systems has been also probeder oxygen-lean conditions with a feed of a 90% CH4/2.3%
O2/7.7% He reaction mixture and a constant contact time(τ , 6.6 × 10⁻² s). In spite of the high CH4/O2 ratio (≈40)hindering the reaction kinetics[2,19–21], the F[1000]S1-19 – – 110
-
AP sample attains 1% (525◦C) and 2% (570◦C) conversionlevels at a temperature slightly higher than at standardditions (CH4/O2, 2), whereas a more than twofold riin SHCHO (54 and 49%) accounts for STYHCHO values of360 and 650 g kg−1
cat h−1 at 525 and 570◦C, respectively.
A larger shift of bothT1% and T2% to higher temperatur(Table 4) does not affect a similar increase inSHCHO on theF[3700]S1-AP sample (Table 4).
3.3. Characterisation of the “treated” and “used”catalysts
3.3.1. TPR of catalysts pretreated (650◦C) with CH4 andCH4/O2 reaction mixture flow
The TPR profiles of F[3700]S1-AP (A) and F[4300]SIW (B) catalysts, pretreated for 5 min at 650◦C underflowing CH4 (top), are compared with the correspondprofiles of the calcined samples (bottom) inFig. 5A. Regard-less of the preparation method and Fe loading, the treatof FeOx /SiO2 catalysts at 650◦C with methane causesmarked decrease in the TPR signal in theT range of 350–650◦C, evidently diagnostic of an extensive reductionFe3+ ions to Fe2+ by the substrate. This reflects significachanges in the respective reduction profile, no longer shing the typical features of the calcined systems.
Furthermore, the reduction patterns of the “usF[3700]S1-AP and F[4300]S2-IW catalysts have been cpared with the relative spectra of “fresh” samples inFig. 5B.The TPR profile of the “used” F[3700]S1-AP catalyst shomarked changes in the reduction kinetics, evidently diagtic of a deepreconstructuringof the active phase, whereaonly a slight decrease in the rate of H2 consumption onthe rising side of the main TPR peak is noticed forF[4300]S2-IW system. As a consequence, the TPR spefor the “used” systems look similar to each other, rep
ducing, in turn, almost unchanged the main features of the“fresh” F[4300]S2-IW sample.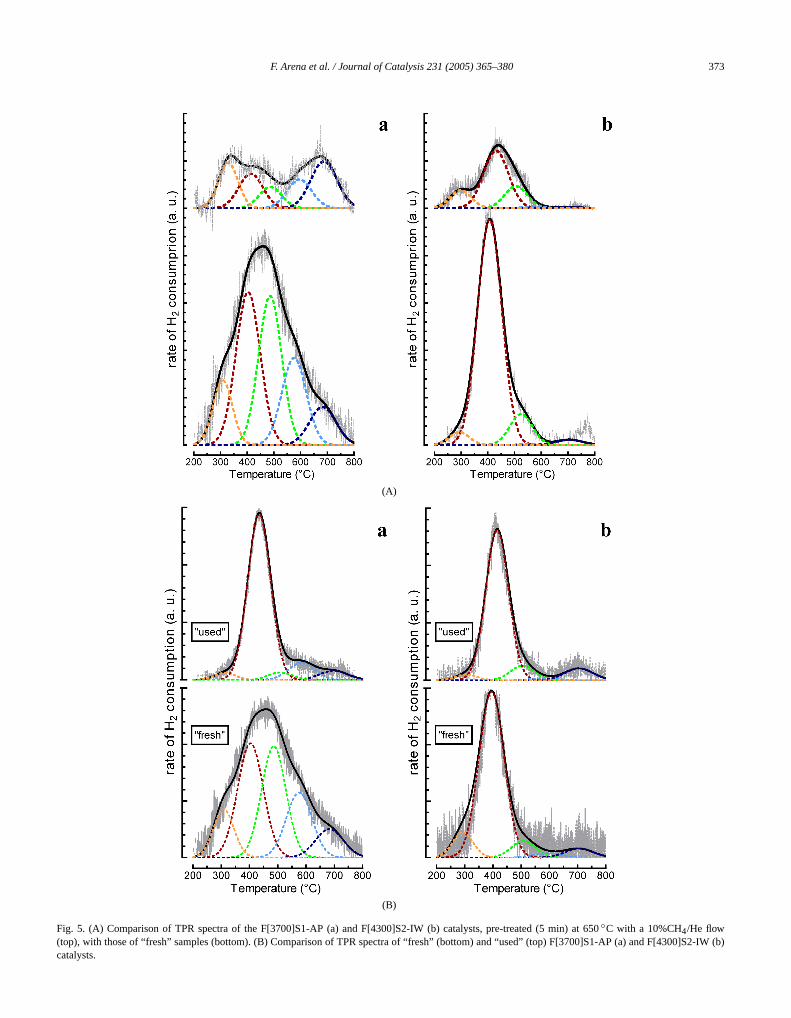
2-IW (
F. Arena et al. / Journal of Catalysis 231 (2005) 365–380 373
(A)
(B)
Fig. 5. (A) Comparison of TPR spectra of the F[3700]S1-AP (a) and F[4300]S2-IW (b) catalysts, pre-treated (5 min) at 650◦C with a 10%CH4/He flow(top), with those of “fresh” samples (bottom). (B) Comparison of TPR spectra of “fresh” (bottom) and “used” (top) F[3700]S1-AP (a) and F[4300]Sb)
catalysts.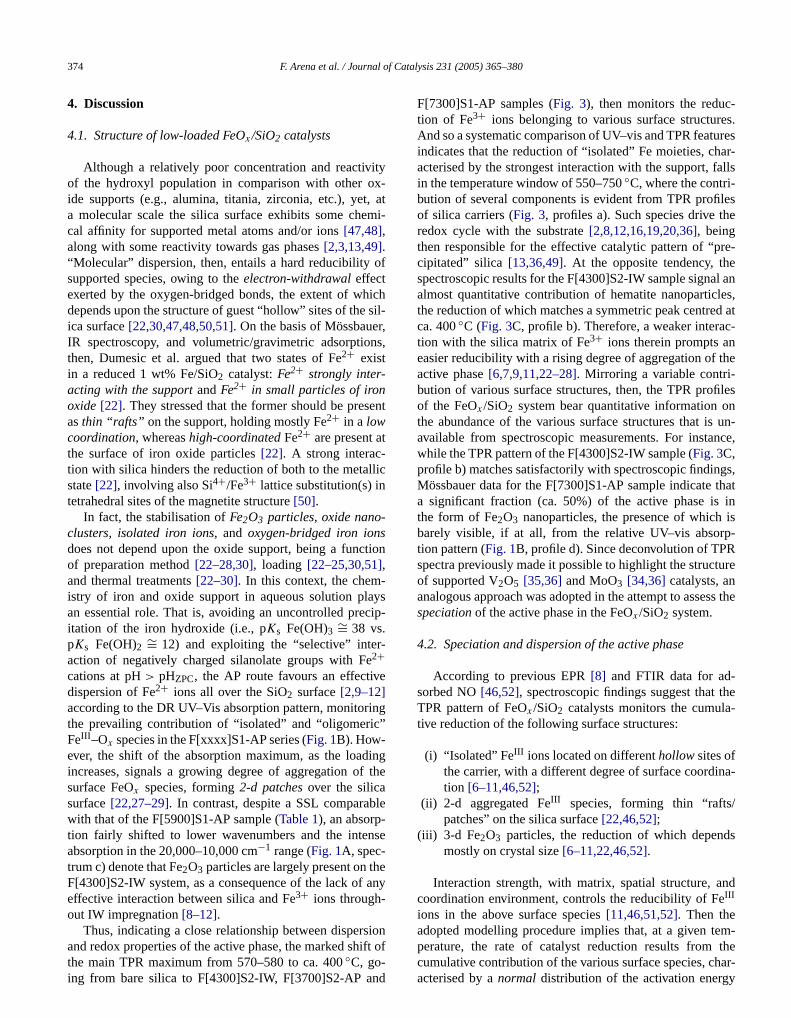
f Ca
ityx-, atmi-
of
ichsil-r,ns,
ent
t
llic
-
tion
-ys
cip-
-ee
ing”
ingf the
ble
se
heany
sion
-es.resar-
falls
leshe
re-el anles,d atc-nthe
filesnun-
nce,
gs,thatinis
p-Rture
ss the
-the-
na-
/
ds
nd
em-
374 F. Arena et al. / Journal o
4. Discussion
4.1. Structure of low-loaded FeOx /SiO2 catalysts
Although a relatively poor concentration and reactivof the hydroxyl population in comparison with other oide supports (e.g., alumina, titania, zirconia, etc.), yeta molecular scale the silica surface exhibits some checal affinity for supported metal atoms and/or ions[47,48],along with some reactivity towards gas phases[2,3,13,49].“Molecular” dispersion, then, entails a hard reducibilitysupported species, owing to theelectron-withdrawaleffectexerted by the oxygen-bridged bonds, the extent of whdepends upon the structure of guest “hollow” sites of theica surface[22,30,47,48,50,51]. On the basis of MössbaueIR spectroscopy, and volumetric/gravimetric adsorptiothen, Dumesic et al. argued that two states of Fe2+ existin a reduced 1 wt% Fe/SiO2 catalyst:Fe2+ strongly inter-acting with the supportandFe2+ in small particles of ironoxide[22]. They stressed that the former should be presasthin “rafts” on the support, holding mostly Fe2+ in a lowcoordination, whereashigh-coordinatedFe2+ are present athe surface of iron oxide particles[22]. A strong interac-tion with silica hinders the reduction of both to the metastate[22], involving also Si4+/Fe3+ lattice substitution(s) intetrahedral sites of the magnetite structure[50].
In fact, the stabilisation ofFe2O3 particles, oxide nanoclusters, isolated iron ions, and oxygen-bridged iron ionsdoes not depend upon the oxide support, being a funcof preparation method[22–28,30], loading [22–25,30,51],and thermal treatments[22–30]. In this context, the chemistry of iron and oxide support in aqueous solution plaan essential role. That is, avoiding an uncontrolled preitation of the iron hydroxide (i.e., pKs Fe(OH)3 ∼= 38 vs.pKs Fe(OH)2 ∼= 12) and exploiting the “selective” interaction of negatively charged silanolate groups with F2+cations at pH> pHZPC, the AP route favours an effectivdispersion of Fe2+ ions all over the SiO2 surface[2,9–12]according to the DR UV–Vis absorption pattern, monitorthe prevailing contribution of “isolated” and “oligomericFeIII –Ox species in the F[xxxx]S1-AP series (Fig. 1B). How-ever, the shift of the absorption maximum, as the loadincreases, signals a growing degree of aggregation osurface FeOx species, forming2-d patchesover the silicasurface[22,27–29]. In contrast, despite a SSL comparawith that of the F[5900]S1-AP sample (Table 1), an absorp-tion fairly shifted to lower wavenumbers and the intenabsorption in the 20,000–10,000 cm−1 range (Fig. 1A, spec-trum c) denote that Fe2O3 particles are largely present on tF[4300]S2-IW system, as a consequence of the lack ofeffective interaction between silica and Fe3+ ions through-out IW impregnation[8–12].
Thus, indicating a close relationship between disper
and redox properties of the active phase, the marked shift ofthe main TPR maximum from 570–580 to ca. 400◦C, go-ing from bare silica to F[4300]S2-IW, F[3700]S2-AP andtalysis 231 (2005) 365–380
F[7300]S1-AP samples (Fig. 3), then monitors the reduction of Fe3+ ions belonging to various surface structurAnd so a systematic comparison of UV–vis and TPR featuindicates that the reduction of “isolated” Fe moieties, chacterised by the strongest interaction with the support,in the temperature window of 550–750◦C, where the contri-bution of several components is evident from TPR profiof silica carriers (Fig. 3, profiles a). Such species drive tredox cycle with the substrate[2,8,12,16,19,20,36], beingthen responsible for the effective catalytic pattern of “pcipitated” silica [13,36,49]. At the opposite tendency, thspectroscopic results for the F[4300]S2-IW sample signaalmost quantitative contribution of hematite nanoparticthe reduction of which matches a symmetric peak centreca. 400◦C (Fig. 3C, profile b). Therefore, a weaker interation with the silica matrix of Fe3+ ions therein prompts aeasier reducibility with a rising degree of aggregation ofactive phase[6,7,9,11,22–28]. Mirroring a variable contri-bution of various surface structures, then, the TPR proof the FeOx /SiO2 system bear quantitative information othe abundance of the various surface structures that isavailable from spectroscopic measurements. For instawhile the TPR pattern of the F[4300]S2-IW sample (Fig. 3C,profile b) matches satisfactorily with spectroscopic findinMössbauer data for the F[7300]S1-AP sample indicatea significant fraction (ca. 50%) of the active phase isthe form of Fe2O3 nanoparticles, the presence of whichbarely visible, if at all, from the relative UV–vis absortion pattern (Fig. 1B, profile d). Since deconvolution of TPspectra previously made it possible to highlight the strucof supported V2O5 [35,36] and MoO3 [34,36] catalysts, ananalogous approach was adopted in the attempt to assespeciationof the active phase in the FeOx /SiO2 system.
4.2. Speciation and dispersion of the active phase
According to previous EPR[8] and FTIR data for adsorbed NO[46,52], spectroscopic findings suggest thatTPR pattern of FeOx /SiO2 catalysts monitors the cumulative reduction of the following surface structures:
(i) “Isolated” FeIII ions located on differenthollowsites ofthe carrier, with a different degree of surface coordition [6–11,46,52];
(ii) 2-d aggregated FeIII species, forming thin “raftspatches” on the silica surface[22,46,52];
(iii) 3-d Fe2O3 particles, the reduction of which depenmostly on crystal size[6–11,22,46,52].
Interaction strength, with matrix, spatial structure, acoordination environment, controls the reducibility of FeIII
ions in the above surface species[11,46,51,52]. Then theadopted modelling procedure implies that, at a given t
perature, the rate of catalyst reduction results from thecumulative contribution of the various surface species, char-acterised by anormal distribution of the activation energy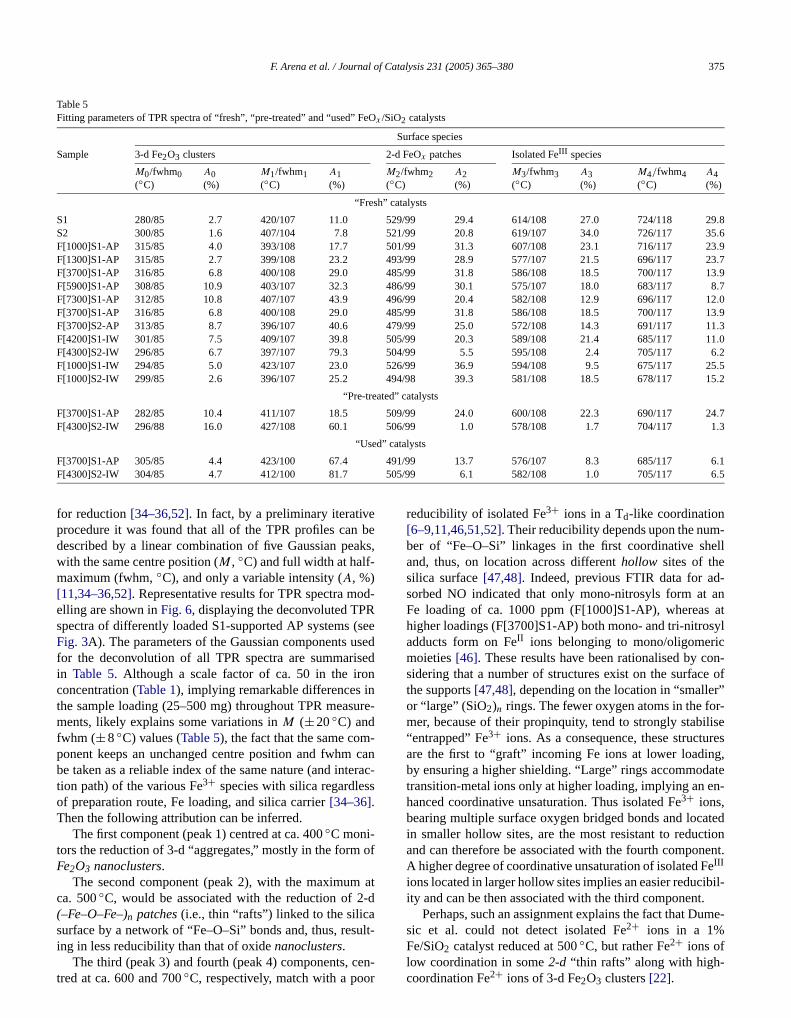
F. Arena et al. / Journal of Catalysis 231 (2005) 365–380 375
Table 5Fitting parameters of TPR spectra of “fresh”, “pre-treated” and “used” FeOx /SiO2 catalysts
Surface species
Sample 3-d Fe2O3 clusters 2-d FeOx patches Isolated FeIII species
M0/fwhm0(◦C)
A0(%)
M1/fwhm1(◦C)
A1(%)
M2/fwhm2(◦C)
A2(%)
M3/fwhm3(◦C)
A3(%)
M4/fwhm4(◦C)
A4(%)
“Fresh” catalysts
S1 280/85 2.7 420/107 11.0 529/99 29.4 614/108 27.0 724/118 29.8S2 300/85 1.6 407/104 7.8 521/99 20.8 619/107 34.0 726/117 35.6F[1000]S1-AP 315/85 4.0 393/108 17.7 501/99 31.3 607/108 23.1 716/117 23.9F[1300]S1-AP 315/85 2.7 399/108 23.2 493/99 28.9 577/107 21.5 696/117 23.7F[3700]S1-AP 316/85 6.8 400/108 29.0 485/99 31.8 586/108 18.5 700/117 13.9F[5900]S1-AP 308/85 10.9 403/107 32.3 486/99 30.1 575/107 18.0 683/117 8.7F[7300]S1-AP 312/85 10.8 407/107 43.9 496/99 20.4 582/108 12.9 696/117 12.0F[3700]S1-AP 316/85 6.8 400/108 29.0 485/99 31.8 586/108 18.5 700/117 13.9F[3700]S2-AP 313/85 8.7 396/107 40.6 479/99 25.0 572/108 14.3 691/117 11.3F[4200]S1-IW 301/85 7.5 409/107 39.8 505/99 20.3 589/108 21.4 685/117 11.0F[4300]S2-IW 296/85 6.7 397/107 79.3 504/99 5.5 595/108 2.4 705/117 6.2F[1000]S1-IW 294/85 5.0 423/107 23.0 526/99 36.9 594/108 9.5 675/117 25.5F[1000]S2-IW 299/85 2.6 396/107 25.2 494/98 39.3 581/108 18.5 678/117 15.2
“Pre-treated” catalysts
F[3700]S1-AP 282/85 10.4 411/107 18.5 509/99 24.0 600/108 22.3 690/117 24.7F[4300]S2-IW 296/88 16.0 427/108 60.1 506/99 1.0 578/108 1.7 704/117 1.3
“Used” catalysts
491505
beaks,
od-R(seesed
sedn
nure-
-canracs
of
at-d
ult-
-ell
d-anat
sylcon-e ofr”r-liseresg,aten-
atedtionent.e
ibil-.ume-
F[3700]S1-AP 305/85 4.4 423/100 67.4F[4300]S2-IW 304/85 4.7 412/100 81.7
for reduction[34–36,52]. In fact, by a preliminary iterativeprocedure it was found that all of the TPR profiles candescribed by a linear combination of five Gaussian pewith the same centre position (M , ◦C) and full width at half-maximum (fwhm,◦C), and only a variable intensity (A, %)[11,34–36,52]. Representative results for TPR spectra melling are shown inFig. 6, displaying the deconvoluted TPspectra of differently loaded S1-supported AP systemsFig. 3A). The parameters of the Gaussian components ufor the deconvolution of all TPR spectra are summariin Table 5. Although a scale factor of ca. 50 in the iroconcentration (Table 1), implying remarkable differences ithe sample loading (25–500 mg) throughout TPR measments, likely explains some variations inM (±20◦C) andfwhm (±8 ◦C) values (Table 5), the fact that the same component keeps an unchanged centre position and fwhmbe taken as a reliable index of the same nature (and intetion path) of the various Fe3+ species with silica regardlesof preparation route, Fe loading, and silica carrier[34–36].Then the following attribution can be inferred.
The first component (peak 1) centred at ca. 400◦C moni-tors the reduction of 3-d “aggregates,” mostly in the formFe2O3 nanoclusters.
The second component (peak 2), with the maximumca. 500◦C, would be associated with the reduction of 2(–Fe–O–Fe–)n patches(i.e., thin “rafts”) linked to the silicasurface by a network of “Fe–O–Si” bonds and, thus, res
ing in less reducibility than that of oxidenanoclusters.The third (peak 3) and fourth (peak 4) components, cen-tred at ca. 600 and 700◦C, respectively, match with a poor
/99 13.7 576/107 8.3 685/117 6.1/99 6.1 582/108 1.0 705/117 6.5
-
reducibility of isolated Fe3+ ions in a Td-like coordination[6–9,11,46,51,52]. Their reducibility depends upon the number of “Fe–O–Si” linkages in the first coordinative shand, thus, on location across differenthollow sites of thesilica surface[47,48]. Indeed, previous FTIR data for asorbed NO indicated that only mono-nitrosyls form atFe loading of ca. 1000 ppm (F[1000]S1-AP), whereashigher loadings (F[3700]S1-AP) both mono- and tri-nitroadducts form on FeII ions belonging to mono/oligomerimoieties[46]. These results have been rationalised by csidering that a number of structures exist on the surfacthe supports[47,48], depending on the location in “smalleor “large” (SiO2)n rings. The fewer oxygen atoms in the fomer, because of their propinquity, tend to strongly stabi“entrapped” Fe3+ ions. As a consequence, these structuare the first to “graft” incoming Fe ions at lower loadinby ensuring a higher shielding. “Large” rings accommodtransition-metal ions only at higher loading, implying an ehanced coordinative unsaturation. Thus isolated Fe3+ ions,bearing multiple surface oxygen bridged bonds and locin smaller hollow sites, are the most resistant to reducand can therefore be associated with the fourth componA higher degree of coordinative unsaturation of isolated FIII
ions located in larger hollow sites implies an easier reducity and can be then associated with the third component
Perhaps, such an assignment explains the fact that Dsic et al. could not detect isolated Fe2+ ions in a 1%
◦ 2+
Fe/SiO2 catalyst reduced at 500C, but rather Fe ions oflow coordination in some2-d “thin rafts” along with high-coordination Fe2+ ions of 3-d Fe2O3 clusters[22].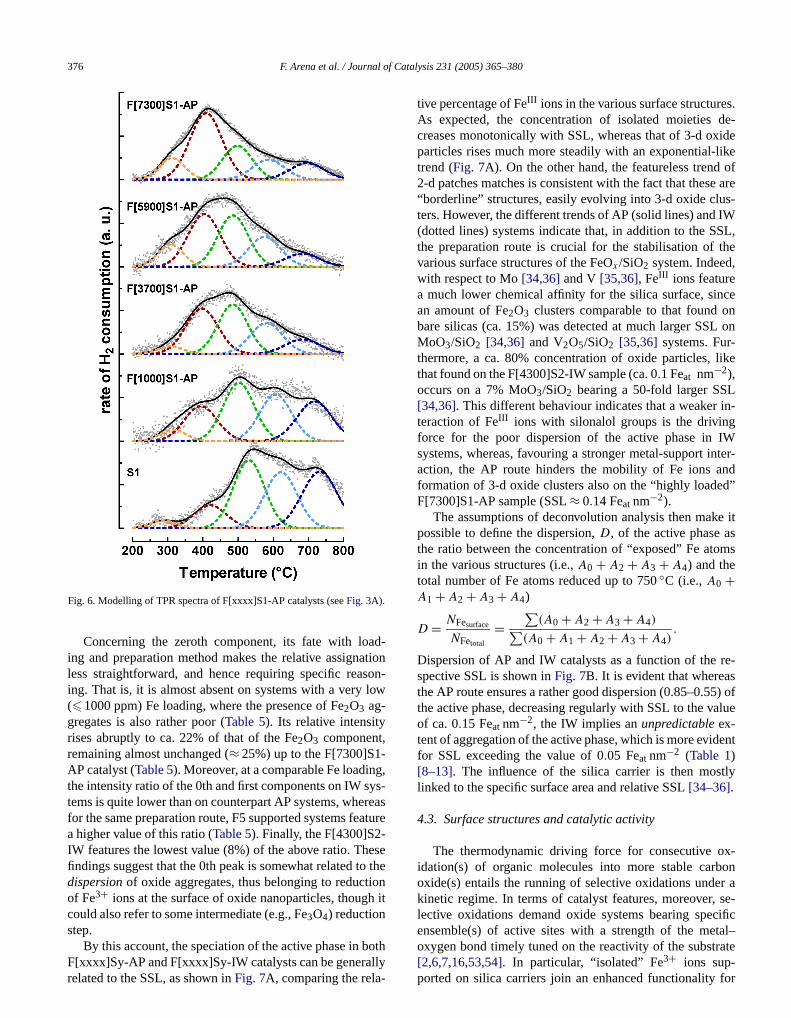
f Ca
ad-tion
son-low
-g,ys-reasatur
eseo theionh it
s.de-ide
likeof
e ares-IWSL,the,
ceonL on
like
Lin-gIWnter-ndd”
e itsoms
re-s5) ofalue
dent
tly
x-onr ase-cifictal–
376 F. Arena et al. / Journal o
Fig. 6. Modelling of TPR spectra of F[xxxx]S1-AP catalysts (seeFig. 3A).
Concerning the zeroth component, its fate with loing and preparation method makes the relative assignaless straightforward, and hence requiring specific reaing. That is, it is almost absent on systems with a very(�1000 ppm) Fe loading, where the presence of Fe2O3 ag-gregates is also rather poor (Table 5). Its relative intensityrises abruptly to ca. 22% of that of the Fe2O3 component,remaining almost unchanged (≈ 25%) up to the F[7300]S1AP catalyst (Table 5). Moreover, at a comparable Fe loadinthe intensity ratio of the 0th and first components on IW stems is quite lower than on counterpart AP systems, whefor the same preparation route, F5 supported systems fea higher value of this ratio (Table 5). Finally, the F[4300]S2-IW features the lowest value (8%) of the above ratio. Thfindings suggest that the 0th peak is somewhat related tdispersionof oxide aggregates, thus belonging to reductof Fe3+ ions at the surface of oxide nanoparticles, thougcould also refer to some intermediate (e.g., Fe3O4) reductionstep.
By this account, the speciation of the active phase in bothF[xxxx]Sy-AP and F[xxxx]Sy-IW catalysts can be generallyrelated to the SSL, as shown inFig. 7A, comparing the rela-
talysis 231 (2005) 365–380
e
tive percentage of FeIII ions in the various surface structureAs expected, the concentration of isolated moietiescreases monotonically with SSL, whereas that of 3-d oxparticles rises much more steadily with an exponential-trend (Fig. 7A). On the other hand, the featureless trend2-d patches matches is consistent with the fact that thes“borderline” structures, easily evolving into 3-d oxide cluters. However, the different trends of AP (solid lines) and(dotted lines) systems indicate that, in addition to the Sthe preparation route is crucial for the stabilisation ofvarious surface structures of the FeOx /SiO2 system. Indeedwith respect to Mo[34,36]and V[35,36], FeIII ions featurea much lower chemical affinity for the silica surface, sinan amount of Fe2O3 clusters comparable to that foundbare silicas (ca. 15%) was detected at much larger SSMoO3/SiO2 [34,36] and V2O5/SiO2 [35,36] systems. Fur-thermore, a ca. 80% concentration of oxide particles,that found on the F[4300]S2-IW sample (ca. 0.1 Feat nm−2),occurs on a 7% MoO3/SiO2 bearing a 50-fold larger SS[34,36]. This different behaviour indicates that a weakerteraction of FeIII ions with silonalol groups is the drivinforce for the poor dispersion of the active phase insystems, whereas, favouring a stronger metal-support iaction, the AP route hinders the mobility of Fe ions aformation of 3-d oxide clusters also on the “highly loadeF[7300]S1-AP sample (SSL≈ 0.14 Feat nm−2).
The assumptions of deconvolution analysis then makpossible to define the dispersion,D, of the active phase athe ratio between the concentration of “exposed” Fe atin the various structures (i.e.,A0 + A2 + A3 + A4) and thetotal number of Fe atoms reduced up to 750◦C (i.e.,A0 +A1 + A2 + A3 + A4)
D = NFesurface
NFetotal
=∑
(A0 + A2 + A3 + A4)∑
(A0 + A1 + A2 + A3 + A4).
Dispersion of AP and IW catalysts as a function of thespective SSL is shown inFig. 7B. It is evident that whereathe AP route ensures a rather good dispersion (0.85–0.5the active phase, decreasing regularly with SSL to the vof ca. 0.15 Feat nm−2, the IW implies anunpredictableex-tent of aggregation of the active phase, which is more evifor SSL exceeding the value of 0.05 Feat nm−2 (Table 1)[8–13]. The influence of the silica carrier is then moslinked to the specific surface area and relative SSL[34–36].
4.3. Surface structures and catalytic activity
The thermodynamic driving force for consecutive oidation(s) of organic molecules into more stable carboxide(s) entails the running of selective oxidations undekinetic regime. In terms of catalyst features, moreover,lective oxidations demand oxide systems bearing speensemble(s) of active sites with a strength of the me
oxygen bond timely tuned on the reactivity of the substrate[2,6,7,16,53,54]. In particular, “isolated” Fe3+ ions sup-ported on silica carriers join an enhanced functionality for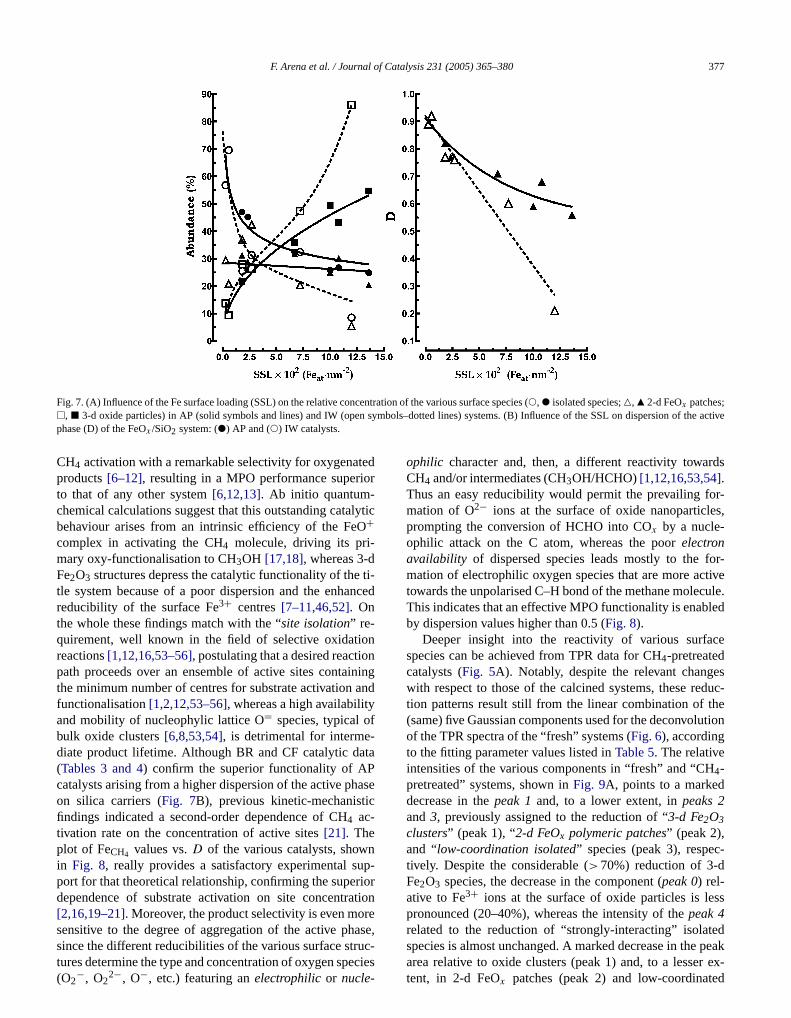
F. Arena et al. / Journal of Catalysis 231 (2005) 365–380 377
Fig. 7. (A) Influence of the Fe surface loading (SSL) on the relative concentration of the various surface species (!, " isolated species;P, Q 2-d FeOx patches;n sym the active
edor
lytic
ti-nce
nn
iningandyf-ta
asec
np-
riortionrease
rds
r-s,
or-tiveule.led
ce
esduc-heution
c-
ss
ed
1, 2 3-d oxide particles) in AP (solid symbols and lines) and IW (opephase (D) of the FeOx /SiO2 system: (") AP and (!) IW catalysts.
CH4 activation with a remarkable selectivity for oxygenatproducts[6–12], resulting in a MPO performance superito that of any other system[6,12,13]. Ab initio quantum-chemical calculations suggest that this outstanding catabehaviour arises from an intrinsic efficiency of the FeO+complex in activating the CH4 molecule, driving its pri-mary oxy-functionalisation to CH3OH [17,18], whereas 3-dFe2O3 structures depress the catalytic functionality of thetle system because of a poor dispersion and the enhareducibility of the surface Fe3+ centres[7–11,46,52]. Onthe whole these findings match with the “site isolation” re-quirement, well known in the field of selective oxidatioreactions[1,12,16,53–56], postulating that a desired reactiopath proceeds over an ensemble of active sites contathe minimum number of centres for substrate activationfunctionalisation[1,2,12,53–56], whereas a high availabilitand mobility of nucleophylic lattice O= species, typical obulk oxide clusters[6,8,53,54], is detrimental for intermediate product lifetime. Although BR and CF catalytic da(Tables 3 and 4) confirm the superior functionality of APcatalysts arising from a higher dispersion of the active phon silica carriers (Fig. 7B), previous kinetic-mechanistifindings indicated a second-order dependence of CH4 ac-tivation rate on the concentration of active sites[21]. Theplot of FeCH4 values vs.D of the various catalysts, showin Fig. 8, really provides a satisfactory experimental suport for that theoretical relationship, confirming the supedependence of substrate activation on site concentra[2,16,19–21]. Moreover, the product selectivity is even mosensitive to the degree of aggregation of the active ph
since the different reducibilities of the various surface struc-tures determine the type and concentration of oxygen species(O2−, O22−, O−, etc.) featuring anelectrophilicor nucle-
bols–dotted lines) systems. (B) Influence of the SSL on dispersion of
d
,
ophilic character and, then, a different reactivity towaCH4 and/or intermediates (CH3OH/HCHO)[1,12,16,53,54].Thus an easy reducibility would permit the prevailing fomation of O2− ions at the surface of oxide nanoparticleprompting the conversion of HCHO into COx by a nucle-ophilic attack on the C atom, whereas the poorelectronavailability of dispersed species leads mostly to the fmation of electrophilic oxygen species that are more actowards the unpolarised C–H bond of the methane molecThis indicates that an effective MPO functionality is enabby dispersion values higher than 0.5 (Fig. 8).
Deeper insight into the reactivity of various surfaspecies can be achieved from TPR data for CH4-pretreatedcatalysts (Fig. 5A). Notably, despite the relevant changwith respect to those of the calcined systems, these retion patterns result still from the linear combination of t(same) five Gaussian components used for the deconvolof the TPR spectra of the “fresh” systems (Fig. 6), accordingto the fitting parameter values listed inTable 5. The relativeintensities of the various components in “fresh” and “CH4-pretreated” systems, shown inFig. 9A, points to a markeddecrease in thepeak 1and, to a lower extent, inpeaks 2and3, previously assigned to the reduction of “3-d Fe2O3
clusters” (peak 1), “2-d FeOx polymeric patches” (peak 2),and “low-coordination isolated” species (peak 3), respetively. Despite the considerable (>70%) reduction of 3-dFe2O3 species, the decrease in the component (peak 0) rel-ative to Fe3+ ions at the surface of oxide particles is lepronounced (20–40%), whereas the intensity of thepeak 4related to the reduction of “strongly-interacting” isolat
species is almost unchanged. A marked decrease in the peakarea relative to oxide clusters (peak 1) and, to a lesser ex-tent, in 2-d FeOx patches (peak 2) and low-coordinated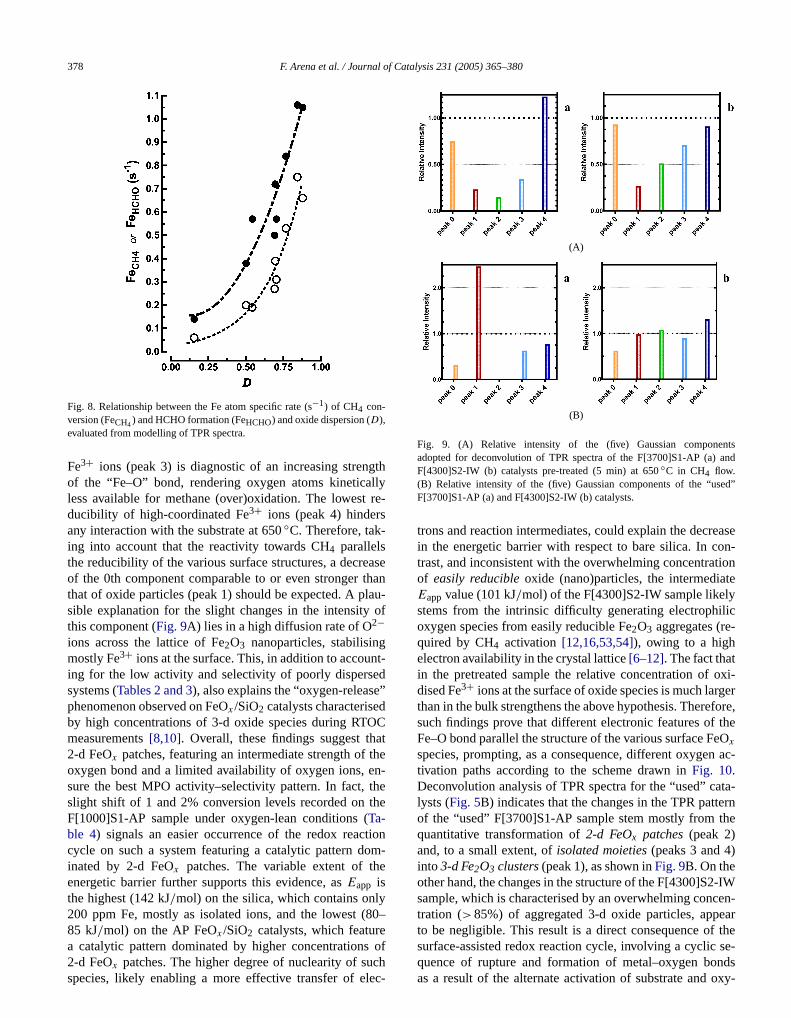
f Ca
gthllyre-
s
asethanlau-
of
gnt-d
e”dOCatthen-
thethe
tionom-e
y80–e
ntsand
ed”
easeon-tionte
ylic-
oxi-gerfore,theeOn ac-
ta-ernthe
)
-IWcen-earthe
378 F. Arena et al. / Journal o
Fig. 8. Relationship between the Fe atom specific rate (s−1) of CH4 con-version (FeCH4) and HCHO formation (FeHCHO) and oxide dispersion (D),evaluated from modelling of TPR spectra.
Fe3+ ions (peak 3) is diagnostic of an increasing strenof the “Fe–O” bond, rendering oxygen atoms kineticaless available for methane (over)oxidation. The lowestducibility of high-coordinated Fe3+ ions (peak 4) hinderany interaction with the substrate at 650◦C. Therefore, tak-ing into account that the reactivity towards CH4 parallelsthe reducibility of the various surface structures, a decreof the 0th component comparable to or even strongerthat of oxide particles (peak 1) should be expected. A psible explanation for the slight changes in the intensitythis component (Fig. 9A) lies in a high diffusion rate of O2−ions across the lattice of Fe2O3 nanoparticles, stabilisinmostly Fe3+ ions at the surface. This, in addition to accouing for the low activity and selectivity of poorly dispersesystems (Tables 2 and 3), also explains the “oxygen-releasphenomenon observed on FeOx /SiO2 catalysts characteriseby high concentrations of 3-d oxide species during RTmeasurements[8,10]. Overall, these findings suggest th2-d FeOx patches, featuring an intermediate strength ofoxygen bond and a limited availability of oxygen ions, esure the best MPO activity–selectivity pattern. In fact,slight shift of 1 and 2% conversion levels recorded onF[1000]S1-AP sample under oxygen-lean conditions (Ta-ble 4) signals an easier occurrence of the redox reaccycle on such a system featuring a catalytic pattern dinated by 2-d FeOx patches. The variable extent of thenergetic barrier further supports this evidence, asEapp isthe highest (142 kJ/mol) on the silica, which contains onl200 ppm Fe, mostly as isolated ions, and the lowest (85 kJ/mol) on the AP FeOx /SiO2 catalysts, which featur
a catalytic pattern dominated by higher concentrations of2-d FeOx patches. The higher degree of nuclearity of suchspecies, likely enabling a more effective transfer of elec-talysis 231 (2005) 365–380
(A)
(B)
Fig. 9. (A) Relative intensity of the (five) Gaussian componeadopted for deconvolution of TPR spectra of the F[3700]S1-AP (a)F[4300]S2-IW (b) catalysts pre-treated (5 min) at 650◦C in CH4 flow.(B) Relative intensity of the (five) Gaussian components of the “usF[3700]S1-AP (a) and F[4300]S2-IW (b) catalysts.
trons and reaction intermediates, could explain the decrin the energetic barrier with respect to bare silica. In ctrast, and inconsistent with the overwhelming concentraof easily reducibleoxide (nano)particles, the intermediaEappvalue (101 kJ/mol) of the F[4300]S2-IW sample likelstems from the intrinsic difficulty generating electrophioxygen species from easily reducible Fe2O3 aggregates (required by CH4 activation [12,16,53,54]), owing to a highelectron availability in the crystal lattice[6–12]. The fact thatin the pretreated sample the relative concentration ofdised Fe3+ ions at the surface of oxide species is much larthan in the bulk strengthens the above hypothesis. Theresuch findings prove that different electronic features ofFe–O bond parallel the structure of the various surface Fx
species, prompting, as a consequence, different oxygetivation paths according to the scheme drawn inFig. 10.Deconvolution analysis of TPR spectra for the “used” calysts (Fig. 5B) indicates that the changes in the TPR pattof the “used” F[3700]S1-AP sample stem mostly fromquantitative transformation of2-d FeOx patches(peak 2)and, to a small extent, ofisolated moieties(peaks 3 and 4into 3-d Fe2O3 clusters(peak 1), as shown inFig. 9B. On theother hand, the changes in the structure of the F[4300]S2sample, which is characterised by an overwhelming contration (>85%) of aggregated 3-d oxide particles, appto be negligible. This result is a direct consequence of
surface-assisted redox reaction cycle, involving a cyclic se-quence of rupture and formation of metal–oxygen bondsas a result of the alternate activation of substrate and oxy-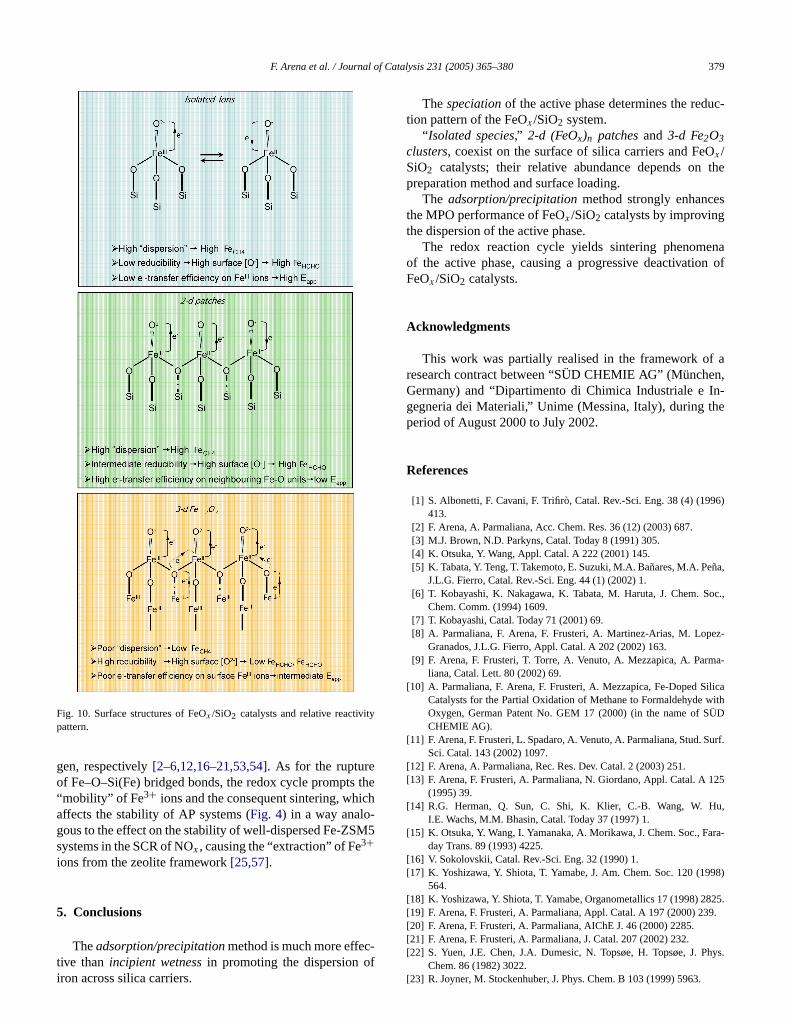
of Ca
y
theich
M5
uc-
Othe
s
enan of
an,
In-he
6)
ña,
oc.,
z-
a-
ilicaith
ÜD
urf.
25
u,
ara-
98)
25.9.
F. Arena et al. / Journal
Fig. 10. Surface structures of FeOx /SiO2 catalysts and relative reactivitpattern.
gen, respectively[2–6,12,16–21,53,54]. As for the ruptureof Fe–O–Si(Fe) bridged bonds, the redox cycle prompts“mobility” of Fe3+ ions and the consequent sintering, whaffects the stability of AP systems (Fig. 4) in a way analo-gous to the effect on the stability of well-dispersed Fe-ZSsystems in the SCR of NOx , causing the “extraction” of Fe3+ions from the zeolite framework[25,57].
5. Conclusions
Theadsorption/precipitationmethod is much more effec-tive than incipient wetnessin promoting the dispersion ofiron across silica carriers.
talysis 231 (2005) 365–380 379
Thespeciationof the active phase determines the redtion pattern of the FeOx /SiO2 system.
“ Isolated species,” 2-d (FeOx)n patchesand 3-d Fe2O3
clusters, coexist on the surface of silica carriers and Fex /SiO2 catalysts; their relative abundance depends onpreparation method and surface loading.
The adsorption/precipitationmethod strongly enhancethe MPO performance of FeOx /SiO2 catalysts by improvingthe dispersion of the active phase.
The redox reaction cycle yields sintering phenomof the active phase, causing a progressive deactivatioFeOx /SiO2 catalysts.
Acknowledgments
This work was partially realised in the framework ofresearch contract between “SÜD CHEMIE AG” (MüncheGermany) and “Dipartimento di Chimica Industriale egegneria dei Materiali,” Unime (Messina, Italy), during tperiod of August 2000 to July 2002.
References
[1] S. Albonetti, F. Cavani, F. Trifirò, Catal. Rev.-Sci. Eng. 38 (4) (199413.
[2] F. Arena, A. Parmaliana, Acc. Chem. Res. 36 (12) (2003) 687.[3] M.J. Brown, N.D. Parkyns, Catal. Today 8 (1991) 305.[4] K. Otsuka, Y. Wang, Appl. Catal. A 222 (2001) 145.[5] K. Tabata, Y. Teng, T. Takemoto, E. Suzuki, M.A. Bañares, M.A. Pe
J.L.G. Fierro, Catal. Rev.-Sci. Eng. 44 (1) (2002) 1.[6] T. Kobayashi, K. Nakagawa, K. Tabata, M. Haruta, J. Chem. S
Chem. Comm. (1994) 1609.[7] T. Kobayashi, Catal. Today 71 (2001) 69.[8] A. Parmaliana, F. Arena, F. Frusteri, A. Martinez-Arias, M. Lope
Granados, J.L.G. Fierro, Appl. Catal. A 202 (2002) 163.[9] F. Arena, F. Frusteri, T. Torre, A. Venuto, A. Mezzapica, A. Parm
liana, Catal. Lett. 80 (2002) 69.[10] A. Parmaliana, F. Arena, F. Frusteri, A. Mezzapica, Fe-Doped S
Catalysts for the Partial Oxidation of Methane to Formaldehyde wOxygen, German Patent No. GEM 17 (2000) (in the name of SCHEMIE AG).
[11] F. Arena, F. Frusteri, L. Spadaro, A. Venuto, A. Parmaliana, Stud. SSci. Catal. 143 (2002) 1097.
[12] F. Arena, A. Parmaliana, Rec. Res. Dev. Catal. 2 (2003) 251.[13] F. Arena, F. Frusteri, A. Parmaliana, N. Giordano, Appl. Catal. A 1
(1995) 39.[14] R.G. Herman, Q. Sun, C. Shi, K. Klier, C.-B. Wang, W. H
I.E. Wachs, M.M. Bhasin, Catal. Today 37 (1997) 1.[15] K. Otsuka, Y. Wang, I. Yamanaka, A. Morikawa, J. Chem. Soc., F
day Trans. 89 (1993) 4225.[16] V. Sokolovskii, Catal. Rev.-Sci. Eng. 32 (1990) 1.[17] K. Yoshizawa, Y. Shiota, T. Yamabe, J. Am. Chem. Soc. 120 (19
564.[18] K. Yoshizawa, Y. Shiota, T. Yamabe, Organometallics 17 (1998) 28[19] F. Arena, F. Frusteri, A. Parmaliana, Appl. Catal. A 197 (2000) 23[20] F. Arena, F. Frusteri, A. Parmaliana, AIChE J. 46 (2000) 2285.[21] F. Arena, F. Frusteri, A. Parmaliana, J. Catal. 207 (2002) 232.
[22] S. Yuen, J.E. Chen, J.A. Dumesic, N. Topsøe, H. Topsøe, J. Phys.Chem. 86 (1982) 3022.[23] R. Joyner, M. Stockenhuber, J. Phys. Chem. B 103 (1999) 5963.
f Ca
240.
163
A.58
96
ini,
on-
00)
ich
em.
, C.6)
, S.
a e
rg.
copy
.G.2.To-
m.
tal.
urf.
91.rk,
380 F. Arena et al. / Journal o
[24] K. Chen, Y. Fan, Z. Hu, Q. Yan, J. Solid. State Chem. 121 (1996)[25] X. Feng, W.K. Hall, J. Catal. 166 (1997) 368.[26] L.A. Boot, A.J. van Dillen, J.W. Geus, F.R. van Buren, J. Catal.
(1996) 186.[27] S. Bordiga, R. Buzzoni, F. Geobaldo, C. Lamberti, E. Giamello,
Zecchina, G. Leofanti, G. Petrini, G. Tozzola, G. Vlaic, J. Catal. 1(1996) 486.
[28] El-M. El-Malki, R.A. van Santen, W.M.H. Sachtler, J. Catal. 1(2000) 212.
[29] G. Spoto, A. Zecchina, G. Berlier, S. Bordiga, M.G. Clerici, L. BasJ. Mol. Catal. A 158 (2000) 107.
[30] P. Decyk, M. Trejda, J. Kujawa, K. Głaszczka, M. Bettahar, S. Mteverdi, M. Mercy, J. Catal. 219 (2003) 146.
[31] J. Jia, K.S. Pillai, W.M.H. Sachtler, J. Catal. 221 (2004) 119.[32] S.-T. Wong, J.-F. Lee, S. Cheng, C.-Y. Mou, Appl. Catal. A 198 (20
115.[33] G. Grosse, Mos90 (Version 2.2), Technical University of Mun
(1992).[34] F. Arena, A. Parmaliana, J. Phys. Chem. 100 (1996) 19994.[35] F. Arena, F. Frusteri, G. Martra, S. Coluccia, A. Parmaliana, J. Ch
Soc., Faraday Trans. 93 (1997) 3849.[36] F. Arena, N. Giordano, A. Parmaliana, J. Catal. 167 (1997) 66.[37] L. Le Noc, D. Trong On, S. Solmykina, B. Echchahed, F. Beland
Cartier dit Moulin, L. Bonneviot, Stud. Surf. Sci. Catal. 101 (199611.
[38] G. Lehmann, Z. Phys. Chem. Neue Folge 72 (1970) 279.
[39] L. Bonneviot, D. Trong On, A. Lopez, J. Chem. Soc., Chem. Commun.(1993) 685.
talysis 231 (2005) 365–380
[40] L. Marchese, E. Gianotti, V. Dellarocca, T. Maschmeyer, F. ReyColuccia, J.M. Thomas, Phys. Chem. Chem. Phys. 1 (1999) 585.
[41] H.H. Tippins, Phys. Rev. B 1 (1970) 126.[42] R. Bongiovanni, E. Pellizzetti, E. Borgarello, D. Meisel, La Chimic
l’Industria 4 (1994) 261.[43] C.A. Brown, G.J. Remar, R.L. Musselman, E.I. Solomon, Ino
Chem. 34 (1995) 688.[44] E. Murad, J.H. Johnston, in: G.J. Long (Ed.), Mössbauer Spectros
Applied to Inorganic Chemistry, 1987, pp. 507–582.[45] N.G. Gallegos, A.M. Alvarez, M.V. Cagnoli, J.F. Bengoa, S
Marchetti, R.C. Mercader, A.A. Yeramian, J. Catal. 161 (1996) 13[46] F. Arena, G. Gatti, G. Martra, S. Coluccia, A. Parmaliana, Catal.
day 91–92 (2004) 305.[47] Q. Ma, K. Klier, H. Cheng, J.W. Mitchell, K.S. Hayes, J. Phys. Che
B 104 (2000) 10618.[48] P. D Maniar, A.J. Navrotsky, Non-Cryst. Solids 120 (1990) 20.[49] Q. Sun, R.G. Herman, K. Klier, Catal. Lett. 16 (1992) 251.[50] C.R.F. Lund, J.A. Dumesic, J. Phys. Chem. 85 (1981) 3175.[51] J. Jia, J. Shen, L. Lin, Z. Xu, T. Zhang, D. Liang, React. Kinet. Ca
Lett. 64 (1998) 255.[52] F. Arena, G. Gatti, S. Coluccia, G. Martra, A. Parmaliana, Stud. S
Sci. Catal. 147 (2004) 535.[53] A. Bielañski, J. Haber, Oxygen in Catalysis, Dekker, New York, 19[54] B.K. Hodnett, Heterogeneous Catalytic Oxidation, Wiley, New Yo
2000.[55] J.L. Callahan, R.K. Grasselli, AIChE J. 9 (1963) 755.
[56] R.K. Grasselli, Top. Catal. 15 (2001) 93.[57] X. Feng, W.K. Hall, Catal. Lett. 41 (1996) 45.Copyright © 2022 FDOKUMEN