Soil deformation pattern around laterally loaded pile
10
Delivered by ICEVirtualLibrary.com to: IP: 212.6.33.13 On: Sun, 09 Oct 2011 13:15:09 Soil deformation pattern around laterally loaded piles Masoud Hajialilue-Bonab PhD Associate Professor, Department of Civil Engineering, University of Tabriz, Iran Habin Azarnya-Shahgoli MSc Graduate Student, Department of Civil Engineering, University of Tabriz, Iran Yones Sojoudi MSc Ano Consulting Co. Tabriz, Iran 1 2 3 In the analysis of soil–pile interaction under lateral load, the behaviour of soil around a pile is an important parameter which has a great influence on the results. In this paper the three-dimensional deformation pattern of soil around laterally loaded piles was studied on small-scale physical models in the laboratory using the particle image velocimetry method. In each step of loading two digital cameras were used to capture the deformed piles and soil, one above and the other on the side. One of the cameras was placed vertically in front of the test box and the other horizontally on top of it. Image processing was undertaken to evaluate the three-dimensional behaviour of deformed soil. Particle image velocimetry analysis was undertaken to obtain the displacement. The deformation pattern and shear strains of soil around laterally loaded single pile and pile groups were studied. The effects of pile length, stiffness and diameter on the soil deformation pattern were investigated. The group effect and interaction between piles in pile groups were also studied. Experimental results showed that a conical passive zone is established in front of laterally loaded piles. 1. Introduction If the soil bearing capacity is too low to use shallow foundations, piles will be used to build deep foundations. Applied loads on piles can be axial (tensile or compressive), lateral and moment. Nearly all piles are subjected to lateral loads. In some structures horizontal loads are negligible relative to vertical loads, but in some cases piles are subjected to considerable lateral loads. For example, in jetties and harbour structures, retaining structures supported by piles, pile foundations located in seismic zones and piers supported by piles, piles are subjected to lateral loads. Considering the aforementioned topics, it is necessary to study piles under lateral loads. Most of the research about piles under lateral loads has to date been performed by installing strain gauges on piles to investigate the load-bearing capacity of the piles, pile deflection, pile rotation and internal forces created in the pile. Remaud (1999) has performed a set of tests on an instrumented pile and pile group under lateral static load in centrifuge. Hajialilue-Bonab (2003) has performed a comprehensive set of tests in centrifuge on single piles which were instrumented with strain gauges, linear variable differential transformer (LVDT), acceleration and force sensors under lateral static and dynamic loads. He obtained static and dynamic P–y curves. Only a few physical models have been created to investigate the behaviour of the soil around the pile and its deformation pattern. Therefore it is necessary to investigate the soil deformation pattern around laterally loaded piles and pile– soil interaction in order to improve the level of knowledge on this subject. Tominaga et al. (1983) studied horizontal displacement of soil in front of laterally loaded piles. They concluded that the horizontal displacements are generally larger than the vertical ones and these two values decrease very rapidly as the distance from the pile surface increases. Ashour et al. (1998) investigated strain created in front of a laterally loaded pile using a strain wedge (SW) model. They concluded that the SW model approach provides an effective method for solving the problem of a laterally loaded pile. Patra and Pise (2001) have done some experimental tests with a pile model (L/B 5 12) and concluded that there is no group effect for spacing more than 6B. Rollins et al. (2006) have also shown that the group effect increases when the pile space decreases by 5?65 pile diameters. Otani et al. (2006) investigated three-dimensional (3D) failure patterns in sand owing to a International Journal of Physical Modelling in Geotechnics Volume 11 Issue 3 Soil deformation pattern around laterally loaded piles Hajialilue-Bonab, Azarnya-Shahgoli and Sojoudi International Journal of Physical Modelling in Geotechnics, 2011, 11(3), 116–125 http://dx.doi.org/10.1680/ijpmg.2011.11.3.116 Paper 1000015 Received 19/09/2010 Accepted 19/05/2011 Keywords: deformation/model tests/piles & piling ICE Publishing: All rights reserved 116
-
Upload
independent -
Category
Documents
-
view
0 -
download
0
Transcript of Soil deformation pattern around laterally loaded pile

Delivered by ICEVirtualLibrary.com to:
IP: 212.6.33.13
On: Sun, 09 Oct 2011 13:15:09
Soil deformation pattern aroundlaterally loaded piles
Masoud Hajialilue-Bonab PhDAssociate Professor, Department of Civil Engineering, University of Tabriz, Iran
Habin Azarnya-Shahgoli MScGraduate Student, Department of Civil Engineering, University of Tabriz,Iran
Yones Sojoudi MScAno Consulting Co. Tabriz, Iran
1 2 3
In the analysis of soil–pile interaction under lateral load, the behaviour of soil around a pile is an important parameter
which has a great influence on the results. In this paper the three-dimensional deformation pattern of soil around
laterally loaded piles was studied on small-scale physical models in the laboratory using the particle image velocimetry
method. In each step of loading two digital cameras were used to capture the deformed piles and soil, one above and
the other on the side. One of the cameras was placed vertically in front of the test box and the other horizontally on top
of it. Image processing was undertaken to evaluate the three-dimensional behaviour of deformed soil. Particle image
velocimetry analysis was undertaken to obtain the displacement. The deformation pattern and shear strains of soil
around laterally loaded single pile and pile groups were studied. The effects of pile length, stiffness and diameter on the
soil deformation pattern were investigated. The group effect and interaction between piles in pile groups were also
studied. Experimental results showed that a conical passive zone is established in front of laterally loaded piles.
1. Introduction
If the soil bearing capacity is too low to use shallow foundations,
piles will be used to build deep foundations. Applied loads on
piles can be axial (tensile or compressive), lateral and moment.
Nearly all piles are subjected to lateral loads. In some structures
horizontal loads are negligible relative to vertical loads, but in
some cases piles are subjected to considerable lateral loads. For
example, in jetties and harbour structures, retaining structures
supported by piles, pile foundations located in seismic zones and
piers supported by piles, piles are subjected to lateral loads.
Considering the aforementioned topics, it is necessary to study
piles under lateral loads.
Most of the research about piles under lateral loads has to date
been performed by installing strain gauges on piles to investigate
the load-bearing capacity of the piles, pile deflection, pile rotation
and internal forces created in the pile. Remaud (1999) has
performed a set of tests on an instrumented pile and pile group
under lateral static load in centrifuge. Hajialilue-Bonab (2003)
has performed a comprehensive set of tests in centrifuge on single
piles which were instrumented with strain gauges, linear variable
differential transformer (LVDT), acceleration and force sensors
under lateral static and dynamic loads. He obtained static and
dynamic P–y curves. Only a few physical models have been
created to investigate the behaviour of the soil around the pile and
its deformation pattern. Therefore it is necessary to investigate the
soil deformation pattern around laterally loaded piles and pile–
soil interaction in order to improve the level of knowledge on this
subject. Tominaga et al. (1983) studied horizontal displacement of
soil in front of laterally loaded piles. They concluded that the
horizontal displacements are generally larger than the vertical
ones and these two values decrease very rapidly as the distance
from the pile surface increases. Ashour et al. (1998) investigated
strain created in front of a laterally loaded pile using a strain
wedge (SW) model. They concluded that the SW model approach
provides an effective method for solving the problem of a laterally
loaded pile. Patra and Pise (2001) have done some experimental
tests with a pile model (L/B 5 12) and concluded that there is no
group effect for spacing more than 6B. Rollins et al. (2006) have
also shown that the group effect increases when the pile space
decreases by 5?65 pile diameters. Otani et al. (2006) investigated
three-dimensional (3D) failure patterns in sand owing to a
International Journal of Physical Modellingin GeotechnicsVolume 11 Issue 3
Soil deformation pattern around laterallyloaded pilesHajialilue-Bonab, Azarnya-Shahgoli and Sojoudi
International Journal of Physical Modelling in Geotechnics,
2011, 11(3), 116–125
http://dx.doi.org/10.1680/ijpmg.2011.11.3.116
Paper 1000015
Received 19/09/2010 Accepted 19/05/2011
Keywords: deformation/model tests/piles & piling
ICE Publishing: All rights reserved
116
Delivered by ICEVirtualLibrary.com to:
IP: 212.6.33.13
On: Sun, 09 Oct 2011 13:15:09
laterally loaded pile using X-ray computed tomography (CT).
They concluded that the failure zone is extended and that the
volume and angle of the failure zone increases with the increase in
the pile loading level, but an ultimate value exists at some loading
stages. Also the size of the failure zone decreases with an increase
in the ground depth along the pile and the shape of this failure
zone is almost conical in three dimensions.
It is evident from the above research that the industrial X-ray CT
scanner promises to be a powerful tool even in the geotechnical
engineering field. Unfortunately the use of CT scanners greatly
impacts the costs associated with such research. Hence, White
et al. (2003) developed the deformation measurement system
based on particle image velocimetry (PIV) and close-range
photogrammetry. The PIV method, in addition to being
economical, accurately corresponds with geotechnical tests.
Small-scale laboratory modelling provides researches with full
control of all controllable variables of the model except the key
question providing a strong platform for establishing validity of
the models. A thorough understanding of relevant scaling laws
and the dimensional analysis which controls them is essential.
The equation governing the deformation of the pile is as follows
1. EId4y
dz4~{ky
where EI is flexural rigidity of the pile, y is the horizontal deflec-
tion of the pile, z is the distance measured down the pile and k is
the coefficient of the subgrade reaction that is expected to be propor-
tional to the shear modulus of the soil G (k~bG) (although the pile–
soil interaction is not strictly a process of pure shear) (Wood, 2004).
This equation can be normalised by defining a dimensionless
depth and a dimensionless pile deflection
2. j~z
l,l~
y
y0
where l is the length of the pile and y0 is the lateral deflection of
the pile at its top. The equation then becomes
3.EI
l4
d4l
dj4~{kl
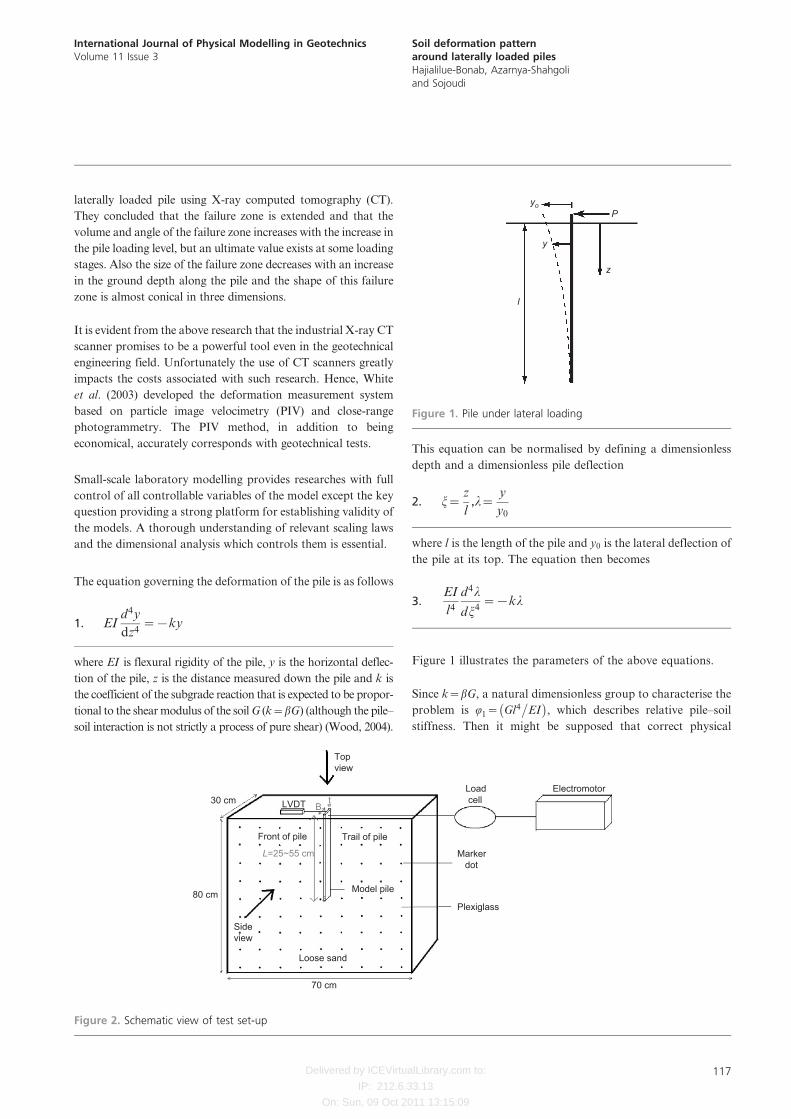
Figure 1 illustrates the parameters of the above equations.
Since k~bG, a natural dimensionless group to characterise the
problem is Q1~ Gl4�
EI� �
, which describes relative pile–soil
stiffness. Then it might be supposed that correct physical
yo
y
z
l
P
Figure 1. Pile under lateral loading
Topview
Loose sand
Marker dot
Load cell
Electromotor
Plexiglass
30 cm LVDT B
Trail of pile
Model pile
L=25~55 cm
Front of pile
t
80 cm
Sideview
70 cm
Figure 2. Schematic view of test set-up
International Journal of Physical Modelling in GeotechnicsVolume 11 Issue 3
Soil deformation patternaround laterally loaded pilesHajialilue-Bonab, Azarnya-Shahgoli
and Sojoudi
117

Delivered by ICEVirtualLibrary.com to:
IP: 212.6.33.13
On: Sun, 09 Oct 2011 13:15:09
modelling will be obtained if the dimensionless ratio w1 is
identical in the model and the prototype (Wood, 2004).
2. Test set-up and procedure
2.1 Test box
A wooden box with internal dimensions of 80 6 70 6 30 cm3
was used as the test box. A transparent sheet was used in place of
a fourth wooden wall. Plexiglass was used to allow observation
of the deformations in the soil sample. The experimental set-up
is shown in Figure 2. Figures 3(a) and 3(b) represent the
embedded single pile views from the side and top respectively.
2.2 Soil
The soil was fine, dry sand from the Sofian region in the
northwest of Iran. The type of soil is classified as SP in unified
soil classification system (USCS). Some characteristics of the
soil are shown in Table 1.
The soil was placed in the box using a sand raining system in
order to obtain a uniform and homogeneous medium. The
average unit weight and relative density of soil in the boxes
were 14?8 kN/m3 and 24% respectively.
2.3 Model piles, loading system and
instrumentation
The majority of piles considered in this research are long
flexible piles. The theoretical definition of a long pile in
cohesionless soil used here is (Prakash and Sharma, 1989)
4.L
T§4, T~
ffiffiffiffiffiffiEI
nh
5
r
Average particle size of
sand (D50): mm cdmax: kN/m3 cdmin: kN/m3 cdave: kN/m3 nh: kN/m3 A Gs W (ultimate)
0?285 17?08 14?2 14?8 2?2 6 103 200 2?637 28˚
Table 1. Characteristics of soil
Tests no. 1 2 3 4 5 6 7 8 9 10 11 12 13
L: mm 300 250 350 450 550 250 350 450 550 350 350 350 200
B: mm 60 60 60 60 60 60 60 60 60 31 40 60 60
t: mm 2 1?25 1?25 1?25 1?25 2?5 2?5 2?5 2?5 3?1 2 3?1 5
EI: N m2 2?8 0?68 0?68 0?68 0?68 5?46 5?46 5?46 5?46 5?46 5?46 10?4 43?8
L/B 5 4?17 5?83 7?5 9?17 4?17 5?83 7?5 9?17 11?29 8?75 5?83 3?33
L/T 4?53 5?01 7?02 9?02 11?02 3?3 4?63 5?95 7?27 4?63 4?63 4?07 1?74
Material Al Al Al Al Al Al Al Al Al Al St Al Al
Al 5 aluminium; St 5 steel
Table 2. Model single pile properties
(a) (b)
Figure 3. Embedded pile in soil: (a) side view; (b) top view
International Journal of Physical Modelling in GeotechnicsVolume 11 Issue 3
Soil deformation patternaround laterally loaded pilesHajialilue-Bonab, Azarnya-Shahgoli
and Sojoudi
118

Delivered by ICEVirtualLibrary.com to:
IP: 212.6.33.13
On: Sun, 09 Oct 2011 13:15:09
where L is the embedded pile length, T is the length factor, EI is
the flexural rigidity of the pile and nh is the subgrade horizontal
reaction constant module k~nhzð Þ. nh was calculated from Equa-
tion 5 (Terzaghi, 1955)
5. nh~Ac
1:35
These parameters are given in Table 1.
Rectangular piles that were slightly thicker than they were wide
were selected in order to apply the similitude law. The smallest
dimensions of piles were in contact with the Plexiglass. The
properties of the model piles are given in Table 2.
In order to investigate the soil deformation pattern around
laterally loaded piles several tests were performed on single
piles with different dimensions and pile groups with different
spacing. In all tests the piles were fixed in the wooden box and
then sand was poured surrounding the piles using a sand
raining system. Lateral load tests on pile groups were carried
out on 2 6 1 pile group models. An aluminous cap was used to
connect two pile heads. Each pile was joined by a hinge (free
rotation) to the cap. An electromotor with uniform velocity
was used to apply lateral load to the pile head. A LVDT
displacement sensor was installed in order to record the pile
head displacement. A sensitive load cell was also applied to
measure the lateral force during the tests. Two Canon Power
shot G6 with resolution 7?1 megapixel (3072 6 2304 pixels)
digital cameras were used for the purpose of facilitating
visualisation of the soil movements during testing and image
processing. In order to eliminate parasitic lights, several
projectors were also used. Pile heads were free to rotate.
Lateral load was applied statically to the pile heads from right
to left with a precise electromotor gearbox.
2.4 Image analysis by the PIV method
Digital photographs were taken of deformed piles and the soil
around them. Two cameras were used simultaneously during
testing, one from above and the other on the side. All controls
such as focus, gain and shutter speed were adopted auto-
matically. The images were processed using the GeoPIV8
software, developed at Cambridge University (White and
Take, 2002). The PIV analysis was undertaken using patches
of 32 6 32 pixels, spaced at 32 pixel centres and a search area
of 64 6 64. This provided sufficient textural detail to give good
tracking of the patches.
3. Test results and discussion
In order to study the (3D) behaviour of soil around a laterally
loaded single pile, 13 tests were performed that were
0
z/B
x/Bx/B
y/B
Single pile
Single pile
Plexiglass0
(a) (b)
00
Soil surfaceLateral load
Lateral load
Soil surface
Figure 4. Single pile: (a) side view; (b) top view
2–2 –1 10
x/B
x/B
z/B
y/B
210–2 –10
1·0
0·5
1·5
2·0
2
1
0
5
4
3
(a) (b)
Figure 5. Soil displacement vectors around pile (test 1,
magnification factor 5 3): (a) side view; (b) top view
International Journal of Physical Modelling in GeotechnicsVolume 11 Issue 3
Soil deformation patternaround laterally loaded pilesHajialilue-Bonab, Azarnya-Shahgoli
and Sojoudi
119

Delivered by ICEVirtualLibrary.com to:
IP: 212.6.33.13
On: Sun, 09 Oct 2011 13:15:09
interpreted as follows. Note that in the following figures, x/B 5
0 shows the position of a single pile. The origin of the vertical
axis (z/B 5 0) and horizontal axis (y/B 5 0) is taken as the soil
surface and interior vicinity of Plexiglass respectively.
Schematic views of a single pile in soil from side and overhead
views are shown in Figures 4(a) and 4(b) respectively.
3.1 Soil displacement vectors around a laterally
loaded pile
The displacement vectors around a pile are shown in Figures 5(a)
and 5(b) for pile head deflection 9 mm (0.15B) (test 1). These
vectors have been plotted with a magnification factor of 3. It can
be observed that soil particles located farther from the pile do not
move. The displacement vectors become larger as they approach
the pile. Another observation is that the soil grains located in the
trail of the pile move downwards, while soil grains located in front
of the pile move upwards with small angles. A radical change of
vector angles at pile position can be seen.
Considering Figure 5(a) the maximum horizontal displacement
occurs in the pile head and decreases gradually with depth. At
greater depths the displacements of soil around the pile are
negligible. Since soil grains in front of laterally loaded piles
have observed angles of displacement vectors with respect to
the horizontal axis that are smaller than 45 , it is concluded
that the horizontal displacements of soil in front of laterally
loaded piles are larger than the vertical ones.
In front of a laterally loaded pile both horizontal and vertical
displacements coexist. Vertical displacements occur near the
ground surface in front of the pile, and this has a significant effect
on pile deflection. For this reason the study of vertical displacement
in front of the pile is important. Figure 6 shows typical vertical
displacements around a laterally loaded flexible pile at the ultimate
state for a pile head deflection of 9 mm in test 1, which was
extracted from PIV analysis. These vectors have been plotted with
a magnification factor of 3. This figure shows that the vertical
displacements in front of a pile become zero at a depth of about 1B
(B is pile diameter) and after this depth the soil displacements are
horizontal. It can be observed that in the trail of the pile the vertical
displacements are larger than those in the front of the pile.
In order to investigate the depth at which the vertical
displacements are negligible the results of different tests are
plotted in Figure 7(a). In this figure the vertical axis indicates
the depth of zero vertical displacement (Ldv) divided by pile
width (B). The horizontal axis is normalised length. It can be
observed that for the pile with L/T of about 11, the zero
vertical displacement is 0?7B but for L/T 5 4?6 this depth
varies from 1?1 to 2?25, depending on pile width. It can be
concluded that this depth is not directly dependent on width.
In Figure 7(b) the vertical axis is the depth of zero vertical
displacement (Ldv) divided by pile length (L) and the
horizontal axis is the normalised length. These results can be
fitted to a power-type regression curve and a reasonable
correlation can be observed.
3.2 Shear strains around a laterally loaded pile
Figures 8(a) and 8(b) show maximum shear strain created in
soil around a single pile. It can be observed that the maximum
2–2 –1 10
0
0·5
1·5
2·0
1·0
x/B
z/B
Figure 6. Vertical displacement of soil around pile (test 1,
magnification factor 5 3): side view
0·5
0·4
0·3
0·2
0·1
00 2 4 6 8 10 12
(a) (b)
0
Test dataFitted curve
Test dataFitted curve
1
2
3
0 2 4 6 8 10 12L/T
L/T
Ldv/L
Ldv/B
Figure 7. Vertical displacement depth of soil in front of pile
International Journal of Physical Modelling in GeotechnicsVolume 11 Issue 3
Soil deformation patternaround laterally loaded pilesHajialilue-Bonab, Azarnya-Shahgoli
and Sojoudi
120

Delivered by ICEVirtualLibrary.com to:
IP: 212.6.33.13
On: Sun, 09 Oct 2011 13:15:09
shear strain occurred in pile-adjacent soils near the surface. A
triangular strain wedge to the side of the displaced pile is
created. Figure 8(b) shows that in front of a laterally loaded
pile a passive zone is established. This passive zone is similar to
a circle. In the prototype pile, the symmetry of the shear strain
zone is established on the other side of the Plexiglass too. In
composing Figures 8(a) and 8(b) it is concluded that in front of
a laterally loaded pile, the passive zone that is established is
almost conical in shape in three dimensions. This proposed
passive zone is shown in Figure 9.
Considering the applied load direction which is from right to
left, the shear strain zone does not have a symmetric shape
towards the pile place and is inclined to the left. However, the
shear strain created in the soil surface behind the pile is more
than the shear strain in front of the pile. This is because there
are more angles of displacement vectors behind the pile than in
front of the pile (this result has been obtained from Section
3.1).
3.3 Displacement and strain field around a laterally
loaded rigid pile
In order to investigate the soil deformation pattern around a
laterally loaded rigid pile a test was performed on a model rigid
pile (test 13). Figures 10(a) and 10(b) show the displacement
vectors with a magnification factor of 3 and the shear strain of
a rigid pile which had a rotation at a depth of about 2?65B. It
can be observed that, unlike the flexible pile, significant
displacement occurs at increased depths.
3.4 Effects of pile length on soil deformation
patterns around a pile
To study the effect of pile length on soil deformation patterns
under lateral load the results of lateral force plotted against
pile head deflection for piles with different lengths are shown in
Figure 11. These tests were undertaken with piles of two
different stiffness (EI 5 0?68 N m2, EI 5 5?46 N m2) and four
different lengths (250, 350, 450, 550 mm). It can be observed
that for the piles with similar stiffness and width, when the
ratio L/B is bigger than 6, the increase of length has no effect
on the lateral capacity of the piles.
3.5 Effects of pile stiffness on soil deformation
patterns around a pile
In flexible piles, the pile stiffness is an effective parameter in
lateral load capacity. This parameter significantly influences the
deformation of the surrounding soil. In order to study the effect
of pile stiffness on the soil deformation pattern, three model
piles with various stiffnesses of the same length and width were
tested. Figure 12 illustrates strain wedge formation around these
piles for the same pile head deflection. It can be seen that the
–1
–1–2
1·5
2·0
1·0
1·0
0·8
0·6
0·4
0·2
0
1·0
0·8
0·6
0·4
0·2
0
21
0·5
0 0
(a)x/B
x/B
z/B
y/B
(b)
–2 21
2
3
4
5
1
0
0
Figure 8. Soil shear strain around pile: (a) side view; (b) top view
Passiveconical zone
Zero-displacementpoint
Lateral load
Model pile
Figure 9. Proposed 3-D model of passive zone of soil
International Journal of Physical Modelling in GeotechnicsVolume 11 Issue 3
Soil deformation patternaround laterally loaded pilesHajialilue-Bonab, Azarnya-Shahgoli
and Sojoudi
121

Delivered by ICEVirtualLibrary.com to:
IP: 212.6.33.13
On: Sun, 09 Oct 2011 13:15:09
mobilised depth of the strain wedge was increased and the
mobilised angle was decreased with increasing pile stiffness.
For a laterally loaded flexible pile Meyerhof et al. (1988)
suggested that in the absence of pile failure the ultimate load
for soil failure can be estimated using an effective embedment
depth instead of rigid pile depth.
Meyerhof et al. (1988) used the result of theoretical analyses
(Banerjee and Davis, 1978; Poulos and Davis, 1980) and
proposed the average relationship between the effective depth
ratio Le/L of free head pile and the pile stiffness Krs as below
6.Le
L~2:6K0:2
rs ƒ1
7. Krs~EI
EhL4
where Eh is the horizontal soil modulus at the pile tip. Figure 13
shows the comparison of experimental results obtained from this
study with theoretical formulation given by Equations 6 and 7.
As shown in Figure 13 the effective depth obtained in this re-
search is in agreement with the theoretical relationship.
3.6 Effects of pile diameter on soil deformation
patterns around a pile
To investigate the effect of pile width on soil deformation,
three models of pile with the same length and stiffness but with
various widths were tested. To study the pile diameter effect on
soil deformation patterns, the mobilised strain wedge around
the piles was extracted using PIV analysis. The 1% strain
x/B
(a)
z/B
03.5
1.51.0_1.0_2.0
3.0
2.0
1.0
0
x/B
(b)
z/B
03.5
1.51.0_1.0_2.0
3.0
2.0
1.0
0
0
0.2
0.4
0.8
0.6
1.0
Figure 10. Soil deformation pattern around rigid pile:
(a) displacement vectors (magnification factor 5 3); (b) shear strain
25
EI=0.68 (N m2)
EI=5.46 (N m2)
2015Deflection: mm
105
50 L/B=5.83L/B=7.5L/B=9.17
L/B=4.17
40
30
Load
: N
20
10
00 30
60
Figure 11. Typical load–displacement curve for various embedded
length ratios of piles
1x/B
z/L
0_1_2
Displacement = 20 mm
EI = 0.68 (N m2)EI = 5.46 (N m2)EI = 10.4 (N m2)
_3
0.2
2
0.4
0.6
0.8
0
Figure 12. Mobilised strain wedge around pile
International Journal of Physical Modelling in GeotechnicsVolume 11 Issue 3
Soil deformation patternaround laterally loaded pilesHajialilue-Bonab, Azarnya-Shahgoli
and Sojoudi
122

Delivered by ICEVirtualLibrary.com to:
IP: 212.6.33.13
On: Sun, 09 Oct 2011 13:15:09
wedges are illustrated for the same applied load in
Figure 14(a). With increasing pile diameter, the mobilised
strain wedge depth is reduced. To study the slope of the strain
wedge the curves in Figure 14(b) were normalised with respect
to z by strain wedge depth (Le). It can be observed that
although the depth of the strain wedge is decreased by
increasing pile diameter, the effective radius is increased.
3.7 Behaviour of soil around a laterally loaded pile
group
The effective radius has an important effect on lateral load
capacity of pile groups in front of laterally loaded piles in the
load direction and can affect the pile group performance. In
order to investigate the soil deformation pattern around
laterally loaded pile groups and pile–soil–pile interaction, six
tests were performed on a 2 6 1 pile group model by varying
the pile centre-to-centre spacing from 0?5 to 3 times the pile
widths (B) in the direction of the load. The properties of piles
were similar to test 1. The pile cap deflection for these tests was
9 mm (0?15B). In all of the following figures, point x/B 5 0
shows the place of the trail pile in the group. Also, points
x/B 5 20?5, 23 show the place of the lead pile in the pile
groups spaced at 0?5B, 3B respectively. Also, the origin of the
vertical axis (z/B 5 0) is taken as the soil surface. A schematic view
of the 3B pile group in soil from a side view is shown in Figure 15.
Note that the lead pile is at the front of the group in terms of
the direction of motion while the trail pile is at the back. The
displacement vectors around 0?5B and 3B pile groups are
shown in Figures 16(a) and 16(b). These vectors have been
plotted with a magnification factor of 3. These results are
accrued values over the whole test and illustrate the deforma-
tion pattern around the pile group.
It can be observed that radical changes of angle are always
large around the trail pile. For the pile group test with the pile
space equal to 0?5B, the change of angle around the lead pile is
small. If the pile space increases to 3B, the angle change around
the lead pile becomes similar to the trail pile. This demon-
strates that the group effect is negligible in the last case (pile
space is 3B).
In the case of 0?5B space between piles it can be observed that
the displacement vectors between two piles are almost
horizontal (Figure 16(a)). Therefore the soil between the two
piles has a very low resistance against horizontal displacement
of the trail pile. In this case the soil resistance for the piles in
the trailing row is greatly reduced owing to the influence of the
leading row piles on the soil. A slight reduction in soil
resistance for the piles in the leading row in comparison with
the single pile was observed.
In the case of 3B space between piles, the displacements of soil
around each pile have no overlaps. It can be concluded that the
interaction between piles decreases with increasing pile space.
Relative stiffness, Krs
0.8
0.6
0.4E
L e/L
0.2
01×10–31×10–41×10–51×10–6
Test data
Equation 6
1×10⁻²
1.0
Figure 13. Effective depth obtained from test and theoretical
relationship
B=40 mmB=31 mm
B=60 mmB=31 mm
B=40 mm B=60 mm
_0.5
0
0.5
1.0
1.50 0.5_1
x/B
(a) (b)
x/Le
z/L e
0
0.2
0.4
0.6
0.8
z/L
_3 0 3_6L/T=4.63L/T=4.63
Figure 14. Effect of pile width on mobilised strain wedge depth
and wedge angle
International Journal of Physical Modelling in GeotechnicsVolume 11 Issue 3
Soil deformation patternaround laterally loaded pilesHajialilue-Bonab, Azarnya-Shahgoli
and Sojoudi
123

Delivered by ICEVirtualLibrary.com to:
IP: 212.6.33.13
On: Sun, 09 Oct 2011 13:15:09
Figures 17(a) and 17(b) show maximum shear strain created in
soil around 0?5B and 3B pile groups. These results are accrued
values over the whole test.
In the case of 0?5B space between piles (Figure 17(a)) strain
wedges are overlapped, which shows the interaction of two
piles. In this case because the variation of the angles of
displacement vectors around the trail pile is more significant
than around the lead piles, the shear strain created in the soil
around the trail pile is more than around the lead pile. In the
3B pile group (Figure 17(b)) there is no interference and each
pile acts as a single pile. In this case the shear strain created in
the soil around the lead pile is similar to around the trail pile.
In the case of the 0?5B space, the created strain wedge is very
similar to a single pile with larger width. This means that when
two piles are very close to each other, the behaviour of the pile
group would be similar to a single pile. In this case the soil
between the two piles has a very small effect on the lateral
capacity of the pile group. The suggestion would be to put a
minimum space between the piles in the group in order to
mobilise the maximum capacity of the soil for lateral force and
displacements.
4. Conclusions
An extensive series of lateral loading tests has been conducted
on flexible model piles in loose sand. The piles were made of
different embedded length and stiffness to investigate soil
deformation patterns around piles and the influence of pile
length, stiffness and diameter on it. The group effect and
interaction between piles in a pile group were also studied. The
conclusions drawn from this study are summarised below.
(a) A cone-shaped passive zone is established in front of a
laterally loaded pile. This passive conical zone has the
largest section in the ground surface, and the size of this
section decreases with the increase in the ground depth
along the pile.
(b) Soil grains behind the pile moved down, while soil grains
in front of the pile moved up with small angles. In the trail
pile, the shear strain created in the surface soil is more
than that in the front of the pile.
(c) The embedment lengths of piles have less effect than pile
stiffness on lateral load capacity, although with increasing
pile stiffness the effect of embedded length on lateral
capacity increases.
(d) Increasing centre-to-centre pile spacing in a group in the
direction of lateral load will decrease the pile–soil–pile
interaction effects. Consequently both the behaviour of
piles and the soil deformation pattern around them are
similar to single pile ones. For pile cap deflection equal to
0?15B in 3B pile spacing the group effect disappears and
piles in a group behave like a single pile.
–5 –4 –3 –2 –1 10
0
1
3
4
5
2
x/B
(a)
z/B
–5 –4 –3 –2 –1 10
0
1
3
4
5
2
x/B
(b)
z/B
Figure 16. Soil displacement vectors around pile group
(magnification factor 5 3): (a) 0?5B pile group; (b) 3B pile group
_3 0
Trailpile
Leadpile
0 Soil surfaceLateral load
x/B
z/B
Figure 15. 3B pile group (side view)
International Journal of Physical Modelling in GeotechnicsVolume 11 Issue 3
Soil deformation patternaround laterally loaded pilesHajialilue-Bonab, Azarnya-Shahgoli
and Sojoudi
124

Delivered by ICEVirtualLibrary.com to:
IP: 212.6.33.13
On: Sun, 09 Oct 2011 13:15:09
(e) When two piles are very close to each other, the
behaviour of the pile group would be similar to a single
pile. In this case the soil between two piles has a very
small effect on the lateral capacity of the pile group.
REFERENCES
Ashour M, Norris G and Pilling P (1998) Lateral loading of a pile
in layered soil using the strain wedge model. Journal of
Geotechnical and Geoenvironmental Engineering ASCE
124(4): 303–315.
Banerjee PK and Davis TG (1978) The behaviour of axially and
laterally loaded single piles embedded in non homogeneous
soil. Geotechnique 28(3): 309–326.
Hajialilue-Bonab M (2003) Physical and Numerical Modelling of
a Single Pile in Sand under Lateral Impact Load. PhD
thesis, University of Caen, France.
Meyerhof GG, Sastry VVRN and Yelcin AS (1988) Lateral
resistance and deflection of flexible piles. Canadian
Geotechnical Journal 25(3): 511–522.
Otani J, Pham KD and Sano J (2006) Investigation of failure
patterns in sand due to laterally loaded pile using X-ray
CT. Soils and Foundations 46(4): 529–535.
Patra NR and Pise PJ (2001) Ultimate lateral resistance of pile
groups in sand. Journal of Geotechnical and
Geoenvironmental Engineering ASCE 127(6): 481–487.
Poulos HG and Davis EH (1980) Pile Foundations Analysis and
Design. Wiley, New York, NY, USA.
Prakash S and Sharma H (1989) Pile Foundations in Engineering
Practice. Wiley, London, UK.
Remaud D (1999) Piles under Lateral Forces: Experimental
Study of Piles Group. PhD thesis, University of Nantes,
France.
Rollins KM, Olsen RJ, Egbert JJ et al. (2006) Pile spacing effects
on lateral pile group behavior: load tests. Journal of
Geotechnical and Geoenvironmental Engineering ASCE
132(10): 1262–1271.
Terzaghi K (1955) Evaluation of coefficients of subgrade
reaction. Geotechnique 5(4): 297–326.
Tominaga K, Yamagata K and Kishida H (1983) Horizontal
displacement of soil in front of laterally loaded piles. Soils
and Foundations 23(3): 80–90.
White DJ and Take WA (2002) GeoPIV: Particle Image
Velocimetry (PIV) Software for Use in Geotechnical
Testing. University of Cambridge, Cambridge, UK, Report
CUED/D-SOILS/TR322.
White DJ, Take WA and Bolton MD (2003) Soil deformation
measurement using particle image velocimetry (PIV).
Geotechnique 53(7): 619–631.
Wood DM (2004) Geotechnical Modelling. Wiley, London, UK.
WHAT DO YOU THINK?
To discuss this paper, please email up to 500 words to the
editor at [email protected]. Your contribution will be
forwarded to the author(s) for a reply and, if considered
appropriate by the editorial panel, will be published as
discussion in a future issue of the journal.
International Journal of Physical Modelling in Geotechnics
relies entirely on contributions sent in by civil engineering
professionals, academics and students. Papers should be
2000–5000 words long (briefing papers should be 1000–
2000 words long), with adequate illustrations and refer-
ences. You can submit your paper online via www.icevir-
tuallibrary.com/content/journals, where you will also find
detailed author guidelines.
_5
1
2
3
4
5 _4 _3 _2x/B(a)
z/B
_1 0 1 _5 _4 _3 _2x/B(b)
_1 0 1
0
1
2
3
4
5
z/B
0
0.8
0.6
0.4
0.2
0
1.0
0.8
0.6
0.4
0.2
0
1.0
Figure 17. Soil shear strain around pile group: (a) 0?5B pile group;
(b) 3B pile group
International Journal of Physical Modelling in GeotechnicsVolume 11 Issue 3
Soil deformation patternaround laterally loaded pilesHajialilue-Bonab, Azarnya-Shahgoli
and Sojoudi
125