Structure and geodynamics of the post-collision zone between the Nazca–Antarctic spreading center...
11
Letters Structure and geodynamics of the post-collision zone between the Nazca–Antarctic spreading center and South America Andrei Maksymowicz a,b,n , Eduardo Contreras-Reyes a , Ingo Grevemeyer c , Ernst R. Flueh c a Departamento de Geofı ´sica, Facultad de Ciencias Fı ´sicas y Matema ´ticas, Universidad de Chile, Santiago, Chile b Departamento de Geologı ´a, Facultad de Ciencias Fı ´sicas y Matema ´ticas, Universidad de Chile, Santiago, Chile c GEOMAR, Helmholtz Centre of Ocean Research, Wischhofstr. 1-3, D-24148 Kiel, Germany article info Article history: Received 30 March 2012 Received in revised form 12 June 2012 Accepted 13 June 2012 Editor: P. Shearer Keywords: accretionary prism Patagonia Antarctic plate subduction erosion Chile Triple Junction abstract The Chile Triple Junction (CTJ) is the place where the Chile Ridge (Nazca–Antarctic spreading center) is subducting beneath the continental South American plate. Sediment accretion is active to the south of the CTJ in the area where the northward migrating Chile Ridge has collided with the continent since 14 Ma. At the CTJ, tectonic erosion of the overriding plate narrows and steepens the continental slope. We present here a detailed tomographic image of the upper lithospheric Antarctic–South America subduction zone where the Chile Ridge collided with the continent 3–6 Ma off Golfo de Penas. Results reveal that a large portion of trench sediment has been scraped off and frontally accreted to the forearc forming a 70–80 km wide accretionary prism. The velocity–depth model shows a discontinuity at 30–40 km landward of the deformation front, which is interpreted as the contact between the frontal (poorly consolidated sedimentary unit) and middle (more compacted sedimentary unit) accretionary prism. The formation of this discontinuity could be related to a short term episode of reduced trench sedimentation. In addition, we model the shape of the continental slope using a Newtonian fluid rheology to study the convergence rate at which the accretionary prism was formed. Results are consistent with an accretionary prism formed after the collision of the Chile Ridge under slow convergence rate similar to those observed at present between Antarctic and South America ( 2.0 cm/a). Based on the kinematics of the Chile Ridge subduction during the last 13 Ma, we propose that the accretionary prism off Golfo de Penas was formed recently ( 5 Ma) after the collision of the Chile Ridge with South America. & 2012 Elsevier B.V. All rights reserved. 1. Introduction Subduction of a mid-oceanic ridge is a catastrophic event, which is expected to disrupt and erode a huge amount of material from the overriding plate, as reported by many authors for the present-day Chile Triple Junction (CTJ) of the oceanic Nazca and Antarctic, and continental South America plates (Forsythe and Nelson, 1985; Cande and Leslie, 1986; Behrmann and Kopf, 2001; Ranero et al., 2006). The collision of the Chile Ridge or Chile Rise (Nazca–Antarctic spreading center) with the South American con- tinent involves a relatively simple plate geometry, whereas the approaching segments of spreading centers are nearly parallel to the trench axis, and one section of the rift valley is currently passing beneath the continental slope (Fig. 1). This simple geome- try makes it possible to study the structure of the continental margin before, during, and after a ridge–trench collision. Some of the previously noted effects of the Chile Ridge subduction on the margin are (1) rapid uplift followed by subsidence of the forearc area (Cande and Leslie, 1986), (2) tec- tonic erosion where the ridge is subducting (Herron et al., 1981; Behrmann and Kopf, 2001; Ranero et al., 2006), and (3) normal faulting and intensive sedimentary mass wasting (Behrmann and Kopf, 2001). Onshore, field work in the Tres Montes and Taitao peninsula (Fig. 1) found recent anomalous near trench magma- tism and ophiolites (Lagabrielle et al., 2000; Bourgois et al., 1996; Guivel et al., 2003), and the northward migration of the Chile Ridge is believed to have left a magmatic signature along the margin in the wake of the Chile Ridge (i.e., Lagabrielle et al., 2000). Seismic refraction and wide-angle data collected in 2004/2005 offshore of the Golfo de Penas, Chilean Patagonia (Fig. 1), provide the opportunity to study the seismic structure of the incoming/ subducting oceanic Antarctic plate and the marine continental forearc in the post-collision zone between the Chile Ridge and South America. We present a high resolution 2D seismic tomo- graphic model, complemented by seismic reflection imaging of sediments, gravimetric and high resolution bathymetry data Contents lists available at SciVerse ScienceDirect journal homepage: www.elsevier.com/locate/epsl Earth and Planetary Science Letters 0012-821X/$ - see front matter & 2012 Elsevier B.V. All rights reserved. http://dx.doi.org/10.1016/j.epsl.2012.06.023 n Correspondence to: Departamento de Geofı ´sica, Facultad de Ciencias Fı ´sicas y Matema ´ ticas, Universidad de Chile, Blanco Encalada 2002, Santiago, Chile. Fax: þ56 2 6968686. E-mail address: [email protected] (A. Maksymowicz). Earth and Planetary Science Letters 345–348 (2012) 27–37
Transcript of Structure and geodynamics of the post-collision zone between the Nazca–Antarctic spreading center...

Earth and Planetary Science Letters 345–348 (2012) 27–37
Contents lists available at SciVerse ScienceDirect
Earth and Planetary Science Letters
0012-82
http://d
n Corr
Matema
Fax: þ5
E-m
journal homepage: www.elsevier.com/locate/epsl
Letters
Structure and geodynamics of the post-collision zone betweenthe Nazca–Antarctic spreading center and South America
Andrei Maksymowicz a,b,n, Eduardo Contreras-Reyes a, Ingo Grevemeyer c, Ernst R. Flueh c
a Departamento de Geofısica, Facultad de Ciencias Fısicas y Matematicas, Universidad de Chile, Santiago, Chileb Departamento de Geologıa, Facultad de Ciencias Fısicas y Matematicas, Universidad de Chile, Santiago, Chilec GEOMAR, Helmholtz Centre of Ocean Research, Wischhofstr. 1-3, D-24148 Kiel, Germany
a r t i c l e i n f o
Article history:
Received 30 March 2012
Received in revised form
12 June 2012
Accepted 13 June 2012
Editor: P. ShearerWe present here a detailed tomographic image of the upper lithospheric Antarctic–South America
Keywords:
accretionary prism
Patagonia
Antarctic plate
subduction
erosion
Chile Triple Junction
1X/$ - see front matter & 2012 Elsevier B.V.
x.doi.org/10.1016/j.epsl.2012.06.023
espondence to: Departamento de Geofısica, F´ ticas, Universidad de Chile, Blanco Enca
6 2 6968686.
ail address: [email protected] (A. Maksymo
a b s t r a c t
The Chile Triple Junction (CTJ) is the place where the Chile Ridge (Nazca–Antarctic spreading center) is
subducting beneath the continental South American plate. Sediment accretion is active to the south of
the CTJ in the area where the northward migrating Chile Ridge has collided with the continent since
14 Ma. At the CTJ, tectonic erosion of the overriding plate narrows and steepens the continental slope.
subduction zone where the Chile Ridge collided with the continent 3–6 Ma off Golfo de Penas. Results
reveal that a large portion of trench sediment has been scraped off and frontally accreted to the forearc
forming a 70–80 km wide accretionary prism. The velocity–depth model shows a discontinuity at
30–40 km landward of the deformation front, which is interpreted as the contact between the frontal
(poorly consolidated sedimentary unit) and middle (more compacted sedimentary unit) accretionary
prism. The formation of this discontinuity could be related to a short term episode of reduced trench
sedimentation. In addition, we model the shape of the continental slope using a Newtonian fluid
rheology to study the convergence rate at which the accretionary prism was formed. Results are
consistent with an accretionary prism formed after the collision of the Chile Ridge under slow
convergence rate similar to those observed at present between Antarctic and South America
(�2.0 cm/a). Based on the kinematics of the Chile Ridge subduction during the last 13 Ma, we propose
that the accretionary prism off Golfo de Penas was formed recently (�5 Ma) after the collision of the
Chile Ridge with South America.
& 2012 Elsevier B.V. All rights reserved.
1. Introduction
Subduction of a mid-oceanic ridge is a catastrophic event,which is expected to disrupt and erode a huge amount of materialfrom the overriding plate, as reported by many authors for thepresent-day Chile Triple Junction (CTJ) of the oceanic Nazca andAntarctic, and continental South America plates (Forsythe andNelson, 1985; Cande and Leslie, 1986; Behrmann and Kopf, 2001;Ranero et al., 2006). The collision of the Chile Ridge or Chile Rise(Nazca–Antarctic spreading center) with the South American con-tinent involves a relatively simple plate geometry, whereas theapproaching segments of spreading centers are nearly parallel tothe trench axis, and one section of the rift valley is currentlypassing beneath the continental slope (Fig. 1). This simple geome-try makes it possible to study the structure of the continentalmargin before, during, and after a ridge–trench collision.
All rights reserved.
acultad de Ciencias Fısicas y
lada 2002, Santiago, Chile.
wicz).
Some of the previously noted effects of the Chile Ridgesubduction on the margin are (1) rapid uplift followed bysubsidence of the forearc area (Cande and Leslie, 1986), (2) tec-tonic erosion where the ridge is subducting (Herron et al., 1981;Behrmann and Kopf, 2001; Ranero et al., 2006), and (3) normalfaulting and intensive sedimentary mass wasting (Behrmann andKopf, 2001). Onshore, field work in the Tres Montes and Taitaopeninsula (Fig. 1) found recent anomalous near trench magma-tism and ophiolites (Lagabrielle et al., 2000; Bourgois et al., 1996;Guivel et al., 2003), and the northward migration of the ChileRidge is believed to have left a magmatic signature along themargin in the wake of the Chile Ridge (i.e., Lagabrielle et al.,2000).
Seismic refraction and wide-angle data collected in 2004/2005offshore of the Golfo de Penas, Chilean Patagonia (Fig. 1), providethe opportunity to study the seismic structure of the incoming/subducting oceanic Antarctic plate and the marine continentalforearc in the post-collision zone between the Chile Ridge andSouth America. We present a high resolution 2D seismic tomo-graphic model, complemented by seismic reflection imaging ofsediments, gravimetric and high resolution bathymetry data

-79º
-79º
-78º
-78º
-77º
-77º
-76º
-76º
-75º
-75º
-74º
-74º
-73º
-73º
-50º00' -50º00'
-49º30' -49º30'
-49º00' -49º00'
-48º30'-48º30'
-48º00'-48º00'
-47º30'-47º30'
-47º00'-47º00'
-46º30'-46º30'
-46º00'-46º00'
-45º30' -45º30'
-45º00' -45º00'
116
121
145
152
-7500Bathymetry [m]
GUAMBLIN F.Z.
DARWIN F.Z.
TAITAO F.Z.
TRES MONTES F.Z.
ESMERALDA F.Z.
P07-Corridor5
CTJ
Golfo de Penas Basin
6.6 cm/yr
1.8 cm/yr
CH
ILE RISE.
LOFZTMP
TP
Corridor4
rc2901-746
rc2901-748
rc2901-751
-44º30'
-44º00'
-44º30'
-44º00'
GUAFO F.Z.
Corridor3
-5000 -2500 0 2500 5000 7500
Fig. 1. High resolution bathymetry from TIPTEQ cruise SO181 from Scherwath et al. (2009) and Bourgois et al. (2000). Black dots represent locations of ocean bottom
seismic instruments. Red dots indicate the five stations (152, 145, 121, and 116) shown in Fig. 4. Segmented curve corresponds to the intracrustal Liquine Ofqui Fault Zone
(LOFZ). TP and TMP mark the locations of the Taitao Peninsula and the Tres Montes Peninsula. The blue lines show the location of the wide angle seismic profiles corridor
3 and corridor 4 (Scherwath et al., 2009). The gray lines show the location of the seismic reflection profiles 751, 748 and 759 acquired in the cruise R/V Conrad RC 2901.
A. Maksymowicz et al. / Earth and Planetary Science Letters 345–348 (2012) 27–3728
(Flueh and Grevemeyer, 2005; Scherwath et al., 2009). Resultsprovide new insights into the evolution of acretionary margins,rebuilding of the accretionary prism after the ridge–trench
collision, and the geometry of the deformation front affected bysubduction of different segments of the Nazca–Antarctic spread-ing center.

-78º00'
-78º00'
-77º30'
-77º30'
-77º00'
-77º00'
-76º30'
-76º30'
-76º00'
-76º00'
-75º30'
-75º30'
-75º00'
-75º00'
-74º30'
-74º30'
-74º00'
-74º00'
-48º00' -48º00'
-47º30' -47º30'
-47º00' -47º00'
-5000Bathymetry [m]
-4500 -4000 -3500 -3000 -2500 -2000 -1500 -1000 -500 0
TRES MONTES F.Z.
DF
DF2
WARC
SB
DF
CBC
GPC
Seamounts
Fig. 2. High resolution bathymetry of the Golfo de Penas region, where the Deformation Front (DF), Widest Accretionary Ridge Complex (WARC), seaward limit of the
WARC (DF2), Slope Basin (SB), Cabo Bynoe Canyon (CBC), and Golfo de Penas Canyon (GPC) are shown.
A. Maksymowicz et al. / Earth and Planetary Science Letters 345–348 (2012) 27–37 29
2. Tectonic setting
The motion of Antarctic plate relative to South America hasbeen roughly E–W since 25 Ma and its present convergence rate isabout 20 km/Ma, while the Nazca–South America convergencerate is about 66 km/Ma and has remained close to N781E duringthe last 25 Ma (Cande and Leslie, 1986; Pardo-Casas and Molnar,1987; Angermann et al., 1999). Because the Chile Rise axis is�101 oblique to the Chile trench axis, the CTJ migrates northward(Cande et al., 1987). The Chile Rise first met the Chile trench about14 Ma at Tierra del Fuego, at 521S (Forsythe and Nelson, 1985).
The CTJ spatially correlates with a mayor change in the offshoremorphology of the Chilean margin. North of CTJ and south of theJuan Fernandez Ridge, the margin hosts a frontal accretionaryprism 5–40 km wide (Scherwath et al., 2009; Contreras-Reyeset al., 2010). North of �331S where the Juan Fernandez Ridgesubducts, the Chilean margin is characterized by a starved trenchand has been in erosional mode since Jurassic (Ranero et al., 2006).In the vicinity of the CTJ, where the Chile Ridge is subducting,tectonic erosion is active (Herron et al., 1981; Behrmann and Kopf,2001; Ranero et al., 2006). South of CTJ, sediment accretion is thedominant process, resulting in the formation of relatively largefrontal accretionary prisms (460 km wide) (Behrmann and Kopf,2001; Ranero et al., 2006).
The subduction of the Chile Ridge left the formation of anasthenospheric slab window by the progressive separation of theoceanic Nazca and Antarctic lithospheres beneath the overridingSouth American plate (Cande and Leslie, 1986; Thorkelson, 1996). Inthe studied area, Russo et al. (2010) studied this slab window usingseismological data and showed that the seaward limit of the windowis located approximately in the middle of the Golfo de Penas Basin.The slab window also spatially correlates with a Quaternary volcanicgap between 471S and 491S (Cande and Leslie, 1986).
2.1. Regional geology
Landward of the CTJ, the Taitao Peninsula (TP in Fig. 1)involves a Paleo accretionary complex consisting of metaturbi-dites and schists of Triassic protolith bounded by Pliocenevolcanic centers and granitoids to the west. At the shelf break,Plio-Pleistocene ophiolite complex and Pliocene plutonic rocksare exposed in the westernmost part of Tres Montes Peninsula
(TMP in Fig. 1) (Kaeding et al., 1990). The main geologic unitobserved to the east and to the south of the Golfo de Penas is theNorth Patagonian Batholith, of early Cretaceous age (MapaGeologico de Chile, 2003). It is assumed that the basement ofGolfo de Penas Basin is composed of pre-tertiary metamorphicand plutonic rocks with local outcrops of Miocene and Pliocenemagmatism probably associated with subduction of the ChileRidge segments (e.g., Lagabrielle et al., 2000).
The southern expression of the N–S Liquine Ofqui Strike Faultsystem (LOFZ) is located arcward of the CTJ (Fig. 1), which isdescribed as a main crustal structure that shows right-sensemovement in response to stress partitioning due to obliqueNazca–South America convergence (Cembrano et al., 2002).According to Murdie et al. (1993) the opening of Golfo de PenasBasin is interpreted as a pull-apart extension episode related tothe dynamic of LOFZ forced by Chile Ridge subduction during thelast 6 Ma (see geological map of the studied zone in the supple-mentary material).
2.2. Trench sedimentation
The southern central Chile trench between 341S and 531S isheavily sedimented as a result of the sediments delivered by therivers and the rapid glaciation denudation of the Andes(Thornburg and Kulm, 1987; Bangs and Cande, 1997; Bourgoiset al., 2000). Sediment transport from the continent to the trenchis controlled by submarine landslides, submarine canyons, andturbidity currents (Voelker et al., 2006), and high precipitation(annual precipitation could exceed 4000 mm). At relatively highlatitudes, the influx of terrigenous sediments changed over timein response to glacial and warming events. Vostok drilling ice core(Petit et al., 1999) and d18O–d13C deep-sea isotope records(Zachos et al., 2001) reveal short term climate cycles with powerspectrum peaks centered at periods of �100 kyr and �41 kyrsince 0.5 Ma. According to these studies, the last Glacial Max-imum occurred �18 ka.
3. Wide-angle seismic data
From December 2004 to February 2005, the TIPTEQ (from TheIncoming Plate to Mega-thrust Earth-Quake Processes) project

A. Maksymowicz et al. / Earth and Planetary Science Letters 345–348 (2012) 27–3730
investigated the subduction zone offshore Chilean Patagoniasouth of the CTJ aboard the German R/V Sonne (Flueh andGrevemeyer, 2005). In this paper, we present seismic wide-angledata that were collected along the profile P07, supplemented byhigh-resolution swath bathymetric images of the surroundingseafloor (Figs. 1–3). The seismic line P07 is located �110 kmsouth of the CTJ (Figs. 1 and 2) covering the outer rise, continentalslope and shelf in the area of the Golfo de Penas (Fig. 2). Shotswere recorded with 37 OBS (Ocean Bottom Seismometers) andOBH (Ocean Bottom Hydrophones) spaced every �5.5 km.The seismic source for the refraction work carried out was acluster of 8�8 L G guns, providing a total volume of 64 L for eachshot. The sources was fired at a time interval of 60 s, whichcorresponds to an average shot spacing of �150 m. Coincidentseismic reflection data were also collected along this profile(Fig. 3). For the reflection investigation a 100-m-long 16-channelstreamer and a Generator/Injector (GI) gun with a volume of 1.5 Lwere used, providing high-resolution images of the sedimentarysequences blanketing the incoming plate.
We recorded shallow sediments refractions (Ps), reflectionsfrom the bottom of the forearc basin (PsP), intracrustal refractions(Pg), reflections from the top of the oceanic crust (PtocP), Mohoreflections (PmP) and mantle refractions (Pn) of excellent quality.Four example record sections are shown in Fig. 4, with theiridentified seismic phases annotated (see details in the Supple-mentary material).
4. Travel-time tomography inversion
We used the inversion method of Korenaga et al. (2000) whichallows the joint inversion of seismic refraction and reflection traveltime data for a 2-D velocity field. To derive the velocity–depthmodel, the water depth taken from the swath bathymetry centerbeam was used to construct the seabed–water column interface,and this remained fixed during the inversion. In order to obtain thesedimentary velocities and thicknesses, we jointly inverted refrac-tion (Ps), reflection (PsP) phases and shallow seismic reflection data(Fig. 4). The sedimentary velocities and geometry of the forearcbasin derived from the tomographic inversion were then held fixedin the following iterative inversions. Crustal velocities wereinverted using Pg phases, while the top of the overriding con-tinental crust was constrained using PtocP arrivals. Similarly,oceanic crustal velocities and Moho depths of the subductingPacific crust were derived using oceanic Pg and PmP phases,respectively. Finally, the uppermost mantle velocities of theincoming Antarctic plate were inverted using Pn phases.
10 30 50 704020
2
3
4
5
6
7
X [
TWT
[s] Deformati
(DSeamounts
Top of Oceanic Crust
860
Fig. 3. High-resolution seismic reflection line coi
The horizontal grid spacing of the model used for the velocityinversion is 0.5 km, whereas the vertical grid spacing is variedfrom 0.1 km at the top of the model to 0.3 km at the bottom.Variable smoothing, damping and correlations lengths para-meters were employed to regularize the inversion and minimizehigh spatial frequency artifacts, mainly in deepest part of themodel. We prepared the reference model for the tomographicinversion by 1-D modeling of six seismic stations, which weconsider as a key to define the general structure of the margin.The 2-D seismic velocities of the reference model are calculatedby linearly interpolating the velocities of the 1-D velocity models(see Supplementary material for 1-D velocity models).
High ray coverage was obtained in the western part of themodel (x¼0–165 km) (Fig. 5), resulting in a robust inversion ofvelocities and depths for the incoming Antarctic crust, continentalwedge and Golfo de Penas forearc basin. The geometry of the topof the subducted Antarctic crust is poorly constrained by PtocP andPmP reflections in the eastern zone of the profile. Therefore, weperform a gravity model of the entire Moho discontinuity toconstrain the top of the Antarctic plate. Additionally, we study thevelocity and depth uncertainties of our model by performing aMontecarlo type analysis (see Supplementary material).
4.1. Description of results
4.1.1. Oceanic crust and uppermost mantle
The velocity–depth model shows that the Antarctic crust is onaverage �5.7 km thick, and is covered by a layer of pelagic andterrigenous sediments that become thicker landward from�0.7 km to �2.3 km at the deformation front. Upper and lowercrust is in the range of 4.0–6.0 km/s and 46.0–7.3 km/s, respec-tively. Near x¼35 km, a detected high velocity zone in the uppercrust (Fig. 5) spatially correlates with three seamounts observedin the reflection and bathymetry data (Figs. 2 and 3). This anomalyis characterized by a decrease of velocities both in the lower crustand mantle (Fig. 5).
We observe two low Vp anomalies in the uppermost mantlecompared with typical mantle peridotite velocities (Z8.0 km/s).One is located at x�30 km and correlates with the position ofthree small seamounts (Figs. 2, 3, and 5). The another and widestlow velocity anomaly (7.4–8.0 km/s) is located beneath thecontinental slope and shelf.
4.1.2. The accretionary complex and continental basement
A wedge-shaped body is identified from the deformation front tothe continental shelf, where seismic velocities increase landwardfrom 2.5–3.0 km/s to 5.5–6.0 km/s over �70 km length (Fig. 5). Thisbody is segmented by two units with a horizontal velocity-gradient of
110 120 130 140 150km]
on FrontF)
Slope Basin (SB)
Widest Accretionary Ridge Complex (WARC)
DF2
0 90 100
ncident with wide-angle seismic profile P07.

Fig. 4. Examples of wide-angle seismic data with predicted travel times, which are computed based on the velocity model presented in Fig. 5, and corresponding ray path
are also plotted at the bottom. (A) OBS 152, (B) OBS 145, (C) OBS 121, and (D) OBS 116.
A. Maksymowicz et al. / Earth and Planetary Science Letters 345–348 (2012) 27–37 31

Fig. 5. Velocity model of the profile P07 obtained from tomographic inversion of travel times from crustal and mantle phases.
1-5
4.5
4
3.5
3
2.5
2
1.5
1
0.5
0Average Vp Model - Golfo de Penas
Vp [km/s]
Dep
th [k
m]
Golfo de Penas Basament
Deep Sediments
Shallow Sediments
802
2.5
3
3.5
4
4.5
5
5.5
6
6.5
C1
C7
Vp
[km
/s]
X [km]
Bac
ksto
p C1
C2
C3
C4
C5
C6
C7DF2
90 100 110 120 130 140 150 160 2 3 4 5 6 7
Fig. 6. (A) Extracted velocities along the thick black lines shown in Fig. 5, which landward of the shelf break corresponds to continental basement velocities. Note the
strong horizontal velocity gradients at the DF2 and shelf break. (B) Velocity–depth profile for the shelf basin and uppermost continental basement, this profile corresponds
to the average model into the segmented rectangle.
A. Maksymowicz et al. / Earth and Planetary Science Letters 345–348 (2012) 27–3732
0.025 km/s/km (Fig. 6A) separated by an abrupt increase of velocity,located at x�105 km. Similarly and coinciding with the shelf break,there is another abrupt increase of velocity.
5. Interpretation and discussion
Fig. 7 summarizes our interpretation, which is described asfollows.
5.1. Upper structure of the Antarctic oceanic lithosphere
At x¼35 km, high upper and low lower crustal velocities correlatewith the location of three seamounts (Figs. 3 and 5). The upper
mantle velocities of 7.6–7.8 km/s beneath the seamounts suggestcrustal intrusion and the presence of magmatic underplating addedbelow the Moho. These seamounts were likely formed near theNazca–Antarctic spreading center. The velocity–depth model alsoshows a wide low velocity anomaly centered around x�140 km inthe upper mantle (Fig. 5). The low upper mantle velocities may becaused by hydration and bending related faulting of the oceaniclithosphere as has been observed in seismic profiles north of CTJ(Scherwath et al., 2009). It is also possible that low Pn velocities arerelated to high temperatures around the subducted Antarctic–Nazcaspreading center, as is reported by a seismological study which showsthat the western limit of the Patagonian slab window is located belowthe Golfo de Penas Basin (Russo et al., 2010).
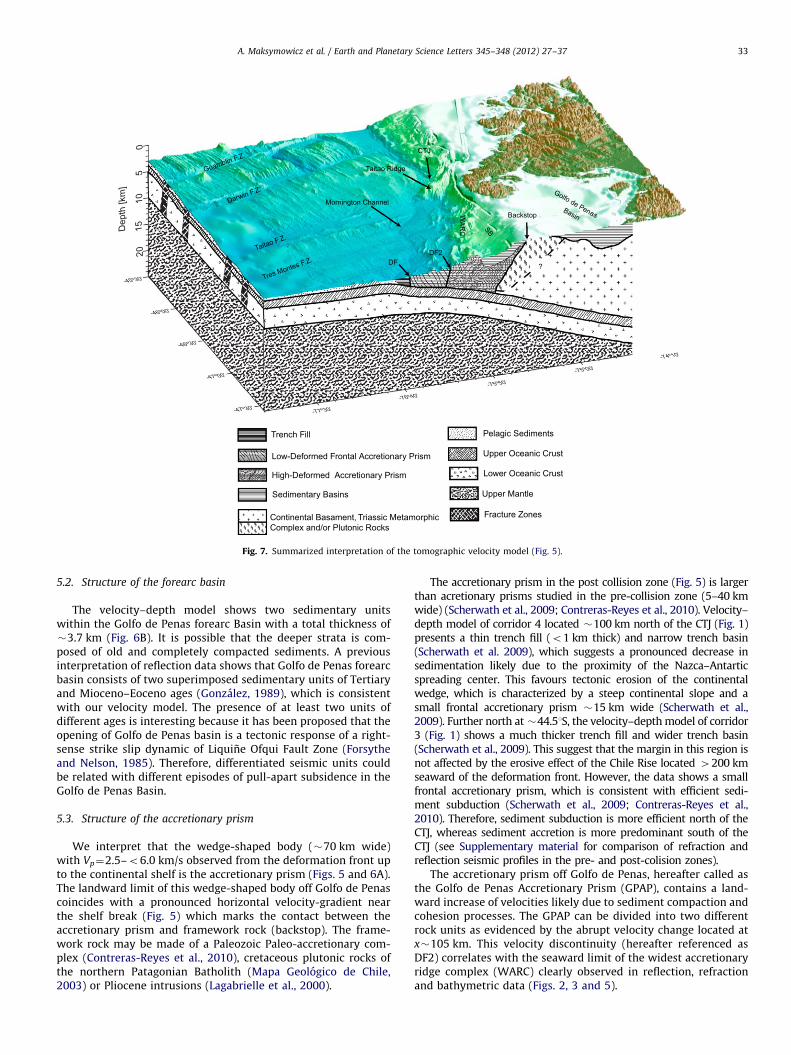
Fig. 7. Summarized interpretation of the tomographic velocity model (Fig. 5).
A. Maksymowicz et al. / Earth and Planetary Science Letters 345–348 (2012) 27–37 33
5.2. Structure of the forearc basin
The velocity–depth model shows two sedimentary unitswithin the Golfo de Penas forearc Basin with a total thickness of�3.7 km (Fig. 6B). It is possible that the deeper strata is com-posed of old and completely compacted sediments. A previousinterpretation of reflection data shows that Golfo de Penas forearcbasin consists of two superimposed sedimentary units of Tertiaryand Mioceno–Eoceno ages (Gonzalez, 1989), which is consistentwith our velocity model. The presence of at least two units ofdifferent ages is interesting because it has been proposed that theopening of Golfo de Penas basin is a tectonic response of a right-sense strike slip dynamic of Liquine Ofqui Fault Zone (Forsytheand Nelson, 1985). Therefore, differentiated seismic units couldbe related with different episodes of pull-apart subsidence in theGolfo de Penas Basin.
5.3. Structure of the accretionary prism
We interpret that the wedge-shaped body (�70 km wide)with Vp¼2.5–o6.0 km/s observed from the deformation front upto the continental shelf is the accretionary prism (Figs. 5 and 6A).The landward limit of this wedge-shaped body off Golfo de Penascoincides with a pronounced horizontal velocity-gradient nearthe shelf break (Fig. 5) which marks the contact between theaccretionary prism and framework rock (backstop). The frame-work rock may be made of a Paleozoic Paleo-accretionary com-plex (Contreras-Reyes et al., 2010), cretaceous plutonic rocks ofthe northern Patagonian Batholith (Mapa Geologico de Chile,2003) or Pliocene intrusions (Lagabrielle et al., 2000).
The accretionary prism in the post collision zone (Fig. 5) is largerthan acretionary prisms studied in the pre-collision zone (5–40 kmwide) (Scherwath et al., 2009; Contreras-Reyes et al., 2010). Velocity–depth model of corridor 4 located �100 km north of the CTJ (Fig. 1)presents a thin trench fill (o1 km thick) and narrow trench basin(Scherwath et al. 2009), which suggests a pronounced decrease insedimentation likely due to the proximity of the Nazca–Antarticspreading center. This favours tectonic erosion of the continentalwedge, which is characterized by a steep continental slope and asmall frontal accretionary prism �15 km wide (Scherwath et al.,2009). Further north at �44.51S, the velocity–depth model of corridor3 (Fig. 1) shows a much thicker trench fill and wider trench basin(Scherwath et al., 2009). This suggest that the margin in this region isnot affected by the erosive effect of the Chile Rise located 4200 kmseaward of the deformation front. However, the data shows a smallfrontal accretionary prism, which is consistent with efficient sedi-ment subduction (Scherwath et al., 2009; Contreras-Reyes et al.,2010). Therefore, sediment subduction is more efficient north of theCTJ, whereas sediment accretion is more predominant south of theCTJ (see Supplementary material for comparison of refraction andreflection seismic profiles in the pre- and post-colision zones).
The accretionary prism off Golfo de Penas, hereafter called asthe Golfo de Penas Accretionary Prism (GPAP), contains a land-ward increase of velocities likely due to sediment compaction andcohesion processes. The GPAP can be divided into two differentrock units as evidenced by the abrupt velocity change located atx�105 km. This velocity discontinuity (hereafter referenced asDF2) correlates with the seaward limit of the widest accretionaryridge complex (WARC) clearly observed in reflection, refractionand bathymetric data (Figs. 2, 3 and 5).

A. Maksymowicz et al. / Earth and Planetary Science Letters 345–348 (2012) 27–3734
An accretionary wedge can be defined as a particular case of afold and trust-belt with basal decollement at the top of subduc-tion channel, where the continental basement behaves as a rigidindentor. However, the simple model of a compressive sedimen-tary wedge with a landward increase of compaction degreecannot explain the dynamic complexities of accretionary prisms.In particular, alternation between accretion and erosion periodstemporarily affect the size of the accretionary prism. For instance,if the accretionary prism size is reduced by a short-term erosiveepisode and the conditions at the trench for tectonic accretion arereached, a new frontal accretionary prism of unconsolidatedsediments can be formed. In this case, the previous partiallyeroded accretionary prism should work as a semi-rigid indentorfor the new frontal prism. Furthermore, the compressional defor-mation should affect the entire accretionary prism (i.e., from thecurrent deformation front up to the accretionary prism–continental basement contact). The case for a new frontal accre-tionary prism formed after a long erosive episode is different.In this case, the eroded continental basement that could becomposed of crystalline and/or metasedimentary complex behavesas a rigid backstop for the new frontal prism. In this case, the maincompressional deformation is confined to the new frontal prism.
We interpret the DF2 discontinuity as the deformation frontduring a possible short-term erosive (or non-accretionary) epi-sode that eroded the front of the GPAP. Simpson (2010) suggestedthat during short term episodes of reduced sediment supply tothe trench, the deformation front rapidly advances seaward, andthe partially eroded accretionary prism is narrowed and stee-pened. This mechanism could explain the formation of the WARC.In fact, the WARC uplift blocks the trenchward transport ofterrigenous sediments, which were accumulated in the mainslope basin as observed in Fig. 3. Consistently, our velocity–depth model shows low velocities associated with this youngslope basin (Fig. 5).
5.4. Age of the Golfo de Penas accretionary prism
To estimate the age of the GPAP formed since the beginning ofthe last long-term accretionary period in the area, we analyze theshape of the GPAP using a Newtonian fluid rheology (Emermanand Turcotte, 1983). This approach allows an analytical predictionof the depth of the continental slope h as a function of theconvergence rate u0, characteristic length of the accretionaryprism L, sediment density rs, water density rw, and dynamicviscosity Z. The idea is to derive u0 and compare it to Nazca–SouthAmerica and Antarctic–South America convergence rates to inferwhether the GPAP was entirely formed after the collision of theChile Ridge with South America or not. In addition, a kinematicpaleo reconstruction of the ridge–trench collision is calculated toestimate the time of collision in the study zone.
According to Emerman and Turcotte (1983), the slope h of aviscous accretionary prism can be approximated as
hðxÞ ¼ CðL�xÞ½ �1=3
ð1Þ
where the constant C is related to u0, Z, rs, rw, and the gravityacceleration g via:
C ¼9Zu0
gðrs�rwÞð2Þ
Thus, C can be determined by fitting the bathymetric profiles(see Fig. 8A for bathymetric profiles), and finally the convergencerate is estimated using (2). Fig. 8B shows the estimated conver-gence rate using (2) in W–E profiles at different latitudes aroundCTJ. If a uniform Newtonian fluid rheology is assumed for themargin, a clear increase of convergence rate is observed north
of CTJ. Emerman and Turcotte (1983) modeled the shape of theaccretionary prism across the Kurile, Ryukyu, and Aleutian mar-gins and they found a range of 1017–1018 Pa s. Consequently, weconsider a value of Z¼7�1017 Pa s and rs¼2500 kg/m3 which fitin the south the current Antarctica–South America convergencerate (2.0 cm/yr), and in the north the present Nazca–SouthAmerica convergence rate (6.6 cm/yr). Since the sediment originis the same to the north and south of the CTJ (sourced fromthe continent) (Voelker et al., 2006), we do not expect muchdifference in their composition and viscosity. Thus, the pre-sented model is consistent with the hypothesis that accretion-ary prism observed south of CTJ has been formed entirely afterthe subduction of the Chile Ridge, which implies that thebackstop observed in seismic profile marks the position of thedeformation front at the beginning of the accretion processoffshore of Golfo de Penas.
Using the finite rotation poles of Nazca–South America andAntarctica–South America plates (Cande and Leslie, 1986), agegrid of the oceanic Nazca plate (Cande and Leslie, 1986; Tebbensand Cande, 1997), and mapping oceanic features from the highresolution bathymetry and gravity data, we derive the Chile Ridgemigration during the last 13 Ma (Fig. 9). Additionally, from thebackstop location observed in Fig. 5, we extrapolate the locationof the backstop between CTJ and 501S (segmented red curve inFig. 9) using gravity data. The NS extrapolation was done follow-ing a local gravity minimum clearly observed between thesedimentary ridges and the shelf break, which is coincident withthe backstop in profile P07. Thus, we expect the same configura-tion to the north and to the south of the studied seismic profile(see Supplementary material for gravity data).
According to the previous analysis, the intersection betweenthe trace of Chile Ridge and backstop defines the maximum age ofaccretion at different latitudes. We therefore conclude that theage of the accretionary prism decreases to the north, taking valuesof 5.9 Ma close to Esmeralda FZ, �4.95 Ma off Golfo de Penas, and0 Ma at the CTJ (Fig. 9B and C). The northward decrease of theaccretionary prism age correlates with the narrowing geometrydefined by the deformation front and backstop (Fig. 9), whichshows a direct interplay between the GPAP width and theposition of the subducting Chile Ridge during the last 13 Ma.
5.5. Tectonic implications of the collision between the Chile Ridge
and Southern Andean Margin
The previous analysis has important implications for the geody-namics of the Patagonian margin influenced by the Chile Ridgesubduction since 9 Ma. To describe the evolution of the margin,we consider two assumptions based on observations in the vicinityof the current CTJ. These assumptions are (1) large and smallaccretionary prisms are formed in regions with slow and rapidconvergence rates, respectively, and (2) subduction of the ChileRidge removes the entire accretionary prism as is observed in thecurrent CTJ region. Thus, the main implications of the subductionand migration of the Chile Ridge are as follows:
(1)
Before 9.3 Ma, a rapid northward migration of the subductingChile Ridge erodes locally an old accretionary prism thatpossibly was small as is observed currently north of the CTJ(Contreras-Reyes et al., 2010). Moreover, the high Nazca–South America convergence rate in the past was higher(�80 km/Ma, Cande and Leslie, 1986) than present times(�66 km/Ma, Angermann et al., 1999), which possiblyfavored sediment subduction instead of accretion around9 Ma. South of Esmeralda FZ, the rapid migration of the CTJ(�100 km/Myr) implies that the maximum possible age for
Fig. 8. (A) East–West topographic profiles (black curve) and predicted topographic (red curve) using a Newtonian Fluid rheology (see Section 5.3 for details). Map location
of topographic lines are also shown. (B) Convergence rate versus latitude estimated by fitting the topographic profiles. (For interpretation of the references to color in this
figure legend, the reader is referred to the web version of this article.)
A. Maksymowicz et al. / Earth and Planetary Science Letters 345–348 (2012) 27–37 35

Fig. 9. Kinematics of the Chile Ridge subduction during the last �13 Ma. Black numbers correspond to the ages of the intersections between the approximeted backstop
(red segmented curve) and Chile Ridge tracks (blue curves). Chile Ridge segments are as follows: segment between Esmeralda FZ and Madre de Dios FZ (E-MD), segment
between Tres Montes FZ and Esmeralda FZ (TM-E), segment between Taitao FZ and Tres Montes FZ (T-TM), and the segment between Darwin FZ and Taitao FZ (D-T).
(A) Kinematics of the Chile Ridge between 13 Ma and 5.9 Ma. (B) Kinematics of the Chile Ridge between 5.9 Ma and 4.5 Ma. (C) Kinematics of the Chile Ridge during the last
2.2 Ma. (For interpretation of the references to color in this figure legend, the reader is referred to the web version of this article.)
A. Maksymowicz et al. / Earth and Planetary Science Letters 345–348 (2012) 27–3736
accretionary prism decreases slightly to the north due to theobliqueness of the spreading center configuration (Fig. 9A).
(2)
From 9.3 Ma to 5.9 Ma, the CTJ corresponded to the subduc-tion of the Esmeralda transform fault. In that configuration,the accretionary prism was small north of the CTJ due to ahigh convergence rate. In contrast, south of the CTJ, the slowconvergence rate favored the growth of the accretionaryprism. The kinematics likely explains the strike rotation ofthe deformation front observed at �49–49.51S (Fig. 9). Notethat in these latitudes, the CTJ migrated slowly to the south ina small segment of the margin.(3)
Geophysical data reveal that the outcropping basement fea-tures associated to the Mocha FZ (�1000 km north of the CTJ)are mostly buried by thick turbidities (Voelker et al., 2006)and the erosional effects of this oceanic feature is thereforerelatively little as is observed in high resolution seismicreflection data (Contreras-Reyes et al., 2010). Thus, we expecta similar process during the Esmeralda FZ subduction 9.3–5.9 Ma. Although, the Esmaralda transform fault that sub-ducted 9.3–5.9 Ma was an active structure with a morphologysimilar to the Mocha FZ. In addition, the plate age at bothsides of the Esmeralda transform fault, when subducted, weresimilar to the Nazca plate ages observed north and south ofthe Guamblin FZ (see Fig. 9A). This oceanic feature presents athick trench fill (41 km, Scherwath et al., 2009), which likelyprevents the erosive effect of the oceanic feature subduction.Thus, we propose that the triple junction was not an erosiveregion during most of the time of Esmeralda transform faultsubduction. This analysis is valid only for the long term effectsof transform faults subduction considering a regional scale.Locally, the subduction of a transform fault could generatecomplex deformation in the continental wedge and theinjection of fluids to the overriding plate.(4)
Between 5.9 Ma and 4.5 Ma, the Tres Montes–Esmeraldasegment of Chile Ridge subducted (Fig. 9B), and thereforethe CTJ was a local erosive region which migrates progres-sively to the north. These processes in addition to theconvergence rate differences between north and south ofthe CTJ, and the roughly N–S strike of the backstop, explainsthe counterclockwise rotation of the deformation frontobserved at �471S (Fig. 9).The influence of the subducting Chile Ridge on the dynamic ofthe LOFZ has been suggested by some authors (Forsythe andNelson, 1985; Murdie et al., 1993; Cembrano et al., 2002).Between �5.4 and 4.5 Ma, the subducting Chile Ridge affectsthe northern continental block limited by the LOFZ (Fig. 9B),which may lead to a late period of opening of the Golfo dePenas Basin. Consistently, the shallow uncompacted sedi-ments unit in Golfo de Penas Basin (Fig. 6B), also reportedas late tertiary sediments by Gonzalez (1989) corresponds tothis late opening period.
(5)
From 4.5 Ma to the present, two long periods of non-erosionfollowed by two short periods of local erosion in the CTJregion can be observed north of Tres Montes FZ (Fig. 9C). Thesequence is as follows: (a) the subduction of Tres MontesTransform Fault (non-erosive period, from 4.5 to 2.2 Ma),(b) subduction of Taitao–Tres Montes Ridge segment (erosiveperiod, from 2.2 to 2.0 Ma), (c) subduction of Taitao Trans-form Fault (non-erosive period, 2–�0.13 Ma), and (d) thepresent erosive subduction of Darwin–Taitao Ridge segment.In other words, in the last �4.5 Ma the local high coupling atthe subduction interface due to the subduction of the ChileRidge affected the forearc tectonics in two short periods(o0.5 Myr).6. Conclusions
The accretionary prism offshore Golfo de Penas shows twoseismic units of different compaction, and it is separated by avelocity discontinuity. This Vp discontinuity (DF2) between fron-tal and middle prisms correlates with the position of a largeaccretionary ridge complex located in the continental slope. Thisaccretionary ridge complex is interpreted as evidence of a short-term episode of subduction erosion probably related to a period ofdecreased sediment supply.
Another velocity discontinuity detected near the shelf break isinterpreted as the accretionary prism–continental basement

A. Maksymowicz et al. / Earth and Planetary Science Letters 345–348 (2012) 27–37 37
contact. Additionally, the backstop spatially correlates with a lowgravity anomaly that strikes north–south from 501S to the currentposition of the CTJ.
The large scale shape of the continental slope in the north andsouth of the CTJ was modeled using a static flux model consider-ing an uniform rheology and current convergence rate values. Thebest model suggests the idea that GPAP has been formed after thesubduction of the Chile Ridge, and therefore the GPAP agedecreases northward according to the kinematics of Chile Ridgesubduction.
The strike rotations of the deformation front observed at �49–49.51S and �471S can be explained as the result of the EsmeraldaTransform Fault subduction between �9.3 and �5.9 Ma, and thenorthward migration of the CTJ between �5.9 and �4.5 Ma.
Based on our seismic constraints, numeric modeling of thecontinental slope shape, and kinematic plate model, we estimatea maximum age for the GPAP of about 5 Ma.
In the Golfo de Penas forearc Basin, the velocity–depth modelshows a lower compacted sedimentary unit underlying an upperlayer of poorly compacted sediments. The upper unit formationcould be related to a recent period of opening of the Golfo de PenasBasin controlled by the dynamics of the LOFZ in response to amayor coupling due to subduction of Tres Montes–Esmeraldaspreading center between 5.4 and 4.5 Ma.
Acknowledgments
Andrei Maksymowicz gratefully acknowledges a scholarshipgranted by the Chilean National Science Cooperation (CONICYT).Eduardo Contreras-Reyes acknowledges the support of the Chi-lean National Science Foundation (FONDECYT) Project 11090009.Seismic refraction and wide-angle data used in the study wereacquired during the cruise SO181 of the German R/V SONNE.Sea-going effort were sponsored by the German government(BMBF Grant 03G0181A). We acknowledge the Lamont DohortyEarth Observatory for sharing the seismic multichannel datacollected in 1988 during the cruise RC 2901 of the RV Conrad.We also thank Harm Van Avendonk, an anonymous reviewer, andthe Editor Peter Shearer for constructive comments.
Appendix A. Supporting information
Supplementary data associated with this article can be found inthe online version at http://dx.doi.org/10.1016/j.epsl.2012.06.023.
References
Angermann, D., Klotz, J., Reigber, C., 1999. Space-geodetic estimation of the Nazca–South America Euler vector. Earth Planet. Sci. Lett. 171 (3), 329–334.
Bangs, N.L., Cande, S.C., 1997. Episodic development of a convergent margininferred from structures and processes along the Southern Chile margin.Tectonics 16, 489–503.
Behrmann, J.H., Kopf, A., 2001. Balance of tectonically accreted and subductedsediment at the Chile Triple Junction. Int. J. Earth Sci. 90, 753–768.
Bourgois, J., Guivel, C., Lagabrielle, Y., Calmus, T., Boulague, J., Daux, V., 2000.Glacial–interglacial trench supply variation, spreading-ridge subduction, andfeedback controls on the Andean margin development at the Chile triplejunction area (45–481S). J. Geophys. Res. 105 (B4), 8355–8386.
Bourgois, J., Martin, H., Lagabrielle, Y., Le., Moigne J., Jara, Frutos, 1996. Subductionerosion related to spreading-ridge subduction: Taitao Peninsula (Chile margintriple junction area). Geology 24, 723–726.
Cande, S.C., Leslie, R.B., Parra, J.C., Hobart, M., 1987. Interaction between the Chileridge and Chile trench: geophysical and geotermal evidence. J. Geophys. Res.92 (B1), 495–520.
Cande, S.C., Leslie, R.B., 1986. Late Cenozoic tectonics of the southern Chile Trench.J. Geophys. Res. 91, 471–496.
Cembrano, J., Lavenu, A., Reynolds, P., Arancibia, G., Lopez, G., Sanhueza, A., 2002.Late Cenozoic ductile deformation north of the Nazca–South America–Antarctica triple junction. Tectonophysics 354, 289–314.
Contreras-Reyes, E., Flueh, E.R., Grevemeyer, I., 2010. Tectonic control on sedimentaccretion and subduction off south central Chile: implications for coseismicrupture processes of the 1960 and 2010 megathrust earthquakes. Tectonics 29,TC6018, http://dx.doi.org/10.1029/2010TC002734.
Emerman, S.H., Turcotte, D.L., 1983. A fluid model for the shape of accretionarywedges. Earth Planet. Sci. Lett. 63, 379–384.
Flueh, E.R., Grevemeyer, I. (Eds.), 2005. TIPTEQ SONNE Cruise SO-181, From theIncoming Plate to Mega Thrust EarthQuakes. Geomar Rep. 102. Geomar, Kiel,Germany.
Forsythe, R., Nelson, E., 1985. Geological manifestations of ridge collision:evidence from the Golfo de Penas-Taitao Basin, southern Chile. Tectonics 4,477495.
Gonzalez, E., 1989. Hydrocarbon resources in the coastal zone of Chile. In:Ericksen, G., et al. (Eds.), Geology of the Andes and its Relation to Hydrocarbonand Mineral Resources. Circum-Pacific Council for Energy and MineralResources, Houston, Texas, pp. 383–404.
Guivel, C., Lagabrielle, Y., Bourgois, J., Martin, H., Arnaud, N., Fourcade, S., Cotten, J.,Maury, R.C., 2003. Very shallow melting of oceanic crust during spreadingridge subduction: origin of near-trench quaternary volcanism at the ChileTriple Junction. J. Geophys. Res. 108, 2345.
Herron, E.M., Cande, S.C., Hall, B.R., 1981. An active spreading center collides witha subduction zone, a geophysical survey of the Chile margin triple junction.Geol. Soc. Am. Mem. 154, 683–701.
Kaeding, M., Forsythe, R.D., Nelson, E.P., 1990. Geochemistry of the Taitao ophioliteand near-trench intrusions from the Chile Margin Triple Junction. J. South Am.Earth Sci. 3, 161177.
Korenaga, J., Holbrook, W.S., Kent, G.M., Kelemen, P.B., Detrick, R.S., Larsen, H.-C.,Hopper, J.R., Dahl-Jensen, T., 2000. Crustal structure of the southeast Green-land margin from joint refraction and reflection seismic tomography. J.Geophys. Res. 105, 21591–21614.
Lagabrielle, Y., Guivel, C., Maury, R., Cotton, J., Bourgois, J., Fourcade, S., Martin, H.,2000. Magmatic tectonic effects of high thermal regime at the site of activeridge subduction: the Chile Triple Junction model. Tectonophyiscs 326,255–268.
Mapa Geologico de Chile, 2003. Mapa Geologico de Chile: version digital, Publica-cion Geologica Digital no. 4 (CD-ROM, version 1.0, 2003). Servicio Nacional deGeologıa y Minerıa, Santiago.
Murdie, R.E., Prior, D.J., Styles, P., Flint, S.S., Pearce, R.G., Agar, S.M., 1993. Seismicresponses to ridge-transform subduction: Chile triple junction. Geology 21,10951098.
Pardo-Casas, F., Molnar, P., 1987. Relative motion for the Nazca (Farallon) andSouth America plates since late Cretaceous time. Tectonics 6, 233–248.
Petit, J.R., Jouzel, J., Raynaud, D., Barkov, N.I., Barnola, J.M., Basile, I., Bender, M.,Chappellaz, J., Davis, M., Delaygue, G., Delmotte, M., Kotlyakov, V.M., Legrand,M., Lipenkov, V.Y., Lorius, C., Pe�pin, L., Ritz, C., Saltzmank, E., Stievenard, M.,1999. Climate and atmospheric history of the past 420,000 years from theVostok ice core, Antarctica. Nature 399 (6735), 429–436, http://dx.doi.org/10.1038/20859.
Ranero, C.R., von Huene, R., Weinrebe, W., Reichert, C., 2006. Tectonic processesalong the Chile convergent margin. In: Onken, O., et al. (Eds.), The Andes:Active Subduction Orogeny. Springer-Verlag, Berlin, pp. 91–122.
Russo, R.M., VanDecar, J.C., Comte, D., Mocanu, V.I., Gallego, A., Murdie, R.E., 2010.Subduction of the Chile Ridge: upper mantle structure and flow. GSA Today 20(9)http://dx.doi.org/10.1130/GSATG61A.1.
Scherwath, M., Contreras-Reyes, E., Flueh, E.R., Grevemeyer, I., Krabbenhoeft, A.,Papenberg, C., Petersen, C.J., Weinrebe, R.W., 2009. Deep lithospheric struc-tures along the southern central Chile margin from wide-angle P-wavemodelling. Geophys. J. Int. 179 (1), 579–600.
Simpson, G.D.H., 2010. Formation of accretionary prisms influenced by sedimentsubduction and supplied by sediments from adjacent continents. Geology 38(2), 131–134.
Tebbens, S.F., Cande, S.C., 1997. Southeast Pacific tectonic evolution from earlyOligocene to present. J. Geophys. Res. 102, 12061–12084.
Thorkelson, D.J., 1996. Subduction of diverging plates and the principles of slabwindow formation. Tectonophysics 255, 47–63.
Thornburg, T.M., Kulm, L.D., 1987. Sedimentation in the Chile Trench: depositionalmorphologies, lithofacies, and stratigraphy. Geol. Soc. Am. Bull. 98, 33–52.
Voelker, D.M., Wiedicke, S., Ladage, C., Gaedicke, C., Reichert, C., Rauch, K.,Kramer, W., Heubeck, C., 2006. Latitudinal variation in sedimentary processesin the Peru-Chile Trench off Central Chile. In: Oncken, O (Ed.), TheAndes—Active Subduction Orogeny, Frontiers in Earth Sciences. SpringerPress, Berlin, Heidelberg, pp. 193–216.
Zachos, J., Pagani, M., Sloan, L., Thomas, E., Billups, K., 2001. Trends, rhythms, andaberrations in global climate 65 Ma to present. Science 292 (5517), 686–693http://dx.doi.org/10.1126/science.1059412.