Central Andean Ore Deposits Linked to Evolving Shallow Subduction Systems and Thickening Crust

Geophys. J . Int. (1994) 117, 625-639
Velocity structure in northern Chile: evidence of subducted oceanic crust in the Nazca Plate
Diana Comte,1.2 Steven W. R ~ e c k e r , ~ and Gerard0 SuArez' 'lnstituto de Geofisicu. Uniuersidud Nucionul Aut6noma de Mkxico, M h i c o D . F. 'Depto. de Geofisica, Uniuersidad de Chile, Cusillu 2777, Santiago, Chile 3Depurtmerll of Eurth und Enuironmentul Sciences, Rensseluer Polytechnic Institute. Troy. N Y 12180. USA
Accepted 1'9'93 Novcmhcr 10. Rcccived 1993 Novcmhcr I ; i n original form 1993 May 26
S U M M A R Y 2-D P -wave velocity models were determined for the subduction zones near Iquique and Antofagasta in northern Chile, simultaneously inverting P - and S-wave arrival times from locally recorded earthquakes for velocity structure and hypocentral locations. A 2-D parametrization was used because of the paucity of data, but is justified by the lack of significant variations along the strike of the subduction zone observed from both refraction profiles and simple 3-D inversions. T h e crust and upper mantle a re parameterized by constant velocity regions of irregular shape, with the size and boundaries of these regions governed by prior information about the structure and by the ability of the data to resolve P-wave velocities. Beneath the Antofagasta region there is evidencc of an approximately 10 km thick layer of oceanic crust attached to the top of the subducting Nazca plate. This crust has a P-wave velocity of 7.3 f 0.1 km s - ' and is observed down to a depth of 60 f 10 km. This depth also corresponds to the maximum depth of seismogenic coupling in the Chilean subduction zone. The subducted oceanic crust overlies an oceanic upper mantle with a P-wave velocity of 8.0 f 0.1 km s- ' . Apparently, oceanic crust is being subducted beneath Iquique as well. However, this feature is less constrained by the data available from this region.
Key words: Nazca Plate, oceanic crust.
1 INTRODUCTION
Northern Chile is located in one of the more active seismic zones of the circuni-Pacific belt. Here, the Nazca plate subducts beneath the South American plate with a relative convergence rate of about 8.4 cm yrp i (DeMets, Argus & Stein 1990). The associated high rate of background seismicity is well documented, but the historical seismicity in northern Chile is not clearly established due to the lack of reliable documents before the nineteenth century. Nevertheless, we know that a great earthquake, for which a complete description of damage exists, occurred here on 1877 May 10. The magnitude estimated for this event is Mw=8.7 (Lomnitz 1971; Abe 1979; Kausel 1986; Comte & Pardo 1991). The estimated rupture length is about 450 km. and ranges from the south of Africa to the north of Antofagasta (Fig. 1). The absence of earthquakes of comparable size since 1877 suggests that northern Chile is an important seismic gap.
To better understand the tectonic framework of this gap, two microearthquake investigations were carried out in
northern Chile, P -wave velocity structure, subducted
northern Chile using portable analogue and digital seismological instruments. One of these investigations was conducted in 1988 near Antofagasta at the southern end of the estimated rupture zone of the 1877 earthquake. The second took place in 1991 near Iquique in the central part of the 1877 rupture. The principal objective of those investigations was to constrain better the shape and structure of the Wadati-Benioff zone in northern Chile (Comte et al. 1993a.b). The earthquakes recorded during these investigations are used in this study to determine the 2-D P-wave velocity structure along the downgoing Nazca plate and the western margin of the continental South American plate.
2 D A T A ACQUISITION A N D PROCESSING
The set of arrival times used in this analysis was recorded by two microearthquake investigations performed in northern Chile: Iquique (near 20"s) during July and August of 1991, and Antofagasta (near 24"s) during September and October
625

626 D. Comte, S . W. Roecker and G. Suarez
-1 8"
-20"
-22"
-24"
-26" -72" -70" -68" -66"
Figure 1. The rectangular white areas show the location of the inverted volumes in lquique and Antofagasta. The microearthquakes recorded and seismic stations deployed in both areas are indicated by circles and by squares respectively. Solid triangles represent the Quaternary volcanoes. The open arrow shows the convergence direction of the Nazca plate relative to the South America plate (DeMets et al. 1990). The area of intensity VIII MM of the 1877 great earthquake is shown as a dashed line. Bathymetry and topography contours are in metres.
of 1988. These data sets sample non-overlapping volumes o f the subsurface and, therefore, each was analysed separately.
S-wave arrival times were obtained using the horizontal components o f the digital instruments.
From the -350 local earthquakes recorded by this array,
2.1 The Iquique investigation
The temporary seismological network in the Iquique region consisted of 1 I portable analogue and nine digital stations installed within a 150 km radius of the city of lquique (Fig. 1, Table 1). Reported arrival times are of variable quality and were weighted accordingly. For the analogue records, the accuracies of the P and S readings are about 0.1 s and 0.5 s respectively, whereas for the digital stations they are about 0.01 s and 0.2 s respectively. The highest precision
a subset of the best constrained locations was selected to be used in the velocity inversions. We used only those events recorded with more than a total of eight arrival times and with a minimum of three S waves for the first cut. The hypocentres o f this preliminary data set were initially located in a 1-D structure inferred from the seismic refraction studies conducted by Wigger et al. (1993) near Iquique (Table 2). S-wave velocities for this model were derived from Wadati diagrams that show an average V,,/V, ratio of 1.76 f 0.01 for events between 0 and 200 km in
Velocity structure in northern Chile 627
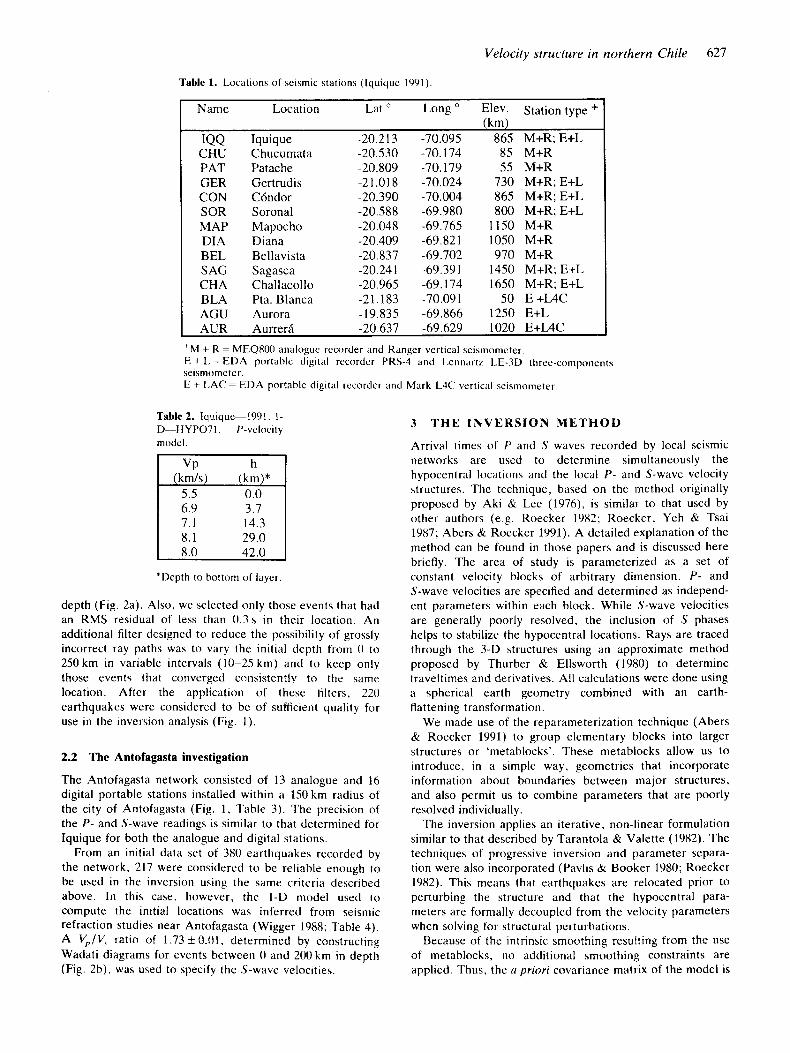
Table 1. Locations o f seismic stations (Iquique 1991).
I Name Location Lat O Long O Elev. Station type +
-20.21 3 -70.095 865 M+R;E+L C H U Chucumata -20.530 -70.174 85 M+R I IQQ Iquique P A T GER CON S O R M A P DIA BEL SAG C H A BLA AGU AUR
Patache Gertrudis C6ndor Soronal Mapocho Diana Bellavista Sagasca Challacollo Pta. Blanca Aurora Aurrer i
-20.809 -21.018 -20.390 -20.588 -20.048 -20.409 -20.837 -20.24 1 -20.965 -21.183 -19.835 -20.637
-70.179 -70.024 -70.004 -69.980 -69.765 -69.821 -69.702 -69.391 -69.174 -70.09 1 -69.866 -69.629
55 M+R 730 M+R;E+L 865 M+R;E+L 800 M+R;E+L
1150 M+R 1050 M+R 970 M+R
1450 M+R; E+L 1650 M+R; E+L
50 E + L 4 C 1250 E+L 1020 E+UC
’ M + R = M E 0 8 0 0 analogue recorder and Ranger vertical seismometer. E + 1. = EIIA portahlc digital rccordcr PRS-4 and Lxnnartz ILE-3D three-components seismometer. E + LAC = E D A portable digital recorder and Mark L4C vertical seismometer.
Table 2. Iquique-19Y 1 . 1- D-HY PO71 P-vclocity modcl.
km/s
14.3 29.0
8.0 42.0
*Depth to bottom of layer
depth (Fig. 2a). Also, we selected only those events that had an RMS residual of less than 0.3s in their location. An additional filter designed to reduce the possibility of grossly incorrect ray paths was to vary the initial depth from 0 to 250 km in variable intervals (10-25 km) and to keep only those events that converged consistently to the same location. After the application of these filters, 220 earthquakes were considered to be of sufficient quality for use in the inversion analysis (Fig. 1).
2.2 The Antofagasta investigation
The Antofagasta network consisted of 13 analogue and 16 digital portable stations installed within a 150 km radius of the city of Antofagasta (Fig. 1, Table 3). The precision of the P - and S-wave readings is similar to that determined for Iquique for both the analogue and digital stations.
From an initial data set of 380 earthquakes recorded by the network, 217 were considered to be reliable enough to be used in the inversion using the same criteria described above. In this case. however, the I-D model used to compute the initial locations was inferred from seismic refraction studies near Antofagasta (Wigger 1988; Table 4). A V,/V, ratio of 1.73 * 0.01. determined by constructing Wadati diagrams for events between 0 and 200 km in depth (Fig. 2b). was used to specify the S-wave velocities.
3 T H E INVERSION METHOD
Arrival times of I’ and S waves recorded by local seismic networks are used to determine simultaneously the hypocentral locations and the local P - and S-wave velocity structures. The technique, based on the method originally proposed by Aki & Lee (1976), is similar to that used by other authors (e.g. Roecker 1982; Roecker, Yeh & Tsai 1987; Abers & Roecker 1091). A detailed explanation of the method can be found in those papers and is discussed here briefly. The area of study is parameterized as a set of constant velocity blocks of arbitrary dimension. P - and S-wave velocities are specified and determined as independ- ent parameters within each block. While S-wave velocities are generally poorly resolved, the inclusion of S phases helps to stabilize the hypocentral locations. Rays are traced through the 3-D structures using an approximate method proposed by Thurber & Ellsworth (1980) to determine traveltimes and derivatives. All calculations were done using a spherical earth geometry combined with an earth- flattening transformation.
We made use of the reparameterization technique (Abers & Roecker 1991) to group elementary blocks into larger structures or ‘metablocks’. These metablocks allow us to introduce, in a simple way, geometries that incorporate information about boundaries between major structures, and also permit us to combine parameters that are poorly resolved individually.
The inversion applies an iterative, non-linear formulation similar to that described by Tarantola & Valette (1982). The techniques of progressive inversion and parameter separa- tion were also incorporated (Pavlis & Booker 1980; Roecker 1982). This means that earthquakes are relocated prior to perturbing the structure and that the hypocentral para- meters are formally decoupled from the velocity parameters when solving for structural perturbations.
Because of the intrinsic smoothing resulting from the use of metablocks, no additional smoothing constraints are applied. Thus, the u priori covariance matrix of the model is

628 D. Comte, S. W . Roecker and G. Sucirez
!(a) IQUIQUE
Vp/Vs = 1.76 0.01 30
0 I-
v, I-
t
60 j I
(b) ANTOFAGASTA
vp/vs = 1.73 f 0.01 i
Figure 2. Wadati diagrams for (a) the Iquique investigation and (b) the Antofagasta investigation.
diagonal. Generally, the size of this diagonal element had to be rather large, typically an order of magnitude greater than what might be presumed from simple considerations of a priori uncertainties, in order to stabilize the iterative procedure.
Station corrections were not included because all the stations were installed on hard rock. Therefore. the near-surface structure is not expected to produce a significant delay. Mean sea level is taken as the origin. and compensation for elevation differences o f the various stations are explicitly computed for each ray. The inversion was iterated until changes in velocities became small (<0.05 km s I ) and the variance reduction became insig- nificant (<2 per cent). In general, two or three iterations were sufficient to fit these criteria.
4 P R E V I O U S SEISMIC REFRACTION STUDIES
The initial velocity models were derived from seismic refraction profiles carried ou t in northern Chile from 1982 to 1989 by the Mobility of Active Continental Margins research group established by the University of Berlin in cooperation with local institutions from Argentina, Bolivia and Chile. The recording lines and shot points of these crustal seismic studies cover an area from the Coastal Cordillera to the Western Andean Cordillera. and range in latitude from 20"s to 26"s. We used a profile near 24"s of the Global Geoscience Transect 6 (Wigger et al. 1991) as the initial model for the analysis of the Antofagasta data, and a profile near 21"s (Wigger et al. 1993) for the analysis of the Iquique data.
Both profiles show strong E-W variations in crustal structure. There is a rapid increase in crustal thickness: it varies from about 40 km under the Coastal Cordillera to a maximum of 65-70 km about 200 km inland from t h e coast. The structure of the upper crust changes dramatically in velocity and thickness in the area of the Pre-Cordillera; the western part has average velocities of 6.4-6.6 km s I ,
whereas the eastern part has a velocity of only 6.0 km s-I. Strata with velocities less than 6.4 km s-' are thin in the west and thicken progressively towards the east, reaching 30-40 km under the active volcanic arc. The upper crust has a velocity of 6.7 km s~-' under the Coastal Cordillera and Central Valley, 6.3 km s-' in the Pre-Cordillera, and an average of about 5.9 km s - ' under the Andean Cordillera. These variations in the average velocities of the crust from east to west led Wigger et al. (1991) to infer that the forearc is colder and more rigid than the lower crust beneath the magmatic arc.
In both profiles (21"s and 24"S), a low-velocity zone is present in the uppermost mantle beneath the continent. Wigger et al. (1991) proposed several alternative explana- tions for the presence of this low-velocity zone, including the presence of magmatic restite, underthrust continental crust, subducted oceanic crust of the Nazca plate, serpentinized mantle material, or a combination of these.
In contrast to the significant variations in structure seen along the E-W profiles, a N-S profile along the Coastal Cordillera from Iquique to the south of Antofagasta (Wigger et al. 1993) revealed no significant N-S variations in the velocity structure of the continental crust and upper mantle. Combining this inference with observations of a similar N-S uniformity in surficial geology and offshore bathymetry in this region, we surmise that the crust and upper mantle in this region is approximately 2-D.
5 RESULTS O F T H E VELOCITY INVERSIONS
5.1 Selection of the initial model
The distribution of ray paths for both the Iquique and Antofagasta investigations is insufficient to constrain a detailed 3-D velocity structure. However, as discussed above, prior information from refraction studies and surficial features suggests that a 2-D representation is locally sufficient. Initial trials with simple 3-D structures also failed

Velocity structure in northern Chile 629
Table 3. Location of seismic stations (Antofagasta 1988)
Name Location . Lat O Long O Elev. Station type+ (km)
CAL HOS DVM CLB MIR CHO FAR CUE COL TOS YUG YNG ROS SRA TAM ESM MBL MOR MAG SGR LVI MIC ANG VAL MAR SCR LMO AVI
Calama Hornitos D. Mejilones Culebron Miranda Chacabuco Farol Cuevitas Coloso Tosca Yugoslavia Yungay Rosario Sierra Gorda Tamira Esmeralda Man. Blancos Moreno Magnesia San Gregorio Los Vientos Michilla Angamos Valenzuela Morrito San Cristobal Los Morros Aue. Victoria
-22.480 -22.958 -23.25 1 -23.340 -23.357 -23.056 -23.498 -23.628 -23.777 -23.914 -24.02 1 -24.089 -24.457 -22.866 -22.645 -22.934 -23.455 -23.5 10 -24.095 -24.21 8 -24.483 -22.826 -23.101 -23.166 -23.261 -23.446 -23.566 -24.1 12
-69.025 -70.278 -70.344 -69.768 -70.177 -69.593 -70.299 -69.939 -70.439 -70.259 -69.863 -70.086 -69.892 -69.347 -70.243 -69.867 -70.027 -70.550 -69.597 -69.825 -70.3 15 -70.233 -70.512 -69.997 -69.5 19 -69.587 -70.276 -69.256
2030 M+L4C 270 M+L4C 360 M+L4C
1320 M+L4C 1225 M+L4C 1570 M+L4C 950 M+L4C 960 M+L4C 150 M+L4C 720 M+L4C
1250 M+L4C 1070 M+L4C 1470 M+L4C 1800 G+L22 270 G+L22
1510 G+L22 840 G+L22 220 G+L22 400 G+L22 130 GiL22 930 DT+L4C 527 DT+L4C 710 DT+L4C 400 DT+L4C 720 DT+L4C 820 DT+L4C 000 DT+L22
2250 DT+L4C CRI Cro': Sta. Rita -24.167 -70.371 1620 DT+L4C
' M + L4C = MEQ800 analogue recorder and Mark L4C vertical seismometer G + L22 = GEOSTRAS digital recorder and Mark L22 three-component seismometer D T + L4C = Digital telemetric recorder and Mark L4C vertical seismometer. D T + L22 = Digital telcmetric recorder and Mark L22 three-component scismomctcr.
Table 4. Antofagasta-
velocity model. 1988. I-D-HYP071. P-
*Depth t o bottom of layer
to reveal significant N-S variations in structure along the strike of the subduction zone. Nevertheless, the dip angle of the Wadati-Benioff zones is slightly steeper beneath Iquique than it is beneath Antofagasta, and there is a lack of overlap between both investigations. Therefore, we determined two independent models, one for each investigation. The block boundaries are oriented in a direction parallel to the convergence of the Nazca plate relative to South America (N77"E; DeMets et ul. 1990). The
size and position of the metablocks was governed both by what are likely to be major structural elements in this area (e.g. thick continental crust, subducting oceanic lithosphere) and by the ability of the data to resolve the structures.
The initial velocities and boundaries of the metablocks making up the continental crust were inferred from the results of the refraction profiles. Thin alternating high- and low-velocity layers were represented by an equivalent layer averaging the velocities of the included strata. Due to the absence of crustal seismic activity in the forearc, the shallow structure of the continental crust cannot be constrained by these data sets. For this reason, we used the velocity structures determined by the refraction investigations for the upper crust and held them fixed during the inversions.
The boundaries of the metablocks corresponding to the oceanic lithosphere were inferred from the patterns of seismicity in the Wadati-Benioff zones. The lower boundary of the upper oceanic lithosphere is unconstrained. However, because the ray paths do not travel deeply into the d a b , this is not an important consideration.
A series of inversions with different vertical and horizontal boundaries of the metablocks were run to test the sensitivity of the results relative to the choice of boundaries. In general, the velocities in the major units change by less

630 D. Come, S. W. Roecker and G. Sucirez
than f0.05 km s- ' if these boundaries are shifted by about f5 km. Larger shifts in the location of the boundaries result in averaging of the velocity between blocks (e.g. higher velocities in the crust or lower velocities in the mantle). The fit t o the data does not change significantly as most of these boundaries a re moved, and thus our estimates of where these boundaries are likely to be can provide significant constraints.
A series of inversions with initial velocities in individual units varying by as much as f l km s-' were performed to investigate the sensitivity of the inversion results to the initial velocity model used. In each case, after about four iterations the results from the different models converged to similar velocity distributions, well within the expected uncertainties, demonstrating an acceptable insensitivity of the inversion results t o the starting values.
S-wave velocities were also determined and they tend to mimic the P-wave structures, but in general their values are poorly constrained by this data set.
5.2 The Iquique inversion
The initial velocity model near Iquique and the distribution of earthquakes located with a I-D model (Table 2) using HYP071PC (Lee & Valdes 1985) near Iquique are shown in Fig. 3(a) (model 10, Table 5 ) . For purposes of discussion, the metablocks corresponding to the continental lithosphere are labelled with the prefix CI, those to the upper mantle beneath the continental lithosphere with CM, and those to the upper and lower lithosphere with 0 1 and OMI, respectively. Velocities in the three shallowest blocks (CI1, C12 and C13) were fixed. Of the other six metablocks, only four (CI4, CI6, 0 1 and CMI) had associated resolution diagonals ( R , exceeding 0.5 (Table 5 ) , meaning that more information was derived from the data than from the a priori constraints for these perturbations. The best resolved metablock is the one associated with the subducted slab (01), which has a velocity of 8.1 * 0.2 km s - I and an R, of 0.8. This velocity is typical of that observed in the upper mantle of the slab (e.g. Spudich & Orcutt 1980). The other four metablocks (CI4, CI6, 01 and CMI) had a lower R, value of 0.6 and estimated uncertainties of f0.2-0.3 km s P 1 .
Considering that the best resolved metablock was the one associated with the subducted oceanic lithosphere (01), we subdivided it to see if finer structure could be determined (Table 5 , model 11). The subducted slab was thus separated into two metablocks, one representing the upper part of the oceanic crust (011) from a depth of 10 to 150 km, and another (012) associated with the lower part of the oceanic crust. Although we allowed the velocity to vary in this new crustal layer, the velocity obtained in model 10, of 8.1 f 0.1 km s-l with an R , of 0.7, was again obtained.
Another inversion (Fig. 3b, Table 5 , model I2), where the upper part of the oceanic crust was divided into two metablocks (011 and OI2), resulted in a lower velocity of 7.7 f 0 . 2 km S - I and an R,, of 0.7 for the 011 block. The associated oceanic upper mantle velocity of 8.3 f 0.3 km s I
(R, of 0.7) also appears to be less well constrained. Nevertheless, this model provided a significantly better fit to the arrival times (a 7 per cent improvement in data variance compared t o the model without an oceanic crust). We conclude that the Iquique data set is capable of resolving a
low-velocity region at the top of the subducted slab. The depth to which this feature extends is not well constrained, but it appears that subduction of low-velocity crust could reach a depth of about 60 km.
5.3 The Antofagasta inversion
The starting model used in the analysis of the Antofagasta data (Fig. 421, model A0 Table 6) is similar to that used in Iquique. Velocities in five shallow metablocks (CA1 to CAS) are fixed. The results of the inversion of the Antofagasta data with this starting model showed a low-velocity zone (CMA) in the continental upper mantle (Fig. 4b). In an attempt to determine the extent of this low-velocity zone, the metablock corresponding to the upper mantle was separated in model A 1 using two smaller metablocks (CMAl and CMA2; Fig. Sa, Model A1 in Table
The only poorly resolved metablock in the inversion using model A l is the one corresponding to the deeper part of the slab (OMA, Fig. 4a). The average P-wave velocity obtained for the slab (OA) is 7.6 f 0.1 km s- ' with an R, of 0.9. The three metablocks corresponding to the continental crust (CA6 to CA8) were better resolved than in the case of Iquique. The shallower continental block (CA6) converged to a velocity of 6.7 f 0.2 km s ~' with an R,, of 0.7. The other two metablocks beneath it (CA7 and CA8) have velocities of 7.0 f 0.1 km s-' and 7.8 f 0.2 km s-' with R,, values of 0.9 and 0.8, respectively. The vertical boundary between the two metablocks in the continental upper mantle (CMA1 and CMA2) was displaced (fS km) on a trial and error basis as a test of sensitivity to this boundary. In general, the position of this boundary is inconsequential, the only difference being small changes in the associated resolutions and uncertainties. A low-velocity (7.3 f 0.2 km s - I , R, of 0.8) region is observed in the western subblock of the upper mantle (CMAl) , whereas the eastern subblock (CMA2) has a significantly higher velocity of 8 . 2 k m s - I. However, the block CMA2 is poorly resolved (Rd of 0.5) and has large uncertainties ( f 0 . 4 km s- ' ) .
As in the case of Iquique, the metablock representing the upper part of the slab (OA) was the best resolved and, therefore, we subdivided this metablock into two independ- ent blocks ( O A l and OA2, model A2 on Table 6) in order to determine additional details of structure in the upper part of the subducted slab. In the first test, the resulting velocities (7.6 and 7 .7kms- ' for O A l and O A 2 blocks, respectively) are almost the same as those obtained in model A1 for the single metablock O A of the oceanic slab.
A series of inversions was attempted where the uppermost metablock of the subducted slab was divided into two parts, and the boundary between them was varied. The model with the largest reduction in data variance (31 per cent improvement from 0.083 s2 to 0.057 s2), the lowest associated uncertainties, and the best resolution (Model A3, Table 6, Fig. 5b) suggests that the shallower part of the slab ( O A l ) has a lower velocity (7.3 f 0.1 km s - ' ) than the deeper part of the plate (OA2). The lower subblock of the slab (OA3) has a P-wave velocity of 8.0 f 0.1 km s-l. Both are well resolved with an R , of 0.9, which is almost the same as that obtained for the deeper crustal metablock ,(OA2).
6).

Velocity structure in northern Chile 63 1
(a) IQUIQUE INITIAL P-WAVE VELOCITY MODEL I0
I l l Ill II I II I 20 60 100 140 180 220 260 300 I '
100 -
140 -
(b) IQUIQUE FINAL P-WAVE 2D VELOCITY MODEL 12
I l l Ill II I II I 20 60 100 140 180 220 260 300 I'
20
3 -60 s 8 a 100
140
5.0 7.2 8.7 Velocities in k i d s
Figure 3. Results from the inversion o f the lquiquc data set ('Iahle 3 ) . prcscntcd in a 2-D profile indicated o n Fig. I ( t - 1 ' ) . Ench metablock IS
identified in its left upper corner; the value that is located to the right or below it corresponds to the P-wave velocity (km s ' ) . White squares show the initial hypocentres of the events using 1-D velocity structure. The two first layers were fixed and not included in the inversion. The white metablocks are those that were poorly resolved ( R < ! < 0,s). The projection of the seismic stations and the volcanoes arc shown as vertical bars and triangles, respectively. The grey scale representing the velocity scale is shown on the lower part of the figure. (a) Initial P-wave velocity model (10). (b) Final P-wave velocity model (12).

632 D. Comte, S. W . Roecker and G. Suarez
Table 5. Results of the lquique inversions.
Model I0
MB VIP Resulting Vp
k d s k m / S
CI1 5.9 fixed
CI2 5.3 fixed
C13 6.6 fixed
CI4 6.8 7.29.2 (0.6)
CI5 5.9 Q<OS
C16 7.4 7.8M.2 (0.6)
CMI 8.7 8.4M.3 (0.6)
01 8.0 8 .13 .2 (0.8)
OM1 8.7 R@5
Model I1
MB VIP Resulting Vp
k m / S k d s
CI 1 5.9 fixed
CI2 5.3 fixed
C13 6.6 fixed
CI4 6.8 7.1M.2 (0.5)
CI5 5.9 Rd<0.5
CI6 7.4 7.7M.2 (0.7)
CMI 8.7 8.2M.3 (0.7)
01 1 8.0 8.1M.2 (0.8)
012 8.0 7.9M.2 (0.9)
OM1 8.7 Q<OS
MB = Identification of the rnetablocks for each model. VIP = Initial P-wave vclncitics for each rnodcl. Thc R,, value i s indicated in parenthesis, when i t is greatcr than 0.5
Thus it is possible to identify a smaller scale structure within the subducted slab in the form of a low-velocity layer attached to the top of the Nazca plate to a depth of about 60 km. We interpret this low-velocity layer to be evidence of subducted oceanic crust, corresponding in P-wave velocity to layer 3 of typical oceanic crust (e.g. Spudich & Orcutt 1980). We note also that the low-velocity structure of the crust beneath the Coastal Cordillera that Wigger et al. (1991) observed, may also be explained by the presence of subducted low-velocity oceanic crust.
We note that the initial low-velocity block (CMAI) for models A1 and A2 converged in model A3 (Fig. 5b) to the same value of P-wave velocity of the deeper continental crustal layer (CA8), suggesting that both (CA8 and CMAI) may be one single block of a thick continental crust.
As a test of the robustness of the 2-D models obtained for Iquique and Antofagasta, a set of synthetic P - and S-wave arrival times were generated using the final models and the same source-receiver pairs as in the original data sets. Random noise with a zero mean and a standard deviation of 0.2s was added to these synthetic arrival times. The resulting velocity models for Iquique and Antofagasta are very similar ( f O . 1 km s-I) to the models obtained using real data (Figs 6a and b), suggesting that the trends observed are not simply artefacts of the inversion procedure.
5.4 Earthquake locations
A s discussed above, the initial microearthquake locations obtained using a flat I-D velocity structure were reasonably well constrained. Nevertheless, the hypocentres are displaced slightly when they are relocated in the 2-D models (Figs 7 and 8). The changes between the 2-D and the I-D epicentral locations are less than 1 km inside each network,
Model I2
MB VIP Resulting Vp Synthetic Vp
k d s k m / S km/S
CIl 5.9 fixed fixed
CI2 5.3 fixed fixed
C13 6.6 fixed fixed
CI4 6.8 7.2M.2 (0.6) 7.2M.2 (0.8)
C15 5.9 R + O S Rdc0.5
CI6 7.4 7.539.2 (0.6) 7.5rto.2 (0.7)
CMI 8.7 8.3M.3 (0.7) 8.333.2 (0.9)
011 8.0 7 .7s .2 (0.8) 7.7M.2 (0.8)
012 8.0 8.3M.2 (0.8) 8.339.2 (0.8)
013 8.0 8.3M.2 (0.7) 8.3M.2 (0.9)
OM1 8.7 Q<0.5 Rd<0.5
and they are generally less than 3 km for events located outside the network. In the case of Iquique, the 2-D-1-D epicentral difference vectors show a slight overall shift towards the centre of the network, which is observed mainly for events located far away from it. The Antofagasta 2-D-1-D epicentral difference vectors show less variation than in the case of Iquique. The direction of motion, however, is towards the centre of the network, mainly for events located outside of it. The hypocentral depths show more variation and age generally shifted either downwards (for Antofagasta) or upwards (for Iquique) by 2-3 km in the 2-D model. The different trends in 2-D relocations between the Iquique and Antofagasta data sets is primarily due to the Iquique 2-D model being faster, and the Antofagasta 2-D model being slower, than their respective I-D models.
6 DISCUSSION A N D CONCLUSIONS
The inversion method utilized in this study has been successfully applied before in a variety of tectonic environments (e.g. Thurber 1983, 1984; Abers & Roecker 1991; Ni, Ibenbrahim & Roecker 1991; Prevot et al. 1991). In this case, the inversion is performed using a small number of events and stations where a full 3-D inversion with many independent blocks was not justified. Therefore, only large regions corresponding to major tectonic units were allowed to vary. Because the majority of the events recorded are located within the downdoing slab. the metablock associated with it was the best resolved in both the Iquique and Antofagasta investigations. Although the number of events utilized are almost the same in both studies, they are better distributed along the slab in the Antofagasta investigation. This, in addition to a larger number of seismic stations, results in better resolution of structure in the oceanic

Velocity structure in northern Chile 633
(a) ANTOFAGASTA INITIAL P-WAVE VELOCITY MODEL A0
i 180 220 260 300 A’
II I I 1 1 1 1 I1111 I 111 I II A 20 60 100 140
20
60 a iu a
100
140
(b) ANTOFAGASTA FINAL P-WAVE 2D VELOCITY MODEL A 0
I I II1111 I 1111 I 111 I I I 1 A 20 60 100 140 180 220 260 300 A’
100
140
5 .o 7.0 8.7 Velocities in k d s
Figure 4. Results f rom the inversion of the Antofagasta data set (Table 6). Symbols are as for Fig. 3. (a) Initial P-wave velocity model (AO) (b) Resulting P-wave velocity model (AO).

634 D . Comte, S . W . Roecker and G . Suarez
Table 6. Results of t he Antofagasta inversions.
Model A0 MB VIP Resulting Vp
k d s k d s
CAI , 6.0 fixed
CA2 5.8 fixed
CA3 5.1 fixed
CA4 6.3 fixed
CA5 6.1 fixed
CA6 6.5 6.7M.I (0.6)
CA7 7.1 7.IM.l (0.8)
CA8 7.6 7.8+02 (07)
3MA 8 7 7.2M.2(0.6)
OA 8.0 7.6M.I (0.9)
)MA 8.7 FGj<0.5
Symbols as o n Table 3.
Model A1
MB VIP Resulting Vp
km/s k d s
CAI 6.0 fixed
CA2 5.8 fixed
CA3 5.1 fixed
CA4 6.3 fixed
CAS 6.1 fixed
CA6 6.5 6.7M.2 (0.7)
CA7 7 1 7 . M . 1 (0.9)
CA8 7.6 7.8?0.2 (0.8)
ZMAI 8.7 7.3M.2 (0.8)
3MA2 8 7 8.2%.4(0.5)
OA 8.0 7.6M.l (0.9)
OMA 8.7 R,j<0.5
Model A2
lithosphere beneath Antofagasta. Therefore, we will focus our discussion in the results of the Antofagasta analysis.
The P-wave velocities determined for the upper mantle below the continent a re not as well resolved as in the other blocks. However, they consistently converged to values of about 8.4km s-.' in both regions (CMI, Iquique-model 2 and CMA2, Antofagasta-model 3 ) . This value is slightly higher than that expected for the upper mantle. It is not, however, an unreasonable average estimate of velocities between 60 and 150 km depth.
The distribution of seismicity recorded during the Antofagasta investigation allowed us to resolve structural details in the downgoing slab. As mentioned above, we interpret the low velocities in the upper part of the slab ( 0 1 1, Iquique-model2 and O A l , Antofagasta-model 3) as evidence of subducted oceanic crust beneath northern Chile. Test inversions varying the size of this layer suggest an average thickness of about 10 km. A thicker crust results in significantly larger misfits of the arrival times. The available data are incapable of determining whether the subducted oceanic crust is thinner than -10 km. At the stame time, it is unlikely that any discernible residual would have been generated if it is significantly thinner than -10 km. The maximum depth extent of the subducted oceanic crust appears to be -60 f 10 km; a depth corresponding approximately to the maximum depth of seismogenic coupling in the Chilean subduction zone (Tichelaar & Ruff 1991; Suirez & Comte 1993).
Tichelaar and Ruff (19Yl) proposed several mechanisms that may control the maximum depth of coupling. Among them: (i) a reduction of the frictional strength due to thermally activated creep, (ii) the rate of plate convergence and the age of the subducting oceanic lithosphere, (ii) the dip angle of the slab and its relation to volcanic activity, (iv) the thickness of the continental crust, (v) strength variations on the interface associated with sediments, (vi) phase
MB Vlp Resulting Vp
k d s k d s
CAI 6.0 fixed
CA2 5.8 fixed
CA3 5.1 fixed
CA4 6.3 fixed
CAS 6.1 fixed
CA6 6.5 6.7M.2(0.6)
CA7 7.1 7 . M . 1 (0.7)
CA8 7.6 7.9-Lo.2 (0.7)
CMAl 8.7 7.3M.2 (0.6)
:MA2 8.7 FGj<0.5
OAl 8.0 7.6M.1 (0.8)
OA2 8.0 7.7M.I (0.9)
OMA 8.7 RdcO.5
Model A3
MB VIP Resulting Vp Synthetic Vp
k d s k d s k d s
CAI 6.0 fixed fixed
CA2 5.8 fixed fixed
CA3 5.1 fixed fixed
CA4 6.3 fixed fixed
CA5 6.1 fixed fixed
CA6 6.5 6 6H.2 (0.7) 6 6M.2 (0.8)
CA7 7. I 7 IM. I (0.9) 7. IM. I (0.9)
CA8 7 6 7 5M.2 (0 8) 7.5M.2 (0.9)
:MA1 8.7 7.5M.2(0.8) 7.5M.1(0.9)
:MA2 8.7 8 5M.3 (0.6) 8.6kO.3 (0.7)
OAl 8 0 7.3M.I (0.9) 7.3M.1 (0.9)
OA2 8.0 8 . 0 . 2 ( 0 . 9 ) 8.1M.2 (0.9)
OA3 8.0 8.GM.1 (0.9) &.M.l (0.9)
OMA 8.7 R,j<0.5 R,j<0.5
changes from basalt to eclogite, and (vii) the presence of water at depth. They pointed out that it is difficult to identify which mechanisms, if any, dominate over the others in determining the maximum depth of coupling.
The results of the present study, when compared with studies of the Philippine plate (Hori et al. 1985; Hori 1990) and the Pacific plate (Hurukawa & Imoto 1992) suggest that the phase change from basalt to eclogite plays a prominent, if not the dominant, role in controlling the maximum depth of coupling. Beneath Antofagasta we are able to resolve a low-velocity layer on top of the subducting slab with a P-wave velocity typical of basaltic crust to depths of approximately 60 km, corresponding to the depth of coupling in this region. This result is similar to that obtained by Hori et al. (1985) and Hori (1990), who analysed the depth of the conversion of oceanic gabbro to eclogite in subducted crust along the Philippine plate. Their results suggest that the subducting oceanic crust remains in a gabbroic phase to depths of less than 60 km along the entire northern boundary of the Philippine plate. Moreover, Hurukawa & Imoto (1992) concluded from an analysis of focal mechanisms of earthquakes that gabbro does not transform into eclogite at depths of less than about 50 km in the Philippine plate and 70-80 km in the Pacific plate. Therefore, the estimated depth of about 60 km for which a low-velocity upper crust on the subducted Nazca plate is observed in the inversions of the Antofagasta data set may similarly be associated with the depth of the phase transformation in the oceanic crust from gabbro to eclogite. In turn, this phase transformation may play a role in defining the maximum depth extent of unstable sliding on the interplate contact.
The correlation between the depth of phase transition with the depth of the seismogenic coupling between plates with very different ages, rates of convergence, slab dip angles, thickness of overlying continental crust, and

Velocity structure in northern Chile 635
(a) ANTOFAGASTA FINAL P-WAVE
220 260 300 A’ II II1111 I1111 I Ill I II i
A 20 60 100 140 180
20
100
140
(b) ANTOFAGASTA FINAL P-WAVE 2D VELOCITY MODEL A3
II 1 1 1 1 1 1 I Ill1 I 111 I II 1 A 20 60 100 140 180 220 260 300 A’
20
100
140
5 .O 7.0 8.7 Velocities in k d s
Figure 5. Results from the inversion of the Antofagasta data set (Table 6 ) . Symbols are a5 for Fig. 3 . (a) Initial P-wave velocity model (Al) . (h) Resulting P-wave velocity model (A3). The low-velocity layer in the upper part of the subducted slab is interpreted as subducted oceanic crust.

636 D. Comte, S. W. Roecker and G . Suarez
(a) IQUIQUE SYNTHETIC P-WAVE 2D VELOCITY MODEL
I I 140 180 220 260 300 I’
I I I 111 II I I 20 60 100
20
1 - 60 s a e, a
100
140
(b) ANTOFAGASTA SYNTHETIC P-WAVE 2D VELOCITY MODEL
II I I 1 1 1 1 I 1 1 1 1 I 111 I II I A 20 60 100 140 180 220 260 300 A’
20
5 60 a a, a
100
140
5 .O 7 .O 8.7 Velocities in km/s
Figure 6. Results of a test of the inversion results using synthetic arrival times: (a) the lquique data set; (b) the Antofagasta data set. Symbols are as for Fig. 3 .

Velocity structure in northern Chile 637
(a) IQUIQUE
I 0
50
h
E 100 5 5 a
150
200
-19-
-
-20 -
-
-21 -
-22 -
250
2D - 1 D Changes -
-
4 -
j I -70 -69 -68 -67 -71
PI' 1 I I I 1 I I I
IQUIQUE 2D - 1 D Changes 3) 0 0
I I I I I I I I
-50 0 50 100 150 200 250 300 350 400
Distance from Origin (km)
Figure 7. Locations of selected earthquakes from the Iqu ique investigations in the final 2-D model. (a) Epicentres are indicated as open circles. For each epicentre a l ine is drawn from the original location i n the I-D structure to the final epicentre in a 2-D velocity structure. (b) Cross-section o f hypocentres (open circles) along the PI-PI' profi le.

638 D. Comte, S. W. Roecker and G. Sua‘rez
-2
-2
-2
-2
-2
h
E
5 Y v
Q
F 0
-50
-1 00
-150
-200
-250
I I I I I I I I
a) ANTOFAGASTA 2D - 1 D Changes
-69 -68 -67 -70 -71
\ F I 1 I I I I I 1
9 ANTOFAGASTA 2D - 1 D Changes
\
-50 0 50 100 150 200 250 300 350 400
Distance from Origin (km)
Figure 8. Locations of selected carthquakes from the Antofagasta investigation in the final 2-D model. (a) Epicentres are indicated as open circles. Symbols are as for Fig. 7 . (b) Cross-section of hypocentres (open circles) along the PA-PA‘ profile.

Velocity structure in northern Chile 639
sedimentation history, suggest the dominance of this mechanism over several (but not all) of its competitors listed above.
7 ACKNOWLEDGMENTS
We thank M. Schmitz and P. Wigger for providing us with the refraction profile models. We also thank D. Byrne, A. Snoke, B. Tichelaar and C. Valdks for their useful suggestions. The Antofagasta and Iquique investigations were funded by the Institut Franpis de Recherche Scientifique pour le Development en Cooperation (ORSTOM) and by the International Development Research Center (IDRC) o f Canada through a grant to the Pan American Institute of Geography and History (PAIGH). This work was partially funded by the Fundacion Andes in Chile (grant C52040).
REFERENCES
Abe, K., 1979. Size of the great earthquakes of 1837-1974 inferred from tsunami data. J . geophys. Res., 84, 1561-1568.
Abers, G . A . & Roecker, S.W., 1991. Deep structure o f an arc-continent collision: earthquake relocation and inversion for upper mantle P and S wave velocities beneath Papua New Guinea. J . geophys. Res., 96, 6379-6401.
Aki, K. & Lee, W., 1976. Determination of three-dimensional velocity anomalies under a seismic array using first P arrival times from local earthquakes, I , A homogeneous model, J . geophys. Res., 81, 4281-4339.
Comte, D. & Pardo, M., 1991. Reappraisal of great historical earthquakes in northern Chilc and southern Peru seismic gaps, Natural Hazards, 4, 23-44.
Comte. D. . Pardo, M., Dorbath, L . , Dorbath, C., Haessler, H . , Rivera, L., Cisternas, A. & Ponce, L . , 1993a. Seismogenic interplate contact zone and crustal seismicity around Antofagasta, northern Chile using local data, Geophys. 1. Int.,
Comte. D. . SuArez, G . , Monfret, T., Pardo, M., Ponce, L. & Dominguez, J., 1993b. Preliminary results of a seismic experiment in northern Chile during July and August, 1991, Geofisica. in press.
DeMets, C . , Argus, R.G. & Stein, S., 1990. Current plate motions, Geophys. J . In t . , 101, 425-478.
Hori, S . , 1990. Seismic waves guided by untransformed occanic crust subducting into the mantle: the case of the Kanto district, central Japan, Tectonophysics, 176, 355-376.
Hori, S. , Inoue, H. , Fukao, Y. & Ukawa, M., 19x5. Seismic detection of the untransformed ‘basaltic’ oceanic crust subducting into the mantle, Ceophys. J . R . aslr. Soc., 83,
Hurukama, N. & Imoto, M., 1992. Subducting oceanic crust of the Philippine Sea and Pacific plates and weak-zone-normal compression in the Kanto district, Japan, Geophys. J . Int. , 109,
Kausel, E.. 1986. Los terremotos de Agoste de 1868 y Mayo de 1x77 que afectaron el sur del Peru y norte de Chile, Roletin dP la Academia Chilena de Ciencias, 3 , 8-12.
Lee, W. & Valdes, C. . 1985. HYPO71 PC: A personal computer
16, 553-561.
169- 197.
639-652.
version of the HYPO71 earthquake location program, US Geoi. Suru. Open-File Rep. 85-749.
Lomnitz, C., 1971. Grandes terremotos y tsunamis en Chile durante el p e r b d o 1535-1955, Geofis. Panam.. 2, 151-178.
Ni, J . , Ibenbrahim, A. & Roecker, S . , 1991. Three-dimensional velocity structure and hypocenters of earthquakes beneath the Hazara Arc, Pakistan: Geometry of the underthrusting Indian plate, J . geophys. Res., 96, 19 865-19 877.
Pavlis, G.L. & Booker, J .R. . 1980. The mixed discrete-continuous inverse problem: application to the simultaneous determination of earthquake hypocenters and velocity structure, J . geophys. Res.. 85, 4801-4810.
Prevot, R . , Roecker. S. . Isacks, B. & Chatelain. J . . 1991. Mapping of low P wave velocity structure in the subducting plate of the central New Hebrides. southwest Pacific, J . geophys. Res., 96, 19 825-10842.
Roecker, S., 1982. Velocity structure of the Pamir-Hindu Kush region: Possible evidence o f subducted crust, J . geophys. Res.,
Roecker, S. , Yeh, Y. 6t Tsai, Y . , 1987. Three-dimensional P and S wave velocity structures beneath Taiwan: Deep structure beneath and arc-continent collision, J . geophy.s. Res., 92, 10 547- I 0 570.
Spudich, P. & Orcutt, J . , 1980. A new look at the seismic velocity structure of the oceanic crust. Rev. Geophys. Space Phys., 18,
Suarez, G . & Comte, D . , 1993. Comment on ‘Seismic coupling along the Chilean subduction zone’ by B. W. Tichclaar and L.
Tarantola, A. & Valette. B., 1982. Inverse problem =Quest for information, J . Geophy.s., SO, 159- 170.
Thurber, C . , 1983. Earthquake locations and three-dimensional crustal structure in the Coyote Lake area. central California. J . geophys. Res., 88, 82264236.
Thurber, C., 1984. Seismic detection of the summit magma complex of Kilauea volcano, Hawaii, Science, 223, 165-167.
Thurber, C. & Ellsworth, W., 1980. Rapid solution of ray tracing problems in heterogeneous media, Bull. seism. Soc. A m . , 70,
Tichelaar, B. & Ruff, L., 1991. Seismic coupling along the Chilean subduction zone, J . geophys. Res., 96, 1 1 997-12 022.
Wigger, P., 1988. Seismicity and crustal structure of the central Andes, in The Southern Central Andes-Lecture Notes in Earth Science, pp. 17 209-17 229, eds Bahlburg, H . , Breitkreuz, Ch. & Gieset, P., Springer-Verlag, Berlin.
Wigger. P., Araneda, M., Asch, G . , Giese, P . , Heinsohn, W.-D., Rower, P . , Schmitz, M. & Viramonte, J . , 1991. The crustal structure along the central Andean Transect derived from seismic refraction investigations, in Central Andean Transect. Nazca Plate to Chaco Plains Southwestern Pacific Ocean, Northern Chile and Northern Argentina, Global Science Transect 8. pp. 13-19, copublished by the Inter-Union Commission on the Lithosphere and American Geophysical Union.
Wigger. P., Schmitz, M., Araneda, M., Asch. G . , Baldzuhn, S . , Giese, P., Heinsohn, W.-D. , Martinez, E., Ricaldi, E. , Rower, P. & Viramonte, J . , 1993. Variation of the crustal structure of the southern central Andes deduced from seismic refraction investigations, in Tectonics of the Southern Central Andes, pp. 23-48, eds Reutter. K.-J. Scheuber, E. & Wigger, P., Springer Verlag, Berlin.
87, 945-959.
627-645,
R. Ruff, 1. geophys. R a . , 98, 15 X25-15 X2X.
1137-1 148.
Copyright © 2022 FDOKUMEN