Methanol production using hydrogen from concentrated solar ...
Upload
independentCategory
view
4download
0
Available online at www.sciencedirect.com
www.elsevier.com/locate/molstruc
Journal of Molecular Structure 875 (2008) 121–129
Structural investigations of high concentrated aqueous LiClsolutions: X-ray scattering and MD simulations approach
Salah Bouazizi, Salah Nasr *
Laboratoire Physico-Chimie des Materiaux, Departement de Physique, Faculte des Sciences de Monastir, 5019 Monastir, Tunisia
Received 13 January 2007; received in revised form 16 April 2007; accepted 16 April 2007Available online 21 April 2007
Abstract
A detailed analysis of aqueous LiCl solution structures is performed by molecular dynamics (MD) simulations and X-ray scattering attwo salt concentrations (6 and 7 m) at 298 K. Another run is performed for C = 14 m. MD simulations are carried out with rigid SPCwater model, while the ions are treated as charged Lennard-Jones particles. Both MD and X-ray scattering investigations show a signif-icant reorganization of the solvent. The degree of hydrogen bonding of which clearly decreases when compared to pure fluid. MD resultsalso show that the first hydration shell of the cation is greatly distorted at high concentrations whereas the corresponding one of theanion appears nearly invariant. Moreover, the ion-pairing process is accented at highest salt concentration. X-ray data are analyzedto deduce the structure factor and the pair correlation functions of each system. A good concordance is highlighted between experimentaland theoretical results. A model of intermolecular arrangement, via MD results, is then proposed to describe the local order in each sys-tem, as deduced from X-ray scattering data.� 2007 Elsevier B.V. All rights reserved.
Keywords: Local order; H bonding; Aqueous LiCl solution; X-ray scattering; MD simulation
1. Introduction
The wide spread attention given to aqueous electrolytesolutions and their being widely investigated are due totheir importance in a wide range of biological and chemicalsystems [1]. In particular, the manner in which water sol-vates alkalis cations is relevant to many problems such asthe mechanism of enzymatic catalysis. Since, water is themost important solvent not only for technical applicationsbut also in biosystems, aqueous LiCl solutions haveattracted particular attention for many reasons. In fact,investigations of the properties of lithium are not onlyfor purely academic purposes. Lithium ion batteries aresignificant components of mobile electronic devices. Fur-thermore, many lightweight metal alloys, lubricationgreases, and glasses contain lithium. In medicine, lithium
0022-2860/$ - see front matter � 2007 Elsevier B.V. All rights reserved.
doi:10.1016/j.molstruc.2007.04.017
* Corresponding author.E-mail address: [email protected] (S. Nasr).
ions, which used in drugs for half a century, are essentialin the treatment of several psychiatric disorders [2]. Themonovalent Li+ ion is experimentally usually found tohave a coordination number nLiO between 4 and 6 [3]. Ithas been argued that the coordination number is concen-tration dependent [4,5], it decreases from about 6 at 4 mto about 3 at 10 m [5]. This tendency is questioned in arecent theoretical study by Egorov et al. [6], employingthree different lithium–water potential functions at a largenumber of concentrations. A thorough theoretical studyby Rempe et al. [7] found the number of water moleculesin the first solvation shell to be four for dilute solution.Concerning Cl� ion, it has a characteristic local coordina-tion which is remarkably insensitive to ionic concentration,counterion and moderate changes in temperature and pres-sure [8]. In the experimental study of Yamanaka et al. [9], ithas been shown that with lowering temperature, the water–water correlation within the hydration shell of Li+
decreases, while the hydration shell of Cl� is more struc-tured in the supercooled and glassy state.
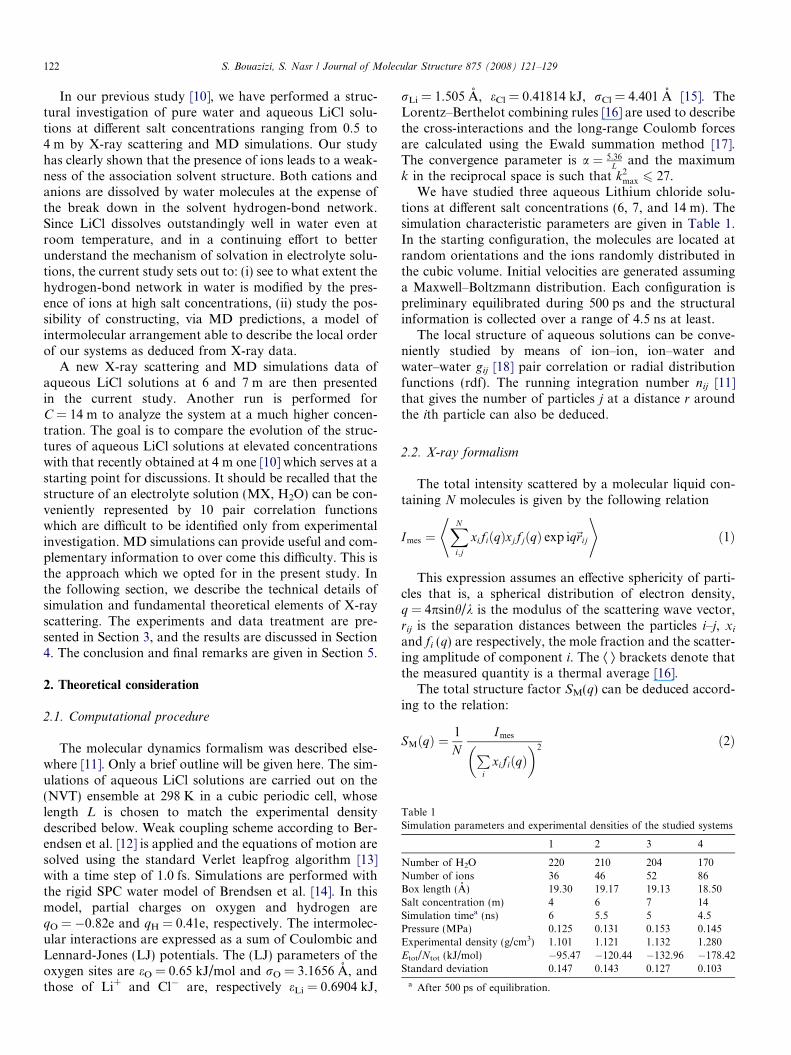
Table 1Simulation parameters and experimental densities of the studied systems
1 2 3 4
Number of H2O 220 210 204 170Number of ions 36 46 52 86Box length (A) 19.30 19.17 19.13 18.50Salt concentration (m) 4 6 7 14Simulation timea (ns) 6 5.5 5 4.5Pressure (MPa) 0.125 0.131 0.153 0.145Experimental density (g/cm3) 1.101 1.121 1.132 1.280Etot/Ntot (kJ/mol) �95.47 �120.44 �132.96 �178.42Standard deviation 0.147 0.143 0.127 0.103
a After 500 ps of equilibration.
122 S. Bouazizi, S. Nasr / Journal of Molecular Structure 875 (2008) 121–129
In our previous study [10], we have performed a struc-tural investigation of pure water and aqueous LiCl solu-tions at different salt concentrations ranging from 0.5 to4 m by X-ray scattering and MD simulations. Our studyhas clearly shown that the presence of ions leads to a weak-ness of the association solvent structure. Both cations andanions are dissolved by water molecules at the expense ofthe break down in the solvent hydrogen-bond network.Since LiCl dissolves outstandingly well in water even atroom temperature, and in a continuing effort to betterunderstand the mechanism of solvation in electrolyte solu-tions, the current study sets out to: (i) see to what extent thehydrogen-bond network in water is modified by the pres-ence of ions at high salt concentrations, (ii) study the pos-sibility of constructing, via MD predictions, a model ofintermolecular arrangement able to describe the local orderof our systems as deduced from X-ray data.
A new X-ray scattering and MD simulations data ofaqueous LiCl solutions at 6 and 7 m are then presentedin the current study. Another run is performed forC = 14 m to analyze the system at a much higher concen-tration. The goal is to compare the evolution of the struc-tures of aqueous LiCl solutions at elevated concentrationswith that recently obtained at 4 m one [10] which serves at astarting point for discussions. It should be recalled that thestructure of an electrolyte solution (MX, H2O) can be con-veniently represented by 10 pair correlation functionswhich are difficult to be identified only from experimentalinvestigation. MD simulations can provide useful and com-plementary information to over come this difficulty. This isthe approach which we opted for in the present study. Inthe following section, we describe the technical details ofsimulation and fundamental theoretical elements of X-rayscattering. The experiments and data treatment are pre-sented in Section 3, and the results are discussed in Section4. The conclusion and final remarks are given in Section 5.
2. Theoretical consideration
2.1. Computational procedure
The molecular dynamics formalism was described else-where [11]. Only a brief outline will be given here. The sim-ulations of aqueous LiCl solutions are carried out on the(NVT) ensemble at 298 K in a cubic periodic cell, whoselength L is chosen to match the experimental densitydescribed below. Weak coupling scheme according to Ber-endsen et al. [12] is applied and the equations of motion aresolved using the standard Verlet leapfrog algorithm [13]with a time step of 1.0 fs. Simulations are performed withthe rigid SPC water model of Brendsen et al. [14]. In thismodel, partial charges on oxygen and hydrogen areqO = �0.82e and qH = 0.41e, respectively. The intermolec-ular interactions are expressed as a sum of Coulombic andLennard-Jones (LJ) potentials. The (LJ) parameters of theoxygen sites are eO = 0.65 kJ/mol and rO = 3.1656 A, andthose of Li+ and Cl� are, respectively eLi = 0.6904 kJ,
rLi = 1.505 A, eCl = 0.41814 kJ, rCl = 4.401 A [15]. TheLorentz–Berthelot combining rules [16] are used to describethe cross-interactions and the long-range Coulomb forcesare calculated using the Ewald summation method [17].The convergence parameter is a ¼ 5:36
L and the maximumk in the reciprocal space is such that k2
max 6 27.We have studied three aqueous Lithium chloride solu-
tions at different salt concentrations (6, 7, and 14 m). Thesimulation characteristic parameters are given in Table 1.In the starting configuration, the molecules are located atrandom orientations and the ions randomly distributed inthe cubic volume. Initial velocities are generated assuminga Maxwell–Boltzmann distribution. Each configuration ispreliminary equilibrated during 500 ps and the structuralinformation is collected over a range of 4.5 ns at least.
The local structure of aqueous solutions can be conve-niently studied by means of ion–ion, ion–water andwater–water gij [18] pair correlation or radial distributionfunctions (rdf). The running integration number nij [11]that gives the number of particles j at a distance r aroundthe ith particle can also be deduced.
2.2. X-ray formalism
The total intensity scattered by a molecular liquid con-taining N molecules is given by the following relation
Imes ¼XN
i;j
xifiðqÞxjfjðqÞ exp iq~rij
* +ð1Þ
This expression assumes an effective sphericity of parti-cles that is, a spherical distribution of electron density,q = 4psinh/k is the modulus of the scattering wave vector,rij is the separation distances between the particles i–j, xi
and fi (q) are respectively, the mole fraction and the scatter-ing amplitude of component i. The Æ æ brackets denote thatthe measured quantity is a thermal average [16].
The total structure factor SM(q) can be deduced accord-ing to the relation:
SMðqÞ ¼1
NImesP
ixifiðqÞ
� �2ð2Þ
a
b
c
0.0
0.0
0.5
1.0
0.5
1.0
1.5
0.0
0.5
1.0
1.5
2.0
2.5
Fig. 1. The oxygen–oxygen (a), oxygen–hydrogen (b) and hydrogen–hydrogen (c) pair correlation functions of aqueous LiCl solutions, asdeduced from MD simulations. (_____: c = 14 m, - - - : c = 7 m, . . .:c = 6 m and -Æ-Æ-: c = 4 m).
S. Bouazizi, S. Nasr / Journal of Molecular Structure 875 (2008) 121–129 123
3. Experiment and data treatment
The X-ray diffraction studies were carried out on a stan-dard h–2h diffractometer operating in transmission mode.The sample was contained in flat sample holder (4 mmthick) equipped with Mylar windows. MoKa radiation(k = 0.7093 A), monochromated by a bent asymmetricquartz crystal in the primary beam, was used. Scatteredintensities were measured in steps of 0.25� (2h) in the range3–55�, and in steps of 0.5� at high angles. The maximum q
value was 15.34 A�1. The sodium chloride was supplied byPharmacopee Europeenne (purity > 99%) and the solutionswere prepared with deionized water.
For each solution, the experimental intensity data Imes
was corrected according to the relation [19]:
IcorrðhÞ ¼ ImesðhÞ � BðhÞ½ �P ðhÞ�1AðhÞ�1GðhÞ�1 ð3Þwere B(h), P(h), A(h) and G(h) are respectively, the back-ground correction, the polarization factor, the absorptioncorrection and the variation of the effective irradiated vol-ume [11]. The experimental structure function of each solu-tion was then expressed as [20]
SMðqÞ � SMð1Þ ¼aIcorrðqÞ �
Pi
xiI iincohðqÞ þ
Pi
xif 2i ðqÞ
� �P
ixifiðqÞ
� �2
ð4Þ
where a is the normalizing factor [21] and I iincoh is the comp-
ton intensity for compound i.The pair correlation function g(r) of the molecular cen-
ter can be calculated by Fourier transformation of thestructure factor according to the relation
gðrÞ ¼ 1þ ð2prqÞ�1
Z 1
0
q SMðqÞ � SMð1Þ½ � sinðqrÞdq ð5Þ
4. Results and discussion
In the following passage, we discuss the water–watercorrelations at C = 6, 7 and 14 m. Earlier results atC = 4 m [10] are also quoted for comparison. The oxy-gen–oxygen pair correlation functions gOO(r) for rigidSPC water are illustrated in Fig. 1a. We can see that thefirst separation distance (2.77 A) at 6 and 7 m is the sameas that observed at 4 m and lower concentrations [10].However, the location of the first peak is clearly shiftedfrom 2.77 to 3.12 A at 14 m and the amplitude of this peakis monotonously reduced as the concentration increases.Moreover, the second peak in gOO(r), the signature of thewater tetrahedral coordination, is regularly reduced inamplitude to become fundamentally modified at 14 m.Another clear effect is the shifting of the third maximumin gOO(r) from 6.37 A at 4 m to 6.27 A at 14 m. It is alsointeresting to notice that this peak is clearly amplified athigh concentrations.
The consideration of the oxygen–hydrogen gOH(r) paircorrelation function (Fig. 1b) particularly shows a regularreduction of the amplitude of the first peak, leading to adecrease in the number, nOH, of hydrogen bonds per mol-ecule, which moves from 2.96 at 4 m to 1.24 at 14 m (seeTable 2). A similar phenomenon is observed in the hydro-gen–hydrogen pair correlation functions gHH(r) (Fig. 1c),and nHH coordination number (Table 2). The drasticdecrease in the number of hydrogen bonds, associated tothe observed features in the gOO(r) rdf, is an evidence ofion-induced disruption on water structure. As the salt con-centration increases, there is a decrease in the orientationalordering of a pair of hydrogen-bonded water molecules.Otherwise, the oxygen–oxygen coordination number nOO
increases (see Table 2) in spite of the reduction of the heightof the first peak in gOO(r) curves. This is certainly due tothe net shift of the first minimum which moves from about4.01 A for 4 m to 4.92 A for 14 m solution.
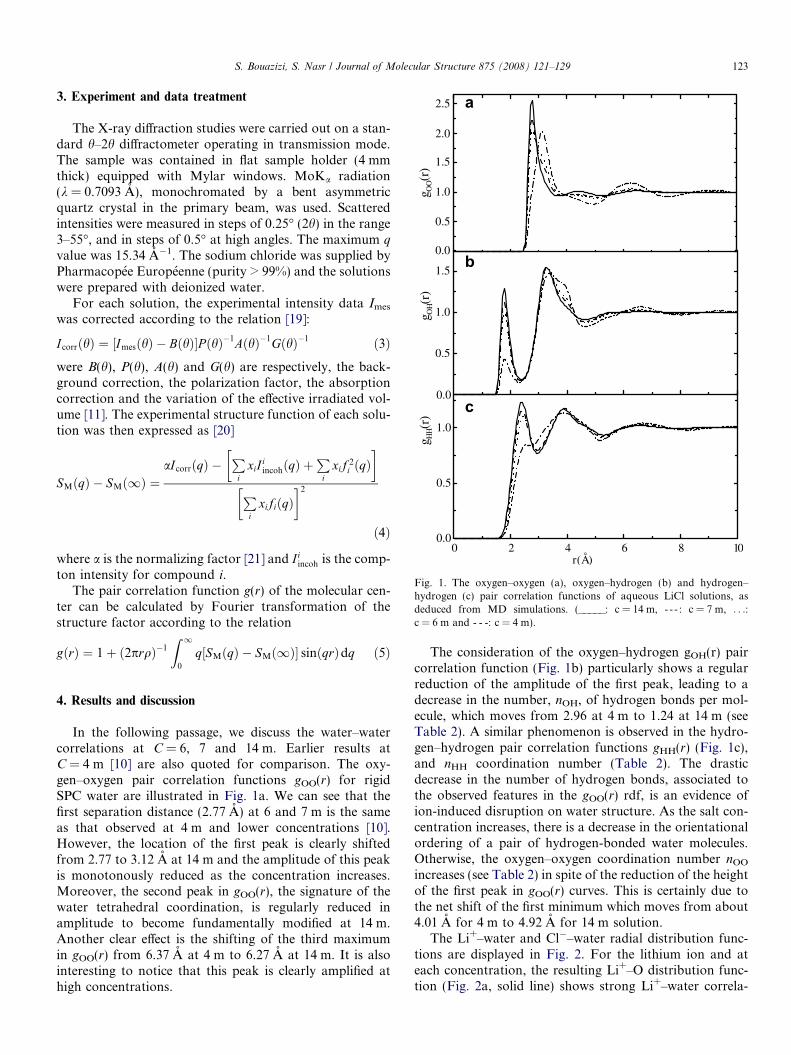
The Li+–water and Cl�–water radial distribution func-tions are displayed in Fig. 2. For the lithium ion and ateach concentration, the resulting Li+–O distribution func-tion (Fig. 2a, solid line) shows strong Li+–water correla-
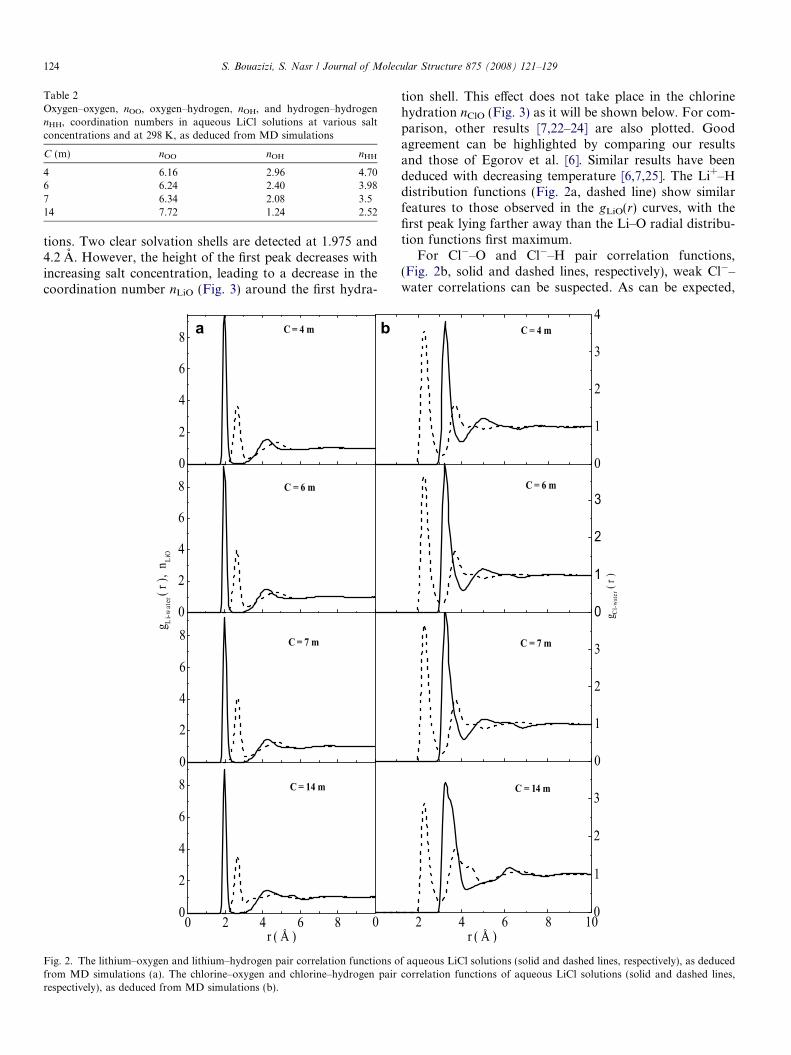
Table 2Oxygen–oxygen, nOO, oxygen–hydrogen, nOH, and hydrogen–hydrogennHH, coordination numbers in aqueous LiCl solutions at various saltconcentrations and at 298 K, as deduced from MD simulations
C (m) nOO nOH nHH
4 6.16 2.96 4.706 6.24 2.40 3.987 6.34 2.08 3.514 7.72 1.24 2.52
124 S. Bouazizi, S. Nasr / Journal of Molecular Structure 875 (2008) 121–129
tions. Two clear solvation shells are detected at 1.975 and4.2 A. However, the height of the first peak decreases withincreasing salt concentration, leading to a decrease in thecoordination number nLiO (Fig. 3) around the first hydra-
a b
Fig. 2. The lithium–oxygen and lithium–hydrogen pair correlation functions ofrom MD simulations (a). The chlorine–oxygen and chlorine–hydrogen pairrespectively), as deduced from MD simulations (b).
tion shell. This effect does not take place in the chlorinehydration nClO (Fig. 3) as it will be shown below. For com-parison, other results [7,22–24] are also plotted. Goodagreement can be highlighted by comparing our resultsand those of Egorov et al. [6]. Similar results have beendeduced with decreasing temperature [6,7,25]. The Li+–Hdistribution functions (Fig. 2a, dashed line) show similarfeatures to those observed in the gLiO(r) curves, with thefirst peak lying farther away than the Li–O radial distribu-tion functions first maximum.
For Cl�–O and Cl�–H pair correlation functions,(Fig. 2b, solid and dashed lines, respectively), weak Cl�–water correlations can be suspected. As can be expected,
f aqueous LiCl solutions (solid and dashed lines, respectively), as deducedcorrelation functions of aqueous LiCl solutions (solid and dashed lines,
0 2 4 6 8 10 12 14 16 182
3
4
5
6
7
8
9
Hyd
ratio
n nu
mbe
r
C(mol/kg)
Fig. 3. The Li+ (s this work, j Ref. [6], c Ref. [22], � Ref. [23], m Ref.[24]) and Cl� (. this work, h Ref. [22], b Ref. [23]) hydration numbers.
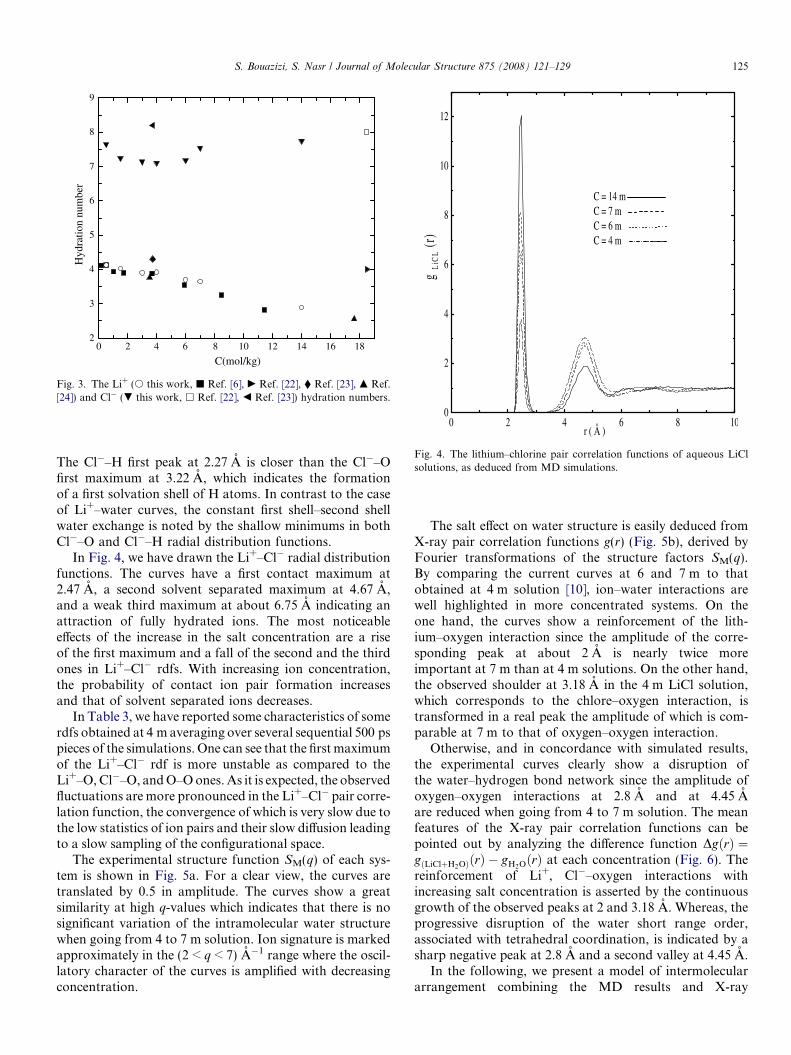
ig. 4. The lithium–chlorine pair correlation functions of aqueous LiClolutions, as deduced from MD simulations.
S. Bouazizi, S. Nasr / Journal of Molecular Structure 875 (2008) 121–129 125
The Cl�–H first peak at 2.27 A is closer than the Cl�–Ofirst maximum at 3.22 A, which indicates the formationof a first solvation shell of H atoms. In contrast to the caseof Li+–water curves, the constant first shell–second shellwater exchange is noted by the shallow minimums in bothCl�–O and Cl�–H radial distribution functions.
In Fig. 4, we have drawn the Li+–Cl� radial distributionfunctions. The curves have a first contact maximum at2.47 A, a second solvent separated maximum at 4.67 A,and a weak third maximum at about 6.75 A indicating anattraction of fully hydrated ions. The most noticeableeffects of the increase in the salt concentration are a riseof the first maximum and a fall of the second and the thirdones in Li+–Cl� rdfs. With increasing ion concentration,the probability of contact ion pair formation increasesand that of solvent separated ions decreases.
In Table 3, we have reported some characteristics of somerdfs obtained at 4 m averaging over several sequential 500 pspieces of the simulations. One can see that the first maximumof the Li+–Cl� rdf is more unstable as compared to theLi+–O, Cl�–O, and O–O ones. As it is expected, the observedfluctuations are more pronounced in the Li+–Cl� pair corre-lation function, the convergence of which is very slow due tothe low statistics of ion pairs and their slow diffusion leadingto a slow sampling of the configurational space.
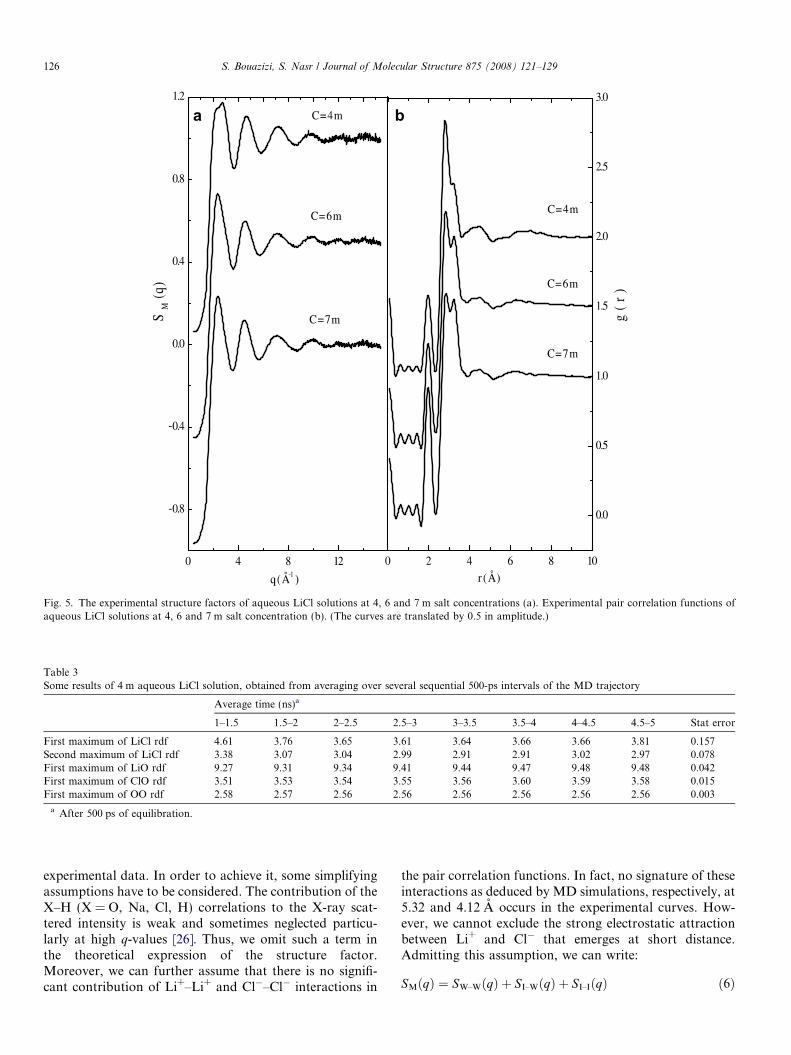
The experimental structure function SM(q) of each sys-tem is shown in Fig. 5a. For a clear view, the curves aretranslated by 0.5 in amplitude. The curves show a greatsimilarity at high q-values which indicates that there is nosignificant variation of the intramolecular water structurewhen going from 4 to 7 m solution. Ion signature is markedapproximately in the (2 < q < 7) A�1 range where the oscil-latory character of the curves is amplified with decreasingconcentration.
Fs
The salt effect on water structure is easily deduced fromX-ray pair correlation functions g(r) (Fig. 5b), derived byFourier transformations of the structure factors SM(q).By comparing the current curves at 6 and 7 m to thatobtained at 4 m solution [10], ion–water interactions arewell highlighted in more concentrated systems. On theone hand, the curves show a reinforcement of the lith-ium–oxygen interaction since the amplitude of the corre-sponding peak at about 2 A is nearly twice moreimportant at 7 m than at 4 m solutions. On the other hand,the observed shoulder at 3.18 A in the 4 m LiCl solution,which corresponds to the chlore–oxygen interaction, istransformed in a real peak the amplitude of which is com-parable at 7 m to that of oxygen–oxygen interaction.
Otherwise, and in concordance with simulated results,the experimental curves clearly show a disruption ofthe water–hydrogen bond network since the amplitude ofoxygen–oxygen interactions at 2.8 A and at 4.45 Aare reduced when going from 4 to 7 m solution. The meanfeatures of the X-ray pair correlation functions can bepointed out by analyzing the difference function DgðrÞ ¼gðLiClþH2OÞðrÞ � gH2OðrÞ at each concentration (Fig. 6). Thereinforcement of Li+, Cl�–oxygen interactions withincreasing salt concentration is asserted by the continuousgrowth of the observed peaks at 2 and 3.18 A. Whereas, theprogressive disruption of the water short range order,associated with tetrahedral coordination, is indicated by asharp negative peak at 2.8 A and a second valley at 4.45 A.
In the following, we present a model of intermoleculararrangement combining the MD results and X-ray
a b
Fig. 5. The experimental structure factors of aqueous LiCl solutions at 4, 6 and 7 m salt concentrations (a). Experimental pair correlation functions ofaqueous LiCl solutions at 4, 6 and 7 m salt concentration (b). (The curves are translated by 0.5 in amplitude.)
Table 3Some results of 4 m aqueous LiCl solution, obtained from averaging over several sequential 500-ps intervals of the MD trajectory
Average time (ns)a
1–1.5 1.5–2 2–2.5 2.5–3 3–3.5 3.5–4 4–4.5 4.5–5 Stat error
First maximum of LiCl rdf 4.61 3.76 3.65 3.61 3.64 3.66 3.66 3.81 0.157Second maximum of LiCl rdf 3.38 3.07 3.04 2.99 2.91 2.91 3.02 2.97 0.078First maximum of LiO rdf 9.27 9.31 9.34 9.41 9.44 9.47 9.48 9.48 0.042First maximum of ClO rdf 3.51 3.53 3.54 3.55 3.56 3.60 3.59 3.58 0.015First maximum of OO rdf 2.58 2.57 2.56 2.56 2.56 2.56 2.56 2.56 0.003
a After 500 ps of equilibration.
126 S. Bouazizi, S. Nasr / Journal of Molecular Structure 875 (2008) 121–129
experimental data. In order to achieve it, some simplifyingassumptions have to be considered. The contribution of theX–H (X = O, Na, Cl, H) correlations to the X-ray scat-tered intensity is weak and sometimes neglected particu-larly at high q-values [26]. Thus, we omit such a term inthe theoretical expression of the structure factor.Moreover, we can further assume that there is no signifi-cant contribution of Li+–Li+ and Cl�–Cl� interactions in
the pair correlation functions. In fact, no signature of theseinteractions as deduced by MD simulations, respectively, at5.32 and 4.12 A occurs in the experimental curves. How-ever, we cannot exclude the strong electrostatic attractionbetween Li+ and Cl� that emerges at short distance.Admitting this assumption, we can write:
SMðqÞ ¼ SW–WðqÞ þ SI–WðqÞ þ SI–IðqÞ ð6Þ
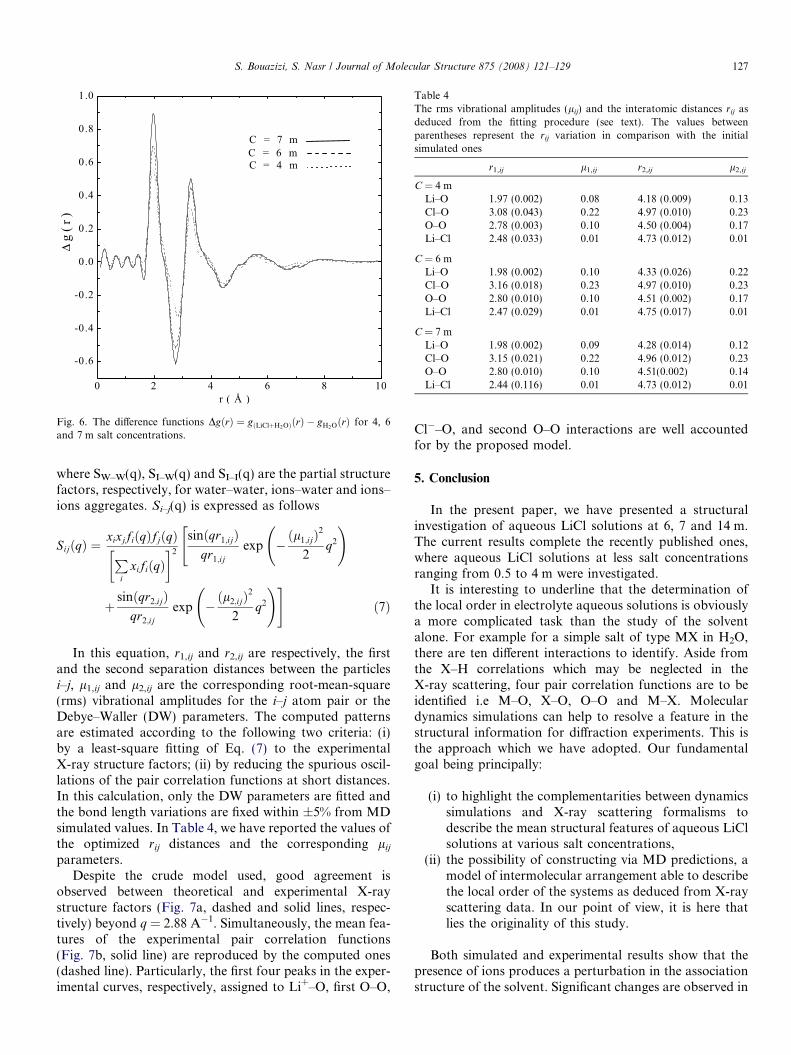
Fig. 6. The difference functions DgðrÞ ¼ gðLiClþH2OÞðrÞ � gH2OðrÞ for 4, 6and 7 m salt concentrations.
Table 4The rms vibrational amplitudes (lij) and the interatomic distances rij asdeduced from the fitting procedure (see text). The values betweenparentheses represent the rij variation in comparison with the initialsimulated ones
r1,ij l1,ij r2,ij l2,ij
C = 4 mLi–O 1.97 (0.002) 0.08 4.18 (0.009) 0.13Cl–O 3.08 (0.043) 0.22 4.97 (0.010) 0.23O–O 2.78 (0.003) 0.10 4.50 (0.004) 0.17Li–Cl 2.48 (0.033) 0.01 4.73 (0.012) 0.01
C = 6 mLi–O 1.98 (0.002) 0.10 4.33 (0.026) 0.22Cl–O 3.16 (0.018) 0.23 4.97 (0.010) 0.23O–O 2.80 (0.010) 0.10 4.51 (0.002) 0.17Li–Cl 2.47 (0.029) 0.01 4.75 (0.017) 0.01
C = 7 mLi–O 1.98 (0.002) 0.09 4.28 (0.014) 0.12Cl–O 3.15 (0.021) 0.22 4.96 (0.012) 0.23O–O 2.80 (0.010) 0.10 4.51(0.002) 0.14Li–Cl 2.44 (0.116) 0.01 4.73 (0.012) 0.01
S. Bouazizi, S. Nasr / Journal of Molecular Structure 875 (2008) 121–129 127
where SW–W(q), SI–W(q) and SI–I(q) are the partial structurefactors, respectively, for water–water, ions–water and ions–ions aggregates. Si–j(q) is expressed as follows
SijðqÞ ¼xixjfiðqÞfjðqÞP
ixifiðqÞ
� �2
sinðqr1;ijÞqr1;ij
exp �ðl1;ijÞ
2
2q2
!"
þsinðqr2;ijÞ
qr2;ij
exp �ðl2;ijÞ
2
2q2
!#ð7Þ
In this equation, r1,ij and r2,ij are respectively, the firstand the second separation distances between the particlesi–j, l1,ij and l2,ij are the corresponding root-mean-square(rms) vibrational amplitudes for the i–j atom pair or theDebye–Waller (DW) parameters. The computed patternsare estimated according to the following two criteria: (i)by a least-square fitting of Eq. (7) to the experimentalX-ray structure factors; (ii) by reducing the spurious oscil-lations of the pair correlation functions at short distances.In this calculation, only the DW parameters are fitted andthe bond length variations are fixed within ±5% from MDsimulated values. In Table 4, we have reported the values ofthe optimized rij distances and the corresponding lij
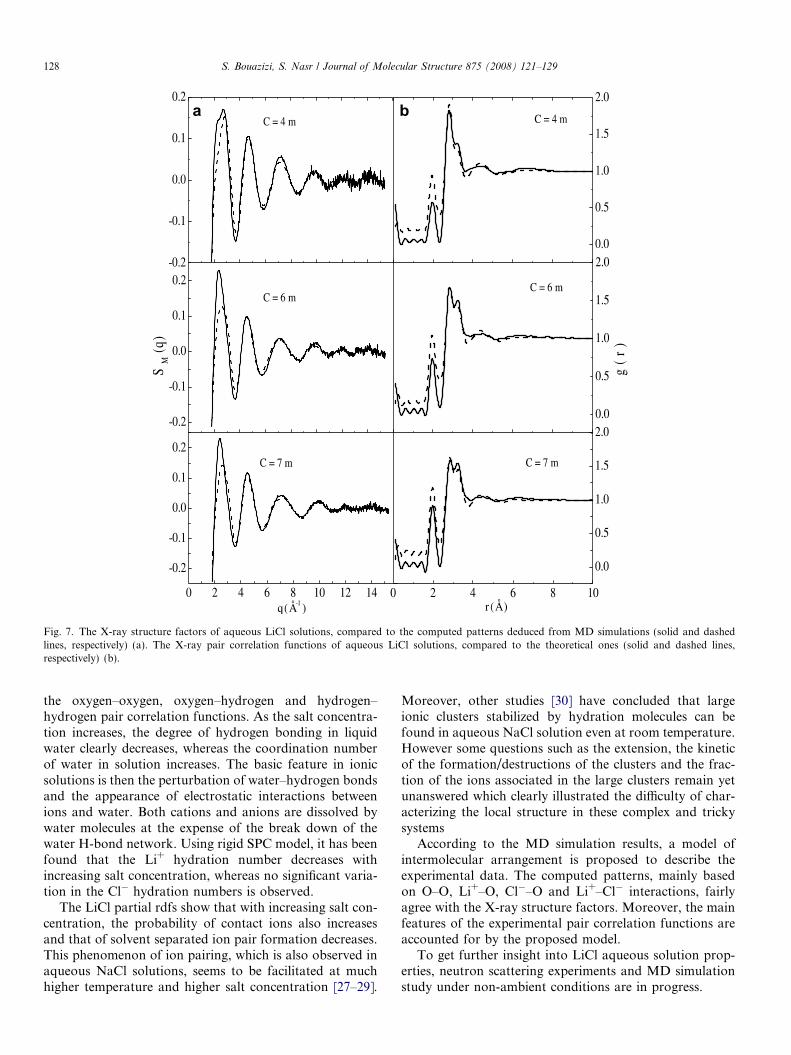
parameters.Despite the crude model used, good agreement is
observed between theoretical and experimental X-raystructure factors (Fig. 7a, dashed and solid lines, respec-tively) beyond q = 2.88 A�1. Simultaneously, the mean fea-tures of the experimental pair correlation functions(Fig. 7b, solid line) are reproduced by the computed ones(dashed line). Particularly, the first four peaks in the exper-imental curves, respectively, assigned to Li+–O, first O–O,
Cl�–O, and second O–O interactions are well accountedfor by the proposed model.
5. Conclusion
In the present paper, we have presented a structuralinvestigation of aqueous LiCl solutions at 6, 7 and 14 m.The current results complete the recently published ones,where aqueous LiCl solutions at less salt concentrationsranging from 0.5 to 4 m were investigated.
It is interesting to underline that the determination ofthe local order in electrolyte aqueous solutions is obviouslya more complicated task than the study of the solventalone. For example for a simple salt of type MX in H2O,there are ten different interactions to identify. Aside fromthe X–H correlations which may be neglected in theX-ray scattering, four pair correlation functions are to beidentified i.e M–O, X–O, O–O and M–X. Moleculardynamics simulations can help to resolve a feature in thestructural information for diffraction experiments. This isthe approach which we have adopted. Our fundamentalgoal being principally:
(i) to highlight the complementarities between dynamicssimulations and X-ray scattering formalisms todescribe the mean structural features of aqueous LiClsolutions at various salt concentrations,
(ii) the possibility of constructing via MD predictions, amodel of intermolecular arrangement able to describethe local order of the systems as deduced from X-rayscattering data. In our point of view, it is here thatlies the originality of this study.
Both simulated and experimental results show that thepresence of ions produces a perturbation in the associationstructure of the solvent. Significant changes are observed in
a b
Fig. 7. The X-ray structure factors of aqueous LiCl solutions, compared to the computed patterns deduced from MD simulations (solid and dashedlines, respectively) (a). The X-ray pair correlation functions of aqueous LiCl solutions, compared to the theoretical ones (solid and dashed lines,respectively) (b).
128 S. Bouazizi, S. Nasr / Journal of Molecular Structure 875 (2008) 121–129
the oxygen–oxygen, oxygen–hydrogen and hydrogen–hydrogen pair correlation functions. As the salt concentra-tion increases, the degree of hydrogen bonding in liquidwater clearly decreases, whereas the coordination numberof water in solution increases. The basic feature in ionicsolutions is then the perturbation of water–hydrogen bondsand the appearance of electrostatic interactions betweenions and water. Both cations and anions are dissolved bywater molecules at the expense of the break down of thewater H-bond network. Using rigid SPC model, it has beenfound that the Li+ hydration number decreases withincreasing salt concentration, whereas no significant varia-tion in the Cl� hydration numbers is observed.
The LiCl partial rdfs show that with increasing salt con-centration, the probability of contact ions also increasesand that of solvent separated ion pair formation decreases.This phenomenon of ion pairing, which is also observed inaqueous NaCl solutions, seems to be facilitated at muchhigher temperature and higher salt concentration [27–29].
Moreover, other studies [30] have concluded that largeionic clusters stabilized by hydration molecules can befound in aqueous NaCl solution even at room temperature.However some questions such as the extension, the kineticof the formation/destructions of the clusters and the frac-tion of the ions associated in the large clusters remain yetunanswered which clearly illustrated the difficulty of char-acterizing the local structure in these complex and trickysystems
According to the MD simulation results, a model ofintermolecular arrangement is proposed to describe theexperimental data. The computed patterns, mainly basedon O–O, Li+–O, Cl�–O and Li+–Cl� interactions, fairlyagree with the X-ray structure factors. Moreover, the mainfeatures of the experimental pair correlation functions areaccounted for by the proposed model.
To get further insight into LiCl aqueous solution prop-erties, neutron scattering experiments and MD simulationstudy under non-ambient conditions are in progress.
S. Bouazizi, S. Nasr / Journal of Molecular Structure 875 (2008) 121–129 129
Acknowledgements
The authors thank Nabiha Bchir and Moncef Rassas forhelping in the improvement of the linguistic aspect of thispaper.
Appendix A. Supplementary data
Supplementary data associated with this article can befound, in the online version, at doi:10.1016/j.molstruc.2007.04.017.
References
[1] B.M. Pettitt, P.J. Rossky, J. Chem. Phys. 84 (1986) 5836.[2] H.H. Loeffler, B.M. Rode, J. Chem. Phys. 117 (2002) 110.[3] H. Ohtaki, T. Radnai, Chem. Rev. 93 (1993) 1157.[4] Y. Marcus, Chem. Rev. 88 (1988) 1475.[5] I. Howell, G.W. Neilson, J. Phys. Condens. Mat. 8 (1996) 4455.[6] A.V. Egorov, A.V. Komolkin, V.I. Chizhik, P.V. Yushmanov, A.P.
Lyubartsev, A. Laaksonen, J. Phys. Chem. B. 107 (2003) 3234.[7] S.B. Rempe, L.R. Pratt, G. Hummer, J.D. Kress, R.L. Martin, A.
Redondo, J. Am. Chem. Soc. 122 (2000) 966.[8] S. Cummings, J.E. Enderby, G.W. Neilson, J.R. Newsome, R.A.
Howe, W.S. Howells, A.K. Soper, Nature 287 (1980) 714.[9] K. Yamanaka, M.Y. amagami, T. Takamuku, T. Yamaguchi, H.
Wakita, J. Phys. Chem. 97 (1993) 10835.[10] S. Bouazizi, S. Nasr, J. Mol. Struct. 837 (2007) 206.
[11] S. Bouazizi, S. Nasr, N. jaıdane, M.-C. Bellissent-Funel, J. Phys.Chem. B. 110 (2006) 23515.
[12] H.J.C. Berendsen, J.P.M. Postma, W.F. Van Gunsteren, A. DiNola,J.R. Haak, J. Chem. Phys. 81 (1984) 3684.
[13] L. Verlet, Phys. Rev. 159 (1967) 159.[14] H.J.C. Berendsen, J.P.M. Postma, W.F. Van Gunsteren, J.
Hermans, in: B. Pullman (Ed.), Intermolecular Forces, Reidel,Dordrecht, 1981.
[15] S. Chowdhuri, A. Chandra, J. Chem. Phys. 118 (2003) 9719.[16] P.A. Egelstaff, An Introduction to the Liquid State, Clarendon, New
York, 1994.[17] S.W. de Leeuw, J.W. Perram, E.R. Smith, Proc. Soc. Lond. A 373
(1980) 27.[18] H. Ohtaki, N. Fukushima, Pure Appl. Chem. 63 (1991) 1743.[19] S. Nasr, M. Ghedira, R. Cortes, J. Chem. Phys. 110 (1999) 10487.[20] G. Palinkas, T. Radnai, F. Hajdu, Z. Naturforsch. 35A (1980) 107.[21] J. Krogh-Moe, Acta Crystallogr. 9 (1956) 951.[22] K. Tanaka, N. Ogita, Y. tamura, I. Okada, H. Ohtaki, G. Palinkas,
E. Spohr, K. Heienzinger, Z. Naturforsch. 42A (1987) 9.[23] M.L. Restrepo, W.G. Chapman, J. Chem. Phys. 100 (1994) 8321.[24] M.V. Fedotova, R.D. Oparin, V.N. Trostin, J. Mol. Liq. 91 (2001)
123.[25] V.I. Chizhik, Mol. Phys. 90 (1997) 653.[26] F. Hammami, S. Nasr, M.-C. Bellissent-Funel, M. Oumezzine, J.
Phys. Chem. B. 109 (2005) 16169.[27] S. Koneshan, J.C. Rasaiah, J. Chem. Phys. 113 (2000) 8125.[28] T. Driesner, T.M. Seware, I.G. Tironi, Geochim. Cosmochin. Acta 62
(1998) 3095.[29] J.W. Tester, P.A. Marrone, M.M. DiPippo, K. Sako, M.T. Reagan,
T. Arias, W. A. Peters, J. Supercrit. Fluids 13 (1198) 255.[30] L. Degreve, F.L.B. da Silva, J. Mol. Liq. 87 (2000) 217.
Copyright © 2022 FDOKUMEN