Structural determination of ethylene-propylene-diene rubber (EPDM) containing high degree of...
11
Structural Determination of Ethylene-Propylene-Diene Rubber (EPDM) Containing High Degree of Controlled Long-Chain Branching Susanta Mitra, 1 * Mikkel Jørgensen, 1 Walther Batsberg Pedersen, 1 Kristoffer Almdal, 1 Debasish Banerjee 2 * 1 The Danish Polymer Centre, Risø National Laboratory, Frederiksborgvej 399, Roskilde DK-4000, Denmark 2 Department of Radiology, Washington University School of Medicine, St. Louis, Missouri 63110 Received 16 May 2008; accepted 2 March 2009 DOI 10.1002/app.30402 Published online 1 May 2009 in Wiley InterScience (www.interscience.wiley.com). ABSTRACT: This work highlights an attempt to charac- terize the degree and nature of long-chain branching (LCB) in an unknown sample of ethylene-propylene-diene rubber (EPDM). Two EPDM rubbers selected for this study were comparable in comonomer compositions but significantly different with respect to molar mass and the presence of LCB. Both rubbers contained 5-ethylidene-2- norbornene (ENB) as diene. Solution cast films of pure EPDM samples were used for different characterization techniques. 1 H-NMR, and 13 C-NMR were used for assess- ing the comonomer ratios and LCB. Size exclusion chro- matography (SEC) equipped with triple detector system was used to determine the molar mass (both absolute and relative) and polydispersity index (PDI). Presence of branching was also detected using sec-viscometry. Rheo- logical analysis has also been used for characterizing LCB. Finally, on the basis of the experimental findings and the available theories, an attempt was made to identify the chemical nature and degree of LCB. This study reveals the possibility of detailed characterization of molecular architecture of EPDM containing LCB by comparing with an essentially linear EPDM in light of an existing theory. V V C 2009 Wiley Periodicals, Inc. J Appl Polym Sci 113: 2962–2972, 2009 Key words: elastomers; EPDM; long chain branching; NMR; polymers; rheology; size exclusion chromatography INTRODUCTION Ethylene-propylene-diene rubbers (EPDM) are used for several outdoors applications e.g., in the build- ing, construction, engineering, and automotive sec- tors by virtue of their resistance to oxygen, ozone, heat, and UV because of the saturated hydrocarbon backbone. 1 One of the most important grades of EPDM is with 5-ethylidene-2-norborene (ENB) as a diene and the typical chemical structure is shown in Scheme 1. With metallocene catalysts, it possible to synthe- size ethylene, propylene, and other higher a-olefine copolymers with narrow and unimodal chemical composition distribution (CCD) compared to bi- modal and nonuniform CCD obtained by Ziegler- Natta catalysts. 2,3 Moreover, metallocene catalyst can also be used to synthesize a copolymer containing long-chain branching (LCB). The term LCB attributes to the configuration of a polymer molecule possess- ing side chains with a degree of polymerization, which are capable to entangle with each other (i.e., molar mass of the side chain is above the entangle- ment molar mass of the polymer). LCB introduction in polymer using metallocene catalysts increases the shear thinning and melt elasticity, while keeping the molar mass distribution (MWD) or PDI typically between 2.0 and 2.5. 2,3 Rubbers made with metallo- cene catalysts combine the excellent mechanical properties and good processibility. 4–6 Therefore, LCB containing rubber results in excellent filler disper- sion, smooth surface finishes, and form stability along with consistent mechanical properties. Several new grades of EPDM are commercially available, which contain controlled LCB with narrow PDI and higher molar mass. 4–6 It is also claimed that some of these new grades having high molar mass and con- trolled LCB could behave as a high ENB content EPDM (which is one of the costly grades of EPDM). 5,6 This could result in higher state of curing Journal of Applied Polymer Science, Vol. 113, 2962–2972 (2009) V V C 2009 Wiley Periodicals, Inc. *Present address: GE Global Research, SABIC Innovative Plastics Program, John F Welch Technology Centre (GE India Technology Centre Pvt. Ltd.), 122, EPIP, Phase 2, Hoodi Village, Whitefield Road, Bangalore 560066, India. Correspondence to: S. Mitra ([email protected]). Contract grant sponsor: MONEPOL (Danish Centre for the Study of Polymer Degradation and Stability); contract grant number: 2000-603/4001-51.
-
Upload
independent -
Category
Documents
-
view
0 -
download
0
Transcript of Structural determination of ethylene-propylene-diene rubber (EPDM) containing high degree of...

Structural Determination of Ethylene-Propylene-DieneRubber (EPDM) Containing High Degree of ControlledLong-Chain Branching
Susanta Mitra,1* Mikkel Jørgensen,1 Walther Batsberg Pedersen,1 Kristoffer Almdal,1
Debasish Banerjee2*
1The Danish Polymer Centre, Risø National Laboratory, Frederiksborgvej 399, Roskilde DK-4000, Denmark2Department of Radiology, Washington University School of Medicine, St. Louis, Missouri 63110
Received 16 May 2008; accepted 2 March 2009DOI 10.1002/app.30402Published online 1 May 2009 in Wiley InterScience (www.interscience.wiley.com).
ABSTRACT: This work highlights an attempt to charac-terize the degree and nature of long-chain branching(LCB) in an unknown sample of ethylene-propylene-dienerubber (EPDM). Two EPDM rubbers selected for thisstudy were comparable in comonomer compositions butsignificantly different with respect to molar mass and thepresence of LCB. Both rubbers contained 5-ethylidene-2-norbornene (ENB) as diene. Solution cast films of pureEPDM samples were used for different characterizationtechniques. 1H-NMR, and 13C-NMR were used for assess-ing the comonomer ratios and LCB. Size exclusion chro-matography (SEC) equipped with triple detector systemwas used to determine the molar mass (both absolute and
relative) and polydispersity index (PDI). Presence ofbranching was also detected using sec-viscometry. Rheo-logical analysis has also been used for characterizing LCB.Finally, on the basis of the experimental findings and theavailable theories, an attempt was made to identifythe chemical nature and degree of LCB. This study revealsthe possibility of detailed characterization of moleculararchitecture of EPDM containing LCB by comparing with anessentially linear EPDM in light of an existing theory. VVC 2009Wiley Periodicals, Inc. J Appl Polym Sci 113: 2962–2972, 2009
Key words: elastomers; EPDM; long chain branching;NMR; polymers; rheology; size exclusion chromatography
INTRODUCTION
Ethylene-propylene-diene rubbers (EPDM) are usedfor several outdoors applications e.g., in the build-ing, construction, engineering, and automotive sec-tors by virtue of their resistance to oxygen, ozone,heat, and UV because of the saturated hydrocarbonbackbone.1 One of the most important grades ofEPDM is with 5-ethylidene-2-norborene (ENB) as adiene and the typical chemical structure is shown inScheme 1.
With metallocene catalysts, it possible to synthe-size ethylene, propylene, and other higher a-olefinecopolymers with narrow and unimodal chemical
composition distribution (CCD) compared to bi-modal and nonuniform CCD obtained by Ziegler-Natta catalysts.2,3 Moreover, metallocene catalyst canalso be used to synthesize a copolymer containinglong-chain branching (LCB). The term LCB attributesto the configuration of a polymer molecule possess-ing side chains with a degree of polymerization,which are capable to entangle with each other (i.e.,molar mass of the side chain is above the entangle-ment molar mass of the polymer). LCB introductionin polymer using metallocene catalysts increases theshear thinning and melt elasticity, while keeping themolar mass distribution (MWD) or PDI typicallybetween 2.0 and 2.5.2,3 Rubbers made with metallo-cene catalysts combine the excellent mechanicalproperties and good processibility.4–6 Therefore, LCBcontaining rubber results in excellent filler disper-sion, smooth surface finishes, and form stabilityalong with consistent mechanical properties. Severalnew grades of EPDM are commercially available,which contain controlled LCB with narrow PDI andhigher molar mass.4–6 It is also claimed that some ofthese new grades having high molar mass and con-trolled LCB could behave as a high ENB contentEPDM (which is one of the costly grades ofEPDM).5,6 This could result in higher state of curing
Journal ofAppliedPolymerScience,Vol. 113, 2962–2972 (2009)VVC 2009 Wiley Periodicals, Inc.
*Present address: GE Global Research, SABIC InnovativePlastics Program, John F Welch Technology Centre (GEIndia Technology Centre Pvt. Ltd.), 122, EPIP, Phase 2,Hoodi Village, Whitefield Road, Bangalore 560066, India.
Correspondence to: S. Mitra ([email protected]).Contract grant sponsor: MONEPOL (Danish Centre for
the Study of Polymer Degradation and Stability); contractgrant number: 2000-603/4001-51.

at a relatively low level of unsaturations and makepossible to develop a cost efficient formulation withenabled properties.5,6
Unfortunately, the information on the degree andchemical nature of LCB in EPDM is not availablefrom the manufacturer because of trade secrecy.Interestingly, several methods are reported in the lit-eratures for characterizing vis-a-vis quantifying thedegree and nature of LCB in polyolefins.2,3 How-ever, limited information on quantifying LCB ofEPDM using rheology, 13C-NMR, and SEC study areavailable.7–11 In most of these cases either LCB iswell defined as the polymer is synthesized in a con-trolled lab scale or several known model polymersare considered to quantify the nature and degree ofLCB7–10 and establish the structure property.12–14
However, it is really challenging to characterize theLCB of a pure rubber without having knowledge onthe chemistry of branching (and without having amodel system) and thus often forces to rely on theavailable data.
The objective of this present study is to character-ize and quantify the LCB of a pure EPDM rubber.This is accomplished by the help of an essentiallylinear EPDM containing no or insignificant branch-ing and that too from different manufacturer withdifferent molar mass but having similar comonomercompositions and PDI. This resembles with a typicalproblem of quantifying LCB vis-a-vis branchingarchitecture without knowing much about theunderlying chemistry with regard to LCB.
EXPERIMENTAL
Materials
The details of the EPDM types used in this studyare given in Table I. E-1 was NordelVR IP 4520 fromThe Dow Chemical Company,15 and E-2 wasKeltanVR 8340A from DSM Elastomer, Netherland.16
AVK Gummi A/S, Denmark, provided EPDMsamples.Thin films of EPDM were prepared by dissolving
E-1 and E-2 in n-heptane (concentrations �0.05g/mL) at room temperature. Solution cast films weremade on glass Petri dishes by pipetting 50 mL andallowed to dry at room temperature for 3 days. Thefilms were peeled off and rinsed with methanol. Thefilm thicknesses were 1.0–1.2 mm. These films wereused for characterization.Table II shows the details of EngageVR 8400 (ethyl-
ene-octene copolymer) obtained from The DowChemical Company (Midland, MI).17 It was includedin this study to compare and contrast the rheologyand NMR data, as it contains a known amount ofwell-defined hexyl branching. This is to support ourassumption on the essentially linear structure of E-1and establish our postulations on branching.
Size exclusion chromatography
The absolute molar mass (mass average, Mw; andnumber average, Mn) and polydispersity index (Mw/Mn, PDI) of the EPDM were measured using SEC.EPDM films were dissolved in tetrahydrofuran(THF) at room temperature for 24 h for SEC study.Before SEC experiments, samples were heated to50�C for 4 h. The sample solutions were filteredthrough 13 mm Whatman GD/X filters (0.45 lmpore size). One hundred microliters of the samplesolution (concentration of approximately 2 mg/mL)was injected onto the chromatographic system con-sisting of a precolumn, a Waters Styragel HT 6E 7.8� 300 mm and a PL gel Mixed-D 7.5 � 300 mm,operated at room temperature. Differential refractiveindex (DRI), viscometry and light scattering (LS)
TABLE ICharacterization of the EPDM Rubbers Used in the Study
EPDM typeEthylenea
(wt %)ENBa
(wt %) BranchingbMolar masscMw
(kg/mol) Mw/Mnc
Molar massdMw
(kg/mol)
E-1 50 5.0 � 0.5 – 202 2.74 133E-2 55 5.0 � 0.5 Long chain 376 2.80 258
a Verified by 1H-NMR study.b Verified by rheology experiments (frequency sweep) using parallel-plate geometry.c Based on calibration with narrow molar mass distribution polystyrene standards.d Absolute value measured by size exclusion chromatography (SEC) using a calculated dn/dc ¼ 0.077 for EPDM in
tetrahydrofuran at 20�C.
Scheme 1 Representative chemical structure of EPDMcontaining ENB as a diene.
STRUCTURAL DETERMINATION OF EPDM 2963
Journal of Applied Polymer Science DOI 10.1002/app

signals were obtained by using a Viscotek 200 DRI-detector, a Viscotek LD-600 and RALLS-detector, re-spectively, at room temperature. A calibration curvefor the column was also determined based on theanalysis of a narrow molar mass distribution poly-styrene standards having molar masses between2,050,000 and 3250. THF was used as eluent with aflow rate of 1 mL/min. The pump used was Shi-madzu LC-10AD type and the auto injectoremployed was Shimadzu SIL-10 Advp.
NMR spectroscopy
The relative diene (ENB), ethylene (e), and propyl-ene (p) content of each EPDM were determined by1H-NMR using a Bruker 250 MHz spectrometer atroom temperature. The measurements were per-formed using 10% (w/v) solutions of rubber filmsdissolved in 1,2-dichlorobenzene-d4 (Deutero GmbH,Germany). Sixteen scans were averaged for each ofthe 1H experiments. Similarly, the characterizationsfor comonomer compositions and LCB were deter-mined by 13C-NMR on the same instrument at 75MHz. 13C spectra were run as 10% solutions in 1,2-dichlorobenzene-d4 (Deutero GmbH, Germany).Scans of 1024 were averaged for the 13C experi-ments. To increase the signal to noise ratio, the 13Cspectrum of E-2 was rerun for longer time, where51,200 scans were averaged.
Rheology
LCB for rubber films was characterized by runningthe frequency sweep Rheology experiments. A Rheo-metrics RMS-800 spectrometer were used employingparallel plate (diameter 25 mm) geometry at 2%strain over the temperature range of 40–100�C withan interval of 20�C within a frequency range of 0.01–100 rad/s. To check possible degradation effectsduring experiments, measurements were repeatedseveral times. In all cases variations among measure-ments were negligible. Storage (G0) and loss moduli(G00) were determined for the various temperaturesover the entire frequency ranges for each sample.The zero-shear viscosity (go) and the loss angle (d�)were measured for each samples at 100�C.
RESULTS AND DISCUSSION
Size exclusion chromatography
The results of the SEC characterization are summar-ized in Table I. Conventional calibration was usedfor SEC to estimate molar mass and the width of themolar mass distribution or PDI. An absolute valueof Mw was obtained by using simultaneous LS andDRI detection. The dn/dc (mL/g) for the EPDM-THFsystem necessary to calculate the absolute molarmass was estimated to be 0.077.18 The Mw and Mw/Mn values obtained agree well with the reported val-ues.4–6,15,16 Mw of E-2 is found approximately 1.9times higher than that of E-1. However, no signifi-cant difference in PDI (Mw/Mn) of E-1 and E-2 isobserved.The linear intrinsic viscosity/molar mass relation-
ships are obtained from Visometry/SEC analysisand Mark-Houwink (MH) plots for E-1 and E-2 areshown in Figure 1. MH constants e.g., a for E-1(0.69) agrees with the value reported for the linearEPDM18 and a for E-2 (0.475) reveals a dense struc-ture in solution due to presence of high degree ofLCB. It is quite interesting to note from Figure 1 thatat molar mass of around 100 kg/mol, the intrinsicviscosity of E-1 is lower than the E-2. This indicatesthat the degree of LCB increases with the increase inmolar mass of E-2 that, however, does not affect thePDI to a significant extent. This could also attribute
Figure 1 Mark-Houwink plot of E-1 and E-2 as obtainedfrom SEC/viscometry. [Color figure can be viewed in theonline issue, which is available at www.interscience.wiley.com.]
TABLE IIMaterial Properties of Engage
VR840017
Engage 8400 Octene contentaDensity(g/cm3)
Melting pointb
(�C)Tg
b
(�C)% Total
crystallinity
Ethylene-octene copolymer �40 wt % 0.870 60 �55 21
a Verified by NMR study.b Verified by DSC (rate of heating 10�C/min).
2964 MITRA ET AL.
Journal of Applied Polymer Science DOI 10.1002/app

to a substantial difference in the ethylene to propyl-ene ratio either by original comonomer compositionsof E-1 and E-2 or by presence of LCB in E-2. Signifi-cance of this observation is elaborated later.
NMR spectroscopy
The 1H-NMR spectra of Engage 8400 is shown inFigure 2(a). Assuming Engage 8400 is a copolymerof ethylene and 1-octene, the terminal methyl (CH3)resonance of the octene unit appears around 1.04
ppm. Because the terminal CH3 peak representsthree protons, the methylene (CH2) groups in thependant hexyl group account for 10 protons. Thisleaves �35 protons in the main chain. In otherwords, there are about 17 CH2 groups plus 1methine (CH) group in the main chain for eachhexyl side chain. Because each octene unit contrib-utes three protons (1 CH2 and 1 CH) in the mainchain, there are 16 CH2 groups per octene unit, giv-ing a mole ratio of 8 : 1 (ethylene : octane). Thisagrees with product data sheet (Table II).17 The 13C-
Figure 2 NMR spectra of EngageVR
8400 (a) 1H and (b) 13C.
STRUCTURAL DETERMINATION OF EPDM 2965
Journal of Applied Polymer Science DOI 10.1002/app

NMR spectrum is in accordance with such a struc-ture [Fig. 2(b)]. The large peak at 30 ppm representsthe CH2 groups in the main chain, whereas the sidechains give rise to peaks at 13.9, 22.8, 27, 30.4, 32.1,34.1, and 37.8 ppm. The CH protons at the branchpoints yield the small peak at 30.35 ppm. The mostdiagnostic peak is the one at 13.9 ppm originatingfrom the CH3 protons at the end of the hexyl/longerside chains.19 All the 13C resonances have beenassigned in Figure 2(b).20,21
The 1H-NMR spectrum of E-1 is very similar tothe Engage 8400, shown in Figure 3(a). The doubletat 1.1 ppm is due to the methyl groups in the pro-pylene units while the large singlet centred around1.5 ppm are due to all of the methylene groups plus1 methine group at branch point. The intensity ofthe methylene protons compared with the methylprotons is much less in E-1. The integrals indicate 4–5 methylene groups per methyl groups. Each propyl-ene unit takes out two of these methylenes leaving
Figure 3 NMR spectra of E-1 (a) 1H and (b) 13C.
2966 MITRA ET AL.
Journal of Applied Polymer Science DOI 10.1002/app

2–3 for the ethylene groups. A rough estimate wouldthen be 1–2 ethylene units per propylene group. 13Cspectrum of E-1 [Fig. 3(b)] is a combination of theEngage 8400 and a typical ethylene-propylene copol-ymer. In Figure 3(b) no resonance is observedaround 14 ppm, which signifies the absence of anyterminal methyl from a long- and short-chainbranches. This also indicates that the terminalmethyl from the ENB units is absent probablybecause of very low concentration (less than 2 mole%) of the ENB units in the studied EPDM.
The 1H-NMR of E-2 is given in Figure 4 is verysimilar to that of E-1. The integrals indicate � 6methylene groups per methyl group. The 13C spec-trum of E-2 shown in Figure 5 is also similar to thatof E-1 with some additional peaks. The spectrumshown in Figure 5 was run for a much longer time(51,200 scans were averaged). The small peakaround 13.8 ppm is due to the presence of terminalCH3 protons in a hexyl or longer side chain, whichis only possible if the polymer had a significant frac-tion of hexyl or longer pendant groups. The CH3
peak of the ENB unit appears also at the same posi-tion. The peak from the pendant CH3 group of pro-pylene unit appears at 19.9 ppm. It is important tonote that the intensity of the CH3 peak of propyleneunit is much more than that of terminal CH3 from apendant hexyl (or longer) unit, which signifies thatonly a fraction of side chains are long units. ForLCB, the carbons at the branch point and at a and bpositions with respect to the branch point can alsobe identified from the 13C spectrum. The peaks at
33.3 and 37.3 ppm are due to the methine branchpoint, and a carbon with respect to the branch point,respectively. The most striking feature of this spec-trum is the low intensity of the signal from the mainchain (CH2) repeat units (dþdþ) at 29.9 ppm. This isdue to extensive branching of the main chain (bothshort and long chain), which is further supported byrheology study. The major peaks were assigned inFigure 5. Note that due to the presence of bothmethyl and LCB, two different sets of chemical shiftarises, which are shown in two structures in Figure5.20,21 Because the methyl branch is predominating,the high intensity peaks are due to this kind ofbranch units. The type of branching has no influenceon the carbons that are three or more bonds awayfrom the branch points and that is why the chemicalshift of c/cdþ carbons are identical in both type ofbranch structures. The 1H spectrum of E-2 is notinterpreted in a quantitative manner (as in case of E-1) due to this extensive branching.The concentration of ENB estimated from 1H-
NMR study22 agrees well with the value reported bythe manufacturers15,16 for E-1 and E-2 (Table I). Theamount of ENB present in E-1 and E-2 is found com-parable within the limit of experimental error.An idealized structure of ethylene (e) propylene
(p) rubber (4 : 2) in a regular e-e-p pattern is shownbelow in Figure 6(a). The chemical shift values andassignments were made with the program Chem-DrawVR Ultra. If we change the structure to a blocktype with the propylene groups together the ideal-ized spectrum changes dramatically [Fig. 6(b)]. The
Figure 4 1H-NMR spectra of E-2.
STRUCTURAL DETERMINATION OF EPDM 2967
Journal of Applied Polymer Science DOI 10.1002/app

actual EPDM 13C spectra are more plausibly in ac-cordance with the regular e-e-p structure [Fig. 6(a)].Otherwise, we could have noticed the peak at 44.1ppm due to methylene groups in between twomethine carbons. This grouping only occurs withpropylene–propylene pairs situated next to eachother. But, that signal is not observed in the twoEPDM spectra [Figs. 3(b) and 5] ruling out the possi-bility of p-p type pairs in the structure.
Rheology
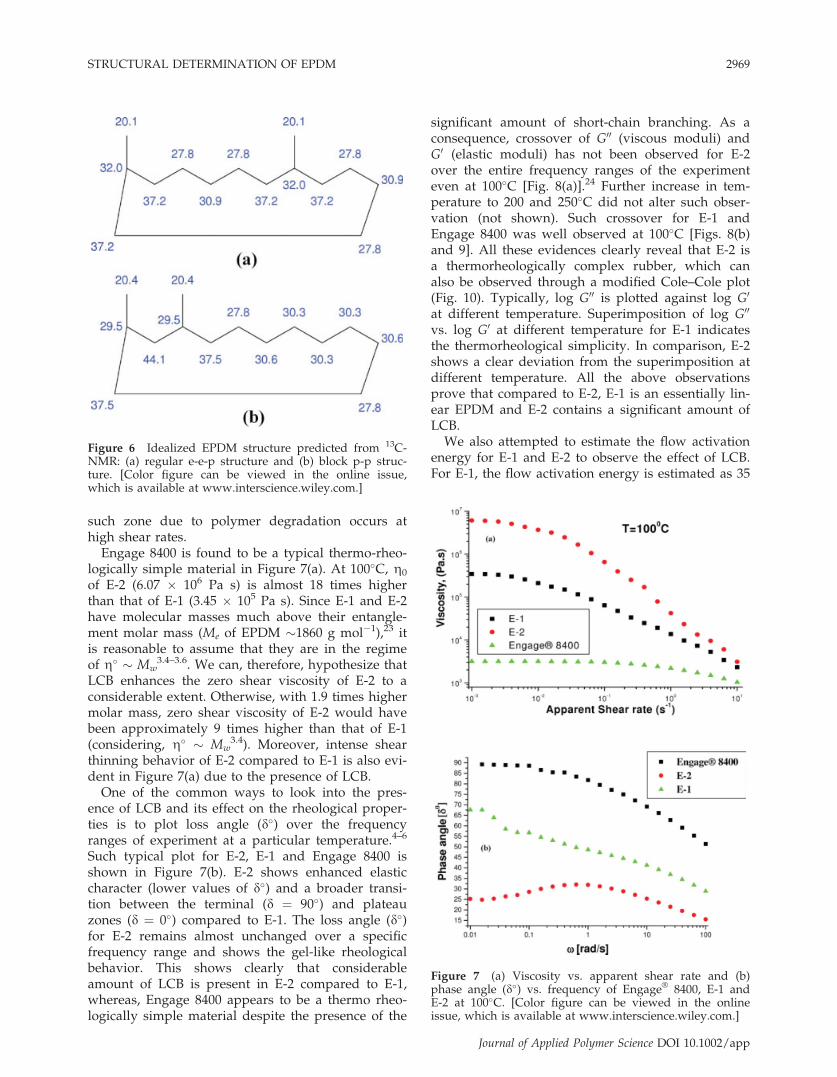
The zero shear viscosity (g�) values obtained fromthe rheology experiments (viscosity vs. apparentshear rate) conducted at 100�C for Engage 8400, E-1and E-2 are shown in Figure 7(a). For polymeric
liquids, viscosity dependence on shear rate can, ingeneral, be described by such ‘‘viscosity’’ curvesshown in Figure 7(a). For sufficiently low shear ratevalues, viscosity becomes independent of shear rate,i.e., the material exhibits Newtonian behavior. Thislimiting viscosity is called the zero shear viscosity(g0). At this zone, the polymer behaves as linear vis-cous where any alignment is destroyed by randomthermal motion. With increasing the shear rate, sig-nificant alignment results in a decrease in viscositywhere the steady state alignment is achieved andwith more alignment the material flows faster. Withfurther increase in shear rate the viscosity curve lev-els out, and the material tends toward Newtonianbehavior again. However, for most polymericliquids, it is impossible to determine experimentally
Figure 5 13C-NMR spectra of E-2 and assignment of LCB and EPDM.
2968 MITRA ET AL.
Journal of Applied Polymer Science DOI 10.1002/app
such zone due to polymer degradation occurs athigh shear rates.
Engage 8400 is found to be a typical thermo-rheo-logically simple material in Figure 7(a). At 100�C, g0
of E-2 (6.07 � 106 Pa s) is almost 18 times higherthan that of E-1 (3.45 � 105 Pa s). Since E-1 and E-2have molecular masses much above their entangle-ment molar mass (Me of EPDM �1860 g mol�1),23 itis reasonable to assume that they are in the regimeof g� � Mw
3.4–3.6. We can, therefore, hypothesize thatLCB enhances the zero shear viscosity of E-2 to aconsiderable extent. Otherwise, with 1.9 times highermolar mass, zero shear viscosity of E-2 would havebeen approximately 9 times higher than that of E-1(considering, g� � Mw
3.4). Moreover, intense shearthinning behavior of E-2 compared to E-1 is also evi-dent in Figure 7(a) due to the presence of LCB.
One of the common ways to look into the pres-ence of LCB and its effect on the rheological proper-ties is to plot loss angle (d�) over the frequencyranges of experiment at a particular temperature.4–6
Such typical plot for E-2, E-1 and Engage 8400 isshown in Figure 7(b). E-2 shows enhanced elasticcharacter (lower values of d�) and a broader transi-tion between the terminal (d ¼ 90�) and plateauzones (d ¼ 0�) compared to E-1. The loss angle (d�)for E-2 remains almost unchanged over a specificfrequency range and shows the gel-like rheologicalbehavior. This shows clearly that considerableamount of LCB is present in E-2 compared to E-1,whereas, Engage 8400 appears to be a thermo rheo-logically simple material despite the presence of the
significant amount of short-chain branching. As aconsequence, crossover of G00 (viscous moduli) andG0 (elastic moduli) has not been observed for E-2over the entire frequency ranges of the experimenteven at 100�C [Fig. 8(a)].24 Further increase in tem-perature to 200 and 250�C did not alter such obser-vation (not shown). Such crossover for E-1 andEngage 8400 was well observed at 100�C [Figs. 8(b)and 9]. All these evidences clearly reveal that E-2 isa thermorheologically complex rubber, which canalso be observed through a modified Cole–Cole plot(Fig. 10). Typically, log G00 is plotted against log G0
at different temperature. Superimposition of log G00
vs. log G0 at different temperature for E-1 indicatesthe thermorheological simplicity. In comparison, E-2shows a clear deviation from the superimposition atdifferent temperature. All the above observationsprove that compared to E-2, E-1 is an essentially lin-ear EPDM and E-2 contains a significant amount ofLCB.We also attempted to estimate the flow activation
energy for E-1 and E-2 to observe the effect of LCB.For E-1, the flow activation energy is estimated as 35
Figure 6 Idealized EPDM structure predicted from 13C-NMR: (a) regular e-e-p structure and (b) block p-p struc-ture. [Color figure can be viewed in the online issue,which is available at www.interscience.wiley.com.]
Figure 7 (a) Viscosity vs. apparent shear rate and (b)phase angle (d�) vs. frequency of EngageV
R
8400, E-1 andE-2 at 100�C. [Color figure can be viewed in the onlineissue, which is available at www.interscience.wiley.com.]
STRUCTURAL DETERMINATION OF EPDM 2969
Journal of Applied Polymer Science DOI 10.1002/app

kJ/mole (agrees well with cited value in the litera-ture) using time–temperature superposition. Becauseof thermorheological complexity owing to the pres-ence of extensive LCB in E-2, the time–temperaturesuperposition did not exist and hence could not esti-mate the flow activation energy of E-2.
LCB estimation
The MH equations from the Viscometry/SEC for theE-1 is [g]THF ¼ 4.027 � 10�4 M0:690
w and for E-2 is[g]THF ¼ 4.831 � 10�3 M0:475
w . Interestingly, Grotoand Grasseley23 proposed [g]THF ¼ 3.88 � 10�4
M0:686w for a linear hydrogenated polyisoprene (i.e.,
equivalent to an alternating ethylene propylene rub-ber of � 1 : 1 e : p having an essentially linear struc-ture) which is very close to the value we obtainedfor E-1. This, therefore, indicates that Groto andGrassley’s findings23 for linear hydrogenated polyi-soprene rubber is applicable to E-1. Furthermore,their proposed relation on zero shear viscosity andmolar mass at 100�C i.e., [g]0 ¼ 4.86 � 10�4 M3:48
w
could also be applied for E-1.23 Using Mw of E-1 esti-mated from the SEC the above equation yields g0 ¼
3.29 � 105 Pa s. The experimental value for E-1 at100�C obtained from the rheology experiment is 3.45� 105 Pa s, which is very close and thus validatesour hypothesis on the essential linear nature of E-1.To quantify the degree of LCB in E-2, following
assumptions are made, which seems reasonable con-sidering all the results:
I. E-1 is an essential linear polymerII. The comonomer composition (e/p/ENB) is
practically identical for E-1 and E-2 and majordifferences are in molar mass and LCB
When compared in the same environment (tem-perature and solvent), a branched polymer has ahigher segment density and a lower hydrodynamicvolume than that of a linear polymer of equal molar
Figure 8 Storage (G0) and loss (G00) moduli from fre-quency sweep at 100�C: (a) E-2 and (b) E-1. [Color figurecan be viewed in the online issue, which is available atwww.interscience.wiley.com.]
Figure 9 Storage (G0) and loss (G00) moduli from fre-quency sweep at 100�C of EngageV
R
8400. [Color figure canbe viewed in the online issue, which is available atwww.interscience.wiley.com.]
Figure 10 Modified Cole–Cole plot of E-1 (solid symbols)and E-2 (open symbols) at different temperatures. [Colorfigure can be viewed in the online issue, which is availableat www.interscience.wiley.com.]
2970 MITRA ET AL.
Journal of Applied Polymer Science DOI 10.1002/app

mass. The mean square radius of gyration is a mea-sure of a polymer’s hydrodynamic volume. Conse-quently, the ratio of mean square radius of gyrationof a branched polymer to that of a linear polymer ofthe same molar mass in the identical environmentexpresses the degree of branching. The ratio g isreferred to as the index of branching or contractionfactor. Similarly, the ratio of the intrinsic viscosity ofa branched polymer to a linear polymer of equalmolar mass is conventionally denoted as g0. How-ever, quantifying the LCB frequency (number ofbranches per chain/molecule) using g-ratio methodsrequires several theoretical considerations.25 Theother traditional approach to LCB characterization isthrough counting branch points by means of 13CNMR in solution. This approach has a sensitivity li-mitation.25 Several other methods for LCB quantifi-cation for polymers are also available and many arebeing proposed in literatures.25,26 However, none ofthem are really straightforward and most of themrequire several model polymers or parameters toestimate the branching density especially for a poly-mer with unknown chemistry of LCB. So, the g-ratiomethod is chosen to quantify the density of LCB ofE-2 in this study.
MH equation obtained for E-1 could be used tocalculate the intrinsic viscosity of a hypothetical‘‘essentially linear’’ E-2 of identical Mw and PDIwhich is [g]L ¼ 2.19 dL/g. Since, E-2 actually con-tains significant amount of LCB, we obtained [g]B ¼1.55 dL/g from SEC/viscometry. From g0 ¼ [g]B/[g]L, we get g0 ¼ 0.7078. As per literature, g0 isrelated to g by an exponent factor b, g0 ¼ gb. It isnecessary to mention that much work has focus tounderstand the theoretical basis that relates g0 to mo-lecular parameters but still the dependence of g0 andg is not clearly understood.27 Moreover, the contrac-tion factor g is also dependent on molar mass anddegree of LCB (Fig. 1). But for simplicity and LCBfrequency calculation, we ignore such dependencewithin the ranges of mass average molar mass of E-1and E-2 (1.33 � 105 – 2.58 � 105). The value of b isreported to vary between 0.5 to 1.5 depending uponthe nature, type, and degree of branching as well asmolar mass and PDI.28 Generally, b is equal to 0.5for low levels of branching or for star polymers,whereas b is closer to 1.5 for comb-shaped polymers(very high degree of branching). Rheology and SECstudy revealed the presence of very high degree ofLCB in E-2. 13C-NMR study shows that LCBs arepredominantly trifunctional in nature. So, b ¼ 1.5 isa good approximation for our case.28 Hence, we getg ¼ 0.7942. Now, we can use the following equationfor trifunctional (f ¼ 3) branching, g ¼ [(1 þ m/7)1/2
þ 4m/9p]�1/2.29 Solving for m (the number of branchunit per molecule which is the LCB frequency), weget approximately 27 branches per rubber molecule.
However, if we consider g0 ¼ gb, where b ¼ (2 – e)and e is the exponential from the MH equation forthe linear analogue29 a total of 28 branches are esti-mated per rubber molecule. Hence, approximately27–28 branches (for b � 1.31 to 1.5) per rubber mole-cule are present in E-2 sample assuming only tri-functional branching is randomly distributed.This, therefore, indicates the presence of a comb
type branching architecture (highly branched) in E-2where branches are long enough to entangle witheach other. Considering approximately 27–28branches on an average per rubber molecule, the av-erage molar mass of the rubber chain between twosuccessive branching points would be well abovethe entanglement molar mass of EPDM. Thus, therubber chain in between two branch points can alsoplay a major role in entanglement to enhance theviscosity. The a-value obtained from MH equationfor E-2 indicates highly dense structure.27–31 Highlybranched type molecules at lower molar mass ac-quire higher intrinsic viscosity than their corre-sponding linear counterpart with same molar mass(Fig. 1).27–31 With higher conversion during polymer-ization, degree of branching increases with molarmass yet PDI remains unaffected because of the con-trolled nature of LCB introduced by the cata-lysts.31,32 Moreover, 13C-NMR did not show a highintensity peak for the main chain of E-2 even aftersignal averaging for a long time (51,200 scans wereaveraged for the 13C spectrum of E-2 in Fig. 5). Thisis only possible if there are very small numbers ofmethylene units (compared with E-1), which are 3 ormore carbons away from the branch point. There-fore, we can conclude that E-2 has a very highdegree of branching (possibly both short and longchain). As a consequence of high degree of LCBalong with high molar mass, several types of entan-glements e.g., between LCBs, between main chainsand among LCBs to main chains exist in E-2, whichcan act as physical crosslinks. This could be a reasonfor E-2 to behave like a lightly crosslink rubber ormicrogel, which is manifested by the dominance ofelastic moduli (G0) over viscous moduli (G00)throughout the frequency ranges in rheology experi-ments even at 250�C (not shown).24,32
Another point we would like to specify withregard to its behavior like high ENB grades leadingto higher state of crosslinking as claimed by E-2datasheet. Our previous work on the crosslinked E-1and E-2 confirm this to be true.33,34 Approximately,60% higher crosslinking density (both in sulphurand peroxide curing using the identical formulationsand conditions) is observed in E-2 compared to thatin E-1 despite the similar ENB content (�5 � 0.5 wt%). This is also attributed to the highly densebranched structure of E-2. High degree of LCBincreases the probabilities of both inter and intra
STRUCTURAL DETERMINATION OF EPDM 2971
Journal of Applied Polymer Science DOI 10.1002/app

molecular crosslinking that leads to increasing theoverall crosslinking density.
In a long-chain branched high molar mass poly-mer, well-entangled LCB suppress longitudinalmotion at low frequencies since the terminal relaxa-tion involves the movement of the entire molecule.Moreover, a further mechanism at higher frequen-cies is also needed to allow translation of a branchedmolecule. Long chain branch retraction to a morecompact structure has been proposed as such amechanism.35–40 These mechanisms were furtherexplored and the whole viscoelastic response wasfound to depend, not only on the LCB content, butalso on LCB structure and topology.40 The combina-tion of high molar mass together with high degreeof LCB makes E-2 a thermorhelogically complex andquite unique with regard to both melt and solutionproperties.
CONCLUSIONS
This work has clearly demonstrated that in-depthunderstanding on molecular architecture of anunknown EPDM rubber containing high degree ofLCB is possible even though the chemistry ofbranching is not known. Structural information onLCB containing EPDM is elucidated using SEC,NMR, and Rheology by the help of an essentiallylinear EPDM with similar comonomer compositionsbut with different molar mass. Both the studiedEPDM was found to have a regular e-e-p type back-bone as revealed by NMR study. E-1 is found to bethermorheologically simple rubber compared to E-2.On the basis of our experimental observations andtheoretical considerations, we predicted the presenceof high degree of LCB in E-2 and the branchingarchitecture was more likely to be a comb type. ForE-2, a of MH equation estimated from SEC/viscome-try matches with the reported values for other poly-mers containing high degree of LCB. Thequantification of degree of LCB using semiempiricalequations supports our notion while NMR validatesour postulation. With some reasonable assumption,this work furnishes the structural information ofEPDM containing high degree of LCB without priorinformation on the chemistry of branching vis-a-visits reason for behaving as a high ENB contentrubber.
The authors thank Lene Hubert, Lotte Neilsen, and Dr. SokolNdoni at the Danish Polymer Centre, Risø National Labora-tory, Denmark. Susanta and Debasish are indebted to Dr.Surendra Kulkarni, Dr. Adil Dhalla, and Dr. A.S. Radhak-rishna of GEGlobal Research, SABIC Innovative Plastics Pro-gram, Bangalore, India, for their continuous support andencouragement.
References
1. Cesca, S. J Polym Sci Part D: Macromol Rev 1972, 10, 2.2. Beigzadeh, D.; Soares, J. B. P.; Duever, T. A. Macromol Symp
2001, 173, 179.3. Vega, J.; Aguilar, M.; Peon, J.; Pastor, D.; Martınez-Salazar, J.
e-Polymers 2002, 46, 1.4. Booij, H. C. Kautsch Gummi Kunstst 1991, 44, 128.5. Beelen, H. J. H. Kautsch Gummi Kunstst 1999, 52, 406.6. Meijers, P. W. L. J.; Maag, L. R.; Beelen, H. J. H.; vande Ven,
P. M. Kautsch Gummi Kunstst 1999, 52, 663.7. Mitsuda, Y.; Schrag, J. L.; Ferry, J. D. J Appl Polym Sci 1974,
18, 193.8. Wang, W.-J.; Zhu, S.; Park, S.-J. Macromolecules 2000, 33, 5770.9. Kolodka, E.; Wang, W.-J.; Zhu, S.; Hamielec, A. E. Macromole-
cules 2002, 35, 10062.10. Wang, W.-J.; Ye, Z.; Fan, H.; Li, B.-G.; Zhu, S. Polymer 2004,
45, 5497.11. Scholte, T. G.; Meijerink, N. L. J.; Schoffeleers, H. M.; Brands,
A. M. G. J Appl Polym Sci 1984, 29, 3763.12. Beardsley, K. P.; Ho, C. C. J Elastomers Plast 1984, 16, 20.13. Kresge, E. N.; Cozewith, C.; Strate, G. V. Rubber Chem Tech-
nol 1985, 58, 180.14. Demaio, M.; Caldari, S.; Chiantore, O. Int J Polym Anal Char-
act 1999, 5, 85.15. Dow Chemical Company. Technical data and product infor-
mation sheet of NordelVR IP; Dow Chemical Company: MI.16. DSM Elastomer. Technical data and product information sheet
of KeltanVR ; DSM Elastomer: The Netherlands.17. Dow Chemical Company. Technical data sheet of EngageVR
8400; Dow Chemical Company: MI.18. Poche, D. S.; Brown, R. J.; Meiske, L. J Appl Polym Sci 2002,
85, 2178.19. Randall, J. C. J Polym Sci Polym Phys Ed 1973, 11, 275.20. Liu, W.; Rinaldi, P. L.; Mcintosh, L. H.; Quirk, R. P. Macromo-
lecules 2001, 34, 4757.21. Cheng, H. N. Macromolecules 1984, 17, 1950.22. Kolbert, A. C.; Didier, J. G. J Appl Polym Sci 1999, 71, 523.23. Harrell, E. R.; Nakajima, N. J Appl Polym Sci 1984, 29, 995.24. Groto, J. T.; Graessley, W. W. Macromolecules 1984, 17, 2767.25. Janzen, J.; Colby, R. H. J Mol Struct 1999, 485, 569.26. Shroff, R. N.; Mavridis, H. Macromolecules 1999, 32, 8454.27. Mckee, M. G.; Unal, S.; Wilkes, G. L.; Long, T. E. Prog Polym
Sci 2005, 30, 507.28. Bohdanecky, M. Macromolecules 1977, 10, 971.29. Zimm, B. H.; Stockmayer, W. H. J Chem Phys 1949, 17, 1301.30. Qiye, W.; Peng, L.; Jingxia, M.; Zhang, N.; Peng, A.; Jingan,
W. J Appl Polym Sci 2006, 101, 2847.31. Voit, B. J Polym Sci Part A: Polym Chem 2005, 43, 2679.32. Hempenius, M. A.; Zoetelief, W. F.; Gauthier, M.; Moller, M.
Macromolecules 1998, 31, 2299.33. Mitra, S.; Ghanbari-Siahkali, A.; Kingshott, P.; Rehmeier, H. K.;
Abildgaard, H.; Almdal, K. Polym Degrad Stab 2006, 91, 69.34. Mitra, S.; Ghanbari-Siahkali, A.; Kingshott, P.; Rehmeier, H.
K.; Abildgaard, H.; Almdal, K. Polym Degrad Stab 2006, 91,81.
35. Suneel, K.; Buzza, D. M. A.; Groves, D. J.; Mcleish, T. C. B.;Parker, D.; Keeney, A. J.; Feast, W. J. Macromolecules 2002, 35,9605.
36. Lohse, D. J.; Xenidou, M.; Schultz, D. N.; Milner, S. T.; Fetters,L. J.; Wright, P. J.; Hadjichristidis, N.; Latrou, H.; Pitsikalis,M.; Poulos, Y.; Avgeropoulos, A.; Sioula, S.; Paraskeva, S.;Velis, G.; Mendelson, R. A.; Garcia-Franco, C. A.; Lyon, M. K.;Sun, T.; Ruff, C. J. Polym Mater Sci Eng 2000, 82, 123.
37. Read, D. J.; Mcleish, T. C. B. Macromolecules 2001, 34, 1928.38. Mcleish, T. C. B.; Larson, R. G. J Rheol 1998, 42, 81.39. Pearson, D. S.; Helfand, E. Macromolecules 1984, 17, 2388.40. Larson, R. G. Macromolecules 2001, 34, 4556.
2972 MITRA ET AL.
Journal of Applied Polymer Science DOI 10.1002/app