Step-scan TMDSC and high rate DSC study of the multiple melting behavior of poly(1,3-propylene...
12
Step-scan TMDSC and high rate DSC study of the multiple melting behavior of poly(1,3-propylene terephthalate) George Z. Papageorgiou a , Dimitris S. Achilias a , George P. Karayannidis a, * , Dimitris N. Bikiaris a , Christos Roupakias a , George Litsardakis b a Laboratory of Organic Chemical Technology, Department of Chemistry, Aristotle University of Thessaloniki, GR-541 24 Thessaloniki, Macedonia, Greece b Laboratory of Materials for Electrotechnics, Department of Electrical and Computer Engineering, Aristotle University of Thessaloniki, GR-541 24 Thessaloniki, Macedonia, Greece Received 10 November 2004; received in revised form 3 February 2005; accepted 13 July 2005 Available online 25 August 2005 Abstract The multiple melting behavior of poly(1,3-propylene terephthalate) (PPT) samples after isothermal crystallization from the melt was studied. The step-scan temperature-modulated differential scanning calorimetry (TMDSC) and high rate DSC were used to investigate this behavior in conjunction with standard DSC, wide-angle X-ray diffraction (WAXD) and polarizing light microscopy (PLM). The effect of PPT average molecular weight on the melting was also examined. In general multiple endotherms after isothermal crystallization of PPT were attributed to a continuous crys- tal perfection process during the subsequent heating scan via melting–recrystallization–remelting. Multiple melting behavior was more pronounced for the low molecular weight PPT. Step-scan TMDSC showed that extensive recrystal- lization occurs in PPT samples, especially after rapid isothermal crystallization. In fact two recrystallization exothermic peaks were observed. High rate DSC revealed the initial morphology generated during the isothermal step and showed that the low and middle peaks are associated with melting of primary crystals while the high temperature peak should be attributed to melting of recrystallized material. Ó 2005 Elsevier Ltd. All rights reserved. Keywords: Poly(trimethylene terephthalate) (PTT); Poly(propylene terephthalate) (PPT); Differential scanning calorimetry (DSC); Temperature-modulated DSC (TMDSC); Multiple melting 1. Introduction Crystallization and melting behavior of engineering plastics are very important in polymer technology. Since, morphological features of crystallizable polymers are controlled by kinetic and not by thermodynamic factors, metastability is always observed in polymers after cooling processes [1]. Multiple melting has been observed for polyesters such as poly(ethylene terephthal- ate) (PET) [2], poly(butylene terephthalate) (PBT) [3], poly(ethylene naphthalate) (PEN) [4–6], poly(butylene naphthalate) (PBN) [7], and other polymers like syn- diotactic polypropylene [8], syndiotactic polystyrene [9], and poly(arylene ether ether ketone) [10]. The 0014-3057/$ - see front matter Ó 2005 Elsevier Ltd. All rights reserved. doi:10.1016/j.eurpolymj.2005.07.005 * Corresponding author. Tel.: +30 2310 997814; fax: +30 2310 997769. E-mail address: [email protected] (G.P. Karayanni- dis). EUROPEAN POLYMER JOURNAL European Polymer Journal 42 (2006) 434–445 www.elsevier.com/locate/europolj
Transcript of Step-scan TMDSC and high rate DSC study of the multiple melting behavior of poly(1,3-propylene...
EUROPEAN
POLYMERJOURNALEuropean Polymer Journal 42 (2006) 434–445
www.elsevier.com/locate/europolj
Step-scan TMDSC and high rate DSC study of themultiple melting behavior of poly(1,3-propylene terephthalate)
George Z. Papageorgiou a, Dimitris S. Achilias a, George P. Karayannidis a,*,Dimitris N. Bikiaris a, Christos Roupakias a, George Litsardakis b
a Laboratory of Organic Chemical Technology, Department of Chemistry, Aristotle University of Thessaloniki,
GR-541 24 Thessaloniki, Macedonia, Greeceb Laboratory of Materials for Electrotechnics, Department of Electrical and Computer Engineering, Aristotle University of Thessaloniki,
GR-541 24 Thessaloniki, Macedonia, Greece
Received 10 November 2004; received in revised form 3 February 2005; accepted 13 July 2005Available online 25 August 2005
Abstract
The multiple melting behavior of poly(1,3-propylene terephthalate) (PPT) samples after isothermal crystallizationfrom the melt was studied. The step-scan temperature-modulated differential scanning calorimetry (TMDSC) and highrate DSC were used to investigate this behavior in conjunction with standard DSC, wide-angle X-ray diffraction(WAXD) and polarizing light microscopy (PLM). The effect of PPT average molecular weight on the melting was alsoexamined. In general multiple endotherms after isothermal crystallization of PPT were attributed to a continuous crys-tal perfection process during the subsequent heating scan via melting–recrystallization–remelting. Multiple meltingbehavior was more pronounced for the low molecular weight PPT. Step-scan TMDSC showed that extensive recrystal-lization occurs in PPT samples, especially after rapid isothermal crystallization. In fact two recrystallization exothermicpeaks were observed. High rate DSC revealed the initial morphology generated during the isothermal step and showedthat the low and middle peaks are associated with melting of primary crystals while the high temperature peak shouldbe attributed to melting of recrystallized material.� 2005 Elsevier Ltd. All rights reserved.
Keywords: Poly(trimethylene terephthalate) (PTT); Poly(propylene terephthalate) (PPT); Differential scanning calorimetry (DSC);Temperature-modulated DSC (TMDSC); Multiple melting
1. Introduction
Crystallization and melting behavior of engineeringplastics are very important in polymer technology.
0014-3057/$ - see front matter � 2005 Elsevier Ltd. All rights reservdoi:10.1016/j.eurpolymj.2005.07.005
* Corresponding author. Tel.: +30 2310 997814; fax: +302310 997769.
E-mail address: [email protected] (G.P. Karayanni-dis).
Since, morphological features of crystallizable polymersare controlled by kinetic and not by thermodynamicfactors, metastability is always observed in polymersafter cooling processes [1]. Multiple melting has beenobserved for polyesters such as poly(ethylene terephthal-ate) (PET) [2], poly(butylene terephthalate) (PBT) [3],poly(ethylene naphthalate) (PEN) [4–6], poly(butylenenaphthalate) (PBN) [7], and other polymers like syn-diotactic polypropylene [8], syndiotactic polystyrene[9], and poly(arylene ether ether ketone) [10]. The
ed.
G.Z. Papageorgiou et al. / European Polymer Journal 42 (2006) 434–445 435
interpretation of multiple melting endotherms observedin differential scanning calorimeter (DSC) traces of semi-crystalline polymers is difficult. The most common con-cepts invoked to explain the multiple melting behaviorof polymers are the melting of crystals of differentstability (dual morphology mechanism) [11], and themelting–recrystallization–remelting process (reorganiza-tion mechanism) [12]. The dual morphology mechanismis based on the evidence of two or more different crystal-line structures existing in the crystallized polymers i.e.(a) two or more crystal modifications, (b) at least twopopulations of lamellae of different stabilities, or (c) dif-ferent crystalline morphologies [13–17]. The reorganiza-tion mechanism suggests that crystallization producesinitially crystals of lower degree of perfection or thinnerlamellae, which can melt and recrystallize during theheating scan to yield crystals of better perfection orgreater thickness [18].
Recently, triple melting behavior was reported forpoly(1,3-propylene terephthalate) (PPT) [19], a polyesterwhich became commercially available only a few yearsago, due to limitations in production of 1,3-propanediol[20]. The origin of the multiple endotherms of PPT wasstudied primarily with conventional DSC technique.Also, multiple melting was correlated with ringedspherulites formed during isothermal crystallization atvarious temperatures [21]. In a previous work we ana-lyzed the multiple melting behavior of poly(ethylenenaphthalate) (PEN) poly(butylene naphthalate) (PBN)and their copolymers using conventional DSC [6].
Step-scan DSC is a temperature-modulated DSCtechnique that operates, in conjunction with the power-compensation DSC. The approach applies a series ofshort interval heating and isothermal steps to cover thetemperature range of interest. This requires a DSC withvery fast responsiveness to achieve short interval linearand isothermal steps. The use of ultra low mass furnaceswith the power-compensation DSC ensures very fast re-sponse time. With the step-scan DSC approach, two sig-nals are obtained. Thermodynamic Cp signal representsthe reversible aspects of the material, while the isother-mal signal reflects the irreversible nature of the sampleduring heating. Because the sample is either heated orheld isothermally (true isothermal), the step-scan DSCapproach is straightforward [22]. High rate DSC is alsoapplicable with power-compensation DSC, since highresolution and low thermal lag is required. High ratesof 100 �C/min up to 500 �C/min minimize time forchanges in morphologies of the samples during scanningand thus the original morphology can be effectively de-tected [23].
The aim of this work is to thoroughly analyze themelting behavior of PPT using new DSC techniques,such as the step-scan (temperature-modulated) DSCand the high rate DSC, in parallel to conventionalDSC, wide-angle X-ray diffraction (WAXD) and polar-
izing light microscopy (PLM). This combination oftechniques offers a powerful tool to study the thermalbehavior of polymers and approximates real conditionsof polymer processing. Furthermore, two polyesters ofdifferent molecular masses were used in order to clarifythe effect of molecular weight on the melting behaviorof PPT.
2. Experimental
2.1. Materials
PPT samples were synthesized from terephthalic acid(TPA) and 1,3-propanediol (1,3-PDO). TPA was ob-tained from Fluka (purityP 99%) and 1,3-PDO was agift from Du Pont de Nemours. Synthesis was describedin details in our previous paper [20]. The intrinsic viscos-ities of the resins were measured in a mixed solvent ofphenol/1,1,2,2-tetrachloroethane 60/40 w/w at 25 �Cusing an Ubbelhode viscometer and they were foundequal to 0.40 and 0.69 dL/g for the two polyester sam-ples. From these values the weight average molecularweight of each sample was calculated according to theequation ½g� ¼ 5:36� 10�4M0:69
w provided by Chuahet al. [24] and they were found to be 14,500 and 32,500,respectively. These two polyesters will be referred in thefollowing paper as low molecular weight PPT (LMW-PPT) and high molecular weight PPT (HMW-PPT).
2.2. Differential scanning calorimetry
To perform all the DSC analyses a Perkin–ElmerPyris 1 differential scanning calorimeter supplied withproper software was used. The instrument was calibratedusing high purity indium and zinc standards. Samples ofabout 5 mg were used in most cases for standard DSCanalysis. Isothermal crystallization tests were performedin the instrument, at temperatures from 170 to 209 �C.The samples, sealed in aluminium pans, were initiallymelted at 270 �C for 5 min to erase all previous thermalhistory, and then cooled at a rate 300 �C/min till 20 �Cabove the crystallization temperature and finally at a rate40 �C/min to the desired crystallization temperature.This cooling process was followed in order to achievebetter equilibrium of the instrument before crystalliza-tion begins, according to the instrument supplier�s guide-lines for optimizing conditions for crystallization tests. Afresh sample was used for each test. Tests were performedunder a nitrogen atmosphere. Gas flow rate was 20 mL/min. Melting for only 5 min was decided to prevent ther-mal or hydrolytic degradation of the polyesters.
Step-scan (temperature-modulated) DSC study wascarried out using the Pyris 1 DSC and the step-scan soft-ware. For step-scan DSC study, samples of 5 mg wereused. These samples were crystallized following the
20 25 30 35
Tc=182oC heat to 212oC
Tc=182oC
Tc=191oC
Tc=197oC
_104
_113
102
_102
012
_012
010
Inte
nsity
(a.
u.)
Angle 2θ (deg)
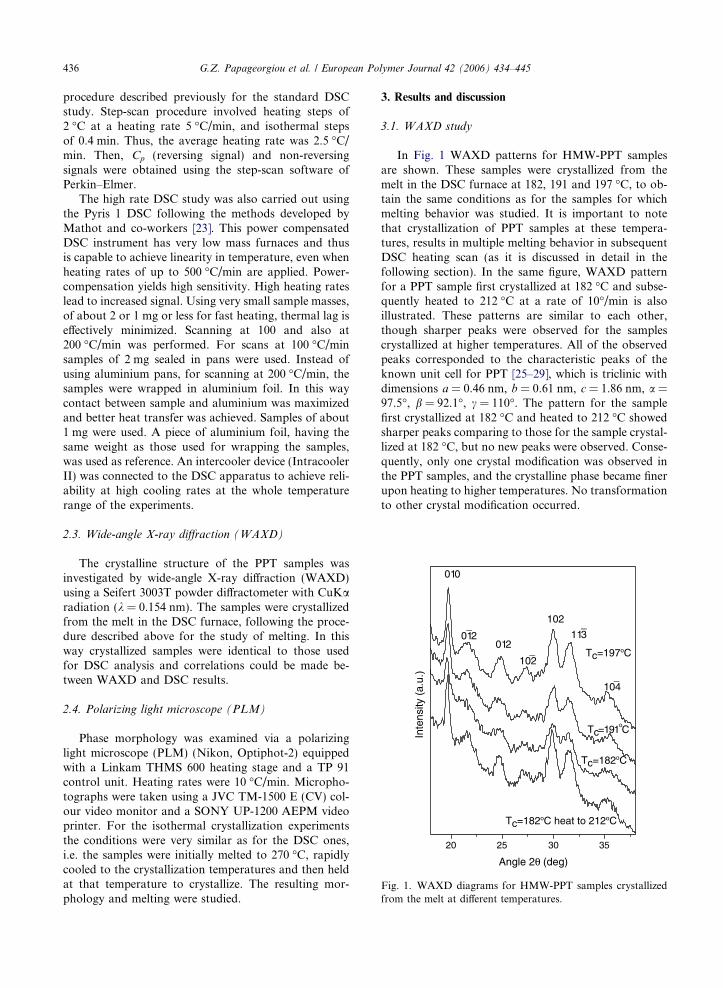
Fig. 1. WAXD diagrams for HMW-PPT samples crystallizedfrom the melt at different temperatures.
436 G.Z. Papageorgiou et al. / European Polymer Journal 42 (2006) 434–445
procedure described previously for the standard DSCstudy. Step-scan procedure involved heating steps of2 �C at a heating rate 5 �C/min, and isothermal stepsof 0.4 min. Thus, the average heating rate was 2.5 �C/min. Then, Cp (reversing signal) and non-reversingsignals were obtained using the step-scan software ofPerkin–Elmer.
The high rate DSC study was also carried out usingthe Pyris 1 DSC following the methods developed byMathot and co-workers [23]. This power compensatedDSC instrument has very low mass furnaces and thusis capable to achieve linearity in temperature, even whenheating rates of up to 500 �C/min are applied. Power-compensation yields high sensitivity. High heating rateslead to increased signal. Using very small sample masses,of about 2 or 1 mg or less for fast heating, thermal lag iseffectively minimized. Scanning at 100 and also at200 �C/min was performed. For scans at 100 �C/minsamples of 2 mg sealed in pans were used. Instead ofusing aluminium pans, for scanning at 200 �C/min, thesamples were wrapped in aluminium foil. In this waycontact between sample and aluminium was maximizedand better heat transfer was achieved. Samples of about1 mg were used. A piece of aluminium foil, having thesame weight as those used for wrapping the samples,was used as reference. An intercooler device (IntracoolerII) was connected to the DSC apparatus to achieve reli-ability at high cooling rates at the whole temperaturerange of the experiments.
2.3. Wide-angle X-ray diffraction (WAXD)
The crystalline structure of the PPT samples wasinvestigated by wide-angle X-ray diffraction (WAXD)using a Seifert 3003T powder diffractometer with CuKaradiation (k = 0.154 nm). The samples were crystallizedfrom the melt in the DSC furnace, following the proce-dure described above for the study of melting. In thisway crystallized samples were identical to those usedfor DSC analysis and correlations could be made be-tween WAXD and DSC results.
2.4. Polarizing light microscope (PLM)
Phase morphology was examined via a polarizinglight microscope (PLM) (Nikon, Optiphot-2) equippedwith a Linkam THMS 600 heating stage and a TP 91control unit. Heating rates were 10 �C/min. Micropho-tographs were taken using a JVC TM-1500 E (CV) col-our video monitor and a SONY UP-1200 AEPM videoprinter. For the isothermal crystallization experimentsthe conditions were very similar as for the DSC ones,i.e. the samples were initially melted to 270 �C, rapidlycooled to the crystallization temperatures and then heldat that temperature to crystallize. The resulting mor-phology and melting were studied.
3. Results and discussion
3.1. WAXD study
In Fig. 1 WAXD patterns for HMW-PPT samplesare shown. These samples were crystallized from themelt in the DSC furnace at 182, 191 and 197 �C, to ob-tain the same conditions as for the samples for whichmelting behavior was studied. It is important to notethat crystallization of PPT samples at these tempera-tures, results in multiple melting behavior in subsequentDSC heating scan (as it is discussed in detail in thefollowing section). In the same figure, WAXD patternfor a PPT sample first crystallized at 182 �C and subse-quently heated to 212 �C at a rate of 10�/min is alsoillustrated. These patterns are similar to each other,though sharper peaks were observed for the samplescrystallized at higher temperatures. All of the observedpeaks corresponded to the characteristic peaks of theknown unit cell for PPT [25–29], which is triclinic withdimensions a = 0.46 nm, b = 0.61 nm, c = 1.86 nm, a =97.5�, b = 92.1�, c = 110�. The pattern for the samplefirst crystallized at 182 �C and heated to 212 �C showedsharper peaks comparing to those for the sample crystal-lized at 182 �C, but no new peaks were observed. Conse-quently, only one crystal modification was observed inthe PPT samples, and the crystalline phase became finerupon heating to higher temperatures. No transformationto other crystal modification occurred.
G.Z. Papageorgiou et al. / European Polymer Journal 42 (2006) 434–445 437
3.2. Standard DSC analysis
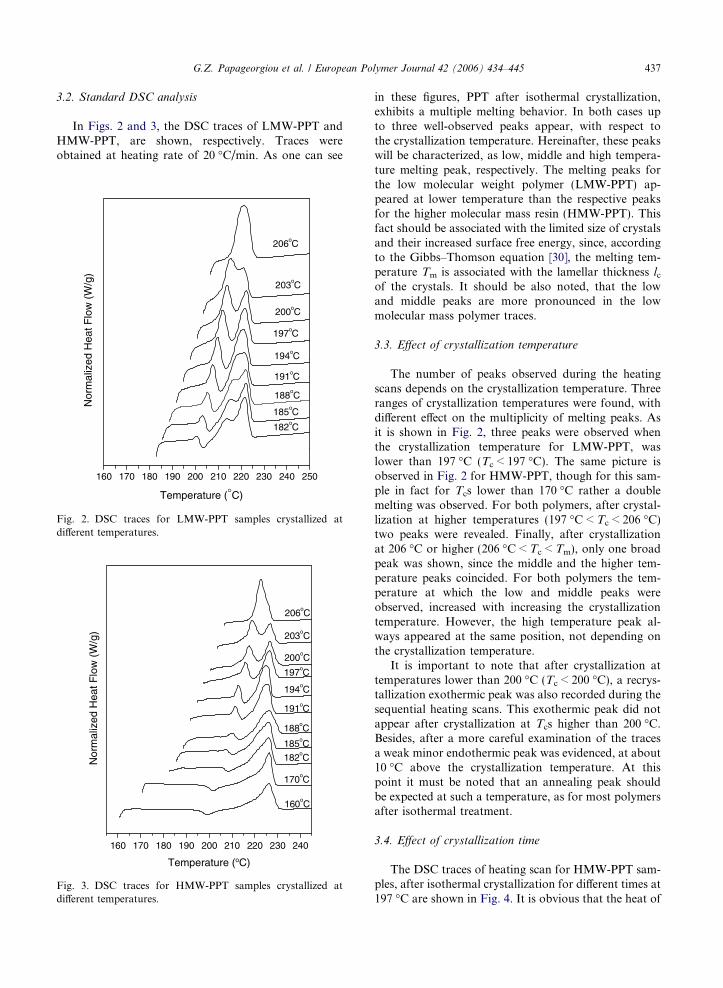
In Figs. 2 and 3, the DSC traces of LMW-PPT andHMW-PPT, are shown, respectively. Traces wereobtained at heating rate of 20 �C/min. As one can see
160 170 180 190 200 210 220 230 240 250
206oC
203oC
200oC
197oC
194oC
191oC
188oC
185oC
182oC
Nor
mal
ized
Hea
t Flo
w (
W/g
)
Temperature (°C)
Fig. 2. DSC traces for LMW-PPT samples crystallized atdifferent temperatures.
160 170 180 190 200 210 220 230 240
160oC
170oC
206oC
203oC
200oC
197oC
194oC
191oC
188oC
185oC
182oCNor
mal
ized
Hea
t Flo
w (
W/g
)
Temperature (oC)
Fig. 3. DSC traces for HMW-PPT samples crystallized atdifferent temperatures.
in these figures, PPT after isothermal crystallization,exhibits a multiple melting behavior. In both cases upto three well-observed peaks appear, with respect tothe crystallization temperature. Hereinafter, these peakswill be characterized, as low, middle and high tempera-ture melting peak, respectively. The melting peaks forthe low molecular weight polymer (LMW-PPT) ap-peared at lower temperature than the respective peaksfor the higher molecular mass resin (HMW-PPT). Thisfact should be associated with the limited size of crystalsand their increased surface free energy, since, accordingto the Gibbs–Thomson equation [30], the melting tem-perature Tm is associated with the lamellar thickness lcof the crystals. It should be also noted, that the lowand middle peaks are more pronounced in the lowmolecular mass polymer traces.
3.3. Effect of crystallization temperature
The number of peaks observed during the heatingscans depends on the crystallization temperature. Threeranges of crystallization temperatures were found, withdifferent effect on the multiplicity of melting peaks. Asit is shown in Fig. 2, three peaks were observed whenthe crystallization temperature for LMW-PPT, waslower than 197 �C (Tc < 197 �C). The same picture isobserved in Fig. 2 for HMW-PPT, though for this sam-ple in fact for Tcs lower than 170 �C rather a doublemelting was observed. For both polymers, after crystal-lization at higher temperatures (197 �C < Tc < 206 �C)two peaks were revealed. Finally, after crystallizationat 206 �C or higher (206 �C < Tc < Tm), only one broadpeak was shown, since the middle and the higher tem-perature peaks coincided. For both polymers the tem-perature at which the low and middle peaks wereobserved, increased with increasing the crystallizationtemperature. However, the high temperature peak al-ways appeared at the same position, not depending onthe crystallization temperature.
It is important to note that after crystallization attemperatures lower than 200 �C (Tc < 200 �C), a recrys-tallization exothermic peak was also recorded during thesequential heating scans. This exothermic peak did notappear after crystallization at Tcs higher than 200 �C.Besides, after a more careful examination of the tracesa weak minor endothermic peak was evidenced, at about10 �C above the crystallization temperature. At thispoint it must be noted that an annealing peak shouldbe expected at such a temperature, as for most polymersafter isothermal treatment.
3.4. Effect of crystallization time
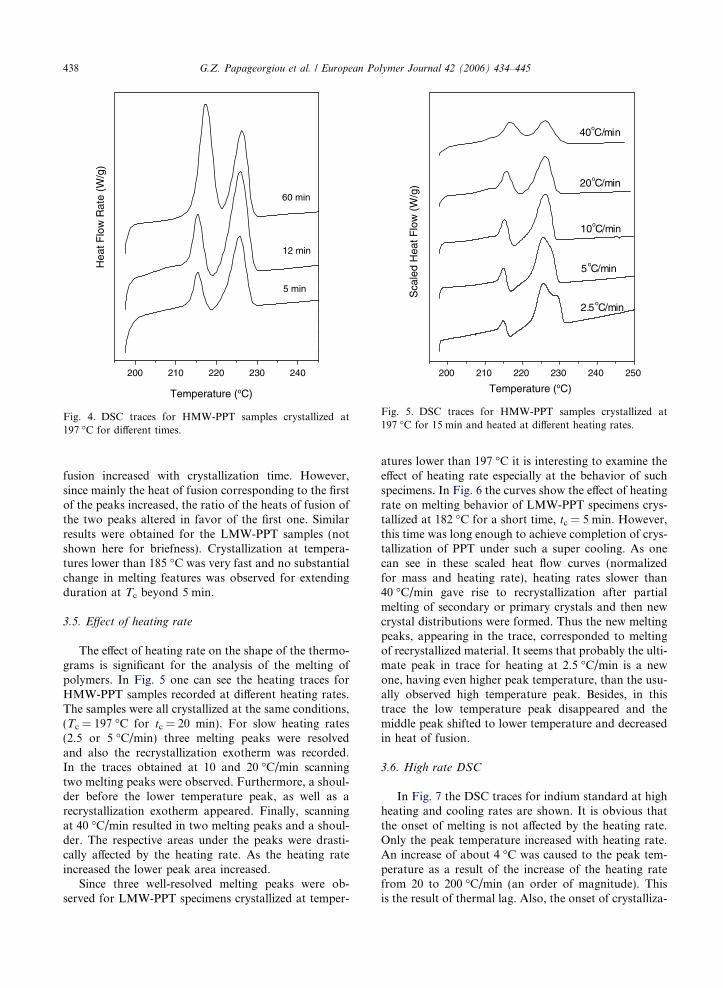
The DSC traces of heating scan for HMW-PPT sam-ples, after isothermal crystallization for different times at197 �C are shown in Fig. 4. It is obvious that the heat of
200 210 220 230 240
60 min
12 min
5 min
Hea
t Flo
w R
ate
(W/g
)
Temperature (oC)
Fig. 4. DSC traces for HMW-PPT samples crystallized at197 �C for different times.
200 210 220 230 240 250
40oC/min
20oC/min
10oC/min
5oC/min
2.5oC/min
Sca
led
Hea
t Flo
w (
W/g
)
Temperature (oC)
Fig. 5. DSC traces for HMW-PPT samples crystallized at197 �C for 15 min and heated at different heating rates.
438 G.Z. Papageorgiou et al. / European Polymer Journal 42 (2006) 434–445
fusion increased with crystallization time. However,since mainly the heat of fusion corresponding to the firstof the peaks increased, the ratio of the heats of fusion ofthe two peaks altered in favor of the first one. Similarresults were obtained for the LMW-PPT samples (notshown here for briefness). Crystallization at tempera-tures lower than 185 �C was very fast and no substantialchange in melting features was observed for extendingduration at Tc beyond 5 min.
3.5. Effect of heating rate
The effect of heating rate on the shape of the thermo-grams is significant for the analysis of the melting ofpolymers. In Fig. 5 one can see the heating traces forHMW-PPT samples recorded at different heating rates.The samples were all crystallized at the same conditions,(Tc = 197 �C for tc = 20 min). For slow heating rates(2.5 or 5 �C/min) three melting peaks were resolvedand also the recrystallization exotherm was recorded.In the traces obtained at 10 and 20 �C/min scanningtwo melting peaks were observed. Furthermore, a shoul-der before the lower temperature peak, as well as arecrystallization exotherm appeared. Finally, scanningat 40 �C/min resulted in two melting peaks and a shoul-der. The respective areas under the peaks were drasti-cally affected by the heating rate. As the heating rateincreased the lower peak area increased.
Since three well-resolved melting peaks were ob-served for LMW-PPT specimens crystallized at temper-
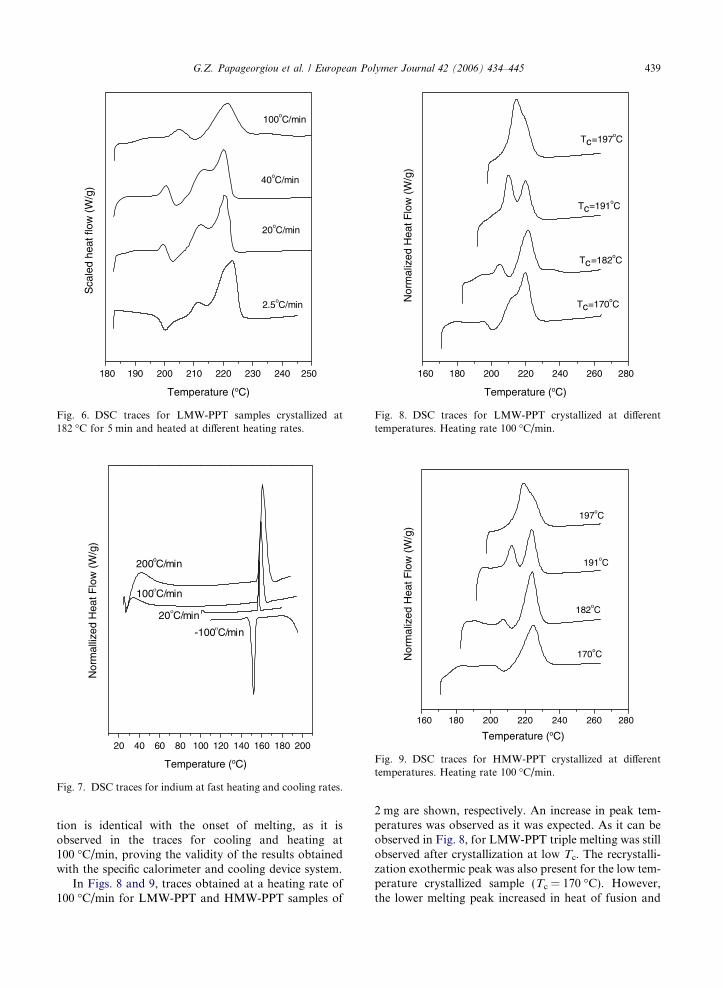
atures lower than 197 �C it is interesting to examine theeffect of heating rate especially at the behavior of suchspecimens. In Fig. 6 the curves show the effect of heatingrate on melting behavior of LMW-PPT specimens crys-tallized at 182 �C for a short time, tc = 5 min. However,this time was long enough to achieve completion of crys-tallization of PPT under such a super cooling. As onecan see in these scaled heat flow curves (normalizedfor mass and heating rate), heating rates slower than40 �C/min gave rise to recrystallization after partialmelting of secondary or primary crystals and then newcrystal distributions were formed. Thus the new meltingpeaks, appearing in the trace, corresponded to meltingof recrystallized material. It seems that probably the ulti-mate peak in trace for heating at 2.5 �C/min is a newone, having even higher peak temperature, than the usu-ally observed high temperature peak. Besides, in thistrace the low temperature peak disappeared and themiddle peak shifted to lower temperature and decreasedin heat of fusion.
3.6. High rate DSC
In Fig. 7 the DSC traces for indium standard at highheating and cooling rates are shown. It is obvious thatthe onset of melting is not affected by the heating rate.Only the peak temperature increased with heating rate.An increase of about 4 �C was caused to the peak tem-perature as a result of the increase of the heating ratefrom 20 to 200 �C/min (an order of magnitude). Thisis the result of thermal lag. Also, the onset of crystalliza-
180 190 200 210 220 230 240 250
2.5oC/min
20oC/min
40oC/min
100oC/min
Sca
led
heat
flow
(W
/g)
Temperature (oC)
Fig. 6. DSC traces for LMW-PPT samples crystallized at182 �C for 5 min and heated at different heating rates.
20 40 60 80 100 120 140 160 180 200
-100oC/min
20oC/min
100oC/min
200oC/min
Nor
mal
lized
Hea
t Flo
w (
W/g
)
Temperature (oC)
Fig. 7. DSC traces for indium at fast heating and cooling rates.
160 180 200 220 240 260 280
Tc=191oC
Tc=197oC
Tc=182oC
Tc=170oCNor
mal
ized
Hea
t Flo
w (
W/g
)
Temperature (oC)
ig. 8. DSC traces for LMW-PPT crystallized at differentemperatures. Heating rate 100 �C/min.
160 180 200 220 240 260 280
197oC
191oC
182oC
170oC
Temperature (oC)
Nor
mal
ized
Hea
t Flo
w (
W/g
)
Fig. 9. DSC traces for HMW-PPT crystallized at differenttemperatures. Heating rate 100 �C/min.
G.Z. Papageorgiou et al. / European Polymer Journal 42 (2006) 434–445 439
tion is identical with the onset of melting, as it isobserved in the traces for cooling and heating at100 �C/min, proving the validity of the results obtainedwith the specific calorimeter and cooling device system.
In Figs. 8 and 9, traces obtained at a heating rate of100 �C/min for LMW-PPT and HMW-PPT samples of
Ft
2 mg are shown, respectively. An increase in peak tem-peratures was observed as it was expected. As it can beobserved in Fig. 8, for LMW-PPT triple melting was stillobserved after crystallization at low Tc. The recrystalli-zation exothermic peak was also present for the low tem-perature crystallized sample (Tc = 170 �C). However,the lower melting peak increased in heat of fusion and
160 180 200 220 240 260 280
197oC
191oC
182oC
170oC
Nor
mal
ized
Hea
t Flo
w (
W/g
)
Temperature (oC)
Fig. 11. DSC traces for HMW-PPT crystallized at differenttemperatures. Heating rate 200 �C/min.
440 G.Z. Papageorgiou et al. / European Polymer Journal 42 (2006) 434–445
the middle and higher peaks were very close. For Tc =182 �C, in the corresponding heating trace at 100 �C/min these peaks coincided. In the heating trace for a sam-ple crystallized at 191 �C only two peaks remained, incontrast to the trace for heating at 20 �C/min (Fig. 2)where three melting and the recrystallization peaks wereobserved. In the case of LMW-PPT sample crystallizedat 197 �C high rate heating revealed the lower peakaccompanied by a weak shoulder instead of two well-resolved peaks. Since fast rates cause some increase inpeak temperature, the peak at 220 �C corresponds tothe middle and not the higher temperature peak.
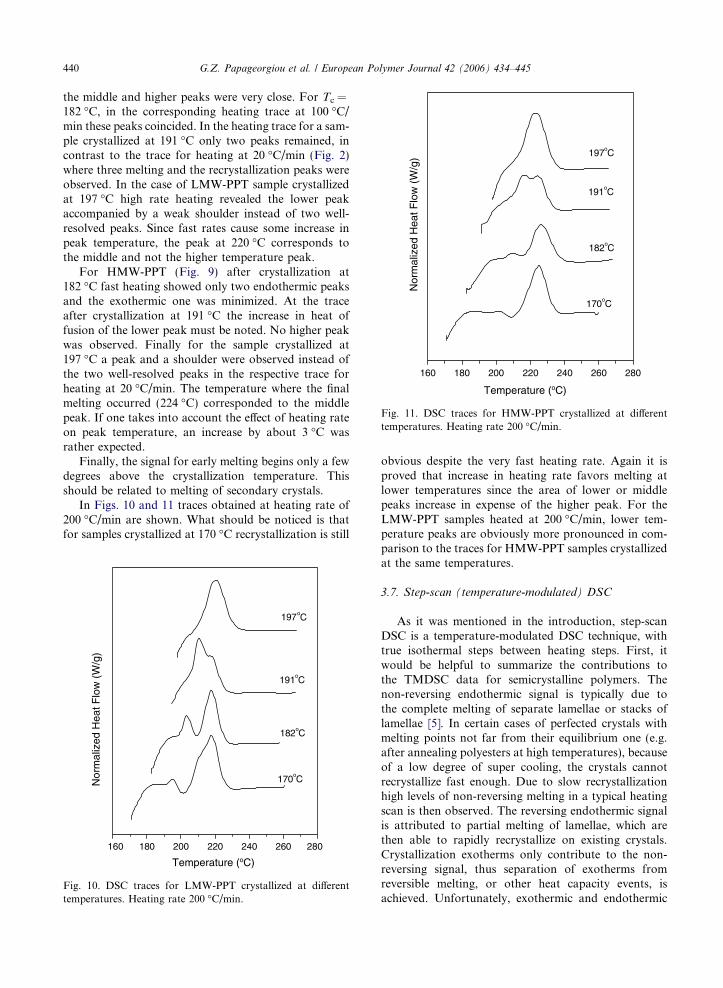
For HMW-PPT (Fig. 9) after crystallization at182 �C fast heating showed only two endothermic peaksand the exothermic one was minimized. At the traceafter crystallization at 191 �C the increase in heat offusion of the lower peak must be noted. No higher peakwas observed. Finally for the sample crystallized at197 �C a peak and a shoulder were observed instead ofthe two well-resolved peaks in the respective trace forheating at 20 �C/min. The temperature where the finalmelting occurred (224 �C) corresponded to the middlepeak. If one takes into account the effect of heating rateon peak temperature, an increase by about 3 �C wasrather expected.
Finally, the signal for early melting begins only a fewdegrees above the crystallization temperature. Thisshould be related to melting of secondary crystals.
In Figs. 10 and 11 traces obtained at heating rate of200 �C/min are shown. What should be noticed is thatfor samples crystallized at 170 �C recrystallization is still
160 180 200 220 240 260 280
170oC
182oC
191oC
197oC
Temperature (oC)
Nor
mal
ized
Hea
t Flo
w (
W/g
)
Fig. 10. DSC traces for LMW-PPT crystallized at differenttemperatures. Heating rate 200 �C/min.
obvious despite the very fast heating rate. Again it isproved that increase in heating rate favors melting atlower temperatures since the area of lower or middlepeaks increase in expense of the higher peak. For theLMW-PPT samples heated at 200 �C/min, lower tem-perature peaks are obviously more pronounced in com-parison to the traces for HMW-PPT samples crystallizedat the same temperatures.
3.7. Step-scan (temperature-modulated) DSC
As it was mentioned in the introduction, step-scanDSC is a temperature-modulated DSC technique, withtrue isothermal steps between heating steps. First, itwould be helpful to summarize the contributions tothe TMDSC data for semicrystalline polymers. Thenon-reversing endothermic signal is typically due tothe complete melting of separate lamellae or stacks oflamellae [5]. In certain cases of perfected crystals withmelting points not far from their equilibrium one (e.g.after annealing polyesters at high temperatures), becauseof a low degree of super cooling, the crystals cannotrecrystallize fast enough. Due to slow recrystallizationhigh levels of non-reversing melting in a typical heatingscan is then observed. The reversing endothermic signalis attributed to partial melting of lamellae, which arethen able to rapidly recrystallize on existing crystals.Crystallization exotherms only contribute to the non-reversing signal, thus separation of exotherms fromreversible melting, or other heat capacity events, isachieved. Unfortunately, exothermic and endothermic
180 190 200 210 220 230 240 250 260 270
ReversingTotalNon Reversing
Tc=206oC
Tc=197oC
Tc=182oC
Nor
mal
lized
Hea
t Flo
w (
W/g
)
Temperature (oC)
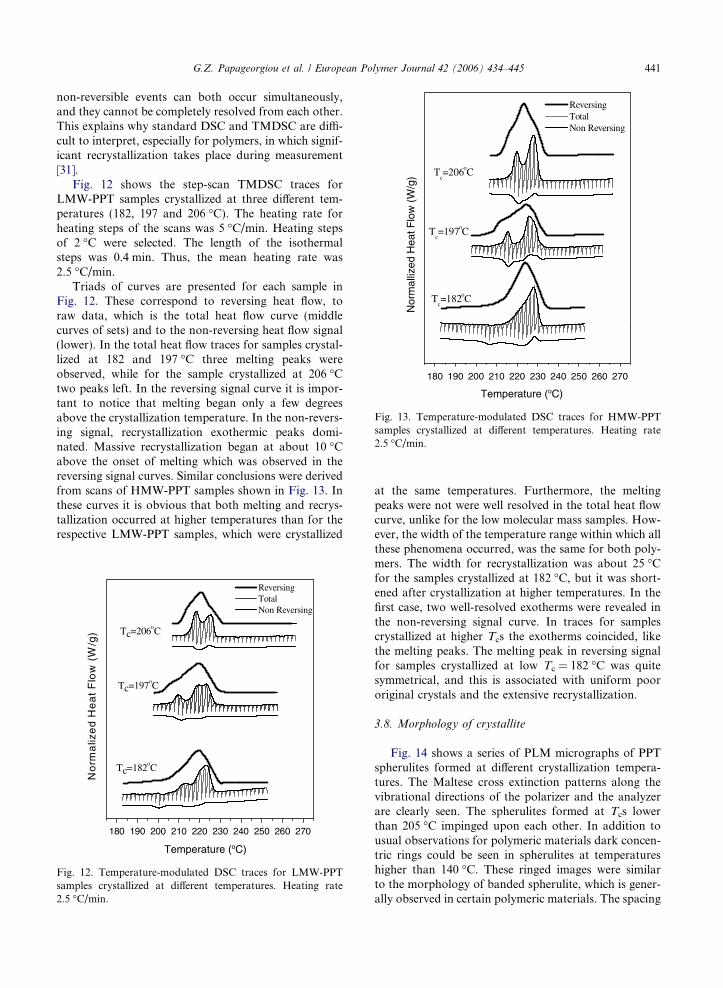
Fig. 13. Temperature-modulated DSC traces for HMW-PPTsamples crystallized at different temperatures. Heating rate2.5 �C/min.
G.Z. Papageorgiou et al. / European Polymer Journal 42 (2006) 434–445 441
non-reversible events can both occur simultaneously,and they cannot be completely resolved from each other.This explains why standard DSC and TMDSC are diffi-cult to interpret, especially for polymers, in which signif-icant recrystallization takes place during measurement[31].
Fig. 12 shows the step-scan TMDSC traces forLMW-PPT samples crystallized at three different tem-peratures (182, 197 and 206 �C). The heating rate forheating steps of the scans was 5 �C/min. Heating stepsof 2 �C were selected. The length of the isothermalsteps was 0.4 min. Thus, the mean heating rate was2.5 �C/min.
Triads of curves are presented for each sample inFig. 12. These correspond to reversing heat flow, toraw data, which is the total heat flow curve (middlecurves of sets) and to the non-reversing heat flow signal(lower). In the total heat flow traces for samples crystal-lized at 182 and 197 �C three melting peaks wereobserved, while for the sample crystallized at 206 �Ctwo peaks left. In the reversing signal curve it is impor-tant to notice that melting began only a few degreesabove the crystallization temperature. In the non-revers-ing signal, recrystallization exothermic peaks domi-nated. Massive recrystallization began at about 10 �Cabove the onset of melting which was observed in thereversing signal curves. Similar conclusions were derivedfrom scans of HMW-PPT samples shown in Fig. 13. Inthese curves it is obvious that both melting and recrys-tallization occurred at higher temperatures than for therespective LMW-PPT samples, which were crystallized
180 190 200 210 220 230 240 250 260 270
Tc=206oC
Tc=197oC
Tc=182oC
ReversingTotalNon Reversing
No
rma
lize
dH
ea
tF
low
(W/g
)
Temperature (oC)
Fig. 12. Temperature-modulated DSC traces for LMW-PPTsamples crystallized at different temperatures. Heating rate2.5 �C/min.
at the same temperatures. Furthermore, the meltingpeaks were not were well resolved in the total heat flowcurve, unlike for the low molecular mass samples. How-ever, the width of the temperature range within which allthese phenomena occurred, was the same for both poly-mers. The width for recrystallization was about 25 �Cfor the samples crystallized at 182 �C, but it was short-ened after crystallization at higher temperatures. In thefirst case, two well-resolved exotherms were revealed inthe non-reversing signal curve. In traces for samplescrystallized at higher Tcs the exotherms coincided, likethe melting peaks. The melting peak in reversing signalfor samples crystallized at low Tc = 182 �C was quitesymmetrical, and this is associated with uniform poororiginal crystals and the extensive recrystallization.
3.8. Morphology of crystallite
Fig. 14 shows a series of PLM micrographs of PPTspherulites formed at different crystallization tempera-tures. The Maltese cross extinction patterns along thevibrational directions of the polarizer and the analyzerare clearly seen. The spherulites formed at Tcs lowerthan 205 �C impinged upon each other. In addition tousual observations for polymeric materials dark concen-tric rings could be seen in spherulites at temperatureshigher than 140 �C. These ringed images were similarto the morphology of banded spherulite, which is gener-ally observed in certain polymeric materials. The spacing
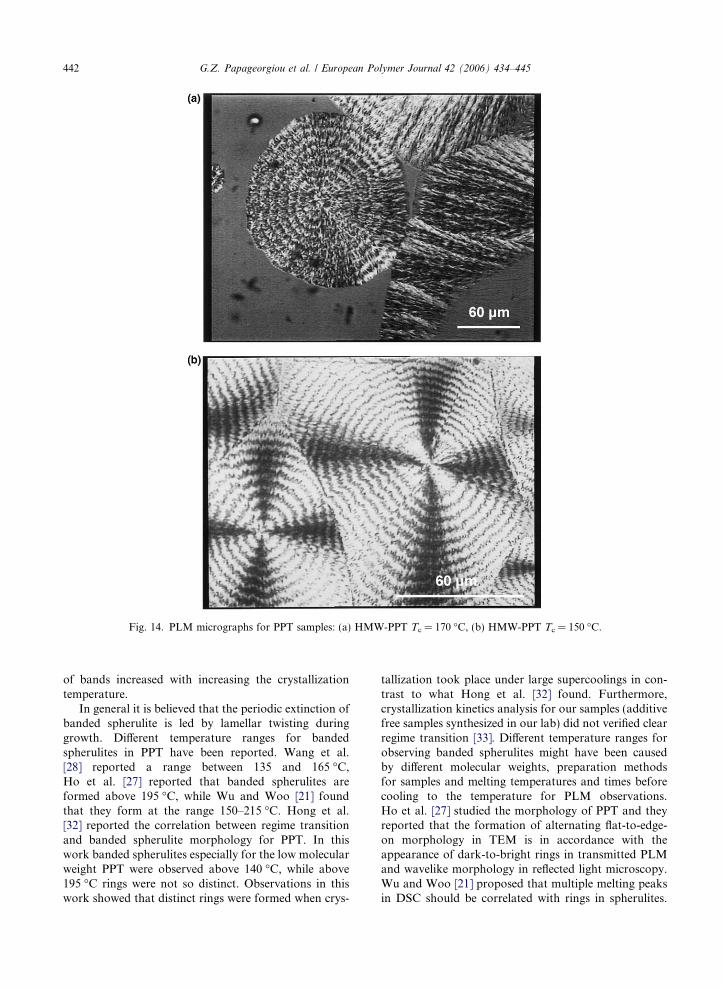
Fig. 14. PLM micrographs for PPT samples: (a) HMW-PPT Tc = 170 �C, (b) HMW-PPT Tc = 150 �C.
442 G.Z. Papageorgiou et al. / European Polymer Journal 42 (2006) 434–445
of bands increased with increasing the crystallizationtemperature.
In general it is believed that the periodic extinction ofbanded spherulite is led by lamellar twisting duringgrowth. Different temperature ranges for bandedspherulites in PPT have been reported. Wang et al.[28] reported a range between 135 and 165 �C,Ho et al. [27] reported that banded spherulites areformed above 195 �C, while Wu and Woo [21] foundthat they form at the range 150–215 �C. Hong et al.[32] reported the correlation between regime transitionand banded spherulite morphology for PPT. In thiswork banded spherulites especially for the low molecularweight PPT were observed above 140 �C, while above195 �C rings were not so distinct. Observations in thiswork showed that distinct rings were formed when crys-
tallization took place under large supercoolings in con-trast to what Hong et al. [32] found. Furthermore,crystallization kinetics analysis for our samples (additivefree samples synthesized in our lab) did not verified clearregime transition [33]. Different temperature ranges forobserving banded spherulites might have been causedby different molecular weights, preparation methodsfor samples and melting temperatures and times beforecooling to the temperature for PLM observations.Ho et al. [27] studied the morphology of PPT and theyreported that the formation of alternating flat-to-edge-on morphology in TEM is in accordance with theappearance of dark-to-bright rings in transmitted PLMand wavelike morphology in reflected light microscopy.Wu and Woo [21] proposed that multiple melting peaksin DSC should be correlated with rings in spherulites.
G.Z. Papageorgiou et al. / European Polymer Journal 42 (2006) 434–445 443
They proposed that in melt crystallized PPT mixed typesof lamellae develop in various fractions. Thus, the lowtemperature peak in DSC traces is due to grainy imper-fect crystal aggregates, the middle peak is associatedwith melting of flat-on thin lamella and the higher tem-perature peak is due to melting of a thickened lamellawith edge-on orientation. At this point it is importantthat in this work the banded spherulites were also ob-served at the same temperature range with multiple melt-ing. Rings were more distinct when samples werecrystallized under large supercoolings. At the same con-ditions samples exhibiting triple melting and extensiverecrystallization were formed. Also, LMW-PPT seemedto form ringed spherulites easier than HMW-PPT, asit also exhibited increased tendency for triple meltingwith enhanced low and middle melting peaks.
3.9. On the origin of the multiple melting
In order to interpret the melting behavior of PPT, theorigin of each peak and the metastability of the crystal-line phase generated at specific conditions, as well as toclarify the phenomena taking place during heating, theresults presented previously are combined and discussedin the following text.
The WAXD study proved that since only one crystalmodification of PPT was observed, the multiple meltingbehavior could not be due to multiple crystal modifica-tions of PPT present in the crystallized samples. Further-more, no crystal transition was observed upon heating,though a finer WAXD pattern with sharper peaks wasrecorded. This should be probably attributed to the par-tial melting and recrystallization of the sample occurringupon slow heating, as will be discussed below.
The number of the melting peaks of PPT is a functionof the crystallization temperature. Thus three ranges ofcrystallization temperatures with importance werenoted. Crystallization of PPT at low temperatures, i.e.below 197 �C, exhibited fast rates due to the large super-coolings. Thus, the triple melting, which was recordedduring the consequent heating scan, should be probablyassociated with the effects of both fast crystallizationand low temperature. Fast crystallization is often relatedwith large nucleation density as well as with constraints,which may arise due to topological factors. Large nucle-ation density is anticipated to lead to reduced crystalsize and also impingement of spherulites. Constraintenvironment may lead to a significant extent of second-ary crystallization [1]. Furthermore, according to theGibbs–Thomson equation the lamellar thickness in caseof lamellar crystals and also the respective melting tem-perature are strictly dependent on the crystallizationtemperature. Thus, crystallization at low temperatureshould be associated with forming of crystals of limitedthermodynamic stability, in other words a metastablecrystalline phase. Such a metastable phase may undergo
extensive perfection via a partial melting and recrys-tallization during subsequent heating above the crystal-lization temperature. The extent of crystal perfectiondepends on the stability of the original phase and thetime offered during the heating scan [6]. So, the interpre-tation of the triple melting shown in the correspondingtraces of Figs. 2 and 3 could be based on a sequentialmelting–recrystallization–remelting process. The lowertemperature melting peak was present in all traces re-corded at fast rates and thus should be attributed tomelting of primary crystals, since fast rates reveal theoriginal morphology of the specimens. This peak wascompensated by recrystallization in traces for slow heat-ing rates. Usually, a minor endothermic peak is observed10–15 �C above the isothermal crystallization or anneal-ing temperature after such processes in subsequent heat-ing scans for semicrystalline polymers [4]. This minorpeak is due to melting of secondary crystals. In the caseof PPT samples there was only weak evidence (shoulder)of melting in this range of temperatures especially forfast heating rates. Besides in TMDSC non-reversing sig-nal, the onset of recrystallization was observed in thisrange of temperature, which might compensate theendothermic effect of melting. However, these observa-tions allow one to distinguish melting of secondary crys-tals from the lower peak, which should be attributed tomelting of primary crystals. Thus, a fourth fold meltingshould be rather considered, though the minor peak wasnot clear in standard DSC traces.
After crystallization at the medium temperaturerange (197 �C < Tc < 206 �C), two main peaks were ob-served in standard DSC traces, the lower and also anultimate melting peak. The latter was a result of overlap-ping of the middle and high temperature peaks. As theTc was increased, the lower melting peak was also in-creased in peak height and also in peak temperaturefor both the low and the higher molar mass polymers.This was a consequence of the increased stability of crys-tals formed at higher temperature, due to increasedlamellar thickness, and/or reduced number of crystaldefects.
As one can see in Fig. 4 the increase in heat of fusionof the lower peak, with increasing crystallization time,was more obvious than that of the ultimate peak andthus the lower melting peak became dominant. Thiswas probably due to the fact that after prolonged time,crystals of increased stability were formed, as can also beconcluded by the somehow increased peak temperatureof the lower peak, and thus reorganization was ratherlimited after that.
Melting peaks for the low molecular mass PPT werelocated at lower temperatures, and also the lower andthe middle peaks were more profound. This was becauseof the limited initial lamellar thickness and the limita-tions for annealing during heating scan, as a conse-quence of the reduced length of the polymer chains.

444 G.Z. Papageorgiou et al. / European Polymer Journal 42 (2006) 434–445
Also, chain ends may act as crystal defects and thus it isanticipated, crystals of LMW-PPT to be defective due tolarger number of chain ends.
As the crystallization temperature increased above197 �C the lower peak became dominant for both poly-mers. This was a result of increased stability of originalcrystals and also the limited time for perfection. Thetime offered for recrystallization during a heating scanis proportional to the temperature interval between themelting of original crystals and the final melting and alsoinversely proportional to the heating rate. Thus, for agiven heating rate, a low melting temperature of originalcrystals resulted in increased time for perfection. Conse-quently, samples crystallized at low temperatures hadmore time for perfection and thus a large portion ofcrystallinity melted at the higher temperature peak. Thisis why for samples crystallized at low Tcs, the highertemperature peak was dominant. Time for perfectionalso depends on the heating rate [18]. As one can seein Fig. 5, for slow heating rates (2.5 or even 5 �C/min)the samples had enough time to undergo extensiverecrystallization. Not only the recrystallization exo-therm itself was obvious for slow heating rates, but alsothree melting peaks were observed. The latter wasbecause extensive recrystallization gave rise to the higherpeak. For higher heating rates the higher peak was nomore observed and also the lower peak increased in heatof fusion. This was because only a short time was thengiven to the crystals to recrystallize. Examining thecurve for a heating rate 40 �C/min, it is concluded thatabout half of crystallinity melted before reaching220 �C, despite the fact that superheating effects werein play. This was far from what was observed when aheating rate 2.5 �C/min was applied. Besides, in the tracefor heating at 40 �C/min, the shoulder appearing beforethe lower peak was an evidence for melting of low stabil-ity crystals, before undergoing any perfection. In factthis shoulder might be attributed to melting of second-ary crystals.
The effect of heating rate on melting of LMW-PPTspecimens crystallized at 182 �C might reveal new things.For slow heating rate (2.5 �C/min) recrystallizationbegan just a few degrees above the crystallization temper-ature. It was so massive that even the lower melting peakdisappeared. Furthermore, the middle peak decreased intemperature, but also in heat of fusion, and a new peaklocated at temperature even higher than the usuallyobserved high temperature peak was recorded. Thus, itseems that a continuous perfection of crystals occurred.Crystals melting at the middle peak seem to undergo suchperfection. This must be correlated with the secondrecrystallization exothermic peak in the non-reversingsignal in the respective step scan curves of Fig. 12. In highrate heating scans the middle peak was also observed.These observations are indications that the middle peakis associated with melting of original crystals.
Generally speaking, high rate DSC study (100 and200 �C/min) revealed the initial morphologies of thesamples. High rate heating scans showed that recrystal-lization of samples crystallized at Tcs less than 190 �Cwas rapid. Recrystallization exotherms were observedeven at heating at 100 �C/min. However, it was verifiedthat the lower and the middle peaks were present, andthus they correspond to melting of crystals initiallyformed. On the other hand, the higher peak seemed tobe due to melting of recrystallized material, since itwas not observed in high rate DSC traces.
Step-scan-TMDSC study verified that extensiverecrystallization of PPT always takes place. In thenon-reversing signal curves double exothermic peaksfor samples crystallized at low temperatures or a singleone for samples crystallized at higher Tcs were observed.Recrystallization occurred in the range of temperaturesfrom about 10 �C above the corresponding crystalliza-tion temperature to roughly 225 �C for the high molecu-lar mass polymer, or 222 �C for the low molecular massone. This means that recrystallization begins just aftermelting of secondary and/or primary crystals and itstops just before final melting. The main difference isthat such phenomena occur for the high molecular masssamples at about 5 �C higher, following the trend formelting at higher temperatures.
4. Conclusion
In this investigation, the multiple melting behavior oftwo PPT samples, with different average molecularweights, isothermally crystallized from the melt wasthoroughly investigated. The study of the melting behav-ior showed that this is a result of crystal perfection pro-cess during the subsequent heating scan. Step-scanTMDSC revealed that extensive recrystallization occursin PPT samples, especially when fast isothermal crys-tallization takes place under large supercoolings, whichresults in formation of metastable crystalline phases.In fact, two recrystallization exothermic peaks wereobserved in step-scan DSC traces, which followed themelting of secondary and primary crystals, respectively.In high rate DSC traces the lower and the middle peakswere present and thus these two peaks should be inter-preted as melting of original crystals. In contrast thehigh temperature peak always observed in standardDSC traces, was not observed in high rate heating scansand this was a proof that this peak is associated withmelting of perfected crystals during slow heating scans.Furthermore, high rate DSC showed that melting of sec-ondary crystals takes place about 5–10 �C above thecrystallization temperature. The so-called annealingpeak is not clearly observed in standard DSC tracesfor PPT due to compensation by the exothermic recrys-tallization phenomena.
G.Z. Papageorgiou et al. / European Polymer Journal 42 (2006) 434–445 445
Acknowledgements
The authors would like to thank E.I. Du Pont deNemours, Wilmington, DE and especially the depart-ment of Du Pont SoronaTM technology and BusinessDevelopment for the supply of 1,3-PDO and AmocoChemicals-Fine Acid (Chicago, IL) for providing theterephthalic acid.
References
[1] Keller A, Cheng SZD. Polymer 1998;39:4461.[2] Medellin-Rodriguez FJ, Phillips PJ, Lin JS. Macromole-
cules 1996;29:7491.[3] Nichols ME, Robertson RE. J Polym Sci Part B: Polym
Phys 1992;30:755.[4] Denchev Z, Nogales A, Ezquerra A, Fernandes-Nasci-
mento J, Balta-Calleja FJ. J Polym Sci Part B: Polym Phys2000;38:116.
[5] Sauer BB, Kampert WG, Neal Blanchard E, Threefoot SA,Hsiao BS. Polymer 2000;41:1099.
[6] Papageorgiou GZ, Karayannidis GP. Polymer 1999;40:5325.
[7] Ju M-Y, Chang F-C. Polymer 2001;42:5037.[8] Wang Z-G, Wang X-H, Hsiao BS, Philips RA, Medellin-
Rodriguez FJ, Srinivas S, et al. J Polym Sci Part B: PolymPhys 2001;39:2982.
[9] Sun YS, Woo EM. Macromolecules 1999;32:7836.[10] Marand H, Alizadeh A, Farmer R, Desai R, Velikov V.
Macromolecules 2000;33:3392.[11] Hsiao BS, Gardner KH, Wu DQ, Chu B. Polymer 1993;34:
3986.[12] Blundell DJ, Osborn BN. Polymer 1983;24:953.
[13] Samuels RJ. J Polym Sci Part B: Polym Phys 1975;13:1417.[14] Cebe P, Hong SD. Polymer 1986;27:1183.[15] Blundell DJ. Polymer 1987;28:2248.[16] Wang Z-G, Hsiao BS, Sauer BB, Kampert WG. Polymer
1999;40:4615.[17] Kruger KN, Zachmann HG. Macromolecules 1993;26:
5202.[18] Cheng SZD, Wunderlich B. Macromolecules 1988;21:789.[19] Srimoaon P, Dangseeyun N, Supaphol P. Eur Polym J
2004;40:599.[20] Karayannidis GP, Roupakias C, Bikiaris DN, Achilias DS.
Polymer 2003;44:931.[21] Wu P-L, Woo EM. J Polym Sci Part B: Polym Phys 2002;
41:80.[22] Perkin–Elmer. Step scan DSC users manual.[23] Pijpers TFJ, Mathot VBF, Goderis B, Scherrenberg RL,
van der Vegte EW. Macromolecules 2002;35:3601.[24] Chuah HH, Lin-Vien D, Soni U. Polymer 2001;42:7137.[25] Desborough IJ, Hall IH, Neisser JZ. Polymer 1979;20:
545.[26] Dandurand SP, Perez S, Revol JF, Brisse F. Polymer 1979;
20:419.[27] Ho R-M, Ke K-Z, Chen M. Macromolecules 2000;33:7529.[28] Wang B, Li CY, Hanzlicek J, Cheng SD, Geil PH,
Grebowicz J, et al. Polymer 2001;42:7171.[29] Yang J, Sidoti G, Geil PH, Li CY, Cheng SZD. Polymer
2001;42:7181.[30] Hoffman JD, Davis GT, Lauritzen Jr JI. In: Hannay NB,
editor. Treatise on solid state chemistry, vol. 3. NewYork: Plenum Press; 1976 [chapter 7].
[31] Pyda M, Wunderlich B. J Polym Sci Part B: Polym Phys2000;38:622.
[32] Hong P-D, Chung W-T, Hsu C-F. Polymer 2002;43:3335.[33] Achilias DS, Papageorgiou GZ, Karayannidis GP. J Polym
Sci Part B: Polym Phys 2004;42:3775.