STRESS TESTING COMPANIES IN THE ENERGY VALUE ...
56
Cambridge Centre for Risk Studies Cambridge Case Study Series SCENARIO APPLICATIONS: STRESS TESTING COMPANIES IN THE ENERGY VALUE CHAIN
-
Upload
khangminh22 -
Category
Documents
-
view
1 -
download
0
Transcript of STRESS TESTING COMPANIES IN THE ENERGY VALUE ...
Cambridge Centre for Risk Studies
Cambridge Case Study Series
SCENARIO APPLICATIONS: STRESS TESTING COMPANIES IN THE ENERGY VALUE CHAIN
2Scenario Applications: Cambridge Centre for Risk Studies Stress Testing Companies in the Energy Value Chain
AcknowledgementsCambridge Centre for Risk Studies gratefully acknowledges the Institute for Risk Management for supporting the research efforts summarised in this report. The Centre is grateful for the expertise provided by our research team, collaborators, and subject matter specialists. Any misinterpretation in use of the advice provided is entirely the responsibility of the Cambridge Centre for Risk Studies.
Paper Citation:Cambridge Centre for Risk Studies, 2019. Scenario Applications: Stress TestingCompanies in the Energy Value Chain. Cambridge Centrefor Risk Studies at the University of Cambridge JudgeBusiness School in collaboration with the Institute of Risk Management.orRalph, D; Tuveson, M; Copic, J; Deng, K., Carpenter, O.,Coburn, A. 2019. Scenario Applications: Stress TestingCompanies in the Energy Value Chain. Cambridge Centrefor Risk Studies at the University of Cambridge JudgeBusiness School in collaboration with the Institute of Risk Management.
Cambridge Centre for Risk Studies Research TeamDr Michelle Tuveson, Chairman & Executive DirectorProfessor Daniel Ralph, Academic DirectorDr Andrew Coburn, Chief ScientistSimon Ruffle, Director of Research and InnovationJennifer Copic, Project Manager and Liability Research LeadDr Andy Skelton, Lead ModellerKen Deng, Lead Financial Risk ResearchOliver Carpenter, Lead Environmental Risk ResearchDr Jennifer Daffron, Lead Technology Risk ResearchTamara Evan, Lead Geopolitical Risk ResearchJames Bourdeau, Geopolitical Risk ResearchPhil Cameron, Cyber Risk ResearchTimothy Douglas, Risk ModellerTimothy Summers, Senior Data ScientistWilliam Turner, Data ScientistDr Paul Burgess, Senior Advisor for Risk ManagementJayne Tooke, Communications Assistant
The views contained in this report are entirely those of the research team of the Cambridge Centre for Risk Studies, and do not imply any endorsement of these views by the organisations supporting the research, or our consultants and collaborators. The results of the Cambridge Centre for Risk Studies research presented in this report are for information purposes only. This report is not intended to provide a sufficient basis on which to make an investment decision. The Centre is not liable for any loss or damage arising from its use. Any commercial use will require a license agreement with the Cambridge Centre for Risk Studies.
Copyright © 2019 by Cambridge Centre for Risk Studies.
Cambridge Centre for Risk Studies University of Cambridge Judge Business School Trumpington StreetCambridge CB2 1AG United [email protected] and Research Platformwww.jbs.cam.ac.uk/faculty-research/centres/risk
Institute of Risk ManagementSackville House143 - 149 Fenchurch StreetLondonEC3M 6BNUnited KingdomWebsite www.theirm.org
3Cambridge Centre for Risk Studies Scenario Applications:
Stress Testing Companies in the Energy Value Chain
ContentsAbout the Institute of Risk Management (IRM) . . . . . . . . . . . . . . . . . . . . . . . . . . . . . . . . . . . . . . . . . . . . . . . . . . . . . . . . . . . . . . . . . . . . . . . . . . . .4
Forward from IRM . . . . . . . . . . . . . . . . . . . . . . . . . . . . . . . . . . . . . . . . . . . . . . . . . . . . . . . . . . . . . . . . . . . . . . . . . . . . . . . . . . . . . . . . . . . . . . . . . . . . . . . .5
Executive Summary . . . . . . . . . . . . . . . . . . . . . . . . . . . . . . . . . . . . . . . . . . . . . . . . . . . . . . . . . . . . . . . . . . . . . . . . . . . . . . . . . . . . . . . . . . . . . . . . . . . . . .6
Section 1: Introduction . . . . . . . . . . . . . . . . . . . . . . . . . . . . . . . . . . . . . . . . . . . . . . . . . . . . . . . . . . . . . . . . . . . . . . . . . . . . . . . . . . . . . . . . . . . . . . . . . . .8
Companies within the Energy Value Chain. . . . . . . . . . . . . . . . . . . . . . . . . . . . . . . . . . . . . . . . . . . . . . . . . . . . . . . . . . . . . . . . . . . . . . . . . . . . . .9
Section 2: The Business Environment of Energy Value Chain Companies. . . . . . . . . . . . . . . . . . . . . . . . . . . . . . . . . . . . . . . . . . . . . . . . . . . 10
A Market View . . . . . . . . . . . . . . . . . . . . . . . . . . . . . . . . . . . . . . . . . . . . . . . . . . . . . . . . . . . . . . . . . . . . . . . . . . . . . . . . . . . . . . . . . . . . . . . . . . . . . . 10
State of Geopolitics . . . . . . . . . . . . . . . . . . . . . . . . . . . . . . . . . . . . . . . . . . . . . . . . . . . . . . . . . . . . . . . . . . . . . . . . . . . . . . . . . . . . . . . . . . . . . . . . . 11
Currency Exchange Rates . . . . . . . . . . . . . . . . . . . . . . . . . . . . . . . . . . . . . . . . . . . . . . . . . . . . . . . . . . . . . . . . . . . . . . . . . . . . . . . . . . . . . . . . . . . . 12
Cyber Risks . . . . . . . . . . . . . . . . . . . . . . . . . . . . . . . . . . . . . . . . . . . . . . . . . . . . . . . . . . . . . . . . . . . . . . . . . . . . . . . . . . . . . . . . . . . . . . . . . . . . . . . . . 13
Climate Change . . . . . . . . . . . . . . . . . . . . . . . . . . . . . . . . . . . . . . . . . . . . . . . . . . . . . . . . . . . . . . . . . . . . . . . . . . . . . . . . . . . . . . . . . . . . . . . . . . . . 13
Self-Reported Top Enterprise Risks by Companies in the Energy Value Chain . . . . . . . . . . . . . . . . . . . . . . . . . . . . . . . . . . . . . . . . . . . . 15
Section 3: Exploration of Risks through Scenarios. . . . . . . . . . . . . . . . . . . . . . . . . . . . . . . . . . . . . . . . . . . . . . . . . . . . . . . . . . . . . . . . . . . . . . . . . 17
Introduction to Scenario Stress Tests . . . . . . . . . . . . . . . . . . . . . . . . . . . . . . . . . . . . . . . . . . . . . . . . . . . . . . . . . . . . . . . . . . . . . . . . . . . . . . . . . 17
Scenario Stress Tests to Assess Risk Exposure and the Value of Mitigations . . . . . . . . . . . . . . . . . . . . . . . . . . . . . . . . . . . . . . . . . . . . . 18
Section 4: Selected Scenarios for the Energy Value Chain . . . . . . . . . . . . . . . . . . . . . . . . . . . . . . . . . . . . . . . . . . . . . . . . . . . . . . . . . . . . . . . . . 21
Overview and Selection of Scenarios . . . . . . . . . . . . . . . . . . . . . . . . . . . . . . . . . . . . . . . . . . . . . . . . . . . . . . . . . . . . . . . . . . . . . . . . . . . . . . . . . 21
Scenario #1: Geopolitical Crisis: Middle East Conflict . . . . . . . . . . . . . . . . . . . . . . . . . . . . . . . . . . . . . . . . . . . . . . . . . . . . . . . . . . . . . . . . . . 23
Scenario #2: Natural Catastrophe: Hurricane in the Gulf of Mexico. . . . . . . . . . . . . . . . . . . . . . . . . . . . . . . . . . . . . . . . . . . . . . . . . . . . . 30
Scenario #3: Liability Risk: Litigation Against Carbon Emissions . . . . . . . . . . . . . . . . . . . . . . . . . . . . . . . . . . . . . . . . . . . . . . . . . . . . . . . . 35
Section 5: Conclusions . . . . . . . . . . . . . . . . . . . . . . . . . . . . . . . . . . . . . . . . . . . . . . . . . . . . . . . . . . . . . . . . . . . . . . . . . . . . . . . . . . . . . . . . . . . . . . . . . . 40
Summary of Qualitative Findings for Selected Scenarios. . . . . . . . . . . . . . . . . . . . . . . . . . . . . . . . . . . . . . . . . . . . . . . . . . . . . . . . . . . . . . . 40
Reflections and Future Vision . . . . . . . . . . . . . . . . . . . . . . . . . . . . . . . . . . . . . . . . . . . . . . . . . . . . . . . . . . . . . . . . . . . . . . . . . . . . . . . . . . . . . . . . 42
Bibliography . . . . . . . . . . . . . . . . . . . . . . . . . . . . . . . . . . . . . . . . . . . . . . . . . . . . . . . . . . . . . . . . . . . . . . . . . . . . . . . . . . . . . . . . . . . . . . . . . . . . . . . . . . . 44
Appendix A: Transition to a Low-Carbon Economy . . . . . . . . . . . . . . . . . . . . . . . . . . . . . . . . . . . . . . . . . . . . . . . . . . . . . . . . . . . . . . . . . . . . . . . . 51
Appendix B: Science in Scenarios – Geopolitical: Middle East Conflict . . . . . . . . . . . . . . . . . . . . . . . . . . . . . . . . . . . . . . . . . . . . . . . . . . . . . . 54
4Scenario Applications: Cambridge Centre for Risk Studies Stress Testing Companies in the Energy Value Chain
The IRM is the leading professional body for Enterprise Risk Management (ERM). We drive excellence in managing risk to ensure organisations are ready for the opportunities and threats of the future. We do this by providing internationally recognised qualifications and training, publishing research and guidance and setting professional standards.
For over 30 years our qualifications have been the global choice of qualifications for risk professionals and their employers. We are an independent, not for profit body, with members working in all industries, in all risk disciplines and in all sectors around the world.
About the Institute of Risk Management (IRM)
5Cambridge Centre for Risk Studies Scenario Applications:
Stress Testing Companies in the Energy Value Chain
Foreword from IRM
Firms throughout the energy value chain need innovative tools, like the scenario analysis techniques outlined in this report, in order to understand and manage risk and opportunity in a volatile world. As the paper says, the extreme risks that the sector faces may not be predictable in the conventional way, but they are foreseeable. The thinking in this guidance will help organisations sharpen up their foresight and improve their resilience in respect of future events.
The report outlines three plausible scenarios that should be considered by any organisation operating in the energy sector: a Middle East conflict, a Gulf of Mexico hurricane and the emergence of legal liability relating to climate change. Whether these scenarios themselves unfold as described is only part of the story: the process of marshalling the right people in an organisation to have a meaningful discussion around the scenarios and considering their implications and alternatives will be of great value in itself.
IRM has an active special interest group of practitioners working in the energy sector. We will encourage the members of that group now to take the Cambridge work and ‘road test’ it, working as a community to further develop new thinking in this area.
I would like to thank all the organisations and individuals who contributed to this work and also the Cambridge team for their focused and thorough approach, bringing some new thinking on concepts and techniques into the risk management space.
Socrates Coudounaris, BEng (Hons) MSc FCII CIP CFIRMIRM ChairRisk Management Director, Reinsurance Group of America
We are delighted to continue our working partnership with the Cambridge Centre for Risk Studies which has produced this valuable guidance for the energy sector.
6Scenario Applications: Cambridge Centre for Risk Studies Stress Testing Companies in the Energy Value Chain
Executive SummaryThe energy value chain is a vital component of the global economy, an industry whose outputs underpin the growth and productivity of all other sectors of the global economy. The energy value chain spans the gamut from fossil fuel production to high intensity energy consumers. The future business prospects of the companies that are part of this value chain range widely and depend on both internal and external forces. In this case study, we present the application of scenario stress tests to energy value chain companies as a systematic approach for highlighting potential futures and assessing risks which may impact an organisation, sectors, or economies and for managing emerging risks.
The business backdrop to the energy value chain incorporates three dimensions:
• macroeconomic forecasts of rising global demand for hydrocarbons until at least 2040, albeit with a fuel mix that favours lower rates of noxious and CO2 emissions;
• global geopolitics in which resource access and security remain important factors, the former thrown into the spotlight since the United States imposed tariffs on Chinese steel and aluminium in March 2018;
• scientific consensus that avoiding catastrophic damage to the global economy and society in the future requires concerted action to reduce CO2 emissions before (and beyond) 2030.
Scenarios are standard in corporate risk assessment as organisational stress tests. Scenarios as strategic stress tests have been embedded in planning processes in the oil and gas industry for over a half a century, dating back to Shell’s foresight of the 1973 OPEC oil embargo. By contrast, the stress test scenarios analysed here are shock events with acute impacts that speak directly to disaster recovery and resilience. They include a Middle East Conflict, a Hurricane in Gulf of Mexico, and a Climate Change Liability lawsuit.
Our findings are informed by external inputs including expert elicitation exercises for each of the three stress test scenarios; the CCRS-IRM 2018 Enterprise Risk Management report, which distils industry views from GICS sectors including those relevant to the energy value chain; and the wider business and management literature.
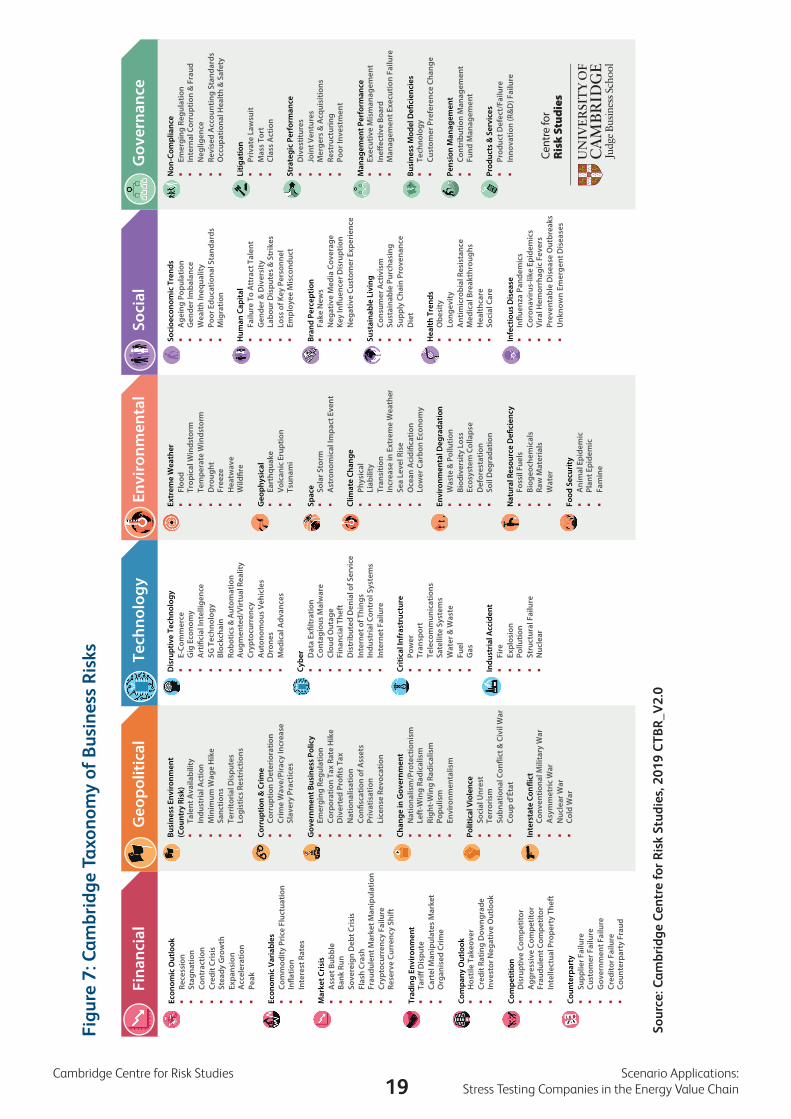
When considering the business environment of any industry, it is helpful to have a reference to a generalised structure representing different risk areas. For the purposes of discussion in this case study, we refer to the classes within the Cambridge Taxonomy of Business Risks to guide our discussion of the most significant areas of business risks facing energy value chain companies. These stress test scenarios are representatives of half of the risk classes in the Cambridge Taxonomy of Business Risks: Geopolitical, Environmental and Governance.
The impacts to the energy value chain across the selected three scenarios have some similarities but also marked differences. Scenarios can be either driven by physical consequences with threats to people and facilities, or by financial impacts from fines, legal proceedings, or other material costs. Our qualitative scenario assessments show that response capacity and mitigations tend to cluster in four categories across the energy value chain:
• Operations: Business continuity and site monitoring capabilities play key roles in maintaining or re-establishing operational processes in the face of a large scale disruption. Standard resilience strategies include holding higher levels of inventory, strengthening facilities, and procuring back-up capacity. Connecting to local communities around sites is an aspect of resilience which goes beyond the organisation itself.
• Information and reporting: How a company manages the collection and reporting of information on its activities and ecosystem is a significant aspect of its pre-event vulnerabilities and post-event responses to a shock. This relates to external transparency, via regulatory and market disclosures, and public relations; and internal communications regarding operations and staff.
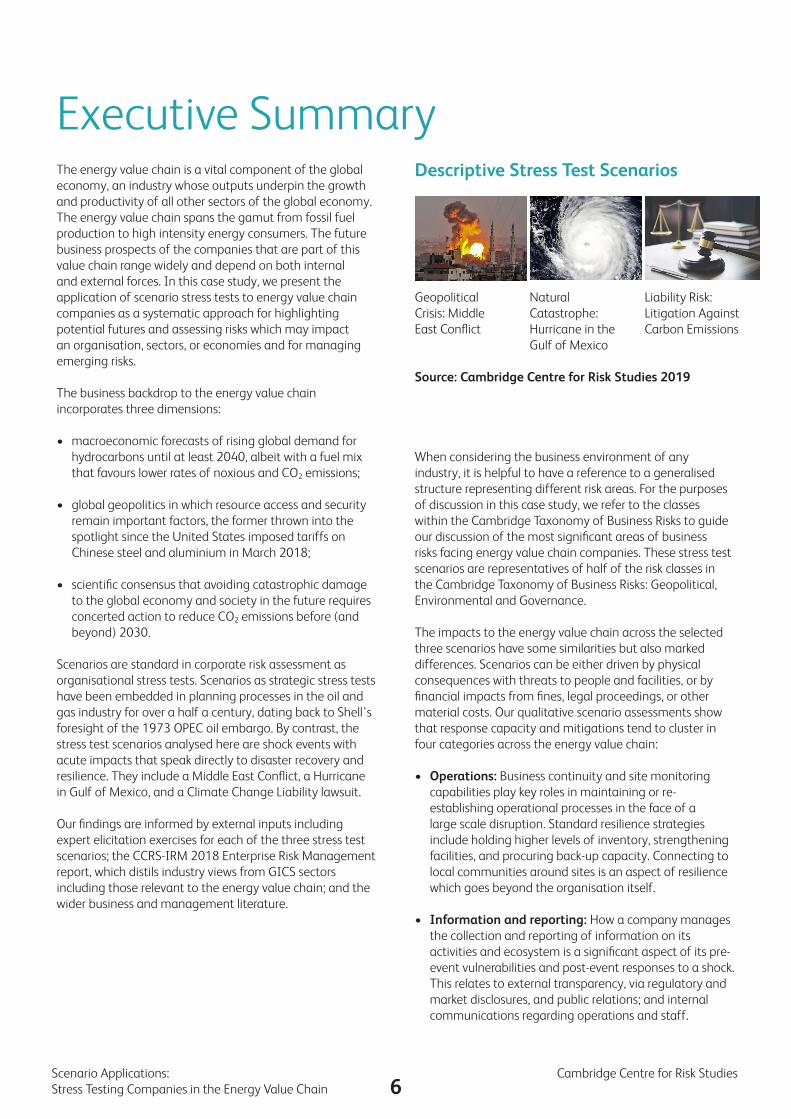
Geopolitical Crisis: Middle East Conflict
Natural Catastrophe: Hurricane in the Gulf of Mexico
Liability Risk: Litigation Against Carbon Emissions
Descriptive Stress Test Scenarios
Source: Cambridge Centre for Risk Studies 2019
7Cambridge Centre for Risk Studies Scenario Applications:
Stress Testing Companies in the Energy Value Chain
• Financials: Access to a “fighting fund” from company reserves or in some cases, insurance, may be of critical importance in responding to a large shock. A well-capitalised organisation will have opportunities to acquire distressed elements of other businesses in the aftermath of an ecosystem shock or regional disaster.
• Reputation: A shock may depress stock prices in the medium or long term. This may be reflective of a reassessment of inherent risks to the business model of a firm, particularly when that shock is viewed as a weak signal of a long term trend.
The research presented in this report is part of the Cambridge Centre for Risk Studies’ research track on corporate risk profiling1. In partnership with the Institute for Risk Management, it is informed by views from risk management specialists representing companies within the energy value chain. The path towards a low carbon economy may pose challenges and material consequences to their business models that go beyond what is envisioned today. We believe it is vital for such research and partnerships to help facilitate and manage the strategic shifts and risks during the energy transition.
Conclusion & Future Perspectives
This case study presents three types of scenarios: a war, a hurricane, and a lawsuit. These scenarios, though individually unlikely, have a history of frequency and severity that provides a basis for estimating the future distribution of events. It is not possible to predict the timing and severity of any particular event; nevertheless, planning around unpredictable events can be an effective component to a company’s risk management preparations. This is at the heart of the wide and continuing push for companies, as well as governmental agencies and not-for-profit organisations, to declare their risk exposures analogous to the way they declare asset values.
A deeper risk analysis would expand the qualitative analysis presented here in several ways. A comprehensive approach would dramatically increase the number and type of stress test scenarios, given the unpredictability of catastrophic events which a global organisation experiences – recurring impacts from non-recurring events. Attention to emerging risks rather than shock events is also important; this is increasingly recognised in business and regulation practices. Finally, quantifying risk exposure across a comprehensive
1 (Cambridge Centre for Risk Studies 2018)
set of risks is a first step toward cost-benefit analysis of resilience management and investment. We believe this study contributes to the general intellectual field of building standardised evaluation processes for enabling more resilient organisations.
8Scenario Applications: Cambridge Centre for Risk Studies Stress Testing Companies in the Energy Value Chain
Section 1: IntroductionThe energy value chain is a vital component of the global economy, an industry whose outputs underpin the growth and productivity of all other sectors of the global economy. The future business prospects of the companies that are part of this value chain range widely and depend on both internal and external forces. In this case study, we present the application of scenario stress tests to energy value chain companies as a systematic approach for highlighting potential futures and assessing risks which may impact an organisation, sectors, or economies and for managing emerging risks.
Futures scenarios may range from a business-as-usual perspective without major disruptions to its production or consumption, or the extreme converse - massive fundamental shifts to the energy landscape. This range of futures challenges strategic planning at companies, in particular, their risk management departments who have added responsibilities for incorporating this wide array of futures into their standard risk frameworks. Emerging risks pose particular risks to energy value chain companies. Given their capital investments and size, energy companies are often less agile to respond to internal and external risks that threaten their business models. These companies often have high capital investments in physical infrastructure, real estate and highly specialised staff, all of which make it difficult to execute rapid strategy changes.
Good practices in risk management serve to avoid or respond effectively to crises whether the risks are recognised or emerging. We argue that current risk management practices of global corporations may need to be rethought, or even reinvented to address tail risks - including processes for their identification, evaluation, mitigation, and monitoring. Traditionally, risks associated with regulation, natural hazards, geopolitics and macroeconomics have been key drivers of risk for the energy sectors. While high severity shocks in those risk areas will always be relevant, trends such as changes in climate and social sentiment regarding environmental issues represent new classes of risks which have yet to fully manifest through company balance sheets.
The research presented in this report is part of the Cambridge Centre for Risk Studies’ research track on corporate risk profiling.2 In partnership with the Institute for Risk Management, it is informed by views from risk management specialists representing companies within the energy value chain. These views were elicited through a combination of individual interviews, workshops, focus groups, live polling and an online survey.
2 (Cambridge Centre for Risk Studies 2018)
The general objectives of our overall research programmes are to better understand current views, practices, and mitigations of risks at corporations and how they are adapting to meet future challenges and opportunities. While this report focusses on global corporations within the energy value chain, we expect organisations from other sectors to find considerable overlaps on the definition and application of scenarios as part of their risk management processes.
9Cambridge Centre for Risk Studies Scenario Applications:
Stress Testing Companies in the Energy Value Chain
Companies within the Energy Value ChainWe refer to the Energy Value Chain as the collective of the organisations from producers and refiners of hydrocarbons in the upstream to heavy consumers of carbon-based inputs downstream. This covers fossil fuel producers, mainly in oil and gas, from exploration to retailing, and coal mining; and energy intensive firms such as carbon-based power generators and intrinsically high energy consumers such as metal smelters and cement manufacturers.
Companies in the Energy Value Chain are often referred to as heavy industries since they are capital-intensive, involve movement or processing of massive tonnages of raw material, and have high barriers to entry. The value chain starts with the supply chain of production and distribution and completes with the consumer.
We categorise companies by business sector segmentation using the Global Industry Classification Standard (GICS) 3. This classification system is particularly well aligned with market reporting and analysis at the individual company level as well as broad categories of sectors. The GICS structure consists of 11 sectors, 24 industry groups, 69 industries, and 158 sub-industries and applies to companies globally. Energy value chain companies are dispersed throughout the energy, materials, industrials, and utilities GICS sectors. Alternative classification standards for future consideration include the Standard Industrial Codes (SIC), and North America Industrial Coding System (NAICS).
Within the oil and gas industry, the value chain can be broadly described as the following 4:• Upstream sector: all activities associated with
exploration & production• Midstream sector: Transportation of crude oil to refineries
and storage and marketing of wholesale products• Downstream sectors: Refining, delivery to retail hubs,
sales & marketing of products
Main participants in the international oil markets can be categorised as the following:• Super Major Companies (SMCs)• National Oil Company (NOCs)• International Oil Companies (IOCs)
Beyond the focus of this report, there is a growing number of companies within the renewable energy, utilities, and technology sectors that are involved in the production,
3 (S&P Global & MSCI 2018)4 (Saleh 2018)
distribution, and support of clean energy. In particular, solar, wind, battery, and other technologies are making significant and growing contributions as viable energy sources. The future holds much optimism for renewables as their installed capacity is burgeoning worldwide. The European Environment Agency estimates around 17% of EU energy consumed came from renewable sources in 2017 with 11 EU member countries already meeting their 2020 targets. 5
This case study is part of the “Cambridge Case Study Series”, a collection of analyses of risk management practices of global corporations. There is more publicly available data on companies in the US and Europe than other regions and literature and media coverage of business activities and reporting in these regions tend to follow suit. Likewise, the data and analysis in this case study has greater focus on sectors and companies located in the US and Europe. Additionally, this case study covers topics relevant to publicly listed companies with traditional business models in the energy value chain rather than those in the renewable energy markets.
5 (European Environment Agency 2018)
10Scenario Applications: Cambridge Centre for Risk Studies Stress Testing Companies in the Energy Value Chain
Section 2: The Business Environment of Energy Value Chain Companies
A Market ViewMany companies in the Energy Value Chain are large, longstanding, and widely considered as “blue chip”. Given the high barriers to entry and capital requirements, it is not a surprise that challengers are not able to swiftly overtake market share and out-compete existing incumbents. This is in stark contrast to technology and information services companies that are able to dominate market capitalisation with comparatively low human and physical capital expenditures. However, the history of innovation shows storied paths of “blue chip” companies losing market share and eventually entering into distress as a result of disruptive business forces.
Given the size of many of these energy value chain companies, they are on one hand well-positioned to benefit from an international and interconnected marketplace shaped by globalisation. On the other hand, the world now faces renewed challenges to global business in the form of resurgent nationalism, protectionism, and reverses to international trade agreements - these factors certainly heighten risks to this industry.
The trends within the energy value chain show hydrocarbon production firms in relative decline over the last two decades as measured by their dominance of the global economy – they are in some circles referred to as a “sunset industry”. As a reference point, the SMCs were consistently ranked in the top ten by market capitalisation until 2014 when they became outranked by the big technology companies such as Amazon, Apple, Facebook, Google, and Microsoft.6 Prevailing business environments and market trends are challenging the core of the business model of oil - “peak oil demand” is a phrase used by energy analysts to describe the end of growth of oil consumption.
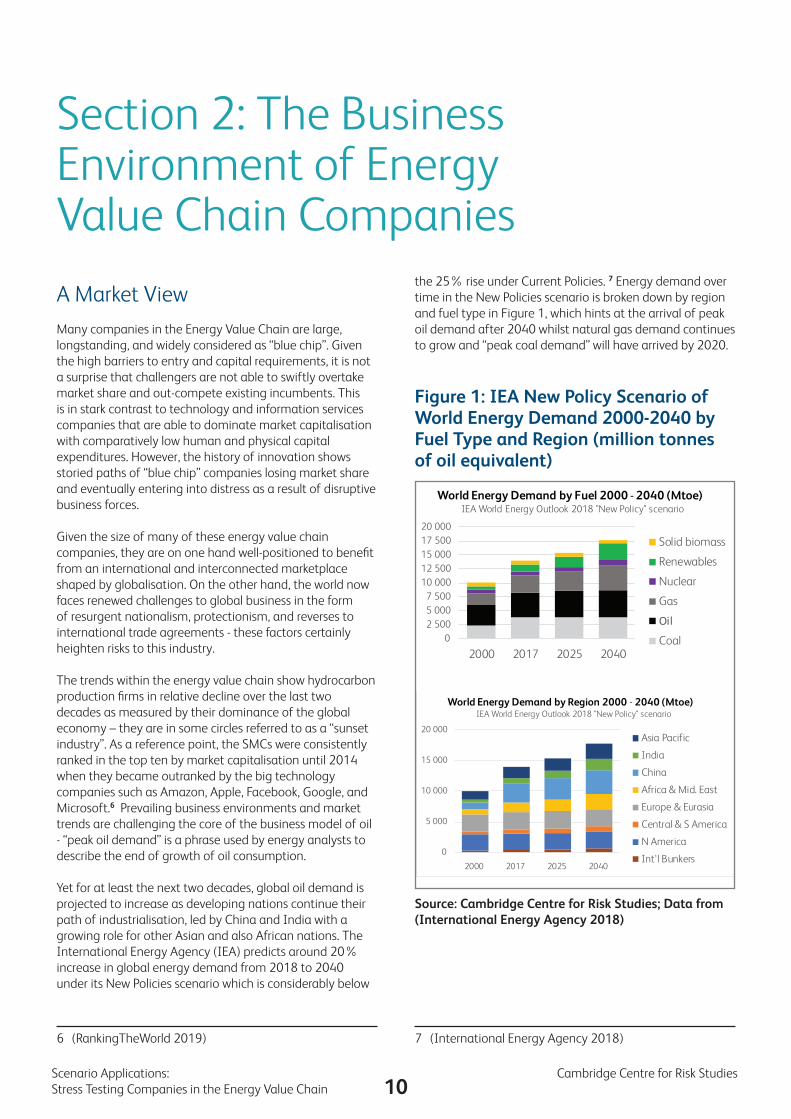
Yet for at least the next two decades, global oil demand is projected to increase as developing nations continue their path of industrialisation, led by China and India with a growing role for other Asian and also African nations. The International Energy Agency (IEA) predicts around 20% increase in global energy demand from 2018 to 2040 under its New Policies scenario which is considerably below
6 (RankingTheWorld 2019)
the 25% rise under Current Policies. 7 Energy demand over time in the New Policies scenario is broken down by region and fuel type in Figure 1, which hints at the arrival of peak oil demand after 2040 whilst natural gas demand continues to grow and “peak coal demand” will have arrived by 2020.
Figure 1: IEA New Policy Scenario of World Energy Demand 2000-2040 by Fuel Type and Region (million tonnes of oil equivalent)
7 (International Energy Agency 2018)
02 5005 0007 500
10 00012 50015 00017 50020 000
2000 2017 2025 2040
World Energy Demand by Fuel 2000 - 2040 (Mtoe)IEA World Energy Outlook 2018 "New Policy" scenario
Solid biomass
Renewables
Nuclear
Gas
Oil
Coal
0
5 000
10 000
15 000
20 000
2000 2017 2025 2040
World Energy Demand by Region 2000 - 2040 (Mtoe)IEA World Energy Outlook 2018 "New Policy" scenario
Asia Pacific
India
China
Africa & Mid. East
Europe & Eurasia
Central & S America
N America
Int'l Bunkers
Source: Cambridge Centre for Risk Studies; Data from (International Energy Agency 2018)
11Cambridge Centre for Risk Studies Scenario Applications:
Stress Testing Companies in the Energy Value Chain
Beyond 2040, estimates are wider ranging on whether energy demand will plateau or continue to grow. Some believe that global energy demand will flatten due to increased energy efficiency, growth in electrification, 8,9 pervasiveness of renewables, advancements in battery technology, and potential for ace disruptors. Others believe that energy demand will continue to increase due to the growth of the middle class in developing countries, the power demands of a more technologically advanced world, and to meeting the consequences of climate change. However, there is consensus that demand for carbon-based energy sources will have peaked and will begin a trajectory of decline. 10, 11
In the long term, oil and coal prices are expected to decrease relative to other energy sources. They will be replaced by natural gas and renewable energy production which will reduce CO2 outputs, noxious nitrous, sulphurous and particulate emissions. A specific pressure point is visible in downstream oil refining, namely the prospect of decreasing petroleum and diesel sales for vehicles in urban areas, driven by clean air regulation and public health concerns rather than reductions in CO2 emissions.12 This looming retail challenge is significant but it is debatable that this poses a viability risk to oil and gas companies when viewed in the context of rising demand for their products between now and 2040.
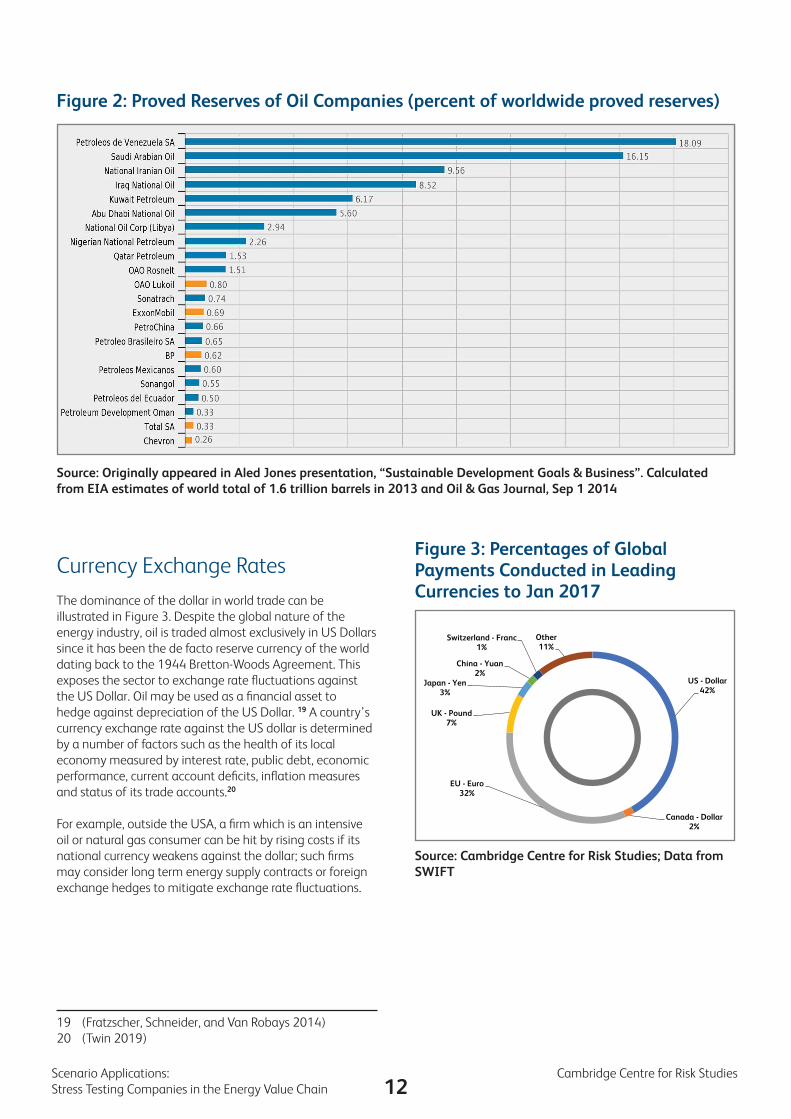
State of GeopoliticsDistribution of fossil fuel reserves is an important part of the value chain. Figure 2 highlights the significance of the Middle East and South America as sources of petroleum and hence the impact on global oil and gas industry of their national companies. Taking the reliance on those regional economies for oil revenues together with global pressures to reduce the consumption of hydrocarbons, the existence of significant geopolitical risk is arguably more salient than traditional economic risk to those economies. The chance of massive disruption to the global production of oil and gas has been growing.
Taking a geopolitical view of the demand side of fossil fuels, it is difficult to overstate the future impact of China, which has steadily expanded the scope, scale and influence of its marine and transportation infrastructure sectors over the past two decades. According to the Financial Times,
8 (Mai et al. 2012)9 (Citi 2019)10 (McKinsey & Company 2019)11 (BP plc 2019)12 (Oxford Energy Forum 2018)
‘two-thirds of global container traffic passes through Chinese owned or invested ports,’ additionally, ‘Beijing’s shipping lines deliver more containers [throughput] than those from any other country.’ 13. Transportation infrastructure is often developed in Belt and Road Initiative partner nations on terms highly favourable to China and in which China can leverage its geo-economic superiority to gain strategic advantage. Taken together with the modernisation of the Peoples Liberation Army Navy (PLAN), Chinese diversification in the marine and transportation infrastructure sector could prove to be a critical source for manmade risk and shocks if geopolitical tensions were to escalate. 14 15 16 17 18
13 (Kynge et al. 2017)14 (Kynge et al. 2017)15 (Office of the Secretary of Defense 2018)16 (Thorne and Spevack 2017)17 (Linden 2018)18 (Blackwill and Harris 2017)
12Scenario Applications: Cambridge Centre for Risk Studies Stress Testing Companies in the Energy Value Chain
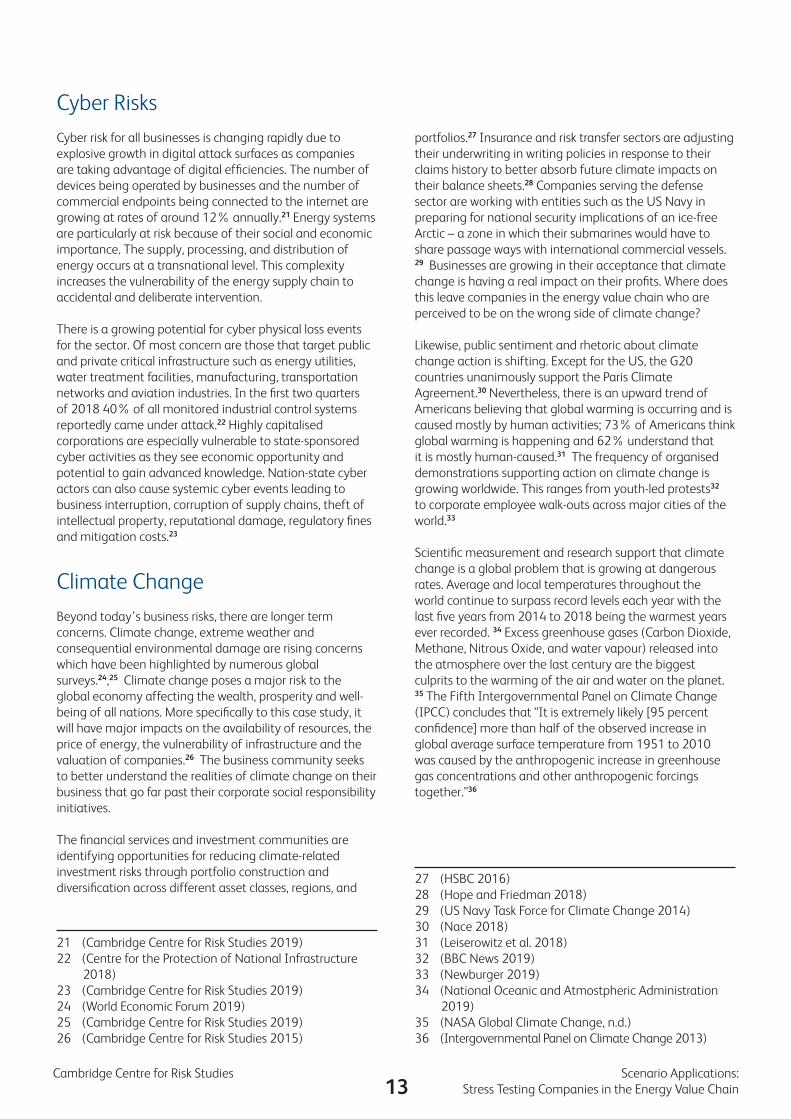
Currency Exchange RatesThe dominance of the dollar in world trade can be illustrated in Figure 3. Despite the global nature of the energy industry, oil is traded almost exclusively in US Dollars since it has been the de facto reserve currency of the world dating back to the 1944 Bretton-Woods Agreement. This exposes the sector to exchange rate fluctuations against the US Dollar. Oil may be used as a financial asset to hedge against depreciation of the US Dollar. 19 A country’s currency exchange rate against the US dollar is determined by a number of factors such as the health of its local economy measured by interest rate, public debt, economic performance, current account deficits, inflation measures and status of its trade accounts.20
For example, outside the USA, a firm which is an intensive oil or natural gas consumer can be hit by rising costs if its national currency weakens against the dollar; such firms may consider long term energy supply contracts or foreign exchange hedges to mitigate exchange rate fluctuations.
19 (Fratzscher, Schneider, and Van Robays 2014)20 (Twin 2019)
Source: Originally appeared in Aled Jones presentation, “Sustainable Development Goals & Business”. Calculated from EIA estimates of world total of 1.6 trillion barrels in 2013 and Oil & Gas Journal, Sep 1 2014
Figure 2: Proved Reserves of Oil Companies (percent of worldwide proved reserves)
Figure 3: Percentages of Global Payments Conducted in Leading Currencies to Jan 2017
Source: Cambridge Centre for Risk Studies; Data from SWIFT
US - Dollar42%
Canada - Dollar2%
EU - Euro32%
UK - Pound7%
Japan - Yen3%
China - Yuan2%
Switzerland - Franc1%
Other11%
Percentage of global payments
13Cambridge Centre for Risk Studies Scenario Applications:
Stress Testing Companies in the Energy Value Chain
Cyber RisksCyber risk for all businesses is changing rapidly due to explosive growth in digital attack surfaces as companies are taking advantage of digital efficiencies. The number of devices being operated by businesses and the number of commercial endpoints being connected to the internet are growing at rates of around 12% annually.21 Energy systems are particularly at risk because of their social and economic importance. The supply, processing, and distribution of energy occurs at a transnational level. This complexity increases the vulnerability of the energy supply chain to accidental and deliberate intervention.
There is a growing potential for cyber physical loss events for the sector. Of most concern are those that target public and private critical infrastructure such as energy utilities, water treatment facilities, manufacturing, transportation networks and aviation industries. In the first two quarters of 2018 40% of all monitored industrial control systems reportedly came under attack.22 Highly capitalised corporations are especially vulnerable to state-sponsored cyber activities as they see economic opportunity and potential to gain advanced knowledge. Nation-state cyber actors can also cause systemic cyber events leading to business interruption, corruption of supply chains, theft of intellectual property, reputational damage, regulatory fines and mitigation costs.23
Climate ChangeBeyond today’s business risks, there are longer term concerns. Climate change, extreme weather and consequential environmental damage are rising concerns which have been highlighted by numerous global surveys.24,25 Climate change poses a major risk to the global economy affecting the wealth, prosperity and well-being of all nations. More specifically to this case study, it will have major impacts on the availability of resources, the price of energy, the vulnerability of infrastructure and the valuation of companies.26 The business community seeks to better understand the realities of climate change on their business that go far past their corporate social responsibility initiatives.
The financial services and investment communities are identifying opportunities for reducing climate-related investment risks through portfolio construction and diversification across different asset classes, regions, and
21 (Cambridge Centre for Risk Studies 2019)22 (Centre for the Protection of National Infrastructure
2018)23 (Cambridge Centre for Risk Studies 2019)24 (World Economic Forum 2019)25 (Cambridge Centre for Risk Studies 2019)26 (Cambridge Centre for Risk Studies 2015)
portfolios.27 Insurance and risk transfer sectors are adjusting their underwriting in writing policies in response to their claims history to better absorb future climate impacts on their balance sheets.28 Companies serving the defense sector are working with entities such as the US Navy in preparing for national security implications of an ice-free Arctic – a zone in which their submarines would have to share passage ways with international commercial vessels. 29 Businesses are growing in their acceptance that climate change is having a real impact on their profits. Where does this leave companies in the energy value chain who are perceived to be on the wrong side of climate change?
Likewise, public sentiment and rhetoric about climate change action is shifting. Except for the US, the G20 countries unanimously support the Paris Climate Agreement.30 Nevertheless, there is an upward trend of Americans believing that global warming is occurring and is caused mostly by human activities; 73% of Americans think global warming is happening and 62% understand that it is mostly human-caused.31 The frequency of organised demonstrations supporting action on climate change is growing worldwide. This ranges from youth-led protests32 to corporate employee walk-outs across major cities of the world.33
Scientific measurement and research support that climate change is a global problem that is growing at dangerous rates. Average and local temperatures throughout the world continue to surpass record levels each year with the last five years from 2014 to 2018 being the warmest years ever recorded. 34 Excess greenhouse gases (Carbon Dioxide, Methane, Nitrous Oxide, and water vapour) released into the atmosphere over the last century are the biggest culprits to the warming of the air and water on the planet. 35 The Fifth Intergovernmental Panel on Climate Change (IPCC) concludes that “It is extremely likely [95 percent confidence] more than half of the observed increase in global average surface temperature from 1951 to 2010 was caused by the anthropogenic increase in greenhouse gas concentrations and other anthropogenic forcings together.”36
27 (HSBC 2016)28 (Hope and Friedman 2018)29 (US Navy Task Force for Climate Change 2014)30 (Nace 2018)31 (Leiserowitz et al. 2018)32 (BBC News 2019)33 (Newburger 2019)34 (National Oceanic and Atmostpheric Administration
2019)35 (NASA Global Climate Change, n.d.)36 (Intergovernmental Panel on Climate Change 2013)
14Scenario Applications: Cambridge Centre for Risk Studies Stress Testing Companies in the Energy Value Chain
There is a disconnect between the global economics view of future demand for fossil fuels, represented in Figure 1, and the scientific consensus that fossil fuel emissions continue to drive up the average temperature of the planet, increasing the probability and severity of climatic disasters. The IPCC warned in 201837 that the planet will reach the crucial average temperature threshold of 1.5 degrees Celsius above pre-industrial levels as early as 2030. The IPCC points out that compared to 1.5 degrees, 2 degrees of warming exposes hundreds of millions of people to the risks of extreme drought, wildfires, floods and food shortages. While the future economic and social damage from climate change will be massive if not catastrophic 38, climate change damage can be reduced substantially by significant reduction in CO2 emissions in the next decade and beyond. The short term co-benefits of reduced CO2 emissions are also substantial, 39 particularly improved public health from cleaner air.
In the words of Nitin Nohria, the dean of Harvard Business School, “None of the major problems confronting the globe today—sustainability, health care, poverty, financial-system repair—can be solved unless business plays a significant role.” 40 Climate change is one of the world’s most pressing problems without an obvious solution and thus companies in the energy value chain will need to be active participants in order to support an orderly transition from a high-carbon to a low-carbon energy economy.
What is the future of the companies within the energy value chain, and will they have a role in a non-carbon-based energy economy? Considering that the energy majors currently have control of the energy distribution networks and access to large amounts of capital, it seems likely that they will be significant shapers of the future of the energy markets. A clearer picture of their risks may enable companies in making the necessary strategic pivots to remain competitive in a low-carbon economy and rise to the forces from subsequent momentous business model disruptions. We posit that a risk lens offers an objective business relevant focus to the energy transition that will help reconcile meeting the world’s energy demand with reducing greenhouse gases. See Appendix A for more discussion on the transitioning to a low-carbon economy.
37 (IPCC 2018)38 (Economist Intelligence Unit 2015)39 (Hamilton 2017)40 (Nohria 2010)
15Cambridge Centre for Risk Studies Scenario Applications:
Stress Testing Companies in the Energy Value Chain
Self-Reported Top Enterprise Risks by Companies in the Energy Value Chain
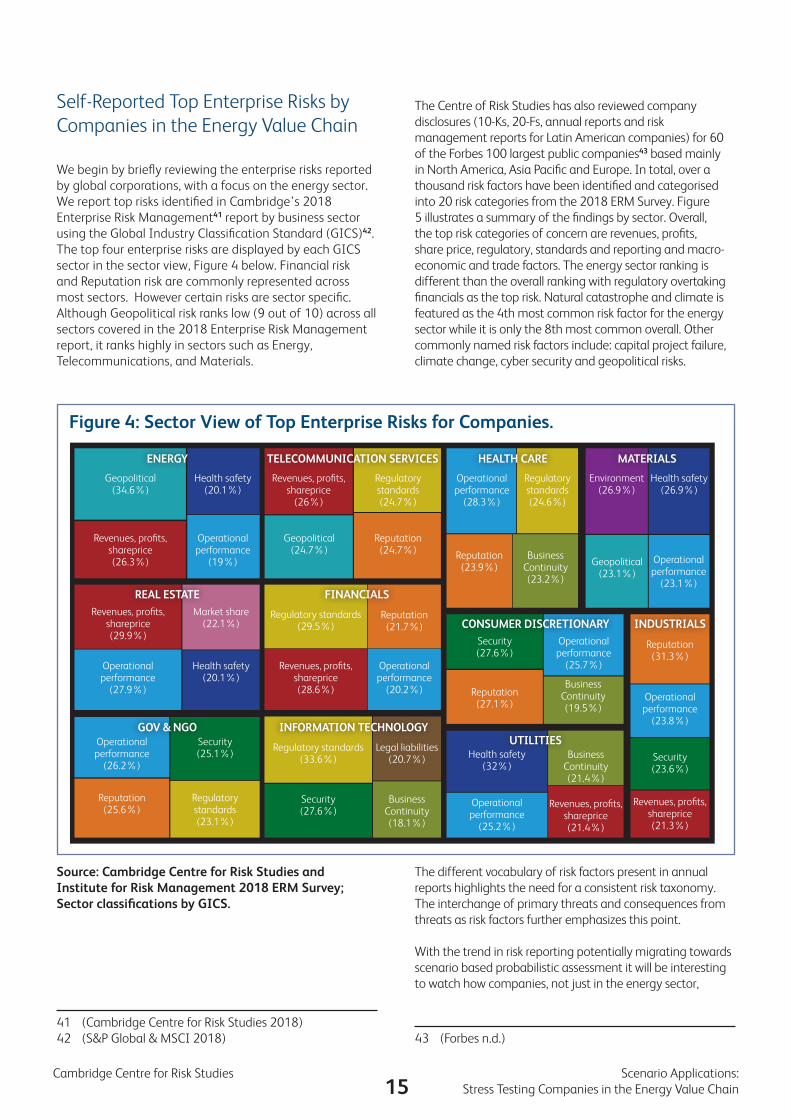
We begin by briefly reviewing the enterprise risks reported by global corporations, with a focus on the energy sector. We report top risks identified in Cambridge’s 2018 Enterprise Risk Management41 report by business sector using the Global Industry Classification Standard (GICS)42. The top four enterprise risks are displayed by each GICS sector in the sector view, Figure 4 below. Financial risk and Reputation risk are commonly represented across most sectors. However certain risks are sector specific. Although Geopolitical risk ranks low (9 out of 10) across all sectors covered in the 2018 Enterprise Risk Management report, it ranks highly in sectors such as Energy, Telecommunications, and Materials.
41 (Cambridge Centre for Risk Studies 2018)42 (S&P Global & MSCI 2018)
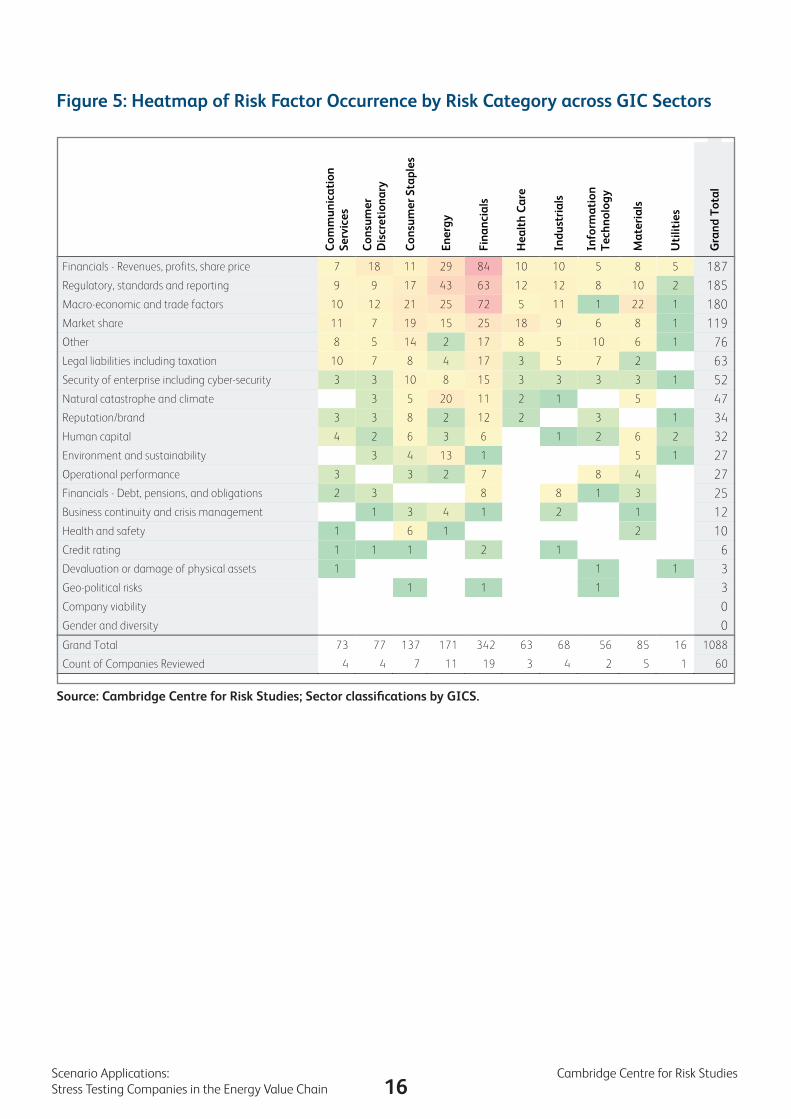
The Centre of Risk Studies has also reviewed company disclosures (10-Ks, 20-Fs, annual reports and risk management reports for Latin American companies) for 60 of the Forbes 100 largest public companies43 based mainly in North America, Asia Pacific and Europe. In total, over a thousand risk factors have been identified and categorised into 20 risk categories from the 2018 ERM Survey. Figure 5 illustrates a summary of the findings by sector. Overall, the top risk categories of concern are revenues, profits, share price, regulatory, standards and reporting and macro-economic and trade factors. The energy sector ranking is different than the overall ranking with regulatory overtaking financials as the top risk. Natural catastrophe and climate is featured as the 4th most common risk factor for the energy sector while it is only the 8th most common overall. Other commonly named risk factors include: capital project failure, climate change, cyber security and geopolitical risks.
The different vocabulary of risk factors present in annual reports highlights the need for a consistent risk taxonomy. The interchange of primary threats and consequences from threats as risk factors further emphasizes this point.
With the trend in risk reporting potentially migrating towards scenario based probabilistic assessment it will be interesting to watch how companies, not just in the energy sector,
43 (Forbes n.d.)
ENERGY
Geopolitical(34.6%)
Geopolitical(24.7%)
Geopolitical(23.1%)
Reputation(24.7%) Reputation
(23.9%)
Security(27.6%)
Security(27.6%)
Health safety(32%)
Operational performance
(25.2%)
Reputation(27.1%)
Reputation(21.7%)
Reputation(31.3%)
Operational performance
(23.8%)
Security(23.6%)
Revenues, profits, shareprice(21.3%)
Operational performance
(20.2%)
Operational performance
(25.7%)
Business Continuity(23.2%)
Business Continuity(19.5%)
Business Continuity(21.4%)
Revenues, profits, shareprice (21.4%)
Revenues, profits, shareprice (26.3%)
Revenues, profits, shareprice (29.9%)
Market share (22.1%)
Revenues, profits, shareprice
(26%)
Regulatory standards(24.7%)
Regulatory standards(29.5%)
Regulatory standards(33.6%)
Legal liabilities(20.7%)
Business Continuity(18.1%)
Revenues, profits, shareprice (28.6%)
Regulatory standards(24.6%)
Environment (26.9%)
Health safety(20.1%)
Health safety(20.1%)
Operational performance
(27.9%)
Operational performance
(26.2%)
Reputation(25.6%)
Security(25.1%)
Regulatory standards(23.1%)
Health safety(26.9%)
Operational performance
(19%) Operational performance
(23.1%)
Operational performance
(28.3%)
TELECOMMUNICATION SERVICES HEALTH CARE MATERIALS
REAL ESTATE FINANCIALS
CONSUMER DISCRETIONARY INDUSTRIALS
UTILITIESINFORMATION TECHNOLOGYGOV & NGO
Figure 4: Sector View of Top Enterprise Risks for Companies.
Source: Cambridge Centre for Risk Studies and Institute for Risk Management 2018 ERM Survey; Sector classifications by GICS.
16Scenario Applications: Cambridge Centre for Risk Studies Stress Testing Companies in the Energy Value Chain
Figure 5: Heatmap of Risk Factor Occurrence by Risk Category across GIC Sectors
Com
mun
icat
ion
Serv
ices
Con
sum
er
Dis
cret
iona
ry
Con
sum
er S
tapl
es
Ener
gy
Fina
ncia
ls
Hea
lth
Car
e
Indu
stri
als
Info
rmat
ion
Tec
hnol
ogy
Mat
eria
ls
Uti
litie
s
Gra
nd T
otal
Financials - Revenues, profits, share price 7 18 11 29 84 10 10 5 8 5 187
Regulatory, standards and reporting 9 9 17 43 63 12 12 8 10 2 185
Macro-economic and trade factors 10 12 21 25 72 5 11 1 22 1 180
Market share 11 7 19 15 25 18 9 6 8 1 119
Other 8 5 14 2 17 8 5 10 6 1 76
Legal liabilities including taxation 10 7 8 4 17 3 5 7 2 63
Security of enterprise including cyber-security 3 3 10 8 15 3 3 3 3 1 52
Natural catastrophe and climate 3 5 20 11 2 1 5 47
Reputation/brand 3 3 8 2 12 2 3 1 34
Human capital 4 2 6 3 6 1 2 6 2 32
Environment and sustainability 3 4 13 1 5 1 27
Operational performance 3 3 2 7 8 4 27
Financials - Debt, pensions, and obligations 2 3 8 8 1 3 25
Business continuity and crisis management 1 3 4 1 2 1 12
Health and safety 1 6 1 2 10
Credit rating 1 1 1 2 1 6
Devaluation or damage of physical assets 1 1 1 3
Geo-political risks 1 1 1 3
Company viability 0
Gender and diversity 0
Grand Total 73 77 137 171 342 63 68 56 85 16 1088
Count of Companies Reviewed 4 4 7 11 19 3 4 2 5 1 60
Source: Cambridge Centre for Risk Studies; Sector classifications by GICS.
17Cambridge Centre for Risk Studies Scenario Applications:
Stress Testing Companies in the Energy Value Chain
transform their risk exposure communications. Companies in the energy value chain rely on long term capital investments, and thus are particularly sensitive to the alignment of their strategies with business implementation and associated risk management planning. High capital intensity is needed to support infrastructure for energy production and distribution and warrants careful cost benefit analysis and risk assessments. Given that the wider business, regulatory and societal environment is clouded by significant uncertainty emerging from a multitude of varying internal and external conditions, scenario analysis provides broad structures that are particularly conducive to the exploration of risks.
Introduction to Scenario Stress Tests Scenario analysis is a common approach used by managers to view organisations in an imagined state in order to assess risks and opportunities. In the 2018 Enterprise Risk Management survey,44 63% of respondents said their company uses scenarios as part of their business risk analysis. Meanwhile, respondents highlight that there is not a standard scenario library tool for companies to use for assessment and management of risk.
Scenarios are used to challenge the business-as-usual mentality in the context of risks, whether internal to the organisation or external/systemic, short or long term, or having the characteristic of a business disruption or a strategic shift. Perhaps the most common uses of scenarios are as stress tests, either as operational shocks or strategic challenges. This forms the basis for risk assessments and can be used to facilitate reporting, management, and mitigation of risks; and ultimately to rationalise investment in resilience. Scenarios are valued in management for developing or capturing creative thinking about plausible futures, rather than attempting to predict the timing or severity of particular events. The Cambridge Centre for Risk Studies acknowledges that foreseeable risks, which can be described and even quantified by scenarios, are too often unpredictable regarding timing and other characteristics.
A critical distinction can be made between scenarios that examine emerging trends, which are of concern for long-term strategic planning, and those that consider catastrophes
44 (Cambridge Centre for Risk Studies 2018)
or shocks or tail risks, which represent acute threats that may trigger simultaneous impacts across an organisation and its supporting ecosystem. This report focusses on how catastrophic or shock scenarios can be used to assess risk to firms in the energy value chain.
Since the 1970s, scenarios have been used extensively in the energy sector for exposing strategic threats to oil exploration and production associated with changing geopolitics and markets. Royal Dutch Shell brought scenario planning from the arena of national security into the corporate boardroom, foreseeing the emergence, but not the time of arrival, of the world’s first global oil cartel which duly arrived in 1973 in the form of the Organization of the Petroleum Exporting Countries, OPEC. Scenario planning at Shell has also been credited with advance warning, not quite prediction but visibility of the future arrival, of the more severe price shock of 1979, the collapse of the oil market in 1986, the fall of the Soviet Union, the rise of Muslim radicalism, and increasing pressure on companies to address environmental and social problems. 45
Catastrophe analysis has been a major factor in the success of the modern insurance industry. A modelling revolution was driven by the financial aftermath of Hurricane Andrew in the 1980s which saw the demise of many North American insurers. To clarify the goal of catastrophe risk analysis, we address two questions that are familiar when undertaking a scenario analysis.
First, what is the scenario for? We use shock scenarios to gain a better understanding of tail risk, starting with identification of a variety of extreme but low probability events, and then considering how severe their impacts might be. Second, how does examination of shock scenarios help to assess and manage risk? Workshopping scenario impacts, on the basis of scenarios that are calibrated on real events from the historical catalogue of shocks, is an effective way to improve qualitative understanding of risks which are present but not top of mind. This is a step toward quantitative assessment of risk exposures which is itself preparation for understanding the tradeoff between the value of resilience – reducing losses or capitalising on opportunities that are intrinsic to shocks –, and the cost of investments in resilience capacity.
45 (Kleiner 2003)
Section 3: Exploration of Risks through Scenarios
18Scenario Applications: Cambridge Centre for Risk Studies Stress Testing Companies in the Energy Value Chain
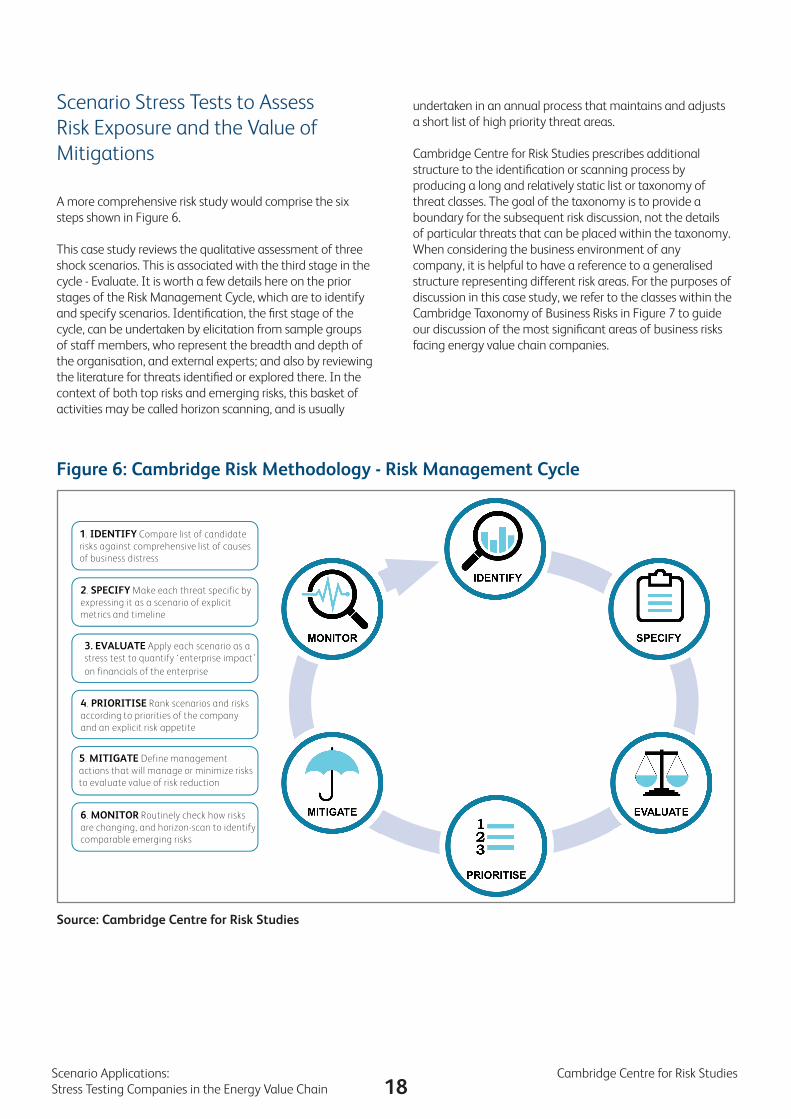
3. EVALUATE Apply each scenario as a stress test to quantify ‘enterprise impact’ on financials of the enterprise
4. PRIORITISE Rank scenarios and risks according to priorities of the company and an explicit risk appetite
5. MITIGATE Define management actions that will manage or minimize risks to evaluate value of risk reduction
6. MONITOR Routinely check how risks are changing, and horizon-scan to identify comparable emerging risks
1. IDENTIFY Compare list of candidate risks against comprehensive list of causes of business distress
2. SPECIFY Make each threat specific by expressing it as a scenario of explicit metrics and timeline
Figure 6: Cambridge Risk Methodology - Risk Management Cycle
Source: Cambridge Centre for Risk Studies
Scenario Stress Tests to Assess Risk Exposure and the Value of Mitigations
A more comprehensive risk study would comprise the six steps shown in Figure 6.
This case study reviews the qualitative assessment of three shock scenarios. This is associated with the third stage in the cycle - Evaluate. It is worth a few details here on the prior stages of the Risk Management Cycle, which are to identify and specify scenarios. Identification, the first stage of the cycle, can be undertaken by elicitation from sample groups of staff members, who represent the breadth and depth of the organisation, and external experts; and also by reviewing the literature for threats identified or explored there. In the context of both top risks and emerging risks, this basket of activities may be called horizon scanning, and is usually
undertaken in an annual process that maintains and adjusts a short list of high priority threat areas.
Cambridge Centre for Risk Studies prescribes additional structure to the identification or scanning process by producing a long and relatively static list or taxonomy of threat classes. The goal of the taxonomy is to provide a boundary for the subsequent risk discussion, not the details of particular threats that can be placed within the taxonomy. When considering the business environment of any company, it is helpful to have a reference to a generalised structure representing different risk areas. For the purposes of discussion in this case study, we refer to the classes within the Cambridge Taxonomy of Business Risks in Figure 7 to guide our discussion of the most significant areas of business risks facing energy value chain companies.
19Cambridge Centre for Risk Studies Scenario Applications:
Stress Testing Companies in the Energy Value Chain
Figu
re 7
: Cam
brid
ge T
axon
omy
of B
usin
ess
Ris
ks
Sou
rce:
Cam
brid
ge C
entr
e fo
r R
isk
Stud
ies,
201
9 C
TB
R_V
2.0
Non
-Com
plia
nce
Emer
ging
Reg
ulat
ion
Inte
rnal
Cor
rupt
ion
& F
raud
Neg
ligen
ceRe
vise
d A
ccou
ntin
g St
anda
rds
Occ
upat
iona
l Hea
lth &
Saf
ety
Litig
atio
nPr
ivat
e La
wsu
itM
ass
Tort
Clas
s A
ctio
n
Stra
tegi
c Pe
rfor
man
ceD
ives
titur
esJo
int V
entu
res
Mer
gers
& A
cqui
sitio
nsRe
stru
ctur
ing
Poor
Inve
stm
ent
Man
agem
ent P
erfo
rman
ceEx
ecut
ive
Mis
man
agem
ent
Ine
ectiv
e Bo
ard
Man
agem
ent E
xecu
tion
Failu
re
Busi
ness
Mod
el D
eci
enci
esTe
chno
logy
Cust
omer
Pre
fere
nce
Chan
ge
Pens
ion
Man
agem
ent
Cont
ribu
tion
Man
agem
ent
Fund
Man
agem
ent
Prod
ucts
& S
ervi
ces
Prod
uct D
efec
t/Fa
ilure
Inno
vatio
n (R
&D
) Fai
lure
Soci
oeco
nom
ic T
rend
sA
gein
g Po
pula
tion
Gen
der I
mba
lanc
eW
ealth
Ineq
ualit
yPo
or E
duca
tiona
l Sta
ndar
dsM
igra
tion
Hum
an C
apita
lFa
ilure
To
Att
ract
Tal
ent
Gen
der &
Div
ersi
tyLa
bour
Dis
pute
s &
Str
ikes
Loss
of K
ey P
erso
nnel
Empl
oyee
Mis
cond
uct
Bran
d Pe
rcep
tion
Fake
New
sN
egat
ive
Med
ia C
over
age
Key
Inen
cer D
isru
ptio
nN
egat
ive
Cust
omer
Exp
erie
nce
Sust
aina
ble
Livi
ngCo
nsum
er A
ctiv
ism
Sust
aina
ble
Purc
hasi
ngSu
pply
Cha
in P
rove
nanc
eD
iet
Hea
lth T
rend
sO
besi
tyLo
ngev
ityA
ntim
icro
bial
Res
ista
nce
Med
ical
Bre
akth
roug
hsH
ealth
care
Soci
al C
are
Infe
ctio
us D
isea
seIn
uenz
a Pa
ndem
ics
Coro
navi
rus-
like
Epid
emic
sVi
ral H
emor
rhag
ic F
ever
sPr
even
tabl
e D
isea
se O
utbr
eaks
Unk
now
n Em
erge
nt D
isea
ses
Extr
eme
Wea
ther
Floo
dTr
opic
al W
inds
torm
Tem
pera
te W
inds
torm
Dro
ught
Free
zeH
eatw
ave
Wild
re
Geo
phys
ical
Eart
hqua
keVo
lcan
ic E
rupt
ion
Tsun
ami
Spac
e Sola
r Sto
rmA
stro
nom
ical
Impa
ct E
vent
Clim
ate
Chan
gePh
ysic
alLi
abili
tyTr
ansi
tion
Incr
ease
in E
xtre
me
Wea
ther
Sea
Leve
l Ris
eO
cean
Aci
dica
tion
Low
er C
arbo
n Ec
onom
y
Envi
ronm
enta
l Deg
rada
tion
Was
te &
Pol
lutio
nBi
odiv
ersi
ty L
oss
Ecos
yste
m C
olla
pse
Def
ores
tatio
nSo
il D
egra
datio
n
Nat
ural
Res
ourc
e D
eci
ency
Foss
il Fu
els
Biog
eoch
emic
als
Raw
Mat
eria
ls
Wat
er
Food
Sec
urity
Ani
mal
Epi
dem
icPl
ant E
pide
mic
Fam
ine
Dis
rupt
ive
Tech
nolo
gyE-
Com
mer
ceG
ig E
cono
my
Art
cial
Inte
llige
nce
5GTe
chno
logy
Bloc
kcha
inRo
botic
s &
Aut
omat
ion
Aug
men
ted/
Virt
ual R
ealit
yCr
ypto
curr
ency
Aut
onom
ous
Vehi
cles
Dro
nes
Med
ical
Adv
ance
s
Cybe
r Dat
a Ex
ltrat
ion
Cont
agio
us M
alw
are
Clou
d O
utag
eFi
nanc
ial T
heft
Dis
trib
uted
Den
ial o
f Ser
vice
Inte
rnet
of T
hing
sIn
dust
rial
Con
trol
Sys
tem
sIn
tern
et F
ailu
re
Criti
cal I
nfra
stru
ctur
ePo
wer
Tr
ansp
ort
Tele
com
mun
icat
ions
Sate
llite
Sys
tem
sW
ater
& W
aste
Fuel
Gas
Indu
stri
al A
ccid
ent
Fire
Expl
osio
nPo
llutio
nSt
ruct
ural
Fai
lure
Nuc
lear
Busi
ness
Env
iron
men
t (C
ount
ry R
isk)
Tale
nt A
vaila
bilit
yIn
dust
rial
Act
ion
Min
imum
Wag
e H
ike
Sanc
tions
Terr
itoria
l Dis
pute
sLo
gist
ics
Rest
rict
ions
Corr
uptio
n &
Crim
eCo
rrup
tion
Det
erio
ratio
nCr
ime
Wav
e/Pi
racy
Incr
ease
Slav
ery
Prac
tices
Gov
ernm
ent B
usin
ess
Polic
yEm
ergi
ng R
egul
atio
nCo
rpor
atio
n Ta
x Ra
te H
ike
Div
erte
d Pr
ots
Tax
Nat
iona
lisat
ion
Con
scat
ion
of A
sset
sPr
ivat
isat
ion
Lice
nse
Revo
catio
n
Chan
ge in
Gov
ernm
ent
Nat
iona
lism
/Pro
tect
ioni
smLe
ft-W
ing
Radi
calis
mRi
ght-
Win
g Ra
dica
lism
Popu
lism
Envi
ronm
enta
lism
Polit
ical
Vio
lenc
eSo
cial
Unr
est
Terr
oris
mSu
bnat
iona
l Con
ict &
Civ
il W
arCo
up d
'Éta
t
Inte
rsta
te C
onic
tCo
nven
tiona
l Mili
tary
War
Asy
mm
etri
c W
arN
ucle
ar W
arCo
ld W
ar
Econ
omic
Out
look
Rece
ssio
nSt
agna
tion
Cont
ract
ion
Cred
it Cr
isis
Stea
dy G
row
thEx
pans
ion
Acc
eler
atio
nPe
ak
Econ
omic
Var
iabl
esCo
mm
odity
Pric
e Fl
uctu
atio
nIn
atio
nIn
tere
st R
ates
Mar
ket C
risi
sA
sset
Bub
ble
Bank
Run
Sove
reig
n D
ebt C
risi
sFl
ash
Cras
hFr
audu
lent
Mar
ket M
anip
ulat
ion
Cryp
tocu
rren
cy F
ailu
reRe
serv
e Cu
rren
cy S
hift
Trad
ing
Envi
ronm
ent
Tari
Dis
pute
Cart
el M
anip
ulat
es M
arke
tO
rgan
ised
Cri
me
Com
pany
Out
look
Hos
tile
Take
over
Cred
it Ra
ting
Dow
ngra
deIn
vest
or N
egat
ive
Out
look
Com
petit
ion
Dis
rupt
ive
Com
petit
orA
ggre
ssiv
e Co
mpe
titor
Frau
dule
nt C
ompe
titor
Inte
llect
ual P
rope
rty
Thef
t
Coun
terp
arty
Supp
lier F
ailu
reCu
stom
er F
ailu
reG
over
nmen
t Fai
lure
Cred
itor F
ailu
reCo
unte
rpar
ty F
raud
Tech
nolo
gyG
eopo
litic
alFi
nanc
ial
Soci
alEn
viro
nmen
tal
Gov
erna
nce
20Scenario Applications: Cambridge Centre for Risk Studies Stress Testing Companies in the Energy Value Chain
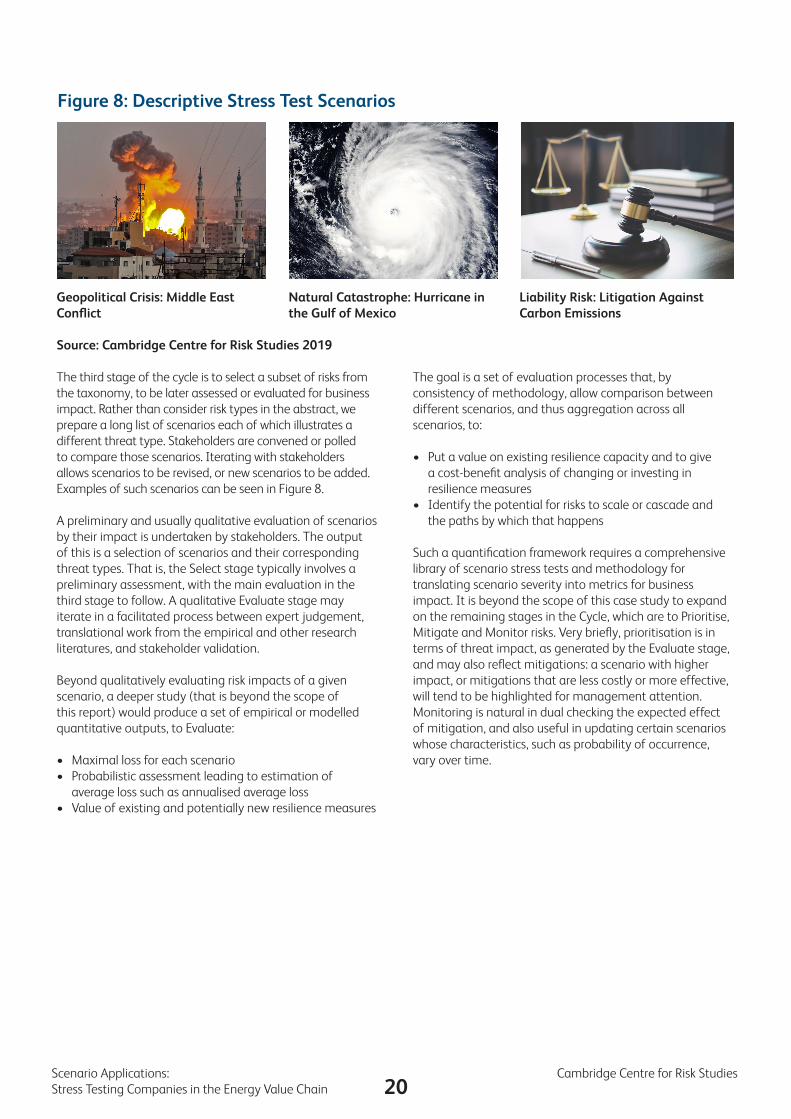
The third stage of the cycle is to select a subset of risks from the taxonomy, to be later assessed or evaluated for business impact. Rather than consider risk types in the abstract, we prepare a long list of scenarios each of which illustrates a different threat type. Stakeholders are convened or polled to compare those scenarios. Iterating with stakeholders allows scenarios to be revised, or new scenarios to be added. Examples of such scenarios can be seen in Figure 8.
A preliminary and usually qualitative evaluation of scenarios by their impact is undertaken by stakeholders. The output of this is a selection of scenarios and their corresponding threat types. That is, the Select stage typically involves a preliminary assessment, with the main evaluation in the third stage to follow. A qualitative Evaluate stage may iterate in a facilitated process between expert judgement, translational work from the empirical and other research literatures, and stakeholder validation.
Beyond qualitatively evaluating risk impacts of a given scenario, a deeper study (that is beyond the scope of this report) would produce a set of empirical or modelled quantitative outputs, to Evaluate:
• Maximal loss for each scenario• Probabilistic assessment leading to estimation of
average loss such as annualised average loss • Value of existing and potentially new resilience measures
Figure 8: Descriptive Stress Test Scenarios
Geopolitical Crisis: Middle East Conflict
Natural Catastrophe: Hurricane in the Gulf of Mexico
Liability Risk: Litigation Against Carbon Emissions
The goal is a set of evaluation processes that, by consistency of methodology, allow comparison between different scenarios, and thus aggregation across all scenarios, to:
• Put a value on existing resilience capacity and to give a cost-benefit analysis of changing or investing in resilience measures
• Identify the potential for risks to scale or cascade and the paths by which that happens
Such a quantification framework requires a comprehensive library of scenario stress tests and methodology for translating scenario severity into metrics for business impact. It is beyond the scope of this case study to expand on the remaining stages in the Cycle, which are to Prioritise, Mitigate and Monitor risks. Very briefly, prioritisation is in terms of threat impact, as generated by the Evaluate stage, and may also reflect mitigations: a scenario with higher impact, or mitigations that are less costly or more effective, will tend to be highlighted for management attention. Monitoring is natural in dual checking the expected effect of mitigation, and also useful in updating certain scenarios whose characteristics, such as probability of occurrence, vary over time.
Source: Cambridge Centre for Risk Studies 2019
21Cambridge Centre for Risk Studies Scenario Applications:
Stress Testing Companies in the Energy Value Chain
Section 4: Selected Scenarios for the Energy Value Chain
Overview and Selection of ScenariosA wide variety of scenarios are needed to comprehensively represent risks in the energy value chain. To prioritise risk categories of relevance, we turn to our 2018 Enterprise Risk Management report 46 which surveys a variety of business sectors on their principal risks, including four sectors that constitute the energy value chain: Energy, Industrials, Materials and Utilities. The top four risk classes identified by those sectors (see Figure 4) are summarised as follows:
• Operations, or Operational Performance; • Staff, or Health & Safety; • Financials, or Revenues, Profits and Share Price; • Geopolitics;
This case study is informed by three very different scenarios, selected to give broad coverages of challenges facing the energy value chain.
46 (Cambridge Centre for Risk Studies 2018)
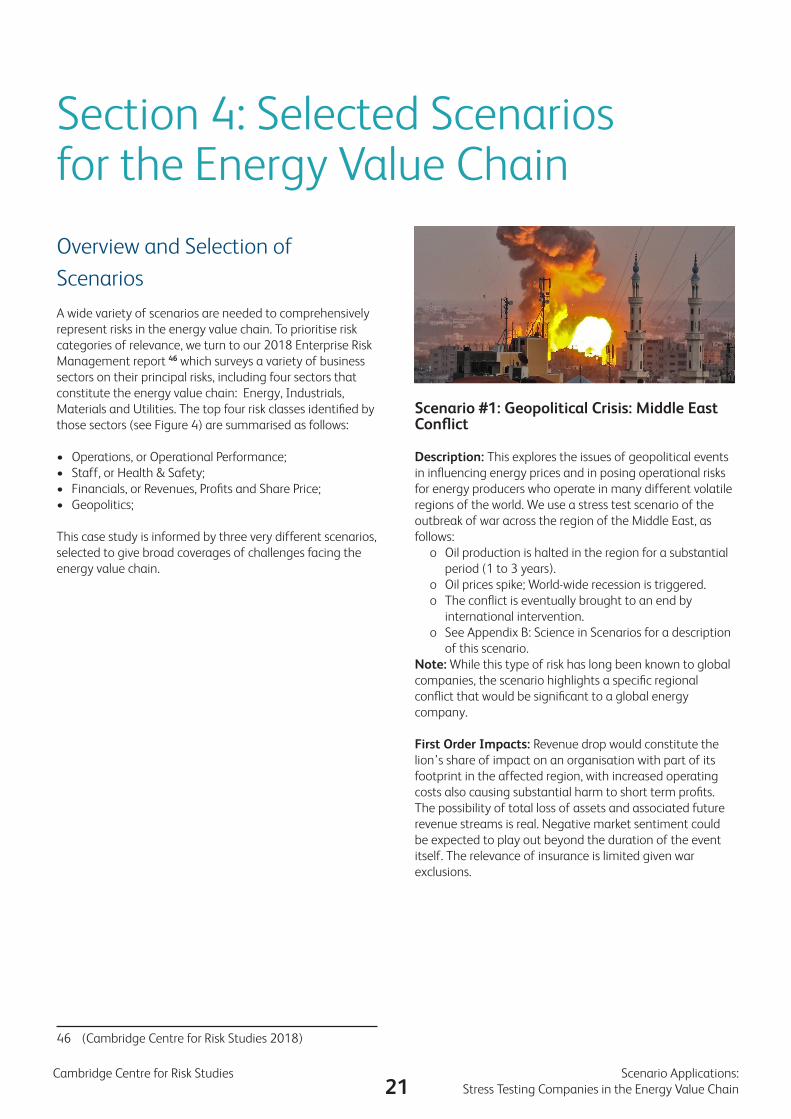
Scenario #1: Geopolitical Crisis: Middle East Conflict
Description: This explores the issues of geopolitical events in influencing energy prices and in posing operational risks for energy producers who operate in many different volatile regions of the world. We use a stress test scenario of the outbreak of war across the region of the Middle East, as follows:
o Oil production is halted in the region for a substantial period (1 to 3 years).
o Oil prices spike; World-wide recession is triggered.o The conflict is eventually brought to an end by
international intervention.o See Appendix B: Science in Scenarios for a description
of this scenario.Note: While this type of risk has long been known to global companies, the scenario highlights a specific regional conflict that would be significant to a global energy company.
First Order Impacts: Revenue drop would constitute the lion’s share of impact on an organisation with part of its footprint in the affected region, with increased operating costs also causing substantial harm to short term profits. The possibility of total loss of assets and associated future revenue streams is real. Negative market sentiment could be expected to play out beyond the duration of the event itself. The relevance of insurance is limited given war exclusions.
22Scenario Applications: Cambridge Centre for Risk Studies Stress Testing Companies in the Energy Value Chain
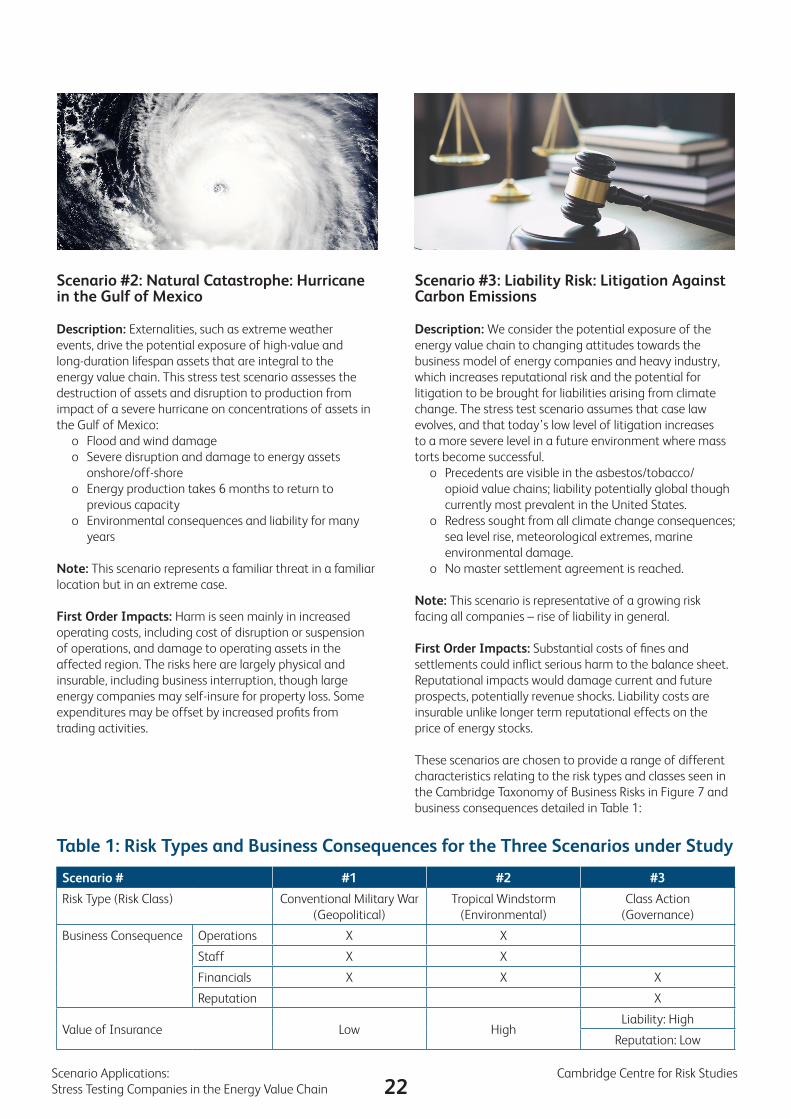
Scenario #2: Natural Catastrophe: Hurricane in the Gulf of Mexico
Description: Externalities, such as extreme weather events, drive the potential exposure of high-value and long-duration lifespan assets that are integral to the energy value chain. This stress test scenario assesses the destruction of assets and disruption to production from impact of a severe hurricane on concentrations of assets in the Gulf of Mexico:
o Flood and wind damageo Severe disruption and damage to energy assets
onshore/off-shoreo Energy production takes 6 months to return to
previous capacityo Environmental consequences and liability for many
years
Note: This scenario represents a familiar threat in a familiar location but in an extreme case.
First Order Impacts: Harm is seen mainly in increased operating costs, including cost of disruption or suspension of operations, and damage to operating assets in the affected region. The risks here are largely physical and insurable, including business interruption, though large energy companies may self-insure for property loss. Some expenditures may be offset by increased profits from trading activities.
Scenario #3: Liability Risk: Litigation Against Carbon Emissions
Description: We consider the potential exposure of the energy value chain to changing attitudes towards the business model of energy companies and heavy industry, which increases reputational risk and the potential for litigation to be brought for liabilities arising from climate change. The stress test scenario assumes that case law evolves, and that today’s low level of litigation increases to a more severe level in a future environment where mass torts become successful.
o Precedents are visible in the asbestos/tobacco/opioid value chains; liability potentially global though currently most prevalent in the United States.
o Redress sought from all climate change consequences; sea level rise, meteorological extremes, marine environmental damage.
o No master settlement agreement is reached.
Note: This scenario is representative of a growing risk facing all companies – rise of liability in general.
First Order Impacts: Substantial costs of fines and settlements could inflict serious harm to the balance sheet. Reputational impacts would damage current and future prospects, potentially revenue shocks. Liability costs are insurable unlike longer term reputational effects on the price of energy stocks.
These scenarios are chosen to provide a range of different characteristics relating to the risk types and classes seen in the Cambridge Taxonomy of Business Risks in Figure 7 and business consequences detailed in Table 1:
Table 1: Risk Types and Business Consequences for the Three Scenarios under Study
Scenario # #1 #2 #3
Risk Type (Risk Class) Conventional Military War (Geopolitical)
Tropical Windstorm (Environmental)
Class Action (Governance)
Business Consequence Operations X X
Staff X X
Financials X X X
Reputation X
Value of Insurance Low HighLiability: High
Reputation: Low
23Cambridge Centre for Risk Studies Scenario Applications:
Stress Testing Companies in the Energy Value Chain
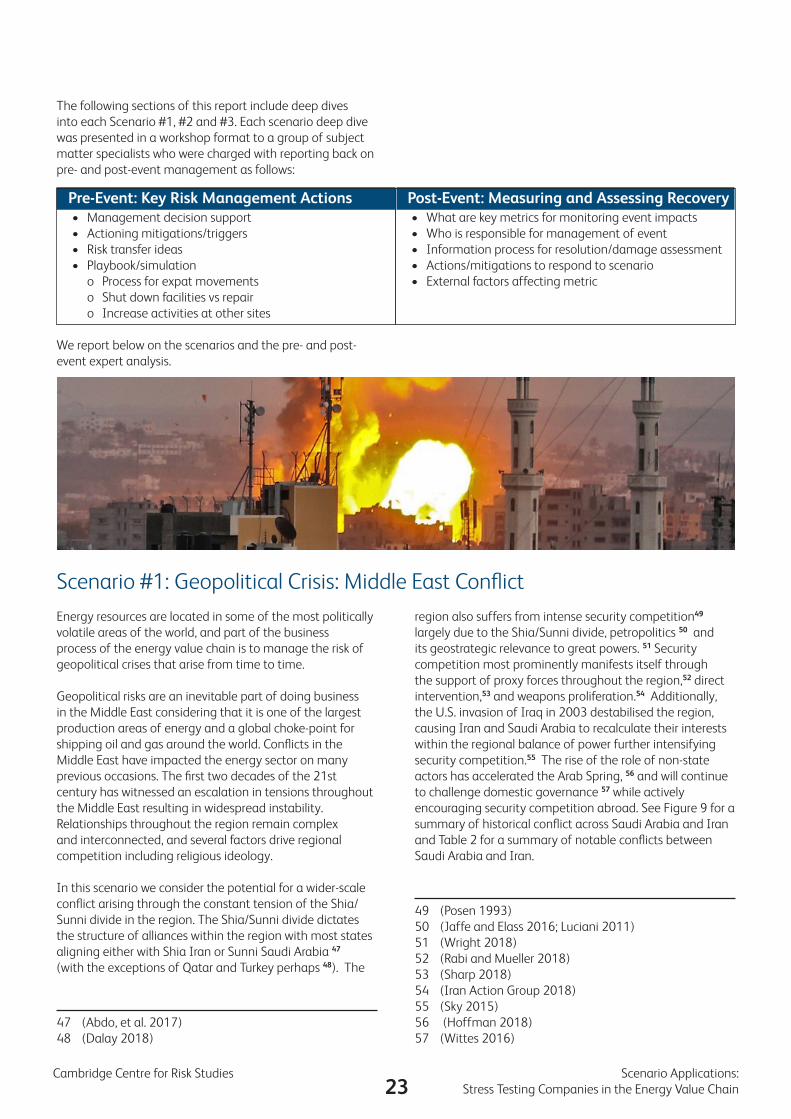
The following sections of this report include deep dives into each Scenario #1, #2 and #3. Each scenario deep dive was presented in a workshop format to a group of subject matter specialists who were charged with reporting back on pre- and post-event management as follows:
We report below on the scenarios and the pre- and post-event expert analysis.
Energy resources are located in some of the most politically volatile areas of the world, and part of the business process of the energy value chain is to manage the risk of geopolitical crises that arise from time to time.
Geopolitical risks are an inevitable part of doing business in the Middle East considering that it is one of the largest production areas of energy and a global choke-point for shipping oil and gas around the world. Conflicts in the Middle East have impacted the energy sector on many previous occasions. The first two decades of the 21st century has witnessed an escalation in tensions throughout the Middle East resulting in widespread instability. Relationships throughout the region remain complex and interconnected, and several factors drive regional competition including religious ideology.
In this scenario we consider the potential for a wider-scale conflict arising through the constant tension of the Shia/Sunni divide in the region. The Shia/Sunni divide dictates the structure of alliances within the region with most states aligning either with Shia Iran or Sunni Saudi Arabia 47 (with the exceptions of Qatar and Turkey perhaps 48). The
47 (Abdo, et al. 2017)48 (Dalay 2018)
Pre-Event: Key Risk Management Actions• Management decision support• Actioning mitigations/triggers• Risk transfer ideas• Playbook/simulation
o Process for expat movementso Shut down facilities vs repairo Increase activities at other sites
Post-Event: Measuring and Assessing Recovery• What are key metrics for monitoring event impacts• Who is responsible for management of event• Information process for resolution/damage assessment• Actions/mitigations to respond to scenario• External factors affecting metric
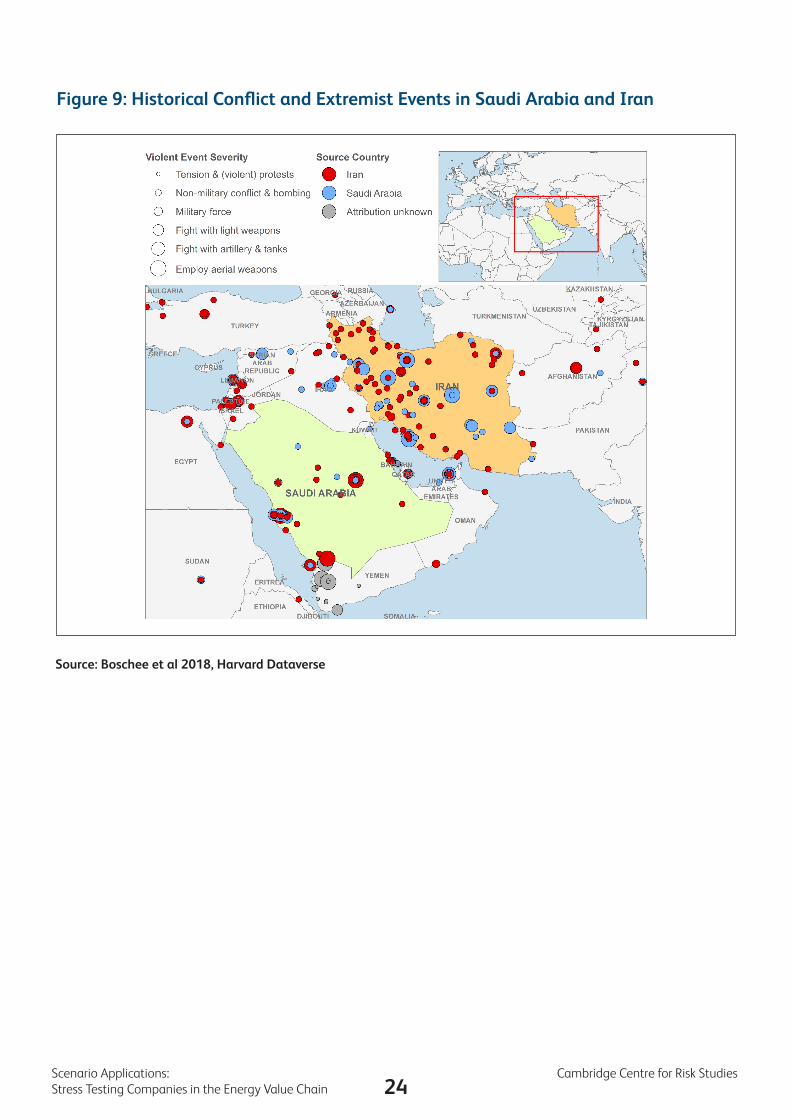
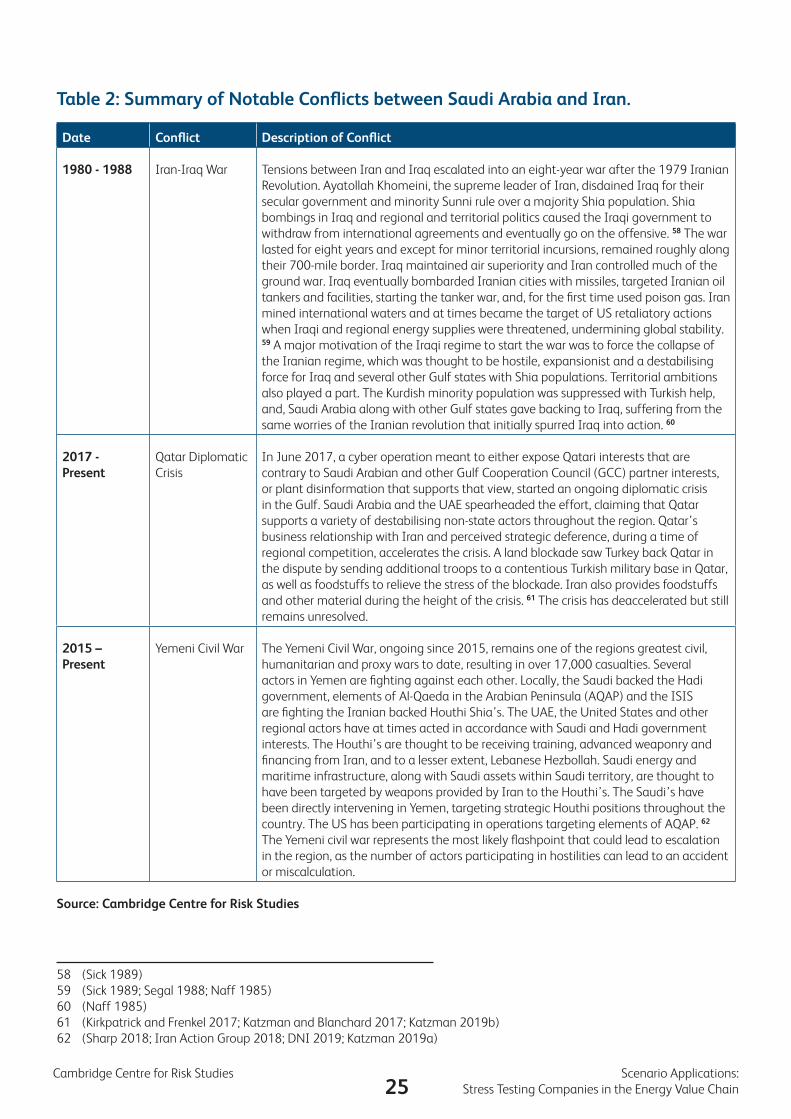
region also suffers from intense security competition49 largely due to the Shia/Sunni divide, petropolitics 50 and its geostrategic relevance to great powers. 51 Security competition most prominently manifests itself through the support of proxy forces throughout the region,52 direct intervention,53 and weapons proliferation.54 Additionally, the U.S. invasion of Iraq in 2003 destabilised the region, causing Iran and Saudi Arabia to recalculate their interests within the regional balance of power further intensifying security competition.55 The rise of the role of non-state actors has accelerated the Arab Spring, 56 and will continue to challenge domestic governance 57 while actively encouraging security competition abroad. See Figure 9 for a summary of historical conflict across Saudi Arabia and Iran and Table 2 for a summary of notable conflicts between Saudi Arabia and Iran.
49 (Posen 1993)50 (Jaffe and Elass 2016; Luciani 2011)51 (Wright 2018)52 (Rabi and Mueller 2018)53 (Sharp 2018)54 (Iran Action Group 2018)55 (Sky 2015)56 (Hoffman 2018)57 (Wittes 2016)
Scenario #1: Geopolitical Crisis: Middle East Conflict
24Scenario Applications: Cambridge Centre for Risk Studies Stress Testing Companies in the Energy Value Chain
Figure 9: Historical Conflict and Extremist Events in Saudi Arabia and Iran
Source: Boschee et al 2018, Harvard Dataverse
25Cambridge Centre for Risk Studies Scenario Applications:
Stress Testing Companies in the Energy Value Chain
Date Conflict Description of Conflict
1980 - 1988 Iran-Iraq War Tensions between Iran and Iraq escalated into an eight-year war after the 1979 Iranian Revolution. Ayatollah Khomeini, the supreme leader of Iran, disdained Iraq for their secular government and minority Sunni rule over a majority Shia population. Shia bombings in Iraq and regional and territorial politics caused the Iraqi government to withdraw from international agreements and eventually go on the offensive. 58 The war lasted for eight years and except for minor territorial incursions, remained roughly along their 700-mile border. Iraq maintained air superiority and Iran controlled much of the ground war. Iraq eventually bombarded Iranian cities with missiles, targeted Iranian oil tankers and facilities, starting the tanker war, and, for the first time used poison gas. Iran mined international waters and at times became the target of US retaliatory actions when Iraqi and regional energy supplies were threatened, undermining global stability. 59 A major motivation of the Iraqi regime to start the war was to force the collapse of the Iranian regime, which was thought to be hostile, expansionist and a destabilising force for Iraq and several other Gulf states with Shia populations. Territorial ambitions also played a part. The Kurdish minority population was suppressed with Turkish help, and, Saudi Arabia along with other Gulf states gave backing to Iraq, suffering from the same worries of the Iranian revolution that initially spurred Iraq into action. 60
2017 - Present
Qatar Diplomatic Crisis
In June 2017, a cyber operation meant to either expose Qatari interests that are contrary to Saudi Arabian and other Gulf Cooperation Council (GCC) partner interests, or plant disinformation that supports that view, started an ongoing diplomatic crisis in the Gulf. Saudi Arabia and the UAE spearheaded the effort, claiming that Qatar supports a variety of destabilising non-state actors throughout the region. Qatar’s business relationship with Iran and perceived strategic deference, during a time of regional competition, accelerates the crisis. A land blockade saw Turkey back Qatar in the dispute by sending additional troops to a contentious Turkish military base in Qatar, as well as foodstuffs to relieve the stress of the blockade. Iran also provides foodstuffs and other material during the height of the crisis. 61 The crisis has deaccelerated but still remains unresolved.
2015 – Present
Yemeni Civil War The Yemeni Civil War, ongoing since 2015, remains one of the regions greatest civil, humanitarian and proxy wars to date, resulting in over 17,000 casualties. Several actors in Yemen are fighting against each other. Locally, the Saudi backed the Hadi government, elements of Al-Qaeda in the Arabian Peninsula (AQAP) and the ISIS are fighting the Iranian backed Houthi Shia’s. The UAE, the United States and other regional actors have at times acted in accordance with Saudi and Hadi government interests. The Houthi’s are thought to be receiving training, advanced weaponry and financing from Iran, and to a lesser extent, Lebanese Hezbollah. Saudi energy and maritime infrastructure, along with Saudi assets within Saudi territory, are thought to have been targeted by weapons provided by Iran to the Houthi’s. The Saudi’s have been directly intervening in Yemen, targeting strategic Houthi positions throughout the country. The US has been participating in operations targeting elements of AQAP. 62 The Yemeni civil war represents the most likely flashpoint that could lead to escalation in the region, as the number of actors participating in hostilities can lead to an accident or miscalculation.
58 (Sick 1989)59 (Sick 1989; Segal 1988; Naff 1985)60 (Naff 1985)61 (Kirkpatrick and Frenkel 2017; Katzman and Blanchard 2017; Katzman 2019b)62 (Sharp 2018; Iran Action Group 2018; DNI 2019; Katzman 2019a)
Table 2: Summary of Notable Conflicts between Saudi Arabia and Iran.
Source: Cambridge Centre for Risk Studies
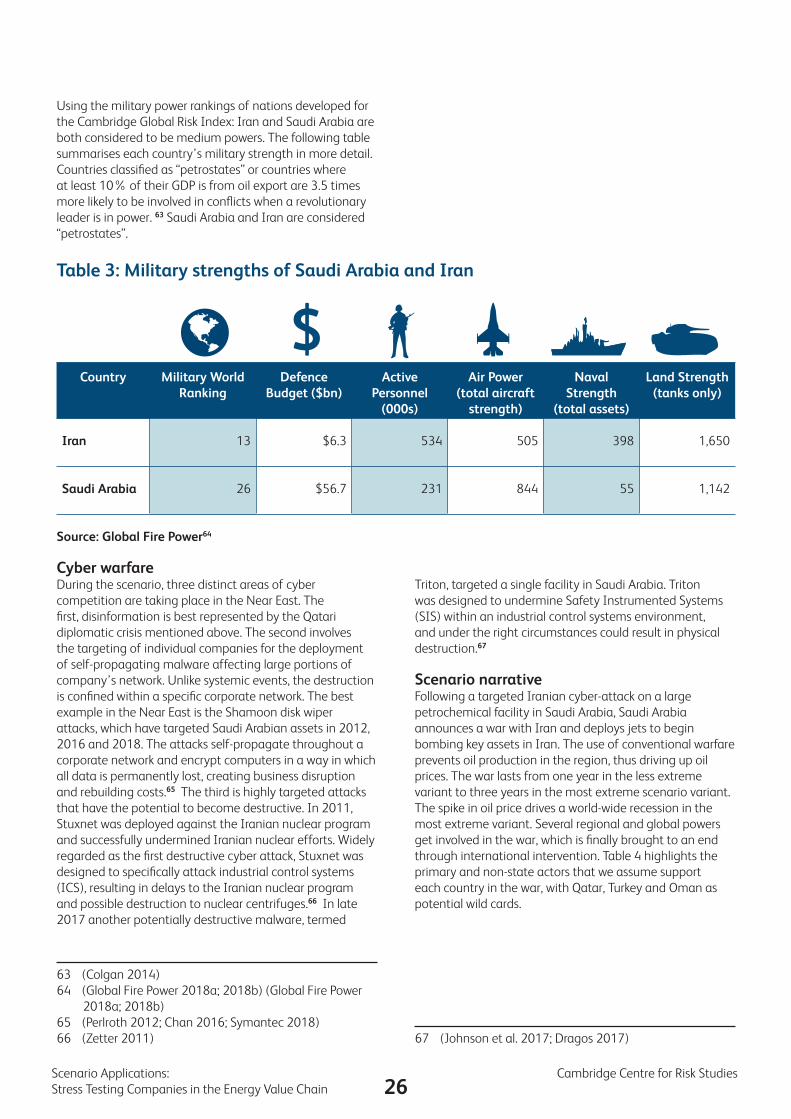
26Scenario Applications: Cambridge Centre for Risk Studies Stress Testing Companies in the Energy Value Chain
Using the military power rankings of nations developed for the Cambridge Global Risk Index: Iran and Saudi Arabia are both considered to be medium powers. The following table summarises each country’s military strength in more detail. Countries classified as “petrostates” or countries where at least 10% of their GDP is from oil export are 3.5 times more likely to be involved in conflicts when a revolutionary leader is in power. 63 Saudi Arabia and Iran are considered “petrostates”.
Source: Global Fire Power64
Cyber warfareDuring the scenario, three distinct areas of cyber competition are taking place in the Near East. The first, disinformation is best represented by the Qatari diplomatic crisis mentioned above. The second involves the targeting of individual companies for the deployment of self-propagating malware affecting large portions of company’s network. Unlike systemic events, the destruction is confined within a specific corporate network. The best example in the Near East is the Shamoon disk wiper attacks, which have targeted Saudi Arabian assets in 2012, 2016 and 2018. The attacks self-propagate throughout a corporate network and encrypt computers in a way in which all data is permanently lost, creating business disruption and rebuilding costs.65 The third is highly targeted attacks that have the potential to become destructive. In 2011, Stuxnet was deployed against the Iranian nuclear program and successfully undermined Iranian nuclear efforts. Widely regarded as the first destructive cyber attack, Stuxnet was designed to specifically attack industrial control systems (ICS), resulting in delays to the Iranian nuclear program and possible destruction to nuclear centrifuges.66 In late 2017 another potentially destructive malware, termed
63 (Colgan 2014)64 (Global Fire Power 2018a; 2018b) (Global Fire Power
2018a; 2018b)65 (Perlroth 2012; Chan 2016; Symantec 2018)66 (Zetter 2011)
Table 3: Military strengths of Saudi Arabia and Iran
Country Military World Ranking
Defence Budget ($bn)
Active Personnel
(000s)
Air Power (total aircraft
strength)
Naval Strength
(total assets)
Land Strength (tanks only)
Iran
13 $6.3 534 505 398 1,650
Saudi Arabia
26 $56.7 231 844 55 1,142
Triton, targeted a single facility in Saudi Arabia. Triton was designed to undermine Safety Instrumented Systems (SIS) within an industrial control systems environment, and under the right circumstances could result in physical destruction.67
Scenario narrativeFollowing a targeted Iranian cyber-attack on a large petrochemical facility in Saudi Arabia, Saudi Arabia announces a war with Iran and deploys jets to begin bombing key assets in Iran. The use of conventional warfare prevents oil production in the region, thus driving up oil prices. The war lasts from one year in the less extreme variant to three years in the most extreme scenario variant. The spike in oil price drives a world-wide recession in the most extreme variant. Several regional and global powers get involved in the war, which is finally brought to an end through international intervention. Table 4 highlights the primary and non-state actors that we assume support each country in the war, with Qatar, Turkey and Oman as potential wild cards.
67 (Johnson et al. 2017; Dragos 2017)
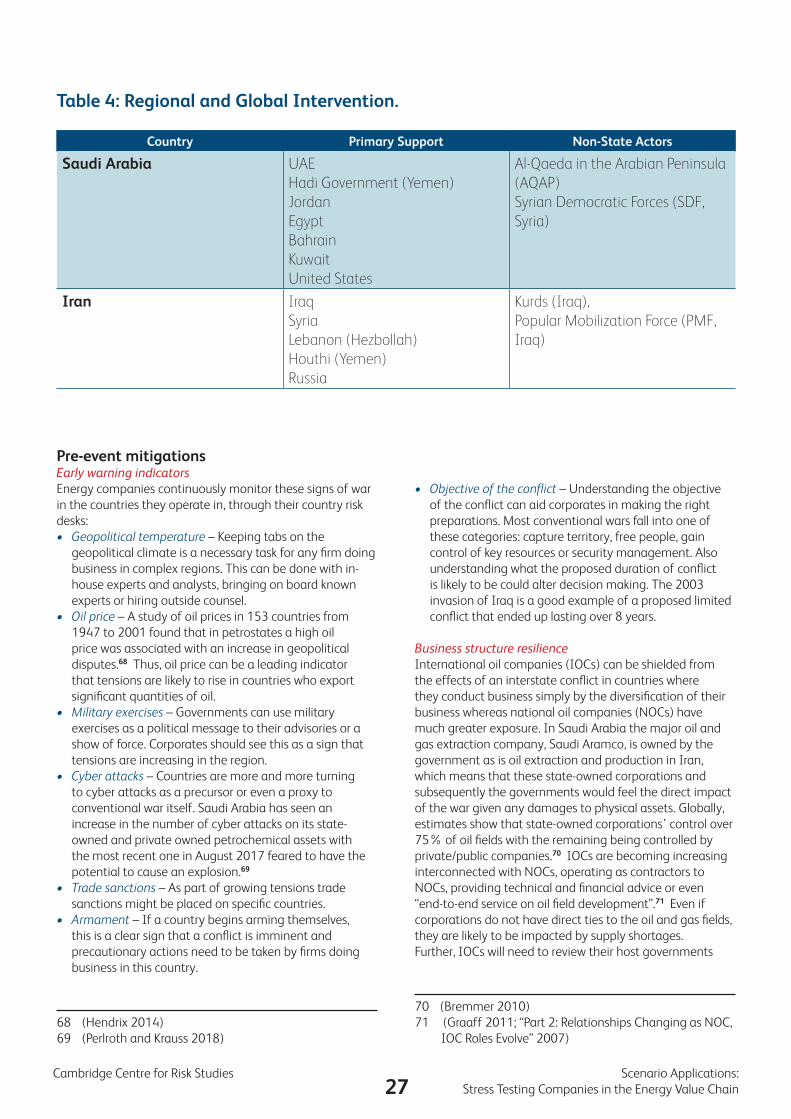
27Cambridge Centre for Risk Studies Scenario Applications:
Stress Testing Companies in the Energy Value Chain
Table 4: Regional and Global Intervention.
Country Primary Support Non-State Actors
Saudi Arabia UAEHadi Government (Yemen)JordanEgyptBahrainKuwaitUnited States
Al-Qaeda in the Arabian Peninsula (AQAP)Syrian Democratic Forces (SDF, Syria)
Iran IraqSyriaLebanon (Hezbollah)Houthi (Yemen)Russia
Kurds (Iraq),Popular Mobilization Force (PMF, Iraq)
Pre-event mitigationsEarly warning indicatorsEnergy companies continuously monitor these signs of war in the countries they operate in, through their country risk desks:• Geopolitical temperature – Keeping tabs on the
geopolitical climate is a necessary task for any firm doing business in complex regions. This can be done with in-house experts and analysts, bringing on board known experts or hiring outside counsel.
• Oil price – A study of oil prices in 153 countries from 1947 to 2001 found that in petrostates a high oil price was associated with an increase in geopolitical disputes.68 Thus, oil price can be a leading indicator that tensions are likely to rise in countries who export significant quantities of oil.
• Military exercises – Governments can use military exercises as a political message to their advisories or a show of force. Corporates should see this as a sign that tensions are increasing in the region.
• Cyber attacks – Countries are more and more turning to cyber attacks as a precursor or even a proxy to conventional war itself. Saudi Arabia has seen an increase in the number of cyber attacks on its state-owned and private owned petrochemical assets with the most recent one in August 2017 feared to have the potential to cause an explosion.69
• Trade sanctions – As part of growing tensions trade sanctions might be placed on specific countries.
• Armament – If a country begins arming themselves, this is a clear sign that a conflict is imminent and precautionary actions need to be taken by firms doing business in this country.
68 (Hendrix 2014)69 (Perlroth and Krauss 2018)
• Objectiveoftheconflict – Understanding the objective of the conflict can aid corporates in making the right preparations. Most conventional wars fall into one of these categories: capture territory, free people, gain control of key resources or security management. Also understanding what the proposed duration of conflict is likely to be could alter decision making. The 2003 invasion of Iraq is a good example of a proposed limited conflict that ended up lasting over 8 years.
Business structure resilienceInternational oil companies (IOCs) can be shielded from the effects of an interstate conflict in countries where they conduct business simply by the diversification of their business whereas national oil companies (NOCs) have much greater exposure. In Saudi Arabia the major oil and gas extraction company, Saudi Aramco, is owned by the government as is oil extraction and production in Iran, which means that these state-owned corporations and subsequently the governments would feel the direct impact of the war given any damages to physical assets. Globally, estimates show that state-owned corporations’ control over 75% of oil fields with the remaining being controlled by private/public companies.70 IOCs are becoming increasing interconnected with NOCs, operating as contractors to NOCs, providing technical and financial advice or even “end-to-end service on oil field development”.71 Even if corporations do not have direct ties to the oil and gas fields, they are likely to be impacted by supply shortages. Further, IOCs will need to review their host governments
70 (Bremmer 2010)71 (Graaff 2011; “Part 2: Relationships Changing as NOC,
IOC Roles Evolve” 2007)
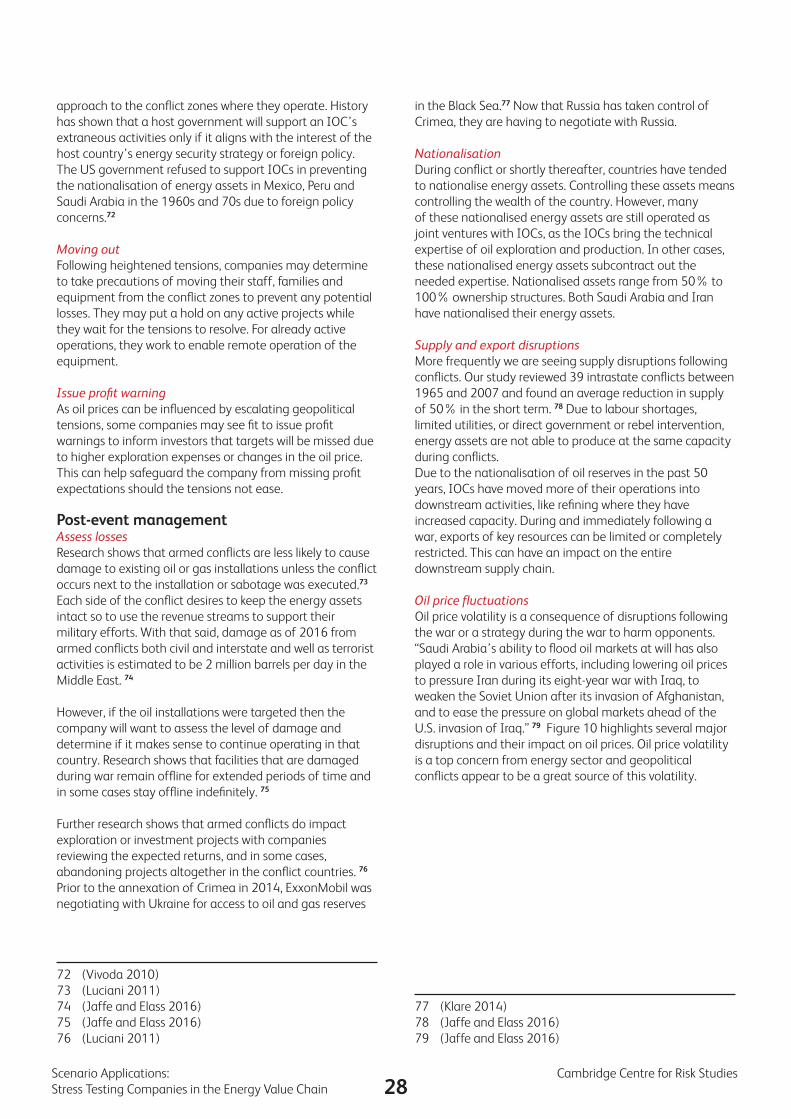
28Scenario Applications: Cambridge Centre for Risk Studies Stress Testing Companies in the Energy Value Chain
approach to the conflict zones where they operate. History has shown that a host government will support an IOC’s extraneous activities only if it aligns with the interest of the host country’s energy security strategy or foreign policy. The US government refused to support IOCs in preventing the nationalisation of energy assets in Mexico, Peru and Saudi Arabia in the 1960s and 70s due to foreign policy concerns.72
Moving outFollowing heightened tensions, companies may determine to take precautions of moving their staff, families and equipment from the conflict zones to prevent any potential losses. They may put a hold on any active projects while they wait for the tensions to resolve. For already active operations, they work to enable remote operation of the equipment.
Issue profit warningAs oil prices can be influenced by escalating geopolitical tensions, some companies may see fit to issue profit warnings to inform investors that targets will be missed due to higher exploration expenses or changes in the oil price. This can help safeguard the company from missing profit expectations should the tensions not ease.
Post-event managementAssess lossesResearch shows that armed conflicts are less likely to cause damage to existing oil or gas installations unless the conflict occurs next to the installation or sabotage was executed.73 Each side of the conflict desires to keep the energy assets intact so to use the revenue streams to support their military efforts. With that said, damage as of 2016 from armed conflicts both civil and interstate and well as terrorist activities is estimated to be 2 million barrels per day in the Middle East. 74
However, if the oil installations were targeted then the company will want to assess the level of damage and determine if it makes sense to continue operating in that country. Research shows that facilities that are damaged during war remain offline for extended periods of time and in some cases stay offline indefinitely. 75
Further research shows that armed conflicts do impact exploration or investment projects with companies reviewing the expected returns, and in some cases, abandoning projects altogether in the conflict countries. 76 Prior to the annexation of Crimea in 2014, ExxonMobil was negotiating with Ukraine for access to oil and gas reserves
72 (Vivoda 2010)73 (Luciani 2011)74 (Jaffe and Elass 2016)75 (Jaffe and Elass 2016)76 (Luciani 2011)
in the Black Sea.77 Now that Russia has taken control of Crimea, they are having to negotiate with Russia.
NationalisationDuring conflict or shortly thereafter, countries have tended to nationalise energy assets. Controlling these assets means controlling the wealth of the country. However, many of these nationalised energy assets are still operated as joint ventures with IOCs, as the IOCs bring the technical expertise of oil exploration and production. In other cases, these nationalised energy assets subcontract out the needed expertise. Nationalised assets range from 50% to 100% ownership structures. Both Saudi Arabia and Iran have nationalised their energy assets.
Supply and export disruptionsMore frequently we are seeing supply disruptions following conflicts. Our study reviewed 39 intrastate conflicts between 1965 and 2007 and found an average reduction in supply of 50% in the short term. 78 Due to labour shortages, limited utilities, or direct government or rebel intervention, energy assets are not able to produce at the same capacity during conflicts.Due to the nationalisation of oil reserves in the past 50 years, IOCs have moved more of their operations into downstream activities, like refining where they have increased capacity. During and immediately following a war, exports of key resources can be limited or completely restricted. This can have an impact on the entire downstream supply chain.
Oil price fluctuationsOil price volatility is a consequence of disruptions following the war or a strategy during the war to harm opponents. “Saudi Arabia’s ability to flood oil markets at will has also played a role in various efforts, including lowering oil prices to pressure Iran during its eight-year war with Iraq, to weaken the Soviet Union after its invasion of Afghanistan, and to ease the pressure on global markets ahead of the U.S. invasion of Iraq.” 79 Figure 10 highlights several major disruptions and their impact on oil prices. Oil price volatility is a top concern from energy sector and geopolitical conflicts appear to be a great source of this volatility.
77 (Klare 2014)78 (Jaffe and Elass 2016)79 (Jaffe and Elass 2016)
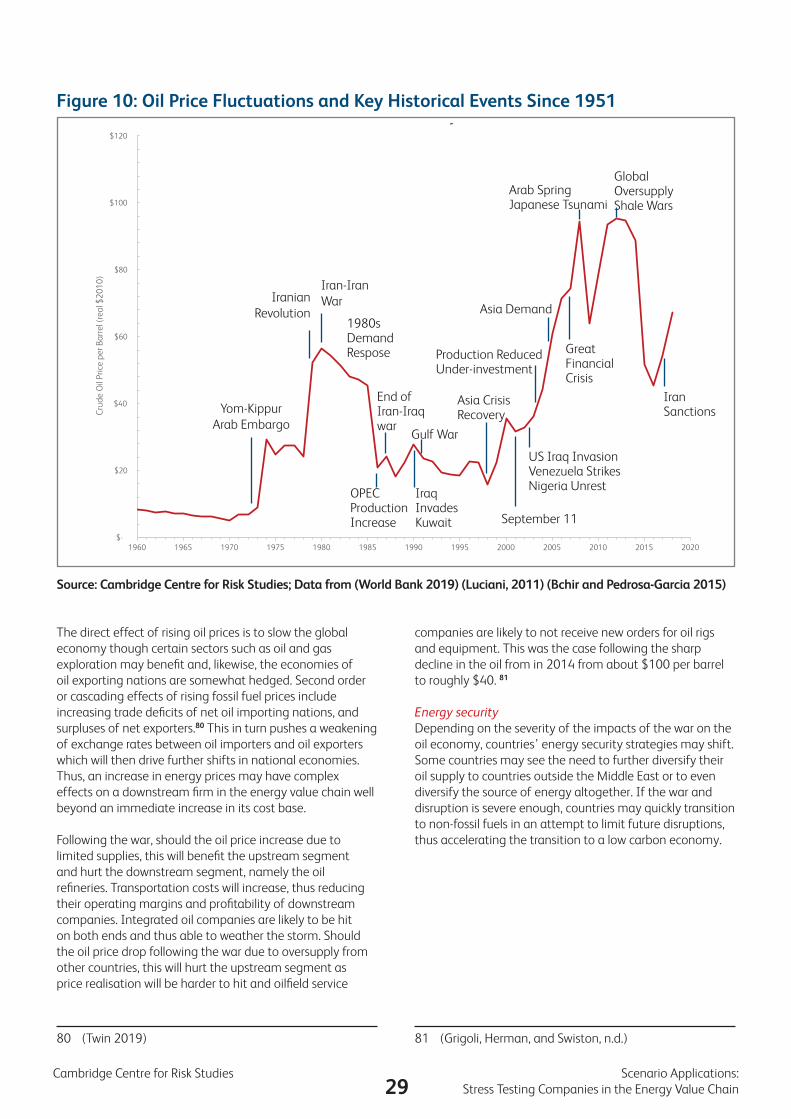
29Cambridge Centre for Risk Studies Scenario Applications:
Stress Testing Companies in the Energy Value Chain
Figure 10: Oil Price Fluctuations and Key Historical Events Since 1951
$-
$20
$40
$60
$80
$100
$120
1960 1965 1970 1975 1980 1985 1990 1995 2000 2005 2010 2015 2020
Cru
de O
il Pr
ice
per B
arre
l (re
al $
2010
)
Oil Price Fluctuations and Key Events
Source: Cambridge Centre for Risk Studies; Data from (World Bank 2019) (Luciani, 2011) (Bchir and Pedrosa-Garcia 2015)
The direct effect of rising oil prices is to slow the global economy though certain sectors such as oil and gas exploration may benefit and, likewise, the economies of oil exporting nations are somewhat hedged. Second order or cascading effects of rising fossil fuel prices include increasing trade deficits of net oil importing nations, and surpluses of net exporters.80 This in turn pushes a weakening of exchange rates between oil importers and oil exporters which will then drive further shifts in national economies. Thus, an increase in energy prices may have complex effects on a downstream firm in the energy value chain well beyond an immediate increase in its cost base.
Following the war, should the oil price increase due to limited supplies, this will benefit the upstream segment and hurt the downstream segment, namely the oil refineries. Transportation costs will increase, thus reducing their operating margins and profitability of downstream companies. Integrated oil companies are likely to be hit on both ends and thus able to weather the storm. Should the oil price drop following the war due to oversupply from other countries, this will hurt the upstream segment as price realisation will be harder to hit and oilfield service
80 (Twin 2019)
companies are likely to not receive new orders for oil rigs and equipment. This was the case following the sharp decline in the oil from in 2014 from about $100 per barrel to roughly $40. 81
Energy securityDepending on the severity of the impacts of the war on the oil economy, countries’ energy security strategies may shift. Some countries may see the need to further diversify their oil supply to countries outside the Middle East or to even diversify the source of energy altogether. If the war and disruption is severe enough, countries may quickly transition to non-fossil fuels in an attempt to limit future disruptions, thus accelerating the transition to a low carbon economy.
81 (Grigoli, Herman, and Swiston, n.d.)
Yom-Kippur Arab Embargo
Iranian Revolution
Iran-Iran War
1980sDemand Respose
End of Iran-Iraq war
Gulf War
Asia Crisis Recovery
Great Financial Crisis
Iran Sanctions
September 11
Production Reduced Under-investment
US Iraq Invasion Venezuela Strikes Nigeria Unrest
Asia Demand
Arab SpringJapanese Tsunami
Global Oversupply Shale Wars
OPEC Production Increase
Iraq Invades Kuwait
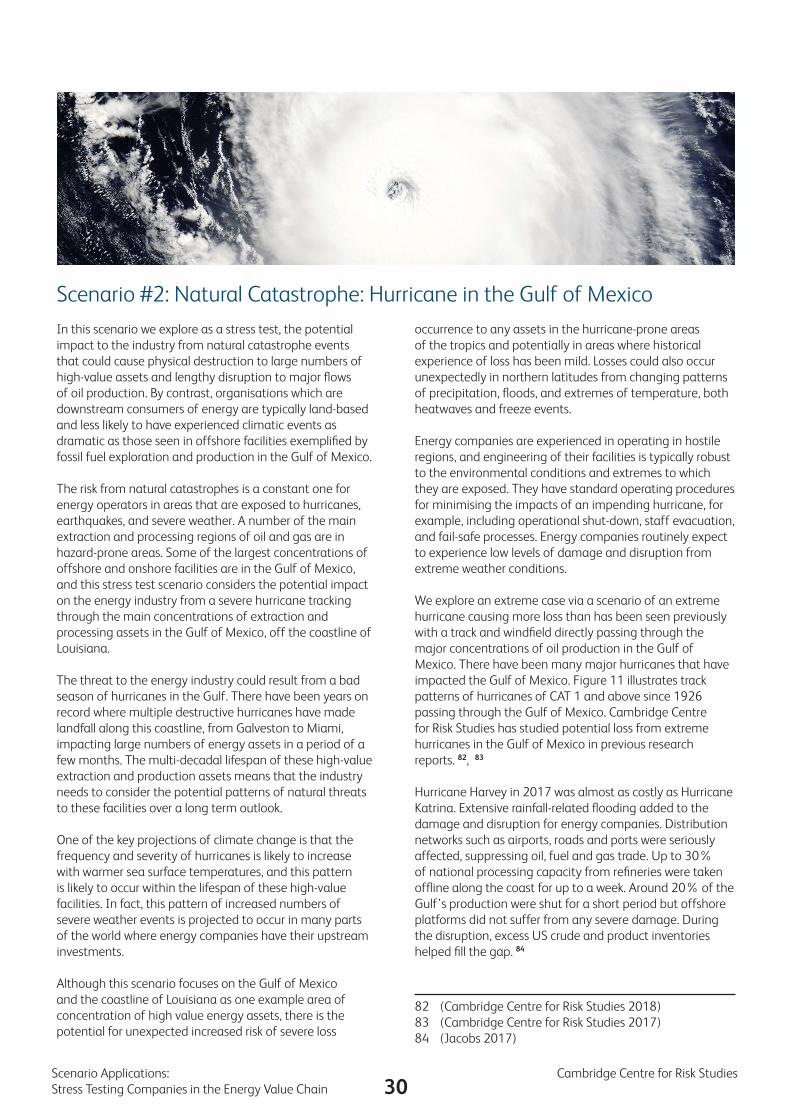
30Scenario Applications: Cambridge Centre for Risk Studies Stress Testing Companies in the Energy Value Chain
Scenario #2: Natural Catastrophe: Hurricane in the Gulf of MexicoIn this scenario we explore as a stress test, the potential impact to the industry from natural catastrophe events that could cause physical destruction to large numbers of high-value assets and lengthy disruption to major flows of oil production. By contrast, organisations which are downstream consumers of energy are typically land-based and less likely to have experienced climatic events as dramatic as those seen in offshore facilities exemplified by fossil fuel exploration and production in the Gulf of Mexico.
The risk from natural catastrophes is a constant one for energy operators in areas that are exposed to hurricanes, earthquakes, and severe weather. A number of the main extraction and processing regions of oil and gas are in hazard-prone areas. Some of the largest concentrations of offshore and onshore facilities are in the Gulf of Mexico, and this stress test scenario considers the potential impact on the energy industry from a severe hurricane tracking through the main concentrations of extraction and processing assets in the Gulf of Mexico, off the coastline of Louisiana.
The threat to the energy industry could result from a bad season of hurricanes in the Gulf. There have been years on record where multiple destructive hurricanes have made landfall along this coastline, from Galveston to Miami, impacting large numbers of energy assets in a period of a few months. The multi-decadal lifespan of these high-value extraction and production assets means that the industry needs to consider the potential patterns of natural threats to these facilities over a long term outlook.
One of the key projections of climate change is that the frequency and severity of hurricanes is likely to increase with warmer sea surface temperatures, and this pattern is likely to occur within the lifespan of these high-value facilities. In fact, this pattern of increased numbers of severe weather events is projected to occur in many parts of the world where energy companies have their upstream investments.
Although this scenario focuses on the Gulf of Mexico and the coastline of Louisiana as one example area of concentration of high value energy assets, there is the potential for unexpected increased risk of severe loss
occurrence to any assets in the hurricane-prone areas of the tropics and potentially in areas where historical experience of loss has been mild. Losses could also occur unexpectedly in northern latitudes from changing patterns of precipitation, floods, and extremes of temperature, both heatwaves and freeze events.
Energy companies are experienced in operating in hostile regions, and engineering of their facilities is typically robust to the environmental conditions and extremes to which they are exposed. They have standard operating procedures for minimising the impacts of an impending hurricane, for example, including operational shut-down, staff evacuation, and fail-safe processes. Energy companies routinely expect to experience low levels of damage and disruption from extreme weather conditions.
We explore an extreme case via a scenario of an extreme hurricane causing more loss than has been seen previously with a track and windfield directly passing through the major concentrations of oil production in the Gulf of Mexico. There have been many major hurricanes that have impacted the Gulf of Mexico. Figure 11 illustrates track patterns of hurricanes of CAT 1 and above since 1926 passing through the Gulf of Mexico. Cambridge Centre for Risk Studies has studied potential loss from extreme hurricanes in the Gulf of Mexico in previous research reports. 82, 83
Hurricane Harvey in 2017 was almost as costly as Hurricane Katrina. Extensive rainfall-related flooding added to the damage and disruption for energy companies. Distribution networks such as airports, roads and ports were seriously affected, suppressing oil, fuel and gas trade. Up to 30% of national processing capacity from refineries were taken offline along the coast for up to a week. Around 20% of the Gulf’s production were shut for a short period but offshore platforms did not suffer from any severe damage. During the disruption, excess US crude and product inventories helped fill the gap. 84
82 (Cambridge Centre for Risk Studies 2018)83 (Cambridge Centre for Risk Studies 2017)84 (Jacobs 2017)
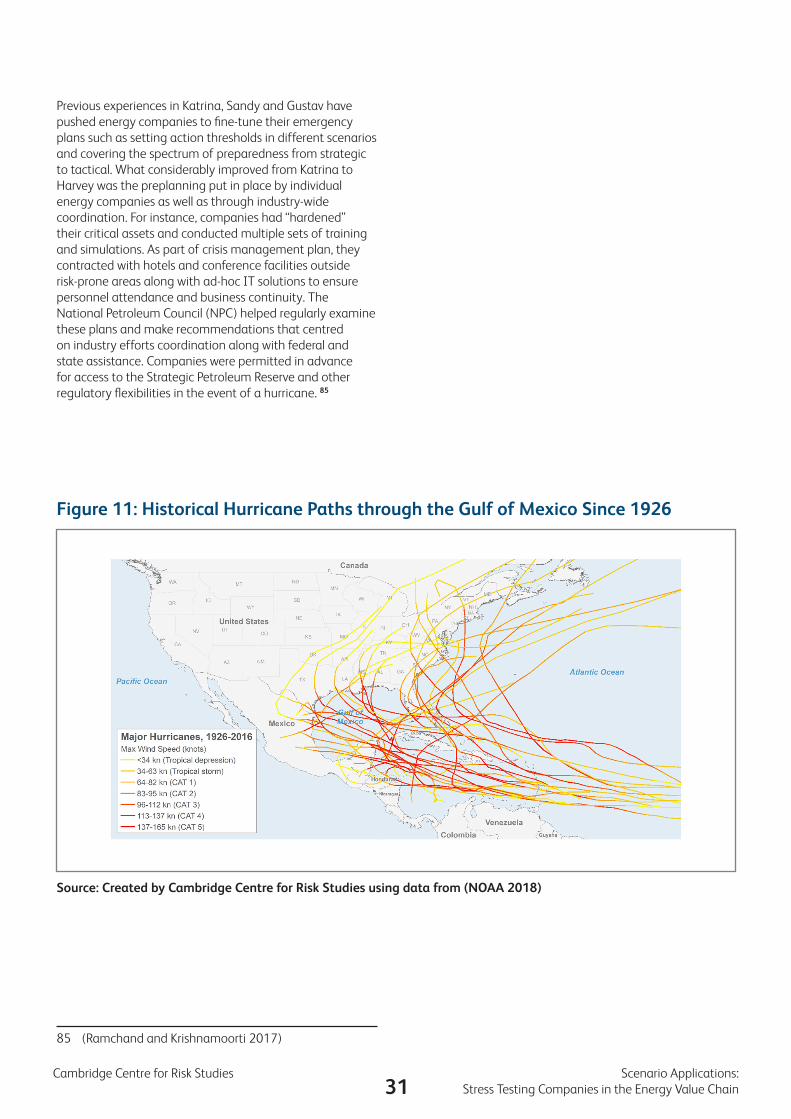
31Cambridge Centre for Risk Studies Scenario Applications:
Stress Testing Companies in the Energy Value Chain
Figure 11: Historical Hurricane Paths through the Gulf of Mexico Since 1926
Previous experiences in Katrina, Sandy and Gustav have pushed energy companies to fine-tune their emergency plans such as setting action thresholds in different scenarios and covering the spectrum of preparedness from strategic to tactical. What considerably improved from Katrina to Harvey was the preplanning put in place by individual energy companies as well as through industry-wide coordination. For instance, companies had “hardened” their critical assets and conducted multiple sets of training and simulations. As part of crisis management plan, they contracted with hotels and conference facilities outside risk-prone areas along with ad-hoc IT solutions to ensure personnel attendance and business continuity. The National Petroleum Council (NPC) helped regularly examine these plans and make recommendations that centred on industry efforts coordination along with federal and state assistance. Companies were permitted in advance for access to the Strategic Petroleum Reserve and other regulatory flexibilities in the event of a hurricane. 85
85 (Ramchand and Krishnamoorti 2017)
Source: Created by Cambridge Centre for Risk Studies using data from (NOAA 2018)
32Scenario Applications: Cambridge Centre for Risk Studies Stress Testing Companies in the Energy Value Chain
Scenario narrativeThe tropical storm forms in the Caribbean in late September that rapidly intensifies into a Category 4 hurricane. It tracks along a unique path straight through the densest concentration of major oil installations in the Gulf of Mexico and makes landfall through the onshore refineries, ports, and oil terminal infrastructure. The hurricane sees peak sustained winds of 160 mph (257 km/h), a maximum radius of 40 miles (64 km), and storm surge up to 6ft (1.8m). Heavy-rain flooding onshore causes further disruption. Onshore energy assets are plagued by power outages, property damage and societal interruptions exacerbating the impact to offshore recovery.
Evacuations are assumed to be successful in the standard scenario variant, but unsuccessful in the more extreme variants as the hurricane surprises the forecasters and arrives with unexpected intensity before standard hurricane preparedness measures are implemented. It takes 6 months for energy production to return to full capacity with environmental consequences and liability lasting for several years following the event.
Repopulation of the affected area takes up to two years as the vast majority is evacuated or displaced from vulnerable coastal areas prior to the hurricane’s arrival. Fear of a repeated hurricane the following year slows the return of citizens to the area.
Pre-event mitigationsEnergy is a necessary commodity – households, businesses and governments are ill-equipped for a sustained supply disruption. However, the energy sector is not immune from havoc wrought by a major hurricane in the Gulf with the potential to paralyse its production. Governments require that large energy companies hold minimum oil stocks proportional to their oil imports or domestic sales in crises of supply shortage. 86
Corporations learn from precedent cases of hurricanes, in both a scientific and business sense, to modulate potential damages of similar natural disasters before they happen. An effective preventative control is established not only on meticulous technical modelling, but also on all-inclusive understanding of alternatives of mitigation tools to curb the direct and indirect impacts.
Business continuity planEnergy value chain companies struggle to deliver continued value for shareholders in the short term, in contrast to the long term investments into a capital-intensive industry. The energy sector is reliant on the operations from drilling and production facilities at exposed locations. The risks to physical breakdowns, storm surges, flood and wind damages resulting from major hurricanes are accepted and managed accordingly. Large players in the sector such as
86 (International Energy Agency 2019)
the Super Major Companies have the scale and resources to be risk aware and prepared.
Executives are informed by engineers and project experts within organisations of the vulnerabilities in site buildings and facilities. They also turn to catastrophe risk analysts of insurers and reinsurers to assess their risk exposure probabilistically and deterministically. Energy companies can use the metrics identified in these analytics to monitor their site operations, select warning indicators and set action thresholds.
Action may involve cross-company collaboration especially when companies’ capabilities are restricted by the disaster in different aspects.87 Putting a structured business continuity plan in place will hence help alleviate disruption to production and supply activities if a hurricane lands ashore. Such a plan is usually updated whenever a major catastrophic shock is documented. If emergency response is not prepared beforehand, energy supply shortage will lead to commodity price turbulence, exerting ripple effects on other industries or sectors.
Pre-event mitigations for physical damagePre-event mitigation tools for physical damage range from building backup facilities to securing risk transfer. Post-event restoration of impaired facilities is usually actioned as soon as possible; however, building backup facilities in advance is usually a contentious decision in companies. Trade-offs are weighed between the benefits of escaping a production halt during disasters and the costs of maintaining idle capacity in normal times. To date, historical catastrophes have not been influential and frequent enough to justify such substantial new investments. Several executives of major energy companies have commented that even a six-month shutdown at a particular site is not considered a black swan. Instead, energy companies tend to strengthen scrutiny of their infrastructure and improve construction guidelines for increase their existing physical resilience in the first place.
Corporations also transfer potential disastrous loss by purchasing insurance or joining captives, but many do not regularly assess the adequacy of insurance in terms of limits, coverages etc. After Katrina hit in 2005, some of the insured, mainly commercial claimants, found that they were not covered for storm surge which was the main loss driver. Litigations went on for years regarding whether damage resulted from wind or water.88 It is hence prudent to know what is protected ahead of time.
Opportunity is the flip side of risk. Energy executives see opportunities in trading after natural catastrophes such as hurricanes. While producers and insurers may bear losses, investing in stocks related to construction can
87 (Marsh 2015)88 (Allianz n.d.)
33Cambridge Centre for Risk Studies Scenario Applications:
Stress Testing Companies in the Energy Value Chain
generate some compensations to minimise the hit from site destruction.89 Saving flexibility in post-shock trading ability will constitute an important piece in pre-event mitigation planning.
Environmental and reputational concernsNonetheless, physical destruction seems a less worrying concern than environmental pollution and reputational impairment, as stated in their annual reports. The 2010 Deepwater Horizon oil spill and 2011 Fukushima Daiichi nuclear disaster after the Tohoku earthquake and tsunami are two examples of serious events causing environmental damage. Environmental, health and socioeconomic impacts that followed the spill and radiation events put an enormous strain on reputation of the energy companies involved.
For environmental sensitivity, the energy sector would like to go beyond regular compliance to avoid general deterrence by investigation and penalty as well as to demonstrate corporate social responsibility that adds to their resilience in the face of unforeseeable environmental risk.90 Energy companies recognise the importance of adaptation to climate change, and therefore incorporate emerging climate conditions and specific environmental concerns into the design of existing and new energy infrastructure.91 Due to the negative externality of environmental risk society-wide, it is monitored and mitigated preventatively under collaboration of companies and domestic and international regulators.
Handling speed is critical in tackling the reputational implication of environmental risk that would otherwise deplete trust in firms. Large energy companies pre-define a reputational crisis team including who will address any issues, ensure timeliness by conducting “fire drills” before an event, and accept full authority to act during crisis. 92
Pre-event mitigations for employeesNatural disasters also present significant hazards to the onsite workers of energy companies. Failure to mitigate this risk dimension has calamitous implications on reputation in addition to costly casualty compensations. Educating employees about personal preparedness before catastrophes injects confidence within companies in dealing with emergency evacuations. Communicating to employees the existence of employer-sponsored support should hurricanes happen will significantly alleviate employee emotional strains and improve employee sentiment regarding their companies.93
89 (Rexaline 2018)90 (Gunningham, Thornton, and Kagan 2005)91 Climate change here refers to changing trends, more
frequent and sever extremes and greater temporal variations in climate parameters in certain regions (Ebinger and Vergara 2011).
92 (Institute of Risk Management 2019)93 (Sanchez, Korbin, and Viscarra 1995
Post-event managementCorresponding to pre-event mitigations, post-event management focuses on physical and humanitarian recovery. Top management of large energy companies have suggested that separate crisis management groups be organised to concentrate on recovery issues. On a national scale, recovery financing comes jointly from the government and the private sector, including government relief funding, private insurance, charitable donations and humanitarian aid.94 Resources are used in reconstructing physical assets and providing tangible support to employees.
Asset integrityWherever the reconstruction funding is sourced, damage assessment is an early step required of forensic accountants. Energy companies will translate the performance decline into asset write-down, property damage, income loss and extra expense by monitoring three key performance indicators and others according to asset integrity guidelines.95 By examining internal records such as fixed asset registers, purchase orders of contracts for repair or replacement, profits and loss statements for two years prior to the event, companies take control of the difficult situation early on, estimate acceptable level of damage as part of their risk appetites, and resume production metrics as quickly and safely as they can.96
Employee safetyWhile informing employees of safety tips and available employer support before natural disasters is the first step, executing the emergency plan appropriately once they happen is central to post-event management. Protection of people needs to deal with not only the primary effects but also secondary and tertiary ones.97 For example, hurricanes induce wind and rain damage primarily, followed by possible loss of electricity and running water on the asset. In the long run, they may result in permanent loss of habitat if the flooding is severe enough. An efficient start of ensuring safety is to provide employees with access to various effective communication methods to receive instructions and report their conditions in time. Emergency kits such as water and food are distributed from employers’ prepared inventory stock.
Companies are obliged to offer accommodation to shelter as many affected workers as they can. Large energy companies also have the capability of assisting in filing personal insurance claims for employees whilst advising them how to talk to their children about the event – all such proactive measures will make employees feel they are being taken care of and hence improve their motivation to help the companies recover. Shell and its joint venture Motiva
94 (Cambridge Centre for Risk Studies 2018)95 (Oil & Gas UK 2018)96 (Marsh 2015)97 (EKU Online 2018)
34Scenario Applications: Cambridge Centre for Risk Studies Stress Testing Companies in the Energy Value Chain
were good examples for demonstrating humanitarian recovery after Hurricane Katrina. Apart from massive outreach via calls, messages, advertising, door-to-door inquiries etc. to ensure employee safety, they provided temporary housing, financial assistance and counselling support for relocated employees including those who suffered home damage. 98 The companies further reached out to neighbouring communities by offering housing, fuel, operating space and employee voluntary work, which strongly boosted their reputation both locally and globally.
Collaborative communicationsCommunications have much broader scope than just within organisations in face of natural disasters. Rescue and recovery cooperation will be based on communications between companies and local or state entities that include regulators, police, hospitals and emergency agencies. This can efficiently limit the operational and financial losses where energy companies are largely exposed. Ad hoc liaison with media is important dimension for companies to be able to inform their shareholders and the public of the recovery progress, which helps establish corporate reputation in a challenging situation.
Strategic risk appetiteAn increasing trend in the energy sector is that pre-event mitigations and post-event management are not viewed as statically separate but dynamically integrated in strategic risk appetite of large companies. Because companies cannot make profits without assuming risks, they treat their emergency plans and execution power as necessary investments within their risk tolerance to achieve a well-thought strategic goal.99 For instance, aware of potential hazards like hurricanes hitting the coasts, energy companies ask themselves strategic questions such as “should we operate in the Gulf?”. To reach their expected return, companies invest in emergency plans and post-event toolkits to hedge the risks that they have taken on when making the strategic decision. In such case, dealing with natural catastrophes is not seen by energy companies as reactive loss prevention but an inherent project risk that they will have more incentives to proactively hedge. To facilitate the enforcement of this thought, executives believe that transparency – for example specification of dollar amounts at risk – can generate the initial push at the management level to take action.
98 (Donovan 2005)99 (Deloitte n.d.)
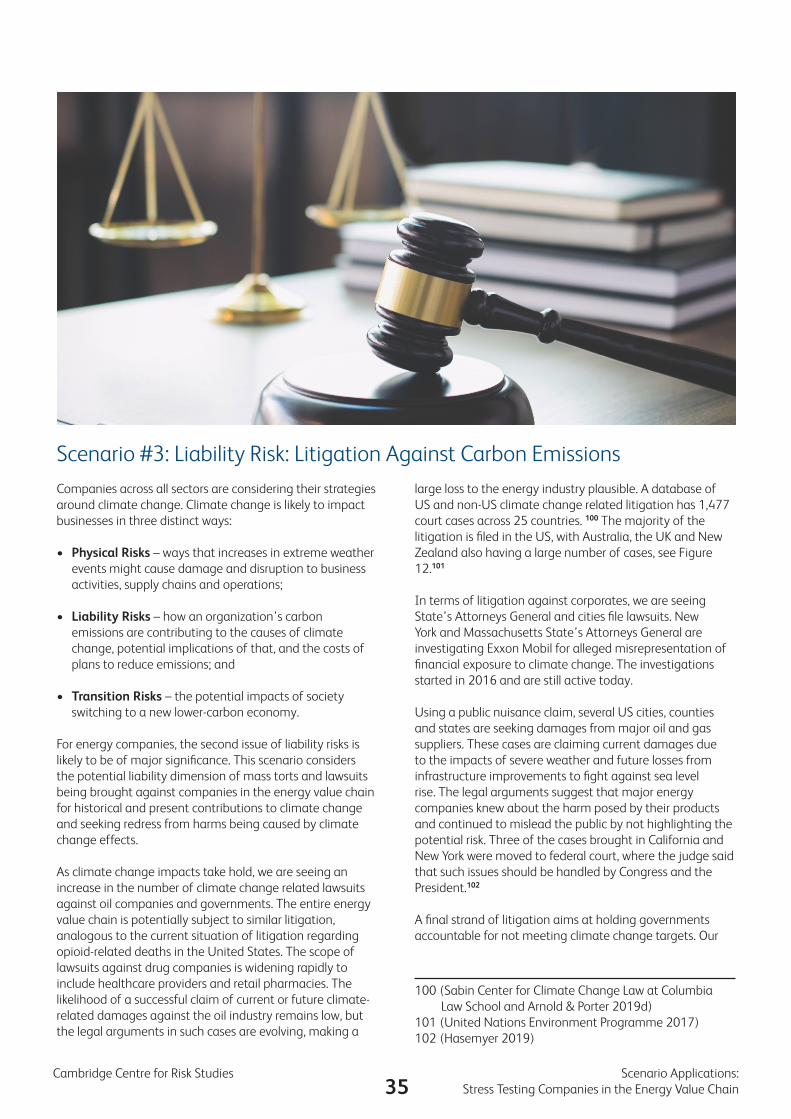
35Cambridge Centre for Risk Studies Scenario Applications:
Stress Testing Companies in the Energy Value Chain
Scenario #3: Liability Risk: Litigation Against Carbon EmissionsCompanies across all sectors are considering their strategies around climate change. Climate change is likely to impact businesses in three distinct ways:
• Physical Risks – ways that increases in extreme weather events might cause damage and disruption to business activities, supply chains and operations;
• Liability Risks – how an organization’s carbon emissions are contributing to the causes of climate change, potential implications of that, and the costs of plans to reduce emissions; and
• Transition Risks – the potential impacts of society switching to a new lower-carbon economy.
For energy companies, the second issue of liability risks is likely to be of major significance. This scenario considers the potential liability dimension of mass torts and lawsuits being brought against companies in the energy value chain for historical and present contributions to climate change and seeking redress from harms being caused by climate change effects.
As climate change impacts take hold, we are seeing an increase in the number of climate change related lawsuits against oil companies and governments. The entire energy value chain is potentially subject to similar litigation, analogous to the current situation of litigation regarding opioid-related deaths in the United States. The scope of lawsuits against drug companies is widening rapidly to include healthcare providers and retail pharmacies. The likelihood of a successful claim of current or future climate-related damages against the oil industry remains low, but the legal arguments in such cases are evolving, making a
large loss to the energy industry plausible. A database of US and non-US climate change related litigation has 1,477 court cases across 25 countries. 100 The majority of the litigation is filed in the US, with Australia, the UK and New Zealand also having a large number of cases, see Figure 12.101
In terms of litigation against corporates, we are seeing State’s Attorneys General and cities file lawsuits. New York and Massachusetts State’s Attorneys General are investigating Exxon Mobil for alleged misrepresentation of financial exposure to climate change. The investigations started in 2016 and are still active today.
Using a public nuisance claim, several US cities, counties and states are seeking damages from major oil and gas suppliers. These cases are claiming current damages due to the impacts of severe weather and future losses from infrastructure improvements to fight against sea level rise. The legal arguments suggest that major energy companies knew about the harm posed by their products and continued to mislead the public by not highlighting the potential risk. Three of the cases brought in California and New York were moved to federal court, where the judge said that such issues should be handled by Congress and the President.102
A final strand of litigation aims at holding governments accountable for not meeting climate change targets. Our
100 (Sabin Center for Climate Change Law at Columbia Law School and Arnold & Porter 2019d)
101 (United Nations Environment Programme 2017)102 (Hasemyer 2019)
36Scenario Applications: Cambridge Centre for Risk Studies Stress Testing Companies in the Energy Value Chain
Children’s Trust in 2015 filed lawsuits in nine US states against the federal government. The lawsuits argue that the government has a responsibility to protect the atmosphere just as they are meant to protect the land, water and fisheries based on the public trust doctrine.
Public trust doctrine cases are also being filed in Ukraine, Philippines and Pakistan.103 Further actions against government stem from human rights bases litigation, which stipulates that citizens have a right to a clean environment and that governments are not doing enough to uphold these rights. For the first time in 2018, the InterAmerican Court of Human Rights ruled that citizens have a right to a healthy environment.104 A final area of litigation against governments relates to policies not standing up to the Paris Agreement. For example, in the UK a group of citizens filed suit against the UK government for carbon emission targets that do not meet the Paris Agreement. 105 A pivotal case in this area was Urgenda Foundation v. Kingdom of the Netherlands where the courts determined that the Dutch government must reduce the countries emissions by 25%. 106 Accelerating the transition to electrical vehicles was an outcome of litigation against German municipalities in DUH v Land Baden-Württemberg which banned diesel cars from the city centres.107 Although these cases name governments as defendants, it is important for corporates to monitor the outcomes as they have the potential to impact policy, laws and regulation.
Determining liability for climate change is challenging since the causal chain is very long. “Fossil fuel production is the beginning of a long chain of causation that includes numerous corporate actors and individual consumers, as well as government licensing and permitting schemes.”108 Academic studies attempt to calculate the impact that fossil fuel companies have on emissions. They find that just 90 major firms are responsible for two thirds of the emissions and for 11 cm of the projected 17 cm sea level rise by 2040.109 Given the large number of greenhouse gas (GHG) emitters, it will be challenging to prove that a given company is responsible for a given consequence or damage. Yet, in traditional product liability cases, the market share theory is commonly used to apportion responsibility.110 Lawsuits are already being filed to test the attribution claims, like Lliuya v. RWE AG. See Breakout Box A: Deep Dive into Climate Change Litigation, for more details.
103 (United Nations Environment Programme 2017)104 (United Nations Environment Programme 2017)105 (Nachmany and Setzer n.d.)106 (de Wit and Quinton 2018; Cox 2016)107 (Hodges, Leatherby, and Mehrotra 2018)108 (Carrington 2018)109 (Ekwurzel et al. 2017)110 (United Nations Environment Programme 2017)
There are several avenues through which corporates can be held liable for climate change related risks. See Table 5 for a summary of possible challenges and remedies to the legal argument against corporates.
• Product liability – since 2017 we are seeing more lawsuits against big oil companies using the legal argument that the industry has been marketing and selling products known to cause harm to the environment. This ‘defective product’ argument is similar that used in asbestos and tobacco litigation. The plaintiffs in these cases are claiming current and future damages.
• Operations liability – there is a growing trend to cite scientific literature attributing GHGs to specific companies and connecting that to climate change impacts.
• Financial liability – energy companies could be held liable for not correctly disclosing (i.e. misreporting or misrepresenting) the risk inherent in their assets. Shareholders could bring suits against the directors and officers (securities class actions) or against the board of directors (derivatives class action) for not disclosing the physical risks from extreme weather or the transitional risks from regulation. Attorney Generals can also investigate this issue. The US, UK, Australia and France all currently have disclosure requirements.111
If lawsuits prove successful with major oil and gas firms, then are companies along the entire energy value chain also at risk and even users of the energy too? Where do we draw the line? Only time will be able to answer this question as litigation is evolves. Figure 12 shows a heat map of the count of climate change litigation globally both with governments or corporates as named defendants.
111 (de Wit and Quinton 2018)
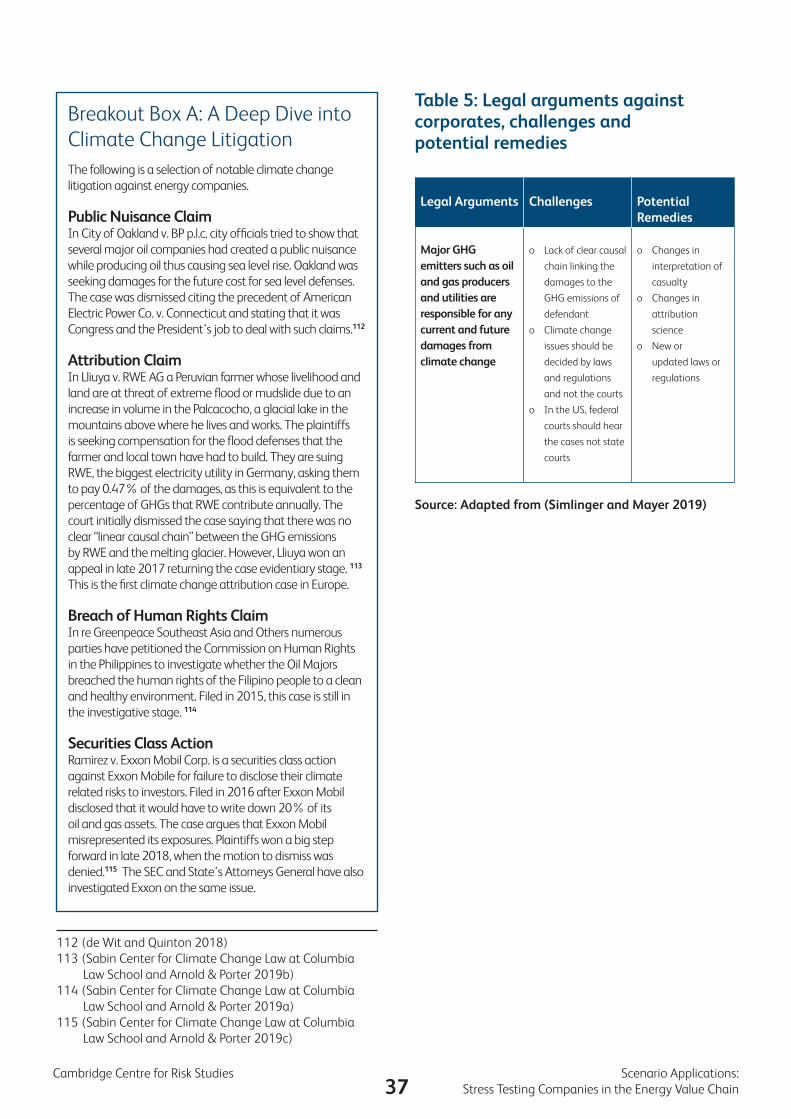
37Cambridge Centre for Risk Studies Scenario Applications:
Stress Testing Companies in the Energy Value Chain
Breakout Box A: A Deep Dive into Climate Change LitigationThe following is a selection of notable climate change litigation against energy companies.
Public Nuisance ClaimIn City of Oakland v. BP p.l.c. city officials tried to show that several major oil companies had created a public nuisance while producing oil thus causing sea level rise. Oakland was seeking damages for the future cost for sea level defenses. The case was dismissed citing the precedent of American Electric Power Co. v. Connecticut and stating that it was Congress and the President’s job to deal with such claims.112
Attribution ClaimIn Lliuya v. RWE AG a Peruvian farmer whose livelihood and land are at threat of extreme flood or mudslide due to an increase in volume in the Palcacocho, a glacial lake in the mountains above where he lives and works. The plaintiffs is seeking compensation for the flood defenses that the farmer and local town have had to build. They are suing RWE, the biggest electricity utility in Germany, asking them to pay 0.47% of the damages, as this is equivalent to the percentage of GHGs that RWE contribute annually. The court initially dismissed the case saying that there was no clear “linear causal chain” between the GHG emissions by RWE and the melting glacier. However, Lliuya won an appeal in late 2017 returning the case evidentiary stage. 113 This is the first climate change attribution case in Europe.
Breach of Human Rights ClaimIn re Greenpeace Southeast Asia and Others numerous parties have petitioned the Commission on Human Rights in the Philippines to investigate whether the Oil Majors breached the human rights of the Filipino people to a clean and healthy environment. Filed in 2015, this case is still in the investigative stage. 114
Securities Class ActionRamirez v. Exxon Mobil Corp. is a securities class action against Exxon Mobile for failure to disclose their climate related risks to investors. Filed in 2016 after Exxon Mobil disclosed that it would have to write down 20% of its oil and gas assets. The case argues that Exxon Mobil misrepresented its exposures. Plaintiffs won a big step forward in late 2018, when the motion to dismiss was denied.115 The SEC and State’s Attorneys General have also investigated Exxon on the same issue.
112 (de Wit and Quinton 2018)113 (Sabin Center for Climate Change Law at Columbia
Law School and Arnold & Porter 2019b)114 (Sabin Center for Climate Change Law at Columbia
Law School and Arnold & Porter 2019a)115 (Sabin Center for Climate Change Law at Columbia
Law School and Arnold & Porter 2019c)
Table 5: Legal arguments against corporates, challenges and potential remedies
Legal Arguments Challenges Potential Remedies
Major GHG emitters such as oil and gas producers and utilities are responsible for any current and future damages from climate change
o Lack of clear causal
chain linking the
damages to the
GHG emissions of
defendant
o Climate change
issues should be
decided by laws
and regulations
and not the courts
o In the US, federal
courts should hear
the cases not state
courts
o Changes in
interpretation of
casualty
o Changes in
attribution
science
o New or
updated laws or
regulations
Source: Adapted from (Simlinger and Mayer 2019)
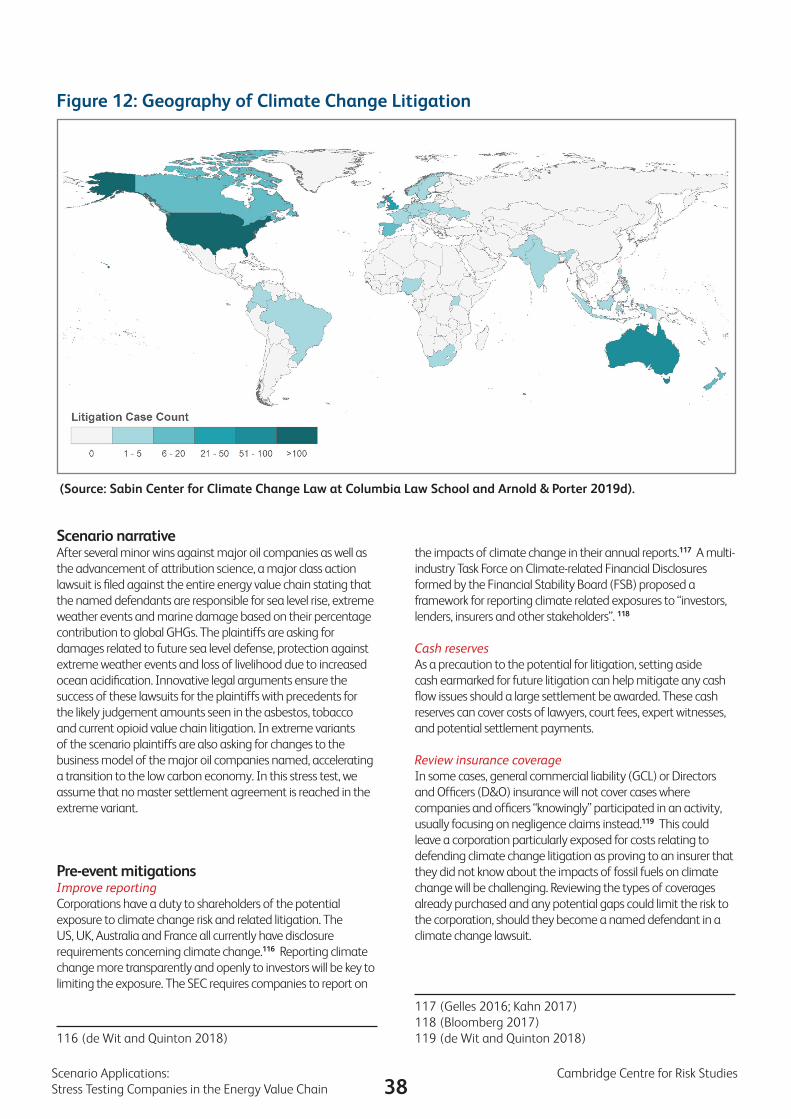
38Scenario Applications: Cambridge Centre for Risk Studies Stress Testing Companies in the Energy Value Chain
Scenario narrativeAfter several minor wins against major oil companies as well as the advancement of attribution science, a major class action lawsuit is filed against the entire energy value chain stating that the named defendants are responsible for sea level rise, extreme weather events and marine damage based on their percentage contribution to global GHGs. The plaintiffs are asking for damages related to future sea level defense, protection against extreme weather events and loss of livelihood due to increased ocean acidification. Innovative legal arguments ensure the success of these lawsuits for the plaintiffs with precedents for the likely judgement amounts seen in the asbestos, tobacco and current opioid value chain litigation. In extreme variants of the scenario plaintiffs are also asking for changes to the business model of the major oil companies named, accelerating a transition to the low carbon economy. In this stress test, we assume that no master settlement agreement is reached in the extreme variant.
Pre-event mitigationsImprove reportingCorporations have a duty to shareholders of the potential exposure to climate change risk and related litigation. The US, UK, Australia and France all currently have disclosure requirements concerning climate change.116 Reporting climate change more transparently and openly to investors will be key to limiting the exposure. The SEC requires companies to report on
116 (de Wit and Quinton 2018)
Figure 12: Geography of Climate Change Litigation
(Source: Sabin Center for Climate Change Law at Columbia Law School and Arnold & Porter 2019d).
the impacts of climate change in their annual reports.117 A multi-industry Task Force on Climate-related Financial Disclosures formed by the Financial Stability Board (FSB) proposed a framework for reporting climate related exposures to “investors, lenders, insurers and other stakeholders”. 118
Cash reservesAs a precaution to the potential for litigation, setting aside cash earmarked for future litigation can help mitigate any cash flow issues should a large settlement be awarded. These cash reserves can cover costs of lawyers, court fees, expert witnesses, and potential settlement payments.
Review insurance coverageIn some cases, general commercial liability (GCL) or Directors and Officers (D&O) insurance will not cover cases where companies and officers “knowingly” participated in an activity, usually focusing on negligence claims instead.119 This could leave a corporation particularly exposed for costs relating to defending climate change litigation as proving to an insurer that they did not know about the impacts of fossil fuels on climate change will be challenging. Reviewing the types of coverages already purchased and any potential gaps could limit the risk to the corporation, should they become a named defendant in a climate change lawsuit.
117 (Gelles 2016; Kahn 2017)118 (Bloomberg 2017)119 (de Wit and Quinton 2018)
39Cambridge Centre for Risk Studies Scenario Applications:
Stress Testing Companies in the Energy Value Chain
Corporate social responsibility (CSR)Engaging in more CSR activities can help limit the further impact of the negative litigation on a company’s reputation. CSR activities can also help boost employee morale which can be impacted by reputational events.
Corporate proceduresRefining corporate process/procedures in regards to how climate change is addressed internally can limit the liability. For example, robust processes on environmental management internally have been shown to improve financial performance.120
Rebalance investment portfolioIn addition to the potential litigation from climate change there is also risk for corporates with large investment portfolios or pension funds which are heavily invested in fossil fuel related assets. Should the transition to a lower carbon economy happen faster than planned then these portfolios will be exposed to signification risk. Changing investment portfolio strategies prior to any trial outcome could be a helpful hedging strategy.
Change investment strategiesEvaluate broader strategic investment strategies to support business model changes towards renewable and clean energy production. This could include growing a division within a company to develop longer term technologies by allocating larger investments, entering joint ventures, acquiring new technology companies. Changes may be wider than changing source or production but include energy services.
Post-event managementFinancial costs of defending litigationLarge settlements or judgements in climate change related litigation has not been the trend, but evolving legal arguments are increasing the chance of a large payout, especially arguments that focus on management decisions, investment strategies and attribution claims. For energy companies caught off guard, they may need to reprioritise capital projects in order to prevent liquidity issues. Access to credit may get more difficult going forward because of either credit downgrades or changes in lending or investing guidelines for banks or investors.
Reputational damageClimate change litigation can bring negative media attention on companies, potentially having an impact on the firm’s reputation. Direct impacts range from revenue loss due to customer churn or loss of future customers, increased advertising costs in an attempt to retain these customers, loss of key personnel, increased hiring costs and potentially stock price impacts. Implementing additional CSR activities post event may limit the impact of reputational damage.
120 (Gunathilaka, Gunawardana, and Pushpakumari 2015)
Disruption to operationsIf the verdict of this ligation involves changes to the way the defendants operate such as bringing their GHGs emissions into a certain range or sweeping business model changes, then companies may need to limit or stop operations altogether. This will cause an increase in operating costs to implement. Some unexplored assets may become stranded if the verdicts require the companies to meet adjusted targets for emissions. Energy is a key resource for the economy, so governments may step in to limit liability.
Lobbying activitiesFollowing a large settlement or judgement, companies in many sectors increase lobbying activities such that they can encourage the governments to draft legislation to limit their liabilities. For American firms, the lobbying intensity – expenditures as a percentage of their assets – when compared to their stock price has consistently outperformed the S&P 500 since 2002.121 Past return on investment of lobbying may not be similarly realised given the macroeconomic forces which are already in play and are propelling world economies to transition to renewable energies.
121 (Economist 2011)
40Scenario Applications: Cambridge Centre for Risk Studies Stress Testing Companies in the Energy Value Chain
Summary of Qualitative Findings for Selected ScenariosThis report uses three scenario stress tests to take a risk perspective of organisations in the energy value chain which are focussed on producing hydrocarbons in the upstream, or are heavy downstream consumers of carbon-based inputs. Energy value chain companies are dispersed throughout the energy, materials, industrials, and utilities GICS sectors.
All three scenarios are represented as shocks, with a representative event that causes a loss or disruption that can be used as a stress test:
• Scenario #1: Geopolitical Crisis: Middle East Conflict
• Scenario #2: Natural Catastrophe: Hurricane in the Gulf of Mexico
• Scenario #3: Liability Risk: Litigation Against Carbon Emissions
These scenarios have considerably different features, from regional physical impacts to legal liability and reputation. Each scenario can also represent an important trend. A number of indices including the Cambridge Global Risk Index122 suggest that geopolitical risks are increasing in general as the world becomes more volatile, so events such as Scenario #1 may occur more frequently. Climate scientists forecast that global anthropogenic warming is likely to result in increasing frequency of severe weather phenomena, a trend that may already be visible today, increasing the likelihood of events such as Scenario #2. Scenario #3 is representative of changing social attitudes, a trend which drives changes in regulation and case law for litigation, so may also represent an area of emerging risk for the energy value chain.
Next, we summarise qualitative findings across these scenario stress tests. Then we look to current and future developments regarding quantifying impacts of stress tests by proposing a notional balance sheet analysis, and a broad view of challenges and opportunities in operational and strategic risk management.
Summarising across Scenarios #1, #2 and #3, five themes emerge from the qualitative risk analysis of the energy value chain. These relate to operations, information, financials, reputation and organisational structure, as summarised in Table 7. Planning and investing to respond to trends that might pose strategic threats and opportunities is an area for further exploration.
122 (Cambridge Centre for Risk Studies 2019)
Section 5: Conclusions
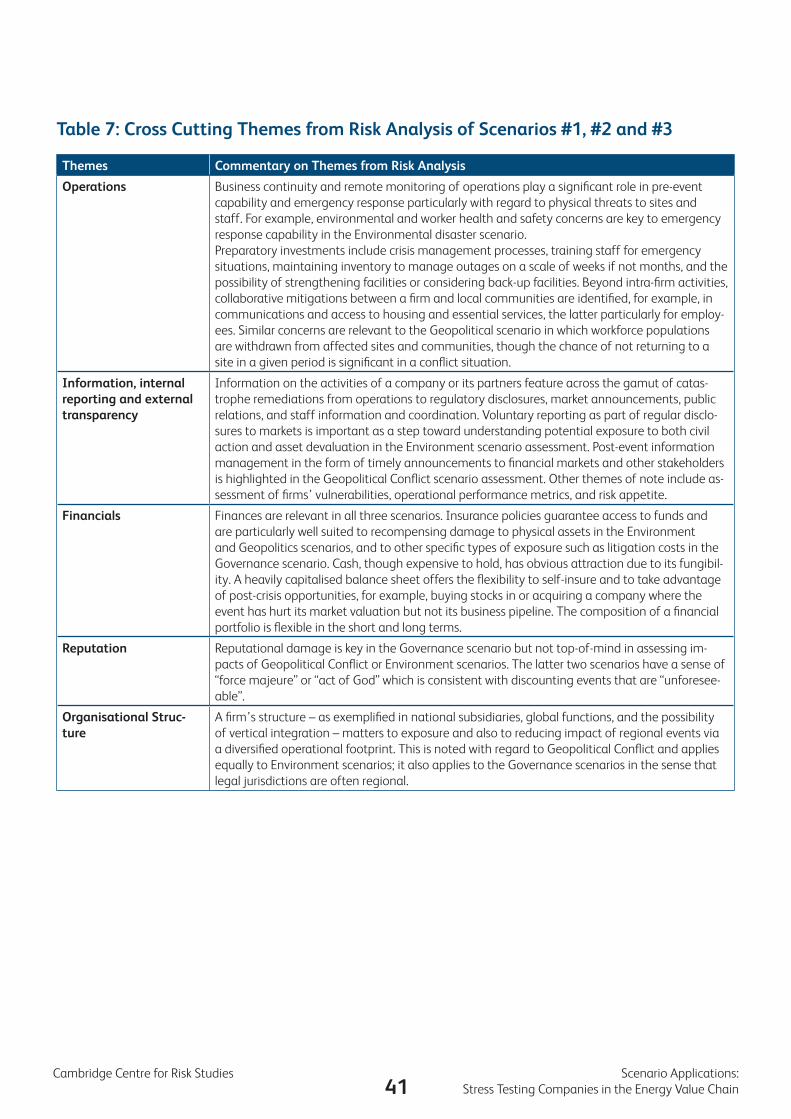
41Cambridge Centre for Risk Studies Scenario Applications:
Stress Testing Companies in the Energy Value Chain
Table 7: Cross Cutting Themes from Risk Analysis of Scenarios #1, #2 and #3
Themes Commentary on Themes from Risk Analysis
Operations Business continuity and remote monitoring of operations play a significant role in pre-event capability and emergency response particularly with regard to physical threats to sites and staff. For example, environmental and worker health and safety concerns are key to emergency response capability in the Environmental disaster scenario. Preparatory investments include crisis management processes, training staff for emergency situations, maintaining inventory to manage outages on a scale of weeks if not months, and the possibility of strengthening facilities or considering back-up facilities. Beyond intra-firm activities, collaborative mitigations between a firm and local communities are identified, for example, in communications and access to housing and essential services, the latter particularly for employ-ees. Similar concerns are relevant to the Geopolitical scenario in which workforce populations are withdrawn from affected sites and communities, though the chance of not returning to a site in a given period is significant in a conflict situation.
Information, internal reporting and external transparency
Information on the activities of a company or its partners feature across the gamut of catas-trophe remediations from operations to regulatory disclosures, market announcements, public relations, and staff information and coordination. Voluntary reporting as part of regular disclo-sures to markets is important as a step toward understanding potential exposure to both civil action and asset devaluation in the Environment scenario assessment. Post-event information management in the form of timely announcements to financial markets and other stakeholders is highlighted in the Geopolitical Conflict scenario assessment. Other themes of note include as-sessment of firms’ vulnerabilities, operational performance metrics, and risk appetite.
Financials Finances are relevant in all three scenarios. Insurance policies guarantee access to funds and are particularly well suited to recompensing damage to physical assets in the Environment and Geopolitics scenarios, and to other specific types of exposure such as litigation costs in the Governance scenario. Cash, though expensive to hold, has obvious attraction due to its fungibil-ity. A heavily capitalised balance sheet offers the flexibility to self-insure and to take advantage of post-crisis opportunities, for example, buying stocks in or acquiring a company where the event has hurt its market valuation but not its business pipeline. The composition of a financial portfolio is flexible in the short and long terms.
Reputation Reputational damage is key in the Governance scenario but not top-of-mind in assessing im-pacts of Geopolitical Conflict or Environment scenarios. The latter two scenarios have a sense of “force majeure” or “act of God” which is consistent with discounting events that are “unforesee-able”.
Organisational Struc-ture
A firm’s structure – as exemplified in national subsidiaries, global functions, and the possibility of vertical integration – matters to exposure and also to reducing impact of regional events via a diversified operational footprint. This is noted with regard to Geopolitical Conflict and applies equally to Environment scenarios; it also applies to the Governance scenarios in the sense that legal jurisdictions are often regional.
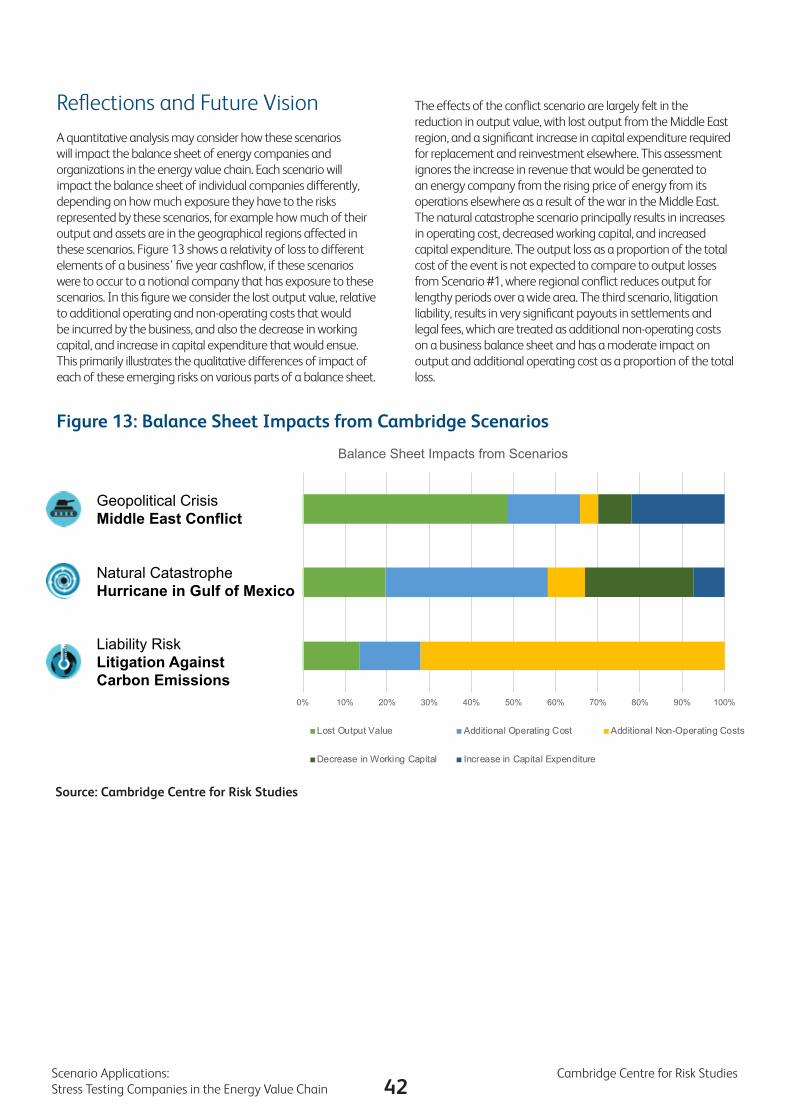
42Scenario Applications: Cambridge Centre for Risk Studies Stress Testing Companies in the Energy Value Chain
Reflections and Future VisionA quantitative analysis may consider how these scenarios will impact the balance sheet of energy companies and organizations in the energy value chain. Each scenario will impact the balance sheet of individual companies differently, depending on how much exposure they have to the risks represented by these scenarios, for example how much of their output and assets are in the geographical regions affected in these scenarios. Figure 13 shows a relativity of loss to different elements of a business’ five year cashflow, if these scenarios were to occur to a notional company that has exposure to these scenarios. In this figure we consider the lost output value, relative to additional operating and non-operating costs that would be incurred by the business, and also the decrease in working capital, and increase in capital expenditure that would ensue. This primarily illustrates the qualitative differences of impact of each of these emerging risks on various parts of a balance sheet.
Figure 13: Balance Sheet Impacts from Cambridge Scenarios
Source: Cambridge Centre for Risk Studies
The effects of the conflict scenario are largely felt in the reduction in output value, with lost output from the Middle East region, and a significant increase in capital expenditure required for replacement and reinvestment elsewhere. This assessment ignores the increase in revenue that would be generated to an energy company from the rising price of energy from its operations elsewhere as a result of the war in the Middle East. The natural catastrophe scenario principally results in increases in operating cost, decreased working capital, and increased capital expenditure. The output loss as a proportion of the total cost of the event is not expected to compare to output losses from Scenario #1, where regional conflict reduces output for lengthy periods over a wide area. The third scenario, litigation liability, results in very significant payouts in settlements and legal fees, which are treated as additional non-operating costs on a business balance sheet and has a moderate impact on output and additional operating cost as a proportion of the total loss.
0% 10% 20% 30% 40% 50% 60% 70% 80% 90% 100%
Conflict in Middle East
Hurricane in Gulf of Mexico
Climate Change Litigation Liability
Balance Sheet Impacts from Scenarios
Lost Output Value Additional Operating Cost Additional Non-Operating Costs
Decrease in Working Capital Increase in Capital Expenditure
Geopolitical CrisisMiddle East Conflict
Natural CatastropheHurricane in Gulf of Mexico
Liability RiskLitigation Against Carbon Emissions
43Cambridge Centre for Risk Studies Scenario Applications:
Stress Testing Companies in the Energy Value Chain
A broader reflection encompasses several points. First, financial tools including insurance are not seen as a replacement for business continuity and other operational planning and response capabilities when dealing with catastrophic events. Beyond cash flow issues or repair and recovery costs of a catastrophe, the strategic imperative is to retain or even grow your customer base. Maintenance of brand value including operational performance is important for the future health of any business.
Second, information, whether internal to the organisation as used in process monitoring and risk assessment, or external such as voluntary disclosure, is key to managing operational risks including public relations in times of acute crisis. Information transparency is also crucial to engaging in the public domain on emerging risks. An early milestone facing a firm on the road to greater transparency is articulation of its risk appetite within the context of the business activities that deliver its value proposition to its customers. Assessing whether a firm is within a quantified risk appetite is challenging but should be considered as a goal, even for risk types where events of significance are highly unpredictable.
Despite the unpredictability of the three types of scenarios considered, the Cambridge Centre for Risk Studies views all three types as foreseeable in the sense that their history of frequency and severity provides some basis for estimating future frequency and severity, while underlining that the time of arrival and severity of any particular event is unpredictable. Put simply, unpredictability is not an excuse for lack of preparation: unpredictable events can be foreseen in terms of their risks, as indicated in the notional balance sheet risk assessment in Figure 13. This is at the heart of the wide and continuing push for companies, as well as governmental agencies and not-for-profit organisations, to declare their risk exposures similar to the way they would declare asset values.
Third, emerging risk is not a focus of Table 7, which has an operational and crisis response focus and reflects the shock nature of the stress test scenarios. Emerging risks may be less visible but arguably equally important to longer term viability of an organisation. For those parts of the energy value chain which embed fossil fuel production and consumption, the trends of physical climate change and climate transition both pose strategic risks - risks to the business model of those organisations. The general topic of creeping change and associated response is a subject of ongoing development in the regulatory, commercial and risk research arenas.
Finally, financial and governance structures play a role in both risk exposure and in assessing and mitigating risks. A clearer picture of the link between the structure of a public company, its risk exposures and its meaningful mitigations is an ambition.
This report focuses on three disparate stress test scenarios to qualitatively explore the exposure and response of the energy value chain to shocks in the business and social environment. A deeper study could expand the analysis by increasing the number and type of risk scenarios, including of emerging
risks. The outputs would be a set of empirical or modelled data to quantify business impacts including the chance of an organisation exceeding its risk appetite thresholds in any given period. The broader vision is to produce standardised evaluation processes that allow business consequences across a comprehensive library of risk scenarios to be compared. Aggregating across all scenarios is the foundation for a transparent cost-benefit approach to managing risk appetite and resilience for an organisation.
44Scenario Applications: Cambridge Centre for Risk Studies Stress Testing Companies in the Energy Value Chain
BibliographyAbdo, et al. 2017. “The Sunni-Shia Divide.” June 11, 2017.
https://www.cfr.org/sunnishia.
Allianz. n.d. “Lessons Learned from Hurricane Katrina.” Expert Risk Articles (blog). Accessed January 17, 2019. https://www.agcs.allianz.com/insights/expert-risk-articles/lessons-learned-from-hurricane-katrina/.
“Banking in the Low Carbon Economy.” n.d. Page. Cambridge Institute for Sustainability Leadership. Accessed January 30, 2019. https://www.cisl.cam.ac.uk/business-action/sustainable-finance/banking-environment-initiative/programme/banking-low-carbon.
BBC News. 2019. “Climate Protests: Marches Worldwide against Global Warming,” September 20, 2019. https://www.bbc.com/news/world-49777279.
Bchir, Mohamed Hedi, and Jose Antonio Pedrosa-Garcia. 2015. “Chapter 3: The Impact of the 2014 Oil Shock on Arab Economies.” In ESCWA’s Survey of Economics and Social Development, 27.
Blackwill, Robert D., and Jennifer M. Harris. 2017. “War by Other Means — Robert D. Blackwill, Jennifer M. Harris | Harvard University Press.” 2017. http://www.hup.harvard.edu/catalog.php?isbn=9780674979796.
Bloomberg, Michael. 2017. “Recommendations of the Task Force on Climate-Related Financial Disclosures.” Final Report.
BP plc. 2019. “BP Energy Outlook 2019 Edition.” https://www.bp.com/content/dam/bp/business-sites/en/global/corporate/pdfs/energy-economics/energy-outlook/bp-energy-outlook-2019.pdf.
Bremmer, Ian. 2010. “The Long Shadow of the Visible Hand.” Wall Street Journal, May 22, 2010, sec. Life and Style. https://www.wsj.com/articles/SB10001424052748704852004575258541875590852.
Burchardt, Jens, Philipp Gerbert, Stefan Schönberger, Patrick Herhold, and Christophe Brognaux. 2018. “The Economic Case for Combating Climate Change.” BCG Henderson Institute. https://www.bcg.com/en-gb/publications/2018/economic-case-combating-climate-change.aspx.
Cambridge Centre for Risk Studies. 2015. “Unhedgeable Risk: How Climate Change Sentiment Impacts Investors.” https://www.jbs.cam.ac.uk/fileadmin/user_upload/research/centres/risk/downloads/crs-unhedgeable-risk.pdf.
———. 2018a. “Challenges and Solutions for Enterprise Exposure Management.” Cambridge Centre for Risk Studies at the University of Cambridge Judge Business School, in collaboration with Risk Management Solutions. https://www.jbs.cam.ac.uk/faculty-research/centres/risk/publications/multi-threat/challenges-and-solutions-for-enterprise-exposure-management/.
———. 2018b. “Risk Management Perspectives of Global Corporations.” Cambridge Centre for Risk Studies at the University of Cambridge Judge Business School, in collaboration with Institute of Risk Management. https://www.jbs.cam.ac.uk/faculty-research/centres/risk/publications/finance-economics-and-trade/risk-management-perspectives-of-global-corporations/.
———. 2018c. “Disaster Recovery Case Studies, US 2005 Storms: Katrina, Rita, and Wilma.” Cambridge Centre for Risk Studies at the University of Cambridge Judge Business School, in collaboration with AxaXL. https://www.jbs.cam.ac.uk/fileadmin/user_upload/research/centres/risk/downloads/crs-case-study-hurricane-katrina.
———. 2019a. “Global Risk Index 2019 Executive Summary.” https://www.jbs.cam.ac.uk/fileadmin/user_upload/research/centres/risk/downloads/crs-global-risk-index-exec-summary-2019.pdf.
———. 2019b. “Cyber Risk Outlook.” Cambridge Centre for Risk Studies at the University of Cambridge Judge Business School, in collaboration with Risk Management Solutions. https://www.jbs.cam.ac.uk/faculty-research/centres/risk/publications/space-and-technology/cyber-risk-outlook-2019/.
———. 2017. “Impacts of Severe Natural Catastrophes on Financial Markets.” Cambridge Centre for Risk Studies at the University of Cambridge Judge Business School, in collaboration with Munich Re. https://www.jbs.cam.ac.uk/faculty-research/centres/risk/publications/natural-catastrophe-and-climate/impacts-of-severe-natural-catastrophes-on-financial-markets/.
“Carbon Tax Center – Pricing Carbon Efficiently and Equitably.” n.d. Carbon Tax Center. Accessed January 31, 2019. https://www.carbontax.org/.
Carrington, Damian. 2018. “Can Climate Litigation Save the World?” The Guardian, March 20, 2018, sec. Environment. https://www.theguardian.com/environment/2018/mar/20/can-climate-litigation-save-the-world.
45Cambridge Centre for Risk Studies Scenario Applications:
Stress Testing Companies in the Energy Value Chain
Centre for the Protection of National Infrastructure. 2018. “Critical National Infrastructure,” 2018. https://www.cpni.gov.uk/critical-national-infrastructure-0.
Chan, Sewell. 2016. “Cyberattacks Strike Saudi Arabia, Harming Aviation Agency.” The New York Times, January 12, 2016, sec. World. https://www.nytimes.com/2016/12/01/world/middleeast/saudi-arabia-shamoon-attack.html.
Citi. 2019. “Energy Darwinism III: The Electrifying Path to Net Zero Carbon.” Citi GPS: Global Perspectives & Solutions. https://ir.citi.com/Mix2nk7TAOYRwYD7XaepoJqKuIlbgh3tH9f7J9A%2BV6%2B6D%2FHthybMOoSFWoQYW4BHHKLXt3NMAdc%3D.
“Climate Action 100+.” n.d. Climate Action 100+. Accessed January 31, 2019. https://climateaction100.wordpress.com/.
Colgan, Jeff D. 2014. “Oil, Domestic Politics, and International Conflict.” Energy Research & Social Science 1 (March): 198–205. https://doi.org/10.1016/j.erss.2014.03.005.
Cox, Roger. 2016. “A Climate Change Litigation Precedent: Urgenda Foundation v The State of the Netherlands.” Journal of Energy & Natural Resources Law 34 (2): 143–63. https://doi.org/10.1080/02646811.2016.1147887.
Dalay, Galip. 2018. “Turkey in the Middle East’s New Battle Lines.” Brookings (blog). May 20, 2018. https://www.brookings.edu/opinions/the-middle-easts-new-battle-lines/.
Deloitte. n.d. “The Risk Intelligent Energy Company.” Issue No.7. Risk Intelligence Series. Accessed January 21, 2019. https://www2.deloitte.com/global/en/pages/governance-risk-and-compliance/articles/risk-intelligent-energy-company.html.
Department for Business, Energy & Industrial Strategy. 2018. “Coal Generation in Great Britain: The Pathway to a Low-Carbon Future.” GOV.UK. January 5, 2018. https://www.gov.uk/government/consultations/coal-generation-in-great-britain-the-pathway-to-a-low-carbon-future.
DNI. 2019. “Worldwide Threat Assessment 2019.” January 29, 2019. https://www.politico.com/f/?id=00000168-9a0d-dc7b-a36e-ff0fa2050001.
Donovan, John. 2005. “Shell and Motiva Account for All Employees Impacted By Hurricane Katrina.” Royal Dutch Shell Plc .Com (blog). September 14, 2005. https://royaldutchshellplc.com/2005/09/15/shell-and-motiva-account-for-all-employees-impacted-by-hurricane-katrina/.
Dragos. 2017. “TRISIS-01.Pdf.” 2017. https://dragos.com/wp-content/uploads/TRISIS-01.pdf.
Ebinger, Jane, and Walter Vergara. 2011. Climate Impacts on Energy Systems. World Bank Studies. The World Bank. https://doi.org/10.1596/978-0-8213-8697.
Economist. 2011. “Money and Politics,” October 1, 2011. https://www.economist.com/finance-and-economics/2011/10/01/money-and-politics.
Economist Intelligence Unit. 2015. “The Cost of Inaction: Recognising the Value at Risk from Climate Change,” 2015. https://eiuperspectives.economist.com/sites/default/files/The%20cost%20of%20inaction_0.pdf.
EKU Online. 2018. “Occupational Safety In Natural Disasters.” EKU Online (blog). February 23, 2018. https://safetymanagement.eku.edu/blog/occupational-safety-in-natural-disasters/.
Ekwurzel, B., J. Boneham, M. W. Dalton, R. Heede, R. J. Mera, M. R. Allen, and P. C. Frumhoff. 2017. “The Rise in Global Atmospheric CO2, Surface Temperature, and Sea Level from Emissions Traced to Major Carbon Producers.” Climatic Change 144 (4): 579–90. https://doi.org/10.1007/s10584-017-1978-0.
European Environment Agency. 2018. “Share of Renewable Energy in Gross Final Energy Consumption.” https://www.eea.europa.eu/data-and-maps/indicators/renewable-gross-final-energy-consumption-4/assessment-3.
Forbes. n.d. “The World’s Largest Public Companies.” Forbes. Accessed December 10, 2018. https://www.forbes.com/global2000/list/.
Fratzscher, Marcel, Daniel Schneider, and Ine Van Robays. 2014. “Oil Prices, Exchange Rates and Asset Prices.” European Central Bank , Working Paper Series, no. 1689 (July). https://www.ecb.europa.eu/pub/pdf/scpwps/ecbwp1689.pdf.
46Scenario Applications: Cambridge Centre for Risk Studies Stress Testing Companies in the Energy Value Chain
Gelles, David. 2016. “S.E.C. Is Criticized for Lax Enforcement of Climate Risk Disclosure.” The New York Times, January 23, 2016, sec. Energy & Environment. https://www.nytimes.com/2016/01/24/business/energy-environment/sec-is-criticized-for-lax-enforcement-of-climate-risk-disclosure.html.
Global Fire Power. 2018a. “2018 Iran Military Strength.” 2018. https://www.globalfirepower.com/country-military-strength-detail.asp?country_id=iran.
———. 2018b. “2018 Saudi Arabia Military Strength.” 2018. https://www.globalfirepower.com/country-military-strength-detail.asp?country_id=saudi-arabia.
Graaff, Naná De. 2011. “A Global Energy Network? The Expansion and Integration of Non-Triad National Oil Companies.” Global Networks 11 (2): 262–83. https://doi.org/10.1111/j.1471-0374.2011.00320.x.
Grigoli, Francesco, Alexander Herman, and Andrew Swiston. n.d. “A Crude Shock: Explaining the Impact of the 2014-16 Oil Price Decline Across Exporters.” IMF Workding Paper. https://www.google.com/url?sa=t&rct=j&q=&esrc=s&source=web&cd=15&cad=rja&uact=8&ved=2ahUKEwjBxdSbhKLgAhUuQxUIHe0mCogQFjAOegQIBhAC&url=https%3A%2F%2Fwww.imf.org%2F~%2Fmedia%2FFiles%2FPublications%2FWP%2F2017%2Fwp17160.ashx&usg=AOvVaw3meU_CDFBUsZ6urbLReyC-.
Gujba, Haruna, Steve Thorne, Yacob Mulugetta, Kavita Rai, and Youba Sokona. 2012. “Financing Low Carbon Energy Access in Africa.” Energy Policy, Universal access to energy: Getting the framework right, 47 (June): 71–78. https://doi.org/10.1016/j.enpol.2012.03.071.
Gunathilaka, L. F. D. Z., Kennedy Gunawardana, and M. D. Pushpakumari. 2015. “An Impact of Environmental Practices on Financial Performance: A Literature Review.” SSRN Scholarly Paper ID 2699776. Rochester, NY: Social Science Research Network. https://papers.ssrn.com/abstract=2699776.
Gunningham, Neil A., Dorothy Thornton, and Robert A. Kagan. 2005. “Motivating Management: Corporate Compliance in Environmental Protection Special Issue on Regulation and Business Behavior.” Law & Policy 27: 289–316.
Halliday, Josh. 2018. “28,000 Jobs at Risk in North of England over Low-Carbon Economy.” The Guardian, October 21, 2018, sec. UK news. https://www.theguardian.com/uk-news/2018/oct/22/28000-jobs-at-risk-in-north-of-england-over-low-carbon-economy.
Hamilton, Kirk. 2017. “Economic Co-Benefits of Reducing CO2 Emissions Outweigh the Cost of Mitigation for Most Big Emitters.” November 2017. http://www.lse.ac.uk/GranthamInstitute/news/economic-co-benefits-of-reducing-co2-emissions-outweigh-the-cost-of-mitigation-for-most-big-emitters/.
Hasemyer, David. 2019. “Fossil Fuels on Trial: Where the Major Climate Change Lawsuits Stand Today.” InsideClimate News. January 6, 2019. https://insideclimatenews.org/news/04042018/climate-change-fossil-fuel-company-lawsuits-timeline-exxon-children-california-cities-attorney-general.
Hendrix, Cullen S. 2014. “Oil Prices and Interstate Conflict Behavior.” SSRN Electronic Journal. https://doi.org/10.2139/ssrn.2474642.
Hodges, Jeremy, Lauren Leatherby, and Kartikay Mehrotra. 2018. “Climate Change Warriors’ Latest Weapon of Choice Is Litigation,” May 24, 2018. https://www.bloomberg.com/graphics/2018-climate-change-lawsuits/.
Hoffman. 2018. “Al-Qaeda’s Resurrection.” Council on Foreign Relations. June 3, 2018. https://www.cfr.org/expert-brief/al-qaedas-resurrection.
Hope, Bradley, and Nicole Friedman. 2018. “Climate Change Is Forcing the Insurance Industry to Recalculate.” Wall Street Journal, October 2, 2018. https://www.wsj.com/graphics/climate-change-forcing-insurance-industry-recalculate/.
HSBC. 2016. “HSBC Statement on Climate Change.” file:///C:/Users/Michelle%20Tuveson/Downloads/161102-hsbc-statement-on-climate-change-oct16.pdf.
Institute of Risk Management. 2019. “Fuelling the Debate: Latest Risk Management Trends in the Energy Sector 2019.”
Intergovernmental Panel on Climate Change. 2013. “Climate Change 2013: The Physical Science Basis.” http://www.climatechange2013.org/images/report/WG1AR5_ALL_FINAL.pdf.
47Cambridge Centre for Risk Studies Scenario Applications:
Stress Testing Companies in the Energy Value Chain
———. 2018. “Global Warming of 1.5 oC —.” https://www.ipcc.ch/sr15/.
International Energy Agency. 2018. “International Energy Agency World Energy Outlook 2018.” https://www.iea.org/weo2018/scenarios/.
———. 2019. “Responding to Major Supply Disruptions.” International Energy Agency. 2019. https://www.iea.org/topics/energysecurity/respondingtomajorsupplydisruptions/.
IPCC. 2018. “Special Report on Global Warming of 1.5oC.” https://www.ipcc.ch/sr15/.
Iran Action Group, U.S. Department of State. 2018. “Outlaw Regime: A Chronicle of Iran’s Destructive Activities.” 2018. https://www.state.gov/documents/organization/286410.pdf.
Jacobs, Justin. 2017. “Hurricane Harvey’s Energy Impact.” Petroleum Economist, August 29, 2017. https://www.petroleum-economist.com/articles/politics-economics/north-america/2017/hurricane-harveys-energy-impact.
Jaffe, Amy Myers, and Jareer Elass. 2016. “War and the Oil Price Cycle.” JIA SIPA. January 1, 2016. https://jia.sipa.columbia.edu/war-oil-price-cycle.
Jäger-Waldau, Arnulf. 2017. “PV Status Report 2017.” JRC Science For Policy Report. Luxembourg: Publications Office of the European Union. https://ec.europa.eu/jrc/sites/jrcsh/files/kjna28817enn.pdf.
Johnson et al. 2017. “Attackers Deploy New ICS Attack Framework ‘TRITON’ and Cause Operational Disruption to Critical Infrastructure « Attackers Deploy New ICS Attack Framework ‘TRITON’ and Cause Operational Disruption to Critical Infrastructure.” FireEye. December 14, 2017. https://www.fireeye.com/blog/threat-research/2017/12/attackers-deploy-new-ics-attack-framework-triton.html.
Kahn, Matthew E. 2017. “Requiring Companies to Disclose Climate Risks Helps Everyone.” Harvard Business Review. February 16, 2017. https://hbr.org/2017/02/requiring-companies-to-disclose-climate-risks-helps-everyone.
Katzman, Kenneth. 2019a. “Iran’s Foreign and Defense Policies,” January, 70.
———. 2019b. “Qatar: Governance, Security, and U.S. Policy,” November, 27.
Katzman, Kenneth, and Christopher M. Blanchard. 2017. “Qatar and Its Neighbors: Disputes and Possible Implications,” June, 3.
Kirkpatrick, David D., and Sheera Frenkel. 2017. “Hacking in Qatar Highlights a Shift Toward Espionage-for-Hire.” The New York Times, December 22, 2017, sec. World. https://www.nytimes.com/2017/06/08/world/middleeast/qatar-cyberattack-espionage-for-hire.html.
Klare, Michael T. 2014. “Twenty-First Century Energy Wars: How Oil and Gas Are Fuelling Global Conflicts.” Energy Post (blog). July 15, 2014. https://energypost.eu/twenty-first-century-energy-wars-oil-gas-fuelling-global-conflicts/.
Kleiner, Art. 2003. “The Man Who Saw the Future.” Strategy+business, Spring 2003. https://www.strategy-business.com/article/8220?gko=4447f.
Kynge, James, Chris Campbell, Amy Kazmin, and Farhan Bokhari. 2017. “How China Rules the Waves.” December 1, 2017. https://ig.ft.com/sites/china-ports.
Leiserowitz, A, E Maibach, S Rosenthal, J Kotcher, M Ballew, M Goldberg, and A Gustafson. 2018. “Climate Change in the American Mind.” Yale University and George Mason University. https://climatecommunication.yale.edu/publications/climate-change-in-the-american-mind-december-2018/.
Linden, Ronald H. 2018. “China Is Buying Up Ports and Influence Across Europe.” Text. The National Interest. June 10, 2018. https://nationalinterest.org/feature/china-buying-ports-influence-across-europe-26210.
“Low-Carbon Economy.” 2019. In Wikipedia. https://en.wikipedia.org/w/index.php?title=Low-carbon_economy&oldid=880498042.
Luciani, Giacomo. 2011. “Armed Conflicts and Security of Oil and Gas Supplies.” SSRN Electronic Journal. https://doi.org/10.2139/ssrn.1898630.
Mai, T, D Sandor, R Wiser, and T Schneider. 2012. “Renewable Electricity Futures Study: Executive Study.” National Renewable Energy Laboratory. http://www.nrel.gov/analysis/re_futures/.
Marsh. 2015. “10 Years After Hurricane Katrina: Lessons in Preparedness, Response,and Resilience.” Insights. https://www.marsh.com/us/insights/research/katrina-lessons-in-risk-management-and-resiliency.html.
48Scenario Applications: Cambridge Centre for Risk Studies Stress Testing Companies in the Energy Value Chain
Masnadi, Mohammad S., Hassan M. El-Houjeiri, Dominik Schunack, Yunpo Li, Jacob G. Englander, Alhassan Badahdah, Jean-Christophe Monfort, et al. 2018. “Global Carbon Intensity of Crude Oil Production.” Science 361 (6405): 851–53. https://doi.org/10.1126/science.aar6859.
McKinsey & Company. 2019. “Global Energy Perspective 2019: Reference Case.” https://www.mckinsey.com/~/media/McKinsey/Industries/Oil%20and%20Gas/Our%20Insights/Global%20Energy%20Perspective%202019/McKinsey-Energy-Insights-Global-Energy-Perspective-2019_Reference-Case-Summary.ashx.
Mercure, J.-F., H. Pollitt, J. E. Viñuales, N. R. Edwards, P. B. Holden, U. Chewpreecha, P. Salas, I. Sognnaes, A. Lam, and F. Knobloch. 2018. “Macroeconomic Impact of Stranded Fossil Fuel Assets.” Nature Climate Change 8 (7): 588. https://doi.org/10.1038/s41558-018-0182-1.
Mooney, Attracta. 2018. “Cambridge Investment Chiefs Quit University Endowment Fund.” Financial Times, September 14, 2018. https://www.ft.com/content/04ca3992-b755-11e8-b3ef-799c8613f4a1.
Nace, Trevor. 2018. “Trump Administration Stands Alone As The Rest Of The G20 Pledges To Fight Climate Change.” Forbes, December 4, 2018. https://www.forbes.com/sites/trevornace/2018/12/04/trump-im-too-intelligent-to-believe-in-climate-change-as-he-stands-alone-against-global-alliance/#13c02ee83c4a.
Nachmany, Michal, and Joana Setzer. n.d. “Global Trends in Climate Change Legislation and Litigation: 2018 Snapshot.” Accessed February 4, 2019. http://www.lse.ac.uk/GranthamInstitute/publication/global-trends-in-climate-change-legislation-and-litigation-2018-snapshot/.
Naff, Thomas. 1985. “Gulf Security and the Iran-Iraq War:” Fort Belvoir, VA: Defense Technical Information Center. https://doi.org/10.21236/ADA229581.
NASA Global Climate Change. n.d. “The Causes of Climate Change.” https://climate.nasa.gov/causes/.
National Oceanic and Atmostpheric Administration. 2019. “2018 Was 4th Hottest Year on Record for the Globe,” February 6, 2019. https://www.noaa.gov/news/2018-was-4th-hottest-year-on-record-for-globe.
Newburger, Emma. 2019. “‘Capitalism Needs to Evolve’: Businesses Close and Employees Walk out for Global Climate Strike.” CNBC, September 20, 2019. https://www.cnbc.com/2019/09/20/global-climate-strike-facebook-amazon-and-twitter-workers-walk-out.html.
NOAA. 2018. “IBTrACS - International Best Track Archive for Climate Stewardship.” https://www.ncdc.noaa.gov/ibtracs/index.php?name=ibtracs-data.
Nohria, Nitin. 2010. “Column: Wealth and Jobs: The Broken Link.” Harvard Business Review. https://hbr.org/2010/11/column-wealth-and-jobs-the-broken-link.
Oil & Gas UK. 2018. “Asset Integrity.” Oil & Gas UK. 2018. https://oilandgasuk.co.uk/assetintegrity/.
Oxford Energy Forum. 2018. “The Future of Gas.” Issue 116. https://www.oxfordenergy.org/wpcms/wp-content/uploads/2018/09/OEF-116.pdf.
“Part 2: Relationships Changing as NOC, IOC Roles Evolve.” 2007. Oil&Gas Journal. April 2, 2007. https://www.ogj.com/articles/print/volume-105/issue-13/general-interest/part-2-relationships-changing-as-noc-ioc-roles-evolve.html.
Perlroth, Nicole. 2012. “Cyberattack on Saudi Oil Firm Disquiets U.S.” The New York Times, October 23, 2012, sec. Global Business. https://www.nytimes.com/2012/10/24/business/global/cyberattack-on-saudi-oil-firm-disquiets-us.html.
Perlroth, Nicole, and Clifford Krauss. 2018. “A Cyberattack in Saudi Arabia Had a Deadly Goal. Experts Fear Another Try.” The New York Times, October 17, 2018, sec. Technology. https://www.nytimes.com/2018/03/15/technology/saudi-arabia-hacks-cyberattacks.html.
Posen. 1993. “The Security Dilemma and Ethnic Conflict: Survival: Vol 35, No 1.” March 3, 1993. https://www.tandfonline.com/doi/abs/10.1080/00396339308442672.
PricewaterhouseCoopers. 2018. “Building Block(Chain)s for a Better Planet.” Fourth Industrial Revolution for the Earth Series. https://www.pwc.com/gx/en/sustainability/assets/blockchain-for-a-better-planet.pdf.
———. n.d. “Climate Change - the next Emerging Risk for Your Business?” PwC. Accessed January 30, 2019a. https://www.pwc.co.uk/services/sustainability-climate-change/climate-risks-and-the-fsb-task-force.html.
49Cambridge Centre for Risk Studies Scenario Applications:
Stress Testing Companies in the Energy Value Chain
———. n.d. “The Low Carbon Economy Index.” PwC. Accessed January 29, 2019b. https://www.pwc.co.uk/services/sustainability-climate-change/insights/low-carbon-economy-index.html.
Rabi, Uzi, and Chelsi Mueller. 2018. “The Geopolitics of Sectarianism in the Persian Gulf.” Asian Journal of Middle Eastern and Islamic Studies 12 (1): 46–65. https://doi.org/10.1080/25765949.2018.1436129.
Ramchand, Latha, and Ramanan Krishnamoorti. 2017. “What Harvey Taught Us: Lessons From The Energy Industry.” Forbes, November 22, 2017. https://www.forbes.com/sites/uhenergy/2017/11/22/what-harvey-taught-us-lessons-from-the-energy-industry/.
RankingTheWorld. 2019. Top 10 Most Valuable Companies In The World (1997-2019). https://www.youtube.com/watch?v=8WVoJ6JNLO8.
Rexaline, Shanthi. 2018. “Trading Hurricane Florence: Investors Make Storm Stock Picks,” September 11, 2018. https://finance.yahoo.com/news/trading-hurricane-florence-investors-storm-190245552.html.
Sabin Center for Climate Change Law at Columbia Law School, and Arnold & Porter. 2019a. “In Re Greenpeace Southeast Asia and Others.” Non-US Climate Change Litigation. 2019. http://climatecasechart.com/non-us-case/in-re-greenpeace-southeast-asia-et-al/.
———. 2019b. “Lliuya v. RWE AG.” Non-US Climate Change Litigation. 2019. http://climatecasechart.com/non-us-case/lliuya-v-rwe-ag/.
———. 2019c. “Ramirez v. Exxon Mobil Corp.” US Climate Change Litigation Database. 2019. http://climatecasechart.com/case/ramirez-v-exxon-mobil-corp/.
———. 2019d. “Climate Change Litigation Databases - Sabin Center for Climate Change Law.” Climate Change Litigation. February 6, 2019. http://climatecasechart.com/.
Saleh, Tawfik Abdo. 2018. Nanotechnology in Oil and Gas Industries. Principles and Applications. Springer International Publishing.
Samuel Fankhauser. 2012. “A Practitioner’s Guide to a Low-Carbon Economy: Lessons from the UK.” Policy paper. Centre for Climate Change Economics and Policy; Grantham Research Institute on Climate Change and the Environment. http://www.lse.ac.uk/
GranthamInstitute/wp-content/uploads/2014/03/PP_low-carbon-economy-UK.pdf.
Sanchez, Juan I., William P. Korbin, and Diana M. Viscarra. 1995. “Corporate Support in the Aftermath of a Natural Disaster: Effects on Employee Strains.” The Academy of Management Journal 38 (2): 504–21. https://doi.org/10.2307/256690.
Segal, David. 1988. “The Iran-Iraq War: A Military Analysis.” Foreign Affairs 66 (5): 946–63. https://doi.org/10.2307/20043572.
Sharp, Jeremy M. 2018. “Yemen: Civil War and Regional Intervention,” August, 26.
Sick, Gary. 1989. “Trial by Error: Reflections on the Iran-Iraq War.” Middle East Journal 43 (2): 230–45.
Simlinger, Florentina, and Benoit Mayer. 2019. “Legal Responses to Climate Change Induced Loss and Damage.” In Loss and Damage from Climate Change: Concepts, Methods and Policy Options, edited by Reinhard Mechler, Laurens M. Bouwer, Thomas Schinko, Swenja Surminski, and JoAnne Linnerooth-Bayer, 179–203. Climate Risk Management, Policy and Governance. Cham: Springer International Publishing. https://doi.org/10.1007/978-3-319-72026-5_7.
Sky. 2015. “Rebalancing the Middle East | YaleGlobal Online.” April 23, 2015. https://yaleglobal.yale.edu/content/rebalancing-middle-east.
S&P Global & MSCI. 2018. “Global Industry Classification Standard.” S&P Global & MSCI. https://www.spglobal.com/marketintelligence/en/documents/112727-gics-mapbook_2018_v3_letter_digitalspreads.pdf.
Symantec. 2018. “Shamoon: Destructive Threat Re-Emerges with New Sting in Its Tail.” December 14, 2018. https://www.symantec.com/blogs/threat-intelligence/shamoon-destructive-threat-re-emerges-new-sting-its-tail.
Thorne, Devin, and Ben Spevack. 2017. “Harbored+Ambitions.Pdf.” 2017. https://static1.squarespace.com/static/566ef8b4d8af107232d5358a/t/5ad5e20ef950b777a94b55c3/1523966489456/Harbored+Ambitions.pdf.
50Scenario Applications: Cambridge Centre for Risk Studies Stress Testing Companies in the Energy Value Chain
Twin, A. 2019. “6 Factors That Influence Exchange Rates.” May 20, 2019. https://www.investopedia.com/trading/factors-influence-exchange-rates/,.
UNFCCC. n.d. “The Paris Agreement.” United Nations. Accessed January 29, 2019. https://unfccc.int/process-and-meetings/the-paris-agreement/the-paris-agreement.
United Nations Environment Programme. 2017. The Status of Climate Change Litigation : A Global Review. https://doi.org/DEL/2110/NA.
US Navy Task Force for Climate Change. 2014. “US Navy Arctic Roadmap 2014-2030.”
Vivoda, Vlado. 2010. “International Oil Companies, US Government and Energy Security Policy: An Interest-Based Analysis.” International Journal of Global Energy Issues 33 (1/2): 73. https://doi.org/10.1504/IJGEI.2010.033016.
Wit, Elisa de, and Amy Quinton. 2018. “Climate Change Litigation: Is Your Business Prepared?” August 27, 2018. http://www.nortonrosefulbright.com/knowledge/publications/169607/climate-change-litigation-is-your-business-prepared.
Wittes, Tamara Cofman. 2016. “Want to Stabilize the Middle East? Start with Governance.” Brookings (blog). November 22, 2016. https://www.brookings.edu/blog/markaz/2016/11/22/want-to-stabilize-the-middle-east-start-with-governance/.
World Bank. 2019. “Commodity Commodity Price Data - Annual Crude Oil Prices.” Text/HTML. World Bank. August 2019. https://www.worldbank.org/en/research/commodity-markets.
World Economic Forum. 2019. “The Global Risks Report 2019 - 14th Edition.” http://www3.weforum.org/docs/WEF_Global_Risks_Report_2019.pdf.
Wright, Thomas. 2018. “The Return to Great-Power Rivalry Was Inevitable.” Brookings (blog). September 12, 2018. https://www.brookings.edu/opinions/the-return-to-great-power-rivalry-was-inevitable/.
Zetter, Kim. 2011. “How Digital Detectives Deciphered Stuxnet, the Most Menacing Malware in History.” Wired, July 11, 2011. https://www.wired.com/2011/07/how-digital-detectives-deciphered-stuxnet/.
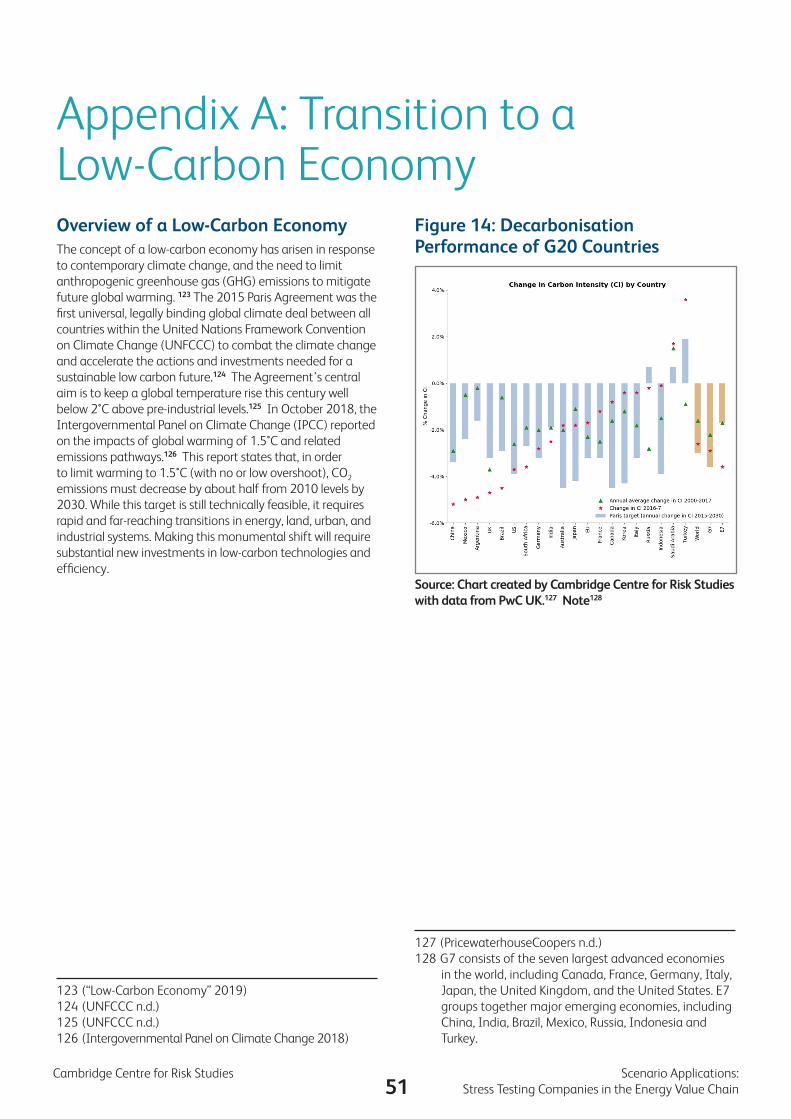
51Cambridge Centre for Risk Studies Scenario Applications:
Stress Testing Companies in the Energy Value Chain
Appendix A: Transition to a Low-Carbon EconomyOverview of a Low-Carbon EconomyThe concept of a low-carbon economy has arisen in response to contemporary climate change, and the need to limit anthropogenic greenhouse gas (GHG) emissions to mitigate future global warming. 123 The 2015 Paris Agreement was the first universal, legally binding global climate deal between all countries within the United Nations Framework Convention on Climate Change (UNFCCC) to combat the climate change and accelerate the actions and investments needed for a sustainable low carbon future.124 The Agreement’s central aim is to keep a global temperature rise this century well below 2°C above pre-industrial levels.125 In October 2018, the Intergovernmental Panel on Climate Change (IPCC) reported on the impacts of global warming of 1.5°C and related emissions pathways.126 This report states that, in order to limit warming to 1.5°C (with no or low overshoot), CO2 emissions must decrease by about half from 2010 levels by 2030. While this target is still technically feasible, it requires rapid and far-reaching transitions in energy, land, urban, and industrial systems. Making this monumental shift will require substantial new investments in low-carbon technologies and efficiency.
123 (“Low-Carbon Economy” 2019)124 (UNFCCC n.d.)125 (UNFCCC n.d.)126 (Intergovernmental Panel on Climate Change 2018)
Figure 14: Decarbonisation Performance of G20 Countries
Source: Chart created by Cambridge Centre for Risk Studies with data from PwC UK.127 Note128
127 (PricewaterhouseCoopers n.d.)128 G7 consists of the seven largest advanced economies
in the world, including Canada, France, Germany, Italy, Japan, the United Kingdom, and the United States. E7 groups together major emerging economies, including China, India, Brazil, Mexico, Russia, Indonesia and Turkey.
52Scenario Applications: Cambridge Centre for Risk Studies Stress Testing Companies in the Energy Value Chain
An important metric of GHG emissions is carbon intensity (CI), typically defined as the mass of carbon dioxide equivalents emitted per megajoule generated by fossil fuels. In recent years, China, Latin America and UK have led the decarbonisation move, outperforming their Nationally Determined Contribution (NDC) targets defined by the Paris Agreement. See Figure 14. From 2000 to 2017, global CI has declined by 1.6% per year on average - far below the 6.4% annual reduction required to limit warming to below 2°C. This is partly due to the resurgent consumption of coal, driven mostly by Turkey, Indonesia and India.129 Countries are resistant towards decarbonisation, concerned that a low-carbon transition cannot be accomplished without harming economic growth. Contrary to such beliefs, investments in emissions reduction, if managed properly, can generate significant economic returns in excess of a country’s cost of capital and create a pecuniary stimulus depending on the proportion of imported fuel in energy consumption.130 For instance, countries that are reliant on fossil fuel imports will likely attach high macroeconomic values to energy savings once fossil fuels are delisted, and they need not suffer early-mover disadvantage if they unilaterally choose to lower emissions.
Ingredients of a Low-Carbon EconomyEfficient transition to a low-carbon economy necessitates collaboration between the public and private sectors, to allow adequate regulation whilst incentivising businesses, especially those that are energy-intensive, to take carbon reduction measures. In the “well-to-wheels” lifecycle of transport fuels, 15-40% of GHG emissions come from upstream processes (producing, transporting and refining), where gas flaring (burning) is a major driver. This suggests stringent flaring reduction and minimal fugitive and venting emissions regulation on fuel producers by the public authorities. Meanwhile, enhanced capacity building often includes performance-oriented fuel quality standard programmes, which capitalise on “invisible hands” and promote fuel-agnostic policies that do not stipulate methods to reduce emissions as long as quality mandates are satisfied.131 This exemplifies an institutional framework that incentivises businesses to cut carbon consumption. Cooperation or partnership between the public and the private side can further go beyond regulatory or legal fields to improving financing and operating environments of clean energy projects. This may include tax breaks or duty waivers to unlock more private investment in low-carbon transition.132 All these means of managing and prioritising low-CI sources, whether through regulation or incentives, are based on transparent data sharing between the public and private sectors.
129 (PricewaterhouseCoopers n.d.)130 (Burchardt et al. 2018)131 (Masnadi et al. 2018)132 (Gujba et al. 2012)
New technologies will continue to drive a low-carbon transition, and their accessibility will increase as they become more affordable to the general public. Proven and expanding alternative energy sources include solar, wind, biomass, geothermal, hydro, and nuclear, of which solar energy has seen the greatest surge in global investment; solar represented 38% of total new generating capacity added (renewable, fossil fuel and nuclear) globally in 2016.133 While proven technologies alone can close at least 75% of the gap between current emissions trajectories and the Paris Agreement limits in many countries, additional measures such as synthetic fuels and carbon capture are required to fulfil the remaining 25%.134 Apart from power generation, technological innovation in various sectors of society is also driving decarbonisation. A gradual shift into electrified transport has profound implications on household consumption as well as business investment. Furthermore, blockchain opens up new pathways to address environmental challenges. The decentralized electronic ledger system, cryptographically secure and immutable, can unlock businesses’ capability to analyse their supply chains and thus optimise sustainable production and logistics. Applied to finance, the technology’s wide outreach and high verifiability facilitates decision making, from retail investment in green infrastructure to charitable donations to developing markets, allowing accessible finance to fund a low-carbon transition. Business outsiders including consumers, investors and regulators also benefit from better reporting and monitoring of internal information enabled by blockchain.135
Irrespective of enhancing existing capacity or sponsoring new technologies, households and businesses cannot afford such a scalable transition for public good without government assistance in funding. There is increased government spending in support of renewable energies. For instance, government investment accounted for almost half the solar panels installed in China in 2017.136 Development of Autonomous-Electric Vehicles (A-EVs) heavily relies on incentives to build charging stations. A low-carbon economy transition is estimated to require $90 trillion of infrastructure investment globally between 2016 and 2030, and so governments also need to incentivise the banking sector, which functions as the crux of financial intermediation and resource allocation, to join the race.137 The sway to cleaner energies in power generation, transport and construction implies waning support for energy-intensive industries such as oil and gas. Countries like China have been transforming their national income structure towards services and technology. Higher education institutions, including the University of Cambridge, face mounting pressure from academic staff and students to dump fossil fuel investments
133 (Jäger-Waldau 2017)134 (Burchardt et al. 2018)135 (PricewaterhouseCoopers 2018)136 (PricewaterhouseCoopers n.d.)137 (“Banking in the Low Carbon Economy” n.d.)
53Cambridge Centre for Risk Studies Scenario Applications:
Stress Testing Companies in the Energy Value Chain
in their endowment funds.138 Asset managers and oil and gas leaders are unsurprisingly concerned about such a sentiment shift which creates an increasingly uncertain future at the expense of current profit maximisation.
Risk of a Low-Carbon TransitionWhile a low-carbon transition is widely seen as an opportunity, it also generates a variety of inherent business risks. Still in an emerging state, transition risk can hardly be taxonomised into well-defined risk categories, but it is clear that the transition covers risk sources from regulatory force, technology, production and consumption. Regulatory pressure is increasing from the G20 Task Force on Climate-related Financial Disclosure (TCFD) that pushes companies to publicly disclose climate-related financial risks in their financial filings. This regulation extends to all companies with listed securities in the G20 countries, including pension plans and asset managers.139 The UK government passed a plan in 2017 to put an end to unabated coal power generation by 2025.140 From a business perspective, failure to react to new regulations poses the risk of heavy fines, reputation damage or even existential threat to affected companies.
Businesses also worry about failure to keep up with development in technology and its applications. At a micro level, competition propels every market player to race in technological advancement and invest in research and development (R&D). A vicious cycle exists once a business fails in any step. For example, the rising trend of electric vehicles and battery design, combined with declining costs of renewable energies, requires businesses to offer greener products at competitive prices. If R&D money is spent but product launch turns out a failure, companies will not recover its costs, let alone be compensated by revenues, which triggers reduced subsequent investments in R&D that is essential for technological improvement in the first place.
In production function, businesses face risks in both capital and labour, especially those in the energy sector. The concept of stranded fossil fuel assets (SFFA) comes under focus not only because high-CI assets can be forcibly abandoned as climate policy limits production below potential capacity, but also due to the natural progression of renewable technology which renders them unnecessary. Equity markets are suspected not to have taken SFFA into pricing, generating a possible “carbon bubble” since oil and gas stocks may be overvalued. Companies tend to be upset about potential consequences of SFFA, including ensuing financial reporting regulation, that might stipulate them to write down obsolete assets off their balance sheet in a lump sum. The global financial loss from SFFA could reach $12 trillion if commitments to current, controversial energy policies continue but are challenged by strict measures to achieve
138 (Mooney 2018)139 (PricewaterhouseCoopers n.d.)140 (Department for Business, Energy & Industrial Strategy
2018)
the Paris targets in the near future.141 This value excludes any disruptive impact on corporate assets from increasingly frequent and severe natural catastrophes, which will only exacerbate losses. In addition to loss of capital, a low-carbon transition brings about job destruction and creation. The transition in the UK is estimated to result in the loss of 28,000 jobs in carbon-intensive sectors, but add 46,000 green jobs to the north of England in the next 12 years, where 48% of the country’s renewable electricity was produced from 2005 to 2014.142 This will present a risk to businesses if there is lack of suitable talent to fill vacancies, or if workers are not retrained but left without the skills and qualifications required for new green jobs.
The prospects of the consumption market remain unpredictable. While fossil fuel prices are expected to decline in the long-term as demand is reduced, an interim peak in price – due to supply surplus by oligopoly power and carbon tax levied on fuel users – may translate into pressure on corporate income statements.143 The substitution of high-CI and expensive energies will take time to manifest as utilities are fundamental to and ingrained in various aspects of life. Uncertainty surrounding consumer acceptance and uptake of new technologies, such as in power generation, transport, and building, is also a risk for low-carbon businesses. Therefore, companies must adapt to evolving consumer behaviours in timely fashion.144 Failure to do so may have lasting implications in a rapidly changing low-carbon transition.
Executives in large oil and gas companies have valid reasons to believe that risks embedded in the low-carbon transition are critical. Shareholders and other stakeholders are waking up to the risks and opportunities presented by the transition to a low-carbon economy, which henceforth require better disclosure. The Climate Action 100+ is an investor-driven initiative enacted to ensure that the world’s 100 largest systemically important GHG emitting companies, and more than 60 others, engage in environmentally responsible practices that drive the transition.145 It is very likely that risk management concerning the low-carbon economy transition will top managers’ agendas in the coming years.
141 (Mercure et al. 2018)142 (Halliday 2018)143 (“Carbon Tax Center – Pricing Carbon Efficiently and
Equitably” n.d.)144 (Samuel Fankhauser 2012)145 (“Climate Action 100+” n.d.)
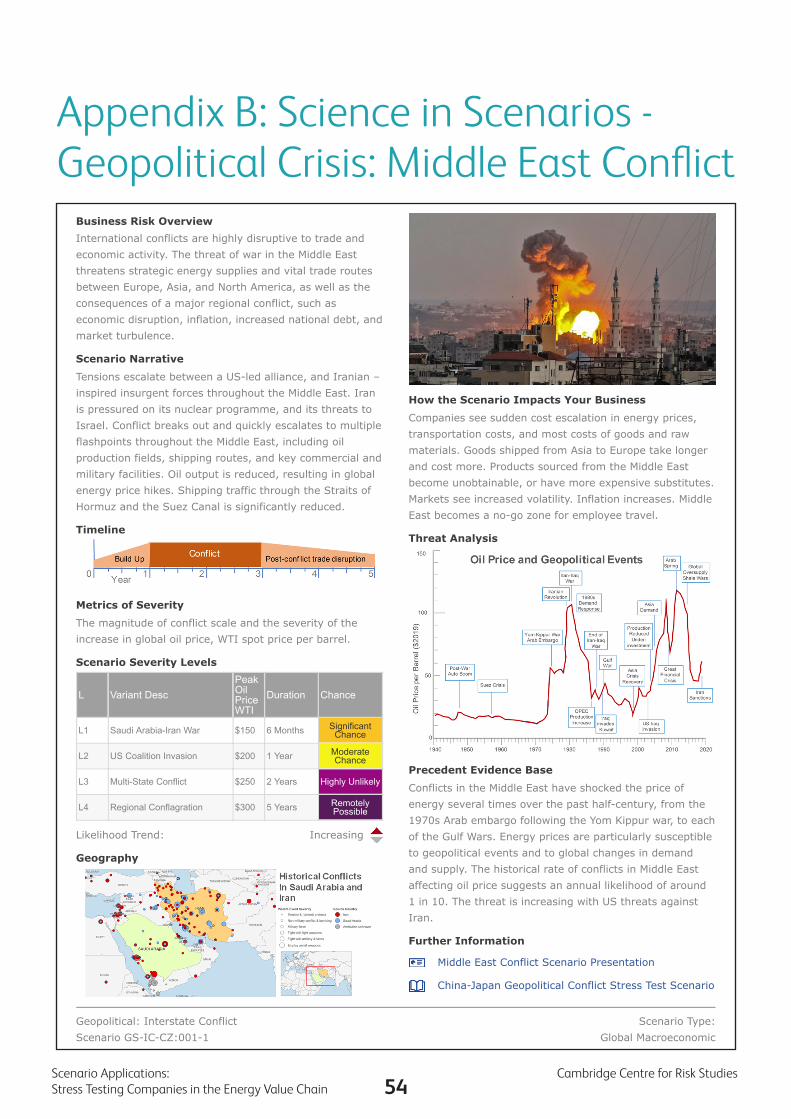
54Scenario Applications: Cambridge Centre for Risk Studies Stress Testing Companies in the Energy Value Chain
Appendix B: Science in Scenarios - Geopolitical Crisis: Middle East Conflict
Science in Scenarios™
Geopolitical Crisis: Middle East Conflict
Likelihood Trend: Increasing
Business Risk OverviewInternational conflicts are highly disruptive to trade andeconomic activity. The threat of war in the Middle Eastthreatens strategic energy supplies and vital trade routesbetween Europe, Asia, and North America, as well as theconsequences of a major regional conflict, such aseconomic disruption, inflation, increased national debt, andmarket turbulence.
Scenario Narrative
Tensions escalate between a US-led alliance, and Iranian –inspired insurgent forces throughout the Middle East. Iranis pressured on its nuclear programme, and its threats toIsrael. Conflict breaks out and quickly escalates to multipleflashpoints throughout the Middle East, including oilproduction fields, shipping routes, and key commercial andmilitary facilities. Oil output is reduced, resulting in globalenergy price hikes. Shipping traffic through the Straits ofHormuz and the Suez Canal is significantly reduced.
Timeline
Metrics of Severity
The magnitude of conflict scale and the severity of theincrease in global oil price, WTI spot price per barrel.
Scenario Severity Levels
Geography
Middle East Conflict Scenario Presentation
China-Japan Geopolitical Conflict Stress Test Scenario
How the Scenario Impacts Your Business
Companies see sudden cost escalation in energy prices,transportation costs, and most costs of goods and rawmaterials. Goods shipped from Asia to Europe take longerand cost more. Products sourced from the Middle Eastbecome unobtainable, or have more expensive substitutes.Markets see increased volatility. Inflation increases. MiddleEast becomes a no-go zone for employee travel.
Threat Analysis
Precedent Evidence Base
Conflicts in the Middle East have shocked the price ofenergy several times over the past half-century, from the1970s Arab embargo following the Yom Kippur war, to eachof the Gulf Wars. Energy prices are particularly susceptibleto geopolitical events and to global changes in demandand supply. The historical rate of conflicts in Middle Eastaffecting oil price suggests an annual likelihood of around1 in 10. The threat is increasing with US threats againstIran.
Further Information
L Variant DescPeakOilPriceWTI
Duration Chance
L1 Saudi Arabia-Iran War $150 6 Months SignificantChance
L2 US Coalition Invasion $200 1 Year ModerateChance
L3 Multi-State Conflict $250 2 Years Highly Unlikely
L4 Regional Conflagration $300 5 Years RemotelyPossible
Geopolitical: Interstate ConflictScenario GS-IC-CZ:001-1
Scenario Type:Global Macroeconomic

55Cambridge Centre for Risk Studies Scenario Applications:
Stress Testing Companies in the Energy Value Chain

Cambridge Centre for Risk Studies
Cambridge Judge Business School University of Cambridge Trumpington StreetCambridge CB2 1AG
T: +44 (0) 1223 768386F: +44 (0) 1223 [email protected]/faculty-research/centres/risk/publications/
Follow us on LinkedIn and Twitter @Risk_Cambridge
Institute of Risk Management 2nd Floor, Sackville House143 - 149 Fenchurch StreetLondon, EC3M 6BN
T: +44 (0)20 7709 9808F: +44 (0)20 7709 0716 W: www.theirm.org
Follow us: @IRMglobal