
Residual Flexural Capacity of Corroded Prestressed ... - MDPI
Upload
portsaid-universityCategory
view
0download
0
Journal of Constructional Steel Research 92 (2014) 90–102
Contents lists available at ScienceDirect
Journal of Constructional Steel Research
Strength assessment of a severely corroded box girder subjected tobending moment
S. Saad-Eldeen, Y. Garbatov, C. Guedes Soares ⁎Centre for Marine Technology and Engineering (CENTEC), Instituto Superior Técnico, Technical University of Lisbon, Av. Rovisco Pais, 1049-001 Lisboa, Portugal
⁎ Corresponding author. Tel.: +351 218 417607; fax: +E-mail address: [email protected] (C. Guedes Soa
0143-974X/$ – see front matter © 2013 Elsevier Ltd. All rhttp://dx.doi.org/10.1016/j.jcsr.2013.09.010
a b s t r a c t
a r t i c l e i n f oArticle history:Received 4 November 2012Accepted 15 September 2013Available online xxxx
Keywords:Ultimate strengthFinite elementBox girderCorrosionMechanical properties
This work deals with the evaluation of the ultimate bendingmoment of a severely corroded box girder subjectedto uniform vertical bending moment through a series of nonlinear finite element analysis. Two models ofcorrosion degradation have been adopted, one is an average general corrosion thickness reduction, and theother is the real thickness of the corroded plates. New stress–strain relations have been developed to accountfor the effect of corrosion on the flexural rigidity. To validate the new developed stress–strain relationships, acomparison between the finite element analysis results using the existing stress–strain models, the newlydeveloped ones and the experimental test results of a severely corroded box girder have been conducted. Thecomparison showed a good agreement and supported the choice of the newly developed stress–strainrelationships of corroded structures.
© 2013 Elsevier Ltd. All rights reserved.
1. Introduction
A ship hull girder is a structure built up of unstiffened, stiffenedplates, frames and other components subjected to complex loading.The ultimate hull girder strength is the maximum bending capacitythat a ship hull girder can sustain under longitudinal bending.
The linear elastic theory has been employed to predict thelongitudinal strength of the ship hull for years. According to this theory,the maximum bending moment that the hull cross-section canwithstand is equal to the bending moment corresponding to the firstyield, that is, the bending moment when the maximum stress on thehull cross-section reaches the yield stress of the material. In designpractise, an allowable stress is used instead of the yield stress, whichcorresponds to a safety factor against yielding.
However, in the last decades, it has been established that ship hullshave considerable additional strength beyond the first yield and thusthe ultimate strength is the appropriate criterion to determine theship hull strength and to be used in codified design as proposed byGuedes Soares et al. [1], which finished up being introduced in thedesign codes several years later [2,3].
To estimate the longitudinal strength of the ship hull several factorshave to be accounted for: (1) various possible failure modes includingbuckling, (2) progressive and interactive behaviour of the failure ofstructural members, (3) redistribution of stresses on the hull cross-section and (4) residual strength of structural members after bucklingand even after the collapse. By considering these factors, the maximumbendingmoment that thehull cross-section canwithstand is designated
351 218 474015.res).
ights reserved.
by the ultimate longitudinal strength, which represents the maximumload-carrying capacity of the ship hull under longitudinal bending.
The ultimate longitudinal strength assessment is a nonlinearproblem in which both the nonlinearity related to material behaviourand geometry are involved [4]. There are three main methods tocalculate the ultimate longitudinal strength of the ship hull. The firstone is the simplified method (SM), where the first attempt to assess aship's hull strength was made by Caldwell [5] who derived a formulafor calculating the ultimate longitudinal bending moment of the hullgirder in a sagging condition. This formula was derived from the stressdistribution along the cross-section corresponding to a fully plasticcollapse.
Later, the method was extended by Smith [6], who proposed asimplified method that is now commonly called the Smith's method.This method enables to perform progressive collapse analysis on thecross-section of a hull girder subjected to longitudinal bending. Thecross-section is divided into small elements composed of a stiffenerwith attached plating. At the beginning, the average stress–averagestrain relationships of individual elements are derived under the axialload considering the influences of yielding and buckling. Then, aprogressive collapse analysis is performed assuming that a planecross-section remains plane and each element behaves according toits average stress–average strain relationship.
Many other methods have been also proposed to simulate theprogressive collapse behaviour of the hull girder. Billingsley [7] usedan engineering approach, which considered a very simplified modelfor each individual beam column element. The strength of the hullgirder was obtained by the linear superposition of the individualcontributions of each element.
Dow et al. [8] developed an incremental curvature procedure, whichallows the derivation of a moment–curvature relationship for a
91S. Saad-Eldeen et al. / Journal of Constructional Steel Research 92 (2014) 90–102
complete hull. This procedure was correlated with experimental dataderived from the collapse tests of three box girders and ultimatelongitudinal strength test carried out on the destroyer ALBUERA,which was a riveted ship. Based on the flexural buckling formulations,Adamchak [9] developed an approximate method to obtain themoment–curvature relationship and to calculate the ultimate strengthof stiffened panels.
Yao and Nikolov [10] developed a progressive collapse methodtaking into account the flexural torsional behaviour of angle barstiffeners welded to continuous plating. A series of elasto-plastic largedeflection analysis have been done. A large-scale frigate model wasanalysed using the developed code.
Hughes [11] proposed a method for estimating the ultimatelongitudinal bending moment of the ship's hull, suggesting discretesteps from one element collapse to the next, instead of applying regularsmall increments of the curvature. In this method, the contribution ofthe post-collapse resistance of compressed panels was ignored tosimplify and speed up the calculations.
Gordo and Guedes Soares [12] have developed an approximatemethod of determining the load shortening curve of one stiffenedwith an associated plate, which became the building block of a methodto assess the ultimate strength of hull girders [13] in an approachinspired by Smith [6]. This method was validated against data from afull scale accident [14] where the loading conditions could be wellestablished.
Rahman and Chowdhury [15] developed a computing methodologyfor calculating the ultimate longitudinal bending moment at any crosssection of a ship or a box girder. The cross section was modelled asone stiffener with its associate effective plating. The overall layout ofthe algorithm is similar to the one presented in [6], with differentpost-collapse behaviour definition of the compressed elements asdefined in [9], with somemodifications of the stress–strain relationshipfrom the elastic range to the post-collapse region. The programme wasvalidated by comparing the output with some experimental results of atested box girder and real very large crude carrier, showing a goodagreement.
The second method used to calculate the ultimate strength is thenonlinear finite element method (NFEM), the applications of thismethod to the collapse analysis of ship's hull are very few; the earlierattempt was done by Chen et al. [16] who take into account elasto-plastic properties of the material, nonlinear geometric behaviour ofthe elements and their buckling and post-buckling strength.
Valsgaard and Steen [17] used a nonlinear super element approachwithin the framework of a general nonlinear shell programme. A
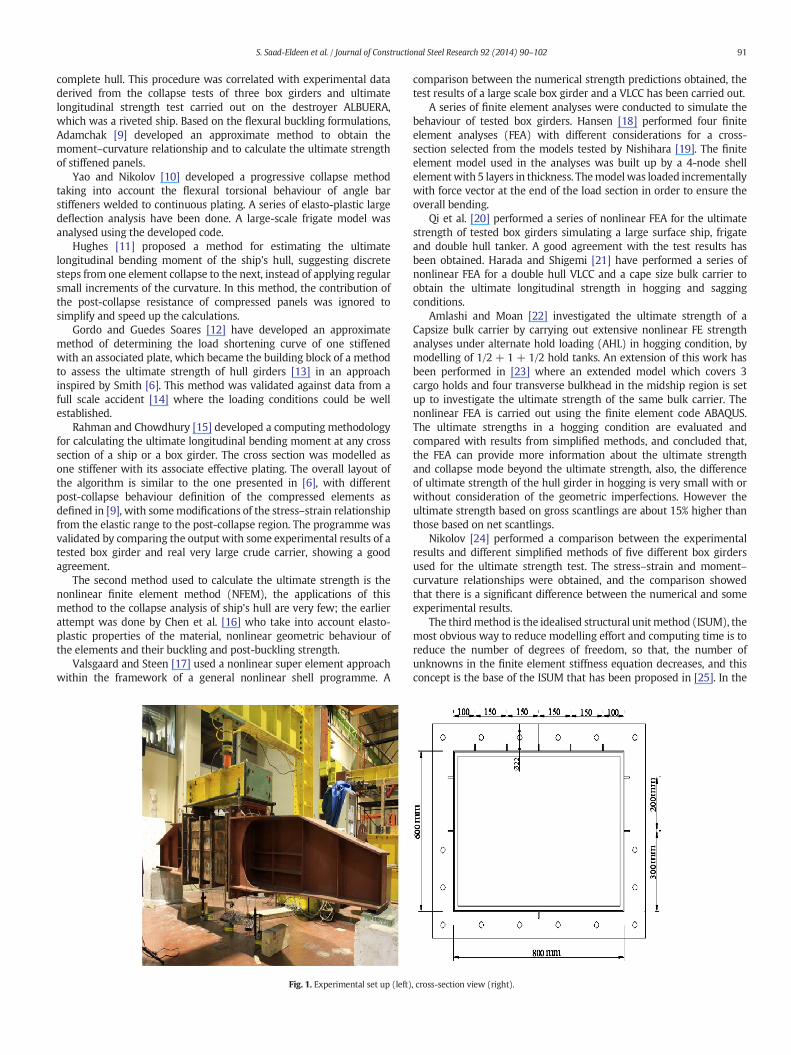
Fig. 1. Experimental set up (left)
comparison between the numerical strength predictions obtained, thetest results of a large scale box girder and a VLCC has been carried out.
A series of finite element analyses were conducted to simulate thebehaviour of tested box girders. Hansen [18] performed four finiteelement analyses (FEA) with different considerations for a cross-section selected from the models tested by Nishihara [19]. The finiteelement model used in the analyses was built up by a 4-node shellelementwith 5 layers in thickness. Themodelwas loaded incrementallywith force vector at the end of the load section in order to ensure theoverall bending.
Qi et al. [20] performed a series of nonlinear FEA for the ultimatestrength of tested box girders simulating a large surface ship, frigateand double hull tanker. A good agreement with the test results hasbeen obtained. Harada and Shigemi [21] have performed a series ofnonlinear FEA for a double hull VLCC and a cape size bulk carrier toobtain the ultimate longitudinal strength in hogging and saggingconditions.
Amlashi and Moan [22] investigated the ultimate strength of aCapsize bulk carrier by carrying out extensive nonlinear FE strengthanalyses under alternate hold loading (AHL) in hogging condition, bymodelling of 1/2 + 1+ 1/2 hold tanks. An extension of this work hasbeen performed in [23] where an extended model which covers 3cargo holds and four transverse bulkhead in the midship region is setup to investigate the ultimate strength of the same bulk carrier. Thenonlinear FEA is carried out using the finite element code ABAQUS.The ultimate strengths in a hogging condition are evaluated andcompared with results from simplified methods, and concluded that,the FEA can provide more information about the ultimate strengthand collapse mode beyond the ultimate strength, also, the differenceof ultimate strength of the hull girder in hogging is very small with orwithout consideration of the geometric imperfections. However theultimate strength based on gross scantlings are about 15% higher thanthose based on net scantlings.
Nikolov [24] performed a comparison between the experimentalresults and different simplified methods of five different box girdersused for the ultimate strength test. The stress–strain and moment–curvature relationships were obtained, and the comparison showedthat there is a significant difference between the numerical and someexperimental results.
The thirdmethod is the idealised structural unit method (ISUM), themost obvious way to reduce modelling effort and computing time is toreduce the number of degrees of freedom, so that, the number ofunknowns in the finite element stiffness equation decreases, and thisconcept is the base of the ISUM that has been proposed in [25]. In the
, cross-section view (right).

Table 1Principal characteristics of severe corroded box girder.
Item Dimensions Units
Deck plating 1.88 mmPort side plating 2.51 mmStarboard side plating 2.87 mmBottom plating 1.80 mmStiffeners 22 × 2.95 mmWeb frames 50 × 50 × 4.79 mmBrackets 80 × 100 × 2.26 mm
92 S. Saad-Eldeen et al. / Journal of Constructional Steel Research 92 (2014) 90–102
ISUM, a structural component such as a stiffened plate bounded bylongitudinal girders and transverse frames is modelled by one elementwith only a few nodal points. Ueda and Rashed [25] developed a plateand stiffened plate element which accurately simulate buckling/plasticcollapse behaviour under combined bi-axial compression/tension andshear loads.
With the existing standard ISUM elements, the main difficulty is thecomputation of the post-collapse behaviour in the structural elementsbeyond their ultimate strength aswell as the flexural–torsional collapsebehaviour of stiffeners is not very successful. Therefore, some researchworks have been carried out by many authors for example, Ueda andRashed [26], Bai et al. [27], Paik [28], Masaoka et al. [29] and Fujikuboet al. [30], to develop the method and to implement new elements tocover the nonlinearities and the post-collapse behaviour. In addition,the empirical equations regressed from the results of theoreticalcalculation or derived theoretically under certain assumptions are alsoof significance in practical application.
All of thementionedmethods were dealing with intact structures. Astep forward is the study of the ultimate strength of corroded boxgirders performed by Saad-Eldeen et al. [31], who carried out a test ofan initially corroded multispan stiffened box girder representing amidship section of a ship hull. The box girder was subjected to four-point loading resulting in a uniform bending moment along thespecimen and the ultimate bending moment of the tested box girderhas been compared with empirical formulae showing a good agree-ment. A continuation of the previous study is the one presented in[32] where a box girder made of mild steel subjected to moderatecorrosion was tested.
Another box girder test was analysed in [33] where a severelycorroded box girder was also tested under the same conditions. It
Fig. 2.Measured thickness of deck platin
was concluded that the load carrying capacity and ultimate bendingmoment is highly affected by the corrosion deterioration of the platingand the material property changes. Saad-Eldeen et al. [34] investigatedthe effect of corrosion degradation on the ultimate strength of thesteel box girders, dissipated energy, resilience, ductility, and elasticlimit. A significant reduction in the stiffness, stress–strain relationshipand the elastic modulus were observed. It was concluded that inaddition to the thickness reduction, corrosion has an additional in-fluence on changing the mechanical properties of steel.
A series of nonlinear FEA of an intact box girder have been performedin [35]. The main objective was to define the most appropriate para-meters description for the developed finite element model by varyingboth the initial imperfection (shape and amplitude) and mesh sizethat is one of the most important governing parameters affecting theultimate strength and post-collapse behaviour. The results achieved bythe developed finite element model demonstrated a good agreementwith the experimentally defined three-linear trend of the moment–curvature relationship of the intact box girder.
Saad-Eldeen et al. [36] analysed the ultimate strength of a slightlycorroded box girder subjected to four-point loading using the nonlinearfinite elementmethod. A series of nonlinear collapse analyses have beenperformed and the ultimate strength has been analysed using differentmaterial models and also different weld toe shapes. An elasto-plasticmodified material model has been developed to account for a residualstress effect.
The post-buckling behaviour demonstrated a very good agreementwith the experimental results. Comparisons between numerical andexperimental results have been performed for the slightly corrodedbox showing a very good agreement.
The study presented here deals with the nonlinear finite elementanalysis of corroded steel box girders, where the analysed box here issubjected to severe corrosion and a different slope of the moment–curvature relationship has been observed from the experimental resultsas given in [33,34].
2. Hull girder strength assessment
The hull girder ultimate strength is defined as the maximumbending capacity of the hull girder beyond which the hull will collapse.Hull girder failure is controlled by the ultimate strength of structuralelements accounting for buckling and yielding.
The principal parameters governing the structural design of aship's hull subjected to compressive loading and influencing the
g (left) and bottom plating (right).

Fig. 4. Stress–strain relationship, initially and severely corroded boxes, [34].Fig. 3. Progressive collapse.
93S. Saad-Eldeen et al. / Journal of Constructional Steel Research 92 (2014) 90–102
compressive strength are the plate and column slenderness, inaddition to the material yield strength and the Young modulus,defined as:
Plate slenderness;β ¼ btp
ffiffiffiffiffiffiσy
E
rð1Þ
Column slenderness;λ ¼ ar
ffiffiffiffiffiffiσy
E
rð2Þ
where tp is the plate thickness, b is the plate width betweenstiffeners, a is the stiffener span between frames, I is the momentof inertia, A is the cross-sectional area of the stiffener including theassociated plate and r is the radii of gyration of the cross-sectionarea of the stiffener with the associated plate calculated as:
r ¼ffiffiffiIA
r: ð3Þ
2.1. Box girder configurations
The box girder, analysed here, consists of three bays. The deck panelis stiffened with five longitudinal flat bars with a spacing of 150 mm.The side panel is stiffened with two stiffeners at a distance of 300 and500 mm, respectively and the bottom panel is stiffened with onestiffener in the middle, as may be seen in Fig. 1.
The principal characteristics of the analysed box girder are given inTable 1. A thickness measurement survey has been performed to findout the remaining thicknesses of the box girder structural elements,the measured remaining thicknesses of the box girder deck and bottompanels are plotted as shown in Fig. 2. Amore detailed information aboutthe severely corroded box girder are reported in [33]. The plate andcolumn slenderness are estimated as 2.69 and 0.81 respectively. Theratio of the stiffener height to the thickness is 8.32. It has been reportedin [33] that the corrosion degradation for the box girder structuralelements, which the original thicknesses were 4.5 mm and the averagemeasured residual thickness after corrosion degradation was 2.05 mmwhich is classified as severe due to the fact that more than 55% of the
Table 2Reduction of inertia moment and bending moments.
Box I, m4 BMpl·kNm BMu·kNm
Initial corr. 0.00091 212.71 568.942Severe corr. 0.00046 59.51 201.006Reduction % 49.42% 72.02% 64.67%
plating thickness was reduced due to corrosion. When relating thiscorrosion loss to the corrosion model of Guedes Soares and Garbatov[37], which was validated with full scale data [38,39], the thicknessmeasurements of the severely corroded box girder represents the23rd year service life without accounting for the coating life.
It has to be pointed out that the box girder is a thin-walled structureand due to corrosion, the structural elements become much thinner,therefore, there is no significant effect of residual stresses as has beenalso concluded by Ueda et al. [40] where, welding residual stressesreduce the buckling strength, but has a small effect on the ultimatestrength when the plate is thin. On the other hand, when the plate isthick, welding residual stresses reduce the ultimate strength signif-icantly. Also Paik and Sohn [41] concluded that the effect of residualstresses tends to be more significant for thicker plates. This impliesthat welding residual stresses most likely contribute to the expansionof plasticity in addition to geometrical nonlinearity due to buckling.
The box girder has been mounted between two stiff supportingarms, using bolt connections as shown in Fig. 1. The box girder wassubjected to four-point vertical bending moment. The bottom part issubjected to tension and the upper part, deck, is under compression.The bending moment is kept constant along the box girder, betweenbolt connections.
The test of ultimate strength is conducted in two loading cycles.During the second loading cycle, which is the final one, the box girderis subjected to the maximum load to which it can withstand. Throughthe final load step, the box girder folds up in a progressive collapsedefined with a great discharge of load and a large deformation due tothe formation of plastic hinges in both plating and stiffeners at thedeck and at the deck/side connection as presented in Fig. 3.
3. Finite element modelling
Numerical analyses of the ultimate strength, for the severelycorroded box girder, are performed based on general nonlinear finiteelement commercial code— ANSYS. The finite element analysis utilisesthe full Newton–Raphson equilibrium iteration scheme. The largedeformation option is activated to solve the geometric and materialnonlinearities and to pass through the extreme points. The automatictime stepping features are employed allowing the programme todetermine appropriate load steps.
Table 3Reduction of the tangent modulus.
Box Tangent modulus, MPa
Initial corr. 206E+ 03Severe corr. 94.16E + 03Reduction % 54.29%

(a) Elastic-plastic, (EP) (b) Elasto-plastic modified, (EPM)
(c) Elasto-plastic modified 1, (EPM1) (d) Elasto-plastic modified2, (EPM2)
Fig. 5. Stress–strain models.
Table 4Stress–strain parameters.
Item Value Units
σy 235 MPaET0 206E + 03 MPaETC0 94.16E + 03 MPaσpl,1 50.09 MPakTC1 0.5 –
kpl,2 0.173 –
94 S. Saad-Eldeen et al. / Journal of Constructional Steel Research 92 (2014) 90–102
The geometry of the box-girder structure is modelled in the sameway as the real one used during the ultimate strength test withoutany simplifications, see Fig. 1 (left) and Fig. 6. Shell elements are usedto generate the entire FE model. The shell element, SHELL 93 is definedby eight nodes, four nodal thicknesses, with six degrees of freedom ateach node: translations in the nodal x, y, and z directions and rotationsabout the nodal x, y, and z axes. The deformation shape functions arequadratic in both in-plane directions. The element has plasticity, stressstiffening, large deflection, and large strain capabilities.
3.1. Material definition
The material used to build up the model is shipbuilding low carbonsteel with yield stress, σy of 235MPa, the Young's modulus, E of206 GPa and the Poisson's ratio, υ of 0.3.
Before performing the ultimate strength test, the box girder wassubjected to severe corrosion in a corrosion test, reported in [33]. As aresult of the severe corrosion wastage, the moment of inertia of thebox girder was reduced by 49.4% with respect to the initially corrodedbox girder, before being tested in [31].
As reported in [34], if the corrosion wastage only affects thegeometrical characteristics of box girder (thickness, net sectional areaand moment of inertia), then the reduction in the bending moment inthe linear sector of the bendingmoment–curvature relationship shouldbe proportional to the reduction in the moment of inertia, when the
Young modulus is kept constant. However, the difference between thereduction in the moment of inertia, I and the bending moment up totheproportional limit, BMpl is about 22.6%, as given in Table 2. Therefore,it may be concluded that, in addition to the thickness reduction,corrosion has an additional effect on changing the mechanical prop-erties of the material. As may be observed from Fig. 4, the slope of thelinear stress–strain relationship, which is defined as the first tangentmodulus is different for the box girder without corrosion and for theone subjected to real sea water severe corrosion.
By fitting the stress–strain relationship, up to the first yield for theseverely corroded box using a linear regression, it can be observedthat there is a significant reduction of 54.3% in the apparent tangent(elastic) modulus (Fig. 4 and Table 3), which demonstrates that, withincreasing the severity of corrosion, themechanical properties changed.

1
X
Y
Z
Severely corroded box girder
JUL 8 201117:42:18
ELEMENTS
U
Fig. 6. Finite element model (left) and gradient of ultimate bending moment vs. element size (right).
95S. Saad-Eldeen et al. / Journal of Constructional Steel Research 92 (2014) 90–102
This observation also coincides with the direct tension tests oncorroded steel wires after 60, 90 and 180 days of exposure to theaggressive corrosion environment that have been carried out by Vuet al. [42], where a significant reduction of 25% in the apparent elasticmodulus of steel wire was observed as a result of the corrosiondegradation. In addition, a reduction in the elastic limit and the ultimatestrength of corroded stressed wire was observed. Also, Revathy et al.[43] indicated that the slope of the stress–strain curve for concretecolumns decreased with increasing the degree of the corrosion damagelevel.
The changes in mechanical properties, due to the effect of corrosiondegradation, lead to a modified stress–strain relationship, which isapplicable for severely corroded structures. To analyse this effect fourstress–stainmodels are used in the FEA to analyse the ultimate strengthand the post-collapse behaviour of the box girder modelled withaverage and real corrosion thickness reductions.
The elastic-perfectly plastic (EP) stress–strainmodel, shown in Fig. 5(a), is defined in the way that at stresses below the yield stress, σy thematerial behaviour is linear with a tangent modulus, ET0 = σy/εy of206 GPa. At the level of the yield stress, the material flows plasticallywithout strain hardening. When the material is unloaded, by reducing
Fig. 7. Histogram of initial imperfection amplitud
the stress below the yield stress, it behaves elastically in a mannerunaffected by the plastic flow; the parameters that define the EPmodel are given in Table 4.
The elasto-plastic modified (EPM) stress–strain model, as shown inFig. 5 (b), is a modification of the idealised elastic–plastic model byreplacing the intact first tangent modulus by the one, which accountsfor the corrosion effect as ETC0 = σy/εy. The first tangent modulusaccounting for the effect of corrosion ETC0 is experimentally definedfor the severely corroded box girder as 94.16 GPa (see Fig. 4 andTable 3). The parameters that define the EPMmodel are given in Table 4.
The elasto-plastic modified 1 (EPM1) stress–strain model in Fig. 5(c), is amodification of the elasto-plasticmodifiedmodel by introducinga second tangent modulus, ETC1 starting from the point up to which thestress and strain are linearly proportional, σPl,1.
The second tangent modulus is calculated as ETC1 = ETC0/(1 + kTC1),where kTC1 is a coefficient, which accounts for the effect of the existingresidual stresses in the box girder. The finite element model does notaccount explicitly the residual stresses. The parameters defining theEPM1 model are given in Table 4.
The elasto-plastic modified 2 (EPM2) stress–strain model, in Fig. 5(d), is a modification of the elasto-plastic modified 1 model by
es (left), initial imperfection shape (right).

Fig. 8. Moment–curvature relationship, average corrosion.
96 S. Saad-Eldeen et al. / Journal of Constructional Steel Research 92 (2014) 90–102
introducing a tangentmodulus, ETpl,2 related to the second proportionallimit,σPl,2, which corresponds to the contribution of the stiffeners in theload carrying capacity. Due to the corrosion degradation of the platingand stiffeners, the second proportional limit is extended to twice ofthe first proportional limit with a tangent modulus of ETpl,2 = ETC0/(1 + kTpl,2) where kTpl,2 is a coefficient accounting for the contributionof the stiffeners in the buckling region. The parameters defining theEPM2 model are given in Table 4.
3.2. Loading and boundary conditions
The box girder is subjected to vertical loading, producing a constantpure vertical bending moment along the box-girder length. The load isgenerated by imposing a vertical displacement acting on the twoheavy plates that are located outside of the analysed box-girder on thesupporting arm connection (see Fig. 6, left). The displacement load isapplied by small increments to ensure that the analysis would closelyfollow the structural load-response curve. Both ends are simplysupported, constrained from translations in the vertical and transversedirection. The translation in the longitudinal direction is only constrainedat one end. No rotation is prevented.
3.3. Coarse mesh size
In order to obtain precise results and to find out an appropriateelement size to be used for the finite element model a systematic finiteelement analyses have been carried out in [35] for an intact box girderhaving the same configurations of the analysed one here. It has been
Table 5Ultimate bending moment, average corrosion.
Criteria
Local Global Combineda
BMu, kNm BMu, % r
EXP 201.01 – – –
EP 275.11 36.87% 2.202 0.215EPM 210.63 4.79% 1.124 0.914EPM1 195.90 −2.54% 0.943 0.959EPM2 199.03 −0.98% 0.989 0.990
a =0.5(1− |BMu%|) + 0.5(1− |(1− r)|).
concluded that the appropriate finite element size is 5 cm as may beseen from Fig. 6 (right). It can be also observed from Fig. 6 (right) thatthere is an inflection point at the level of the element size of 5 cm,which refers to the change in the gradient of the ultimate bendingmoment behaviour.
3.4. Initial imperfections
The plate initial imperfection is modelled based on real initialimperfection measurements as reported in [44] and presented in Fig. 7as:
wi;SC ¼ wio;SC sinπza
� �ð4Þ
wherewi,SC is themean value of the amplitude of the imperfections. Themean value and standard deviation for the measured imperfections are3.919 and 2.008 mm, respectively, as can be seen in Fig. 7 (left). Theseimperfections have been generated in the finite element model bychanging the vertical position of element nodes without inducing anyadditional stresses.
4. Finite element results
Two groups of nonlinear FE analyses have been conducted. The firstone deals with the corrosion degradation, which is modelled as anaverage thickness loss and the second one, uses the real thicknessmeasurements at the nodal location of the finite element model. Amore detailed information about the corrosion measurements isreported in [33].
4.1. Effect of average corrosion
The box girder element surfaces have been modelled using theaverage corrosion thickness as given in Table 1.
Four different stress–strainmodels are given in Fig. 5 have been usedto analyse the behaviour of the severely corroded box girder subjectedto a vertical bending moment.
A criterion for selecting the best stress–strain model has beendeveloped based on two considerations; the achieved ultimate bendingmoment and the similarity in the stress–strain curve relationshipdefined by the r approach, which represent the judgement of the

Fig. 9. Moment–curvature relationship, real corrosion.
97S. Saad-Eldeen et al. / Journal of Constructional Steel Research 92 (2014) 90–102
adequacy of the FE results (moment–curvature relationship) to theexperimental results as:
Combined criteria ¼ 0:5 1− BMu%j jð Þ þ 0:5 1− 1−rð Þj jð Þ ð5Þ
where BMu is the ultimate bending moment.The moment–curvature relationship for each stress–strain model is
plotted in Fig. 8 (left). For the first model, which is the EP, it is noticedthat the overall behaviour of the box girder is far away from theexperimental results in terms of following the shape of the curve andfrom the point of view of the ultimate bending moment. Finite elementanalysis calculates a higher ultimate bending moment than the oneexperimentally achieved as can be seen in Fig. 8 (left) and Table 5,with 36.87%.
Following the combined criteria (see Eq. (5) and Table 5), whichresult in 0.215, demonstrate that the use of the EP model, with thefirst tangent modulus of 206 GPa, gives a very poor agreement withthe experimental results of the severely corroded box girder.
Based on the experimental results, the effect of corrosion degrada-tion has been accounted for by modifying the EP model including anew first tangent modulus. With the use of the modified model, EPMthe resultant moment–curvature relationship is plotted in Fig. 8 (left).As can be observed from Fig. 8, the experimental results and FEAbased on the EPM model coincide very well in the linear sector, whichreflects the effect of corrosion not only in the thickness reduction as inthe EP model but also on the changed mechanical properties of thematerial.
As given in Table 5, the EPM registers a bending moment slightlybigger than the experimental achieved one by 4.8%. The similarity of
Table 6Ultimate bending moment with real corrosion thickness.
Criteria
Local Global Combined
Models BMu, kNm BMu, % r
EXP 201.01 – – –
EP 246.12 22.44% 2.027 0.374EPM 190.47 −5.24% 1.081 0.933EPM1 169.47 −15.69% 0.875 0.859EPM2 170.76 −15.05% 0.925 0.887
the bending moment curvature relation based on r is about 1.12which means that the FEA overestimated the experimental results, seeFig. 8 (right), but the combined criteria is quite good, 0.91.
From this point ahead, modifications have been performed in theEPMmodel to account for the contribution of the plating and stiffenerselements in the total behaviour of the severe corroded box and also forthe remaining residual stresses.
The first modified model, EPM1 accounts for the contribution of theplating, which is in the pre-buckling stage in which the plate's responseto the applied load follows theHooke's Law,where the load displacementrelationship is linear, which has been defined based on the experimentaldata, see Fig. 4. Therefore, the first proportional limit, σPl,1 as defined inFig. 5(c) equals to 50.09 MPa, and the factor, kTC1, which is adopted toaccount for stiffeners contribution and the residual stresses is 0.5 asgiven in Table 4.
FEA based on the EPM1 model is shown in Fig. 8 (right). It can beobserved that by defining the first proportional limit and the tangent ofthe buckling to collapse the region (stiffeners contribution and residualstresses), the bending moment curvature relationship behaviour be-comes closer to the experimental results with a difference of the ultimatebending moment of −2.54% and 0.943 and 0.959 for r and combinedcriteria, respectively, see Table 5. The second modified model, EPM2introduces another proportional limit,σPl,2, which accounts for thestiffeners contribution and is defined as being twice of σPl,1 with kTpl,2equal to 0.173 to define the tangent modulus,ETpl,2 in this region (seeTable 4).
The results of FEA based on the EPM2 model are shown in Fig. 8(right). It can be observed that by introducing the first and secondproportional limits and the tangent of the post-buckling to collapse theregion (residual stresses), the moment curvature behaviour of the boxgirder becomes almost the same as the experimentally defined one. Thedifference in the ultimate bending moment is about −0.98% and 0.989and 0.99 for r and the combined criteria respectively (see Table 5).
Based on the combined criteria used here for comparing differentFEA based on different stress–strain curve models it may be concludedthat the EPM2 model is the best model to fit the experimental results.
4.2. Effect of the real corrosion
The box girder finite element surfaces have beenmodelled using thereal corrosion measurements as shown in Fig. 2 and reported in [33].

1
MN
MX
X
Y
Z
SCB,Avg,EPM2,3.919 IMP,Real,50% CI
-.265E+09-.209E+09
-.154E+09-.983E+08
-.428E+08.128E+08
.684E+08.124E+09
.179E+09.235E+09
JUL 7 201120:56:56
NODAL SOLUTION
STEP=1SUB =5TIME=.5525SZ (AVG)RSYS=0DMX =.02793SMN =-.265E+09SMX =.235E+09
1
MN MX
X
Y
Z
SCB,Real Corr, EPM2,3.919 IMP
-.271E+09-.214E+09
-.158E+09-.102E+09
-.453E+08.110E+08
.674E+08.124E+09
.180E+09.236E+09
JUL 8 201112:28:57
NODAL SOLUTION
STEP=1SUB =6TIME=.470947SZ (AVG)RSYS=0DMX =.028561SMN =-.271E+09SMX =.236E+09
Fig. 10. Longitudinal stresses along the deck panel, average corrosion (left) and real corrosion (right).
98 S. Saad-Eldeen et al. / Journal of Constructional Steel Research 92 (2014) 90–102
The stress–strain models defined in Section 4.1 and shown in Fig. 5 areused to analyse the bending moment curvature behaviour of theseverely corroded box girder under the same conditions that are usedfor the analysis based on average corrosion thickness model.
The moment–curvature relationship for each stress strain model isplotted in Fig. 9 (left). For the EP model, the overall behaviour of thebox girder is far away from the experimentally achieved results interms of following the shape of the curve and the ultimate bendingmoment point. FEA registers a higher ultimate bending moment thanthe experimentally achieved one as can be seen in Fig. 9 (left) andTable 6, with 22.4%.
From the combined criteria, Table 6, the EP model demonstratesvery poor results compared to the experimental results of the severely
1
MN
MX
X
Y
Z
SCB,Avg,EPM2,3.919 IMP,Real,50% CI
-.103E+07.256E+08
.521E+08.787E+08
.105E+09.132E+09
.158E+09.185E+09
.212E+09.238E+09
JUL 8 201116:34:54
NODAL SOLUTION
STEP=1SUB =5TIME=.5525S1 (AVG)DMX =.02793SMN =-.103E+07SMX =.238E+09
Fig. 11. 1st principal stresses at the middle bay, ave
corroded box girder, 0.37. However, the difference between the ultimatebendingmoment based on average and real corrosion thickness is 14.4%.
With the application of the modified model, EPM the resultantmoment–curvature relationship is plotted in Fig. 9 (left). As may beseen the FEA based on EPM model coincides very well with theexperimental results in the linear sector, which reflects the effect ofcorrosion not only in the thickness reduction as in the EP model butalso on the mechanical properties of the material.
As given in Table 6, the EPM registers a bending moment less thanthe experimental one with about −5.2% and also r is about 1.1 (seeFig. 9, right), but the combined criteria is quite good, 0.93.
For the model EPM1, r is about 0.875, see Fig. 9 (right) and theultimate bending moment is lower than the experimental with −
1
MN
MX
X
Y
Z
SCB,Real Corr, EPM2,3.919 IMP
-373024.257E+08
.519E+08.780E+08
.104E+09.130E+09
.156E+09.182E+09
.209E+09.235E+09
JUL 8 201116:47:17
NODAL SOLUTION
STEP=1SUB =6TIME=.470947S1 (AVG)DMX =.028561SMN =-373024SMX =.235E+09
rage corrosion. (left) and real corrosion (right).

Fig. 12. Deck panel stiffeners fracture, severely corroded box.
99S. Saad-Eldeen et al. / Journal of Constructional Steel Research 92 (2014) 90–102
15.7%. If the ultimate bending moment calculated based on the EPM1and using the average corrosion thickness is compared with the oneusing real corrosion the difference is about 13.2% which in fact gives aclear understanding about the big difference in the modelling method-ology of the corrosion degradation.
The last part of the real corrosion group analysis is the application ofthe EPM2. The calculated moment–curvature relationship is plotted inFig. 9 (right) in which the behaviour of the box girder is much betterthan the one based on the EPM1 model, where r is 0.925. As given inTable 6, there is a small difference between the two models in theultimate bending moment about 0.64%.
From the analysis performed it may be concluded that the EPM andEPM2models are themost suitable ones to perform the ultimate strengthanalysis of severely corroded structures based on real corrosion thickness.
4.3. Stress analysis
From the ultimate strength analysis of the two corrosion modellingconcepts, average and real corrosion thickness, it is concluded that the
Fig. 13.Moment–curvature relat
EPM2 model is the best option and the stress analysis presented inthis section will only consider for the EPM2 model.
As may be seen in Fig. 10 (left), the first observation is that thelongitudinal stress distribution in the first and third bays is similar inthe case of the average corrosion thickness along the deck panel, onthe contrary for the same bays with real corrosion thickness the stressdistribution is different and this is much more clear near the deck-sideconnection, see Fig. 10 (right).
For a more detailed understanding of the effect of the average andreal corrosion thickness on the stress distribution, the 1st principalstresses at the middle bay, at the point of achieving the ultimatebending moment are plotted in Fig. 11. Fig. 11 (right) shows thatthere are many locations at which the stresses are concentrated due toreal corrosion thickness distribution, especially in the middle baystiffeners, where the sharp deformation of the stiffeners Fig. 10 (right)occurs leading to a fracture, which was confirmed by the tested boxgirder as can be seen in Fig. 12.
During the test it was observed that, after the first fracture appear, asimultaneous fracture of the stiffeners occurs demonstrating a brittlebehaviour of the material after being subjected to severe corrosion as
ionship, average corrosion.

Table 7Ultimate bending moment two stress–strain models, average corrosion thickness.
Criteria
Local Global Combined
Models BMu, kNm BMu, % r Criteria
EXP 201.01 – – –
EPM2 199.03 −0.98% 0.989 0.989EPM+ EPM2 203.53 1.26% 1.048 0.969
100 S. Saad-Eldeen et al. / Journal of Constructional Steel Research 92 (2014) 90–102
was reported in [34]. A similar behaviour has been reported in [42,43]where the energy absorption for corroded columns decreased as thelevel of corrosion damage increases, which indicated that the failure ofthe columns was brittle in nature at higher degrees of the columndegradation.
In the case with average corrosion, Fig. 11 (left), all of the stiffenersbehave in a normal waywithout any sharp deformations, and the stressdistribution is symmetric in themiddle of the box. In fact if the corrosiondegradation is modelled in a real manner, the stress distribution isasymmetric as shown in Fig. 11 (right).
4.4. Ultimate strength analysis based on two stress–strain models
A comparison between the application of one stress–strain model,EPM2, to predict the ultimate strength behaviour of the box girderand the use of two stress–strain models, one for compressive (deck)based on the EPM2 model and one for tensile loaded part (bottom),based on the EPM model of the box girder has been carried out.
The moment–curvature relationship in both cases is plotted inFig. 13. As can be seen, both of the cases coincide well in the linearsector, after that a deviation starts to appear due to the fact that withthe application of two stress strain models (EPM+ EPM2), the bottompart, which is under tension obeys more capacity. With the use of onestress strain model for the whole box, EPM2, the behaviour is closer tothe experimentally achieved one with r, ultimate bending momentand combined criteria of 0.989, −0.98% and 0.989, respectively asgiven in Table 7.
From the stress distribution point of view, in the case of one stress–strain model, EPM2, the box girder fails before reaching the plasticity inthe bottom plating, Fig. 14 (middle), whichmakes the ultimate bending
1
MN
MX
X
Y
Z
SCB,Avg,EPM2,3.919 IMP,Real,50% CI
-.265E+09-.209E+09
-.154E+09-.983E+08
-.428E+08.128E+08
.684E+08.124E+09
.179E+09.235E+09
JUL 7 201120:56:56
NODAL SOLUTION
STEP=1SUB =5TIME=.5525SZ (AVG)RSYS=0DMX =.02793SMN =-.265E+09SMX =.235E+09
Fig. 14. Longitudinal stresses along the deck panel (left), the middle bay
moment less than the experimental one with −0.98% as given inTable 7.
On the contrary, with the use of two stress strain models,EPM + EPM2 a higher ultimate bending moment is achieved with1.26% than the experimental defined one. This may be explainedby the fact that the bottom part is still not reaching the plasticity(see Fig. 15, middle).
At the deck panel, the middle bay, Fig. 14 (middle) and Fig. 15(middle), the stress distribution is the same and this is because theupper part (deck) in both cases is using the same stress strain model,Fig. 14 (right) and Fig. 15 (right). The stress distribution at the sideshell is different and this is because the lower part (bottom) in thecase of two models (EPM+ EPM2), Fig. 15 (right) is modelled by theEPM model, which enables more capacity, therefore, some of thebottom plating and some parts of the side shell reach the plasticity.Also the stress distribution around the neutral axis is different for thetwo cases.
5. Conclusion
A series of nonlinear finite element analysis have been carried out toevaluate the ultimate strength of a box girder subjected to severecorrosion. Two groups of analyses have been conducted. The first onedeals with the corrosion degradation modelled as average thicknessloss based on real thickness measurements, and the second one, thebox girder element thicknesses are modelled based on the realcorrosion thickness measurements.
New stress–strain relationships have been developed accounting forthe effect of corrosion on the steelmechanical properties. A comparativefinite element analyses between the results achieved using the existingand developed stress–strain models and the test results of a severelycorroded box girder have been conducted.
The ultimate strength analyses, based on the two corrosionmodellingconcepts (average and real corrosion thickness), demonstrated that theEPM2model of the stress–strain behaviour (which includes two changesof slope of the tangentmodulus) is a good option to predict themoment–curvature behaviour and the ultimate bending moment evaluated by thecombined criteria for adequacy as 0.989 and 0.887 for average and realcorrosion thickness respectively.
From the ultimate bending moment point of view, there is a cleardifference (10.0%–14.4%) between the finite element results with the
MN MX
(middle) and the EPM2 model (right), average corrosion thickness.

1
MN
MX
X
Y
Z
SCB,Avg corr.,EPM+EPM2,3.919 IMP,Real,50% CI
-.266E+09-.210E+09
-.155E+09-.989E+08
-.432E+08.124E+08
.681E+08.124E+09
.179E+09.235E+09
JUL 8 201112:34:33
NODAL SOLUTION
STEP=1SUB =5TIME=.51SZ (AVG)RSYS=0DMX =.026503SMN =-.266E+09SMX =.235E+09
MN
MX
Fig. 15. Longitudinal stresses along the deck panel (left), the middle bay (middle) and the EPM+ EPM2 model (right), average corrosion thickness.
101S. Saad-Eldeen et al. / Journal of Constructional Steel Research 92 (2014) 90–102
thickness of the platesmodelled as average corrosion thickness and realcorrosion thickness, which demonstrates a difference in finite elementmodels for deteriorated structures.
Therefore this work has reinforced the previous understanding thatplate corrosion changes the mechanical properties of steel and thateffect needs to be accounted in calculations.
Acknowledgement
The experimental work used here has been performed within theproject “MARSTRUCT-Network of Excellence on Marine Structures”(http://www.mar.ist.utl.pt/marstruct/) and has been partially fundedby the European Union through the Growth Programme under contractTNE3-CT-2003-506141. The first author has been funded by thePortuguese Foundation for Science and Technology (Fundação para aCiência e Tecnologia — FCT) under contract SFRH/BPD/84823/2012.
References
[1] Guedes Soares C, DoglianiM, Ostergaard C, Parmentier G, Pedersen PT. Reliability basedship structural design. Trans Soc Nav Archit Mar Eng (SNAME) 1996;104:359–89.
[2] IACS. Common structural rules for double hull oil tankers. London: InternationalAssociation of Classification Societies; 2006.
[3] IACS. Common structural rules for bulk carriers. London: International Association ofClassification Societies; 2006.
[4] Hu Y, Zhanga A, Sunb J. Analysis on the ultimate longitudinal strength of a bulkcarrier by using simplified method. Mar Struct 2001;14:311–30.
[5] Caldwell J. Ultimate longitudinal strength. Trans R Inst Nav Archit (RINA)1965;107:411–30.
[6] Smith C. Influence of local compressive failure on ultimate longitudinal strength of aship hull. Proceedings of the International Symposium on Practical Design inShipbuilding (PRADS); 1977. p. 73–9.
[7] Billingsley DW. Hull girder response to extreme bending moments. Proceedings of5th STAR Symposium. SNAME; 1980. p. 51–63.
[8] Dow RS, Hugill RC, Clark JD, Smith CS. Evaluation of ultimate ship hull strength.SNAME Symposium on Extreme Loads Response, Arlington; 1981. p. 133–48.
[9] Adamchak JC. An approximate method for estimating the collapse of a ship's hull inpreliminary design. Proceedings of Ship Structure Symposium. Arlington: SNAME;1984. p. 37–61.
[10] Yao T, Nikolov P. Progressive collapse analysis of a ship's hull under longitudinalbending. J Soc Nav Archit Jpn 1991;170:449–61.
[11] Hughes OF. Ship structural design: a rationally-based, computer-aided, optimizationapproach. New York: John Wiley and Sons; 1983.
[12] Gordo JM, Guedes Soares C. Approximate load shortening curves for stiffened platesunder uniaxial compression. Integrity of offshore structures. EEMAS; 1993.p. 189–211.
[13] Gordo JM, Guedes Soares C, Faulkner D. Approximate assessment of the ultimatelongitudinal strength of the hull girder. J Ship Res 1996;40:60–9.
[14] Rutherford S, Caldwell J. Ultimate longitudinal strength of ships: a case study. TransSoc Nav Archit Mar Eng (SNAME) 1990;98:441–71.
[15] RahmanMK, ChowdhuryM. Estimation of ultimate longitudinal bendingmoment ofships and box girders. J Ship Res 1996;40:244–57.
[16] Chen YK, Kutt LM, Piaszczyk CM, Bieniek MP. Ultimate strength of ship structures.Trans SNAME 1983;91:149–68.
[17] Valsgaard S, Steen E. Ultimate hull girder strength margins in present classrequirements. SNAME Symposium 91 onMarine Structural Inspection, Maintenanceand Monitoring, Arlington; 1991. p. B 1–19.
[18] Hansen AM. Strength of midship sections. Mar Struct 1996;9:471–94.[19] Nishihara S. Ultimate longitudinal strength of midship cross section. Nav Archit
Ocean Eng 1984;22:200–14.[20] Qi E, Cui W, Wan Z. Comparative study on the utimate hull girder strength of large
double hull tankers. Mar Struct 2005;18:227–49.[21] Harada M, Shigemi T. A method for estimating the uncertainties in ultimate
longitudinal strength of cross section of ship's hull based on nonlinear FEM. In:Basu R, Belenky V, Wang G, Yu Q, editors. Proceedings of the 10th InternationalSymposium on Practical Design of Ships and Other Floating Structures, Houston,USA; 2007.
[22] Amlashi HKK, Moan T. Ultimate strength analysis of a bulk carrier hull girder underalternate hold loading condition — a case study part 1: nonlinear finite elementmodelling and ultimate hull girder capacity. Mar Struct 2008;21:327–52.
[23] Shu Z, Moan T. Assessment of the hull girder ultimate strength of a bulk carrier usingnonlinear finite element analysis. In: Guedes Soares C, Das PK, editors. Marstruct BkSeries. Taylor & Francis Group; 2009. p. 173–80.
[24] Nikolov PI. Box girder strength under pure bending:comparison of experimental andnumerical results. In: Goren O, Okan B, Karakas S, editors. Proceedings of the 13thCongress of International Maritime Association of the Mediterranean (IMAM'09). ,ITUIstanbul, Turkey: Faculty of Naval Architecture and Ocean Engineering; 2009.p. 79–86.
[25] Ueda Y, Rashed SMH. The idealized structural unit method and its application todeep girder structures. Comput Struct 1984;18:277–93.
[26] Ueda Y, Rashed SMH. Advances in the application of ISUM to marine structures.Proceedings of 2nd International Conference on Advances in Marine Structures.UK: Dunfermline; 1991. p. 628–49.
[27] Bai Y, Bendiksen E, Pedersen PT. Collapse analysis of ship hulls. Mar Struct1993;6:485–507.
[28] Paik JK. Tensile behavior of local members on ship hull collapse. J Ship Res1994;38:239–44.
[29] Masaoka K, Okada H, Ueda Y. A rectangular plate element for ultimate strengthanalysis. Proceedings of the 2nd International Conference on Thin-Walled Structures,Singapore; 1998. p. 469–76.
[30] Fujikubo M, Kaeding P, Yao T. ISUM rectangular plate element with new lateralshape functions (1st report) longitudinal and transverse thrust. J Soc Nav ArchitJpn 2000;187:209–19.
[31] Saad-Eldeen S, Garbatov Y, Guedes Soares C. Experimental assessment of the ultimatestrength of a box girder subjected to four-point bendingmoment. In: Spaier S, EstefenS, Pasqualino I, editors. Proceedings of the 11th International Symposium on PracticalDesign of Ships and Other Floating Structures (PRADS2010), Aped, Rio de Janeiro,Brazil; 2010. p. 1134–43.
[32] Saad-Eldeen S, Garbatov Y, Guedes Soares C. Compressive strength assessment of amoderately corroded box girder. Mar Syst Ocean Technol 2011;6:27–37.
[33] Saad-Eldeen S, Garbatov Y, Guedes Soares C. Experimental assessment of theultimate strength of a box girder subjected to severe corrosion. Mar Struct2011;24:338–57.

102 S. Saad-Eldeen et al. / Journal of Constructional Steel Research 92 (2014) 90–102
[34] Saad-Eldeen S, Garbatov Y, Guedes Soares C. Effect of corrosion degradationon the ultimate strength of steel box girders. Corros Eng Sci Technol2012;47:272–83.
[35] Saad-Eldeen S, Garbatov Y, Guedes Soares C. FE parameters estimation and analysisof ultimate strength of box girder. In: Guedes Soares C, Garbatov Y, Sutulo S, SantosTAR, editors. Maritime technology and engineering. London, UK: Taylor & FrancisGroup; 2012.
[36] Saad-Eldeen S, Garbatov Y, Guedes Soares C. Influence of weld toe shape andmaterial models on the ultimate strength of a slightly corroded box girder. In:Rizzuto E, Guedes Soares C, editors. Sustainable maritime transportation andexploitation of sea resources. London, UK: Taylor & Francis Group; 2012. p. 401–9.
[37] Guedes Soares C, Garbatov Y. Reliability of maintained, corrosion protectedplates subjected to non-linear corrosion and compressive loads. Mar Struct1999:425–45.
[38] Garbatov Y, Guedes Soares C. Corrosionwastage statistics andmaintenance planning ofcorroded hull structures of bulk carriers. In: Guedes Soares C, Das PK, editors. Analysisand design of marine structures. London, UK: Taylor & Francis Group; 2009. p. 215–22.
[39] Garbatov Y, Guedes Soares C, Wang G. Nonlinear time dependent corrosion wastageof deck plates of ballast and cargo tanks of tankers. J Offshore Mech Arct Eng TransASME 2007;129:48–55.
[40] Ueda Y, Yasukawa W, Yao T, Ikegami H, Ohminami R. Effect of welding residualstresses and initial deflection on rigidity and strength of square plates subjected tocompression (report II). Trans JWRI 1997;6:33–8.
[41] Paik JK, Sohn JM. Effects of welding residual stresses on high tensile steel plateultimate strength: nonlinear finite element method investigations. J Offshore MechArct Eng 2012;134:1–6.
[42] Vu NA, Castel A, François R. Effect of stress corrosion cracking on stress–strainresponse of steel wires used in prestressed concrete beams. Corros Sci 2009;51:1453–9.
[43] Revathy J, Suguna K, Raghunath PN. Effect of corrosion damage on the ductilityperformance of concrete columns. Am J Eng Appl Sci 2009;2:324–7.
[44] Saad-Eldeen S, Garbatov Y, Guedes Soares C. Analysis of plate deflections duringultimate strength experiments of corroded box girders. Thin-Walled Struct2012;54:164–76.
Copyright © 2022 FDOKUMEN