Restraint Stress Impairs Oocyte Developmental Potential in Mice

Infant HIV-1 Infection Severely Impairs the Bacille Calmette-Guerin Vaccine-Induced Immune Response1
Nazma Mansoor$,1, Thomas J. Scriba$,1, Marwou de Kock1, Michele Tameris1, Brian Abel1,Alana Keyser1, Francesca Little2, Andreia Soares1, Sebastian Gelderbloem1, SilviaMlenjeni1, Lea Denation1, Anthony Hawkridge1,3, W. Henry Boom4, Gilla Kaplan5, GregoryD. Hussey1, and Willem A. Hanekom1,*
1South African Tuberculosis Vaccine Initiative, Institute of Infectious Diseases and MolecularMedicine and School of Child and Adolescent Health, University of Cape Town, Anzio Road,Observatory, South Africa2Department of Statistical Sciences, University of Cape Town, Rondebosch, South Africa3Aeras Global Tuberculosis Vaccine Foundation, Cape Town, South Africa4Tuberculosis Research Unit, Case Western Reserve University and University Hospitals CaseMedical Center, Cleveland, Ohio, USA5Public Health Research Institute, University of Medicine and Dentistry of New Jersey, Newark,New Jersey, USA
AbstractBackground—World-wide, most infants born to HIV-infected mothers receive BCG.Tuberculosis is a major cause of death of HIV-infected infants in sub-Saharan Africa, and shouldbe prevented. However, BCG may itself cause disease (BCGosis) in these infants. Informationregarding the immunogenicity of BCG is imperative for the risk/benefit assessment of BCGvaccination in HIV-infected infants; however, no such data exists.
Methods—We compared BCG-induced CD4 and CD8 T cell responses, assessed by flowcytometry, in HIV-infected (n = 20), HIV-exposed but uninfected (n = 25), and HIV-unexposed (n= 23) infants, over their first year of life.
Results—BCG vaccination of the 2 HIV-uninfected groups induced a robust response,characterized by IFN-γ, TNF-α, and/or IL-2-expressing CD4 T cells. In contrast, HIV-infectedinfants had a markedly lower response, throughout the first year of life. These infants also hadsignificantly reduced numbers of IFN-γ, TNF-α and IL-2 co-expressing polyfunctional CD4 Tcells, thought to indicate T cell quality.
1Conflict of Interest StatementNone declared.*Correspondence should be addressed to Willem A. Hanekom, University of Cape Town Health Sciences, Anzio Road, Observatory,7925, South Africa, Tel. +27 21 406 6080, Fax. +27 21 406 6693, [email protected].$Nazma Mansoor and Thomas J. Scriba contributed equally to this work.Author ContributionsThe study was designed by Willem Hanekom, Gilla Kaplan, Gregory Hussey and Henry Boom. Field work was completed by Marwoude Kock, Michelle Tameris, Sebastian Gelderbloem, Silvia Mlenjeni, Lea Denation, Anthony Hawkridge and Willem Hanekom.Immunology assays were completed by Nazma Mansoor, Thomas Scriba, Sebastian Gelderbloem, Marwou de Kock, Brian Abel,Alana Keyser and Andreia Soares. Data was analysed and interpreted by Thomas Scriba, Francesca Little, Nazma Mansoor, MicheleTameris, Brian Abel, Henry Boom, Gilla Kaplan and Willem Hanekom. The manuscript written was by Thomas Scriba, NazmaMansoor and Willem Hanekom, with input from other authors.
This work has, in part, been presented at the 7th International Conference on the Pathogenesis of Mycobacterial Infections,Stockholm, Sweden, 2008 (Abstract O19).
Europe PMC Funders GroupAuthor ManuscriptJ Infect Dis. Author manuscript; available in PMC 2010 February 02.
Published in final edited form as:J Infect Dis. 2009 April 1; 199(7): 982–990. doi:10.1086/597304.
Europe PM
C Funders A
uthor Manuscripts
Europe PM
C Funders A
uthor Manuscripts

Conclusions—HIV-1 infection severely impairs the BCG-specific T cell response during thefirst year of life. BCG may therefore provide little, if any, vaccine-induced benefit in HIV-infectedinfants. Considering the significant risk of BCGosis, these data strongly support not giving BCGto HIV-infected infants.
KeywordsTuberculosis; BCG; HIV; infants; T cells; immune response; polyfuntional; Th1; Th17
IntroductionThe Mycobacterium bovis Bacille Calmette-Guerin (BCG) vaccine is given at birth toalmost all infants born in sub-Saharan African countries [1]. Although BCG affords highlyvariable protection against pulmonary tuberculosis (TB), the vaccine does protect againstsevere disseminated forms of TB in infancy by an estimated 73% (67-79%) againstmeningitis, and 77% (58-87%).against miliary disease [1]. However, there is no clearevidence that BCG protects HIV-infected infants against these forms of the disease [2]. Insub-Saharan Africa an estimated 1500 infants are born with HIV-1 infection every day [3].TB is common in this population: in South Africa, the incidence of TB in HIV-infectedinfants and children was 9.2% in 2004, and the disease remains one of the main identifiablecauses of death in this population [4]. Rather than protect against severe TB, BCGvaccination of HIV-infected infants may cause disease, called BCGosis [5, 6]. BCGosis,estimated to affect 110-417 per 100,000 vaccinees in South Africa [5], can occur inlocalized or disseminated forms and cause significant morbidity [7]. To guide a morecomprehensive assessment of risks and benefits of BCG vaccination in HIV infected infants,we assessed whether BCG induces the immune response thought to be required to protectinfants against TB.
The immune determinants of vaccination-induced protection against TB are not fullyunderstood. However, the T-helper type 1 (Th1) cytokine response, characterized by IFN-γ,TNF-α, and IL-2 production, is widely thought to be essential. We have recently shown, inHIV-uninfected infants, that BCG induces CD4 and CD8 populations that expresscombinations of IFN-γ, TNF-α and IL-2 [8]. These include “polyfunctional” CD4 T cells,i.e., cells that co-express all 3 cytokines [8], considered good indicators of the quality of theimmune response. Although evidence in humans remains inconclusive, animal data suggestthat polyfunctional T cell responses correlate with protection against TB in novel TBvaccine studies (personal communication, Anderson P, et al). We therefore measured theseT cell markers as primary outcomes in this study, in a comparison between HIV-infectedand HIV-unexposed, healthy infants.
A secondary aim was to assess whether immunity induced in HIV-uninfected infants born toHIV-infected mothers was similar to that in HIV-unexposed, healthy infants. There is nodata on the efficacy of BCG vaccination in HIV-exposed, uninfected children. However,multiple studies have shown immunological changes [9-11] in and increased mortality andmorbidity [12, 13] of HIV-exposed infants.
Materials and MethodsParticipants
Infants born to HIV-infected and non-infected women, recruited at clinics or maternitywards in the Worcester region of the Western Cape, South Africa, were enrolled between2003 and 2006. All infants had documented BCG (strain Staten Serum Institute, SSI)vaccination on the first day of life. Maternal HIV status was determined by HIV antibody
Mansoor et al. Page 2
J Infect Dis. Author manuscript; available in PMC 2010 February 02.
Europe PM
C Funders A
uthor Manuscripts
Europe PM
C Funders A
uthor Manuscripts

ELISA prior to enrollment. Infant HIV infection status was determined by viralamplification at 6 weeks of age. Infants were assigned to one of three groups: infants born toHIV-uninfected mothers (in this manuscript termed “HIV−”), HIV-uninfected infants bornto HIV-infected mothers (“Exposed HIV−”), or HIV-infected infants (“HIV+”).Antiretroviral therapy (ART) was not routinely available for treatment of HIV infectionduring the study period; at that stage, the public health service focused on preventingmother-to-child transmission.
The protocol was approved by the Research Ethics Committee of the University of CapeTown, and by the Institutional Review Board of the Rockefeller University (New York, NY)and the University of Medicine and Dentistry of New Jersey. Good clinical practice andethical guidelines of the US Department of Health and Human Services and the SouthAfrican Medical Research Council were adhered to; this included written, informed parentalconsent.
Blood collection and processingBlood was collected at 3, 6, 9 and 12 months of age into heparinised tubes. This blood wasimmediately processed at the field site, using whole blood assays previously optimised forthis purpose [8, 14]. Whole blood was incubated with BCG and anti-CD28 and anti-CD49dfor 12 hours. Blood incubated with co-stimulatory antibodies alone (UNS), served asnegative control. After 7 hours, 50-100μL plasma was removed and cryopreserved forsoluble cytokine analysis. Brefeldin A (10μg/mL, Sigma) was added for the last 5 hours ofincubation. Following incubation, red blood cells were lysed and white cells fixed withFACS Lysing Solution (BD Biosciences), and then cryopreserved. A small aliquot ofheparinized blood was stained for CD3, CD4, CD8 and CD45. A full blood count and HIVviral load (only for HIV-infected infants) were performed at each time point.
Antigens and antibodiesLive BCG was reconstituted from the vaccine vial (SSI) at 1.2 × 10⁶ CFU/mL, as previouslydescribed [14]. SEB (Sigma) was used as positive control at 10μg/mL. Anti-CD28 and anti-CD49d (BD Biosciences) were each used at 0.5μg/mL. For flow cytometry the followingantibodies were used: anti-CD3 Pacific Blue or PE (UCHT1), anti-CD4 allophycocyanin(SK3), anti-CD45 FITC (HI30), anti-CD8 PerCP-Cy5.5 or PerCP (SK1), anti-IFN-γAlexaFlour700 (B27), anti-IL-2 FITC (5344.111) and anti-TNF-α PE-Cy7 (MAb11), allfrom BD Biosciences.
Cell counts, staining and flow cytometric analysisCD4 and CD8 lymphocyte frequencies were determined by flow cytometry upon stainingwhole blood for CD4, CD8 and CD45. These values were used with results of CD3 stainingand lymphocyte counts to calculate absolute CD4 and CD8 T cell numbers per mL blood.
Intracellular cytokines were acquired on a LSRII flow cytometer (BD Biosciences) andanalysed as described [8]. Automated compensation with mouse IgG κ-beads and cellcontrols was applied. Flow cytometric plots are displayed using bi-exponential scaling.Gating strategies are shown in Suppl. Figure 1.
Soluble cytokine analysisPlasma was thawed to measure levels of IL-2, TNF-α and IFN-γ by sandwich ELISAfollowing the manufacturer’s instructions (BenderMed for IFN-γ; eBiosciences for TNF-αand IL-2).
Mansoor et al. Page 3
J Infect Dis. Author manuscript; available in PMC 2010 February 02.
Europe PM
C Funders A
uthor Manuscripts
Europe PM
C Funders A
uthor Manuscripts

Data analysis and modellingBackground cytokine levels measured in plasma, and background frequencies ofintracellular cytokine expression, from unstimulated blood, were subtracted from levels andfrequencies following BCG stimulation. Absolute numbers of BCG-specific cytokine-producing cells were calculated for each time point. These data were imported into SPICE,version 4.1 (kindly provided by Mario Roederer, Vaccine Research Center, NIAID, NIH)and analysed, before exporting to Prism 4.03 (GraphPad) or STATA 9.0 for statisticalanalysis.
The distributions of absolute T cell counts were skew due to the presence of some largevalues. We did not exclude any measurements but reduced the possible impact of theseextreme values by log transforming the counts. Log-transformed absolute T cell counts wereanalysed using mixed effects linear regression models to test for group and time effects andfor group-time interactions. These mixed effects regression models treat participants asrandom effects to cope with repeated measures. This has the effect of imposing a non-zero,equal correlation structure on all measurements within a participant. These models werefitted using maximum likelihood estimation and thus observations at each time pointinfluenced estimates of treatment or other effects at every time point including the missingtime points through the specification of the correlation pattern [15]. The numbers of infantsfrom each group at the different time points are listed per analysis in each figure legend andthe total number of infants per group and time point in Table 2.
Time was modelled as a continuous (as opposed to categorical) effect and either linear orquadratic time profiles were fitted. In this way time profiles were smoothed out. All groupeffects estimated from these models are thus adjusted for time but we chose not to reporttime effects in the tables. Total CD4 (or CD8) cell counts were added to the models to adjustgroup comparisons for differences in CD4 (and CD8) counts (Table 1 and Suppl. Figure 3).
Estimated group differences of log-transformed values were exponentiated to obtainproportional differences between groups with respect to original untransformedmeasurements (Table 1).
The distributions of the T cell frequency data were extremely skew and log-transformationsdid not result in symmetrical distributions. As a result, normal-base linear regression typemodels could not be used to model the frequency data. These measurements were thussummarized by group and time point using medians and interquartile ranges and comparedat each time point using Kruskal-Wallis (overall effect) and Mann-Whitney U tests.Resulting p-values from frequency data should be interpreted conservatively because of theincreased chance of false-positives due to multiple testing. Furthermore, comparison at latertime points may be biased as a result of infant drop-out.
ResultsInfant follow-up and losses
Of 298 infants born to HIV-infected mothers, 20 were identified as HIV+ by a positive viralamplification test. The number of infants in the HIV+ group decreased gradually over the 12month period (Table 2). Eight infants died during the study, conducted before ART wasroutinely available for treatment of HIV infection in South Africa, and 4 infants were lost tofollow-up. Median log10 plasma viral loads in the HIV+ infant group at the four timepointswere 5.7, 5.6, 4.9 and 4.9 RNA copies per mL, respectively. Three infants received ART,and their data from after initiation of ART were excluded from analysis. Twenty five of the278 non-infected infants born to HIV-infected mothers were included in the Exposed HIV−group. None of these infants were breastfed. Thirteen of these infants were lost to follow-up
Mansoor et al. Page 4
J Infect Dis. Author manuscript; available in PMC 2010 February 02.
Europe PM
C Funders A
uthor Manuscripts
Europe PM
C Funders A
uthor Manuscripts

over their first year or life. Twenty three infants born to HIV-negative mothers (HIV−) werealso enrolled. Of these, 4 were lost to follow-up. The data analysis approach employedspecifically assessed whether measured outcomes were reliable regardless of the losses tofollow-up (see Data analysis and modeling, under Methods).
BCG-specific Th1 cell numbers were reduced in HIV-infected infantsWe measured the BCG-induced immune response in infants by quantifying Th1-cytokineexpression in BCG-specific T cells by flow cytometry. The BCG-specific responsecomprised multifunctional CD4 and CD8 populations expressing IFN-γ, TNF-α and/or IL-2(Suppl. Fig. 1), as reported before [8]. In all three infant groups the magnitude of cytokine-producing cells peaked at 3 months and then waned over the 9-month follow-up period (Fig.1). The total BCG-specific CD4 T cell response, comprising all cytokine-expressing cells,was significantly lower in HIV+ infants, compared with the other two groups, throughoutthe follow-up period (Table 1 and Fig. 1A). This pattern was also seen when the absolutenumbers of BCG-specific CD4 T cells expressing IFN-γ, IL-2 or TNF-α were quantified(Table 1, Fig. 1B-D). No differences in total cytokine-expressing or IFN-γ, IL-2 or TNF-α-expressing CD4 T cells were seen in Exposed HIV− and HIV− infants.
In a complementary analysis, we showed that BCG-specific CD4 T cell loss wasindependent of CD4 T cell counts. Please refer to Suppl. Results.
Specific polyfunctional CD4 T cell responses were compromised in HIV-infected infantsWe quantified BCG-induced polyfunctional CD4 T cells, which simultaneously expressIFN-γ, IL-2 and TNF-α, in the three infant groups. Absolute numbers of these cells in HIV+infants were significantly lower than in the other two groups, throughout the first year of life(Table 1, Fig. 2). By 9 months of age the depletion of polyfunctional cells was striking in theinfected group; these cells were barely detectable in most HIV+ infants. Again, nodifferences were observed between Exposed HIV− and HIV− infants (Table 1, Fig. 2).
Next, we compared the proportions of monofunctional (cells producing 1 cytokine), bi-functional (2 cytokines) and polyfunctional CD4 T cells (3 cytokines) in these infant groups.The BCG-specific CD4 T cell response, which was significantly lower in HIV-infectedinfants than the other groups (Fig. 1), was also predominantly comprised of mono-functionalcells (Fig. 2B). HIV− and Exposed HIV− infants displayed markedly higher proportions ofbi- and polyfunctional specific CD4 cells than HIV+ infants (Fig. 2B).
CD8 T cells did not compensate for loss of specific CD4 responses in HIV+ infantsWe have previously shown that BCG-vaccination induces CD8 T cells, although at a lowerfrequencies than CD4 T cells [8]. Specific CD8 T cells mostly express IFN-γ, and to a lesserextent TNF-α, IL-2 and cytotoxic markers such as granzymes and perforin [8, 16]. Since theCD4 T cell compartment is compromised in HIV-infected infants, we hypothesized that thisloss would be compensated for by the CD8 T cell response. IFN-γ-producing CD8 T cellswere detectable in most infants, in all groups; however, TNF-α and IL-2-producing cellswere very infrequent and mostly undetectable (data not shown). Regression modeling ofabsolute BCG-specific IFN-γ-expressing CD8 T cell numbers displayed lower responses inthe HIV+ group, compared with the HIV− group (Fig. 3A). Similar patterns were observedwhen IFN-γ+ CD8 T cell frequencies were analysed (Fig. 3B).
BCG-specific secretion of IFN-γ and IL-2 was reduced in HIV-infected infantsTo confirm the flow cytometry results, we quantified BCG-specific secretion of solubleIFN-γ, IL-2 and TNF-α in plasma. As seen for CD4 T cell cytokine production, the levels
Mansoor et al. Page 5
J Infect Dis. Author manuscript; available in PMC 2010 February 02.
Europe PM
C Funders A
uthor Manuscripts
Europe PM
C Funders A
uthor Manuscripts

of IFN-γ and IL-2 at 3 months were significantly lower in HIV+ infants compared withexposed and unexposed HIV− infants (Fig. 4A and B). Lower IFN-γ and IL-2 valuespersisted at later time points in the HIV+ group, though these differences were not alwaysstatistically significant (Fig. 4B). TNF-α levels were typically 10-fold higher than IFN-γand IL-2 concentrations and were not different between the infant groups, across alltimepoints (Fig. 4C).
DiscussionTo determine whether BCG vaccination is immunogenic in HIV-infected infants, weassessed induction of CD4 and CD8 T cells producing Th1 cytokines, a response thought tobe required for control of M. tuberculosis infection. We showed markedly lower numbers ofBCG-specific CD4 T cells in HIV-infected infants, compared with uninfected infants, 3months after newborn vaccination. Further, these numbers dwindled to virtuallyundetectable levels later during the first year of life. We also showed that the ability of CD4T cells to simultaneously express IFN-γ, IL-2, and TNF-α, thought to indicate the “quality”of the immune response, was diminished in HIV-infected infants, compared with non-exposed infants. Further, we found that the relatively low BCG-induced CD8 T cell responsewas also lower in HIV-infected infants compared with uninfected infants, and couldtherefore not compensate for the loss of BCG-specific CD4 T cell immunity. Overall, ourresults demonstrate that the BCG-induced adaptive immune response is severely impairedand, by 9 months, virtually absent in infants with HIV infection.
The severely impaired T cell response in HIV-infected infants suggests that BCG may affordvery little, if any, vaccine-induced benefit. We cannot exclude that immune mechanismsother than T cells, such as antibody responses, could be involved in BCG-inducedprotection. However, overwhelming evidence supports the central importance of theimmune function we examined. Considering the significant risk of BCG disease in thisvulnerable group, our data support the recommendation by the WHO Global AdvisoryCommittee on Vaccine Safety that BCG should not be administered to infants who areknown to be HIV-infected [17]. BCG vaccination of infants not infected with HIV remainscritically important to prevent disseminated disease [1]. The WHO Committee recommendsthat vaccination in infants born to HIV-infected mothers be delayed until infection has beenexcluded by a viral amplification test, usually at 6 weeks of age [17]. Unfortunately, in mostdeveloping country settings, there is no guarantee that infants will return to the clinic for thistest, or the test may not be routinely available. In these settings, the recommendationremains to vaccinate all infants at birth [17].
Two questions emerge from the WHO recommendations. First, is BCG immunogenic inHIV-exposed, but uninfected infants, and second, what are the effects of delayingvaccination beyond the immediate newborn period in this population? Regarding the firstquestion, multiple studies have suggested that maternal HIV infection may adverselyinfluence immune responses to various microorganisms, in uninfected infants [10-13].Increased global T cell activation in HIV exposed infants has also been shown [9-11], andthese factors may contribute to increased mortality and morbidity reported in this population[12, 13]. We therefore hypothesized that BCG-induced immunity in HIV-exposed butuninfected infants would be inferior to that in infants who were not exposed to HIV.However, we found no difference in immunity between these two infant groups. Our dataimply that the BCG-induced immune response in HIV-exposed but uninfected infantsappears normal, and that this group would benefit from vaccination. Our findings are inagreement with another study showing no significant differences in BCG-specific IFN-γrelease measured by ELISA in 7-day whole blood assays in exposed, HIV-uninfected infantswhen compared with unexposed infants, at six weeks of age [11]. However, when these
Mansoor et al. Page 6
J Infect Dis. Author manuscript; available in PMC 2010 February 02.
Europe PM
C Funders A
uthor Manuscripts
Europe PM
C Funders A
uthor Manuscripts

authors used PPD as antigen for the same analysis, a lower IFN-γ response in Exposed HIV− infants was observed.
We are currently addressing the second question posed above by comparing longitudinalimmunity induced when HIV-exposed infants are vaccinated at birth and at 10 weeks of age.
Our study is also the first to describe the kinetics of the BCG-induced immune response ininfants in some detail. Given our pre-selected time points, the CD4 T cell response peaked at3 months post-vaccination, and waned over time. However, BCG-induced protection againstdisseminated forms of TB persists until at least five years of age [1]. This may imply that,after contraction of the peak response measured at 3 months of age, central memory T cellsmay migrate from the blood to lymph nodes or specific organs, resulting in a quantitativelylower response measurable in peripheral blood. These observations underline the importanceof studies of BCG-induced immune correlates of protection.
Interestingly, the proportion of CD4 T cells co-expressing two or three cytokines decreasedover time in all groups. Presence of these polyfunctional T cells may indicate “quality” ofthe immune response, as in HIV infection, presence of HIV-specific polyfunctional T cells isassociated with better clinical outcome [18, 19]. Similar observations have been made inmurine models of Leishmania infection [18, 19], and of M.tb infection [19] (personalcommunication, Anderson P, et al). A similar evolution from a high to a low proportion ofpolyfunctional T cells was reported for Ag85A-specific CD4 T cells after vaccination ofhealthy adults with a novel TB vaccine, MVA85A [20]. A polyfunctional response maytherefore reflect an “effector” response soon after antigen exposure whereas maturation of Tcells may be associated with differential cytokine profiles. Alternatively, polyfunctional Tcells may have redistributed to lymph nodes or specific organs.
Findings from T cell analysis were confirmed when soluble IFN-γ and IL-2 were measuredin plasma, which were significantly decreased in the HIV+ infant group. The comparablelevels of soluble TNF-α levels between the different infant groups is likely due to TNF-αproduction by BCG-reactive innate cells such as monocytes, neutrophils and NK cells.Indeed, soluble TNF-α concentrations exceeded IFN-γ and IL-2 concentrationsapproximately 10-fold, suggesting an additional source of this cytokine.
The significant drop-out rates in the HIV-infected infant group, primarily due to death,constituted a limitation of our study. These death rates are consistent with those observed inother African infant cohorts not on ART [21]. We therefore employed maximum likelihoodmixed effects linear regression modelling, which is designed to cope with missing datapoints. These models generated similar results to those observed when less sophisticated,non-parametric tests were applied. Another limitation was that no data was available fromBCG-unvaccinated infants. Such data would confirm that T cell responses are absent inBCG-naïve infants, and thus that our assay system detects specific T cells. Since BCG isroutinely given to all South African infants on the first day of life, analysis of BCG-unvaccinated infants was not possible. However, in another study by our group, utilising anidentical assay to the one used here, we detected no BCG-specific T cell responses in BCG-naïve infants from South Africa (Kagina and Hanekom, unpublished).
We did not prospectively address co-variates that could have affected infant immunity, suchas maternal viral load and immune status, maternal therapy, infant nutritional status, andadditional infections. Regardless, the BCG-specific T cell responses in HIV-infected infantsremained strikingly different to the two control infant groups.
In conclusion, our findings suggest that BCG vaccination may not protect HIV-infectedinfants against TB. How can protection against TB then be achieved in HIV-infected
Mansoor et al. Page 7
J Infect Dis. Author manuscript; available in PMC 2010 February 02.
Europe PM
C Funders A
uthor Manuscripts
Europe PM
C Funders A
uthor Manuscripts

infants? One approach may be to institute highly active antiretroviral therapy as early aspossible in these infants, and thereafter vaccinate with BCG. Evidence is emerging that earlyART of HIV-infected infants significantly decreases mortality, compared with initiation oftreatment when indicated by clinical or CD4 T cell criteria [22-24]. Moreover, the course ofBCG-related illnesses including BCG-associated immune reconstitution inflammatorysyndrome in HIV-infected infants is less severe when treatment is initiated early [22, 24].Regardless, the approach of BCG vaccination following early ART would have to be studiedformally. An alternative approach is to institute isoniazid prophylaxis in all HIV-infectedinfants. This intervention has been shown to significantly reduce mortality and the incidenceof TB in HIV-infected infants and children [4]. Many questions surrounding thisintervention remain unanswered, such as the effects of isoniazid on drug resistance inpopulations. Early isoniazid prophylaxis is therefore the focus of large trials currentlyunderway. Ultimately, a novel TB vaccine which is safer and hopefully more effective thanBCG in HIV-infected infants, will constitute the most sustainable intervention.
Supplementary MaterialRefer to Web version on PubMed Central for supplementary material.
AcknowledgmentsWe thank the infants and mothers who took part in this study, their families, and the support of the excellent team atour field site
Funding
This work was primarily supported by the Elizabeth Glaser Pediatric AIDS Foundation and the TBRU of the NIH(NO1-AI70022). TJS is a Wellcome Trust Research Training Fellow (080929/Z/06/Z). WAH is also supported bythe NIH (RO1-AI065653), the Aeras Global TB Vaccine Foundation and the European and Developing CountriesTrials Partnership (EDCTP). GK was supported in part by the NIH (RO1-AI054361).
References1. Trunz BB, Fine P, Dye C. Effect of BCG vaccination on childhood tuberculous meningitis and
miliary tuberculosis worldwide: a meta-analysis and assessment of cost-effectiveness. Lancet. 2006;367:1173–80. [PubMed: 16616560]
2. World Health Organization. BCG Disease. Wkly Epidemiol. Rec. 2004; 4:27–38.
3. World Health Organization. The world health report - make every mother and child count.2005URL: http://www.who.int/whr/2005/en/
4. Zar HJ, Cotton MF, Strauss S, et al. Effect of isoniazid prophylaxis on mortality and incidence oftuberculosis in children with HIV: randomised controlled trial. Bmj. 2007; 334:136. [PubMed:17085459]
5. Hesseling AC, Marais BJ, Gie RP, et al. The risk of disseminated Bacille Calmette-Guerin (BCG)disease in HIV-infected children. Vaccine. 2007; 25:14–8. [PubMed: 16959383]
6. Fallo, A.; Torrado, L.; Sanches, A.; Cerqueiro, C.; Schargrodsky, L.; Lopez, EL. Delayedcomplications of Bacille Calmette-Guerin (BCG) vaccination in HIV-infected children;International AIDS Society Meeting; 2005;
7. Hesseling AC, Rabie H, Marais BJ, et al. Bacille Calmette-Guerin vaccine-induced disease in HIV-infected and HIV-uninfected children. Clin Infect Dis. 2006; 42:548–58. [PubMed: 16421800]
8. Soares AP, Scriba TJ, Joseph S, et al. Bacillus calmette-guerin vaccination of human newbornsinduces T cells with complex cytokine and phenotypic profiles. J Immunol. 2008; 180:3569–77.[PubMed: 18292584]
9. Rich KC, Siegel JN, Jennings C, Rydman RJ, Landay AL. Function and phenotype of immatureCD4+ lymphocytes in healthy infants and early lymphocyte activation in uninfected infants of
Mansoor et al. Page 8
J Infect Dis. Author manuscript; available in PMC 2010 February 02.
Europe PM
C Funders A
uthor Manuscripts
Europe PM
C Funders A
uthor Manuscripts

human immunodeficiency virus-infected mothers. Clin Diagn Lab Immunol. 1997; 4:358–61.[PubMed: 9144377]
10. Kuhn L, Meddows-Taylor S, Gray G, Tiemessen C. Human immunodeficiency virus (HIV)-specific cellular immune responses in newborns exposed to HIV in utero. Clin Infect Dis. 2002;34:267–76. [PubMed: 11740717]
11. Van Rie A, Madhi SA, Heera JR, et al. Gamma interferon production in response toMycobacterium bovis BCG and Mycobacterium tuberculosis antigens in infants born to humanimmunodeficiency virus-infected mothers. Clin Vaccine Immunol. 2006; 13:246–52. [PubMed:16467333]
12. Kuhn L, Kasonde P, Sinkala M, et al. Does severity of HIV disease in HIV-infected mothers affectmortality and morbidity among their uninfected infants? Clin Infect Dis. 2005; 41:1654–61.[PubMed: 16267740]
13. McNally LM, Jeena PM, Gajee K, et al. Effect of age, polymicrobial disease, and maternal HIVstatus on treatment response and cause of severe pneumonia in South African children: aprospective descriptive study. Lancet. 2007; 369:1440–51. [PubMed: 17467514]
14. Hanekom WA, Hughes J, Mavinkurve M, et al. Novel application of a whole blood intracellularcytokine detection assay to quantitate specific T-cell frequency in field studies. J ImmunolMethods. 2004; 291:185–95. [PubMed: 15345316]
15. Brown, H.; Prescott, R. Applied Mixed Models in Medicine. Wiley; 2004.
16. Murray RA, Mansoor N, Harbacheuski R, et al. Bacillus Calmette Guerin vaccination of humannewborns induces a specific, functional CD8+ T cell response. J Immunol. 2006; 177:5647–51.[PubMed: 17015753]
17. World Health Organization. Safety of BCG vaccine in HIV-infected children. Wkly Epidemiol.Rec. 2007; 82:22.
18. Betts MR, Nason MC, West SM, et al. HIV nonprogressors preferentially maintain highlyfunctional HIV-specific CD8+ T cells. Blood. 2006; 107:4781–9. [PubMed: 16467198]
19. Darrah PA, Patel DT, De Luca PM, et al. Multifunctional TH1 cells define a correlate of vaccine-mediated protection against Leishmania major. Nat Med. 2007; 13:843–50. [PubMed: 17558415]
20. Beveridge NE, Price DA, Casazza JP, et al. Immunisation with BCG and recombinant MVA85Ainduces long-lasting, polyfunctional Mycobacterium tuberculosis-specific CD4(+) memory Tlymphocyte populations. Eur J Immunol. 2007; 37:3089–3100. [PubMed: 17948267]
21. Newell ML, Brahmbhatt H, Ghys PD. Child mortality and HIV infection in Africa: a review. Aids.2004; 18(Suppl 2):S27–34. [PubMed: 15319741]
22. National Institutes of Health. Treating HIV-Infected Infants Early Helps Them Live Longer. NIHNews. 2007URL: http://www.nih.gov/news/pr/jul2007/niaid-25.htm
23. Doerholt K, Duong T, Tookey P, et al. Outcomes for human immunodeficiency virus-1-infectedinfants in the United kingdom and Republic of Ireland in the era of effective antiretroviral therapy.Pediatr Infect Dis J. 2006; 25:420–6. [PubMed: 16645506]
24. Rabie, H.; Violari, A.; Madhi, S., et al. CROI. Boston, USA: 2008. Complications of BCGVaccination in HIV-infected and -uninfected Children: evidence from the Children with HIV EarlyAntiretroviral Therapy (CHER) Study.
25. Shearer WT, Rosenblatt HM, Gelman RS, et al. Lymphocyte subsets in healthy children from birththrough 18 years of age: the Pediatric AIDS Clinical Trials Group P1009 study. J Allergy ClinImmunol. 2003; 112:973–80. [PubMed: 14610491]
26. Shearer WT, Pahwa S, Read JS, et al. CD4/CD8 T-cell ratio predicts HIV infection in infants: theNational Heart, Lung, and Blood Institute P2C2 Study. J Allergy Clin Immunol. 2007; 120:1449–56. [PubMed: 17920669]
Mansoor et al. Page 9
J Infect Dis. Author manuscript; available in PMC 2010 February 02.
Europe PM
C Funders A
uthor Manuscripts
Europe PM
C Funders A
uthor Manuscripts

Figure 1.CD4 T cell cytokine responses induced by incubation of whole blood with BCG, asmeasured by flow cytometry. (A-D) Absolute (abs.) cytokine-producing CD4 T cellnumbers (no.) in the three infant groups. Background values (unstimulated blood) weresubtracted for each measurement. (A) Total cytokine response at each time point post-vaccination. (B-D) Total IFN-γ-producing CD4 T cells (B), total IL-2-producing CD4 Tcells (C) and total TNF-α-producing CD4 T cells (D), in each infant, at each time point. Thenumbers of HIV-infected, Exposed HIV− and Unexposed HIV− infants per group for thisanalysis were: 15, 25 and 22 at 3 months; 9, 17 and 21 at 6 months; 8, 15 and 21 at 9months; and 5, 12 and 17 at 12 months, respectively. For each boxplot, the median isrepresented by the horizontal line, the interquartile range by the box and the range by thewhiskers. Comparisons (p values) were calculated from mixed effects maximum likelihoodregression models on log-transformed responses that also included time as a continuouseffect (Table 2 and Suppl. Fig. 3).
Mansoor et al. Page 10
J Infect Dis. Author manuscript; available in PMC 2010 February 02.
Europe PM
C Funders A
uthor Manuscripts
Europe PM
C Funders A
uthor Manuscripts
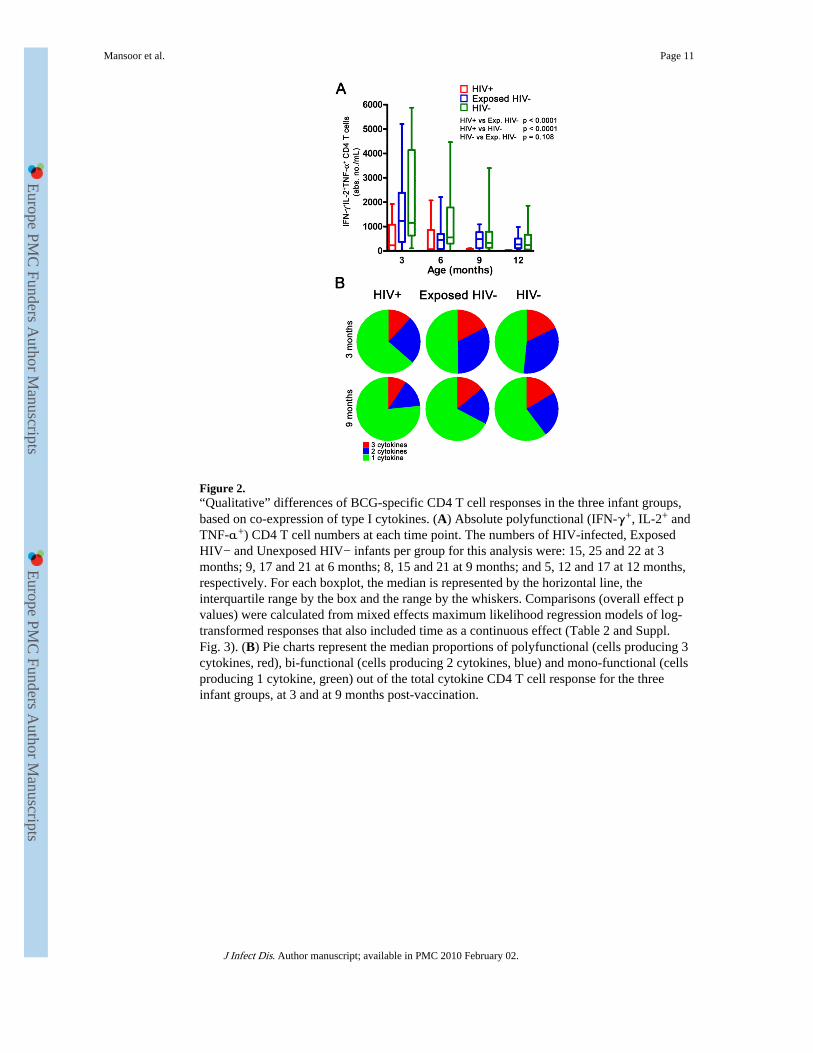
Figure 2.“Qualitative” differences of BCG-specific CD4 T cell responses in the three infant groups,based on co-expression of type I cytokines. (A) Absolute polyfunctional (IFN-γ+, IL-2+ andTNF-α+) CD4 T cell numbers at each time point. The numbers of HIV-infected, ExposedHIV− and Unexposed HIV− infants per group for this analysis were: 15, 25 and 22 at 3months; 9, 17 and 21 at 6 months; 8, 15 and 21 at 9 months; and 5, 12 and 17 at 12 months,respectively. For each boxplot, the median is represented by the horizontal line, theinterquartile range by the box and the range by the whiskers. Comparisons (overall effect pvalues) were calculated from mixed effects maximum likelihood regression models of log-transformed responses that also included time as a continuous effect (Table 2 and Suppl.Fig. 3). (B) Pie charts represent the median proportions of polyfunctional (cells producing 3cytokines, red), bi-functional (cells producing 2 cytokines, blue) and mono-functional (cellsproducing 1 cytokine, green) out of the total cytokine CD4 T cell response for the threeinfant groups, at 3 and at 9 months post-vaccination.
Mansoor et al. Page 11
J Infect Dis. Author manuscript; available in PMC 2010 February 02.
Europe PM
C Funders A
uthor Manuscripts
Europe PM
C Funders A
uthor Manuscripts

Figure 3.BCG-specific IFN-γ CD8 T cell responses. Background values were subtracted andobserved responses are shown as absolute counts (A) and as frequencies (B). For (A),comparisons (overall effect p values tabulated) were calculated from mixed effectsmaximum likelihood regression models of log-transformed responses that also included timeas a continuous effect (Table 2). The numbers of HIV-infected, Exposed HIV− andUnexposed HIV− infants per group for this analysis were: 15, 25 and 22 at 3 months; 9, 17and 21 at 6 months; 8, 15 and 21 at 9 months; and 5, 12 and 17 at 12 months, respectively.For (B), differences between groups were assessed by the Kruskal-Wallis test (overalleffect) and the Mann Whitney U test (p-values are tabulated below each plot). The numbersof HIV-infected, Exposed HIV− and Unexposed HIV− infants per group for this analysiswere: 19, 25 and 23 at 3 months; 12, 17 and 22 at 6 months; 8, 15 and 22 at 9 months; and 5,12 and 17 at 12 months, respectively. Please refer to Materials and Methods for differentstatistical methods used for absolute number data and frequency data. IL-2 and TNF-α-expressing CD8 T cells are not shown because the detected frequencies were very low.
Mansoor et al. Page 12
J Infect Dis. Author manuscript; available in PMC 2010 February 02.
Europe PM
C Funders A
uthor Manuscripts
Europe PM
C Funders A
uthor Manuscripts

Figure 4.Levels of soluble cytokines in plasma from whole blood stimulated with BCG for 7 hours.IFN-γ (A), IL-2 (B) and TNF-α (C) were quantified by ELISA and background values(unstimulated blood) subtracted. For A, the numbers of HIV-infected, Exposed HIV− andUnexposed HIV− infants per group were: 14, 21 and 20 at 3 months; 11, 18 and 20 at 6months; 8, 17 and 19 at 9 months; and 5, 14 and 16 at 12 months, respectively. For B, thenumbers were: 14, 20 and 21 at 3 months; 10, 17 and 20 at 6 months; 8, 16 and 20 at 9months; and 5, 13 and 16 at 12 months, respectively. For C, the numbers were: 14, 21 and20 at 3 months; 11, 18 and 20 at 6 months; 8, 17 and 20 at 9 months; and 5, 14 and 17 at 12months, respectively. Differences between groups were assessed by the Kruskal-Wallis test(overall effect) and the Mann Whitney U test (p-values are tabulated to the right of eachplot).
Mansoor et al. Page 13
J Infect Dis. Author manuscript; available in PMC 2010 February 02.
Europe PM
C Funders A
uthor Manuscripts
Europe PM
C Funders A
uthor Manuscripts

Europe PM
C Funders A
uthor Manuscripts
Europe PM
C Funders A
uthor Manuscripts
Mansoor et al. Page 14
Tabl
e 1
Dif
fere
nces
in a
bsol
ute
T c
ell r
espo
nses
bet
wee
n in
fant
gro
ups
estim
ated
fro
m m
ixed
eff
ects
max
imum
like
lihoo
d re
gres
sion
mod
els
(ove
rall
effe
ct)
Abs
olut
e co
unts
Abs
olut
e co
unts
, adj
uste
d fo
r C
D4
or C
D8
coun
t
Cel
l sub
set
Gro
ups
Dif
fere
nce
Est
imat
eaL
ower
CIb
Upp
er C
Ip-
valu
eD
iffe
renc
eE
stim
ate
Low
er C
IU
pper
CI
p-va
lue
Tot
al C
D4
cyto
kine
resp
onse
Exp
. HIV
− v
s H
IV+
4.09
22.
289
7.31
5<
0.00
013.
155
1.80
05.
529
<0.
0001
HIV
− v
s H
IV+
5.47
93.
053
9.83
6<
0.00
013.
762
2.09
86.
746
<0.
0001
HIV
− v
s E
xp. H
IV−
1.33
90.
815
2.19
80.
249
1.19
20.
748
1.90
00.
459
Tot
al I
FN-γ
CD
4 re
spon
seE
xp. H
IV−
vs
HIV
+6.
056
2.93
912
.478
<0.
0001
4.58
62.
232
9.42
2<
0.00
01
HIV
− v
s H
IV+
8.62
84.
166
16.9
12<
0.00
015.
783
2.74
012
.207
<0.
0001
HIV
− v
s E
xp. H
IV−
1.42
50.
772
2.69
40.
258
1.26
10.
695
2.28
90.
445
Tot
al I
L-2
CD
4re
spon
seE
xp. H
IV−
vs
HIV
+4.
187
2.17
78.
053
<0.
0001
3.14
21.
670
5.91
8<
0.00
01
HIV
− v
s H
IV+
6.50
13.
374
12.5
28<
0.00
014.
267
2.21
08.
248
<0.
0001
HIV
− v
s E
xp. H
IV−
1.55
30.
895
2.69
40.
118
1.35
80.
808
2.28
00.
248
Tot
al T
NF-α
CD
4 re
spon
seE
xp. H
IV−
vs
HIV
+3.
979
2.16
87.
308
<0.
0001
3.12
41.
726
5.64
6<
0.00
01
HIV
− v
s H
IV+
6.06
83.
294
11.1
79<
0.00
014.
259
2.29
87.
893
<0.
0001
HIV
− v
s E
xp. H
IV−
1.52
50.
908
2.55
70.
111.
363
0.83
42.
230
0.21
6
IFN
-γ+IL
-2+
TN
F-α
+ C
D4
resp
onse
Exp
. HIV
− v
s H
IV+
7.53
83.
099
18.3
38<
0.00
015.
371
2.23
912
.884
<0.
0001
HIV
− v
s H
IV+
14.0
695.
737
34.5
01<
0.00
018.
645
3.48
021
.477
<0.
0001
HIV
− v
s E
xp. H
IV−
1.86
60.
872
4.00
30.
108
1.60
80.
775
3.34
00.
202
Tot
al I
FN-γ
CD
8 re
spon
seE
xp. H
IV−
vs
HIV
+3.
190
1.13
58.
944
0.02
83.
209
1.05
99.
728
0.03
9
HIV
− v
s H
IV+
2.86
61.
029
7.98
00.
044
2.87
21.
020
7.46
30.
046
HIV
− v
s E
xp. H
IV−
0.89
90.
380
2.12
50.
808
0.89
50.
364
2.20
10.
810
a Rat
io o
f m
eans
bet
wee
n in
fant
gro
ups
b conf
iden
ce in
terv
al o
f di
ffer
ence
rat
io.
J Infect Dis. Author manuscript; available in PMC 2010 February 02.

Europe PM
C Funders A
uthor Manuscripts
Europe PM
C Funders A
uthor Manuscripts
Mansoor et al. Page 15
Table 2
Participant numbers
Age (months) 3 6 9 12
HIV-infected 20 12 8 5
Exposed HIV- 25 17 15 12
Unexposed HIV- 23 22 22 19
J Infect Dis. Author manuscript; available in PMC 2010 February 02.
Copyright © 2022 FDOKUMEN