Streamlined life cycle assessment of residue utilization options in Tongkat Ali (Eurycoma...
10
Streamlined life cycle assessment of residue utilization options in Tongkat Ali (Eurycoma longifolia) water extract manufacturing process Choon Keat Kuan Dominic Chwan Yee Foo Raymond R. Tan Sivakumar Kumaresan Ramlan Abdul Aziz Received: 18 May 2006 / Accepted: 26 January 2007 / Published online: 22 February 2007 Ó Springer-Verlag 2007 Abstract Life cycle assessment (LCA) is often used to compare alternative process options in terms of their overall impact on the environment to easily identify the most environmentally friendly alternative. In this work, a streamlined LCA study was conducted to as- sess three different residue utilization schemes for Tongkat Ali (Eurycoma longifolia) extract production. The case study was firstly simulated using a batch process simulation software. The results of mass and energy balances obtained from the simulation software were then subjected to life cycle analysis. By evaluating the different schemes for using the fibrous residue from the extraction process, the potential for environmental process improvement was identified. Overall, use of the residue as process fuel was found to be the most environmentally friendly option. It produces the least emissions and reduces resource usage per unit of product than the other options evaluated. Keywords Life cycle assessment Life cycle inventory Phytochemicals Tongkat Ali Herbal water extract production Introduction The herbal-based phytochemical industry is a new and upcoming industrial sector in Southeast Asian countries such as Malaysia. One of the important phytochemicals in the Malaysian market is Eurycoma longifolia (more com- monly known as Tongkat Ali), which is traditionally used for its aphrodisiac, anti-pyretic and anti-malarial effects; it is also consumed as a general tonic (Kuo et al 2003; Aziz et al. 2003, 2005). The decoction of its long, woody root is taken orally to achieve these effects; it is also mixed with conventional food and beverage products as a nutritional additive. The benefits of the roots of Tongkat Ali include restoring energy and vitality, and enhancing blood flow and functioning after child birth (Ismail et al. 1999). The leaves are used as a cure for malaria, ulcers, syphilis and gonorrhea, gum diseases, and insect bites (Adenan 2003). Due to the high market demand and these medicinal effects, this phytochemical product has a high commercial value in the Malaysian market (Aziz et al. 2003). C. K. Kuan Chemical Engineering Department, Universiti Teknologi Malaysia, 81310 Skudai, Johor, Malaysia e-mail: [email protected] D. C. Y. Foo School of Chemical and Environmental Engineering, University of Nottingham Malaysia, Broga Road, 43500 Semenyih, Selangor, Malaysia e-mail: [email protected] R. R. Tan (&) Chemical Engineering Department, De La Salle University-Manila, 2401 Taft Avenue, 1004 Manila, Philippines e-mail: [email protected] S. Kumaresan Chemical Engineering Programme, School of Engineering and Information Technology, Universiti Malaysia Sabah, Locked Bag 2073, 88999 Kota Kinabalu, Malaysia e-mail: [email protected] R. A. Aziz Chemical Engineering Pilot Plant, Universiti Teknologi Malaysia, 81310 Skudai, Johor, Malaysia e-mail: [email protected]
-
Upload
independent -
Category
Documents
-
view
0 -
download
0
Transcript of Streamlined life cycle assessment of residue utilization options in Tongkat Ali (Eurycoma...

Streamlined life cycle assessment of residue utilization options inTongkat Ali (Eurycoma longifolia) water extract manufacturingprocess
Choon Keat Kuan Æ Dominic Chwan Yee Foo ÆRaymond R. Tan Æ Sivakumar Kumaresan ÆRamlan Abdul Aziz
Received: 18 May 2006 / Accepted: 26 January 2007 / Published online: 22 February 2007� Springer-Verlag 2007
Abstract Life cycle assessment (LCA) is often used
to compare alternative process options in terms of their
overall impact on the environment to easily identify
the most environmentally friendly alternative. In this
work, a streamlined LCA study was conducted to as-
sess three different residue utilization schemes for
Tongkat Ali (Eurycoma longifolia) extract production.
The case study was firstly simulated using a batch
process simulation software. The results of mass and
energy balances obtained from the simulation software
were then subjected to life cycle analysis. By evaluating
the different schemes for using the fibrous residue from
the extraction process, the potential for environmental
process improvement was identified. Overall, use of
the residue as process fuel was found to be the most
environmentally friendly option. It produces the least
emissions and reduces resource usage per unit of
product than the other options evaluated.
Keywords Life cycle assessment � Life cycle
inventory � Phytochemicals � Tongkat Ali � Herbal
water extract production
Introduction
The herbal-based phytochemical industry is a new and
upcoming industrial sector in Southeast Asian countries
such as Malaysia. One of the important phytochemicals in
the Malaysian market is Eurycoma longifolia (more com-
monly known as Tongkat Ali), which is traditionally used
for its aphrodisiac, anti-pyretic and anti-malarial effects; it
is also consumed as a general tonic (Kuo et al 2003; Aziz
et al. 2003, 2005). The decoction of its long, woody root is
taken orally to achieve these effects; it is also mixed with
conventional food and beverage products as a nutritional
additive. The benefits of the roots of Tongkat Ali include
restoring energy and vitality, and enhancing blood flow
and functioning after child birth (Ismail et al. 1999). The
leaves are used as a cure for malaria, ulcers, syphilis and
gonorrhea, gum diseases, and insect bites (Adenan 2003).
Due to the high market demand and these medicinal
effects, this phytochemical product has a high commercial
value in the Malaysian market (Aziz et al. 2003).
C. K. KuanChemical Engineering Department,Universiti Teknologi Malaysia,81310 Skudai, Johor, Malaysiae-mail: [email protected]
D. C. Y. FooSchool of Chemical and Environmental Engineering,University of Nottingham Malaysia, Broga Road,43500 Semenyih, Selangor, Malaysiae-mail: [email protected]
R. R. Tan (&)Chemical Engineering Department,De La Salle University-Manila,2401 Taft Avenue, 1004 Manila, Philippinese-mail: [email protected]
S. KumaresanChemical Engineering Programme,School of Engineering and Information Technology,Universiti Malaysia Sabah, Locked Bag 2073,88999 Kota Kinabalu, Malaysiae-mail: [email protected]
R. A. AzizChemical Engineering Pilot Plant,Universiti Teknologi Malaysia,81310 Skudai, Johor, Malaysiae-mail: [email protected]

However, a common pitfall associated with the
phytochemical sector is that the production of phyto-
chemicals (including Tongkat Ali water extract) is
mainly carried out through various traditional pro-
cesses, which often lead to high losses and low product
yield. This also leads to the common perception that
phytochemical processing is technologically backward
industrial sector. Hence more effort is needed to de-
velop this industry into a viable and profitable eco-
nomic sector (Aziz et al. 2005). In the area of process
design, some efforts in phytochemical processing have
been explored recently using flowsheet synthesis
(Harjo et al. 2004), as well as process modelling and
optimisation (Athimulam et al. 2006).
In addition to optimizing the profitability of the
production process, environmental considerations are
becoming increasingly important as the scale of phy-
tochemical production grows. Life cycle assessment
(LCA) is a systematic method for assessing the
environmental impacts of a product through all of its
life cycle stages, from extraction and processing of
raw materials, to manufacturing, transportation, dis-
tribution, maintenance, reuse and recycling, and the
final disposal (Curran 1996; ISO 1997, 1998, 2000a, b).
In recent years LCA has been commonly accepted for
analysing the environmental impacts of products
(Bishop 2000). The LCA methodology has four
components: goal and scope definition, life cycle
inventory analysis (LCI), impact assessment (LCIA),
and interpretation (previously known as improvement
analysis). A full life cycle assessment includes each of
the four components (Curran 1996). Streamlined or
simplified LCA has also become a commonly used
tool in many practical applications where full LCA is
deemed too time-consuming to implement (Graedel
1998).
In this paper, a streamlined LCA study was con-
ducted to quantify and compare the comprehensive
sets of environmental flows over three different
schemes for utilizing the residues of Tongkat Ali water
extract production. Mass and energy balances of the
process streams used for the LCI were extracted from
process simulations. The database for different manu-
facturing alternatives was collected and then used as
inputs in an LCA model. The assessment focuses on
alternatives for the utilization of the fibrous residue
from the water extraction process.
Case study
Figure 1 shows the process flow diagram of a semi-
industrial scale production of Eurycoma longifolia
water extract at Chemical Engineering Pilot Plant
(CEPP), Universiti Teknologi Malaysia (UTM). The
two main processing steps in this water extract pro-
duction consist of the two-stage counter-current solid–
liquid extraction (leaching) process and the spray
drying operation. The current process is operated with
a batch size of 40 kg of ground Tongkat Ali root, which
is supplied in chip form.
In the first processing step, the two-stage counter-
current solid–liquid extraction (leaching) process,
freshly ground Tongkat Ali root chips are sent to the
extraction vessel to be extracted using the hot water as
solvent. The ratio of water volume to the root chips
weight is maintained at 6 l/kg. In the first stage of
extraction, Tongkat Ali chips are boiled with fresh
water or recycled water at a temperature range of 110–
120�C. This elevated temperature is maintained for 2 h
to provide sufficient time for the phytochemicals in the
root chips to be leached into the extraction solvent.
Upon the completion of the first stage of extraction,
the extracted liquid is pumped out of the extractor and
stored in a holding tank, to be sent later for spray
drying. The leftover chips are then extracted using
fresh solvent in the second stage of extraction, fol-
lowing the same operating conditions as in the first
extraction stage. After the second extraction stage, the
solvent is removed and stored for reuse in the sub-
sequent batch; the leftover chips are then discharged.
Approximately 35% of the solvent water is trapped in
the discharged wet chips; this entrained liquid is rich in
phytochemicals and thus constitutes a significant
process loss.
The liquid extract is then spray dried at 170�C to
yield a powdered concentrate. Due to the limitation of
the existing spray drier capacity, which has a liquid
feed rate of 7 l/h, the drying operation for one batch
takes approximately 22 h to complete. Spray drying is
widely used in most herbal-based phytochemical pro-
cessing to produce extract powders, mainly due to its
relatively shorter process time and favourable process
economics, as compared to other product drying
techniques such as freeze drying. In the current pro-
duction scheme, the spray dried extract powder is sold
as the final product in bulk form.
In this semi-industrial scale production, the overall
process-yield of Tongkat Ali extract is approximately
3% of the raw material feed by weight. Hence, signif-
icant quantities of fibrous residues are generated,
which at the moment present disposal difficulties.
Utilization of the residue can potentially make the
process more economically viable, either by generating
additional products or by displacing the demand for
external resources during operation. Rigorous simula-
tion studies have been performed based on the pilot
scale production with three scenarios to enable a
comparative LCA study to be carried out.
Methodology
Goal definition
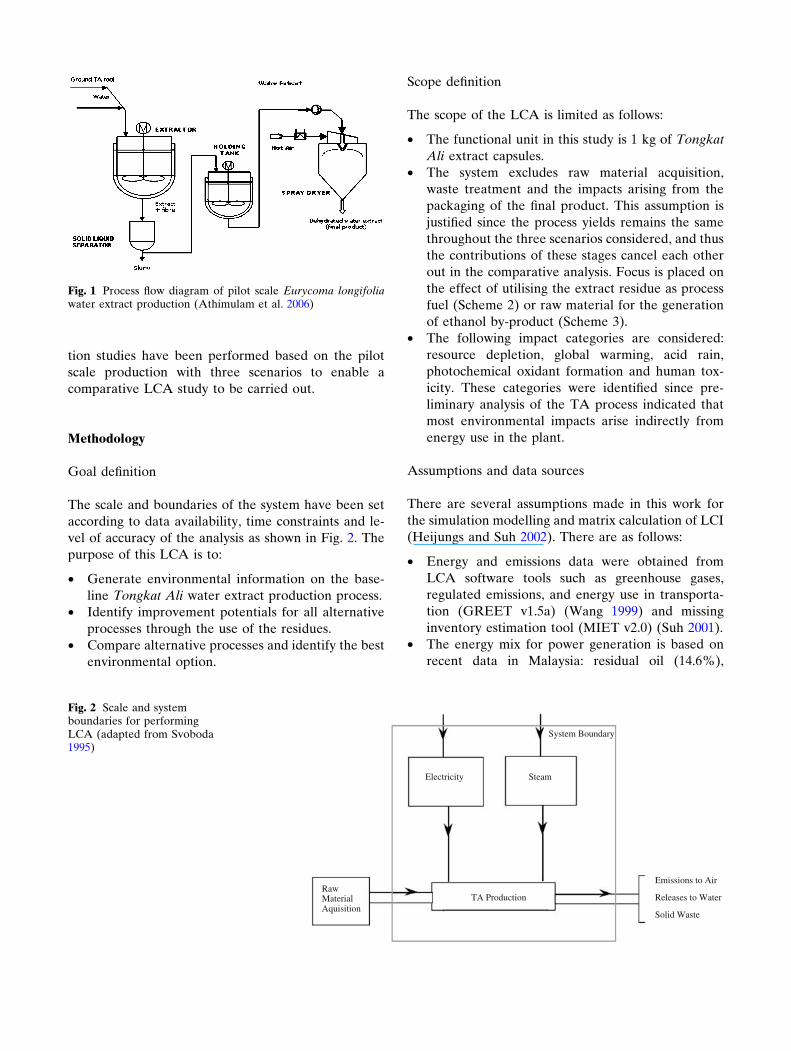
The scale and boundaries of the system have been set
according to data availability, time constraints and le-
vel of accuracy of the analysis as shown in Fig. 2. The
purpose of this LCA is to:
• Generate environmental information on the base-
line Tongkat Ali water extract production process.
• Identify improvement potentials for all alternative
processes through the use of the residues.
• Compare alternative processes and identify the best
environmental option.
Scope definition
The scope of the LCA is limited as follows:
• The functional unit in this study is 1 kg of Tongkat
Ali extract capsules.
• The system excludes raw material acquisition,
waste treatment and the impacts arising from the
packaging of the final product. This assumption is
justified since the process yields remains the same
throughout the three scenarios considered, and thus
the contributions of these stages cancel each other
out in the comparative analysis. Focus is placed on
the effect of utilising the extract residue as process
fuel (Scheme 2) or raw material for the generation
of ethanol by-product (Scheme 3).
• The following impact categories are considered:
resource depletion, global warming, acid rain,
photochemical oxidant formation and human tox-
icity. These categories were identified since pre-
liminary analysis of the TA process indicated that
most environmental impacts arise indirectly from
energy use in the plant.
Assumptions and data sources
There are several assumptions made in this work for
the simulation modelling and matrix calculation of LCI
(Heijungs and Suh 2002). There are as follows:
• Energy and emissions data were obtained from
LCA software tools such as greenhouse gases,
regulated emissions, and energy use in transporta-
tion (GREET v1.5a) (Wang 1999) and missing
inventory estimation tool (MIET v2.0) (Suh 2001).
• The energy mix for power generation is based on
recent data in Malaysia: residual oil (14.6%),
Fig. 1 Process flow diagram of pilot scale Eurycoma longifoliawater extract production (Athimulam et al. 2006)
RawMaterial Aquisition
TA Production
Electricity Steam
Emissions to Air
Releases to Water
Solid Waste
System Boundary
Fig. 2 Scale and systemboundaries for performingLCA (adapted from Svoboda1995)

natural gas (56.5%), coal (17.5%) and others
(11.4%), and transmission losses are estimated at
10.0% (Energy Commission of Malaysia 2003).
• The model assumes 100% Tongkat Ali residue
utilisation for steam generation (Scheme 2).
• Energy consumption and environmental air and
water emissions are the only consideration of the
inventory.
• Mean values for conversion efficiencies, heating
values and other inputs used in the model were
based on SuperPro Designer v6.0 (Intelligen 2005),
technical publications and industry average values
from literature.
LCA model
The general equations for LCIA as described by Hei-
jungs and Suh (2002) are as follows:
P ¼ A
B
� �ð1Þ
s ¼ A�1f ð2Þ
g ¼ Bs ð3Þ
where:
P Process matrix
A Technology matrix indicating the flow of economic
commodities
B Intervention matrix indicating the flow of natural
resources or emissions
s Scaling vector
f Final demand vector indicating the functional unit
of the system
g Inventory vector indicating the environmental
flows per functional unit.
The impact characterisation equation (Heijungs and
Suh 2002) is:
h ¼ Qg ð4Þ
where:
Q Characterisation matrix indicating the relative
strengths of the environmental flows with respect
to each impact category
h Impact vector indicating the environmental
impacts per functional unit.
This generic LCA model can be implemented in
different software environments, such as the purpose-
built LCA program CMLCA (Heijungs and Suh 2002).
In this study, the model was developed entirely in a
spreadsheet environment using Excel.
Results and discussion
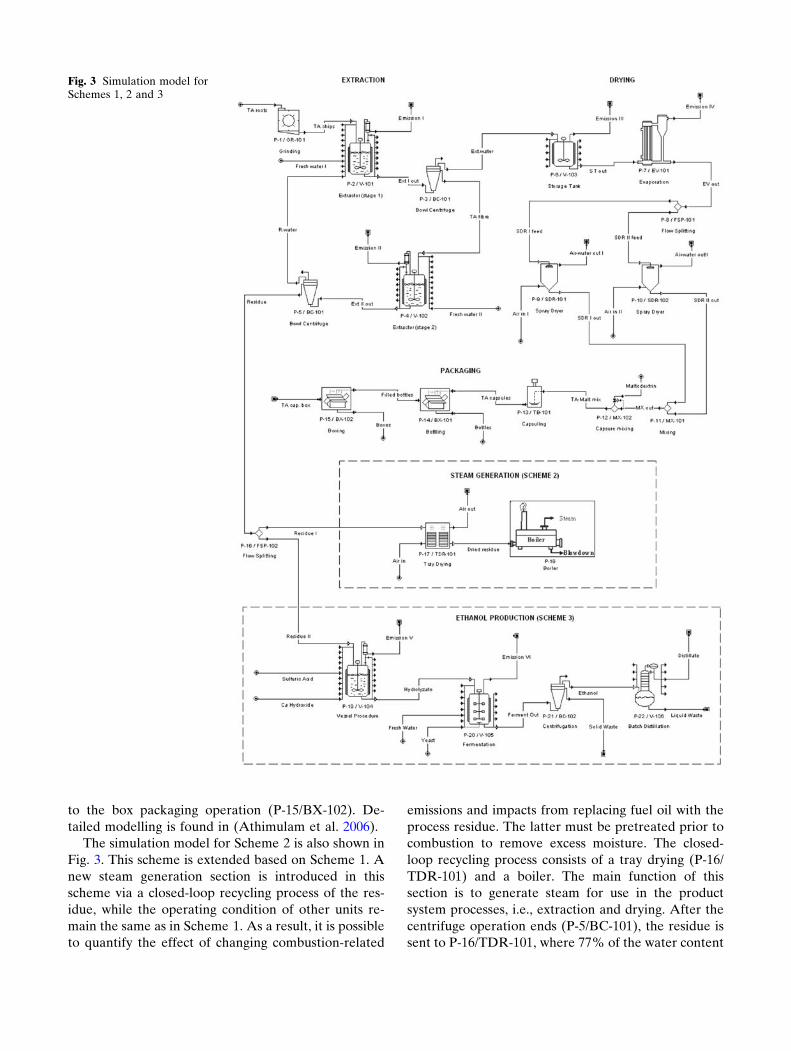
Figure 3 shows the simulation model for a combination
of three schemes for the case study. Due to the batch
operation of the process, a batch simulator software,
SuperPro Designer v6.0 (Intelligen 2005), was used to
model the process. The modelling of each scheme is
described next.
Scheme 1 is adapted from Athimulam et al. (2006)
as the optimal production scheme of the original pro-
cess. A grinder P-1 (with grinder GR-101) is used to
reduce 40 kg of Tongkat Ali root (denoted as ‘TA
roots’) into chips which are the feed of the extract
production. The extraction procedure in P-2 using the
charging of ground TA chips, deionised water as
extraction solvent (consists of recycle water, i.e., ‘R.
water’ from the second extraction stage and 30 l of
fresh water) and heating of mixture to 110�C. This is
followed by an extraction operation that runs for 2 h.
Based on the product yield of 3.0 wt%, Tongkat Ali
extract produced in the extraction vessel was deter-
mined as 1.2 kg per batch. About 150 kg of fibrous
residue is produced at the same time; the utilization of
this waste is studied in Schemes 2 and 3, which are
discussed in subsequent sections.
Upon the completion of the extraction process, the
resulting mixture is sent to the bowl centrifuge (P-3/
BC-101) where all Tongkat Ali fibre (‘TA fibre’) are
removed. The remaining extract–water mixture (de-
noted as ‘Ext. water’) is transferred to storage tank P-6
(in vessel V-103). The separated solids from P-3 are
transferred into P-4/V-102 to undergo the second
extraction stage (same operating condition as in P-2/V-
101) with 240 l of fresh water feed. Product yield at this
stage is assumed at 1% of original feed. The effluent
from vessel procedure P-4 is separated by P-5 (same
operating condition as in P-3/BC-101). The extract
water leaving P-5 is recycled to P-1 while the solid
content leaves as process residue.
In the drying section, the stored extract–water mix-
ture in P-6/V-103 is sent to an evaporator (P-7/EV-101)
prior to two parallel spray-drying processes (P-9/SDR-
101 and P-10/SDR-101). Ambient air is heated to
170�C before it is used as drying medium in the spray
dryers. Hot air and evaporated water vapour is emitted
with 1% extract loss; while TA powder leaves at the
bottom at 70�C.
In the packaging section, the Tongkat Ali extract
powder from the spray driers is mixed with maltodex-
trin (in P-12/MX-102) and made into capsules with
450 mg extract powder each. The capsules produced
are then put into plastic bottles (P-14/BX-101) and sent
to the box packaging operation (P-15/BX-102). De-
tailed modelling is found in (Athimulam et al. 2006).
The simulation model for Scheme 2 is also shown in
Fig. 3. This scheme is extended based on Scheme 1. A
new steam generation section is introduced in this
scheme via a closed-loop recycling process of the res-
idue, while the operating condition of other units re-
main the same as in Scheme 1. As a result, it is possible
to quantify the effect of changing combustion-related
emissions and impacts from replacing fuel oil with the
process residue. The latter must be pretreated prior to
combustion to remove excess moisture. The closed-
loop recycling process consists of a tray drying (P-16/
TDR-101) and a boiler. The main function of this
section is to generate steam for use in the product
system processes, i.e., extraction and drying. After the
centrifuge operation ends (P-5/BC-101), the residue is
sent to P-16/TDR-101, where 77% of the water content
Fig. 3 Simulation model forSchemes 1, 2 and 3

in the TA fibre is removed. Residue leaves the tray
dryer with a moisture content of approximately 40%.
TA fibre calorific value is taken as 10.4 MJ/kg based on
values for biomass such as wood chips; thus, the fuel
energy available in the 150 kg of residue per batch is
about 1,500 MJ.
Last section of Fig. 3 shows the model for Scheme 3.
This scheme is also extended based on Scheme 1. In-
stead of recycling residue for stream co-production in
Scheme 2, Tongkat Ali waste from the centrifuge is
used as feedstock in the newly introduced ethanol
production section. Each batch generates 150 kg of
residue, from which 15.8 kg of ethanol can be pro-
duced be decomposing the cellulose into fermentable
sugars and subsequently fermenting these into alcohol.
There is considerable interest in ethanol as a gasoline
additive or substitute, as demonstrated by a large
number of assessments done on its life cycle in recent
years (von Blottnitz and Curran 2006). The main aim
of this scheme is to produce value-added product while
minimising the solid disposal. The second product
considered is ethanol, which can displace usage of
imported ethanol. Potential reductions in emissions
and impacts are possible through displacement of
conventional, external ethanol production processes,
which is assumed to use grains such as corn (Heijungs
and Suh 2002). Inventory data for the displaced etha-
nol production process are derived from the GREET
1.5a model (Wang 1999). This section consists of four
unit processes, i.e., storage vessel (P-16/V-104), fer-
mentation (P-17/V-105), centrifugation (P-18/BC-102)
and batch distillation (P-19/V-106). The product of this
new section is ethanol of 95% purity, produced via the
fermentation of yeast in a bioreactor.
After the centrifuge operation ends in the bowl
centrifuge (P-5/BC-101), the residue is transferred
into the vessel procedure (P-16/V-104) to be heated to
140�C prior to the acid hydrolysis reaction with sul-
phuric acid (H2SO4). It is next cooled to 37�C before
neutralisation with lime (CaOH) takes place. The
vessel mixture is then sent to a fermentation proce-
dure (P-17/V-105) with yeast. Upon completion of the
fermentation process, the slurry content of procedure
P-17 is passed through a bowl centrifuge (P-18/BC-
102) where it is separated into ethanol and water
mixture from the process residue (mainly consists of
CaOH, CaSO4, hydrolyzate, water and yeast). The
ethanol and water mixture is sent for batch distillation
(P-19/V-106) while the process residue leaves as solid
waste. In the batch distillation, the distillate produced
is ethanol of approximately 95% purity. Liquid waste
effluent consists of water with trace amounts of
CaOH and ethanol.
LCA results and discussion
The mathematical model previously described is coded
in MS Excel for LCA computations. LCI is used to
quantify resources and environmental flows for the
entire life cycle of a product. The method creates a
basis to evaluate comparative environmental impacts
or potential improvements of different alternative
manufacturing routes. Table 1 shows the inventory
vectors (matrix g) of Schemes 1, 2 and 3. Values en-
closed in parentheses indicate negative flows, which are
interpreted either as inputs of resources, or as avoided
emissions from displaced processes (Heijungs and Suh
2002). Tables 2, 3 and 4 show the contributions of the
process or life cycle stages in Schemes 1, 2 and 3,
respectively, to the total inventory results. In all cases,
the drying and packaging processes do not contribute
to any direct emissions, so these processes are excluded
from the table. Their indirect effects are, however,
reflected as additional energy consumption in the
electricity and steam generation processes. Note that
the main benefit derived from Scheme 2, which uses
the fibrous residue as process fuel, lies in displacing
emissions that would otherwise result from burning
fuel oil in an industrial boiler. These displaced emis-
sions are reflected by negative values in the column
‘‘Steam generation’’ in Table 3 for most of the air
emissions. As a result, Scheme 2 generates reduced
total air emissions compared to Scheme 1, except for
N2O. In comparison, Scheme 3, which utilizes the fi-
brous residue for cellulosic ethanol production, dis-
places emissions resulting from conventional (grain-
based) ethanol production, found in the last column
labelled of Table 4. This benefit is achieved at the ex-
pense of added steam demand for the entire process,
Table 1 Inventory results of each scheme
Resource or emission Scheme 1 Scheme 2 Scheme 3
Fresh water (kg) (32.55) (50.43) (171.92)Residue (kg) 13.52 0 0Root (kg) (3.56) (3.56) (3.56)Oil (MJ) (34.71) 3.18 852.10Coal + gas (MJ) (47.32) (47.32) 1,676.13VOC (g) 0.12 0.40 (3.97)CO (g) 1.30 2.85 (10.87)NOx (g) 9.50 6.14 26.61PM10 (g) 0.47 0.65 0.92SOx (g) 7.27 2.72 16.34CH4 (g) 0.16 0.26 (22.59)N2O (g) 0.05 0.27 (1.93)CO2 (kg) 5.96 2.99 20.74Solid waste (kg) 0 0 25.41Liquid waste (kg) 0 0 151.73

with corresponding increases in internal fuel oil con-
sumption. However, the added fuel usage within the
plant is offset by the corresponding reductions in fuel
inputs for the energy-intensive production of grain-
based ethanol. Hence, there are mixed results with
respect to air emissions, with some increasing and
others decreasing. It should be noted, however, that
such results remain highly dependent on the assump-
tions regarding conventional ethanol production. In
Scheme 3, the major environmental disadvantage ap-
pears to be the increased consumption of fresh water,
coupled with large amounts of wastewater and solid
residue from the ethanol production process. This re-
sult may be particularly critical in locations where
water availability is a problem, or where government
effluent regulations are particularly stringent. The re-
sults imply that the choice between Schemes 2 and 3
depends on the prioritization between air and liquid
emissions, which will vary depending on plant location.
Characterisation factors for air emissions are given
in Table 5; the impacts arising from these air emissions
from the system are given in Table 6. It can be seen
that both Schemes 2 and 3 significantly reduce impacts
on the environment compared to the baseline case.
Significant emissions are avoided by displacing exter-
nal power generation in Scheme 2 and conventional
ethanol production in Scheme 3. Scheme 2 is the best
in terms of acidification (AP), eutrophication (or
nitrification or EP) and human toxicity (HTP), while
Scheme 3 is the best in terms of global warming
(GWP) and photochemical ozone formation (POFP)
impacts. However, Scheme 3 is not fully optimized,
and further reductions in impact are possible by using
unfermented residue as fuel to meet the energy de-
mands of ethanol distillation; such a scenario can be
explored further in the future. Furthermore, a scenario
combining Schemes 2 and 3 can be explored as well.
For the resource usage, a positive value indicates
generation where as a negative value indicates con-
sumption. No residue is observed in Scheme 2 because
the residue has been burned to produce steam. Positive
values for oil flows indicate the amount of oil saved
from avoided energy use due to biomass utilization.
Fresh water consumption in Scheme 2 is higher than
that in Scheme 1. Overall, Schemes 2 and 3 both gen-
erate significant reductions in most emissions and im-
Table 2 Contribution ofprocesses in Scheme 1 toinventory results
Resource or emission Electricityproduction
Steamproduction
Preprocessing Extraction
Fresh water (kg) 0 (8.60) 0 (23.95)Residue (kg) 0 0 0 13.53Root (MJ) 0 0 (3.57) 0Oil (MJ) (10.71) (24.01) 0 0Coal + gas (MJ) (47.32) 0 0 0VOC (g) 0.11 0.02 0 0CO (g) 0.94 0.37 0 0NOx (g) 5.45 4.06 0 0PM10 (g) 0.34 0.14 0 0SO2 (g) 4.32 2.95 0 0CH4 (g) 0.09 0.07 0 0N2O (g) 0.05 0.01 0 0CO2 (kg) 4.08 1.88 0 0
Table 3 Contribution ofprocesses in Scheme 2 toinventory results
Resourceor emission
Electricityproduction
Steamproduction
Preprocessing Extraction Steam generationfrom residue
Fresh water (kg) 0 7.04 0 (23.95) (33.52)Root (MJ) 0 0 (3.57) 0 0Oil (MJ) (10.71) 13.89 0 0 0Coal + gas (MJ) (47.32) 0.00 0 0 0VOC (g) 0.11 (0.01) 0 0 0.30CO (g) 0.94 (0.21) 0 0 2.13NOx (g) 5.45 (2.35) 0 0 3.04PM10 (g) 0.34 (0.08) 0 0 0.40SO2 (g) 4.32 (1.71) 0 0 0.11CH4 (g) 0.09 (0.04) 0 0 0.22N2O (g) 0.05 0 0 0 0.23CO2 (kg) 4.08 (1.09) 0 0 0

pact categories. Use of the residue as either process
fuel or feedstock for ethanol production addresses
residue disposal problems; these schemes also reduce
emissions by displacing conventional processes for
steam generation and ethanol production, respectively.
Both residue utilization schemes increase the fresh
water usage, and production of ethanol results in added
liquid waste from the fermentation process. LCIA of
the gaseous emissions shows that use of the residue for
process heating has the lowest AP, EP and HTP while
ethanol production is the best in terms of GWP and
POFP. Tables 7, 8 and 9 show the contributions of the
different processes within the life cycle to impacts from
air emissions. It is evident that the major benefits ac-
crue mainly from the displacement of steam generation
using oil (in Scheme 2) and production of ethanol from
grain (in Scheme 3).
Conclusions
Three alternative Tongkat Ali process residue utiliza-
tion schemes were evaluated using streamlined LCA.
In addition to the baseline production scheme, use of
the fibrous residue as process fuel or feedstock for
ethanol production was simulated to determine the
most environment-friendly scheme. Each of the two
modified schemes presents its own environmental
Table 4 Contribution ofprocesses in Scheme 3 toinventory results
Resourceor emission
Electricityproduction
Steamproduction
Preprocessing Extraction Ethanolproductionfromresidue
Ethanolproduction byconventionalmethod
Fresh water (kg) 0 (17.59) 0 (23.95) (130.38) 0Root (MJ) 0 0 (3.57) 0 0 0Oil (MJ) (53.15) (48.45) 0 0 0 953.71Coal + gas (MJ) (234.96) 0 0 0 0 1,911.10VOC (g) 0.54 0.04 0 0 0 (4.55)CO (g) 4.66 0.74 0 0 0 (16.28)NOx (g) 27.04 8.18 0 0 0 (8.62)PM10 (g) 1.68 0.28 0 0 0 (1.04)SO2 (g) 21.46 5.95 0 0 0 (11.06)CH4 (g) 0.44 0.15 0 0 0 (23.18)N2O (g) 0.24 0.02 0 0 0 (2.19)CO2 (kg) 20.26 3.80 0 0 0 (3.31)Solid waste (kg) 0 0 0 0 25.42 0Liquid waste (kg) 0 0 0 0 151.74 0
Table 5 Characterisationfactors (Wenzel et al. 1997;Guinee 2002)
GWP (g CO2
eq. per g)AP (g SO2
eq. per g)POFP (g C2H4
eq. per g)EP (g NO3
–
eq. per g)HTP (m3 airper g)
VOC 3 0 0.5 0 2,500CO 2 0 0.03 0 830NOx 0 0.7 0.028 1.35 8,600PM10 0 0 0 0 6,667SOx 0 1 0.048 0 1,300CH4 21 0 0.007 0 0N2O 310 0 0 2.82 2,000CO2 1 0 0 0 0
Table 6 LCIA of each scheme
Scheme 1 Scheme 2 Scheme 3
GWP (g CO2 eq.) 29.73 99.37 (1,087.97)AP (g SO2 eq.) 13.92 7.03 34.97POFP (g C2H4 eq.) 0.72 0.59 (0.94)EP (g NO3
– eq.) 12.99 9.05 30.46HTP (m3 air) 95,881.76 64,616.72 233,402.42
Table 7 Processes contributing to impacts from air emissions inScheme 1
Electricityproduction
Steamproduction
GWP (g CO2 eq.) 22.96 6.77AP (g SO2 eq.) 8.13 5.79POFP (g C2H4 eq.) 0.44 0.28EP (g NO3
– eq.) 7.49 5.50HTP (m3 air) 55,861.99 40,019.77

advantages, as a result of emissions and impacts avoi-
ded by displacing fuel oil combustion in a boiler (for
Scheme 2) or ethanol production by conventional
means (for Scheme 3). Thus the final choice of optimal
utilization of the process residue will depend on the
priority placed on key environmental impact indicators
by plant management. For Scheme 2, the main benefits
lie in displacing the usage of fuel oil for steam gener-
ation, leading to potential direct emission reductions
within the plant itself. For Scheme 3, the advantage lies
in displacing ethanol production process emissions
outside the Tongkat Ali plant. As the commercial
production of ethanol from grains is highly energy-
intensive, this scheme also gives significant environ-
mental benefits. Its main drawback is the increase in
direct process wastes from producing ethanol from the
fibrous residue. These liquid and solid wastes may be a
significant limitation in many candidate plant locations
for Tongkat Ali processing. Thus Scheme 2 offers the
best environmental benefits among the alternatives
considered. However, it is technically possible to con-
sider additional schemes combining the best features of
the options studied thus far; and, economic consider-
ations will also play a role in determining the final
decision for a full-scale plant in the future.
References
Adenan MI (2003) Malaysian herbs and herbal products. In: Atwo and half day course of herbal and phytochemicalprocessing. CEPP short course notes (Chemical EngineeringPilot Plant, Universiti Teknologi Malaysia, Malaysia)
Allen DT, Shonnard DR (2002) Green engineering: environ-mentally conscious design of chemical processes. Prentice-Hall, NJ
Athimulam A, Kumaresan S, Foo DCY, Sarmidi MR, Aziz RA(2006) Modelling and optimisation of Eurycoma longifoliawater extract production. Food Bioprod Process 84:139–149
Aziz RA, Sarmidi MR, Kumaresan S, Taher ZM, Foo DCY(2003) Phytochemical processing: the next emerging field inchemical engineering—aspects and opportunities. J Ke-juruteraan Kimia Malaysia 3:45–60
Aziz RA, Sarmidi MR, Kumaresan S, Foo DCY (2005) Engi-neering aspects of herbal and phytochemical processing: aMalaysian perspective. Bull Inst Eng Malaysia Decemberissue:10–19
Bishop PL (2000) Pollution prevention: fundamentals andpractice. Mc-Graw Hill, New York
Curran MA (1996) Environmental life cycle assessment. Mc-Graw Hill New York
Energy Commission of Malaysia (2003) http://www.st.gov.my/(access September 2005)
Graedel TE (1998) Streamlined life-cycle assessment. Prentice-Hall, NJ
Guinee JB (ed) (2002) Handbook on life cycle assessment.Operational guide to the ISO Standards. Kluwer,Dordrecht
Harjo B, Wibowo C, Ng KM (2004) Development of naturalproduct manufacturing processes: phytochemical. Trans InstChem Eng A 82(A8):1010–1028
Harrison CL (1991) An overview of life cycle analysis. AIChEsecond topical conference on pollution prevention, August1991 PA, pp 196–199
Heijungs R, Suh S (2002) Computational structure of life cycleassessment. Kluwer, Dordrecht
Intelligen Inc. (2005) SuperPro Designer� User’s guide. ScotchPlains, NJ
Ismail Z, Ismail N, Lassa J (1999) Malaysian herbal monograph.Malaysian Monograph Committee, Kuala Lumpur
ISO 14040 (1997) Environmental management—life cycle assess-ment—principles and framework. Geneva
ISO 14041 (1998) Environmental management—life cycle assess-ment—goal and scope definition and inventory analysis.Geneva
ISO 14042 (2000a) Environmental management—life cycleassessment—life cycle impact assessment. Geneva
ISO 14043 (2000b) Environmental management—life cycleassessment—life cycle interpretation. Geneva
Table 8 Processescontributing to impacts fromair emissions in Scheme 2
Electricityproduction
Steamproduction
Steam productionusing residue
GWP (g CO2 eq.) 22.96 (3.92) 80.33AP (g SO2 eq.) 8.13 (3.35) 2.24POFP (g C2H4 NO3
– eq.) 0.44 (0.16) 0.31EP (g NO3
– eq.) 7.49 (3.18) 4.75HTP (m3 air) 55,861.99 (23,155.44) 31,910.18
Table 9 Processescontributing to impacts fromair emissions in Scheme 3
Electricityproduction
Steamproduction
Conventionalethanol production
GWP (g CO2 eq.) 113.99 13.66 (1,215.62)AP (g SO2 eq.) 40.39 11.68 (17.09)POFP (g C2H4 eq.) 2.20 0.56 (3.70)EP (g NO3
– eq.) 37.18 11.09 (17.81)HTP (m3 air) 277,360.96 80,757.82 (124,716.36)

Kaur I, Kumaresan S, Sarmidi MR (2003) A study into the effectof laboratory scale processing parameters and scale up onEurycoma longifolia water extract yield. Proceedings of the17th symposium of Malaysian chemical engineers, 29th–30thDecember 2003, Penang, pp 294–299
Kuo PC, Shi LS, Damu AG, Su CR, Huang CH, Ke CH, Wu JB,Lin AJ, Bastow KF, Lee KH, Wu TS (2003) Cytotoxic andantimalarial beta-carboline alkaloids from the roots ofEurycoma longifolia . J Nat Prod 66(10):1324–1327
Suh S (2001) Missing Inventory Estimation Tool (MIET 2.0).Centre of Environmental Science, Leiden University, TheNetherlands
Svoboda S (1995) Note on life cycle analysis. http://www.umich.edu/~nppcpub/resources/compendia/CORPpdfs/CORPlca.pdf.Cited Jan 2006
Von Blottnitz H, Curran MA (2006) A review of assessmentsconducted on bio-ethanol as a transportation fuel from a netenergy, greenhouse gas, and environmental life cycle per-spective. J Cleaner Prod 15:607–619
Wang M (1999) GREET 1.5—transportation fuel cycle model.Final Report ANL/ESD-39, Argonne National Laboratory,USA
Wenzel H, Hauschild M, Alting L (1997) Environmentalassessment of products. Vol 1. Methodology, tools and casestudies in product development. Chapman and Hall,London