The Role of Cover Crop Types and Residue Incorporation in ...
12
agronomy Article The Role of Cover Crop Types and Residue Incorporation in Improving Soil Chemical Properties Rimsha Khan 1 , Aitazaz A. Farooque 2,3, *, Helen Carolyn Peach Brown 4 , Qamar U. Zaman 5 , Bishnu Acharya 6 , Farhat Abbas 3, * and Andrew McKenzie-Gopsill 7 Citation: Khan, R.; Farooque, A.A.; Brown, H.C.P.; Zaman, Q.U.; Acharya, B.; Abbas, F.; McKenzie-Gopsill, A. The Role of Cover Crop Types and Residue Incorporation in Improving Soil Chemical Properties. Agronomy 2021, 11, 2091. https://doi.org/ 10.3390/agronomy11102091 Academic Editors: Othmane Merah, Purushothaman Chirakkuzhyil Abhilash, Magdi T. Abdelhamid, Hailin Zhang and Bachar Zebib Received: 15 September 2021 Accepted: 15 October 2021 Published: 19 October 2021 Publisher’s Note: MDPI stays neutral with regard to jurisdictional claims in published maps and institutional affil- iations. Copyright: © 2021 by the authors. Licensee MDPI, Basel, Switzerland. This article is an open access article distributed under the terms and conditions of the Creative Commons Attribution (CC BY) license (https:// creativecommons.org/licenses/by/ 4.0/). 1 Department of Biology, Faculty of Science, University of Prince Edward Island, Charlottetown, PE C1A 4P3, Canada; [email protected] 2 Faculty of Sustainable Design Engineering, University of Prince Edward Island, Charlottetown, PE C1A 4P3, Canada 3 School of Climate Change and Adaptation, University of Prince Edward Island, Charlottetown, PE C1A 4P3, Canada 4 Environmental Studies, Faculty of Science, University of Prince Edward Island, Charlottetown, PE C1A 4P3, Canada; [email protected] 5 Department of Engineering, Faculty of Agriculture, Dalhousie University, Truro, NS B2N 5E3, Canada; [email protected] 6 Department of Chemical and Biological Engineering, University of Saskatchewan, Saskatoon, SK S7N 5A9, Canada; [email protected] 7 Agriculture and Agri-Food Canada, Charlottetown Research and Development Centre, Charlottetown, PE C1A 7Z5, Canada; [email protected] * Correspondence: [email protected] (A.A.F.); [email protected] (F.A.) Abstract: Soil chemical properties can be improved by incorporating crop residues in soil and letting it decompose. This study explored the use of incorporating residues of cover crops for improvements in soil chemical properties including soil organic matter (SOM), soil pH, and the selected soil macro- and micronutrients in greenhouse and field trials. Factors of interest included (i) cover crops and their combinations and (ii) methods of crop termination and incorporation in soil (disc, mow + disc, glyphosate, roller crimper). The greenhouse trial showed up to a 20% higher amount of SOM accumulated in soils incorporated with crop residues. Buckwheat (3.12%) and phacelia (3.12%) produced significantly different and larger SOM than that of the control treatment that received no crop residues (p ≤ 0.05). The soil pH of the brown mustard treatment was also significantly affected by the experimental treatments (p ≤ 0.05). The incorporation of crop residues did not affect soil phosphorous (P) or potassium (K) concentrations, except for brown mustard, with significantly higher values of P and K than the control treatment. Calcium (Ca) was significantly higher in the soil of phacelia + pea treatment (p ≤ 0.05). Buckwheat + pea produced a higher concentration of Ca (1028 mg/kg) followed by buckwheat alone (1006 mg/kg). Analysis of variance (ANOVA) calculated on the results of the field trial showed that the mix treatment that had a mixture of four cover crops significantly increased the SOM content. Buckwheat produced the highest (2.95%) SOM, then brown mustard and timothy. This study concludes that, irrespective of the tillage incorporation methods, the residues from cover crops are a potential source of improvement in soil health, and this practice may promote sustainable agriculture in conditions similar to those in this study. Keywords: cover crops; greenhouse; organic matter; residue incorporation; sustainable agriculture 1. Introduction Cover crops form a vital bioresource that contributes to improving soil health. Soil chemical properties including organic matter (SOM), soil pH, and soil macro- and mi- cronutrients contribute to soil health. SOM is universally recognized as a significant factor enabling soils to provide critical services in agroecosystems including food and fiber production and environmental sustainability [1,2]. Additionally, SOM contributes Agronomy 2021, 11, 2091. https://doi.org/10.3390/agronomy11102091 https://www.mdpi.com/journal/agronomy
-
Upload
khangminh22 -
Category
Documents
-
view
1 -
download
0
Transcript of The Role of Cover Crop Types and Residue Incorporation in ...

agronomy
Article
The Role of Cover Crop Types and Residue Incorporation inImproving Soil Chemical Properties
Rimsha Khan 1, Aitazaz A. Farooque 2,3,*, Helen Carolyn Peach Brown 4, Qamar U. Zaman 5, Bishnu Acharya 6,Farhat Abbas 3,* and Andrew McKenzie-Gopsill 7
�����������������
Citation: Khan, R.; Farooque, A.A.;
Brown, H.C.P.; Zaman, Q.U.; Acharya,
B.; Abbas, F.; McKenzie-Gopsill, A.
The Role of Cover Crop Types and
Residue Incorporation in Improving
Soil Chemical Properties. Agronomy
2021, 11, 2091. https://doi.org/
10.3390/agronomy11102091
Academic Editors: Othmane Merah,
Purushothaman Chirakkuzhyil
Abhilash, Magdi T. Abdelhamid,
Hailin Zhang and Bachar Zebib
Received: 15 September 2021
Accepted: 15 October 2021
Published: 19 October 2021
Publisher’s Note: MDPI stays neutral
with regard to jurisdictional claims in
published maps and institutional affil-
iations.
Copyright: © 2021 by the authors.
Licensee MDPI, Basel, Switzerland.
This article is an open access article
distributed under the terms and
conditions of the Creative Commons
Attribution (CC BY) license (https://
creativecommons.org/licenses/by/
4.0/).
1 Department of Biology, Faculty of Science, University of Prince Edward Island,Charlottetown, PE C1A 4P3, Canada; [email protected]
2 Faculty of Sustainable Design Engineering, University of Prince Edward Island,Charlottetown, PE C1A 4P3, Canada
3 School of Climate Change and Adaptation, University of Prince Edward Island,Charlottetown, PE C1A 4P3, Canada
4 Environmental Studies, Faculty of Science, University of Prince Edward Island,Charlottetown, PE C1A 4P3, Canada; [email protected]
5 Department of Engineering, Faculty of Agriculture, Dalhousie University, Truro, NS B2N 5E3, Canada;[email protected]
6 Department of Chemical and Biological Engineering, University of Saskatchewan,Saskatoon, SK S7N 5A9, Canada; [email protected]
7 Agriculture and Agri-Food Canada, Charlottetown Research and Development Centre,Charlottetown, PE C1A 7Z5, Canada; [email protected]
* Correspondence: [email protected] (A.A.F.); [email protected] (F.A.)
Abstract: Soil chemical properties can be improved by incorporating crop residues in soil and lettingit decompose. This study explored the use of incorporating residues of cover crops for improvementsin soil chemical properties including soil organic matter (SOM), soil pH, and the selected soilmacro- and micronutrients in greenhouse and field trials. Factors of interest included (i) covercrops and their combinations and (ii) methods of crop termination and incorporation in soil (disc,mow + disc, glyphosate, roller crimper). The greenhouse trial showed up to a 20% higher amount ofSOM accumulated in soils incorporated with crop residues. Buckwheat (3.12%) and phacelia (3.12%)produced significantly different and larger SOM than that of the control treatment that receivedno crop residues (p ≤ 0.05). The soil pH of the brown mustard treatment was also significantlyaffected by the experimental treatments (p ≤ 0.05). The incorporation of crop residues did not affectsoil phosphorous (P) or potassium (K) concentrations, except for brown mustard, with significantlyhigher values of P and K than the control treatment. Calcium (Ca) was significantly higher in thesoil of phacelia + pea treatment (p ≤ 0.05). Buckwheat + pea produced a higher concentration of Ca(1028 mg/kg) followed by buckwheat alone (1006 mg/kg). Analysis of variance (ANOVA) calculatedon the results of the field trial showed that the mix treatment that had a mixture of four cover cropssignificantly increased the SOM content. Buckwheat produced the highest (2.95%) SOM, then brownmustard and timothy. This study concludes that, irrespective of the tillage incorporation methods,the residues from cover crops are a potential source of improvement in soil health, and this practicemay promote sustainable agriculture in conditions similar to those in this study.
Keywords: cover crops; greenhouse; organic matter; residue incorporation; sustainable agriculture
1. Introduction
Cover crops form a vital bioresource that contributes to improving soil health. Soilchemical properties including organic matter (SOM), soil pH, and soil macro- and mi-cronutrients contribute to soil health. SOM is universally recognized as a significantfactor enabling soils to provide critical services in agroecosystems including food andfiber production and environmental sustainability [1,2]. Additionally, SOM contributes
Agronomy 2021, 11, 2091. https://doi.org/10.3390/agronomy11102091 https://www.mdpi.com/journal/agronomy
Agronomy 2021, 11, 2091 2 of 12
markedly to the soil acid-base buffering capacity, determined by soil pH, and representsan essential source of plant nutrients. The concentration of SOM in agricultural soils is afunction of the type and/or method of the incorporated crop residues and the rate of theirdecomposition [3,4].
A potential strategy to address soil health issues is improving soil chemical propertiesthrough planting cover crops with regular field crops [5]. Cover crops reduce nutrient lossand improve soil conditions. They offer an excellent opportunity to increase the diversityof crop rotation between the cultivation of major crops [4,5]. Cover crops also help toreduce the use of herbicides for weed control [6]. The termination and incorporation ofcover crops into the soil is another method of promoting microorganism activities for theincreased decomposition of crop residues, increasing SOM and soil fertility [7].
Haruna et al. [8] studied the effect of cover crop (cereal rye) and crop rotation (maize-soybean) managed by tillage and no-tillage practices on selected soil chemical propertiesand found that the relative change in the percentage of SOM was 8% greater in the covercrop management compared with no cover crop treatment. They concluded that theinteraction effects of the management practices on the soil chemical properties were difficultto predict throughout the study. Gattullo et al. [9] assessed the effect of a fescue covercrop on soil quality, yield, and grape qualitative parameters and reported that cover cropsincreased, on average, soil organic carbon, total N, other soil chemical properties. Pokhrelet al. [10] evaluated the impact of cover crops and poultry litter on selected soil chemicalproperties and yield in dryland soybean production system and found no significant effectsof cover crops over the short period of the study.
Potato is the major crop of Prince Edward Island (PEI), Canada. It is an important partof PEI’s economy contributing about 10.8% of its gross domestic product (GDP) with morethan one billion dollars of direct and indirect economic benefits while engaging 12.1% ofthe island’s total workforce [11]. Currently, PEI produces approximately 20–25% of the totalpotato crop grown in Canada each year [12]. This production could be further increasedthrough improved soil health that may be sourced from an improvement in SOM [13].
Extensive agricultural activities in PEI including soil plowing, deep tilling, weeding,and the use of synthetic fertilizers pose a severe threat to the SOM of PEI soils that havepoor (2–3%) SOM and soil health [14]. There has been little research on the potential ofnative cover crops to improve SOM and soil health of PEI. Therefore, a research questionarises as to whether the cover crops can improve the health of soils of PEI that have beendegraded with intensive tillage for potato cultivation and other crops. It is hypothesizedthat cover crops can play a vital role in improving the health of soils, including the soils ofPEI. To answer the research question and test the study hypothesis, this work was designedto examine the effect of various cover crops on the selected soil health indicators. Thisinformation can be used to inform potato farmers about the top-performing cover crops toenhance the overall health of their soils.
2. Materials and Methods
This study was carried out in the greenhouse and experimental fields of Agricultureand Agri-Food Canada (AAFC) at the Harrington research farm, Queens County, PEI. Thissmall rural community of Barkley Beach is in the North of Charlottetown, the capital ofPEI, which is an Atlantic Canadian province, situated in the Gulf of Saint Lawrence andseparated from the other Atlantic provinces. It lies between 46 to 47 ◦N latitude and 62 to64 ◦W longitude. To the South and the West, the Northumberland Strait separates thisisland from the mainland provinces of Nova Scotia and New Brunswick. Its climate ishumid, which is strongly influenced by the surrounding seas and their variants throughoutthe year. The island winter season is long with a relatively shorter summer season. Inwinter, the island receives storms and blizzards originating from the North Atlantic orthe Gulf of Mexico. Springtime temperatures are cool when the ice generally melts in lateApril. Summers are moderately warm as the daytime temperature occasionally reaches ashigh as 30 ◦C. The island receives the heaviest rainfall spells of the year in late autumn and

Agronomy 2021, 11, 2091 3 of 12
during early winter. Soils of the study area are deep fine sandy loamy soils, which havebeen developed from the land which was originally covered with forest.
This study comprises a greenhouse and a field trial. Details of the two trials aresummarized in Table 1.
Table 1. Information about the greenhouse and field trials.
Major Protocols Greenhouse Trial Field Trial
Date 25 February 2018 to 30 April 2019 25 June 2019 to 10 October 2019
Temperature (minimum, maximum,mean), ◦C −20.1, 30.8, 5.94 −20.3, 29.9, 5.97
Total annual precipitation, mm 1149 1101
Environmental conditions
Controlled conditions under agreenhouse of Agriculture and Agri-FoodCanada’s (AAFC) CharlottetownResearch and Development Centre atHarrington, PEI Canada.
The uncontrolled natural environment of anagricultural field of the AAFC CharlottetownResearch and Development center atHarrington, PEI Canada.
Nature of the trial
Greenhouse trial arranged on a benchtopwhere 28 clay pots (14 cm diameter, 20 cmdeep) were placed 1.5 m apart on four8 m wide and 19 m long wooden benches.
Field trial with forty-eight (48) 4 m × 4 mtreatment plots arranged in 16 m wide and69 m long strips with a 1 m buffer zonebetween and around the strips.
Experimental design Randomized complete block design. Strip plot design.
Treatments and replications
Four replications of three cover crops andtheir three combinations and control(7 treatments) including T1 (brownmustard), T2 (buckwheat), T3 (phacelia),T4 (brown mustard + Pea), T5(buckwheat + pea), T6 (phacelia + pea),and T7: control/no cover crop.
Four replications of the four cover cropstreatments including C1 (timothy), C2(buckwheat), C3 (brown mustard), and C4 (mixof hairy vetch, annual rye (winter rye), crimsonclover).
Irrigation Automated irrigation @ 150 mL/day toeach pot.
No irrigation was provided at all as the cropswere grown under rainfed conditions.
LightLights of photosynthetic photon fluxdensity below 2000 µmol m−2 s−1
managed for 16 h/8 h light/dark periods.Natural light conditions.
Crop husbandry
Weeding, disease symptommonitoring/control, and irrigationscheduling were under standardpractices.
Standard practices of weeding, hoeing, diseasesymptom monitoring/control, nutrientmanagement.
Methods of residue incorporation ManualFour methods of residue incorporation, namely,M1 (mow + disc), M2 (mow), M3 (rollercrimper), and M4 (glyphosate).
Previous crop and fertilization No synthetic fertilizer was used.
In 2018 of the cover crop year the previous cropwas potatoes, which received fertilizer bybanding with N rate of 170 kg N ha−1 as17-17-17 Nitrogen–Phosphorus–Potassium(NPK). In 2019 of the cover crop year, theprevious crop was buckwheat, and no fertilitywas applied.
2.1. The Greenhouse Trial
The soil (of sandy loam texture) was collected from the AAFC Harrington researchfield and was heat sterilized at 80 ◦C for 8 h to kill weed seeds, soil insects, plant pathogenicbacteria, and any organisms present in the soil, before packing in the experimental pots [15].Three subsamples from a composite sample of the soil were analyzed for the soil’s chemicalproperties to be considered as the initial-stage soil health conditions. Pre-cultivation

Agronomy 2021, 11, 2091 4 of 12
benchmarks of soil chemical properties including SOM, soil pH, and concentrations of soilphosphorous (P), potassium (K), calcium (Ca), copper (Cu), zinc (Zn), and P/Al ratio weredetermined on experimental soil.
Twenty-eight (28) pots were packed with the above soil to replicate seven experimentaltreatments (three cover crops and their three mixtures and a control treatment) four times.The pots were arranged under a randomized complete block design. Seeds of the covercrops were sown according to the treatment plan at the sowing rates given in Table 2. Thecrop husbandry was taken care of until it ripped and was ready for harvesting. At thisstage, the crops were terminated, and their residues were deposited back into the soil todecompose. After the decomposition of residues (i.e., 10 months after incorporation), 300 gof soil samples was collected from each experimental pot and analyzed for the selected soilhealth indicators.
Table 2. Experimental treatments, names of cover crops, and seed sowing rates (kg/ha) for each ofthe seven treatments for Experiment 1.
TreatmentsCover Crops
Sowing Ratekg/ha
Treatments andCover Crops
Sowing Ratekg/ha
T1: Brown mustard 11.0 T4: Brown mustard + Pea 5.50 + 78.5T2: Buckwheat 45.0 T5: Buckwheat + Pea 22.5 + 78.5
T3: Phacelia 10.0 T6: Phacelia + Pea 5.00 + 78.5T7: Control/no cover crop N/A
The SOM content was determined using the loss on ignition (LOI) method for whichthe laboratory used a muffle furnace (Model 550 Isotemp Series, Fisher Scientific, Pittsburgh,PA, USA), and the standard procedure was followed [16]. Soil samples were also analyzedby PEI Analytical Laboratories using the standard methods and protocols [17]. Soil pH wasdetermined using PC titrate [18], and the soil nutrients, including P, K, Ca, Zn, and P/Al,were analyzed using inductively coupled plasma optical emission spectroscopy (ICP-OES6500; Thermo Fisher, Santa Clara, CA, USA) [19].
2.2. The Field Trial
Field trials were conducted on the AAFC Harrington field in PEI as the soils of thisarea are suitable for potato cultivation [15]. These are deep fine sandy loam soils, whichhave been developed from the land that was initially covered with forest. One of the covercrops, buckwheat, was selected as the best performer during the greenhouse trial. The otherthree crops were the most used cover crops in PEI (Table 1). Each treatment was replicatedfour times. This experiment was part of an ongoing research project of AAFC [15]. The fourexperimental cover crops were terminated and incorporated into the soil using varioustermination methods, i.e., mow + disc, mow, roller crimper, and glyphosate (Table 3).
Table 3. Methods of termination of cover crops and incorporation into the soil for experimental treatments for Experiment 2.
Methods Termination Technique Description of Incorporation and Equipment Used for the Specific Purpose
M1 Mow + Disc Cover crops were mowed with a flail mower and incorporated into the soil withthe help of a tractor-mounted disc plow.
M2 Mow only Cover crops were mowed with a flail mower.
M3 Roller crimper Roller crimper—front-mounted roller crimper bar (manufactured at RodaleInstitute in Pennsylvania) was used for the plowing of cover crops.
M4 Glyphosate Glyphosate applied @ 2.33 L/ha to terminate cover crop into the soil.
A randomized strip plot design was established with four replications. There werefour main plot effects (i.e., four methods of residue incorporation into the soil includingmow + disc, mow, roller crimper, and glyphosate, applied at the rate of 2.33 L/ha) andfour subplot effects (i.e., three cover crops—namely, timothy; brown mustard; and a mix

Agronomy 2021, 11, 2091 5 of 12
of hairy vetch, crimson, clover, and annual rye—and a control (no incorporation of covercrops) treatment).
The experimental plots were prepared using disc tillage, which usually follows theplowing of soil with a disk plow mounted behind a tractor. Additionally, disking breaks upclods and surface crusts thereby improving soil granulation and surface uniformity. Theseeds of cover crops were planted using plot seeders (Wintersteiger Inc. Ried, Austria).This instrument is used for seeding in small plots.
The crop termination was achieved at the peak flowering stage of the crops. Theincorporated residues of the terminated cover crops were left in the soil to decompose forone year. Soil samples were collected from the 0–15 cm layer of each treatment plot, after ayear of residue decomposition, to determine the selected soil health indicators [20].
The field trial year (i.e., 2019) had the highest ambient air temperature (~30 ◦C) of theyear during the month of July and the driest days of the growing season during July andAugust (Figure 1).
Figure 1. Ambient air temperature (minimum and maximum) and precipitation trends during thetrial season (i.e., June–October 2019).
2.3. Statistical Analysis
Minitab 19 was used to perform the statistical analysis [21]. The analysis of variance(ANOVA) was performed to test the significance of experimental treatments on soil healthindicators. The data of the greenhouse trial were tested for mean significant differencesusing Tukey’s method. Various assumptions, including normality test, constant variance,and independence of the error, were tested at a 95% confidence interval. The error terms’normal distributions were verified using the Anderson–Darling test at a 95% confidenceinterval. Constant variance assumption was checked using residuals versus fitted valueplots. The independence assumption was verified by applying all the treatments in arandom order to the experimental units. Statistical means were considered significantlydifferent at p ≤ 0.05. Fisher’s Least Significant Difference (LSD) was performed on data offield trials to separate means of significant difference.
Agronomy 2021, 11, 2091 6 of 12
3. Results3.1. The Greenhouse Trial
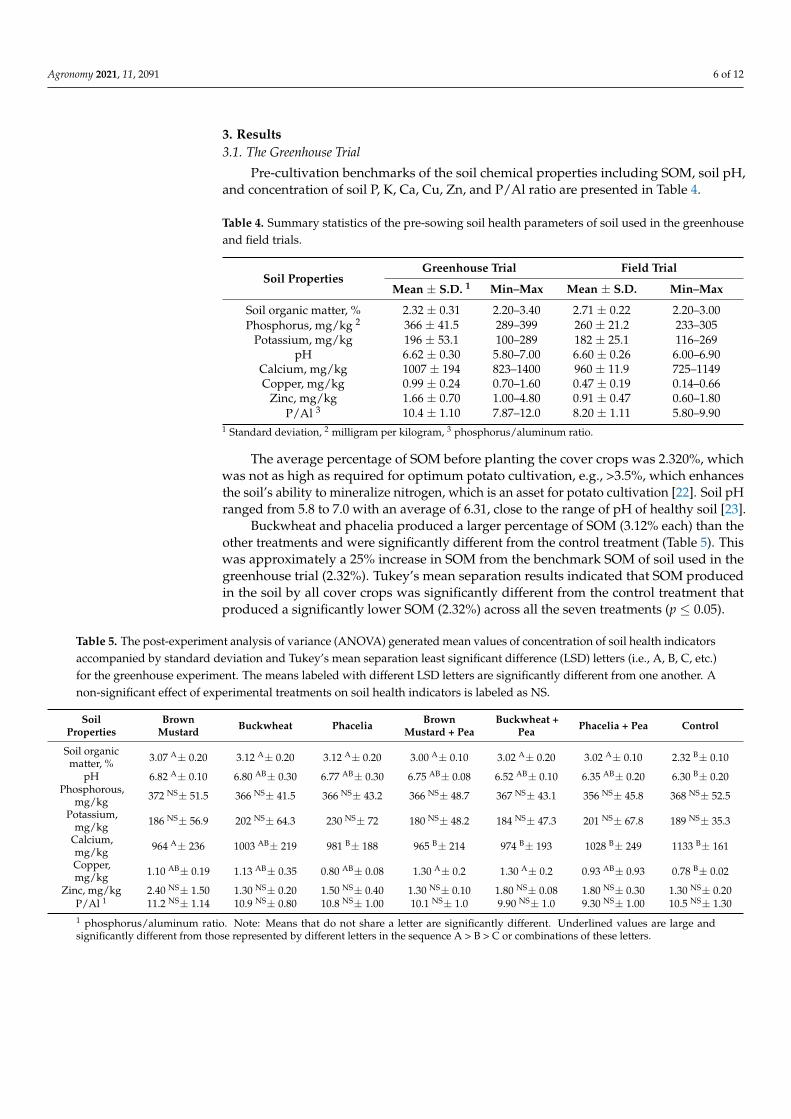
Pre-cultivation benchmarks of the soil chemical properties including SOM, soil pH,and concentration of soil P, K, Ca, Cu, Zn, and P/Al ratio are presented in Table 4.
Table 4. Summary statistics of the pre-sowing soil health parameters of soil used in the greenhouseand field trials.
Soil PropertiesGreenhouse Trial Field Trial
Mean ± S.D. 1 Min–Max Mean ± S.D. Min–Max
Soil organic matter, % 2.32 ± 0.31 2.20–3.40 2.71 ± 0.22 2.20–3.00Phosphorus, mg/kg 2 366 ± 41.5 289–399 260 ± 21.2 233–305
Potassium, mg/kg 196 ± 53.1 100–289 182 ± 25.1 116–269pH 6.62 ± 0.30 5.80–7.00 6.60 ± 0.26 6.00–6.90
Calcium, mg/kg 1007 ± 194 823–1400 960 ± 11.9 725–1149Copper, mg/kg 0.99 ± 0.24 0.70–1.60 0.47 ± 0.19 0.14–0.66
Zinc, mg/kg 1.66 ± 0.70 1.00–4.80 0.91 ± 0.47 0.60–1.80P/Al 3 10.4 ± 1.10 7.87–12.0 8.20 ± 1.11 5.80–9.90
1 Standard deviation, 2 milligram per kilogram, 3 phosphorus/aluminum ratio.
The average percentage of SOM before planting the cover crops was 2.320%, whichwas not as high as required for optimum potato cultivation, e.g., >3.5%, which enhancesthe soil’s ability to mineralize nitrogen, which is an asset for potato cultivation [22]. Soil pHranged from 5.8 to 7.0 with an average of 6.31, close to the range of pH of healthy soil [23].
Buckwheat and phacelia produced a larger percentage of SOM (3.12% each) than theother treatments and were significantly different from the control treatment (Table 5). Thiswas approximately a 25% increase in SOM from the benchmark SOM of soil used in thegreenhouse trial (2.32%). Tukey’s mean separation results indicated that SOM producedin the soil by all cover crops was significantly different from the control treatment thatproduced a significantly lower SOM (2.32%) across all the seven treatments (p ≤ 0.05).
Table 5. The post-experiment analysis of variance (ANOVA) generated mean values of concentration of soil health indicatorsaccompanied by standard deviation and Tukey’s mean separation least significant difference (LSD) letters (i.e., A, B, C, etc.)for the greenhouse experiment. The means labeled with different LSD letters are significantly different from one another. Anon-significant effect of experimental treatments on soil health indicators is labeled as NS.
SoilProperties
BrownMustard Buckwheat Phacelia Brown
Mustard + PeaBuckwheat +
Pea Phacelia + Pea Control
Soil organicmatter, % 3.07 A± 0.20 3.12 A± 0.20 3.12 A± 0.20 3.00 A± 0.10 3.02 A± 0.20 3.02 A± 0.10 2.32 B± 0.10
pH 6.82 A± 0.10 6.80 AB± 0.30 6.77 AB± 0.30 6.75 AB± 0.08 6.52 AB± 0.10 6.35 AB± 0.20 6.30 B± 0.20Phosphorous,
mg/kg 372 NS± 51.5 366 NS± 41.5 366 NS± 43.2 366 NS± 48.7 367 NS± 43.1 356 NS± 45.8 368 NS± 52.5
Potassium,mg/kg 186 NS± 56.9 202 NS± 64.3 230 NS± 72 180 NS± 48.2 184 NS± 47.3 201 NS± 67.8 189 NS± 35.3
Calcium,mg/kg 964 A± 236 1003 AB± 219 981 B± 188 965 B± 214 974 B± 193 1028 B± 249 1133 B± 161
Copper,mg/kg 1.10 AB± 0.19 1.13 AB± 0.35 0.80 AB± 0.08 1.30 A± 0.2 1.30 A± 0.2 0.93 AB± 0.93 0.78 B± 0.02
Zinc, mg/kg 2.40 NS± 1.50 1.30 NS± 0.20 1.50 NS± 0.40 1.30 NS± 0.10 1.80 NS± 0.08 1.80 NS± 0.30 1.30 NS± 0.20P/Al 1 11.2 NS± 1.14 10.9 NS± 0.80 10.8 NS± 1.00 10.1 NS± 1.0 9.90 NS± 1.0 9.30 NS± 1.00 10.5 NS± 1.301 phosphorus/aluminum ratio. Note: Means that do not share a letter are significantly different. Underlined values are large andsignificantly different from those represented by different letters in the sequence A > B > C or combinations of these letters.
Agronomy 2021, 11, 2091 7 of 12
There was a significant effect of experimental treatments on soil pH (p ≤ 0.05). Theincorporation of biomass of brown mustard resulted in the highest soil pH (6.82) andwas significantly different from the control treatment (Table 5). However, the pot soilpH of buckwheat, phacelia, and other cover crops (i.e., phacelia + pea, brown mustard +pea, and buckwheat + pea) was also not significantly different from the control. Calciumconcentration in pot soil also had a significant impact of brown mustard that producedhigher Ca than the control treatment (p ≤ 0.05). Additionally, the Cu concentration inthe potting soil was significantly affected by the two mixed experimental treatments (i.e.,brown mustard + pea and buckwheat + pea produced the highest concentration of Cu(1.30 mg/kg each), which was significantly different from the control treatment (p ≤ 0.05)).
3.2. The Field Trial
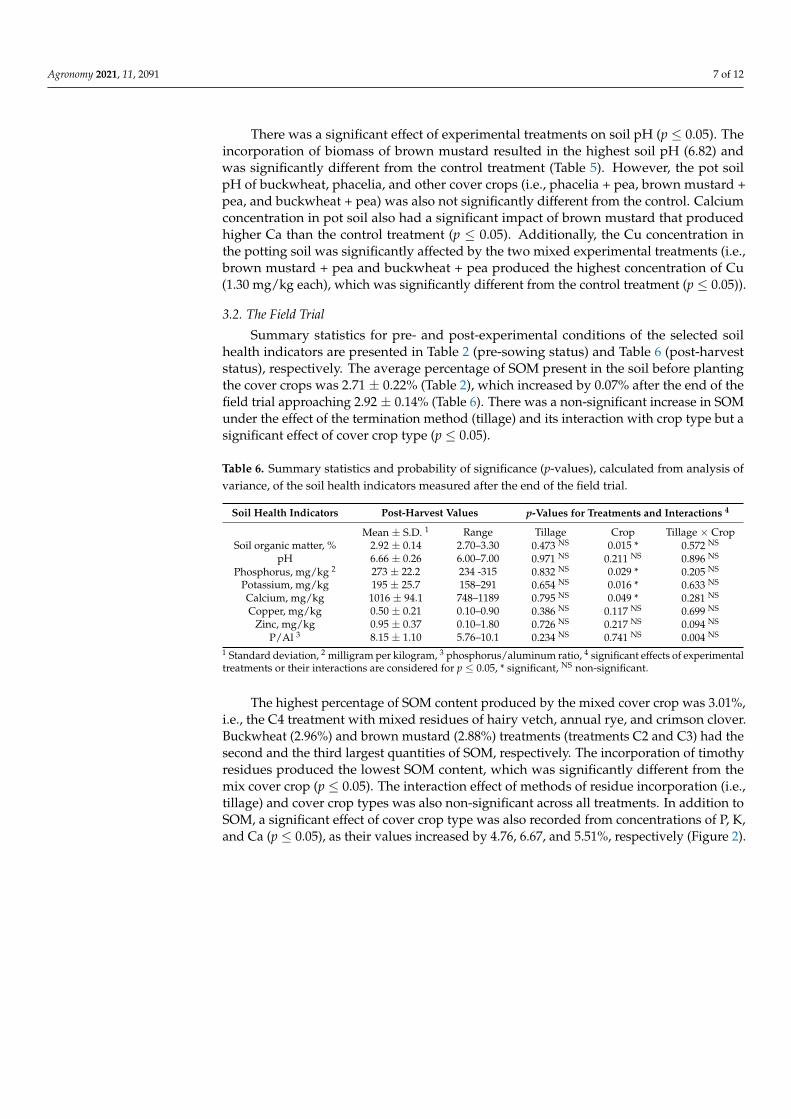
Summary statistics for pre- and post-experimental conditions of the selected soilhealth indicators are presented in Table 2 (pre-sowing status) and Table 6 (post-harveststatus), respectively. The average percentage of SOM present in the soil before plantingthe cover crops was 2.71 ± 0.22% (Table 2), which increased by 0.07% after the end of thefield trial approaching 2.92 ± 0.14% (Table 6). There was a non-significant increase in SOMunder the effect of the termination method (tillage) and its interaction with crop type but asignificant effect of cover crop type (p ≤ 0.05).
Table 6. Summary statistics and probability of significance (p-values), calculated from analysis ofvariance, of the soil health indicators measured after the end of the field trial.
Soil Health Indicators Post-Harvest Values p-Values for Treatments and Interactions 4
Mean ± S.D. 1 Range Tillage Crop Tillage × CropSoil organic matter, % 2.92 ± 0.14 2.70–3.30 0.473 NS 0.015 * 0.572 NS
pH 6.66 ± 0.26 6.00–7.00 0.971 NS 0.211 NS 0.896 NS
Phosphorus, mg/kg 2 273 ± 22.2 234 -315 0.832 NS 0.029 * 0.205 NS
Potassium, mg/kg 195 ± 25.7 158–291 0.654 NS 0.016 * 0.633 NS
Calcium, mg/kg 1016 ± 94.1 748–1189 0.795 NS 0.049 * 0.281 NS
Copper, mg/kg 0.50 ± 0.21 0.10–0.90 0.386 NS 0.117 NS 0.699 NS
Zinc, mg/kg 0.95 ± 0.37 0.10–1.80 0.726 NS 0.217 NS 0.094 NS
P/Al 3 8.15 ± 1.10 5.76–10.1 0.234 NS 0.741 NS 0.004 NS
1 Standard deviation, 2 milligram per kilogram, 3 phosphorus/aluminum ratio, 4 significant effects of experimentaltreatments or their interactions are considered for p ≤ 0.05, * significant, NS non-significant.
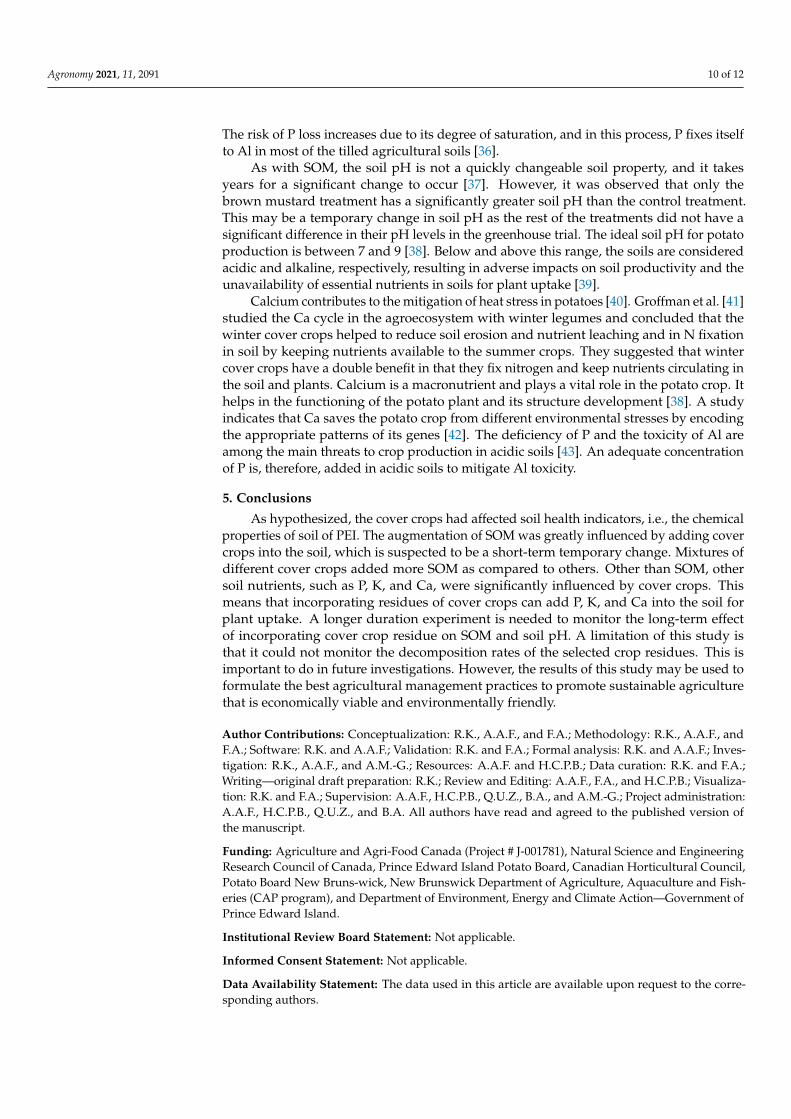
The highest percentage of SOM content produced by the mixed cover crop was 3.01%,i.e., the C4 treatment with mixed residues of hairy vetch, annual rye, and crimson clover.Buckwheat (2.96%) and brown mustard (2.88%) treatments (treatments C2 and C3) had thesecond and the third largest quantities of SOM, respectively. The incorporation of timothyresidues produced the lowest SOM content, which was significantly different from themix cover crop (p ≤ 0.05). The interaction effect of methods of residue incorporation (i.e.,tillage) and cover crop types was also non-significant across all treatments. In addition toSOM, a significant effect of cover crop type was also recorded from concentrations of P, K,and Ca (p ≤ 0.05), as their values increased by 4.76, 6.67, and 5.51%, respectively (Figure 2).

Agronomy 2021, 11, 2091 8 of 12
Figure 2. Multiple mean comparisons and standard error bars of (a) soil organic matter, (b) phosphate, (c) potash, and (d)calcium concentration in soils of treatments C1 (timothy), C2 (buckwheat), C3 (brown mustard), and C4 (mix (hairy vetch,annual rye, and crimson clover) using Fisher’s least significance difference (LSD) method. Treatments labeled with the sameor combination of LSD letters (a, b, c) are not significantly different from one another. Treatment means sharing labels withdifferent LSD letters that are significantly different from one another.
The highest and the lowest concentrations of P were produced by mixed cover crops(C4 treatment) and buckwheat, respectively, with a significant difference between the two(Figure 2b). The Ca concentration in the experimental soil also experienced a significanteffect of incorporating cover crops (p ≤ 0.05). The concentration of Ca was the highestfor the mixed cover crop treatment (C4) and the lowest for the buckwheat, and they weresignificantly different from each other (Figure 2c). Likewise, there was a significant effectof cover crop treatments on the soil concentration of K where brown mustard produced ahigher concentration of K than the other cover crops and was significantly different fromthe buckwheat (p ≤ 0.05; Figure 2d).
The ANOVA results revealed that the main effect of the interaction between covercrops and the residue incorporation methods was non-significant for all cover crop treat-ments (p > 0.05; Table 6). However, the combination of incorporation methods with covercrops (i.e., glyphosate–brown mustard) in soil produced the highest percentage of P/Alamong all treatments (Table 7). Furthermore, the interaction effects of mow–disk–timothyand mow–brown mustard produced a higher percentage of P/Al than the rest of thecombinations of types of cover crop and methods of residue incorporation. The residueincorporation combination roller crimper–brown mustard produced the lowest and mostsignificantly different percentage of P/Al in the experimental plot (p ≤ 0.05; Table 7).

Agronomy 2021, 11, 2091 9 of 12
Table 7. Multiple mean comparisons of P/Al (%) produced by the different cover crops and theirincorporation methods using Fisher’s least significant difference (LSD) method.
Tillage × Crops MeanLSD Letters Tillage × Crops MeanLSD Letters
Glyphosate brown mustard 9.28 a Mow mix 8.33 abc
Mow disk timothy 9.18 a Mow buckwheat 8.28 abc
Mow brown mustard 9.03 a Glyphosate buckwheat 8.14 abc
Mow disk mix 8.74 ab Mow timothy 7.83 abcd
Mow disk brown mustard 8.54 abc Roller crimper mix 7.37 bcd
Roller crimper timothy 8.43 abc Mow disk buckwheat 7.17 cd
Roller crimper buckwheat 8.42 abc Glyphosate timothy 6.62 d
Glyphosate mix 8.39 abc Roller crimper brown mustard 6.60 d
The means that do not share the same LSD letter (a, b, c, or d) are significantly different from one another.
4. Discussion
Cover crop treatments significantly influenced SOM in greenhouse and field trials.These findings are in concurrence with the literature, which indicates that crop residueincorporation is the primary method for improving SOM. For example, Ding et al. [24]reported that organic carbon content, which is derived from SOM, was the highest in acover crop system and the lowest in soil with no cover crops. Ramos et al. [25] suggestedthat cover crops improve soil quality by increasing SOM and improving the soil’s chemicaland physical fertility. They indicated that there was a significant increase in SOM in allground cover crop plots they used in their experiments. They further reported that covercrops helped to build SOM and improved water retention. The presence of SOM hasphysical, chemical, and biological benefits to the soil. Usually, the ideal SOM contentfor productive soils is 3–6%, and such fertile soils tend to produce more food. There isless deterioration and loss of nutrients when the ideal amount of SOM is present in fieldsoils [26].
The interaction effects of experimental treatments are usually significant when bothor one of the two treatments in interaction have a highly significant effect on responsevariables. None of the studied response variables had an interaction effect on the croptype or method of residue incorporation (tillage) in the field trials. Nascent et al. [27]evaluated the interactions effects of cover crops and tillage systems on SOM, soil nitrogen,and soil carbon, and concluded that cover crops and no-tillage systems increased thesoil carbon, calculated from SOM, and soil nitrogen. They also found a change in totalSOM in treatments of their two-year study. Cover crops have long been recognized toplay an essential role in sustainable agriculture due to their functions in improving soilproductivity, suppressing weeds, and preventing soil erosion [24]. De Souza et al. [28]suggested that cover crops become an excellent management option in sandy loam soils. Itis worth mentioning here that the soils used in both greenhouse and field trials were sandyloam soils.
Phosphorus binds itself with an active form of aluminum (Al) and iron (Fe) in the soil,which make it available to the plant. Aluminum provides P availability and increases itsfixation in the soil [29,30]. Obi [31] reported relative increases of 26 and 112% in SOM andP levels with cover crops, and a significant increase in the Ca levels in the soil cultivatedwith cover crops. Wissem et al. [32] concluded that rotations of cover crops increased thetotal P and some labile P pools in the surface of the soil as compared with fallow rotation.However, they reported a positive effect of crop rotation on crop biomass. Fageria et al. [33]reported that cover crops possess a strong ability to absorb low-availability nutrientsin the soil profile and can help in increasing the concentration of plant nutrients in thesurface layers. Hallama et al. [34] evaluated the possibility of P redistribution into the soilunder no-tillage by using cover crops in rotation and found that cover crops increased theavailability of P to the soil. Phosphorus fixation is the indication of the low availability of Pin the soil, and this happens when P binds itself to iron, or the Al fixes itself in soil [35].
Agronomy 2021, 11, 2091 10 of 12
The risk of P loss increases due to its degree of saturation, and in this process, P fixes itselfto Al in most of the tilled agricultural soils [36].
As with SOM, the soil pH is not a quickly changeable soil property, and it takesyears for a significant change to occur [37]. However, it was observed that only thebrown mustard treatment has a significantly greater soil pH than the control treatment.This may be a temporary change in soil pH as the rest of the treatments did not have asignificant difference in their pH levels in the greenhouse trial. The ideal soil pH for potatoproduction is between 7 and 9 [38]. Below and above this range, the soils are consideredacidic and alkaline, respectively, resulting in adverse impacts on soil productivity and theunavailability of essential nutrients in soils for plant uptake [39].
Calcium contributes to the mitigation of heat stress in potatoes [40]. Groffman et al. [41]studied the Ca cycle in the agroecosystem with winter legumes and concluded that thewinter cover crops helped to reduce soil erosion and nutrient leaching and in N fixationin soil by keeping nutrients available to the summer crops. They suggested that wintercover crops have a double benefit in that they fix nitrogen and keep nutrients circulating inthe soil and plants. Calcium is a macronutrient and plays a vital role in the potato crop. Ithelps in the functioning of the potato plant and its structure development [38]. A studyindicates that Ca saves the potato crop from different environmental stresses by encodingthe appropriate patterns of its genes [42]. The deficiency of P and the toxicity of Al areamong the main threats to crop production in acidic soils [43]. An adequate concentrationof P is, therefore, added in acidic soils to mitigate Al toxicity.
5. Conclusions
As hypothesized, the cover crops had affected soil health indicators, i.e., the chemicalproperties of soil of PEI. The augmentation of SOM was greatly influenced by adding covercrops into the soil, which is suspected to be a short-term temporary change. Mixtures ofdifferent cover crops added more SOM as compared to others. Other than SOM, othersoil nutrients, such as P, K, and Ca, were significantly influenced by cover crops. Thismeans that incorporating residues of cover crops can add P, K, and Ca into the soil forplant uptake. A longer duration experiment is needed to monitor the long-term effectof incorporating cover crop residue on SOM and soil pH. A limitation of this study isthat it could not monitor the decomposition rates of the selected crop residues. This isimportant to do in future investigations. However, the results of this study may be used toformulate the best agricultural management practices to promote sustainable agriculturethat is economically viable and environmentally friendly.
Author Contributions: Conceptualization: R.K., A.A.F., and F.A.; Methodology: R.K., A.A.F., andF.A.; Software: R.K. and A.A.F.; Validation: R.K. and F.A.; Formal analysis: R.K. and A.A.F.; Inves-tigation: R.K., A.A.F., and A.M.-G.; Resources: A.A.F. and H.C.P.B.; Data curation: R.K. and F.A.;Writing—original draft preparation: R.K.; Review and Editing: A.A.F., F.A., and H.C.P.B.; Visualiza-tion: R.K. and F.A.; Supervision: A.A.F., H.C.P.B., Q.U.Z., B.A., and A.M.-G.; Project administration:A.A.F., H.C.P.B., Q.U.Z., and B.A. All authors have read and agreed to the published version ofthe manuscript.
Funding: Agriculture and Agri-Food Canada (Project # J-001781), Natural Science and EngineeringResearch Council of Canada, Prince Edward Island Potato Board, Canadian Horticultural Council,Potato Board New Bruns-wick, New Brunswick Department of Agriculture, Aquaculture and Fish-eries (CAP program), and Department of Environment, Energy and Climate Action—Government ofPrince Edward Island.
Institutional Review Board Statement: Not applicable.
Informed Consent Statement: Not applicable.
Data Availability Statement: The data used in this article are available upon request to the corre-sponding authors.
Agronomy 2021, 11, 2091 11 of 12
Acknowledgments: The authors thank Ryan Barret (Research Coordinator) and the Precision Agri-culture Team at the University of Prince Edward Island for their cooperation and assistance duringthe study.
Conflicts of Interest: The authors declare no conflict of interest.
References1. Martinez-Sabater, E.; Bustamante, M.A.; Marhuenda-Egea, F.C.; El-Khattabi, M.; Moral, R.; Lorenzo, E.; Paredes, C.; Galvez, L.N.;
Jorda, J.D. Study of the Evolution of Organic Matter During Composting of Winery and Distillery Residues by Classical 305 andChemometric Analysis. J. Agric. Food Chem. 2009, 57, 9613–9623. [CrossRef]
2. Wulanningtyas, H.S.; Gong, Y.; Li, P.; Sakagami, N.; Nishiwaki, J.; Komatsuzaki, M. A cover crop and no-tillage system forenhancing soil health by increasing soil organic matter in soybean cultivation. Soil Tillage Res. 2021, 205, 104749. [CrossRef]
3. Kauer, K.; Pärnpuu, S.; Talgre, L.; Eremeev, V.; Luik, A. Soil Particulate and Mineral-Associated Organic Matter Increases inOrganic Farming under Cover Cropping and Manure Addition. Agriculture 2021, 11, 903. [CrossRef]
4. Stegarescu, G.; Escuer-Gatius, J.; Soosaar, K.; Kauer, K.; Tõnutare, T.; Astover, A.; Reintam, E. Effect of Crop Residue Decomposi-tion on Soil Aggregate Stability. Agriculture 2020, 10, 527. [CrossRef]
5. Blesh, J.; Vandusen, B.M.; Brainard, D.C. Managing Ecosystem Services with Cover Crop Mixtures on Organic Farms. Agron. J.2019, 111, 826–840. [CrossRef]
6. Teasdale, J.R. Contribution of Cover Crops to Weed Management in Sustainable Agricultural Systems. J. Prod. Agric. 1996, 9,475–479. [CrossRef]
7. Lu, Y.C.; Watkins, K.B.; Teasdale, J.R.; Abdul-Baki, A.A. Cover Crops in Sustainable Food Production. Food Rev. Int. 2000, 16,121–157. [CrossRef]
8. Haruna, S.I.; Nkongolo, N.V. Tillage, Cover Crop and Crop Rotation Effects on Selected Soil Chemical Properties. Sustainability2019, 11, 2770. [CrossRef]
9. Gattullo, C.E.; Mezzapesa, G.N.; Stellacci, A.M.; Ferrara, G.; Occhiogrosso, G.; Petrelli, G.; Castellini, M.; Spagnuolo, M. CoverCrop for a Sustainable Viticulture: Effects on Soil Properties and Table Grape Production. Agronomy 2020, 10, 1334. [CrossRef]
10. Pokhrel, S.; Kingery, W.L.; Cox, M.S.; Shankle, M.W.; Shanmugam, S.G. Impact of Cover Crops and Poultry Litter on Selected SoilProperties and Yield in Dryland Soybean Production. Agronomy 2021, 11, 119. [CrossRef]
11. Macdonald Potatoes: A Billion Industry for P.E.I|Local|News|The Guardian. Available online: https://www.theguardian.pe.ca/news/local/potatoes-a-billion-dollar-industry-for-pei-95098/ (accessed on 17 April 2020).
12. Agriculture and Agri-Food Canada (AAFC). Potato Market Information Review, 2018–2019. Available online: http://www.agr.gc.ca/eng/horticulture/horticulture-sector-reports/potato-market-information-review-2018-2019/?id=1578663511988 (accessed on17 April 2020).
13. Seyedbagheri, M.M. Influence of Humic Products on Soil Health and Potato Production. Potato Res. 2010, 53, 341–349. [CrossRef]14. Nyiraneza, J.; Thompson, B.; Geng, X.; He, J.; Jiang, Y.; Fillmore, S.; Stiles, K. Changes in soil organic matter over 18 y in Prince
Edward Island, Canada. Can. J. Soil Sci. 2017, 97, 745–756. [CrossRef]15. Government of Canada. Agriculture and Agri Food Canada. Available online: https://www.agr.gc.ca/eng/agriculture-and-agri-
food-canada/?id=1395690825741 (accessed on 5 March 2021).16. Sculte, E.E.; Hopkins, B.G. Estimation of Soil Organic Matter by Weight Loss-on-Ignition. Am. Soc. Agron. 2015, 049, 21–31.17. Government of Prince Edward Island. Prince Edward Island Analytical Laboratories (PEIAL). Available online: https://www.
princeedwardisland.ca/en/information/agriculture-and-land/pei-analytical-laboratories-peial (accessed on 5 March 2021).18. Titration Analysis Systems|Multi-Parameter Testing Equipment. Available online: https://mantech-inc.com/analysis-systems/
automated-titration-analysis/ (accessed on 17 December 2020).19. Inductively Coupled Plasma-Optical Emission Spectrometry (ICP-OES)—CA. Available online: //www.thermofisher.com/ca/
en/home/industrial/spectroscopy-elemental-isotope-analysis/trace-elemental-analysis/inductively-coupled-plasma-optical-emission-spectrometry-icp-oes.html (accessed on 17 December 2020).
20. Konen, M.E.; Jacobs, P.M.; Burras, C.L.; Talaga, B.J.; Mason, J.A. Equations for Predicting Soil Organic Carbon Using Loss-on-Ignition for North Central U.S. Soils. Soil Sci. Soc. Am. J. 2002, 66, 1878–1881. [CrossRef]
21. Minitab®19. Minitab. In Minitab. Rel. 12 for Windows; Minitab: State College, PA, USA, 1998.22. Barrett, R. Keeping Your Soils Covered: Environmental and Economic Benefit! Available online: http://peipotatoagronomy.com/
wp-content/uploads/2018/04/Cover-Crop-Factsheet-Apr18.pdf (accessed on 10 August 2021).23. Mann, K.K.; Schumann, A.W.; Obreza, T.A.; Harris, W.G.; Shukla, S. Spatial Variability of Soil Physical Properties Affecting
Florida Citrus Production. Soil Sci. 2010, 175, 487–499. [CrossRef]24. Ding, G.; Liu, X.; Herbert, S.; Novak, J.; Amarasiriwardena, D.; Xing, B. Effect of Cover Crop Management on Soil Organic Matter.
J. Geoderma. 2006, 130, 229–239. [CrossRef]25. Ramos, F.T.; Dores, E.F.D.C.; Weber, O.L.D.S.; Beber, D.C.; Campelo, J.H., Jr.; Maia, J.C.D.S. Soil organic matter doubles the cation
exchange capacity of tropical soil under no-till farming in Brazil. J. Sci. Food Agric. 2018, 98, 3595–3602. [CrossRef]26. Mcleod, M.K.; Schwenke, G.D.; Cowie, A.L.; Harden, S. Soil Carbon is Only Higher in the Surface Soil under Minimum Tillage in
Vertosols and Chormosols of New South Wales North-West Slopes and Plains, Australia. Soil Res. 2013, 51, 680–694. [CrossRef]

Agronomy 2021, 11, 2091 12 of 12
27. Nascente, A.S.; Li, Y.C.; Crusciol, C.A.C. Cover crops and no-till effects on physical fractions of soil organic matter. Soil Tillage Res.2013, 130, 52–57. [CrossRef]
28. De Souza, G.P.; de Figueiredo, C.C.; de Sousa, D.M.G. Soil organic matter as affected by management systems, phosphatefertilization, and cover crops. Pesqui. Agropecu. Bras. 2016, 51, 1668–1676. [CrossRef]
29. Chng, H.Y.; Ahmed, O.H.; Majid, N.M.A.; Jalloh, M.B. Reducing Soil Phosphorus Fixation to Improve Yield of Maize on a TropicalAcid Soil Using Compost and Biochar Derived from Agro-Industrial Wastes. Compos. Sci. Util. 2017, 25, 82–94. [CrossRef]
30. Tan, K.; Keltjens, W.G. Interaction between Aluminium and Phosphorus in Sorghum Plants—II. Studies with the AluminiumTolerant Sorghum Genotype SC0283. Plant Soil 1990, 124, 25–32. [CrossRef]
31. Obi, M.E. The Physical and Chemical Responses of a Degraded Sandy Clay Loam Soil to Cover Crops in Southern Nigeria. J.Plant Soil 1999, 211, 165–172. [CrossRef]
32. Wissem, H.; Noura, Z.; Ernest, K.; Didier, B.; Frederic, G.; Mongi, S. Effect of the soil properties on the sorption capacity ofphosphorus and ammonium by alkaline soils of the semi-arid areas. Appl. Chem. 2005, 8, 2278–5736.
33. Fageria, N.K.; Baligar, V.C.; Bailey, B.A. Role of cover crops in improving soil and row crop productivity. Commun. Soil Sci. PlantAnal. 2005, 36, 2733–2757. [CrossRef]
34. Hallama, M.; Pekrun, C.; Lambers, H.; Kandeler, E. Hidden miners—The roles of cover crops and soil microorganisms inphosphorus cycling through agroecosystems. Plant Soil 2019, 434, 7–45. [CrossRef]
35. Dean, L.A. Fixation of soil phosphorus. Adv. Agron. 2008, 1, 391–411.36. Eric, D.R.; Peter, D.R.; Luiz, A.M.; Luciana, D.C.; Silvia, R.L.; Felipe, F.V.; Edwin, W.; Stephanie, A.S.; Leah, K.V.; Stephen, P. The
phosphorus cost of agriculture intensification in the tropics. Nat. Plants 2016, 2, 16043.37. USDA/NRCS. Soil ph. Soil Quality Kit—Guides for Educators. Available online: https://www.nrcs.usda.gov/Internet/FSE_
DOCUMENTS/nrcs142p2_053293.pdf (accessed on 3 October 2021).38. Waterer, D. Impact of high soil pH on potato yields and grade losses to common scab. Can. J. Plant. Sci. 2002, 82, 583–586.
[CrossRef]39. Understanding the Effect of Soil pH on Crop Productivity. Available online: http://www.agricura.co.zw/understanding-the-
effects-of-soil-ph-on-crop-productivity/ (accessed on 17 June 2021).40. Whalley, H.J.; Knight, M.R. Calcium Signatures are decoded by plants to give Specific Gene Responses. New Phytol. 2013, 197,
690–693. Available online: www.newphytologist.com (accessed on 24 February 2021). [CrossRef] [PubMed]41. Groffman, P.M.; Hendrix, P.F.; Crossley, D.A. Effects of a Winter Legume on Phosphorus, Potassium, Calcium and Magnesium
Cycling in a Humid Subtropical Agro Ecosystem. Agric. Ecosyst. Environ. 1987, 18, 281–289. [CrossRef]42. Koch, M.; Naumann, M.; Pawelzik, E. The Importance of Nutrient Management for Potato Production Part I. J. Plant Nutr. Yield
2020, 63, 97–119. [CrossRef]43. Chen, R.; Zhang, F.; Zhang, Q.; Sun, Q.; Dong, X.; Shen, R.F. Aluminium-phosphorus interactions in plants growing on acid soils:
Does phosphorus always alleviate aluminium toxicity? J. Sci. Food Agr. 2012, 92, 995–1000. [CrossRef] [PubMed]