Constraining the composition and thermal state of the moon ...
Upload
independentCategory
view
0download
0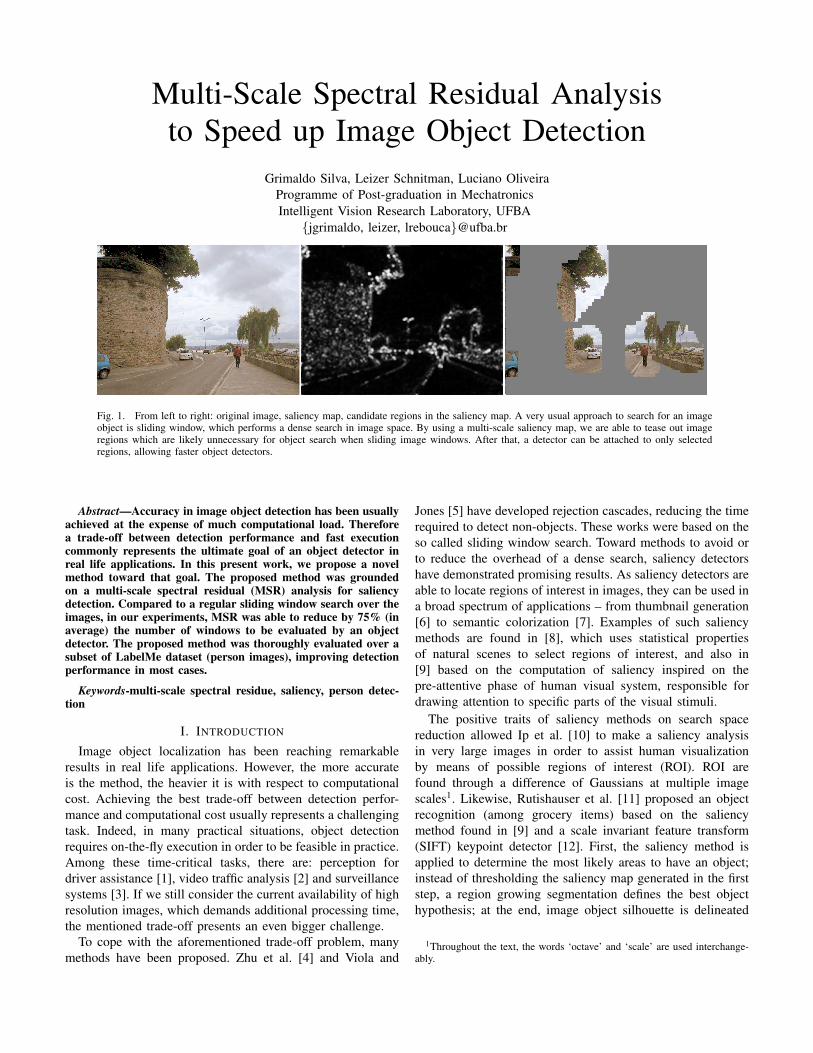
Multi-Scale Spectral Residual Analysisto Speed up Image Object Detection
Grimaldo Silva, Leizer Schnitman, Luciano OliveiraProgramme of Post-graduation in MechatronicsIntelligent Vision Research Laboratory, UFBA
{jgrimaldo, leizer, lrebouca}@ufba.br
Fig. 1. From left to right: original image, saliency map, candidate regions in the saliency map. A very usual approach to search for an imageobject is sliding window, which performs a dense search in image space. By using a multi-scale saliency map, we are able to tease out imageregions which are likely unnecessary for object search when sliding image windows. After that, a detector can be attached to only selectedregions, allowing faster object detectors.
Abstract—Accuracy in image object detection has been usuallyachieved at the expense of much computational load. Thereforea trade-off between detection performance and fast executioncommonly represents the ultimate goal of an object detector inreal life applications. In this present work, we propose a novelmethod toward that goal. The proposed method was groundedon a multi-scale spectral residual (MSR) analysis for saliencydetection. Compared to a regular sliding window search over theimages, in our experiments, MSR was able to reduce by 75% (inaverage) the number of windows to be evaluated by an objectdetector. The proposed method was thoroughly evaluated over asubset of LabelMe dataset (person images), improving detectionperformance in most cases.
Keywords-multi-scale spectral residue, saliency, person detec-tion
I. INTRODUCTION
Image object localization has been reaching remarkableresults in real life applications. However, the more accurateis the method, the heavier it is with respect to computationalcost. Achieving the best trade-off between detection perfor-mance and computational cost usually represents a challengingtask. Indeed, in many practical situations, object detectionrequires on-the-fly execution in order to be feasible in practice.Among these time-critical tasks, there are: perception fordriver assistance [1], video traffic analysis [2] and surveillancesystems [3]. If we still consider the current availability of highresolution images, which demands additional processing time,the mentioned trade-off presents an even bigger challenge.
To cope with the aforementioned trade-off problem, manymethods have been proposed. Zhu et al. [4] and Viola and
Jones [5] have developed rejection cascades, reducing the timerequired to detect non-objects. These works were based on theso called sliding window search. Toward methods to avoid orto reduce the overhead of a dense search, saliency detectorshave demonstrated promising results. As saliency detectors areable to locate regions of interest in images, they can be used ina broad spectrum of applications – from thumbnail generation[6] to semantic colorization [7]. Examples of such saliencymethods are found in [8], which uses statistical propertiesof natural scenes to select regions of interest, and also in[9] based on the computation of saliency inspired on thepre-attentive phase of human visual system, responsible fordrawing attention to specific parts of the visual stimuli.
The positive traits of saliency methods on search spacereduction allowed Ip et al. [10] to make a saliency analysisin very large images in order to assist human visualizationby means of possible regions of interest (ROI). ROI arefound through a difference of Gaussians at multiple imagescales1. Likewise, Rutishauser et al. [11] proposed an objectrecognition (among grocery items) based on the saliencymethod found in [9] and a scale invariant feature transform(SIFT) keypoint detector [12]. First, the saliency method isapplied to determine the most likely areas to have an object;instead of thresholding the saliency map generated in the firststep, a region growing segmentation defines the best objecthypothesis; at the end, image object silhouette is delineated
1Throughout the text, the words ‘octave’ and ‘scale’ are used interchange-ably.
by means of the keypoints detected over the salient areas.Feng et al. [13] address the problem of object detection usinga sliding window over an image, specifying each windowsaliency as the cost of composing it with remaining parts ofthe image; therefore the image is segmented into regions basedon similarity; the difference between regions is calculated overLAB histograms and spatial distances; these features are thenused to select the most differentiated windows which hopefullypresent the most salient objects.
On the reduction of image search space, Lampert et al. [14]propose the use of a branch-and-bound optimization appliedon the score of the classifier, which is used to separate inputspace. The method was called Efficient Subwindow Search(ESS). The target function is subjected to maximize the clas-sification score whereas minimizing the number of windowsevaluated by a detector. In its original form, that method onlydetects one object per image, but it can be modified to searchfor multiple objects. ESS effectively reduces the number ofevaluated windows over the image in contrast to regular slidingwindow based detectors [5], [15], [16].
Following all these ideas, the multi-scale spectral residue(MSR) analysis aims to speed up sliding window-based objectdetection by spectral residual analysis on multiple scales. Ourmethod relies on a sliding window approach based on theimage saliency with the goal of assigning a score to eachwindow before object detection stage (see Fig. ). AlthoughFeng et al. [13] also assign a saliency score to each window,our approach has some important differences. MSR computesan image-wise saliency following the rationale in [8], in amore flexible way, allowing saliency detection in the originalimage aspect ratio. Additionally, we explore properties of thefrequency domain to extract interesting regions in contrastto the use of spatial properties such as composability ofsegments. MSR differs from ESS in the requirements andmethodology. ESS avoids a dense detector search by using anoptimization method that requires a linear classifier and localimage descriptors such as [12]. MSR does not impose suchconstraints, and can be used on most sliding window baseddetectors by relying solely on an object saliency. Our approachalso avoids assumptions about an object shape to reduce thesearch space, as such, it does not attempt to segment an objectbased on salient locations, as in Rutishauser et al. [11]; instead,MSR indicates regions of interest and relies on a classifierfor actual object detection and localization. Recent solutionsof rejection cascades [4] [5] in a sliding window search caneasily be integrated to MSR. This latter can be combined withMSR in order to achieve faster processing time.
This work is structured as follows: an overview of saliencydetection methods is given in Section II. Section III describesMSR and a methodology to evaluate the impact of windowselection on detector performance. In Section IV, the MSRis compared to other saliency methods, and its runtime anddetection performance are measured over a person dataset.Finally, overall conclusions are drawn in Section V.
Contributions: Our contribution resides in a novelmethod, called MSR, with the aim of achieving a better trade-
Window Selection Step
Calculate
Saliency
Select each
octave
Several octaves of
input image
Apply object detector
on selected windows
Select candidate
windows
Return selected
windows
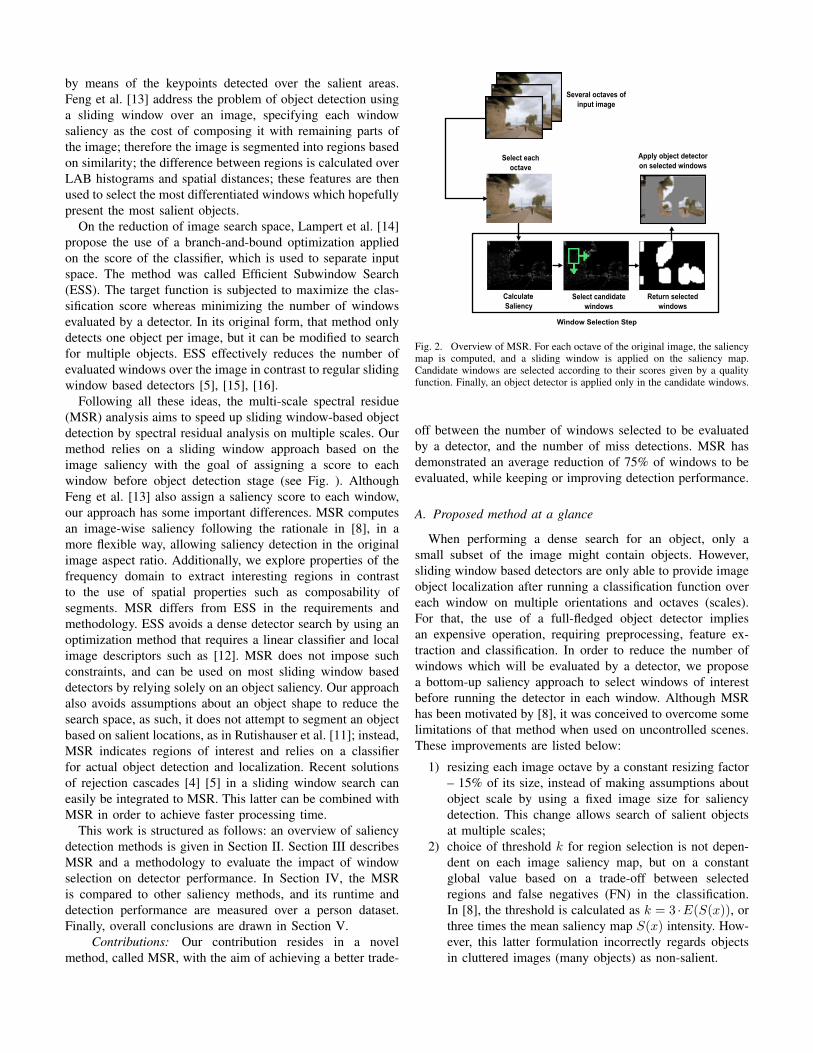
Fig. 2. Overview of MSR. For each octave of the original image, the saliencymap is computed, and a sliding window is applied on the saliency map.Candidate windows are selected according to their scores given by a qualityfunction. Finally, an object detector is applied only in the candidate windows.
off between the number of windows selected to be evaluatedby a detector, and the number of miss detections. MSR hasdemonstrated an average reduction of 75% of windows to beevaluated, while keeping or improving detection performance.
A. Proposed method at a glance
When performing a dense search for an object, only asmall subset of the image might contain objects. However,sliding window based detectors are only able to provide imageobject localization after running a classification function overeach window on multiple orientations and octaves (scales).For that, the use of a full-fledged object detector impliesan expensive operation, requiring preprocessing, feature ex-traction and classification. In order to reduce the number ofwindows which will be evaluated by a detector, we proposea bottom-up saliency approach to select windows of interestbefore running the detector in each window. Although MSRhas been motivated by [8], it was conceived to overcome somelimitations of that method when used on uncontrolled scenes.These improvements are listed below:
1) resizing each image octave by a constant resizing factor– 15% of its size, instead of making assumptions aboutobject scale by using a fixed image size for saliencydetection. This change allows search of salient objectsat multiple scales;
2) choice of threshold k for region selection is not depen-dent on each image saliency map, but on a constantglobal value based on a trade-off between selectedregions and false negatives (FN) in the classification.In [8], the threshold is calculated as k = 3 ·E(S(x)), orthree times the mean saliency map S(x) intensity. How-ever, this latter formulation incorrectly regards objectsin cluttered images (many objects) as non-salient.
3) saliency quality in a region is calculated from a window-wise saliency mean, instead of using pixel values indi-vidually as in [8], allowing detection of entire objectseven when their saliency is non-uniform along its length.
Instead of relying on the object detector to choose the mostlikely image region to contain an object (just after obtainingthe saliency map), windows are slid over an integral saliencyspace. This latter step corresponds to computing the integralimage of the pixels in the saliency space in the same wayas Viola and Jones [5]. After that, a quality function f(·) isapplied at each window w, providing a score. The score ofa given window is calculated using the mean of its saliencyintensity, and a window is selected if its score is greater thanor equal to a threshold k. A higher k selects smaller numberof windows, while potentially missing more true positive (TP)detections in the further steps of the method. Conversely, asvalue of k gets lower, MSR approaches to a method basedon regular sliding window search. An overview of MSRmechanism for window selection is summarized in Fig. 2.
II. OVERVIEW OF SALIENCY DETECTION APPROACHES
An object draws more attention when it has a strong contrastin relation to its neighbourhood, objects such as traffic signs ora stop light were created to explore this property in order to beperceived faster than surrounding objects. While an attentionmechanism can help a person focus on specific objects in ascene, in a similar way, an algorithm capable of detectingsalient objects in images must search for characteristics suchas visual uniqueness, rarity and unpredictability [17]. This isso in order to correctly highlight image regions which demandextra attention. Following these ideas, we briefly summarizesome of saliency detectors:
Itti’s method (IT): Among the first salient methods, abiologically inspired approach was developed by Itti et al.[9]. In that approach, saliency of a given pixel is calculatedbased on its uniqueness in relation to local surroundings.Uniqueness is defined on the analysis of color, intensity andorientation over multiple scales. After that, these features arethen normalized and combined in a way where channels withlarger contrasts are preferred.
Graph based (GB) visual saliency: Similarly to Itti,Harel et al. [18] form activation maps from particular fea-ture channels, and normalize them to better highlight salientregions.
Frequency tuned (FT) saliency region detection: Insteadof using local information to define the saliency, Achanta et al.[19] define saliency of a pixel as its distance from the imagepixel mean on LAB space, formally represented as
Sa(x, y) = ||Iπ − I(x, y)||2 , (1)
where Iπ is the mean image feature vector, I(x, y) is theoriginal pixel value, || · ||2 represents an L2 norm where eachpixel is a feature vector of type [L, a, b].
Luminance contrast (LC): Also using global contrast,Zhai and Shah [20] developed a method for pixel-level saliencydetection using the contrast of a pixel with respect to the othersin a scene. It is given by
Sz(Ik) =∑∀Ii∈I
||Ik − Ii|| , (2)
where Ii and Ik are pixels in the image and || · || representsthe Euclidean distance.
Spectral residual (SR): Similar to global methods, fre-quency based approaches also explore properties of the entireimage. Hou and Zhang [8] used these properties based on1/f ’s law, which states that an ensemble of images on theFourier Spectrum obeys the distribution
E{A(f)} ∝ 1/f , (3)
where A(f) is the amplitude averaged over orientations, and fis a given spectrum in the frequency domain. Whilst objects donot follow properties of natural scenes, detection of potentialsalient points is based on finding statistical singularities on thespectrum of an image. These singularities are called spectralresidues.
III. PRUNING WINDOWS BY MULTI-SCALE SPECTRALRESIDUE
Saliency detectors are able to associate a degree of local orglobal uniqueness for each image pixel (or group of pixels).This information is useful to help pruning undesired windows.In this regard, during a search for objects via sliding windows,the capability to choose whether a detector will evaluate aparticular window or ignore it (based on its object likelihood)can bring benefits to speed up the classification task in furthersteps.
Saliency detectors face additional complexities when deal-ing with uncontrolled scenes, such as variations in object(color, size, illumination and noise). Particularly, it is note-worthy that spectral residual (SR) analysis [8] is susceptibleto those factors when selecting image ROI, since an objectmay have intense intra-variability. To avoid that, in MSR,saliency is measured in a per-window basis, and the saliency ofa window is defined as the mean intensity of its salient pixels,enabling higher resilience to variability of salient pixels.
Another limitation of SR in the context of aiding objectdetectors is its threshold for region selection, defined ask = 3 ∗ E(S(x)) where E(S(x)) denotes the mean valueof the saliency map and k the threshold. Such scheme expectsthat images have but a small number of salient regions. Ifit is not the case, that method potentially excludes importantobjects because of the high lower bound. Given that situation,we define the threshold k as a constant value throughout theentire collection of images, representing an average trade-offbetween the number of selected windows and false negatives(FN) caused by window selection.
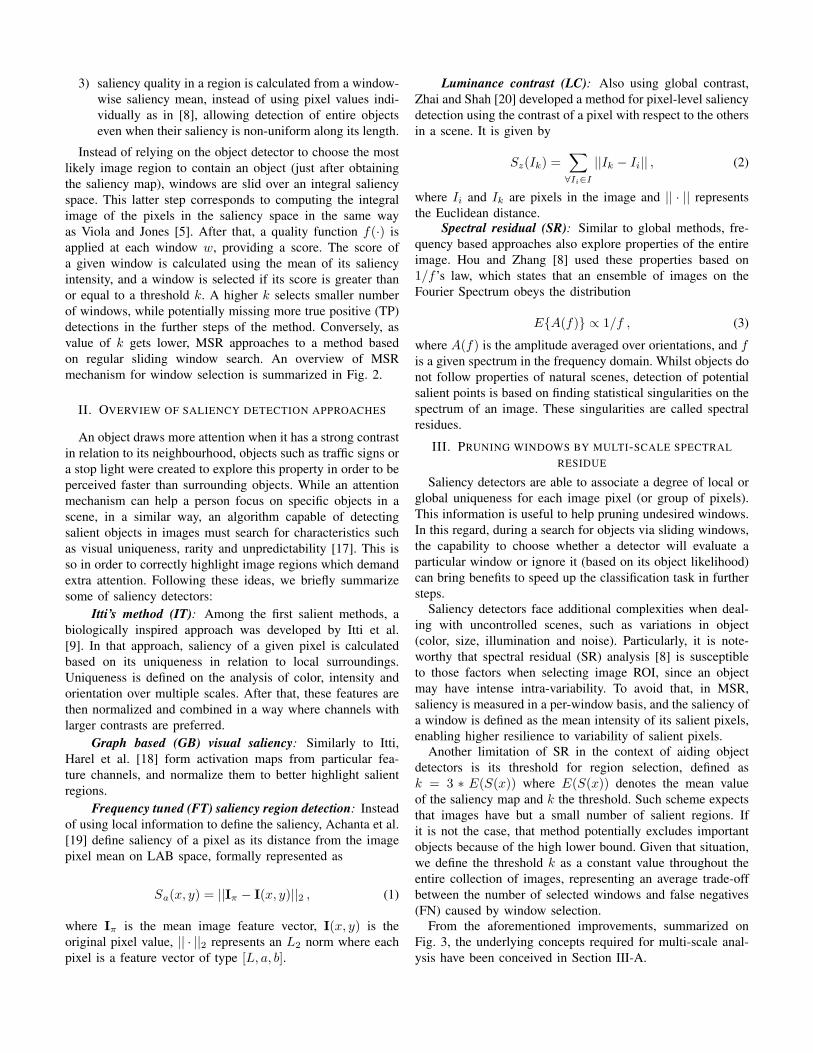
From the aforementioned improvements, summarized onFig. 3, the underlying concepts required for multi-scale anal-ysis have been conceived in Section III-A.
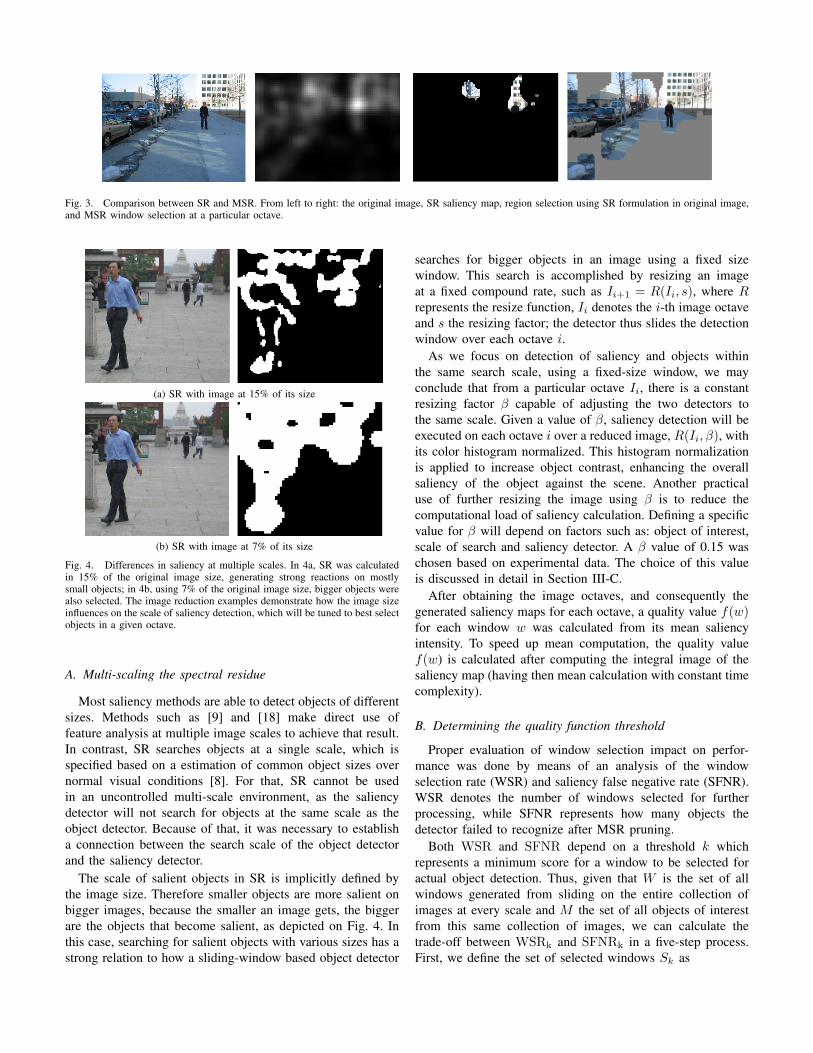
Fig. 3. Comparison between SR and MSR. From left to right: the original image, SR saliency map, region selection using SR formulation in original image,and MSR window selection at a particular octave.
(a) SR with image at 15% of its size
(b) SR with image at 7% of its size
Fig. 4. Differences in saliency at multiple scales. In 4a, SR was calculatedin 15% of the original image size, generating strong reactions on mostlysmall objects; in 4b, using 7% of the original image size, bigger objects werealso selected. The image reduction examples demonstrate how the image sizeinfluences on the scale of saliency detection, which will be tuned to best selectobjects in a given octave.
A. Multi-scaling the spectral residue
Most saliency methods are able to detect objects of differentsizes. Methods such as [9] and [18] make direct use offeature analysis at multiple image scales to achieve that result.In contrast, SR searches objects at a single scale, which isspecified based on a estimation of common object sizes overnormal visual conditions [8]. For that, SR cannot be usedin an uncontrolled multi-scale environment, as the saliencydetector will not search for objects at the same scale as theobject detector. Because of that, it was necessary to establisha connection between the search scale of the object detectorand the saliency detector.
The scale of salient objects in SR is implicitly defined bythe image size. Therefore smaller objects are more salient onbigger images, because the smaller an image gets, the biggerare the objects that become salient, as depicted on Fig. 4. Inthis case, searching for salient objects with various sizes has astrong relation to how a sliding-window based object detector
searches for bigger objects in an image using a fixed sizewindow. This search is accomplished by resizing an imageat a fixed compound rate, such as Ii+1 = R(Ii, s), where Rrepresents the resize function, Ii denotes the i-th image octaveand s the resizing factor; the detector thus slides the detectionwindow over each octave i.
As we focus on detection of saliency and objects withinthe same search scale, using a fixed-size window, we mayconclude that from a particular octave Ii, there is a constantresizing factor β capable of adjusting the two detectors tothe same scale. Given a value of β, saliency detection will beexecuted on each octave i over a reduced image, R(Ii, β), withits color histogram normalized. This histogram normalizationis applied to increase object contrast, enhancing the overallsaliency of the object against the scene. Another practicaluse of further resizing the image using β is to reduce thecomputational load of saliency calculation. Defining a specificvalue for β will depend on factors such as: object of interest,scale of search and saliency detector. A β value of 0.15 waschosen based on experimental data. The choice of this valueis discussed in detail in Section III-C.
After obtaining the image octaves, and consequently thegenerated saliency maps for each octave, a quality value f(w)for each window w was calculated from its mean saliencyintensity. To speed up mean computation, the quality valuef(w) is calculated after computing the integral image of thesaliency map (having then mean calculation with constant timecomplexity).
B. Determining the quality function threshold
Proper evaluation of window selection impact on perfor-mance was done by means of an analysis of the windowselection rate (WSR) and saliency false negative rate (SFNR).WSR denotes the number of windows selected for furtherprocessing, while SFNR represents how many objects thedetector failed to recognize after MSR pruning.
Both WSR and SFNR depend on a threshold k whichrepresents a minimum score for a window to be selected foractual object detection. Thus, given that W is the set of allwindows generated from sliding on the entire collection ofimages at every scale and M the set of all objects of interestfrom this same collection of images, we can calculate thetrade-off between WSRk and SFNRk in a five-step process.First, we define the set of selected windows Sk as
Sk = {w ∈ W | f(w) ≥ k} , (4)
where f(w) is the quality value of a window w and k is thethreshold for window selection. Given Sk, it is possible tocalculate the window selection rate with
WSRk =n(Sk)
n(W ), (5)
where n(·) denotes cardinality of a set. To calculate theSFNRk one should enumerate for each object j ∈ M thenumber of windows in which the object was correctly matched,given by
Ck,j = {w ∈ Sk | o(w) = j} , (6)
where o(w) is a function that, in case an object exists atwindow w, and this is correctly classified by a detector, returnsthe matched object from set M ; otherwise o(w) returns anyelement /∈ M. From that, its trivial to find the set of objectsdetected, Fk, defined as
Fk = {j ∈ M | n(Ck,j) ≥ 1} . (7)
Finally, in order to calculate how many miss detections werecaused by the saliency (SFNR), we use
SFNRk =n(Fkmin)− n(Fk)
n(Fkmin), (8)
where kmin is the minimum threshold value, which guaranteesSkmin = W . Thus, to generate a full trade-off curve, thisprocess is repeated for each k ∈ K where K is the set ofunique window scores.
C. Parameter choice
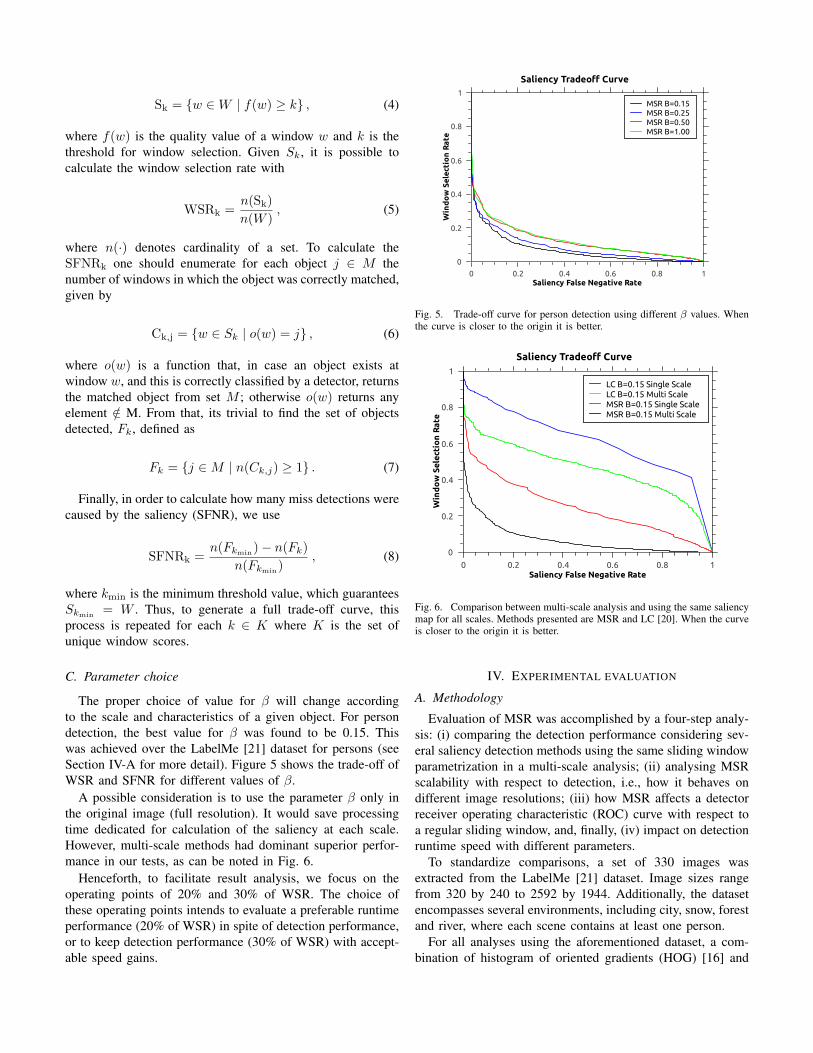
The proper choice of value for β will change accordingto the scale and characteristics of a given object. For persondetection, the best value for β was found to be 0.15. Thiswas achieved over the LabelMe [21] dataset for persons (seeSection IV-A for more detail). Figure 5 shows the trade-off ofWSR and SFNR for different values of β.
A possible consideration is to use the parameter β only inthe original image (full resolution). It would save processingtime dedicated for calculation of the saliency at each scale.However, multi-scale methods had dominant superior perfor-mance in our tests, as can be noted in Fig. 6.
Henceforth, to facilitate result analysis, we focus on theoperating points of 20% and 30% of WSR. The choice ofthese operating points intends to evaluate a preferable runtimeperformance (20% of WSR) in spite of detection performance,or to keep detection performance (30% of WSR) with accept-able speed gains.
Saliency Tradeo� Curve
Win
do
w S
ele
ctio
n R
ate
0
0.2
0.4
0.6
0.8
1
Saliency False Negative Rate0 0.2 0.4 0.6 0.8 1
MSR B=0.15
MSR B=0.25
MSR B=0.50
MSR B=1.00
Fig. 5. Trade-off curve for person detection using different β values. Whenthe curve is closer to the origin it is better.
Saliency Tradeo� Curve
Win
do
w S
ele
ctio
n R
ate
0
0.2
0.4
0.6
0.8
1
Saliency False Negative Rate0 0.2 0.4 0.6 0.8 1
LC B=0.15 Single Scale LC B=0.15 Multi Scale MSR B=0.15 Single Scale MSR B=0.15 Multi Scale
Fig. 6. Comparison between multi-scale analysis and using the same saliencymap for all scales. Methods presented are MSR and LC [20]. When the curveis closer to the origin it is better.
IV. EXPERIMENTAL EVALUATION
A. Methodology
Evaluation of MSR was accomplished by a four-step analy-sis: (i) comparing the detection performance considering sev-eral saliency detection methods using the same sliding windowparametrization in a multi-scale analysis; (ii) analysing MSRscalability with respect to detection, i.e., how it behaves ondifferent image resolutions; (iii) how MSR affects a detectorreceiver operating characteristic (ROC) curve with respect toa regular sliding window, and, finally, (iv) impact on detectionruntime speed with different parameters.
To standardize comparisons, a set of 330 images wasextracted from the LabelMe [21] dataset. Image sizes rangefrom 320 by 240 to 2592 by 1944. Additionally, the datasetencompasses several environments, including city, snow, forestand river, where each scene contains at least one person.
For all analyses using the aforementioned dataset, a com-bination of histogram of oriented gradients (HOG) [16] and
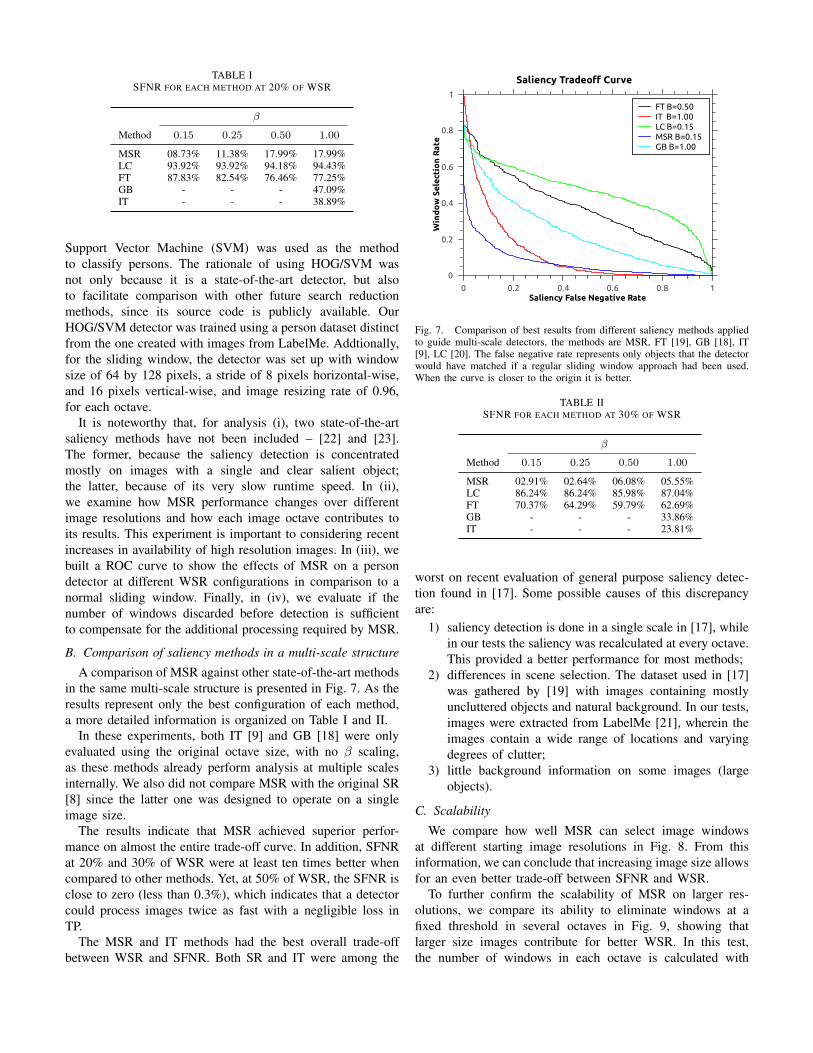
TABLE ISFNR FOR EACH METHOD AT 20% OF WSR
β
Method 0.15 0.25 0.50 1.00
MSR 08.73% 11.38% 17.99% 17.99%LC 93.92% 93.92% 94.18% 94.43%FT 87.83% 82.54% 76.46% 77.25%GB - - - 47.09%IT - - - 38.89%
Support Vector Machine (SVM) was used as the methodto classify persons. The rationale of using HOG/SVM wasnot only because it is a state-of-the-art detector, but alsoto facilitate comparison with other future search reductionmethods, since its source code is publicly available. OurHOG/SVM detector was trained using a person dataset distinctfrom the one created with images from LabelMe. Addtionally,for the sliding window, the detector was set up with windowsize of 64 by 128 pixels, a stride of 8 pixels horizontal-wise,and 16 pixels vertical-wise, and image resizing rate of 0.96,for each octave.
It is noteworthy that, for analysis (i), two state-of-the-artsaliency methods have not been included – [22] and [23].The former, because the saliency detection is concentratedmostly on images with a single and clear salient object;the latter, because of its very slow runtime speed. In (ii),we examine how MSR performance changes over differentimage resolutions and how each image octave contributes toits results. This experiment is important to considering recentincreases in availability of high resolution images. In (iii), webuilt a ROC curve to show the effects of MSR on a persondetector at different WSR configurations in comparison to anormal sliding window. Finally, in (iv), we evaluate if thenumber of windows discarded before detection is sufficientto compensate for the additional processing required by MSR.
B. Comparison of saliency methods in a multi-scale structure
A comparison of MSR against other state-of-the-art methodsin the same multi-scale structure is presented in Fig. 7. As theresults represent only the best configuration of each method,a more detailed information is organized on Table I and II.
In these experiments, both IT [9] and GB [18] were onlyevaluated using the original octave size, with no β scaling,as these methods already perform analysis at multiple scalesinternally. We also did not compare MSR with the original SR[8] since the latter one was designed to operate on a singleimage size.
The results indicate that MSR achieved superior perfor-mance on almost the entire trade-off curve. In addition, SFNRat 20% and 30% of WSR were at least ten times better whencompared to other methods. Yet, at 50% of WSR, the SFNR isclose to zero (less than 0.3%), which indicates that a detectorcould process images twice as fast with a negligible loss inTP.
The MSR and IT methods had the best overall trade-offbetween WSR and SFNR. Both SR and IT were among the
Saliency Tradeo� Curve
Win
do
w S
ele
ctio
n R
ate
0
0.2
0.4
0.6
0.8
1
Saliency False Negative Rate0 0.2 0.4 0.6 0.8 1
FT B=0.50
IT B=1.00
LC B=0.15
MSR B=0.15
GB B=1.00
Fig. 7. Comparison of best results from different saliency methods appliedto guide multi-scale detectors, the methods are MSR, FT [19], GB [18], IT[9], LC [20]. The false negative rate represents only objects that the detectorwould have matched if a regular sliding window approach had been used.When the curve is closer to the origin it is better.
TABLE IISFNR FOR EACH METHOD AT 30% OF WSR
β
Method 0.15 0.25 0.50 1.00
MSR 02.91% 02.64% 06.08% 05.55%LC 86.24% 86.24% 85.98% 87.04%FT 70.37% 64.29% 59.79% 62.69%GB - - - 33.86%IT - - - 23.81%
worst on recent evaluation of general purpose saliency detec-tion found in [17]. Some possible causes of this discrepancyare:
1) saliency detection is done in a single scale in [17], whilein our tests the saliency was recalculated at every octave.This provided a better performance for most methods;
2) differences in scene selection. The dataset used in [17]was gathered by [19] with images containing mostlyuncluttered objects and natural background. In our tests,images were extracted from LabelMe [21], wherein theimages contain a wide range of locations and varyingdegrees of clutter;
3) little background information on some images (largeobjects).
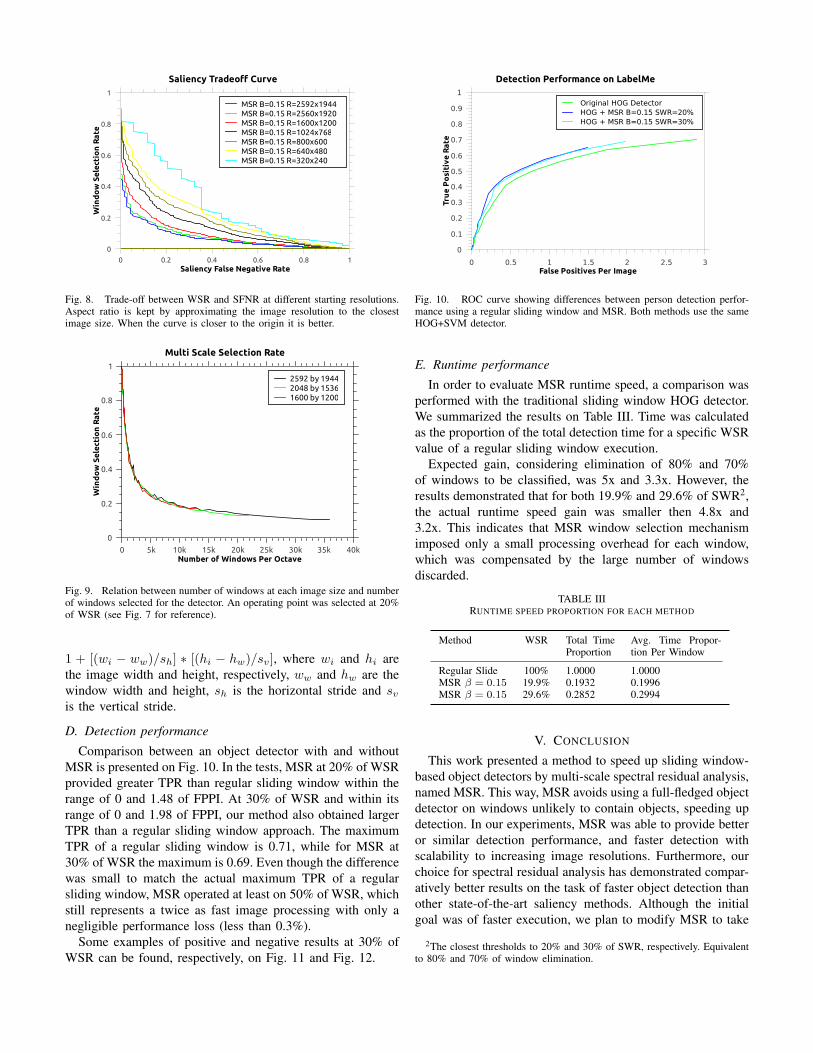
C. Scalability
We compare how well MSR can select image windowsat different starting image resolutions in Fig. 8. From thisinformation, we can conclude that increasing image size allowsfor an even better trade-off between SFNR and WSR.
To further confirm the scalability of MSR on larger res-olutions, we compare its ability to eliminate windows at afixed threshold in several octaves in Fig. 9, showing thatlarger size images contribute for better WSR. In this test,the number of windows in each octave is calculated with
Saliency Tradeo� Curve
Win
do
w S
ele
ctio
n R
ate
0
0.2
0.4
0.6
0.8
1
Saliency False Negative Rate0 0.2 0.4 0.6 0.8 1
MSR B=0.15 R=2592x1944
MSR B=0.15 R=2560x1920
MSR B=0.15 R=1600x1200
MSR B=0.15 R=1024x768
MSR B=0.15 R=800x600
MSR B=0.15 R=640x480
MSR B=0.15 R=320x240
Fig. 8. Trade-off between WSR and SFNR at different starting resolutions.Aspect ratio is kept by approximating the image resolution to the closestimage size. When the curve is closer to the origin it is better.
Multi Scale Selection Rate
Window Selection Rate
0
0.2
0.4
0.6
0.8
1
Number of Windows Per Octave
0 5k 10k 15k 20k 25k 30k 35k 40k
2592 by 19442048 by 15361600 by 1200
Fig. 9. Relation between number of windows at each image size and numberof windows selected for the detector. An operating point was selected at 20%of WSR (see Fig. 7 for reference).
1 + [(wi − ww)/sh] ∗ [(hi − hw)/sv], where wi and hi arethe image width and height, respectively, ww and hw are thewindow width and height, sh is the horizontal stride and svis the vertical stride.
D. Detection performance
Comparison between an object detector with and withoutMSR is presented on Fig. 10. In the tests, MSR at 20% of WSRprovided greater TPR than regular sliding window within therange of 0 and 1.48 of FPPI. At 30% of WSR and within itsrange of 0 and 1.98 of FPPI, our method also obtained largerTPR than a regular sliding window approach. The maximumTPR of a regular sliding window is 0.71, while for MSR at30% of WSR the maximum is 0.69. Even though the differencewas small to match the actual maximum TPR of a regularsliding window, MSR operated at least on 50% of WSR, whichstill represents a twice as fast image processing with only anegligible performance loss (less than 0.3%).
Some examples of positive and negative results at 30% ofWSR can be found, respectively, on Fig. 11 and Fig. 12.
Detection Performance on LabelMe
Tru
e Positive Rate
0
0.1
0.2
0.3
0.4
0.5
0.6
0.7
0.8
0.9
1
False Positives Per Image0 0.5 1 1.5 2 2.5 3
Original HOG Detector
HOG + MSR B=0.15 SWR=20%
HOG + MSR B=0.15 SWR=30%
Fig. 10. ROC curve showing differences between person detection perfor-mance using a regular sliding window and MSR. Both methods use the sameHOG+SVM detector.
E. Runtime performance
In order to evaluate MSR runtime speed, a comparison wasperformed with the traditional sliding window HOG detector.We summarized the results on Table III. Time was calculatedas the proportion of the total detection time for a specific WSRvalue of a regular sliding window execution.
Expected gain, considering elimination of 80% and 70%of windows to be classified, was 5x and 3.3x. However, theresults demonstrated that for both 19.9% and 29.6% of SWR2,the actual runtime speed gain was smaller then 4.8x and3.2x. This indicates that MSR window selection mechanismimposed only a small processing overhead for each window,which was compensated by the large number of windowsdiscarded.
TABLE IIIRUNTIME SPEED PROPORTION FOR EACH METHOD
Method WSR Total TimeProportion
Avg. Time Propor-tion Per Window
Regular Slide 100% 1.0000 1.0000MSR β = 0.15 19.9% 0.1932 0.1996MSR β = 0.15 29.6% 0.2852 0.2994
V. CONCLUSION
This work presented a method to speed up sliding window-based object detectors by multi-scale spectral residual analysis,named MSR. This way, MSR avoids using a full-fledged objectdetector on windows unlikely to contain objects, speeding updetection. In our experiments, MSR was able to provide betteror similar detection performance, and faster detection withscalability to increasing image resolutions. Furthermore, ourchoice for spectral residual analysis has demonstrated compar-atively better results on the task of faster object detection thanother state-of-the-art saliency methods. Although the initialgoal was of faster execution, we plan to modify MSR to take
2The closest thresholds to 20% and 30% of SWR, respectively. Equivalentto 80% and 70% of window elimination.
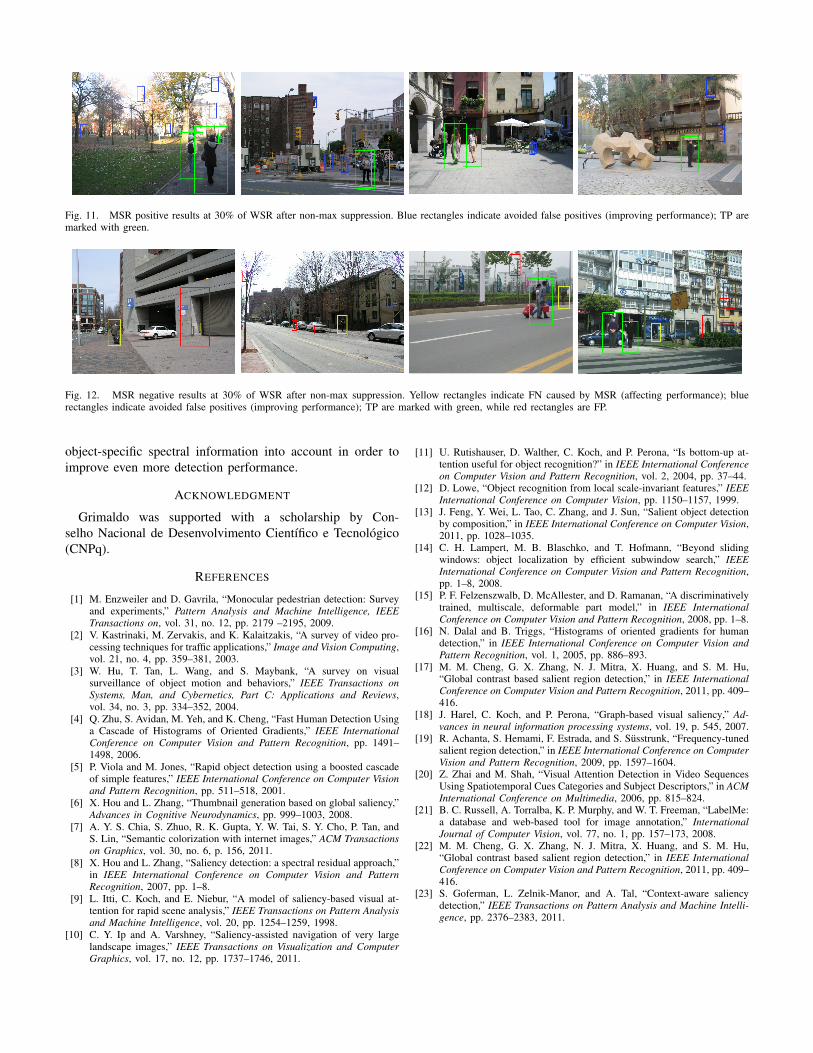
Fig. 11. MSR positive results at 30% of WSR after non-max suppression. Blue rectangles indicate avoided false positives (improving performance); TP aremarked with green.
Fig. 12. MSR negative results at 30% of WSR after non-max suppression. Yellow rectangles indicate FN caused by MSR (affecting performance); bluerectangles indicate avoided false positives (improving performance); TP are marked with green, while red rectangles are FP.
object-specific spectral information into account in order toimprove even more detection performance.
ACKNOWLEDGMENT
Grimaldo was supported with a scholarship by Con-selho Nacional de Desenvolvimento Cientıfico e Tecnologico(CNPq).
REFERENCES
[1] M. Enzweiler and D. Gavrila, “Monocular pedestrian detection: Surveyand experiments,” Pattern Analysis and Machine Intelligence, IEEETransactions on, vol. 31, no. 12, pp. 2179 –2195, 2009.
[2] V. Kastrinaki, M. Zervakis, and K. Kalaitzakis, “A survey of video pro-cessing techniques for traffic applications,” Image and Vision Computing,vol. 21, no. 4, pp. 359–381, 2003.
[3] W. Hu, T. Tan, L. Wang, and S. Maybank, “A survey on visualsurveillance of object motion and behaviors,” IEEE Transactions onSystems, Man, and Cybernetics, Part C: Applications and Reviews,vol. 34, no. 3, pp. 334–352, 2004.
[4] Q. Zhu, S. Avidan, M. Yeh, and K. Cheng, “Fast Human Detection Usinga Cascade of Histograms of Oriented Gradients,” IEEE InternationalConference on Computer Vision and Pattern Recognition, pp. 1491–1498, 2006.
[5] P. Viola and M. Jones, “Rapid object detection using a boosted cascadeof simple features,” IEEE International Conference on Computer Visionand Pattern Recognition, pp. 511–518, 2001.
[6] X. Hou and L. Zhang, “Thumbnail generation based on global saliency,”Advances in Cognitive Neurodynamics, pp. 999–1003, 2008.
[7] A. Y. S. Chia, S. Zhuo, R. K. Gupta, Y. W. Tai, S. Y. Cho, P. Tan, andS. Lin, “Semantic colorization with internet images,” ACM Transactionson Graphics, vol. 30, no. 6, p. 156, 2011.
[8] X. Hou and L. Zhang, “Saliency detection: a spectral residual approach,”in IEEE International Conference on Computer Vision and PatternRecognition, 2007, pp. 1–8.
[9] L. Itti, C. Koch, and E. Niebur, “A model of saliency-based visual at-tention for rapid scene analysis,” IEEE Transactions on Pattern Analysisand Machine Intelligence, vol. 20, pp. 1254–1259, 1998.
[10] C. Y. Ip and A. Varshney, “Saliency-assisted navigation of very largelandscape images,” IEEE Transactions on Visualization and ComputerGraphics, vol. 17, no. 12, pp. 1737–1746, 2011.
[11] U. Rutishauser, D. Walther, C. Koch, and P. Perona, “Is bottom-up at-tention useful for object recognition?” in IEEE International Conferenceon Computer Vision and Pattern Recognition, vol. 2, 2004, pp. 37–44.
[12] D. Lowe, “Object recognition from local scale-invariant features,” IEEEInternational Conference on Computer Vision, pp. 1150–1157, 1999.
[13] J. Feng, Y. Wei, L. Tao, C. Zhang, and J. Sun, “Salient object detectionby composition,” in IEEE International Conference on Computer Vision,2011, pp. 1028–1035.
[14] C. H. Lampert, M. B. Blaschko, and T. Hofmann, “Beyond slidingwindows: object localization by efficient subwindow search,” IEEEInternational Conference on Computer Vision and Pattern Recognition,pp. 1–8, 2008.
[15] P. F. Felzenszwalb, D. McAllester, and D. Ramanan, “A discriminativelytrained, multiscale, deformable part model,” in IEEE InternationalConference on Computer Vision and Pattern Recognition, 2008, pp. 1–8.
[16] N. Dalal and B. Triggs, “Histograms of oriented gradients for humandetection,” in IEEE International Conference on Computer Vision andPattern Recognition, vol. 1, 2005, pp. 886–893.
[17] M. M. Cheng, G. X. Zhang, N. J. Mitra, X. Huang, and S. M. Hu,“Global contrast based salient region detection,” in IEEE InternationalConference on Computer Vision and Pattern Recognition, 2011, pp. 409–416.
[18] J. Harel, C. Koch, and P. Perona, “Graph-based visual saliency,” Ad-vances in neural information processing systems, vol. 19, p. 545, 2007.
[19] R. Achanta, S. Hemami, F. Estrada, and S. Susstrunk, “Frequency-tunedsalient region detection,” in IEEE International Conference on ComputerVision and Pattern Recognition, 2009, pp. 1597–1604.
[20] Z. Zhai and M. Shah, “Visual Attention Detection in Video SequencesUsing Spatiotemporal Cues Categories and Subject Descriptors,” in ACMInternational Conference on Multimedia, 2006, pp. 815–824.
[21] B. C. Russell, A. Torralba, K. P. Murphy, and W. T. Freeman, “LabelMe:a database and web-based tool for image annotation,” InternationalJournal of Computer Vision, vol. 77, no. 1, pp. 157–173, 2008.
[22] M. M. Cheng, G. X. Zhang, N. J. Mitra, X. Huang, and S. M. Hu,“Global contrast based salient region detection,” in IEEE InternationalConference on Computer Vision and Pattern Recognition, 2011, pp. 409–416.
[23] S. Goferman, L. Zelnik-Manor, and A. Tal, “Context-aware saliencydetection,” IEEE Transactions on Pattern Analysis and Machine Intelli-gence, pp. 2376–2383, 2011.
Copyright © 2022 FDOKUMEN