Facilitating Korean Reconciliation through Constitutional Law
Upload
independentCategory
view
0download
0
lable at ScienceDirect
Journal of Environmental Management 92 (2011) 1104e1114
Contents lists avai
Journal of Environmental Management
journal homepage: www.elsevier .com/locate/ jenvman
Understanding stewardship behaviour: Factors facilitating and constrainingprivate water well stewardship
Reid Kreutzwiser a, Rob de Loë b,*, Krystian Imgrund b, Mary Jane Conboy c, Hugh Simpson d,Ryan Plummer e,f
aDepartment of Geography, University of Guelph, 50 Stone Rd. E., Guelph, ON N1G 2W1, CanadabDepartment of Environment and Resources, University of Waterloo, 200 University Ave. W., Waterloo, ON N2L 3G1, CanadacWell Wise Resource Centre, 5315 Main St., Orono, ON L0B 1M0, CanadadOntario Ministry of Agriculture, Food and Rural Affairs, 1 Stone Rd. W., Guelph, ON N1G 4Y2, CanadaeDepartment of Tourism and Environment, Brock University, 500 Glenridge Ave., St. Catharines, ON L2S 3A1, Canadaf Stockholm Resilience Centre, SE-106 91 Stockholm, Sweden
a r t i c l e i n f o
Article history:Received 7 June 2010Received in revised form19 October 2010Accepted 22 November 2010Available online 24 December 2010
Keywords:Private wellsStewardshipWater managementBehaviourGroundwater contaminationSource water protection
* Corresponding author. Tel.: þ1 519 888 4567x386E-mail address: [email protected] (R. de Loë).
0301-4797/$ e see front matter � 2010 Elsevier Ltd.doi:10.1016/j.jenvman.2010.11.017
a b s t r a c t
Regulatory frameworks to ensure municipal drinking water safety exist in most North American juris-dictions. However, similar protection is rarely provided to people reliant on water provided from privatewells. In Canada, approximately 4 million people depend on privately owned, domestic wells for theirdrinking water. Numerous studies have shown that people who rely on private wells for their watersupplies are at risk from nitrate and bacterial contamination. Given the fact that regulations relating toprivate wells tend to be weak or poorly enforced, actions taken by well owners to protect their owndrinking water safety are extremely important. Drawing on one of the largest and most comprehensivesurveys of private well owners ever conducted in Canada or elsewhere, this paper explores factors thatinfluence well owner stewardship behaviour. Key behaviours examined included annual testing of wellwater and inspection of wells, measures to protect water quality, and proper decommissioning of unusedwells. A geographically-stratified survey, sent to 4950 well owners in Ontario, Canada, resulted in aneffective response rate of 34% (n ¼ 1567). Logistic regression analyses revealed that motivations for wellstewardship behaviours included reassurance, the perception of problems, and knowledge of the envi-ronment. Knowing how to perform stewardship behaviours was an important antecedent to action.Barriers to stewardship included complacency, inconvenience, ignorance, cost, and privacy concerns. Topromote stewardship, local initiatives, better educational materials, and enforcement through real estatelaws are all required. Ultimately, drinking water safety for people reliant on private wells is shown to bea responsibility shared by governments and private well owners.
� 2010 Elsevier Ltd. All rights reserved.
1. Introduction
Groundwater contamination is a continuing threat to ruralwater users. Over 43 million people dependent on privately owned,domestic water wells in the United States (Huston et al., 2004) andapproximately 4 million in Canada (Corkal et al., 2004;Environment Canada, 2004). Numerous studies have confirmedthat many of these wells have drinking water below standards forhuman consumption. For example, a recent study of private wellsacross the United States completed by the U.S. Geological Surveyfound that 23% of 1389 wells sampled from 1991e2004 contained
48; fax: þ1 519 746 0292.
All rights reserved.
at least one contaminant in excess of accepted human-healthbenchmarks (De Simone et al., 2009); the most prevalent anthro-pogenic chemical contaminant was nitrate, which this study foundabove the maximum contaminant level (MCL) in 4.4% of wellssampled. Total coliform and E. coli, were also common, beingdetected in 34% and 8% of a subsample of 397 wells, respectively(De Simone et al., 2009). Other studies from the United States andCanada have reported similar findings. Focazio et al. (2006) foundthat 8.4% of 3465 private wells from across the United Statesexceeded the MCL for nitrate. One of the largest studies of wellwater quality in Canada found that 34% and 14% of 1292 domestic,farm wells sampled in Ontario, Canada, from 1991e92 exceededOntario Drinking Water Standards for bacteria and nitrate,respectively (Goss et al., 1998).
R. Kreutzwiser et al. / Journal of Environmental Management 92 (2011) 1104e1114 1105
Contamination of private wells raises serious public healthconcerns. Incidents of contamination from microbial pathogenshave led to numerous outbreaks of waterborne illnesses in theUnited States, Canada, and the United Kingdom (Shepherd andWyn-Jones, 1997; Furtado et al., 1998; Raina et al., 1999; Maclerand Merkle, 2000; Corkal et al., 2004; Schuster et al., 2005;Rogan and Brady, 2009; Charrois, 2010) and, while less prevalent,nitrate contamination has caused methemglobinemia (Knobelochet al., 2000). To avoid such health risks, activities directed to theprotection of sources of supply for centralized drinking watersystems are becoming common. Source water protection ismandated in the United States under the Safe Drinking Water Actand is currently being implemented in the Province of Ontariounder the Clean Water Act (OMOE, 2009b). Regulations existrelating to the construction of private wells in some jurisdictions inthe United States and Canada. However, it is common for wellowners to be principally responsible formaintaining and preventingthe contamination of their wells (Novakowski et al., 2006; Roganand Brady, 2009).
One of the primary mechanisms used to protect private wellwater quality is the promotion of stewardship. Well stewardshipinvolves actions taken by individuals to protect the quality andquantity of their groundwater supplies. The most important ofthese actions include testing for bacteria and nitrate at leastannually, visual inspection of the wellhead annually, effectingsource water protection through the proper management ofpotential contaminants, and proper decommissioning of unused orabandoned wells (Simpson, 2004; Treyens, 2009). Together, theseactions help to prevent illness related to waterborne contaminationand contribute to the protection of water quality in aquifers.
Focusing on stewardship suggests that well owners areprimarily responsible for their own wells. Nonetheless, govern-ments also have critical roles to play. In a recent assessment ofpublic health risks from private water supplies in Canada, Charrois(2010) suggests that while well owners’ responsibilities cannot beoverlooked, government regulation of private wells is clearly lack-ing. The author concludes that government agencies should providebetter education, raise awareness, and even offer financial assis-tance to well owners. Some organizations have further suggestedthat private water systems be incorporated into municipal sourcewater protection frameworks to ensure proper well stewardship(e.g., PollutionWatch, 2009). We suggest that before stewardshipcan be effectively promoted, and before appropriate governmentinterventions can be identified, information is required about wellowners’ behaviours, and the factors that influence thesebehaviours.
Drawing on one of the largest and most comprehensive surveysof private well owners ever conducted in Canada or elsewhere, thispaper explored factors that influence well owner stewardshipbehaviour. We determined the nature and extent of well steward-ship behaviours among private well owners in Ontario; identifiedfactors that facilitate and constrain specific well stewardshipbehaviours (annual water testing for bacteria and nitrate, annualvisual inspections, source water protection actions, and properdecommissioning of unused wells); and assessed the implicationsfor promoting well stewardship and identify responsibilities forgovernment and well owners.
2. Understanding stewardship behaviour
While best management practices for wells have been clearlyoutlined for well owners (e.g., Simpson, 2004; NGWA, 2005; USEPA,2007; Treyens, 2009), few academic studies of well stewardshipbehaviour have been conducted. Of those studies that have beenperformed, most focused onwater testing and have been limited in
the number of well owners sampled (e.g., Schwartz et al., 1998;Jones et al., 2006; Hexemer et al., 2008). As a result of thisknowledge gap, most information on factors that influence stew-ardship behaviour emerges from studies of pro-environmentalbehaviours.
Pro-environmental behaviours refer to actions that improve, orare intended to improve, environmental quality (Stern, 2000). Stern(2000) describes pro-environmental behaviours as “private-sphereenvironmentalism”, but focuses his definition on the purchase,use, and disposal of consumer goods. Because of the focus on ind-ividuals and their behaviours, well stewardship is an importantexample of pro-environmental behaviour.
Studies of private-sphere environmentalism have focused onboth internal and external factors that motivate behaviour.Considering internal factors, the Theory of Planned Behaviour (TPB)has been used to frame psychologically-oriented models of envi-ronmental and conservation behaviour (e.g., Beedell and Rehman,1999; Kaiser et al., 2005; Barr, 2007; Bamberg and Möser, 2007).The TPB states that behaviour is guided by a rational intention, andthat this intention is primarily influenced by attitudes towards thebehaviour in question, social norms, and perceived behaviouralcontrols (Ajzen, 1991). Less egocentric models have also been usedto explain pro-environmental behaviours, notably Schwartz’s(1977) norm activation model. This model is centered on altru-istic actions that are prompted by personal norms, specificallyfeelings of responsibility and guilt. Further studies of personalnorms and positive environmental beliefs and values as motiva-tions for private-sphere environmentalism have lent support to thismodel (Karp, 1996; Tanner, 1999).
Others have built substantially upon both these frameworks.Locus of control, or belief that one’s actions can make a difference,has been found to contribute to the performance of pro-environ-mental behaviours (Hines et al., 1987; Guagnano, 1995). Cognitivefactors, including knowledge of environmental issues, how toperform behaviours, and awareness of problems, have also beenfound to directly or indirectly motivate pro-environmental behav-iours, including private-sphere environmentalism (Hines et al.,1987; Fransson and Gärling, 1999; Bamberg and Möser, 2007).
Factors external to individuals have also been combined withpsychological-oriented models. Kollmuss and Agyeman (2002)suggest that economics (e.g., cost), social structures (e.g., culture,social norms), political regimes (e.g., laws, institutional arrange-ments), and demographics (e.g., education level, gender) mayinfluence pro-environmental behaviours in different ways. Forexample, Derksen and Gartrell (1993) found in their study of wastedisposal in Alberta, Canada, that themost important determinant ofrecycling behaviour was the availability of curb-side recyclingprograms, as opposed to attitudes about recycling.
The relative importance of any of these factors is dependent onthe context in which pro-environmental behaviours occur. Ina review of environmentally responsible behaviour, De Young(2000) advocated the notion that universal explanations ofbehaviour are unlikely due to differing contexts. Instead, he arguedthat researchers need to identify the many behavioural motiva-tions, specifically those that exhibit durability (the ability topromote long-lasting behaviour), and generalizability (the versa-tility to be applied in different contexts). Stern (2000) concurredthat factors influencing environmental behaviours may be differentdepending on the behaviour in question. He further identifiedthe limitations of assuming general influences on behaviour,stating that “[t]o understand any specific environmentally signifi-cant behaviour requires empirical analysis. The evidence suggeststhat the role of environmentalist predispositions can vary greatlywith the behaviour, the actor, and the context” (Stern, 2000,pp. 415).
R. Kreutzwiser et al. / Journal of Environmental Management 92 (2011) 1104e11141106
These studies leave important gaps for managers seeking topromote private-sphere environmentalism. Barr (2003) reportsthat many studies of environmental behaviours, particularly recy-cling, rely on recommendations for improved education andawareness, even when ignorance is not found to be a primaryinfluence on behaviour. Barr (2003, p. 237) notes that “[t]heassumption that basic knowledge dissemination will have morethan a minor indirect effect on behavior is naïve”, and stressesthat motivations for behaviour beyond knowledge need to be usedfor policy formulation and implementation.
Pro-environmental behaviour studies offer general guidanceregarding internal and external factors that may influence wellstewardship, but such studies are not substitutes for in-depthinvestigations in real-world settings. Hence, specific studies ofwell stewardship behaviours in different settings are required toidentify the factors that play the greatest roles in motivating andconstraining stewardship. Clarifying these factors facilitates thedesign of more effective stewardship programs.
3. Methods
3.1. Study area
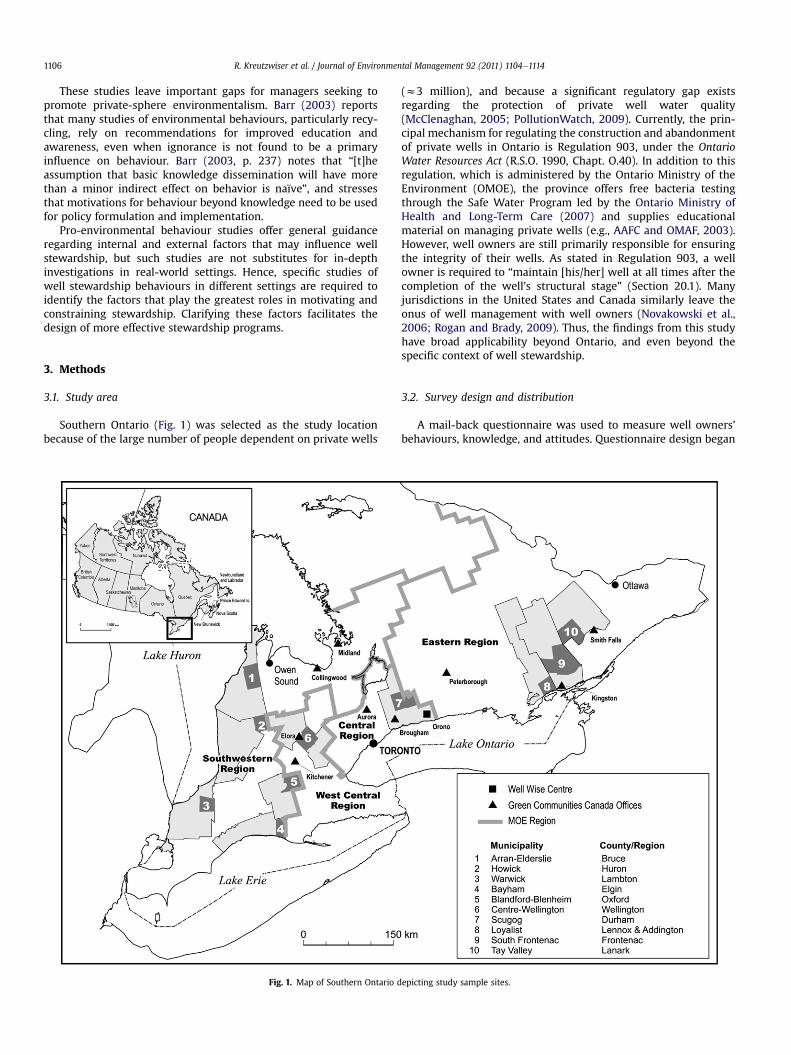
Southern Ontario (Fig. 1) was selected as the study locationbecause of the large number of people dependent on private wells
Fig. 1. Map of Southern Ontario d
(z3 million), and because a significant regulatory gap existsregarding the protection of private well water quality(McClenaghan, 2005; PollutionWatch, 2009). Currently, the prin-cipal mechanism for regulating the construction and abandonmentof private wells in Ontario is Regulation 903, under the OntarioWater Resources Act (R.S.O. 1990, Chapt. O.40). In addition to thisregulation, which is administered by the Ontario Ministry of theEnvironment (OMOE), the province offers free bacteria testingthrough the Safe Water Program led by the Ontario Ministry ofHealth and Long-Term Care (2007) and supplies educationalmaterial on managing private wells (e.g., AAFC and OMAF, 2003).However, well owners are still primarily responsible for ensuringthe integrity of their wells. As stated in Regulation 903, a wellowner is required to “maintain [his/her] well at all times after thecompletion of the well’s structural stage” (Section 20.1). Manyjurisdictions in the United States and Canada similarly leave theonus of well management with well owners (Novakowski et al.,2006; Rogan and Brady, 2009). Thus, the findings from this studyhave broad applicability beyond Ontario, and even beyond thespecific context of well stewardship.
3.2. Survey design and distribution
A mail-back questionnaire was used to measure well owners’behaviours, knowledge, and attitudes. Questionnaire design began
epicting study sample sites.
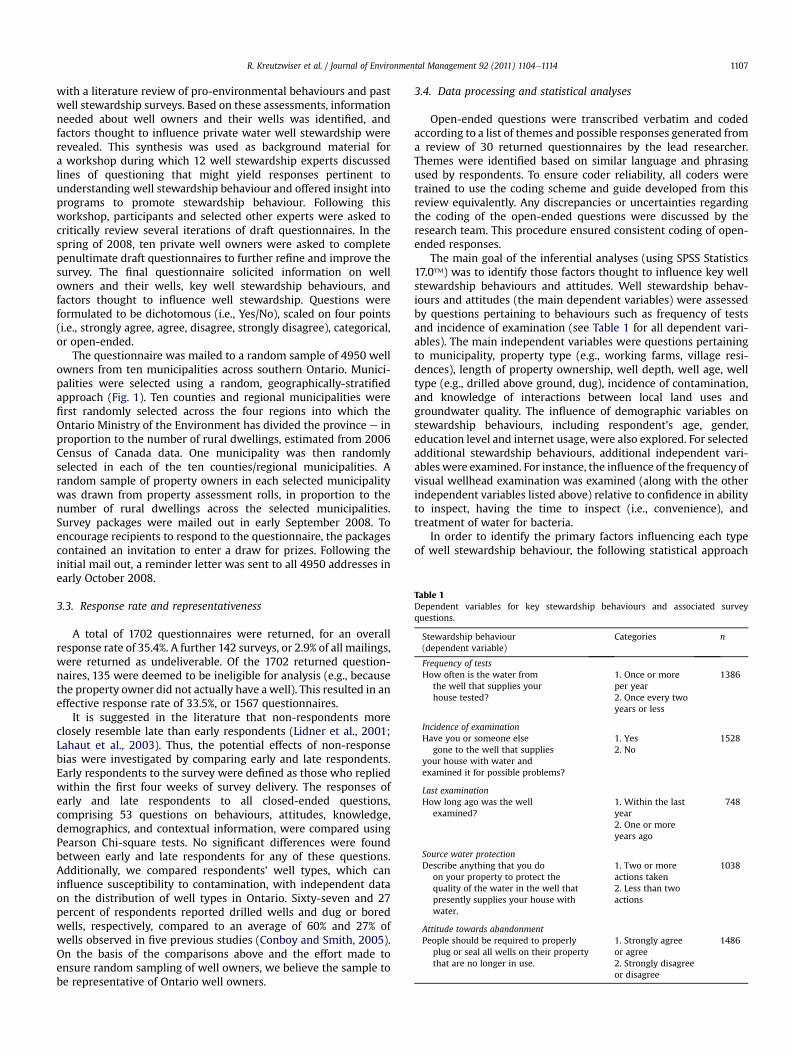
Table 1Dependent variables for key stewardship behaviours and associated surveyquestions.
Stewardship behaviour(dependent variable)
Categories n
Frequency of testsHow often is the water from
the well that supplies yourhouse tested?
1. Once or moreper year
1386
2. Once every twoyears or less
Incidence of examinationHave you or someone else
gone to the well that suppliesyour house with water andexamined it for possible problems?
1. Yes 15282. No
Last examinationHow long ago was the well
examined?1. Within the lastyear
748
2. One or moreyears ago
Source water protectionDescribe anything that you do
on your property to protect thequality of the water in the well thatpresently supplies your house withwater.
1. Two or moreactions taken
1038
2. Less than twoactions
Attitude towards abandonmentPeople should be required to properly
plug or seal all wells on their propertythat are no longer in use.
1. Strongly agreeor agree
1486
2. Strongly disagreeor disagree
R. Kreutzwiser et al. / Journal of Environmental Management 92 (2011) 1104e1114 1107
with a literature review of pro-environmental behaviours and pastwell stewardship surveys. Based on these assessments, informationneeded about well owners and their wells was identified, andfactors thought to influence private water well stewardship wererevealed. This synthesis was used as background material fora workshop during which 12 well stewardship experts discussedlines of questioning that might yield responses pertinent tounderstanding well stewardship behaviour and offered insight intoprograms to promote stewardship behaviour. Following thisworkshop, participants and selected other experts were asked tocritically review several iterations of draft questionnaires. In thespring of 2008, ten private well owners were asked to completepenultimate draft questionnaires to further refine and improve thesurvey. The final questionnaire solicited information on wellowners and their wells, key well stewardship behaviours, andfactors thought to influence well stewardship. Questions wereformulated to be dichotomous (i.e., Yes/No), scaled on four points(i.e., strongly agree, agree, disagree, strongly disagree), categorical,or open-ended.
The questionnaire was mailed to a random sample of 4950 wellowners from ten municipalities across southern Ontario. Munici-palities were selected using a random, geographically-stratifiedapproach (Fig. 1). Ten counties and regional municipalities werefirst randomly selected across the four regions into which theOntario Ministry of the Environment has divided the province e inproportion to the number of rural dwellings, estimated from 2006Census of Canada data. One municipality was then randomlyselected in each of the ten counties/regional municipalities. Arandom sample of property owners in each selected municipalitywas drawn from property assessment rolls, in proportion to thenumber of rural dwellings across the selected municipalities.Survey packages were mailed out in early September 2008. Toencourage recipients to respond to the questionnaire, the packagescontained an invitation to enter a draw for prizes. Following theinitial mail out, a reminder letter was sent to all 4950 addresses inearly October 2008.
3.3. Response rate and representativeness
A total of 1702 questionnaires were returned, for an overallresponse rate of 35.4%. A further 142 surveys, or 2.9% of all mailings,were returned as undeliverable. Of the 1702 returned question-naires, 135 were deemed to be ineligible for analysis (e.g., becausethe property owner did not actually have awell). This resulted in aneffective response rate of 33.5%, or 1567 questionnaires.
It is suggested in the literature that non-respondents moreclosely resemble late than early respondents (Lidner et al., 2001;Lahaut et al., 2003). Thus, the potential effects of non-responsebias were investigated by comparing early and late respondents.Early respondents to the survey were defined as those who repliedwithin the first four weeks of survey delivery. The responses ofearly and late respondents to all closed-ended questions,comprising 53 questions on behaviours, attitudes, knowledge,demographics, and contextual information, were compared usingPearson Chi-square tests. No significant differences were foundbetween early and late respondents for any of these questions.Additionally, we compared respondents’ well types, which caninfluence susceptibility to contamination, with independent dataon the distribution of well types in Ontario. Sixty-seven and 27percent of respondents reported drilled wells and dug or boredwells, respectively, compared to an average of 60% and 27% ofwells observed in five previous studies (Conboy and Smith, 2005).On the basis of the comparisons above and the effort made toensure random sampling of well owners, we believe the sample tobe representative of Ontario well owners.
3.4. Data processing and statistical analyses
Open-ended questions were transcribed verbatim and codedaccording to a list of themes and possible responses generated froma review of 30 returned questionnaires by the lead researcher.Themes were identified based on similar language and phrasingused by respondents. To ensure coder reliability, all coders weretrained to use the coding scheme and guide developed from thisreview equivalently. Any discrepancies or uncertainties regardingthe coding of the open-ended questions were discussed by theresearch team. This procedure ensured consistent coding of open-ended responses.
The main goal of the inferential analyses (using SPSS Statistics17.0�) was to identify those factors thought to influence key wellstewardship behaviours and attitudes. Well stewardship behav-iours and attitudes (the main dependent variables) were assessedby questions pertaining to behaviours such as frequency of testsand incidence of examination (see Table 1 for all dependent vari-ables). The main independent variables were questions pertainingto municipality, property type (e.g., working farms, village resi-dences), length of property ownership, well depth, well age, welltype (e.g., drilled above ground, dug), incidence of contamination,and knowledge of interactions between local land uses andgroundwater quality. The influence of demographic variables onstewardship behaviours, including respondent’s age, gender,education level and internet usage, were also explored. For selectedadditional stewardship behaviours, additional independent vari-ables were examined. For instance, the influence of the frequency ofvisual wellhead examination was examined (along with the otherindependent variables listed above) relative to confidence in abilityto inspect, having the time to inspect (i.e., convenience), andtreatment of water for bacteria.
In order to identify the primary factors influencing each typeof well stewardship behaviour, the following statistical approach
R. Kreutzwiser et al. / Journal of Environmental Management 92 (2011) 1104e11141108
was used. First, Pearson Chi-square tests were used to assess rela-tionships between all dependent and independent variables.Relationships were deemed significant if c2 was significant atp � 0.05 and if at least two of the cross tabulated groups in the chi-square had adjusted standardized residuals �1.96 (indicatingsignificance at p � 0.05 in a z-distribution).
Second, those independent variables deemed to have a signif-icant relationship with the main dependent variables (as assessedby the Pearson Chi-square analyses) were used as predictors inpreliminary binary logistic regression models carried out toidentify the factors that best predicted each of the main stew-ardship behaviours. The variable selection method used for alllogistic regressions was the Forward Stepwise Likelihood Ratio,which has been shown to be the most statistically sound andstable variable selection method, and one which inherently dealswith multicollinearity since variables only enter the model if theypredict unique proportions of variance in the dependent variable(Hosmer and Lemeshow, 2000; Cohen et al., 2003; Whitley et al.,2000).
In order to carry out these analyses all bipolar scale questions forboth dependent and independent variables were recategorized asdichotomous variables (i.e., strongly agree/agree and stronglydisagree/disagree). This was done to meet one of the assumptionsunderlying logistic regression, namely that the cells being esti-mated contain at least five observations in order for the resultingmodel to be considered valid and reliable.Where appropriate, otherindependent variables were recategorized systematically in orderto ensure this assumption was met.
After examining these preliminary regressions a final regressionmodel for each stewardship dependent variable was created.This involved regressing each of the stewardship dependent vari-ables on the independent variables found to be significant predic-tors in the preliminary analyses. Model fit was assessed usingNagelkerke’s R2 and Hosmer’s and Lemeshow’s Goodness of FitTest. In logistic regressions, these tests are preferred over classifi-cation tables (and resulting sensitive and specificity measures)when assessing model fit (Tabachnik and Fidell, 2007). In the finalmodels presented below, all independent variables were found tocontribute unique information to the prediction of the dependentvariable.
Table 2Factors that predict testing well water at least annually (n ¼ 862).
Variable (reference category) Ba S.E. Wald
Reason for test (workdone on well)
83.70
Just curious �0.02 0.52 0.00Legal requirement 0.89 0.37 5.93Peace of mind 1.58 0.33 22.83Routine 2.46 0.34 53.10Suspected/noticed problem 1.20 0.39 9.62Well age (�50a) 29.19<10a 1.61 0.41 15.8210<a�25 0.53 0.39 1.8825<a�50a 0.66 0.39 2.91Incidence of contamination (No) �0.99 0.23 18.35Treatment for bacteria (No) �0.43 0.19 5.22Convenience, Test (SD/D)c �0.86 0.23 14.10Knowledge, Test (SD/D) �1.54 0.23 45.59Constant �1.16 0.49 5.67
a The unstandardized regression coefficient.b Exp(B).c Strongly disagree/disagree.d In the text, this number is stated in terms of its inverse (2.37).
4. Results
4.1. Well owner demographics
Sixty-seven percent of respondents were 50 years of age or over.No respondents were under the age of 25. Sixty-four percent weremale and 36% were female. Thirty percent had university degrees,a quarter (26%) had college diplomas, and the remainder (44%)had trade certificates or other academic credentials. In terms ofproperty type, 58% had their wells on rural, non-farm properties.This was followed by working farms (15%), village residences (13%),and other property types (14%).
4.2. Household well characteristics
The average depth of respondents’wellswas 30m (SD¼�22m).The average age of respondents’ wells was 23 years (SD ¼ �18.0).Forty-two percent had drilled wells with casings that extendedabove ground. Thiswas followedbydrilledwells inpits (25%), dugorboredwells (23%), sandpoints (4%), springs (2%), and other (1%). Theremainder was uncertain of the type of well they had. Fourteenpercent of responding well owners reported having one or moreunused wells on their properties.
Forty-three percent of responding well owners used at least onewater treatment device that targeted bacterial contamination.Sixteen percent reported that they had experienced at least oneincident of water contamination. The most common contaminantsreported were bacteria (75% of 239 reports of contaminants),principally total coliform and E. coli. Chemical contaminantsconstituted 5% of reported contaminants. The most commonactions taken in response to contamination (n ¼ 300) were chlo-rination (36%) and installation of treatment systems (26%).
4.3. Attitudes and performance of well stewardship behaviours
Ninety-four percent of responding well owners indicated theyhad tested the water quality of their household wells at leastonce during the time they owned the well, while the remainderindicated they had not tested their well water quality, or wereuncertain if they had. Of those who had tested their well water, 35%
df Sig. Odds ratiob 95% C.I.
Lower Upper
5 0.00
1 0.97 0.98 0.35 2.711 0.02 2.43 1.19 4.981 0.00 4.84 2.54 9.251 0.00 11.70 6.04 22.681 0.00 3.31 1.55 7.063 0.001 0.00 5.00 2.26 11.061 0.17 1.70 0.80 3.621 0.09 1.94 0.91 4.131 0.00 0.37 0.24 0.581 0.02 0.65 0.45 0.941 0.00 0.42d 0.27 0.661 0.00 0.21 0.14 0.341 0.02 0.31
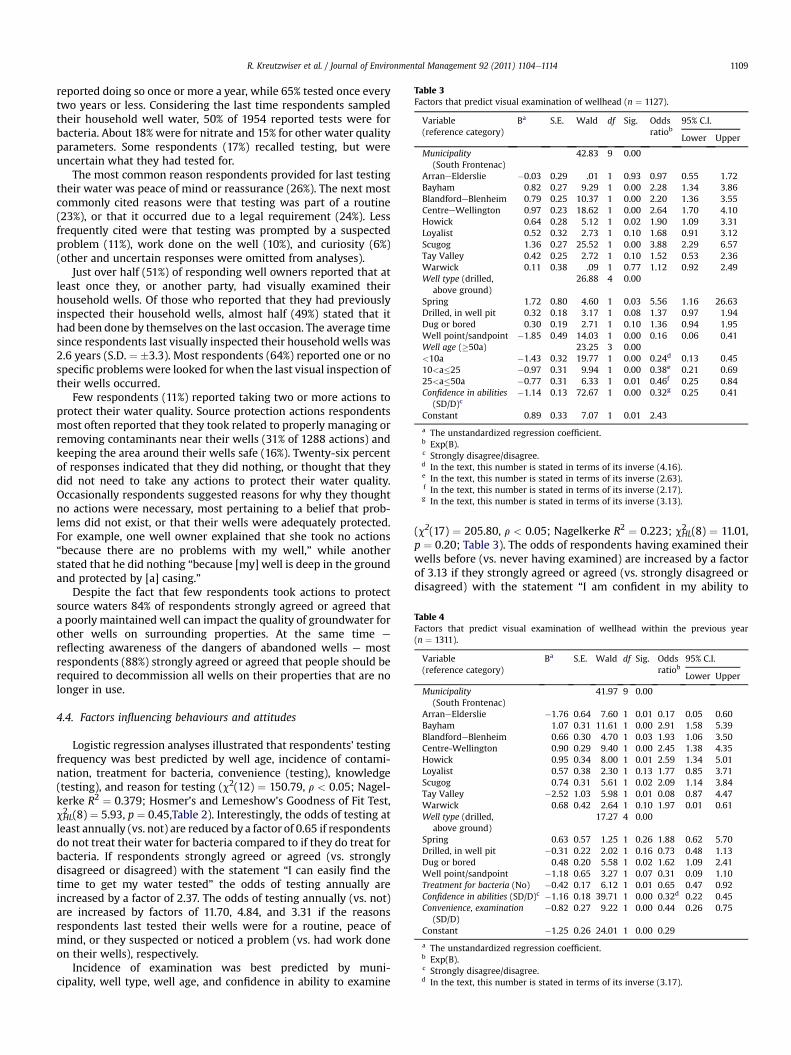
Table 3Factors that predict visual examination of wellhead (n ¼ 1127).
Variable(reference category)
Ba S.E. Wald df Sig. Oddsratiob
95% C.I.
Lower Upper
Municipality(South Frontenac)
42.83 9 0.00
ArraneElderslie �0.03 0.29 .01 1 0.93 0.97 0.55 1.72Bayham 0.82 0.27 9.29 1 0.00 2.28 1.34 3.86BlandfordeBlenheim 0.79 0.25 10.37 1 0.00 2.20 1.36 3.55CentreeWellington 0.97 0.23 18.62 1 0.00 2.64 1.70 4.10Howick 0.64 0.28 5.12 1 0.02 1.90 1.09 3.31Loyalist 0.52 0.32 2.73 1 0.10 1.68 0.91 3.12Scugog 1.36 0.27 25.52 1 0.00 3.88 2.29 6.57Tay Valley 0.42 0.25 2.72 1 0.10 1.52 0.53 2.36Warwick 0.11 0.38 .09 1 0.77 1.12 0.92 2.49Well type (drilled,
above ground)26.88 4 0.00
Spring 1.72 0.80 4.60 1 0.03 5.56 1.16 26.63Drilled, in well pit 0.32 0.18 3.17 1 0.08 1.37 0.97 1.94Dug or bored 0.30 0.19 2.71 1 0.10 1.36 0.94 1.95Well point/sandpoint �1.85 0.49 14.03 1 0.00 0.16 0.06 0.41Well age (�50a) 23.25 3 0.00<10a �1.43 0.32 19.77 1 0.00 0.24d 0.13 0.4510<a�25 �0.97 0.31 9.94 1 0.00 0.38e 0.21 0.6925<a�50a �0.77 0.31 6.33 1 0.01 0.46f 0.25 0.84Confidence in abilities
(SD/D)c�1.14 0.13 72.67 1 0.00 0.32g 0.25 0.41
Constant 0.89 0.33 7.07 1 0.01 2.43
a The unstandardized regression coefficient.b Exp(B).c Strongly disagree/disagree.d In the text, this number is stated in terms of its inverse (4.16).e In the text, this number is stated in terms of its inverse (2.63).f In the text, this number is stated in terms of its inverse (2.17).g In the text, this number is stated in terms of its inverse (3.13).
Table 4Factors that predict visual examination of wellhead within the previous year(n ¼ 1311).
Variable(reference category)
Ba S.E. Wald df Sig. Oddsratiob
95% C.I.
Lower Upper
Municipality(South Frontenac)
41.97 9 0.00
ArraneElderslie �1.76 0.64 7.60 1 0.01 0.17 0.05 0.60Bayham 1.07 0.31 11.61 1 0.00 2.91 1.58 5.39BlandfordeBlenheim 0.66 0.30 4.70 1 0.03 1.93 1.06 3.50Centre-Wellington 0.90 0.29 9.40 1 0.00 2.45 1.38 4.35Howick 0.95 0.34 8.00 1 0.01 2.59 1.34 5.01Loyalist 0.57 0.38 2.30 1 0.13 1.77 0.85 3.71Scugog 0.74 0.31 5.61 1 0.02 2.09 1.14 3.84Tay Valley �2.52 1.03 5.98 1 0.01 0.08 0.87 4.47Warwick 0.68 0.42 2.64 1 0.10 1.97 0.01 0.61Well type (drilled,
above ground)17.27 4 0.00
Spring 0.63 0.57 1.25 1 0.26 1.88 0.62 5.70Drilled, in well pit �0.31 0.22 2.02 1 0.16 0.73 0.48 1.13Dug or bored 0.48 0.20 5.58 1 0.02 1.62 1.09 2.41Well point/sandpoint �1.18 0.65 3.27 1 0.07 0.31 0.09 1.10Treatment for bacteria (No) �0.42 0.17 6.12 1 0.01 0.65 0.47 0.92Confidence in abilities (SD/D)c �1.16 0.18 39.71 1 0.00 0.32d 0.22 0.45Convenience, examination
(SD/D)�0.82 0.27 9.22 1 0.00 0.44 0.26 0.75
Constant �1.25 0.26 24.01 1 0.00 0.29
a The unstandardized regression coefficient.b Exp(B).c Strongly disagree/disagree.d In the text, this number is stated in terms of its inverse (3.17).
R. Kreutzwiser et al. / Journal of Environmental Management 92 (2011) 1104e1114 1109
reported doing so once or more a year, while 65% tested once everytwo years or less. Considering the last time respondents sampledtheir household well water, 50% of 1954 reported tests were forbacteria. About 18% were for nitrate and 15% for other water qualityparameters. Some respondents (17%) recalled testing, but wereuncertain what they had tested for.
The most common reason respondents provided for last testingtheir water was peace of mind or reassurance (26%). The next mostcommonly cited reasons were that testing was part of a routine(23%), or that it occurred due to a legal requirement (24%). Lessfrequently cited were that testing was prompted by a suspectedproblem (11%), work done on the well (10%), and curiosity (6%)(other and uncertain responses were omitted from analyses).
Just over half (51%) of responding well owners reported that atleast once they, or another party, had visually examined theirhousehold wells. Of those who reported that they had previouslyinspected their household wells, almost half (49%) stated that ithad been done by themselves on the last occasion. The average timesince respondents last visually inspected their household wells was2.6 years (S.D. ¼ �3.3). Most respondents (64%) reported one or nospecific problemswere looked for when the last visual inspection oftheir wells occurred.
Few respondents (11%) reported taking two or more actions toprotect their water quality. Source protection actions respondentsmost often reported that they took related to properly managing orremoving contaminants near their wells (31% of 1288 actions) andkeeping the area around their wells safe (16%). Twenty-six percentof responses indicated that they did nothing, or thought that theydid not need to take any actions to protect their water quality.Occasionally respondents suggested reasons for why they thoughtno actions were necessary, most pertaining to a belief that prob-lems did not exist, or that their wells were adequately protected.For example, one well owner explained that she took no actions“because there are no problems with my well,” while anotherstated that he did nothing “because [my] well is deep in the groundand protected by [a] casing.”
Despite the fact that few respondents took actions to protectsource waters 84% of respondents strongly agreed or agreed thata poorly maintained well can impact the quality of groundwater forother wells on surrounding properties. At the same time e
reflecting awareness of the dangers of abandoned wells e mostrespondents (88%) strongly agreed or agreed that people should berequired to decommission all wells on their properties that are nolonger in use.
4.4. Factors influencing behaviours and attitudes
Logistic regression analyses illustrated that respondents’ testingfrequency was best predicted by well age, incidence of contami-nation, treatment for bacteria, convenience (testing), knowledge(testing), and reason for testing (c2(12) ¼ 150.79, r < 0.05; Nagel-kerke R2 ¼ 0.379; Hosmer’s and Lemeshow’s Goodness of Fit Test,cHL2 (8) ¼ 5.93, p ¼ 0.45,Table 2). Interestingly, the odds of testing at
least annually (vs. not) are reduced by a factor of 0.65 if respondentsdo not treat their water for bacteria compared to if they do treat forbacteria. If respondents strongly agreed or agreed (vs. stronglydisagreed or disagreed) with the statement “I can easily find thetime to get my water tested” the odds of testing annually areincreased by a factor of 2.37. The odds of testing annually (vs. not)are increased by factors of 11.70, 4.84, and 3.31 if the reasonsrespondents last tested their wells were for a routine, peace ofmind, or they suspected or noticed a problem (vs. had work doneon their wells), respectively.
Incidence of examination was best predicted by muni-cipality, well type, well age, and confidence in ability to examine
(c2(17) ¼ 205.80, r < 0.05; Nagelkerke R2 ¼ 0.223; cHL2 (8) ¼ 11.01,p ¼ 0.20; Table 3). The odds of respondents having examined theirwells before (vs. never having examined) are increased by a factorof 3.13 if they strongly agreed or agreed (vs. strongly disagreed ordisagreed) with the statement “I am confident in my ability to
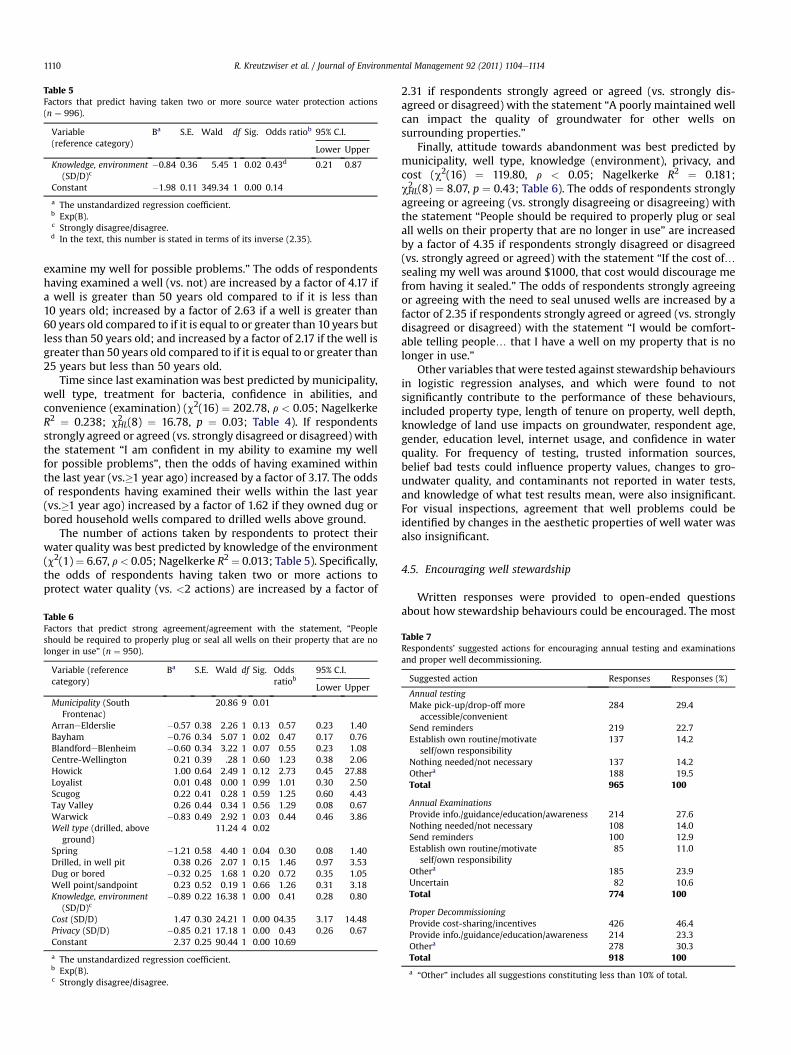
Table 5Factors that predict having taken two or more source water protection actions(n ¼ 996).
Variable(reference category)
Ba S.E. Wald df Sig. Odds ratiob 95% C.I.
Lower Upper
Knowledge, environment(SD/D)c
�0.84 0.36 5.45 1 0.02 0.43d 0.21 0.87
Constant �1.98 0.11 349.34 1 0.00 0.14
a The unstandardized regression coefficient.b Exp(B).c Strongly disagree/disagree.d In the text, this number is stated in terms of its inverse (2.35).
R. Kreutzwiser et al. / Journal of Environmental Management 92 (2011) 1104e11141110
examine my well for possible problems.” The odds of respondentshaving examined a well (vs. not) are increased by a factor of 4.17 ifa well is greater than 50 years old compared to if it is less than10 years old; increased by a factor of 2.63 if a well is greater than60 years old compared to if it is equal to or greater than 10 years butless than 50 years old; and increased by a factor of 2.17 if the well isgreater than 50 years old compared to if it is equal to or greater than25 years but less than 50 years old.
Time since last examination was best predicted by municipality,well type, treatment for bacteria, confidence in abilities, andconvenience (examination) (c2(16) ¼ 202.78, r < 0.05; NagelkerkeR2 ¼ 0.238; cHL
2 (8) ¼ 16.78, p ¼ 0.03; Table 4). If respondentsstrongly agreed or agreed (vs. strongly disagreed or disagreed) withthe statement “I am confident in my ability to examine my wellfor possible problems”, then the odds of having examined withinthe last year (vs.�1 year ago) increased by a factor of 3.17. The oddsof respondents having examined their wells within the last year(vs.�1 year ago) increased by a factor of 1.62 if they owned dug orbored household wells compared to drilled wells above ground.
The number of actions taken by respondents to protect theirwater quality was best predicted by knowledge of the environment(c2(1)¼ 6.67, r< 0.05; Nagelkerke R2 ¼ 0.013; Table 5). Specifically,the odds of respondents having taken two or more actions toprotect water quality (vs. <2 actions) are increased by a factor of
Table 6Factors that predict strong agreement/agreement with the statement, “Peopleshould be required to properly plug or seal all wells on their property that are nolonger in use” (n ¼ 950).
Variable (referencecategory)
Ba S.E. Wald df Sig. Oddsratiob
95% C.I.
Lower Upper
Municipality (SouthFrontenac)
20.86 9 0.01
ArraneElderslie �0.57 0.38 2.26 1 0.13 0.57 0.23 1.40Bayham �0.76 0.34 5.07 1 0.02 0.47 0.17 0.76BlandfordeBlenheim �0.60 0.34 3.22 1 0.07 0.55 0.23 1.08Centre-Wellington 0.21 0.39 .28 1 0.60 1.23 0.38 2.06Howick 1.00 0.64 2.49 1 0.12 2.73 0.45 27.88Loyalist 0.01 0.48 0.00 1 0.99 1.01 0.30 2.50Scugog 0.22 0.41 0.28 1 0.59 1.25 0.60 4.43Tay Valley 0.26 0.44 0.34 1 0.56 1.29 0.08 0.67Warwick �0.83 0.49 2.92 1 0.03 0.44 0.46 3.86Well type (drilled, above
ground)11.24 4 0.02
Spring �1.21 0.58 4.40 1 0.04 0.30 0.08 1.40Drilled, in well pit 0.38 0.26 2.07 1 0.15 1.46 0.97 3.53Dug or bored �0.32 0.25 1.68 1 0.20 0.72 0.35 1.05Well point/sandpoint 0.23 0.52 0.19 1 0.66 1.26 0.31 3.18Knowledge, environment
(SD/D)c�0.89 0.22 16.38 1 0.00 0.41 0.28 0.80
Cost (SD/D) 1.47 0.30 24.21 1 0.00 04.35 3.17 14.48Privacy (SD/D) �0.85 0.21 17.18 1 0.00 0.43 0.26 0.67Constant 2.37 0.25 90.44 1 0.00 10.69
a The unstandardized regression coefficient.b Exp(B).c Strongly disagree/disagree.
2.31 if respondents strongly agreed or agreed (vs. strongly dis-agreed or disagreed) with the statement “A poorly maintained wellcan impact the quality of groundwater for other wells onsurrounding properties.”
Finally, attitude towards abandonment was best predicted bymunicipality, well type, knowledge (environment), privacy, andcost (c2(16) ¼ 119.80, r < 0.05; Nagelkerke R2 ¼ 0.181;cHL2 (8) ¼ 8.07, p ¼ 0.43; Table 6). The odds of respondents strongly
agreeing or agreeing (vs. strongly disagreeing or disagreeing) withthe statement “People should be required to properly plug or sealall wells on their property that are no longer in use” are increasedby a factor of 4.35 if respondents strongly disagreed or disagreed(vs. strongly agreed or agreed) with the statement “If the cost of.sealing my well was around $1000, that cost would discourage mefrom having it sealed.” The odds of respondents strongly agreeingor agreeing with the need to seal unused wells are increased by afactor of 2.35 if respondents strongly agreed or agreed (vs. stronglydisagreed or disagreed) with the statement “I would be comfort-able telling people. that I have a well on my property that is nolonger in use.”
Other variables that were tested against stewardship behavioursin logistic regression analyses, and which were found to notsignificantly contribute to the performance of these behaviours,included property type, length of tenure on property, well depth,knowledge of land use impacts on groundwater, respondent age,gender, education level, internet usage, and confidence in waterquality. For frequency of testing, trusted information sources,belief bad tests could influence property values, changes to gro-undwater quality, and contaminants not reported in water tests,and knowledge of what test results mean, were also insignificant.For visual inspections, agreement that well problems could beidentified by changes in the aesthetic properties of well water wasalso insignificant.
4.5. Encouraging well stewardship
Written responses were provided to open-ended questionsabout how stewardship behaviours could be encouraged. The most
Table 7Respondents’ suggested actions for encouraging annual testing and examinationsand proper well decommissioning.
Suggested action Responses Responses (%)
Annual testingMake pick-up/drop-off more
accessible/convenient284 29.4
Send reminders 219 22.7Establish own routine/motivate
self/own responsibility137 14.2
Nothing needed/not necessary 137 14.2Othera 188 19.5Total 965 100
Annual ExaminationsProvide info./guidance/education/awareness 214 27.6Nothing needed/not necessary 108 14.0Send reminders 100 12.9Establish own routine/motivate
self/own responsibility85 11.0
Othera 185 23.9Uncertain 82 10.6Total 774 100
Proper DecommissioningProvide cost-sharing/incentives 426 46.4Provide info./guidance/education/awareness 214 23.3Othera 278 30.3Total 918 100
a “Other” includes all suggestions constituting less than 10% of total.
R. Kreutzwiser et al. / Journal of Environmental Management 92 (2011) 1104e1114 1111
commonly suggested actions to encourage annual testing pertainedto making sample pick-up and drop-off more convenient (29% ofresponses), followed by receiving reminders (23%) (Table 7). Themost commonly suggested action to encourage annual visualinspections was to provide information, guidance, or education(28%) (Table 7). This was followed by receiving reminders (13%).For both testing and visual inspection, about 14% of responsesdemonstrated a belief that no actions are necessary. The mostcommonly suggested action to encourage proper well decom-missioning (46%) was to provide cost-sharing or other incentives towell owners (Table 7).
5. Discussion
5.1. Water testing
Roughly 16% of respondents reported past instances of watercontamination. Thus, the need to routinely test water is apparent.Despite this, regular testing is not performed by most Ontario wellowners. While almost all respondents reported having had at leastone water test (94%), 65% tested less than once a year and fewreported testing for anything other than bacteria. These figuresare comparable to sampling rates in previous smaller studies inHamilton and Waterloo, Ontario where as many as 61% and 75% ofwell owners, respectively, did not test their well water annually(Jones et al., 2006; Hexemer et al., 2008).
Demographic factors were mostly unrelated to water testingbehaviour. Respondents who knew how often to test were morelikely to test their water at least annually (Table 2), but those whotest frequently may simply be exposed to more educational mate-rial. Charrois (2010) suggested lack of awareness and education asconstraints, and recommended that better educational material canbe used to encourage testing. This suggestion is not supported bythis study, which found that only 5% of suggestions made byrespondents to encourage annual testing pertained to education.Instead, the results of this study reveal that structural constraintsand personal motivations are more important barriers to regulartesting than ignorance. Overcoming these kinds of barriers can beextremely challenging.
Despite the fact that the Government of Ontario offers freebacteria tests, the most common suggestions made by respondentsto encourage testing pertained tomaking sample bottle pick-up anddrop-off to Public Health units more convenient. Well owners whoindicated that they could find the time to get their well water testedwere also more likely to test their water at least once a year. A keyconcern respondents identified was the fact that in rural areas,Public Health unit offices are too far away, and that they are onlyopenduringnormal businesshours. Hexemeret al. (2008) tested theimportance of this constraint by delivering and retrieving samplebottles fromwell owners’ homes. This simple action doubled testingrates in their study. In jurisdictions where free testing is not offered,sampling may be evenmore infrequent, as reflected by the fact thatfew respondents tested for contaminants that were not performedfree-of-charge by Public Health units.
Cost constraints may make improving the accessibility ofservices difficult for Public Health units. While it is crucial that theprovince of Ontario improves support for its testing services, otheroptions may also need to be explored. Specifically, non-governmentorganizations (NGOs) that promote stewardship could implementlocal-scale efforts to reduce inconveniences. For example, individ-uals who regularly test their water could be identified and orga-nized to take in neighbors’ samples on an annual basis. Similarly,annual events could be held for well owners to drop-off watersamples to local organizations. NGOs may be better positioned toorganize and execute such events than government agencies.
Personal concerns and motivations offer more complex chal-lenges to encouraging stewardship. Well owners who last testedtheir water for “peace of mind” or because testing was a personalroutine were also more likely to test their water more than oncea year. Routines appear to overcome some of the inconveniences oftesting. “Peace of mind” e framed as a health concern e explainswhy well owners who treat their water for bacteria were morelikely to test their water annually. Peace of mind has been found tomotivate pro-environmental behaviours that improve environ-mental quality (Baldassare and Katz, 1992) and is a key motivebehind voluntary health screenings for diseases such as cancer (e.g.,Wardle et al., 2000; Cantor et al., 2002; Dale et al., 2005). Otherstudies of personal motivations for stewardship have emphasizedthe importance of personal morals and norms (e.g., Ryan, 2009).However, changing norms can be extremely difficult. Thus,promoting annual testing through emphasizing health-relatedpeace of mind should be an important approach in well steward-ship programs.
Respondents who were less concerned about water safetyseemed less inclined to test. As one well owner stated “we neverworry about testing because we feel we have good water.” Thissense of complacency was evident in a number of well owners;when asked in the survey for ways to encourage routine testing,14%of responses indicated that nothing was necessary or needed.Similarly, when respondents who never tested their water wereasked in the open-ended portion of the survey to describe whythey had not had their water tested, almost half stated that they didnot test because they did not think it was necessary. Well ownerswho last tested their water because they suspected or noticeda problemwere more likely to test their water once or more a year.Likewise, Jones et al. (2006) found that almost a quarter of wellowners surveyed in Hamilton, Ontario, did not test their waterbecause they had not noticed health problems. These findingssupport the conclusion that problems motivate behaviour.However, this is a poor foundation for stewardship as negativehealth and environmental effects may occur prior to the behaviourchange.
Fostering a sense of concern is difficult, but raising the sense ofurgency around testing is possible. The most common suggestionfor encouraging testing was to send reminders to well owners. Intheir supplementary written responses, a number of respondentsdrew analogies between regular testing of well water quality andregular testing of smoke detectors. Having annual campaigns, suchas those by fire departments for smoke detectors, may help to raisethe perception that testing is imperative to safety. Other “rewards”for testing may also be necessary. For example, modest rebates onmunicipal taxes could be offered if proof of routine bacterial and/orperiodic comprehensive water testing is provided. Positive returns,monetary or otherwise, may provide well owners with incentivesto test without having to change entrenched personal conceptionsof risk (a much more difficult task).
One of the most effective ways to encourage one-off testingmay be through regulations associated with real estate trans-actions and the construction of new wells. Bacteria tests areencouraged (but not required) for the sale of homes and formortgage renewals in Ontario, but are required in some jurisdic-tions, notably New Jersey (Rogan and Brady, 2009; Atherholt et al.,2009). Tests for other water quality parameters are rarelydemanded by buyers during real estate transactions. Putting inplace requirements for comprehensive tests at the point ofpurchase of rural homes would ensure that tests for a range ofcontaminants are performed at least once. Unfortunately,while such a requirement could heighten awareness, it would notnecessarily ensure routine testing for bacteria (a key determinantof rural water safety).
R. Kreutzwiser et al. / Journal of Environmental Management 92 (2011) 1104e11141112
5.2. Visual wellhead inspections
Just under half of well owners reported that they had neverperformed a visual well inspection, and two-thirds of those whodid report doing an inspection had not done so within the previousyear. The majority of respondents who inspected their wells onlylooked for one problem, suggesting that most well owners lacka satisfactory understanding of what an adequate visual inspectionentails. Furthermore, as noted above, the findings suggest thatthose who are inspecting their wells may be doing so becausethey are reacting to problems. Well owners with older wells weremore likely to have inspected their wells at least once, while thosewith dug or bored wells were more likely to have inspected theirwells within the last year. Addressing problems as they occur isnecessary, but this study found that proactive, routine inspection e
a key prerequisite for safe rural water supplies e is uncommon.Our model findings suggest that, unlike testing behaviour, lack
of knowledge was the most important barrier to routine visualinspections. Almost half of respondents were not confident in theirown abilities to inspect their wells. Those well owners who wereconfident in their abilities were more likely to have performed atleast one inspection and to have examined their wells within thelast year (Table 3). In the open-ended section of the survey, mostsuggestions for encouraging routine inspections made by respon-dents pertained to education, or revealed misunderstanding bywell owners. For example, one respondent commented “how canyou examine a drilled well when all that you see is the top cap?”,while another stated “there is no way to check other than testingthe water.” Neither statement is technically correct.
Whereas many respondents knew what was meant by watertesting, understanding is clearly lacking in regards to visualinspections. Education alone does not motivate pro-environmentalbehaviours (Barr, 2003). Nonetheless, it remains the case that theproper way to visually inspect wellheads simply is not wellunderstood e a gap that can be remedied through education. Stern(2000) considers knowledge factors to be “personal capabilities,” orfactors that may not directly motivate behaviour, but insteadinfluence the ability of behaviours to be performed. In that respect,knowledge about the proper way to inspect well heads is needed tosupport appropriate inspection behaviour.
Educational materials for visual inspections are currentlyavailable to well owners from governments and non-governmentorganizations in Canada and the United States (e.g., NGWA, 2005;USEPA, 2007; OMOE, 2009a), but these materials are not neces-sarily received by well owners nor easily understood. Check-liststhat well owners can use to work through the different aspects ofvisual inspections in a step-by-step fashion are one importanteducational resource. A few responding well owners specificallyasked for check-lists to encourage routine examinations. Non-government organizations (NGOs) that have already developededucational materials or have access to them (e.g., GCA, No Date;NGWA, 2005) can play an important role in developing anddistributing such material. Local seminars and workshops thatwalk well owners through the steps of a proper visual inspectioncould also be useful. NGOs in Ontario have reported that trainingwell owners to inspect their wells improves their confidence andthe frequency of examinations (ERG, 2004; Lura Consulting, 2009).
As is the case in numerous other studies of environmentalstewardship (e.g., Atari et al., 2009; Ryan, 2009; Gill et al., 2010),this study found that personal motivations are important factorsinfluencing groundwater stewardship. Some respondents claimedthat nothing could be done to encourage them to routinely exam-ine their wells, while others noted that they were only examiningtheir wells on a reactive basis. Lack of knowledge notwithstanding,some of these respondents were complacent about the fact they
had not experienced any problems with their wells or water. Someused the phrase “if it ain’t broke, don’t fix it” to explain whyinspections were a low priority.
As with water testing, such attitudes are difficult to address.Raising the urgency of examinations, as is done in the case of smokealarms, may be one of the few tactics for encouraging inspection,but this approach assumes that well owners know how to inspecttheir wells (which based on the results of this study certainly isnot the case). Again, NGOs may be appropriate entities for raisingawareness at local levels and disseminating such information.Stronger requirements for real estate transactions, as with testing,could also be utilized to ensure inspections by licensed profes-sionals. However, as with annual water testing, the ultimate res-ponsibility for annually examining wells remains with well owners.
5.3. Source water protection
Source water protection is a critical but under-utilized approachamong well owners. A number of respondents (54%) took only oneaction to protect their water quality, and 31% took no actions. Of16 factors tested, including demographics, attitudes, and knowl-edge, only one was found to be related to source water protection:well owners who agreed that poorly maintained wells can impactgroundwater quality on other properties were more likely to takemore actions to protect water quality. This suggests, albeit weakly,that knowledge of groundwater and a desire to protect ground-water quality for others are both motivations for source waterprotection. Unfortunately, altruistic beliefs may be difficult to instillin people who do not already feel strongly about groundwaterprotection. Important barriers to source water protection actionsidentified in the study included complacency and ignorance. While,education could be of some use to dispel misconceptions and toprovide more options for engaged well owners, on its own educa-tion is unlikely to prompt behavioural changes.
These findings suggest that a more comprehensive strategy e
one that targets how well owners think about their properties e
could be more effective. Although well owners are taking someactions to protect water quality, many do not think of their actionsas “source water protection.” This was most evident from howwellowners reacted to water contamination using superficial solutions(e.g., shock-chlorination of the well) as opposed to attempting toaddress the sources of contamination around the well. Simpsonet al. (2007) advocate the use of “private wellhead protectionplans” to encourage holistic thinking and to provide well ownerswith a coherent strategy for rural groundwater protection. Thefundamental elements of risk assessment plans for private wellowners have already been developed through programs such as theCanadaeOntario Environmental Farm Plan (OMAFRA, 2010), andScotland’s microbiological risk assessment approach (Lilly et al.,2003). Promoting the development of such plans would addition-ally benefit attempts to incorporate private stewardship efforts intomunicipal source water protection initiatives. For example, SourceProtection Committees created under Ontario’s Clean Water Actcould include in their source protection plans objectives forencouraging the completion of voluntary, property-scale plans bylandowners.
5.4. Well decommissioning
Improperly abandoned wells, which can be conduits for gro-undwater contamination (Gass, 1988; Avci, 1994), were reported by14% of respondents. It is estimated that over 500,000 abandonedwells exist in Ontario (Novakowski et al., 2006). Importantly, manywell owners expressed open, positive attitudes towards properlydecommissioning unused wells; most strongly agreed or agreed
R. Kreutzwiser et al. / Journal of Environmental Management 92 (2011) 1104e1114 1113
that unused wells should be properly decommissioned. Wellowners who agreed that poorly maintained wells can impactgroundwater quality on other properties were more likely to thinkthat unused wells should be decommissioned.
Perhaps not surprisingly, one prominent barrier for properlydecommissioning wells was cost. The average cost for decom-missioning awell in Ontario ranges from $1400e1600 (Novakowskiet al., 2006). Sixty-nine percent of well owners indicated that a costof $1000 would not discourage them from decommissioningunused wells. Respondents who disagreed that unused wellsshould be properly decommissioned were more likely to agree thatcost was a deterrent. Reinforcing the importance of cost as a barrier,the most common suggestion for promoting proper well decom-missioning noted by respondents was providing cost-sharing orother incentives. Financial assistance for stewardship behaviour inrural areas has been found to be important in other settings. Forexample, Atari et al. (2009) demonstrated that low-income farmswere less likely to take part in conservation programs than high-income farms. This suggests that while some well owners may notwant to pay, others cannot afford to decommission their wells.
Providing more or better cost-sharing programs to well ownersmay not be financially feasible for many jurisdictions, and may notbe a cost-effective approach to dealing with unused wells that posea lower risk of groundwater contamination. Moreover, if laws existfor sealing unused wells, as is the case in Ontario, then stricterenforcement will not necessarily be a better alternative because theprivacy concerns of respondents around abandoned wells wereparticularly notable in this research. Almost 20% of respondents didnot feel comfortable disclosing the presence of unused wells and,importantly, these well owners were less likely to agree thatunused wells needed to be decommissioned. Concerns regardinggovernment intervention on private land would likely be height-ened if decommissioning requirements were enforced aggressively,especially since landowners may have purchased their propertieswithout knowledge of the presence of abandoned wells.
One solution could be for government agencies to only takeresponsibility for those wells that pose the greatest threat togroundwater quality. Unfortunately, this approach will not ame-liorate well owner concerns relating to privacy and governmentintrusion. Such programsmay need to also offer amnesty from legalenforcement and anonymity to landowners to achieve maximumparticipation rates. Partnering with NGOs to establish initial contactwith well owners is another alternative, as many NGOs offer fullanonymity to well owners.
In light of the findings of this study, unused wells that are notdeemed to be of high-risk to aquifers could be left to the respon-sibility of well owners. However, while some respondents may bemotivated by environmental concerns, others will be less inclined ifthey have not perceived problems and do not want to, or cannot,cover the costs. Therefore, a more realistic way to address theselower-risk abandoned wells could be through real estate trans-actions. Requiring the disclosure and decommissioning, or up-grading, of unused wells, at point of property purchase, would bean effective way to manage the risks associated with these kinds ofwells.
6. Conclusion
The extent of private water well stewardship, specifically annualtesting and well head examinations and actions to protect waterquality, was limited in the ten Ontario municipalities where thisstudy took place. Jurisdictions that rely on voluntary stewardshipby well owners to protect rural groundwater may find similartrends, which pose threats not only to the health of the peoplerelying on those wells, but also to broader public health. Influences
on stewardship behaviours are dependent on context. Nonetheless,this study identified a number of factors that may have broaderapplicability to other jurisdictions. Specifically, the influences ofpeace of mind, complacency, the perception of problems, knowl-edge of how to perform behaviours, inconvenience, cost, andprivacy on well owners may be broadly relevant in North America.
Importantly, this study reinforces the fact that the managementof private water supplies is a shared responsibility between wellowners and government. Ultimately, it is up to well owners tomanage their own wells and properties to secure the safety oftheir own drinking water. But drinking water safety should also bea priority of all levels of government, both as a public health con-cern and as a responsibility to protect shared groundwaterresources. Government agencies must invest in the promotionand advocacy of private water well stewardship and exploredifferent mechanisms to ensure proper well management whennecessary. One of the most cost-effective ways for governments todo this for low risk abandoned wells is through regulations asso-ciated with real estate transactions.
Well owners, for their part, must assume their responsibilities toprotect themselves and common resources. While some actionsmay be enforced through the sale and purchase of properties,ongoing, routine actions will always be needed by well owners.On a positive note, manywell owners recognized this responsibilityand expressed corresponding positive attitudes about well stew-ardship. Nonetheless, constant encouragement is needed forstewardship to become a priority to well owners because compla-cency is likely to remain an ongoing challenge.
Ultimately, responsibility for well stewardship and drinkingwater safety in rural Ontario is shared betweenwell owners and theprovincial government, with organizations that promote wellstewardship playing key roles. This study demonstrates clearly thata multi-pronged approach towell stewardship is needed. Simplisticsolutions e such as relying entirely on educational materials e
clearly will be insufficient. Instead, better services and enhancededucation, targeted regulations, and an emphasis on personalresponsibility are all required to ensure the safety of the manypeople who rely on private wells for their drinking water.
Acknowledgements
The authors acknowledge the Canadian Water Network (CWN)for funding that supported this project; CWN was not involved inthe design or implementation of the study. We would also like tothank a number of individuals who contributed directly to surveyand questionnaire design and to data collection and analysis,including Becky Swainson, Jen Herne, Liana Moraru, Dr. YolandaMartins (Inquirus Research Design and Statistics Consulting), andMarisha Lamond and Heather Kirby (Well Aware). Finally, we aregrateful to the many professionals who provided suggestions andinsights in early stages of the study, and who attended our expertworkshop.
References
Agriculture and Agri-FoodCanada and Ontario Ministry of Agriculture and Food(AAFC and OMAF)., 2003. Water Wells: Best Management Practices. OntarioMinistry of Agriculture, Food, and Rural Affairs, Guelph, ON.
Ajzen, I., 1991. The theory of planned behavior. Organizational Behaviour andHuman Decision Processes 50, 179e211.
Atari, D.O.A., Yiridoe, E.K., Smale, S., Duinker, P.N., 2009. What motivates farmers toparticipate in the Nova Scotia environmental farm plan program? Evidence andenvironmental policy implications. Journal of Environmental Management 90,1269e1279.
Atherholt, T.B., Louis, J.B., Shevlin, J., Fell, K., Krietzman, S., 2009. The New JerseyPrivate Well Testing Act: An Overview. Division of Science, Research, andTechnology, New Jersey Department of Environmental Protection, NJ.
R. Kreutzwiser et al. / Journal of Environmental Management 92 (2011) 1104e11141114
Avci, C., 1994. Evaluation of flow leakage through abandoned wells and boreholes.Water Resources Research 30 (9), 2565e2578.
Baldassare, M., Katz, C., 1992. The personal threat of environmental problems aspredictor of environmental practices. Environment and Behavior 24 (5),602e616.
Bamberg, S., Möser, G., 2007. Twenty years after Hines, Hungerford, and Tomera:a new meta-analysis of psycho-social determinants of pro-environmentalbehaviour. Journal of Environmental Psychology 27, 14e25.
Barr, S., 2003. Strategies for sustainability: citizens and responsible environmentbehaviour. Area 35 (3), 227e240.
Barr, S., 2007. Factors influencing environmental attitudes and behaviours. Envi-ronment and Behavior 39 (4), 435e473.
Beedell, J.D.C., Rehman, T., 1999. Explaining farmers’ conservation behaviour: whydo farmers behave the way they do? Journal of Environmental Management 57,165e176.
Cantor, S.B., Volk, R.J., Cass, A.R., Gilani, J., Spann, S.J., 2002. Psychological benefits ofprostate cancer screening: the role of reassurance. Health Expectations 5,104e113.
Charrois, J.W.A., 2010. Private drinking water supplies: challenges for public health.Canadian Medical Association Journal 182, 1061e1064.
Cohen, J., Cohen, P., West, S.G., Aiken, L.S., 2003. Applied Multiple Regression/Correlation Analysis for the Behavioral Sciences. Lawrence Erlbaum AssociatesInc., NJ.
Conboy, M.J., Smith, S., 2005. Well Wise: A Comprehensive Consumer’s Guide forPrivate Wells. Well Wise, ON.
Corkal, D., Schutzman, W.C., Hilliard, C.R., 2004. Rural water safety from the sourceto the on-farm tap. Journal of Toxicology and Environmental Health, Part A 67(20), 1619e1642.
Dale, W., Bilir, P., Han, M., Meltzer, D., 2005. The role of anxiety in prostate carci-noma: a structured review of the literature. American Cancer Society 104 (3),467e478.
De Simone, L.A., Hamilton, L.C., Gilliom, R.J., 2009. Quality of water from domesticwells in principal aquifers of the United States, 1991e2004: overview of majorfindings. Circular 1332. United States Geological Survey.
De Young, R., 2000. Expanding and evaluating motives for environmentallyresponsible behavior. Journal of Social Issues 56 (3), 508e526.
Derksen, L., Gartrell, J., 1993. The social context of recycling. American SociologicalReview 58 (3), 434e442.
Environics Research Group (ERG)., 2004. Well Aware External Program Evaluation(Phase 11): Analysis and Summary of Results. Environics Research Group.
Environment Canada., 2004. Almost nine million Canadians depend on ground-water. Accessed online January 17, 2009. http://www.ec.gc.ca/water/en/nature/grdwtr/e_sixmil.htm.
Focazio, M.J., Tipton, D., Shapiro, S.D., Geiger, L.H., 2006. The chemical quality ofself-supplied domestic well water in the United States. Ground Water Moni-toring and Remediation 26 (3), 92e104.
Fransson, N., Gärling, T., 1999. Environmental concern: conceptual definitions,measurementmethods, and researchfindings. Journal of Environmental Psychology19, 369e382.
Furtado, C., Adak, G.K., Stuart, J.M., Wall, P.G., Evans, H.S., Casemore, D.P., 1998.Outbreaks of waterborne infectious intestinal disease in England and Wales,1992e5. Epidemiology and Infection 121, 109e119.
Gass, T., 1988. The impact of abandoned wells. Water Well Journal 42 (1), 48e49.Gill, N., Klepis, P., Chisolm, L., 2010. Stewardship among lifestyle oriented rural
landowners. Journal of Environmental Planning and Management 53 (3),317e334.
Goss, M.J., Barry, D.A.J., Rudolph, D.L., 1998. Contamination in Ontario farmsteaddomestic wells and its association with agriculture: 1. Results from drinkingwater wells. Journal of Contaminant Hydrology 32, 267e293.
Green Communities Association (GCA), No Date. Well aware: a guide to caring foryour well and protecting your family’s health. Accessed online February 2,2009: http://www.wellaware.ca.
Guagnano, G.A., 1995. Locus of control, altruism and agentic disposition. Populationand Environment 17 (1), 63e77.
Hexemer, A.M., Bird, T.M., Garcia, H.P., Pintar, K., Pollari, F., Zentner, S.E., 2008. Aninvestigation of bacteriological and chemical water quality and the barriers toprivate well water sampling in a Southwestern Ontario Community. Journal ofWater and Health 6 (4), 521e525.
Hines, J.M., Hungerford, H.R., Tomera, A.N., 1987. Analysis and synthesis of researchon responsible environmental behaviour: a meta-analysis. Journal of Environ-mental Education 18, 1e8.
Hosmer, D.W., Lemeshow, S., 2000. Applied Logistic Regression. John Wiley andSons, NY.
Huston, S.S., Barber, N.L., Kenney, J.F., Linsey, K.S., Lumia, D.S., Maupin, M.A., 2004.Estimated use of water in the United States in 2000. Circular 1268. United StatesGeological Survey.
Jones, A.Q., Dewey, C.E., Dore, K., Majowicz, S.E., McEwen, S.A., Waltner-Toews, D.,Henson, S.J., Mathews, E., 2006. Public perceptions of drinking water: apostal survey of residents with private water supplies. BMC Public Health 6(94).
Kaiser, F.G., Hübner, G., Bogner, F.X., 2005. Contrasting the theory of plannedbehavior with the value-belief-norm model in explaining conservationbehavior. Journal of Applied Social Psychology 35 (10), 2150e2170.
Karp, D.G., 1996. Values and their effect on pro-environmental behavior. Environ-ment and Behavior 28 (1), 111e133.
Knobeloch, L., Salna,.B, Hogan, A., Postle, J., Anderson, H., 2000. Blue babies andnitrate-contaminated well water. Environmental Health Perspectives 108 (7),675e678.
Kollmuss, A., Agyeman, J., 2002. Mind the gap: why do people act environmentallyand what are the barriers to pro-environmental behavior? EnvironmentalEducation Research 8 (3), 239e260.
Lahaut, V.M.H.C.J., Jansen, H.A.M., Van de Mheen, D., Garretsen, H.F.L.,Verdurmen, J.E.E., Van Duk, A., 2003. Estimating non-response bias in a surveyon alcohol consumption: comparison of response waves. Alcohol and Alco-holism 38 (2), 128e134.
Lidner, J.R., Murphy, T.H., Briers, G.E., 2001. Handling nonresponse in social scienceresearch. Journal of Agricultural Education 42 (4), 43e53.
Lilly, A., Edwards, A.C., McMaster, M., 2003. Microbiological Risk Assessment SourceProtection for Private Water Supplies: Validation Study. The Macaulay Institute.
Lura Consulting., 2009. 2009 Well Aware program evaluation: summary report.Green Communities, Canada.
Macler, B.A., Merkle, J.C., 2000. Current knowledge on groundwater microbialpathogens and their control. Hydrogeology Journal 8, 29e40.
McClenaghan, T., 2005. Submissions in Response to Source Protection Reports bythe Implementation Committee and the Technical Experts Committee. Publi-cation #502. Canadian Environmental Law Association, Toronto, ON.
National Groundwater Association (NGWA)., 2005. The ground water supply and itsuse. Accessed online January 17, 2009: http://www.wellowner.org/agroundwater/gwsupplyanduse.shtml.
Novakowski, K., Beatty, B., Conboy, M.J., Lebedin, J., 2006. Water Well Sustainabilityin Ontario: Expert Panel Report. Ontario Ministry of the Environment, ON.
Ontario Ministry of Agriculture, Food, and Rural Affairs (OMAFRA)., 2010. Canada-Ontario environmental farm plan. Accessed online March 18, 2010: http://www.omafra.gov.on.ca/english/environment/efp/efp.htm.
Ontario Ministry of Health and Long-Term Care (OMOH)., 2007. Water safety:putting your well water to the test. Accessed online January 22, 2009: http://www.health.gov.on.ca/english/public/pub/watersafe/watersafe_welltest.html.
Ontario Ministry of the Environment (OMOE)., 2009a. Water publications. Accessedonline February 12, 2009: http://www.ene.gov.on.ca/en/publications/water/index.php#8f.
Ontario Ministry of the Environment (OMOE)., 2009b. Clean Water Act. Accessedonline April 5, 2009: http://www.ene.gov.on.ca/en/water/cleanwater/index.php.
PollutionWatch, 2009. Protecting the Great Lakes-St. Lawrence River Basin andDrinking Water Sources. Canadian Environmental Law Association, Toronto, ON.
Raina, P.S., Pollari, F.L., Teare, G.F., Goss, M.J., Barry, D.A.J., Wilson, J.B., 1999. Therelationship between E. coli indicator bacteria in well-water and gastrointes-tinal illness in rural families. Canadian Journal of Public Health 90 (3), 172e175.
Rogan, W.J., Brady, M.T., the Committee on Environmental Health, the Committeeon Infectious Diseases, 2009. Drinking water from private wells and risks tochildren. Pediatrics 123 (6), 1123e1137.
Ryan, C.M., 2009. Managing nonpoint source pollution in Western Washington:landowner learning methods and motivations. Environmental Management2009 (43), 1122e1130.
Schuster, C.J., Ellis, A.G., Robertson, W.J., Charron, D.F., Aramini, J.J., Marshall, B.J.,Medeiros, D.T., 2005. Infectious disease outbreaks related to drinking water inCanada, 1974e2001. Canadian Journal of Public Health 96 (4), 254e258.
Schwartz, J.J., Waterman, A.B., Lemley, A.T., Wagenet, L.P., Landre, P., Allee, D.J., 1998.Homeowner perceptions and management of private water supplies andwastewater treatment systems. Journal of Soil and Water Conservation 53 (4),315e319.
Schwartz, S.H., 1977. Normative influences on altruism. In: Berkowitz, L. (Ed.),Advances in Experimental Social Psychology. Academic Press, New York, NY, pp.221e279.
Shepherd, K.M., Wyn-Jones, A.P., 1997. Private water supplies and the local authorityrole: results of a U.K. national survey. Water Science and Technology 35 (11e12),41e45.
Simpson, H., 2004. Promoting the management and protection of private waterwells. Journal of Toxicology and Environmental Health, Part A 67, 1679e1704.
Simpson, H., Duff, S.N., Taylor, E.P., Myslik, J.P., 2007. A role for private wellheadprotection plans in broader source water protection planning. In: 60th CanadianGeotechnical Conference. The Canadian Geotechnical Conference, Ottawa, ON,pp. 154e161.
Stern, P.C., 2000. Toward a coherent theory of environmentally significant behavior.Journal of Social Issues 56 (3), 407e424.
Tabachnick, B.G., Fidell, L.S., 2007. Using Multivariate Statistics, fifth ed. PearsonEducation Inc., MA.
Tanner, C., 1999. Constraints on environmental behaviour. Journal of EnvironmentalPsychology 19, 145e157.
Treyens, C., 2009. A winning strategy: Follow these four objectives when addressingwater quality concerns. Water Well Journal 63 (4).
United States Environmental Protection Agency (USEPA)., 2007. Private drinkingwater wells: frequent questions. Accessed online April 5, 2009: http://www.epa.gov/safewater/privatewells/faq.html.
Wardle, J., Sutton, S., Williamson, S., Taylor, T., McCaffery, K., Cuzick, J., Hart, A.,Atkins, W., 2000. Psychosocial influences on older adults’ interest in partici-pating in bowel cancer screening. Preventive Medicine 31, 323e334.
Whitley, D.C., Ford, M.G., Livingstone, D.G., 2000. Unsupervised forward selection:a method for eliminating redundant variables. Journal of Chemical Informationand Modeling 40 (5), 1160e1168.
Copyright © 2022 FDOKUMEN