Strategies for enhanced annotation of a microarray probe set
16
Strategies for enhanced annotation of a microarray probe set TuShun R. Powers, Selene M. Virk, and Elba E. Serrano Department of Biology, New Mexico State University, Las Cruces, NM 88003, USA TuShun R. Powers: [email protected]; Selene M. Virk: [email protected]; Elba E. Serrano: [email protected] Abstract We aim to determine the biological relevance of genes identified through microarray-mediated transcriptional profiling of Xenopus sensory organs and brain. Difficulties with genetic data analysis arise because of limitations in probe set annotation and the lack of a universal gene nomenclature. To overcome these impediments, we used sequence based and semantic linking methods in combination with computational approaches to augment probe set annotation on a commercially available microarray. Our curation efforts enabled linkage of probe sets and expression data to public databases, increased the biological significance of our microarray data, and assisted with the tentative identification of unidentified probe sets. Keywords bioinformatics; data mining; gene identification; inner ear; mechanosensory hair cell; enhanced annotation; microarray probe set 1 Introduction Xenopus is a well established model organism for cellular and genetic investigations of complex biological processes during development (Nieuwkoop and Faber, 1967; Pollet et al., 2005; Wullimann et al., 2005). Microarrays increasingly are implemented as powerful tools for large scale assessment of gene expression patterns during essential features of Xenopus life such as embryonic tissue specification, organogenesis, neural induction, and hormonal signalling (Altmann et al., 2001; Munoz-Sanjuan et al., 2002; Baldessari et al., 2005; Das et al., 2006). In our laboratory, Xenopus is implemented as a model for identification of genes that are implicated in inner ear function and sensorineural organogenesis (Varela-Ramirez et al., 1998; Serrano et al., 2001; Quick and Serrano, 2007). To this end we are using the Affymetrix GeneChip ® Xenopus laevis Genome Array for transcriptional profiling of inner ear organs as a method for large scale identification of genes specific to the inner ear, especially those involved in inner ear development (Powers et al., 2007). Our comparative approach analyses Xenopus inner ear transcriptional profiles together with those of brain and other Xenopus organs. These experiments are undertaken with the long term goal of uncovering genes essential for the process of mechanotransduction and the maintenance and regeneration of the mechanosensory hair cell phenotype. During our analysis of Xenopus microarray expression data, we observed that the vendor supplied annotation information for the Xenopus laevis GeneChip ® probe set IDs (Xl-PSIDs) was a key limiting factor in our ability to interpret results. In part, this is because genetics research with the tetraploid Xenopus species, X. laevis, can be inherently difficult. The X. Correspondence to: Elba E. Serrano, [email protected]. NIH Public Access Author Manuscript Int J Bioinform Res Appl. Author manuscript; available in PMC 2010 October 16. Published in final edited form as: Int J Bioinform Res Appl. 2010 ; 6(2): 163–178. NIH-PA Author Manuscript NIH-PA Author Manuscript NIH-PA Author Manuscript
-
Upload
independent -
Category
Documents
-
view
0 -
download
0
Transcript of Strategies for enhanced annotation of a microarray probe set

Strategies for enhanced annotation of a microarray probe set
TuShun R. Powers, Selene M. Virk, and Elba E. SerranoDepartment of Biology, New Mexico State University, Las Cruces, NM 88003, USATuShun R. Powers: [email protected]; Selene M. Virk: [email protected]; Elba E. Serrano: [email protected]
AbstractWe aim to determine the biological relevance of genes identified through microarray-mediatedtranscriptional profiling of Xenopus sensory organs and brain. Difficulties with genetic data analysisarise because of limitations in probe set annotation and the lack of a universal gene nomenclature.To overcome these impediments, we used sequence based and semantic linking methods incombination with computational approaches to augment probe set annotation on a commerciallyavailable microarray. Our curation efforts enabled linkage of probe sets and expression data to publicdatabases, increased the biological significance of our microarray data, and assisted with the tentativeidentification of unidentified probe sets.
Keywordsbioinformatics; data mining; gene identification; inner ear; mechanosensory hair cell; enhancedannotation; microarray probe set
1 IntroductionXenopus is a well established model organism for cellular and genetic investigations ofcomplex biological processes during development (Nieuwkoop and Faber, 1967; Pollet et al.,2005; Wullimann et al., 2005). Microarrays increasingly are implemented as powerful toolsfor large scale assessment of gene expression patterns during essential features of Xenopus lifesuch as embryonic tissue specification, organogenesis, neural induction, and hormonalsignalling (Altmann et al., 2001; Munoz-Sanjuan et al., 2002; Baldessari et al., 2005; Das etal., 2006). In our laboratory, Xenopus is implemented as a model for identification of genesthat are implicated in inner ear function and sensorineural organogenesis (Varela-Ramirez etal., 1998; Serrano et al., 2001; Quick and Serrano, 2007). To this end we are using theAffymetrix GeneChip® Xenopus laevis Genome Array for transcriptional profiling of inner earorgans as a method for large scale identification of genes specific to the inner ear, especiallythose involved in inner ear development (Powers et al., 2007). Our comparative approachanalyses Xenopus inner ear transcriptional profiles together with those of brain and otherXenopus organs. These experiments are undertaken with the long term goal of uncoveringgenes essential for the process of mechanotransduction and the maintenance and regenerationof the mechanosensory hair cell phenotype.
During our analysis of Xenopus microarray expression data, we observed that the vendorsupplied annotation information for the Xenopus laevis GeneChip® probe set IDs (Xl-PSIDs)was a key limiting factor in our ability to interpret results. In part, this is because geneticsresearch with the tetraploid Xenopus species, X. laevis, can be inherently difficult. The X.
Correspondence to: Elba E. Serrano, [email protected].
NIH Public AccessAuthor ManuscriptInt J Bioinform Res Appl. Author manuscript; available in PMC 2010 October 16.
Published in final edited form as:Int J Bioinform Res Appl. 2010 ; 6(2): 163–178.
NIH
-PA Author Manuscript
NIH
-PA Author Manuscript
NIH
-PA Author Manuscript
laevis genome has not been sequenced and the majority of X. laevis gene annotations arisefrom ESTs and cDNA libraries. Consequently, gene annotations for X. laevis may not be ascomprehensive as those for X. tropicalis, a diploid sister species that is viewed as a superioralternative for molecular genetics experiments due to its smaller genome and shorter generationtime (Amaya, 2005). The X. tropicalis genome has been sequenced and is available throughthe University of Santa Cruz (UCSC) genome browser (Kent et al., 2002).
Thus, a central theme that emerged in our genetic analysis is that variations in genenomenclature and functional descriptions can cause ambiguities when we attempt to extractbiological significance from Xl-PSID annotations. What is the remedy for this problem, whichis a challenge shared by many investigators? This issue is especially problematic for researcherswho work with organisms other than human or mouse, or with organisms having anunsequenced or poorly annotated genome. Some laboratories have solved this problem bydeveloping methods to match genes to multiple gene identifiers and integrate this informationinto a queriable database (Glasner et al., 2003). For example, Dai et al. (2004) developed theGeneView system to provide more extensive gene annotation information for microarray chipsthan their vendors.
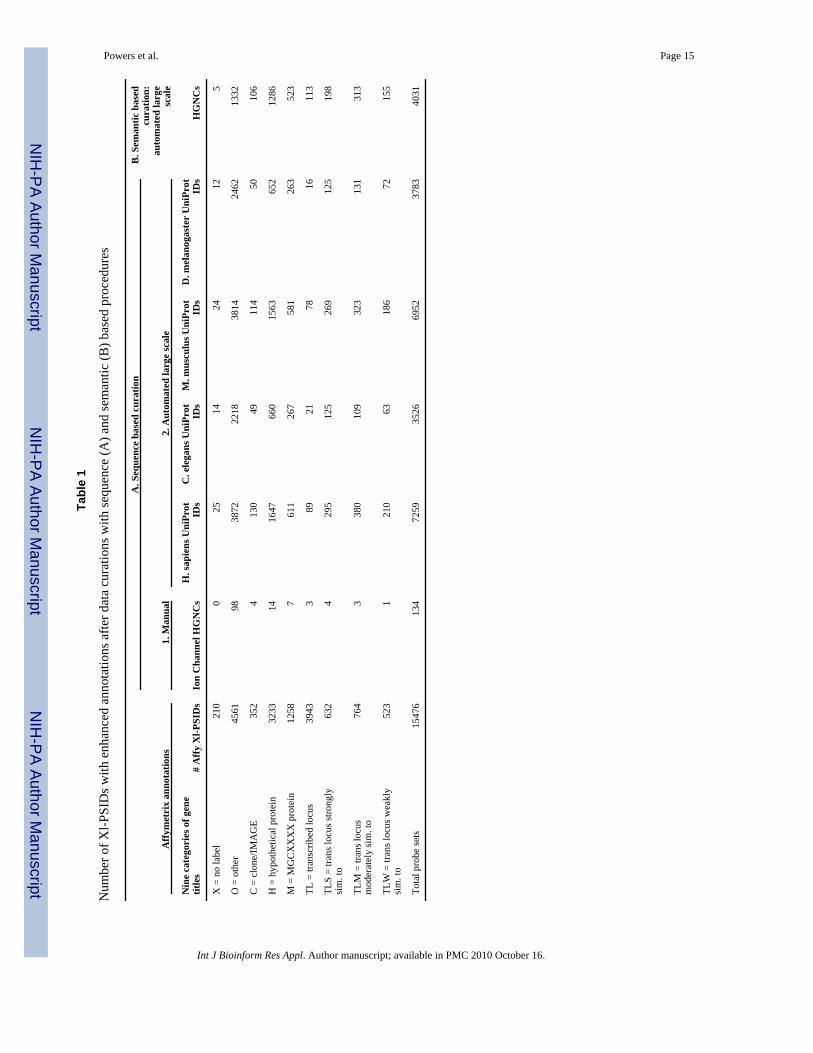
In this paper we summarise our efforts to enhance the annotations of the Xl-PSIDs usingcuration procedures that linked them to more informative gene identifiers such as the HGNCsymbols (HUGO Gene Nomenclature Committee) and UniProt (Universal Protein Resource)IDs (Table 1). HGNC symbols are derived from the official gene name of a human proteinapproved by the HUGO Gene Nomenclature Committee (http://www.genenames.org/). As inthe case of HGNC symbols, a consortium oversees the curation of protein sequences withaccurate and functional annotations for UniProt IDs (The UniProt Consortium, 2007). Thus,linkage of Xl-PSIDs to these public databases increases the value added from the enhancedannotation because a large scientific community regularly oversees and updates the geneidentifiers, thereby minimising the impact of the lack of standardisation of gene nomenclature.We developed three computational strategies that relied either on sequence similarity (Figure1(A)) or semantic similarity (Figure 1(B)). Our results demonstrate how manual and automatedannotation identification techniques can be used to enrich the available information that canbe mined from a transcriptional profiling experiment in a manner that is cost-effective andeasily achievable for a small laboratory operation.
2 DatasetsThe 15,611 PSIDs on the Affymetrix GeneChip® Xenopus laevis Genome Array comprise15,503 probe sets representing 14,400 transcripts (16 probe pairs per transcript) that are acombination of mRNAs and ESTs with a bias towards 3′ UTRs. Within this total, 135 PSIDsare Affymetrix controls. For the purpose of this research paper we will only discuss the 15,476PSIDs that begin with the ‘Xl.’ label because the transcripts used to design these probe setscan be identified in the UniGene clusters by their X. laevis UniGene ID. Annotation informationfor Xl-PSIDs is provided online at The NetAffx Analysis Center(http://www.affymetrix.com/analysis/index.affx) or in the vendor supplied annotation file,Xenopus_laevis.na25.annot.csv(http://www.affymetrix.com/support/technical/byproduct.affx?product=xenopus). Theannotation provided for the Xl-PSIDs includes information about gene identifiers such as aone line gene title, a gene symbol, the archival UniGene cluster, the UniGene ID, the UniGenecluster type, the Entrez gene ID, the RefSeq protein ID, the RefSeq transcript ID, GeneOntology (GO) terms with GO ID number, the Swissprot ID, and the GenBank Accessionnumber.
Powers et al. Page 2
Int J Bioinform Res Appl. Author manuscript; available in PMC 2010 October 16.
NIH
-PA Author Manuscript
NIH
-PA Author Manuscript
NIH
-PA Author Manuscript

After inspecting the annotation file from Affymetrix, we determined that the one line ‘GeneTitle’ column contained information that could be used to group 98% of Xl-PSIDs into ninedifferent categories (Table 1): Category X, those without a designated ‘Gene Title’; CategoryO, so named for ‘other’, contains one line descriptions consisting of gene names or anythingelse that does not fall into the other eight categories; Category C has designations with cDNAIMAGE numbers (integrated molecular analysis of genomes and their expression, Miller et al.,1997) or numbered cDNA clones; Category H contains hypothetical proteins (in which 20 haveadditional modifiers such as a putative gene name for the hypothetical protein); Category Mcontain the MGCXXXX protein numbers from the mammalian gene collection(http://mgc.nci.nih.gov/), and four categories are designated as Transcribed Locus (TL), withTLS, TLM, and TLW abbreviated for transcribed loci that are strongly (>90%), moderately(70–90%) or weakly (<70%) similar to another protein in an aligned region (percentages ofsimilarity are defined by UniGene (http://www.ncbi.nlm.nih.gov/UniGene/FAQ.shtml)). Ascan be seen in Figure 2, most of the Xl-PSIDs were allocated into the following categories: O(other, 30%), TL (transcribed locus, 26%), and H (hypothetical proteins, 21%). The quality ofannotation information provided for the nine different categories varies, with the encircledgroups (TL, M, H, and C) in Figure 2 having the most ambiguous gene descriptions. Thesegroupings were used to analyse the outcomes of our enhancement of the Xl-PSID annotationsbefore and after linkage to HGNC symbols or UniProt IDs.
3 Computational approaches3.1 Sequence based computational approaches for linking Xl-PSIDs to HGNCs
3.1.1 Annotation with implementation of manual primary literature searches,open source software, and public database queries—Interesting gene expressionpatterns for inner ear function are not lacking in the literature. Due to the importance of ionchannels for the process of mechanotransduction, as well as their role in hereditary disordersof hearing and balance (Gabashvili et al., 2007; Serrano et al., 2001), we are especiallyinterested in enhancing Xl-PSIDs with annotations for this gene family. However, makingconnections between experimental data found in the literature and microarray data can bechallenging because of variable nomenclature as well as new understanding of gene functionfor different species. The type of gene identifiers referenced in the literature greatly dependson when the paper was published. If the nomenclature has changed since publication, there canbe difficulties in establishing connections to Xl-PSIDs. Additionally, the name of proteins inpublications can vary for similar genes between species.
Through literature searches we identified a publication by Gabashvili et al. (2007) thatcontained a list of 262 genes for Ion Channel Activity (ICA), which are expressed in inner eartissue. The ICA gene list was compiled based on data gleaned from cDNA libraries, microarrayanalysis, and RT-PCR experiments. Because the Gabashvili et al. (2007) reference already hadHGNCs as the gene symbol of choice, we did not need to search for these. However, it shouldbe noted, that if HGNC symbols are not known, GenBank accession numbers, gene names orsymbols can be used to find the HGNC symbols in the UCSC genome browser (Kent et al.,2002). This process of identifying target genes was the first step in the curation process outlinedin Figure 1(A1).
We began the process of identifying putative ICA Xl-PSIDs by making a text file of all HGNCsfrom the list in the paper and using this to collect Homo sapiens protein sequences with BioMart(http://www.ensembl.org/biomart/martview/4ad4b6a9d10e301741f0d1e2755fe0f0), a miningtool that can be used to retrieve information from the Ensembl database (Figure 1(A1)). Whenthe Ensembl database (release 49) was filtered with the list of 262 ICA HGNC symbols, a totalof 241 protein sequences were recovered from the H. sapiens gene dataset (NCBI36). We usedthe TBLASTN algorithm software (Altschul et al., 1990) in a local search with the H.
Powers et al. Page 3
Int J Bioinform Res Appl. Author manuscript; available in PMC 2010 October 16.
NIH
-PA Author Manuscript
NIH
-PA Author Manuscript
NIH
-PA Author Manuscript
sapiens ICA proteins as the protein query, and the 15,476 consensus nucleotide sequences forXl-PSIDs that begin with the ‘Xl.’ label(http://www.affymetrix.com/support/technical/byproduct.affx?product=xenopus) as thenucleotide database. Results from the TBLASTN search were evaluated by the returned e-value and a list was compiled of the best Xl-PSID matches to ICA HGNC symbols (e-valuesless than 10−14). This labour-intensive method limits the number of Xl-PSIDs that can beprocessed at once, but provides the highest quality annotation for Xl-PSIDs.
3.1.2 Large scale batch annotation with implementation of open source softwareand public database queries—This approach (Figure 1(A2)), like the manual annotationidentification, used sequence similarity to link Xl-PSIDs to UniProt IDs by mining the UniProtdatabase. For this automated strategy, the BLASTX program (Altschul et al., 1990) was usedin a large scale batch search. All known H. sapiens (human), Mus musculus (mouse),Caenorhabditis elegans (worm) and Drosophila melanogaster (fly) protein sequences werecollected from UniProt (The UniProt Consortium, 2007), then compared against nucleotidequeries consisting of the 15,476 consensus sequences for the Xl-PSIDs that begin with the ‘Xl.’label. With this method the annotation of an entire chip can be readily enhanced.
3.2 Semantic based computational approaches for linking Xl-PSIDs to HGNCsTo address the limitations of vendor-supplied annotation data, a local instance of an annotationdatabase was created that incorporated internal expression data and publicly available geneannotation information (Figure 1(B)). The vendor-supplied annotation for Xl-PSIDs is in aformat that is not readily searchable in a high-throughput fashion. In an attempt to overcomethis limitation, a MySQL® database, XenEnhance, was created to store the Xl-PSID annotationdata. We opted to store data in a relational database rather than in another format (such as aflat file) because a relational database can accommodate expansion of Xenopus resourceannotation efforts in the future beyond microarray curation. XenEnhance permits linkage ofXl-PSIDs with the UniGene cluster IDs. This approach relies on the fact that Xl-PSIDs arederived from UniGene cluster IDs; therefore, their linkage to UniGene cluster IDs isstraightforward. Although the vendor provides the UniGene cluster IDs as part of the Xl-PSIDannotation, vendor UniGene cluster ID updates are provided less frequently than those on theUniGene public database which are updated monthly(http://www.ncbi.nlm.nih.gov/UniGene/FAQ.shtml).
Specifically, XenEnhance consists of seven database tables (Figure 3) created using dataretrieved in flat file format from four data sources: the X. laevis GeneChip® annotation file,UniGene, RefSeq, and HGNC symbol data. Two tables were created from the UniGene data.The table ‘ug_clusters_82’ stores descriptive information for each UniGene cluster in therelease, while the table ‘sim_proteins_ug’ stores descriptive information for the human proteinsthat are similar to the UniGene clusters in ‘ug_clusters_82’. One table, ‘hgnc_051908’, waspopulated with HGNC data that was downloaded on May 19, 2008. This table containsdescriptive information for each current official gene symbol. Another table, ‘hs_prot2rna_29’,was created using data from the RefSeq file, release29.accession2geneid(http://www.ncbi.nlm.nih.gov/RefSeq/). This table contains human RefSeq protein accession,the corresponding human RefSeq RNA accession, and the human Entrez gene ID for thecorresponding gene. Two additional tables were created using data from the vendor-suppliedannotation file for the X. laevis GeneChip®. The Xl-PSID links the data in these two tables.One of these tables, ‘xl_probeset_031808’, contains descriptive information whereas thesecond table, ‘xl_probe_031808’, contains the individual probe ID and the sequences thatcomprise a probe set. Finally, the linking table, ‘ug_82_hgnc_051908’, was created to maintainthe association between a X. laevis UniGene cluster and HGNC official gene symbols (seeFigure 4(A)–(C)).
Powers et al. Page 4
Int J Bioinform Res Appl. Author manuscript; available in PMC 2010 October 16.
NIH
-PA Author Manuscript
NIH
-PA Author Manuscript
NIH
-PA Author Manuscript
To format the data from the various sources into a form that could be inserted intoXenEnhance, text parsers and table population software were written in the Java™ language(SDK version 1.5.0_13) to extract the required data from text files and load data into the tables.
The vendor-supplied annotation file is parsed in such a way as to create a separate row in thecorresponding database table for each Xl-PSID (a separate table was created for the individualprobes, which are linked to the Xl-PSIDs). The UniGene Xl.data file was parsed to extractcluster ID, cluster description, the gene represented by the cluster, and the gene ID. The parseddata were loaded into the table ‘ug_clusters_82’. The presence of the gene ID permits directlinking to NCBI’s Entrez Gene without the need to create a local instance of that data set. Asmentioned previously, the Xl-PSIDs are derived from UniGene cluster IDs and the two cantherefore be readily linked without the creation of a distinct linking table.
To make the link between the Xl-PSIDs and the HGNC official gene symbols, it was necessaryto combine data from other sources to that obtained from UniGene. The first step toward thislinkage relied upon the UniGene file, Xl.data. Using the contents of this file, we were able tolink X. laevis UniGene clusters with proteins from different species, including human. Whena UniGene cluster has a human protein with which it shares a degree of similarity, the proteinaccession ID is used to locate the corresponding human Entrez gene ID from the RefSeq file,release29.accession2geneid. In addition to Entrez gene ID, the release29.accession2geneid fileprovides RefSeq RNA accessions (when available), the taxon ID, and the RefSeq proteinaccessions. Using the Entrez gene ID, the HGNC database table could be searched to locatethe corresponding official gene symbol. The Entrez gene ID is used as the direct link betweenXl-PSIDs and HGNC official gene symbols. It is also possible to use the RefSeq proteinaccession to link to the HGNC data, which would be useful in cases where the HGNC symbolcould not be linked to Xl-PSID by means of Entrez gene ID. Because we were using a morerecent release of UniGene than was used when the chip was created, it was necessary for us touse current cluster assignments of the Xl-PSIDs to make the linkage to HGNC symbols.
4 Results and discussion4.1 All three curation approaches successfully link Xl-PSIDs to HGNCs or UniProt IDs
The HGNC symbols for the 241 ICA genes that were manually identified, matched to 134 Xl-PSIDs (Table 1A1). Seventy-three percent of the HGNC symbols were linked to Xl-PSIDs inthe O category, showing that even this labour intensive technique can enhance one line genetitles. The majority of enhanced annotations were identified using the large scale sequencesimilarity based approach (Table 1A2). UniProt IDs from H. sapiens and M. musculus had thelargest counts for matches, linking 7,259 (47%) and 6,952 (45%) of the Xl-PSIDs, respectively,to a new annotation (Table 1A2). Using the semantic approach, we were able to associate 4031(26%) of the 15,476 Xl-PSIDs that were derived from UniGene clusters to HGNC symbolsbased on various degrees of similarity between X. laevis and human proteins.
All three procedures had the highest matches to the other (O) and hypothetical protein (H)categories. Over half of the matches obtained with the sequence similarity approach enhancedannotations within the O category (Table 1A); 1/3 of the matches obtained with the semanticbased approach enhanced annotations within the O and the H categories (Table 1B).
4.2 Automated large scale data curation procedures enhance 60% of the Xl-PSIDsFigure 5(A) illustrates that together, the two large scale approaches (sequence and semanticbased) matched a majority of the Xl-PSIDs to an additional gene identifier such as a UniProtID or HGNC symbol (9108 matches, Table 2A). More than half of all the Xl-PSIDs wereenhanced with an additional annotation, with over half of these matching 4–6 annotations.
Powers et al. Page 5
Int J Bioinform Res Appl. Author manuscript; available in PMC 2010 October 16.
NIH
-PA Author Manuscript
NIH
-PA Author Manuscript
NIH
-PA Author Manuscript

Within the enhanced group (Figure 5(B)), over a quarter of Xl-PSIDs were matched to fivenew annotations.
When we compared the category distribution of the enhanced (Figure 6(A)) and non-enhanced(Figure 6(B)) Xl-PSIDs, we observed that the majority of the enhanced Xl-PSIDs were in theO (other, 45%) and H (hypothetical proteins, 27%) categories (Figure 6(A)). The third largestgroup with enhanced annotations, the M category (MGCXXXX proteins from the mammaliangene collection) included 10% of the Xl-PSIDs with enhanced annotations (Figure 6(A)). Ourcuration strategies identified 929 additional annotations within the M category (74%, Table2). The TL category remained elusive, with 3,733 (94.7%) of the Xl-PSIDs having onlyAffymetrix annotations (Table 2) after curation.
5 ConclusionWe have attacked the problem of enhancing microarray chip annotation with multipleapproaches that were either sequence similarity based, or relied on semantic relationshipsbetween publicly available annotation data from X. laevis and other species. HGNC andUniProt databases were selected as purveyors of target enhancement annotations because theyare collaboratively maintained by the research community and they are frequently updated(http://www.genenames.org/; The UniProt Consortium, 2007). Using the semantic approach,we increased our flexibility in mining the microarray data by creating a relational database thatlinked the vendor supplied annotation data for Xl-PSIDs with publicly available annotation forX. laevis and other species. In so doing, we were able to enhance the existing annotation for60% of the Xl-PSIDs and to associate gene function properties with Xl-PSIDs that lacked thisinformation in the annotation provided by the microarray vendor (Figures 5 and 6). In thefuture, we intend to extend our curation efforts by augmenting Xl-PSID annotations withinformation from online public resources dedicated to Xenopus genetics. For example, websitessuch as Xenbase (http://www.xenbase.org) and the Xenopus Gene Collection (XGC)(http://xgc.nci.nih.gov/) are repositories for Xenopus gene annotation data that are especiallyuseful because they provide lists of full length clones. XGC comprises 10,291 full open readingframe clones and 9,138 non-redundant genes and Xenbase is currently in the process of linkinghuman homologs, along with other species, to Xenopus genes. In addition, software toolsdeveloped as a result of our annotation efforts will be made freely available to the Xenopuscommunity.
Ideally, we would prefer to work with universal gene symbols. However, presently there is nouniversally accepted consensus gene nomenclature for all species and there is variability in thedegree of completion of publicly available annotation data for various species. Consequently,multifaceted approaches for annotation such as those presented here will continue to providevalue for researchers by enhancing vendor-supplied microarray annotation and tentativelyidentifying previously unidentified Xl-PSIDs.
AcknowledgmentsThe authors express their gratitude to Dr. Charles Whittaker for insights and assistance with the mapping of X.laevis Xl-PSIDs to sequenced genomes. This work was supported in part by NIH (GM008136; DC003292;P50GM068762) awards to E.E.S. and an NSF IGERT Fellowship to S.M.V. (DGE-0504304).
ReferencesAltmann CR, Bell E, Sczyrba A, Pun J, Bekiranov S, Gaasterland T, Brivanlou AH. ‘Microarray-based
analysis of early development in Xenopus laevis’. Developmental Biology 2001;236(1):64–75.[PubMed: 11456444]
Powers et al. Page 6
Int J Bioinform Res Appl. Author manuscript; available in PMC 2010 October 16.
NIH
-PA Author Manuscript
NIH
-PA Author Manuscript
NIH
-PA Author Manuscript
Altschul SF, Gish W, Miller W, Myers EW, Lipman DJ. ‘Basic local alignment search tool’. Journal ofMolecular Biology 1990;215(3):403–410. [PubMed: 2231712]
Amaya E. ‘Xenomics’. Genome Research 2005;15(12):1683–1691. [PubMed: 16339366]Baldessari D, Shin Y, Krebs O, König R, Koide T, Vinayagam A, Fenger U, Mochii M, Terasaka C,
Kitayama A, Peiffer D, Ueno N, Eils R, Cho KW, Niehrs C. ‘Global gene expression profiling andcluster analysis in Xenopus laevis’. Mechanisms of Development 2005;122(3):441–475. [PubMed:15763214]
Dai H, Tian B, Zhao WD, Leung A, Smith SR, Wan JS, Yao X. ‘Dynamic integration of gene annotationand its application to microarray analysis’. Journal of Bioinformatics and Computational Biology2004;1(4):627–645. [PubMed: 15290757]
Das B, Cai L, Carter MG, Piao YL, Sharov AA, Ko MS, Brown DD. ‘Gene expression changes atmetamorphosis induced by thyroid hormone in Xenopus laevis tadpoles’. Developmental Biology2006;291(2):342–355. [PubMed: 16458881]
Gabashvili IS, Sokolowski BH, Morton CC, Giersch AB. ‘Ion channel gene expression in the inner ear’.Journal of the Association for Research in Otolaryngology 2007;8(3):305–328. [PubMed: 17541769]
Glasner JD, Liss P, Plunkett G III, Darling A, Prasad T, Rusch M, Byrnes A, Gilson M, Biehl B, BlattnerFR, Perna NT. ‘ASAP, a systematic annotation package for community analysis of genomes’. NucleicAcids Research 2003;31(1):147–151. [PubMed: 12519969]
Kent, WJ.; Sugnet, CW.; Furey, TS.; Roskin, KM.; Pringle, TH.; Zahler, AM.; Haussler, D. The humangenome browser at UCSC; Genome Research. 2002. p. 996-1006.Website: http://genome.ucsc.edu/
Miller G, Fuchs R, Lai E. ‘IMAGE cDNA clones, UniGene clustering, and ACeDB: an integrated resourcefor expressed sequence information’. Genome Research 1997;7(10):1027–1032. [PubMed: 9331373]
Munoz-Sanjuan I, Bell E, Altmann CR, Vonica A, Brivanlou AH. ‘Gene profiling during neural inductionin Xenopus laevis: regulation of BMP signalling by post-transcriptional mechanisms and TAB3, anovel TAK1-binding protein’. Development 2002;129(23):5529–5540. [PubMed: 12403722]
Nieuwkoop, PD.; Faber, J. Normal Table of Xenopus laevis (Daudin): A Systematical and ChronologicalSurvey of the Development from the Fertilized Egg Till the End of Metamorphosis. 2. North-HollandPublishing Co; Amsterdam: 1967.
Pollet N, Muncke N, Verbeek B, Li Y, Fenger U, Delius H, Nierhrs C. ‘An atlas of differential geneexpression during early Xenopus embryogenesis’. Mechanisms of Development 2005;122(3):365–439. [PubMed: 15763213]
Powers T, Trujillo-Provencio C, Whittaker C, Serrano EE. ‘Gene expression profiling of xenopus organsyields insight into the Xenopus inner ear transcriptome’. Association for Research in Otolaryngology.Abstr 2007;30(741):254.
Quick QA, Serrano EE. ‘Cell proliferation during the early compartmentalization of the Xenopuslaevis inner ear’. International Journal of Developmental Biology 2007;51(3):201–210. [PubMed:17486540]
Serrano EE, Trujillo-Provencio C, Sultemeier D, Bullock WM, Quick QA. ‘Identification of genesexpressed in the Xenopus inner ear’. Cellular and Molecular Biology (Noisy-le-grand) 2001;47(7):1229–1239.
The UniProt Consortium. The Universal Protein Resource (UniProt); Nucleic Acids Res. 2007. p. D193-D197.UniProt website: http://www.pir.uniprot.org/
Varela-Ramirez A, Trujillo-Provencio C, Serrano EE. ‘Detection of transcripts for delayed rectifierpotassium channels in the Xenopus laevis inner ear’. Hearing Research 1998;119(1–2):125–134.[PubMed: 9641325]
Wullimann MF, Rink E, Vernier P, Schlosser G. ‘Secondary neurogenesis in the brain of the Africanclawed frog, Xenopus laevis, as revealed by PCNA, Delta-1, Neurogenin-related-1, and NeuroDexpression’. The Journal of Comparative Neurology 2005;489(3):387–402. [PubMed: 16025451]
WebsitesAffymetrix website, Obtained through the
internethttp://www.affymetrix.com/support/technical/byproduct.affx?product=xenopus
Powers et al. Page 7
Int J Bioinform Res Appl. Author manuscript; available in PMC 2010 October 16.
NIH
-PA Author Manuscript
NIH
-PA Author Manuscript
NIH
-PA Author Manuscript
Biomart via Ensembl, Obtained through theinternethttp://www.ensembl.org/biomart/martview/4ad4b6a9d10e301741f0d1e2755fe0f0
HUGO Gene Nomenclature Committee, Obtained through the internethttp://www.genenames.org/NetAffx website, Obtained through the internethttp://www.affymetrix.com/analysis/index.affxThe mammalian gene collection website, Obtained through the internethttp://mgc.nci.nih.gov/The Reference Sequence (RefSeq) Collection website, Obtained through the
internethttp://www.ncbi.nlm.nih.gov/RefSeq/The Xenopus Gene Collection (XGC) website, Obtained through the internet: http://xgc.nci.nih.gov/UniGene website, Obtained through the internet: http://www.ncbi.nlm.nih.gov/UniGene/FAQ.shtmlXenbase website, Obtained through the internet: http://www.xenbase.org
BiographiesTuShun R. Powers is a Postdoctoral Researcher in the Department of Biology at New MexicoState University. She received her PhD in Molecular Biology with a special interest in ruminantmicrobiology from New Mexico State University in 2005. She is intrigued by interdisciplinaryresearch approaches and has interests in microbiology, molecular biology, bioinformatics, andfunctional genomics.
Selene M. Virk is a PhD student in the Department of Biology at New Mexico State University,where she received her Bachelor and Masters of Science degrees. Her current research interestsinclude developing software tools to facilitate functional gene annotation, nervous systemdevelopment, mechanotransduction, and modelling of complex biological systems. She hasten years experience as a Software Engineer in the biotech industry.
Elba E. Serrano is a Regent’s Professor of Biology at New Mexico State University and amember of the MIT Systems Biology Cell Decision Processes Center. She received herundergraduate degree in physics with distinction from the University of Rochester and her PhDin Biological Sciences from Stanford University with an emphasis in neuroscience andbiophysics. Her research interests include neural regeneration, mechanotransduction, anddisorders of hearing and balance. She has a special interest in promoting interdisciplinaryeducation that bridges the life and quantitative/physical sciences, and in programmes thatencourage students to pursue advanced degrees in Science, Technology, Engineering, andMathematics (STEM) disciplines.
Powers et al. Page 8
Int J Bioinform Res Appl. Author manuscript; available in PMC 2010 October 16.
NIH
-PA Author Manuscript
NIH
-PA Author Manuscript
NIH
-PA Author Manuscript

Figure 1.Overview of strategies used to curate Xl-PSIDs with enhanced gene identification througheither sequence similarity (A) or semantic similarity (B) computational methods. A1. HGNCs(official gene symbols) linked to Xl-PSIDs for genes of interest manually identified in theliterature using sequence similarity as the linkage parameter. A2. Automated large scale linkageof Xl-PSIDs to UniProt IDs (for H. sapiens, C. elegans, M. musculus, and D. melanogasterprotein sequences) using sequence similarity matching. B. Semantic-based data flow processto link Xl-PSIDs to HGNCs
Powers et al. Page 9
Int J Bioinform Res Appl. Author manuscript; available in PMC 2010 October 16.
NIH
-PA Author Manuscript
NIH
-PA Author Manuscript
NIH
-PA Author Manuscript
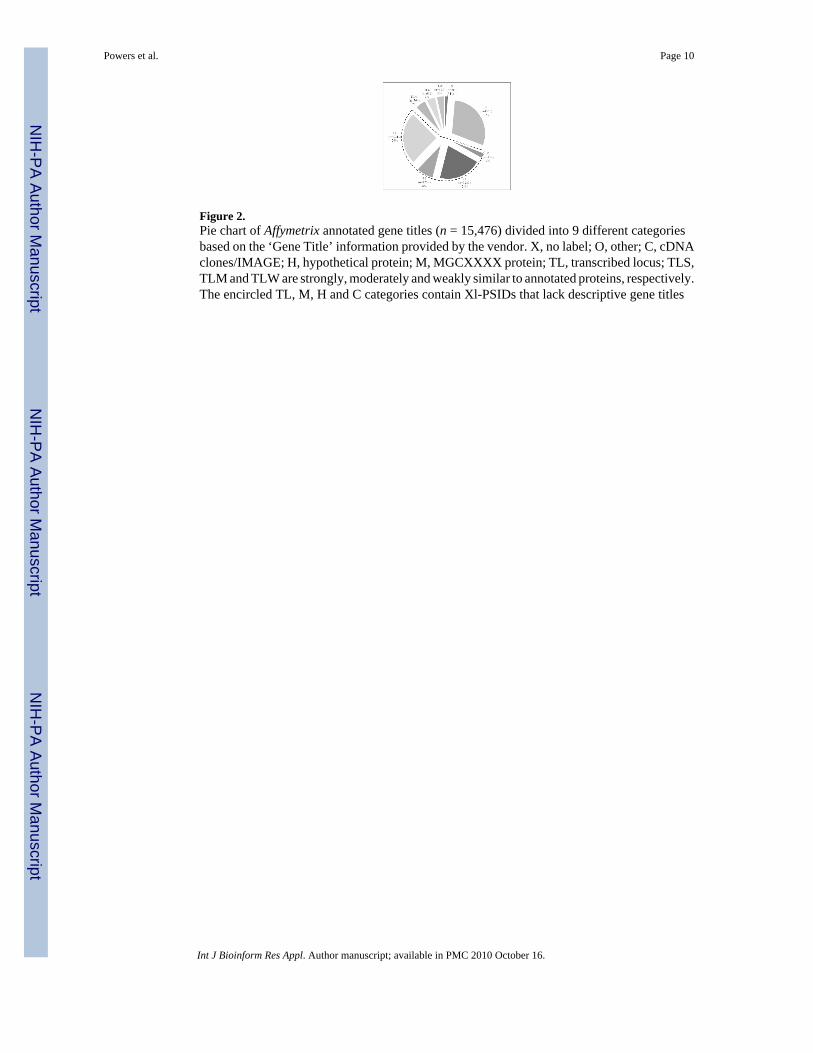
Figure 2.Pie chart of Affymetrix annotated gene titles (n = 15,476) divided into 9 different categoriesbased on the ‘Gene Title’ information provided by the vendor. X, no label; O, other; C, cDNAclones/IMAGE; H, hypothetical protein; M, MGCXXXX protein; TL, transcribed locus; TLS,TLM and TLW are strongly, moderately and weakly similar to annotated proteins, respectively.The encircled TL, M, H and C categories contain Xl-PSIDs that lack descriptive gene titles
Powers et al. Page 10
Int J Bioinform Res Appl. Author manuscript; available in PMC 2010 October 16.
NIH
-PA Author Manuscript
NIH
-PA Author Manuscript
NIH
-PA Author Manuscript
Figure 3.Schematic view of XenEnhance depicting the relationships between tables. Note, arrows donot imply unidirectional linkage, but demonstrate how HGNCs were linked to Xl-PSIDs
Powers et al. Page 11
Int J Bioinform Res Appl. Author manuscript; available in PMC 2010 October 16.
NIH
-PA Author Manuscript
NIH
-PA Author Manuscript
NIH
-PA Author Manuscript

Figure 4.Data sources for automated processing. A. List of the sources used to retrieve information forthe relational database, XenEnhance. B. Sample contents from UniGene Xl.data file. Xl-PSIDswere associated to HGNC symbols using UniGene cluster ID and the PROTSIM line. Note:Entrez Gene ID is the gene index for the X. laevis gene associated with the cluster. C. Sampledata from the RefSeq data file (release29. accession2geneid) retrieved using the PROTID fromthe PROTSIM line in 4(B)
Powers et al. Page 12
Int J Bioinform Res Appl. Author manuscript; available in PMC 2010 October 16.
NIH
-PA Author Manuscript
NIH
-PA Author Manuscript
NIH
-PA Author Manuscript
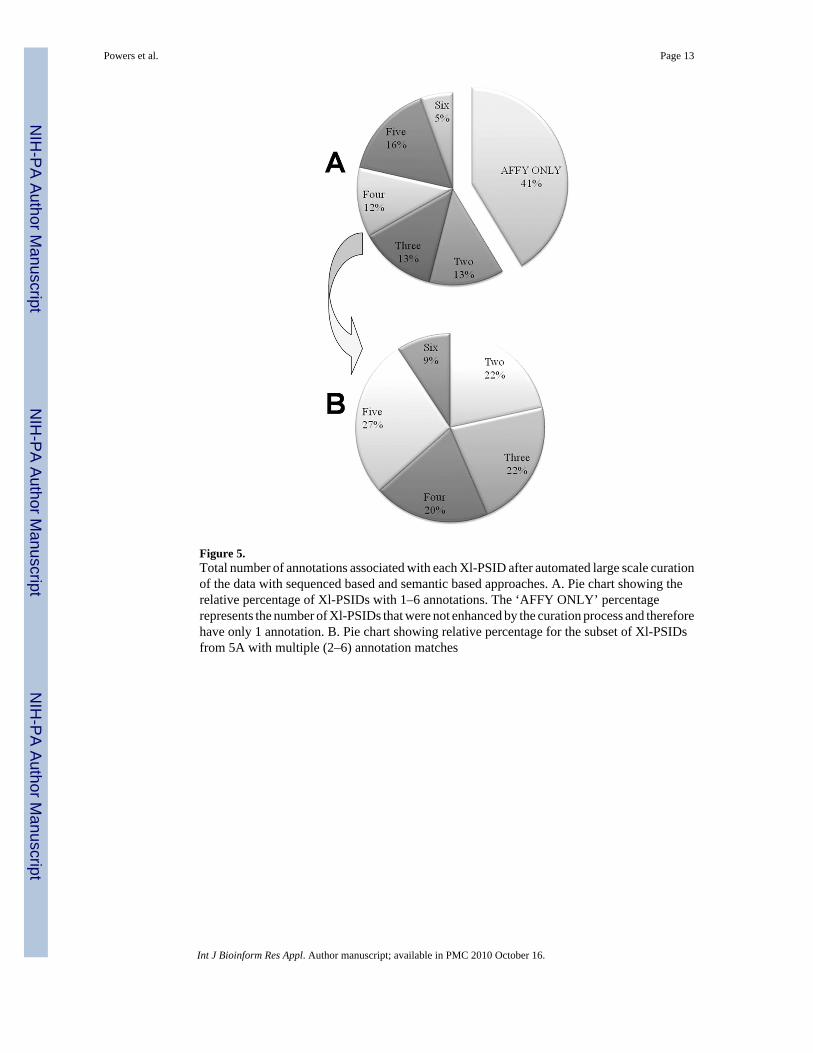
Figure 5.Total number of annotations associated with each Xl-PSID after automated large scale curationof the data with sequenced based and semantic based approaches. A. Pie chart showing therelative percentage of Xl-PSIDs with 1–6 annotations. The ‘AFFY ONLY’ percentagerepresents the number of Xl-PSIDs that were not enhanced by the curation process and thereforehave only 1 annotation. B. Pie chart showing relative percentage for the subset of Xl-PSIDsfrom 5A with multiple (2–6) annotation matches
Powers et al. Page 13
Int J Bioinform Res Appl. Author manuscript; available in PMC 2010 October 16.
NIH
-PA Author Manuscript
NIH
-PA Author Manuscript
NIH
-PA Author Manuscript

Figure 6.Summary of the enhancement of Xl-PSID annotations with the addition of HGNC symbolsand UniProt IDs by automated large scale data curation. (A) PSIDs with enhanced annotation,2–6 each (n = 9,108) and (B) PSIDs without enhanced annotation (n = 6,368)
Powers et al. Page 14
Int J Bioinform Res Appl. Author manuscript; available in PMC 2010 October 16.
NIH
-PA Author Manuscript
NIH
-PA Author Manuscript
NIH
-PA Author Manuscript
NIH
-PA Author Manuscript
NIH
-PA Author Manuscript
NIH
-PA Author Manuscript
Powers et al. Page 15
Tabl
e 1
Num
ber o
f Xl-P
SID
s with
enh
ance
d an
nota
tions
afte
r dat
a cu
ratio
ns w
ith se
quen
ce (A
) and
sem
antic
(B) b
ased
pro
cedu
res
Affy
met
rix
anno
tatio
ns
A. S
eque
nce
base
d cu
ratio
nB
. Sem
antic
bas
edcu
ratio
n:au
tom
ated
larg
esc
ale
1. M
anua
l2.
Aut
omat
ed la
rge
scal
e
Nin
e ca
tego
ries
of g
ene
title
s#
Affy
Xl-P
SID
sIo
n C
hann
el H
GN
Cs
H. s
apie
ns U
niPr
otID
sC
. ele
gans
Uni
Prot
IDs
M. m
uscu
lus U
niPr
otID
sD
. mel
anog
aste
r U
niPr
otID
sH
GN
Cs
X =
no
labe
l21
00
2514
2412
5
O =
oth
er45
6198
3872
2218
3814
2462
1332
C =
clo
ne/IM
AG
E35
24
130
4911
450
106
H =
hyp
othe
tical
pro
tein
3233
1416
4766
015
6365
212
86
M =
MG
CX
XX
X p
rote
in12
587
611
267
581
263
523
TL =
tran
scrib
ed lo
cus
3943
389
2178
1611
3
TLS
= tra
ns lo
cus s
trong
lysi
m. t
o63
24
295
125
269
125
198
TLM
= tr
ans l
ocus
mod
erat
ely
sim
. to
764
338
010
932
313
131
3
TLW
= tr
ans l
ocus
wea
kly
sim
. to
523
121
063
186
7215
5
Tota
l pro
be se
ts15
476
134
7259
3526
6952
3783
4031
Int J Bioinform Res Appl. Author manuscript; available in PMC 2010 October 16.

NIH
-PA Author Manuscript
NIH
-PA Author Manuscript
NIH
-PA Author Manuscript
Powers et al. Page 16
Tabl
e 2
Num
ber o
f Xl-P
SID
s with
enh
ance
d an
nota
tions
afte
r aut
omat
ed la
rge
scal
e da
ta c
urat
ion
proc
edur
es
Nin
e ca
tego
ries
of g
ene
title
s#
Affy
Xl-P
SID
sA
. Tot
al #
Xl-P
SID
s with
enh
ance
d an
nota
tions
B. #
Xl-P
SID
s with
1–6
ann
otat
ions
afte
r cu
ratio
n pr
oced
ures
1-A
ffy O
nly*
2 O
nly
3 O
nly
4 O
nly
5 O
nly
6 O
nly
X =
no
labe
l21
032
178
99
311
0
O =
oth
er45
6141
3143
028
683
683
516
3254
2
C =
clo
ne/IM
AG
E35
219
315
967
5524
3413
H =
hyp
othe
tical
pro
tein
3233
2406
827
784
557
491
429
145
M =
MG
CX
XX
X p
rote
in12
5892
932
932
318
219
816
363
TL =
tran
scrib
ed lo
cus
3943
210
3733
134
5611
72
TLS
= tra
ns lo
cus s
trong
ly si
m. t
o63
237
925
393
8584
8631
TLM
= tr
ans l
ocus
mod
erat
ely
sim
. to
764
520
244
156
139
110
7837
TLW
= tr
ans l
ocus
wea
kly
sim
. to
523
308
215
111
8455
4711
Tota
l pro
be se
ts15
476
9108
6368
1963
2003
1811
2487
844
* The
num
ber o
f Xl-P
SID
s tha
t wer
e no
t enh
ance
d by
the
cura
tion
proc
ess a
nd re
tain
ed o
nly
the
Affy
met
rix
gene
iden
tifie
rs a
re li
sted
und
er ‘1
-Aff
y on
ly’.
Int J Bioinform Res Appl. Author manuscript; available in PMC 2010 October 16.