Stochastic uncertainty analysis of damage evolution computed through microstructure–property...
8
Probabilistic Engineering Mechanics 25 (2010) 198–205 Contents lists available at ScienceDirect Probabilistic Engineering Mechanics journal homepage: www.elsevier.com/locate/probengmech Stochastic uncertainty analysis of damage evolution computed through microstructure–property relations Erdem Acar a,* , Kiran N. Solanki b , Masoud Rais-Rohani c , Mark F. Horstemeyer d a Department of Mechanical Engineering, TOBB University of Economics and Technology, Sogutozu, Ankara, 06560, Turkey b Center for Advanced Vehicular Systems, Mississippi State University, Mississippi State, MS 39762, United States c Department of Aerospace Engineering, Mississippi State University, Mississippi State, MS 39762, United States d Department of Mechanical Engineering, Mississippi State University, Mississippi State, MS 39762, United States article info Article history: Received 30 December 2008 Received in revised form 24 October 2009 Accepted 2 November 2009 Available online 10 November 2009 Keywords: Damage Dimension reduction Microstructure–property relations Multiscale model Uncertainty abstract Uncertainties in material microstructure features can lead to uncertainty in damage predictions based on multiscale microstructure–property models. This paper presents an analytical approach for stochastic uncertainty analysis by using a univariate dimension reduction technique. This approach is used to analyze the effects of uncertainties pertaining to the structure–property relations of an internal state variable plasticity–damage model that predicts failure. The results indicate that the higher the strain the greater the scatter in damage, even when the uncertainties in the material plasticity and microstructure parameters are kept constant. In addition, the mathematical sensitivity analysis results related to damage uncertainty are consistent with the physical nature of damage progression. At the beginning, the initial porosity and void nucleation are shown to drive the damage evolution. Then, void coalescence becomes the dominant mechanism. And finally, when approaching closer to failure, fracture toughness is found to dominate the damage evolution process. © 2009 Elsevier Ltd. All rights reserved. 1. Introduction Accurate predictions of damage progression and failure in duc- tile materials require the capturing of history effects and the mod- eling of correlations among the various physical scales present in the material, ranging from the atomic-level interactions and the microstructure features to the macroscale behavior at the contin- uum level. With the help of mathematical models that can capture the multiscale microstructure–property relations, it would be pos- sible to more accurately relate the structural responses, such as stress, strain, and damage, to key material parameters such as grain size, particle size, interfacial strength, and porosity. Previous works on multiscale microstructure–property model- ing includes those of Bammann et al. [1,2], Horstemeyer [3], Gana- pathysubramanian and Zabaras [4] and Shilkrot et al. [5]. For a survey of recent progress in multiscale microstructure–property relationship modeling and simulations, the reader is referred to [6]. Although microstructure–property relations enable the model- ing of history effects as well as the damage progression and failure, the presence of uncertainties in material microstructure features * Corresponding author. Tel.: +90 312 292 4257; fax: +90 312 292 4091. E-mail addresses: [email protected] (E. Acar), [email protected] (K.N. Solanki), [email protected] (M. Rais-Rohani), [email protected] (M.F. Horstemeyer). can lead to considerable variation in failure predictions. Recently, Horstemeyer et al. [7] and Solanki [8] used a first-order Taylor series (FOTS) uncertainty analysis to investigate the effects of stochastic uncertainties in the microstructure features and the boundary conditions that characterize the damage evolution in AA356-T6 cast aluminum alloy. In particular, void-nucleation, void-growth, and void-coalescence equations were evaluated and quantified in terms of the sensitivity and stochastic uncertainty of various parameters in the constitutive equations. However, the accuracy of the Taylor expansion method largely depends on the scale of uncertainty in the random parameters and the nonlinear- ity in the corresponding random response. This paper extends the work of Horstemeyer et al. [7] by per- forming a more accurate stochastic uncertainty analysis using the univariate dimension reduction (UDR) technique [9]. UDR is an additive decomposition technique that evaluates the multidimen- sional integral of a random function by solving a series of one- dimensional integrals. As such, UDR offers an efficient approach for the evaluation of statistical moments such as the mean, variance, skewness, and kurtosis of a random response. To fully character- ize the uncertainty in a random response such as damage, the es- timated moments can be used to find its probability distribution using a suitable probability distribution fitting technique. Commonly used distribution fitting techniques include the Pearson and Johnson families of distributions, saddlepoint approx- imations, and generalized lambda distributions. In this work, we 0266-8920/$ – see front matter © 2009 Elsevier Ltd. All rights reserved. doi:10.1016/j.probengmech.2009.11.001
-
Upload
independent -
Category
Documents
-
view
0 -
download
0
Transcript of Stochastic uncertainty analysis of damage evolution computed through microstructure–property...
Probabilistic Engineering Mechanics 25 (2010) 198–205
Contents lists available at ScienceDirect
Probabilistic Engineering Mechanics
journal homepage: www.elsevier.com/locate/probengmech
Stochastic uncertainty analysis of damage evolution computed throughmicrostructure–property relationsErdem Acar a,∗, Kiran N. Solanki b, Masoud Rais-Rohani c, Mark F. Horstemeyer da Department of Mechanical Engineering, TOBB University of Economics and Technology, Sogutozu, Ankara, 06560, Turkeyb Center for Advanced Vehicular Systems, Mississippi State University, Mississippi State, MS 39762, United Statesc Department of Aerospace Engineering, Mississippi State University, Mississippi State, MS 39762, United Statesd Department of Mechanical Engineering, Mississippi State University, Mississippi State, MS 39762, United States
a r t i c l e i n f o
Article history:Received 30 December 2008Received in revised form24 October 2009Accepted 2 November 2009Available online 10 November 2009
Keywords:DamageDimension reductionMicrostructure–property relationsMultiscale modelUncertainty
a b s t r a c t
Uncertainties in material microstructure features can lead to uncertainty in damage predictions based onmultiscale microstructure–property models. This paper presents an analytical approach for stochasticuncertainty analysis by using a univariate dimension reduction technique. This approach is used toanalyze the effects of uncertainties pertaining to the structure–property relations of an internal statevariable plasticity–damage model that predicts failure. The results indicate that the higher the strain thegreater the scatter in damage, even when the uncertainties in the material plasticity and microstructureparameters are kept constant. In addition, themathematical sensitivity analysis results related to damageuncertainty are consistent with the physical nature of damage progression. At the beginning, the initialporosity and void nucleation are shown to drive the damage evolution. Then, void coalescence becomesthe dominant mechanism. And finally, when approaching closer to failure, fracture toughness is found todominate the damage evolution process.
© 2009 Elsevier Ltd. All rights reserved.
1. Introduction
Accurate predictions of damage progression and failure in duc-tile materials require the capturing of history effects and the mod-eling of correlations among the various physical scales present inthe material, ranging from the atomic-level interactions and themicrostructure features to the macroscale behavior at the contin-uum level. With the help of mathematical models that can capturethemultiscale microstructure–property relations, it would be pos-sible to more accurately relate the structural responses, such asstress, strain, and damage, to keymaterial parameters such as grainsize, particle size, interfacial strength, and porosity.Previous works on multiscale microstructure–property model-
ing includes those of Bammann et al. [1,2], Horstemeyer [3], Gana-pathysubramanian and Zabaras [4] and Shilkrot et al. [5]. For asurvey of recent progress in multiscale microstructure–propertyrelationshipmodeling and simulations, the reader is referred to [6].Although microstructure–property relations enable the model-
ing of history effects as well as the damage progression and failure,the presence of uncertainties in material microstructure features
∗ Corresponding author. Tel.: +90 312 292 4257; fax: +90 312 292 4091.E-mail addresses: [email protected] (E. Acar), [email protected]
(K.N. Solanki), [email protected] (M. Rais-Rohani),[email protected] (M.F. Horstemeyer).
0266-8920/$ – see front matter© 2009 Elsevier Ltd. All rights reserved.doi:10.1016/j.probengmech.2009.11.001
can lead to considerable variation in failure predictions. Recently,Horstemeyer et al. [7] and Solanki [8] used a first-order Taylorseries (FOTS) uncertainty analysis to investigate the effects ofstochastic uncertainties in the microstructure features and theboundary conditions that characterize the damage evolution inAA356-T6 cast aluminum alloy. In particular, void-nucleation,void-growth, and void-coalescence equations were evaluated andquantified in terms of the sensitivity and stochastic uncertaintyof various parameters in the constitutive equations. However, theaccuracy of the Taylor expansion method largely depends on thescale of uncertainty in the random parameters and the nonlinear-ity in the corresponding random response.This paper extends the work of Horstemeyer et al. [7] by per-
forming a more accurate stochastic uncertainty analysis using theunivariate dimension reduction (UDR) technique [9]. UDR is anadditive decomposition technique that evaluates the multidimen-sional integral of a random function by solving a series of one-dimensional integrals. As such, UDR offers an efficient approach forthe evaluation of statistical moments such as the mean, variance,skewness, and kurtosis of a random response. To fully character-ize the uncertainty in a random response such as damage, the es-timated moments can be used to find its probability distributionusing a suitable probability distribution fitting technique.Commonly used distribution fitting techniques include the
Pearson and Johnson families of distributions, saddlepoint approx-imations, and generalized lambda distributions. In this work, we
E. Acar et al. / Probabilistic Engineering Mechanics 25 (2010) 198–205 199
use the extended generalized lambda distribution (EGLD), whichcombines the generalized lambda distribution (GLD) with the gen-eralized beta distribution (GBD). The efficiency and accuracy of dis-tribution fitting via the GLD and the GBD can be found in [10–13].After the first four statistical moments of damage are calculated,the parameters of the EGLD are estimated by minimizing the dif-ferences between the moments of the EGLD and those obtainedthrough UDR.The overall procedure of UDR+EGLD uncertainty analysis is as
follows. First, damage calculations are performed at some selectedpoints in the random variable space. Next, the first four statisticalmoments of damage are estimated using UDR. Then, the probabil-ity distribution of damage is approximated with the EGLD. The ac-curacy of this analysis depends on the accuracies of the estimatedmoments and distribution fitting. Acar et al. [14] have also success-fully used the UDR+EGLD approach in the field of structural relia-bility.The main focus of this paper is to analyze the effects of stochas-
tic uncertainties in microstructure features of the material on theuncertainty in damage, which is calculated using the microstruc-ture–property relations in a finite element analysis (FEA) of the se-lected component. Moreover, we aim to quantify the influence ofuncertainty of the individual parameters in the constitutive equa-tions on the uncertainty in damage. In metallurgical studies, it isdifficult to independently quantify the effects of microstructuralparameters when complex interactions are inherent. The quanti-tative predictions of the numerical study are presented in light ofmetallurgical findings to assure that the numerical results provideinsights that are consistent with physical observations.This paper is organized as follows. A brief description of themi-
crostructure–property relationshipmodel of Horstemeyer et al. [3]is given in the next section. Section 3 discusses material mi-crostructure characterizations and their uncertainties. Section 4presents the calculation of statistical moments of damage usingunivariate dimension reduction. Section 5 gives a brief descriptionof probability distribution fitting by using the extended general-ized lambda distribution. Section 6 presents the results of the un-certainty analysis for damage,where sensitivities of various factorsare also compared. Finally, concluding remarks appear in Section 7.
2. Microstructure–property relationships
An effectivemethod to capture themicrostructure–property re-lationships is by use of internal state variable (ISV) evolution equa-tions,which are formulated at themacroscale level. The ISVs reflectlower length scale microstructural rearrangements so that historyeffects can be modeled. With the help of such a material model, itwould be possible to relate structural responses of interest, suchas stress, strain, and toughness, to keymaterial parameters such asparticle size, interfacial strength, and spacing at the lower lengthscale.The microstructure–property relationship modeling frame-
work used here is that developed by Bammann et al. [1,2] and ex-tended by Horstemeyer [3] to account for stress-state-dependentdamage evolution. The pertinent equations in this model are de-noted by the rate of change of the observable and the internalstate variables. For the sake of clarity and completeness, a listingof these equations and their relation to the material microstruc-ture is briefly given here with additional details provided in [3].The first equation is the modified Hooke’s law that includes
damage, and is given as
◦
σ = λ′(1− φ)tr(De)I + 2µ′(1− φ)De −φ
1− φσ (1)
whereµ′ andλ′ are the temperature dependent shearmodulus andthe Lamé constant given as follows:
µ′ = µ
[1−
TTmelt
exp(aa(1−
TTmelt
))],
λ′ = K − bbTTmelt−23µ′ (1a)
where aa is the shear modulus temperature dependent coefficient,bb is the Lamé constant temperature dependent coefficient, Tmeltis the melting temperature in Kelvin, T is the current temperaturein Kelvin, µ and K are shear and bulk moduli of base material,σ and
◦
σ are the Cauchy stress and the co-rotational rate of theCauchy stress, respectively, φ is an ISV that represents the damagefraction or state of material within a continuum element in thecontext of FEA with φ representing its material time derivative,De is the elastic deformation tensor, and I is the second-orderidentity tensor. The underscore symbol indicates a second-ranktensor. Recognizing that De = D − Dp, the ISV representing theplastic deformation tensor or inelastic flow rule, Dp, is given by therelationship
Dp = f (T ) sinh[‖σ ′ − α‖ − {R+ Y (T )}(1− φ)
V (T )(1− φ)
]σ ′ − α
‖σ ′ − α‖(2)
whereσ ′ is the deviatoric part of stress tensor, T is the temperaturein Kelvin, α is the kinematic hardening (an ISV reflecting theeffect of geometrically necessary dislocation) and R is the isotropichardening (an ISV reflecting the effect of statistically storeddislocation density). The function V (T ) determines the magnitudeof rate-dependence on yielding, Y (T ) is the rate-independent yieldstress, and f (T ) determines when the rate-dependence affectsinitial yielding. The functions f (T ), V (T ), and Y (T ), which arerelated to yielding with Arrhenius-type temperature dependence,are given as
V (T ) = C1e(−C2/T ) (3a)
Y (T ) = C3e(−C4/T ) (3b)
f (T ) = C5e(−C6/T ) (3c)
where C1 through C6 are the yield-stress-related material pa-rameters obtained through different monotonic stress-state tests(tension, compression, and torsion) at different temperatures andstrain rates. The evaluation of Dp in Eq. (2) also requires the co-rotational rate of the kinematic hardening,
◦
α, and the materialtime derivative of isotropic hardening, R, expressed in a hardening-recovery format as
◦
α =
{h(T )DP −
[√23rd(T )‖DP‖ + rs(T )
]‖α‖α
}[DCS0DCS
]z(4)
R =
{H(T )DP −
[√23Rd(T )‖DP‖ + Rs(T )
]R2}[DCS0DCS
]z(5)
where DCS0, DCS and z capture the microstructure effect of grainsize. In Eqs. (4) and (5), rd(T ) and Rd(T ) are scalar functions that de-scribe dynamic recovery whereas rs(T ) and Rs(T ) are scalar func-tions that describe thermal (static) recovery with h(T ) and H(T )representing the anisotropic and isotropic hardening modulus,respectively. Hence, the twomain types of recovery that are exhib-ited by populations of dislocations within crystallographic materi-als are captured in the ISVs. The temperature-dependent functionsin Eqs. (4) and (5) are found as
rs(T ) = C11e(−C12/T ) (6)
200 E. Acar et al. / Probabilistic Engineering Mechanics 25 (2010) 198–205
Rs(T ) = C17e(−C18/T ) (7)
rd(T ) = C7
[1+ Ca
(427−J ′23J ′32
)− Cb
(J ′3J ′2
)3/2]e(−C8/T ) (8)
Rd(T ) = C13
[1+ Ca
(427−J ′23J ′32
)− Cb
(J ′3J ′2
)3/2]e(−C14/T ) (9)
h(T ) = C9
[1+ Ca
(427−J ′23J ′32
)+ Cb
(J ′3J ′2
)3/2]× e(−C8/T ) − C10T (10)
H(T ) = C15
[1+ Ca
(427−J ′23J ′32
)+ Cb
(J ′3J ′2
)3/2]× e(−C8/T ) − C16T (11)
where J ′2 =12
(σ ′ − α
)2, J ′3 =
13
(σ ′ − α
)3, C7 through C12 are thematerial plasticity parameters related to kinematic hardening andrecovery terms, C13 through C18 are thematerial plasticity parame-ters related to isotropic hardening and recovery terms, and Ca andCb are thematerial plasticity parameters related to dynamic recov-ery and anisotropic hardening terms. Constants C1 through C18 arefound from tension, compression and shear tests at different tem-peratures and strain rates.The mechanical properties of a material depend upon the mi-
crodefects within its structure that can change as a result of defor-mation. When the number of microdefects accumulates, damageis said to have grown. The three components of damage progres-sionmechanism are void nucleation, growth and coalescence fromsecond-phase particles and pores. In this regard, the material timederivative of damage, φ, is expressed as
φ =(φparticles + φpores
)C +
(φparticles + φpores
)C (12)
where φpores is the cast pore growth (void-growth), φparticle is thevoid-growth due to particle debonding and fracturewith φpores andφparticle as their respective time derivatives. The parameter C is thevoid-coalescences with C as its time derivative. The particle- andpore-based void-growth rate and the void-coalescence rate equa-tions are given as
φparticles = ηv + ηv (13)
η =∥∥Dp∥∥ Ccoeffd1/2
KIC f 1/3
× η
[a(427−J23J32
)+ b
J3J3/22+ c
∥∥∥∥ I1√J2∥∥∥∥]e(−CηT /T) (14)
v =
√3R0
2(1−m)
[sinh
(√3(1−m)
√2I13√J2
)]‖DP‖ (15)
φpores =
[1(
1− φpores)m − (1− φpores)
]
× sinh
{2(2V (T )/Y (T )−1
)(2V (T )/Y (T )+1
) σH
σvm
}∥∥Dp∥∥ (16)
C = [Cd1 + Cd2 (ηv + ηv)] e(CCT T ) (DCS0/DCS)z (17)
where v is the void-growth, η is the void-nucleation, d is theparticle size, f is the particle volume fraction, KIC is the fracturetoughness, σH and σvm are the hydrostatic and von Mises stresses,J1, J2, J3 and I1 are stress invariants, Ccoeff is the void-nucleation co-efficient parameter, CCT and CηT are the void-coalescence and thevoid-nucleation temperature-dependent parameters, Cd1 and Cd2
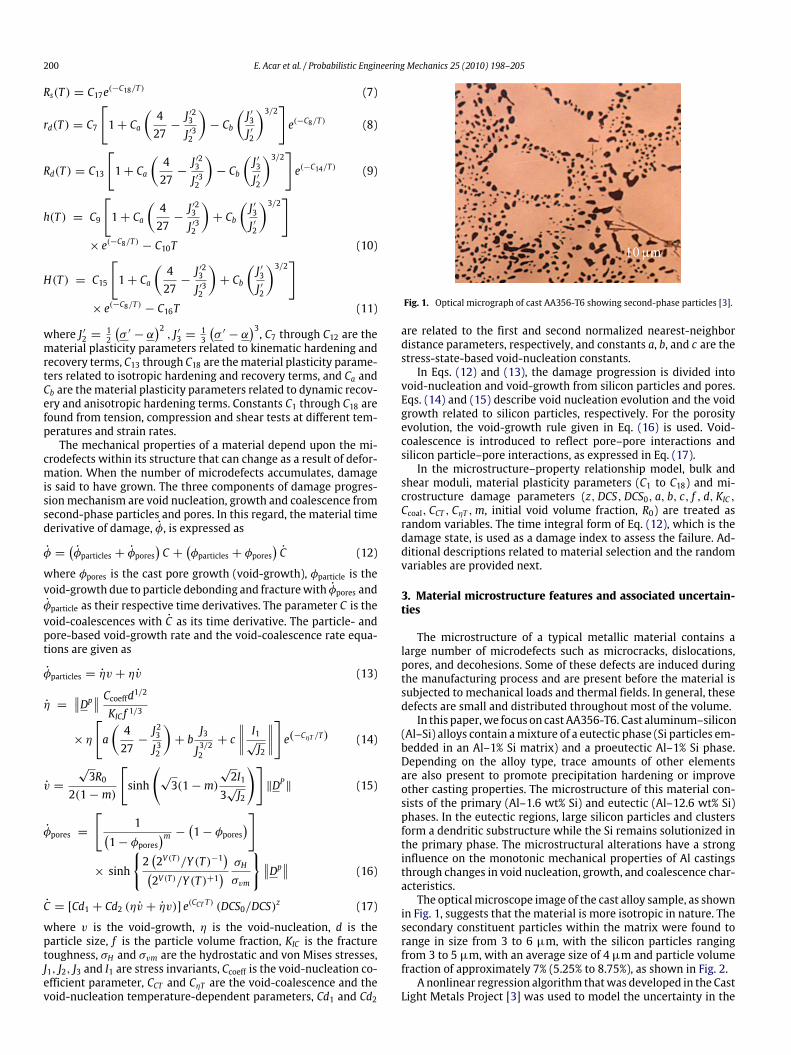
Fig. 1. Optical micrograph of cast AA356-T6 showing second-phase particles [3].
are related to the first and second normalized nearest-neighbordistance parameters, respectively, and constants a, b, and c are thestress-state-based void-nucleation constants.In Eqs. (12) and (13), the damage progression is divided into
void-nucleation and void-growth from silicon particles and pores.Eqs. (14) and (15) describe void nucleation evolution and the voidgrowth related to silicon particles, respectively. For the porosityevolution, the void-growth rule given in Eq. (16) is used. Void-coalescence is introduced to reflect pore–pore interactions andsilicon particle–pore interactions, as expressed in Eq. (17).In the microstructure–property relationship model, bulk and
shear moduli, material plasticity parameters (C1 to C18) and mi-crostructure damage parameters (z,DCS,DCS0, a, b, c, f , d, KIC ,Ccoal, CCT , CηT ,m, initial void volume fraction, R0) are treated asrandom variables. The time integral form of Eq. (12), which is thedamage state, is used as a damage index to assess the failure. Ad-ditional descriptions related to material selection and the randomvariables are provided next.
3. Material microstructure features and associated uncertain-ties
The microstructure of a typical metallic material contains alarge number of microdefects such as microcracks, dislocations,pores, and decohesions. Some of these defects are induced duringthe manufacturing process and are present before the material issubjected to mechanical loads and thermal fields. In general, thesedefects are small and distributed throughout most of the volume.In this paper,we focus on cast AA356-T6. Cast aluminum–silicon
(Al–Si) alloys contain amixture of a eutectic phase (Si particles em-bedded in an Al–1% Si matrix) and a proeutectic Al–1% Si phase.Depending on the alloy type, trace amounts of other elementsare also present to promote precipitation hardening or improveother casting properties. The microstructure of this material con-sists of the primary (Al–1.6 wt% Si) and eutectic (Al–12.6 wt% Si)phases. In the eutectic regions, large silicon particles and clustersform a dendritic substructure while the Si remains solutionized inthe primary phase. The microstructural alterations have a stronginfluence on the monotonic mechanical properties of Al castingsthrough changes in void nucleation, growth, and coalescence char-acteristics.The opticalmicroscope image of the cast alloy sample, as shown
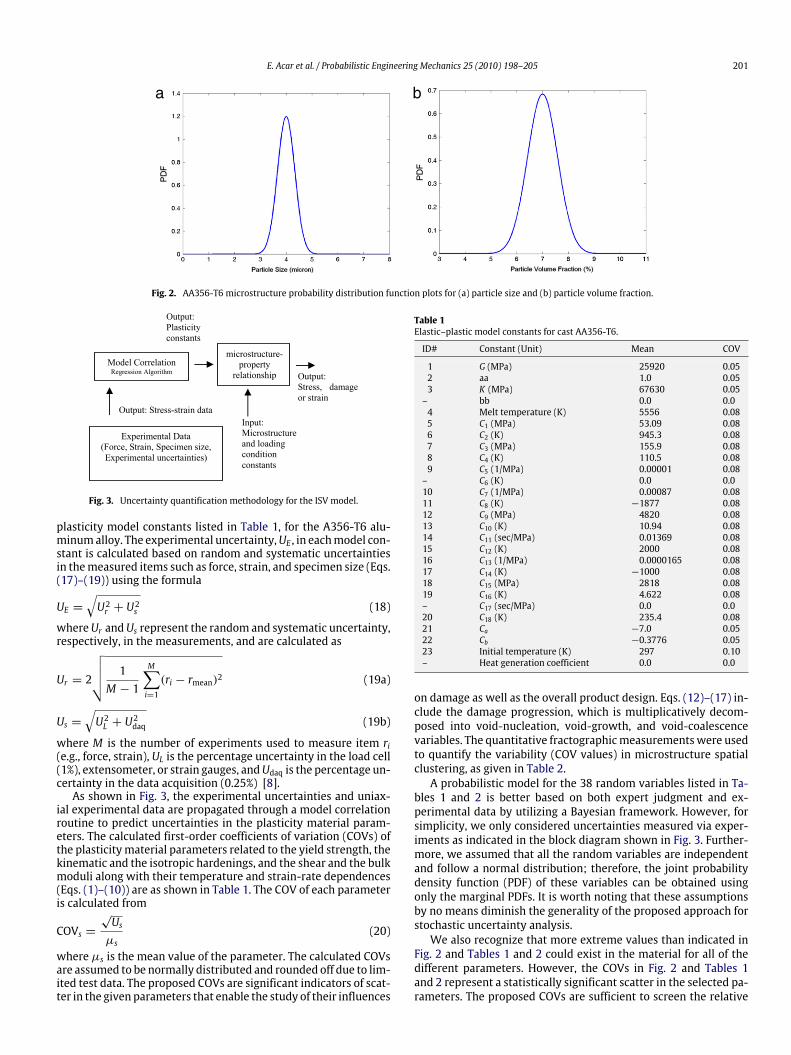
in Fig. 1, suggests that the material is more isotropic in nature. Thesecondary constituent particles within the matrix were found torange in size from 3 to 6 µm, with the silicon particles rangingfrom 3 to 5 µm, with an average size of 4 µm and particle volumefraction of approximately 7% (5.25% to 8.75%), as shown in Fig. 2.A nonlinear regression algorithm thatwas developed in the Cast
Light Metals Project [3] was used to model the uncertainty in the
E. Acar et al. / Probabilistic Engineering Mechanics 25 (2010) 198–205 201
a b
Fig. 2. AA356-T6 microstructure probability distribution function plots for (a) particle size and (b) particle volume fraction.
Fig. 3. Uncertainty quantification methodology for the ISV model.
plasticity model constants listed in Table 1, for the A356-T6 alu-minumalloy. The experimental uncertainty,UE , in eachmodel con-stant is calculated based on random and systematic uncertaintiesin themeasured items such as force, strain, and specimen size (Eqs.(17)–(19)) using the formula
UE =√U2r + U2s (18)
whereUr andUs represent the random and systematic uncertainty,respectively, in the measurements, and are calculated as
Ur = 2
√√√√ 1M − 1
M∑i=1
(ri − rmean)2 (19a)
Us =√U2L + U
2daq (19b)
where M is the number of experiments used to measure item ri(e.g., force, strain), UL is the percentage uncertainty in the load cell(1%), extensometer, or strain gauges, andUdaq is the percentage un-certainty in the data acquisition (0.25%) [8].As shown in Fig. 3, the experimental uncertainties and uniax-
ial experimental data are propagated through a model correlationroutine to predict uncertainties in the plasticity material param-eters. The calculated first-order coefficients of variation (COVs) ofthe plasticitymaterial parameters related to the yield strength, thekinematic and the isotropic hardenings, and the shear and the bulkmoduli along with their temperature and strain-rate dependences(Eqs. (1)–(10)) are as shown in Table 1. The COV of each parameteris calculated from
COVs =√Usµs
(20)
where µs is the mean value of the parameter. The calculated COVsare assumed to be normally distributed and rounded off due to lim-ited test data. The proposed COVs are significant indicators of scat-ter in the given parameters that enable the study of their influences
Table 1Elastic–plastic model constants for cast AA356-T6.
ID# Constant (Unit) Mean COV
1 G (MPa) 25920 0.052 aa 1.0 0.053 K (MPa) 67630 0.05– bb 0.0 0.04 Melt temperature (K) 5556 0.085 C1 (MPa) 53.09 0.086 C2 (K) 945.3 0.087 C3 (MPa) 155.9 0.088 C4 (K) 110.5 0.089 C5 (1/MPa) 0.00001 0.08– C6 (K) 0.0 0.010 C7 (1/MPa) 0.00087 0.0811 C8 (K) −1877 0.0812 C9 (MPa) 4820 0.0813 C10 (K) 10.94 0.0814 C11 (sec/MPa) 0.01369 0.0815 C12 (K) 2000 0.0816 C13 (1/MPa) 0.0000165 0.0817 C14 (K) −1000 0.0818 C15 (MPa) 2818 0.0819 C16 (K) 4.622 0.08– C17 (sec/MPa) 0.0 0.020 C18 (K) 235.4 0.0821 Ca −7.0 0.0522 Cb −0.3776 0.0523 Initial temperature (K) 297 0.10– Heat generation coefficient 0.0 0.0
on damage as well as the overall product design. Eqs. (12)–(17) in-clude the damage progression, which is multiplicatively decom-posed into void-nucleation, void-growth, and void-coalescencevariables. The quantitative fractographicmeasurementswere usedto quantify the variability (COV values) in microstructure spatialclustering, as given in Table 2.A probabilistic model for the 38 random variables listed in Ta-
bles 1 and 2 is better based on both expert judgment and ex-perimental data by utilizing a Bayesian framework. However, forsimplicity, we only considered uncertainties measured via exper-iments as indicated in the block diagram shown in Fig. 3. Further-more, we assumed that all the random variables are independentand follow a normal distribution; therefore, the joint probabilitydensity function (PDF) of these variables can be obtained usingonly the marginal PDFs. It is worth noting that these assumptionsby no means diminish the generality of the proposed approach forstochastic uncertainty analysis.We also recognize that more extreme values than indicated in
Fig. 2 and Tables 1 and 2 could exist in the material for all of thedifferent parameters. However, the COVs in Fig. 2 and Tables 1and 2 represent a statistically significant scatter in the selected pa-rameters. The proposed COVs are sufficient to screen the relative
202 E. Acar et al. / Probabilistic Engineering Mechanics 25 (2010) 198–205
Table 2Damage model constants for cast AA356-T6.
ID # Constant (Unit) Mean COV
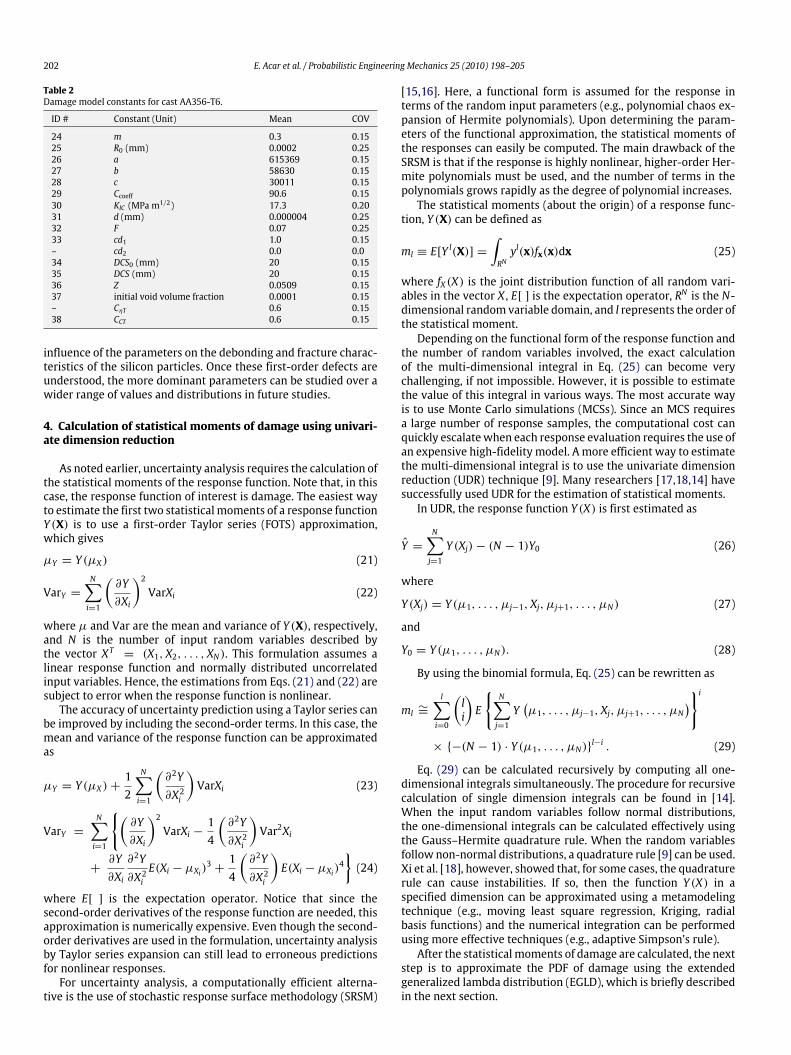
24 m 0.3 0.1525 R0 (mm) 0.0002 0.2526 a 615369 0.1527 b 58630 0.1528 c 30011 0.1529 Ccoeff 90.6 0.1530 KIC (MPa m1/2) 17.3 0.2031 d (mm) 0.000004 0.2532 F 0.07 0.2533 cd1 1.0 0.15– cd2 0.0 0.034 DCS0 (mm) 20 0.1535 DCS (mm) 20 0.1536 Z 0.0509 0.1537 initial void volume fraction 0.0001 0.15– CηT 0.6 0.1538 CCT 0.6 0.15
influence of the parameters on the debonding and fracture charac-teristics of the silicon particles. Once these first-order defects areunderstood, the more dominant parameters can be studied over awider range of values and distributions in future studies.
4. Calculation of statistical moments of damage using univari-ate dimension reduction
As noted earlier, uncertainty analysis requires the calculation ofthe statistical moments of the response function. Note that, in thiscase, the response function of interest is damage. The easiest wayto estimate the first two statistical moments of a response functionY (X) is to use a first-order Taylor series (FOTS) approximation,which gives
µY = Y (µX ) (21)
VarY =N∑i=1
(∂Y∂Xi
)2VarXi (22)
where µ and Var are the mean and variance of Y (X), respectively,and N is the number of input random variables described bythe vector XT = (X1, X2, . . . , XN). This formulation assumes alinear response function and normally distributed uncorrelatedinput variables. Hence, the estimations from Eqs. (21) and (22) aresubject to error when the response function is nonlinear.The accuracy of uncertainty prediction using a Taylor series can
be improved by including the second-order terms. In this case, themean and variance of the response function can be approximatedas
µY = Y (µX )+12
N∑i=1
(∂2Y∂X2i
)VarXi (23)
VarY =N∑i=1
{(∂Y∂Xi
)2VarXi −
14
(∂2Y∂X2i
)Var2Xi
+∂Y∂Xi
∂2Y∂X2iE(Xi − µXi)
3+14
(∂2Y∂X2i
)E(Xi − µXi)
4}(24)
where E[ ] is the expectation operator. Notice that since thesecond-order derivatives of the response function are needed, thisapproximation is numerically expensive. Even though the second-order derivatives are used in the formulation, uncertainty analysisby Taylor series expansion can still lead to erroneous predictionsfor nonlinear responses.For uncertainty analysis, a computationally efficient alterna-
tive is the use of stochastic response surface methodology (SRSM)
[15,16]. Here, a functional form is assumed for the response interms of the random input parameters (e.g., polynomial chaos ex-pansion of Hermite polynomials). Upon determining the param-eters of the functional approximation, the statistical moments ofthe responses can easily be computed. The main drawback of theSRSM is that if the response is highly nonlinear, higher-order Her-mite polynomials must be used, and the number of terms in thepolynomials grows rapidly as the degree of polynomial increases.The statistical moments (about the origin) of a response func-
tion, Y (X) can be defined as
ml ≡ E[Y l(X)] =∫RNyl(x)fx(x)dx (25)
where fX (X) is the joint distribution function of all random vari-ables in the vector X , E[ ] is the expectation operator, RN is the N-dimensional random variable domain, and l represents the order ofthe statistical moment.Depending on the functional form of the response function and
the number of random variables involved, the exact calculationof the multi-dimensional integral in Eq. (25) can become verychallenging, if not impossible. However, it is possible to estimatethe value of this integral in various ways. The most accurate wayis to use Monte Carlo simulations (MCSs). Since an MCS requiresa large number of response samples, the computational cost canquickly escalatewhen each response evaluation requires the use ofan expensive high-fidelity model. A more efficient way to estimatethe multi-dimensional integral is to use the univariate dimensionreduction (UDR) technique [9]. Many researchers [17,18,14] havesuccessfully used UDR for the estimation of statistical moments.In UDR, the response function Y (X) is first estimated as
Y =N∑j=1
Y (Xj)− (N − 1)Y0 (26)
where
Y (Xj) = Y (µ1, . . . , µj−1, Xj, µj+1, . . . , µN) (27)
and
Y0 = Y (µ1, . . . , µN). (28)
By using the binomial formula, Eq. (25) can be rewritten as
ml ∼=l∑i=0
(li
)E
{N∑j=1
Y(µ1, . . . , µj−1, Xj, µj+1, . . . , µN
)}i× {−(N − 1) · Y (µ1, . . . , µN)}l−i . (29)
Eq. (29) can be calculated recursively by computing all one-dimensional integrals simultaneously. The procedure for recursivecalculation of single dimension integrals can be found in [14].When the input random variables follow normal distributions,the one-dimensional integrals can be calculated effectively usingthe Gauss–Hermite quadrature rule. When the random variablesfollow non-normal distributions, a quadrature rule [9] can be used.Xi et al. [18], however, showed that, for some cases, the quadraturerule can cause instabilities. If so, then the function Y (X) in aspecified dimension can be approximated using a metamodelingtechnique (e.g., moving least square regression, Kriging, radialbasis functions) and the numerical integration can be performedusing more effective techniques (e.g., adaptive Simpson’s rule).After the statistical moments of damage are calculated, the next
step is to approximate the PDF of damage using the extendedgeneralized lambda distribution (EGLD), which is briefly describedin the next section.
E. Acar et al. / Probabilistic Engineering Mechanics 25 (2010) 198–205 203
Fig. 4. Damage–strain for cast AA356-T6.
5. Estimating the probability distribution of damage using theEGLD
Approximating the distribution of a random variable using afew of its statistical moments has been of interest to many re-searchers. Usually, the first fourmoments are used for this purpose.Popular distribution fitting techniques include the Johnson dis-tribution, Pearson distribution, saddlepoint approximations, andgeneralized lambda distributions. The main disadvantage of theJohnson distribution is that it is not very easy to determine the fourparameters from themoments of the sample data. Themajor draw-back of the Pearson family of distributions can lead to unstableresults near the boundaries of families in the skewness–kurtosisplane [18], and for the saddlepoint approximation, themain short-coming is that singularities can arise during the numerical proce-dure [17].Another powerful tool to estimate distribution of random vari-
ables is the generalized lambda distribution (GLD), which is veryflexible and can fit a wide variety of distributions [20,21]. How-ever, [10] and [11] showed that the GLDmay fail to provide a validdistribution in some regions of the moment space. They proposed
using the EGLD, which is the extended version of the GLD, wherethe GBD is used when the accuracy of the GLD is not satisfactory.Motivated by their successful application of the EGLD in distribu-tion fitting as well as the previous experience [14], we decided touse the EGLD for distribution fitting. The probability distributionfitting (that is, the estimation of the distribution parameters) isperformed by matching the first four moments of the EGLD withthe first four moments of the response function obtained throughunivariate dimension reduction. Sincewe useUDR formoment cal-culation and the EGLD in distribution fitting, we refer to this ap-proach as UDR+EGLD [14].
6. Uncertainty analysis of damage evolution
6.1. Uncertainty characterization of damage at different strain values
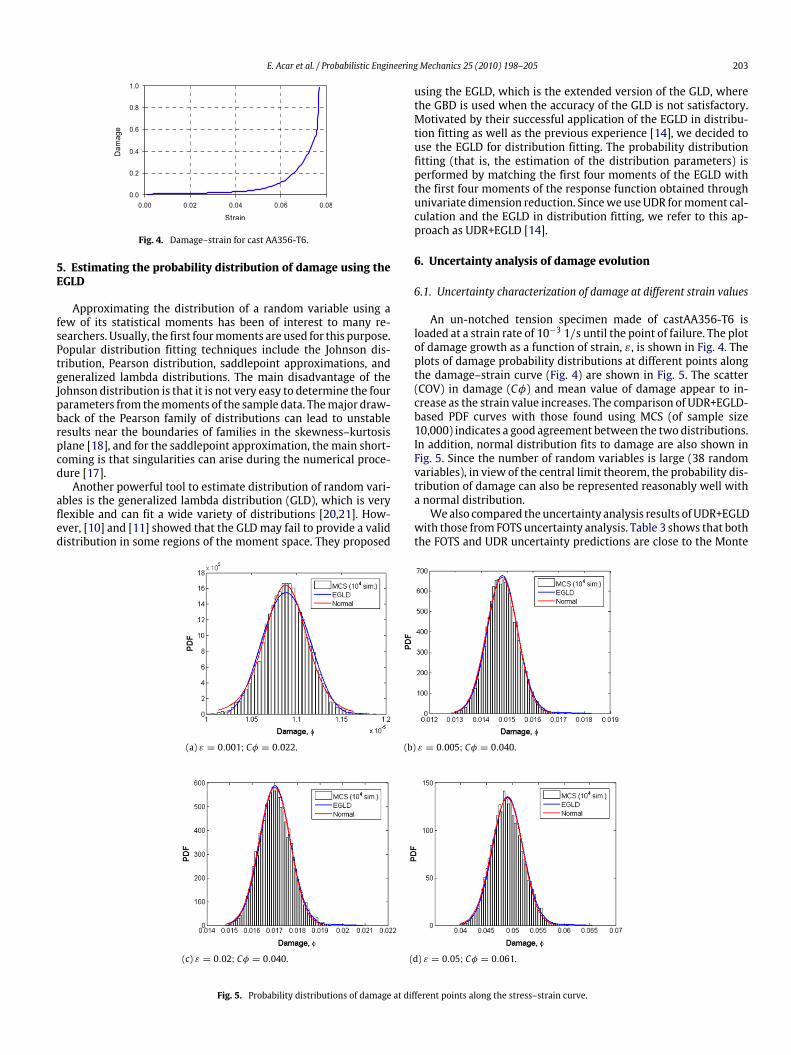
An un-notched tension specimen made of castAA356-T6 isloaded at a strain rate of 10−3 1/s until the point of failure. The plotof damage growth as a function of strain, ε, is shown in Fig. 4. Theplots of damage probability distributions at different points alongthe damage–strain curve (Fig. 4) are shown in Fig. 5. The scatter(COV) in damage (Cφ) and mean value of damage appear to in-crease as the strain value increases. The comparison of UDR+EGLD-based PDF curves with those found using MCS (of sample size10,000) indicates a good agreement between the two distributions.In addition, normal distribution fits to damage are also shown inFig. 5. Since the number of random variables is large (38 randomvariables), in view of the central limit theorem, the probability dis-tribution of damage can also be represented reasonably well witha normal distribution.Wealso compared theuncertainty analysis results ofUDR+EGLD
with those from FOTS uncertainty analysis. Table 3 shows that boththe FOTS and UDR uncertainty predictions are close to the Monte
(a) ε = 0.001; Cφ = 0.022. (b) ε = 0.005; Cφ = 0.040.
(c) ε = 0.02; Cφ = 0.040. (d) ε = 0.05; Cφ = 0.061.
Fig. 5. Probability distributions of damage at different points along the stress–strain curve.
204 E. Acar et al. / Probabilistic Engineering Mechanics 25 (2010) 198–205
(a) (a) ε = 0.001. (b) (b) ε = 0.005.
(c) (c) ε = 0.01. (d) (d) ε = 0.05.
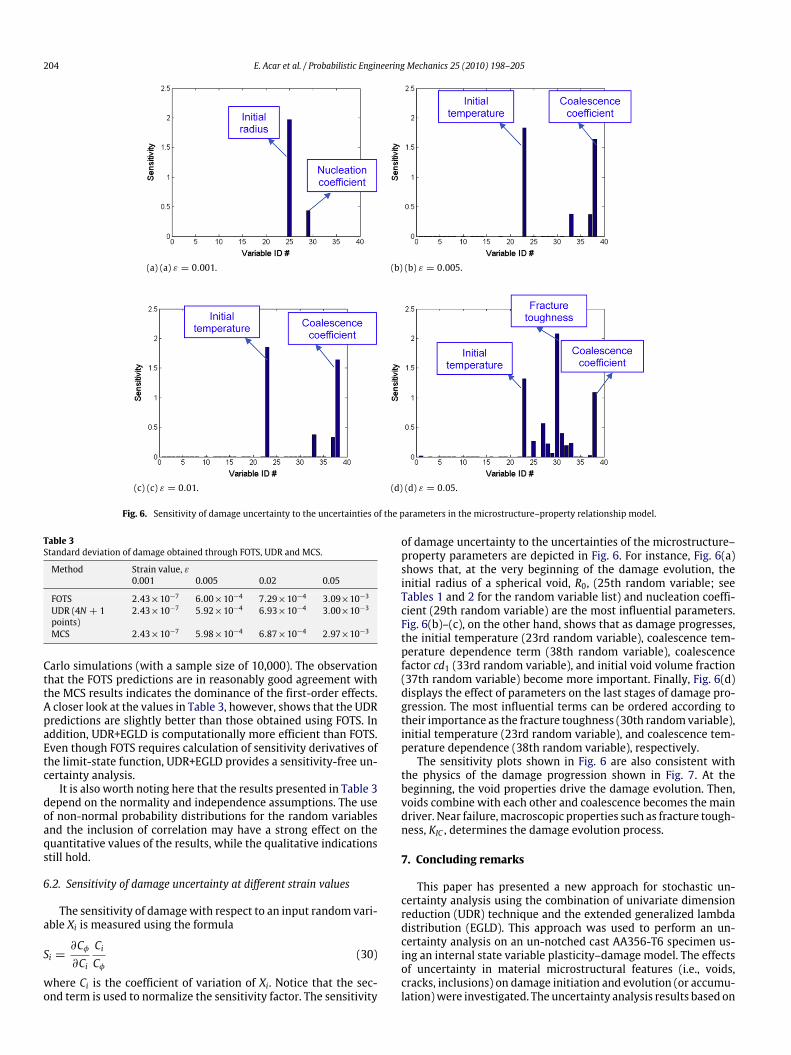
Fig. 6. Sensitivity of damage uncertainty to the uncertainties of the parameters in the microstructure–property relationship model.
Table 3Standard deviation of damage obtained through FOTS, UDR and MCS.
Method Strain value, ε0.001 0.005 0.02 0.05
FOTS 2.43×10⁻⁷ 6.00×10⁻⁴ 7.29×10⁻⁴ 3.09×10⁻³
UDR (4N + 1points)
2.43×10⁻⁷ 5.92×10⁻⁴ 6.93×10⁻⁴ 3.00×10⁻³
MCS 2.43×10⁻⁷ 5.98×10⁻⁴ 6.87×10⁻⁴ 2.97×10⁻³
Carlo simulations (with a sample size of 10,000). The observationthat the FOTS predictions are in reasonably good agreement withthe MCS results indicates the dominance of the first-order effects.A closer look at the values in Table 3, however, shows that the UDRpredictions are slightly better than those obtained using FOTS. Inaddition, UDR+EGLD is computationally more efficient than FOTS.Even though FOTS requires calculation of sensitivity derivatives ofthe limit-state function, UDR+EGLD provides a sensitivity-free un-certainty analysis.It is also worth noting here that the results presented in Table 3
depend on the normality and independence assumptions. The useof non-normal probability distributions for the random variablesand the inclusion of correlation may have a strong effect on thequantitative values of the results, while the qualitative indicationsstill hold.
6.2. Sensitivity of damage uncertainty at different strain values
The sensitivity of damagewith respect to an input random vari-able Xi is measured using the formula
Si =∂Cφ∂Ci
CiCφ
(30)
where Ci is the coefficient of variation of Xi. Notice that the sec-ond term is used to normalize the sensitivity factor. The sensitivity
of damage uncertainty to the uncertainties of the microstructure–property parameters are depicted in Fig. 6. For instance, Fig. 6(a)shows that, at the very beginning of the damage evolution, theinitial radius of a spherical void, R0, (25th random variable; seeTables 1 and 2 for the random variable list) and nucleation coeffi-cient (29th random variable) are the most influential parameters.Fig. 6(b)–(c), on the other hand, shows that as damage progresses,the initial temperature (23rd random variable), coalescence tem-perature dependence term (38th random variable), coalescencefactor cd1 (33rd random variable), and initial void volume fraction(37th random variable) become more important. Finally, Fig. 6(d)displays the effect of parameters on the last stages of damage pro-gression. The most influential terms can be ordered according totheir importance as the fracture toughness (30th randomvariable),initial temperature (23rd random variable), and coalescence tem-perature dependence (38th random variable), respectively.The sensitivity plots shown in Fig. 6 are also consistent with
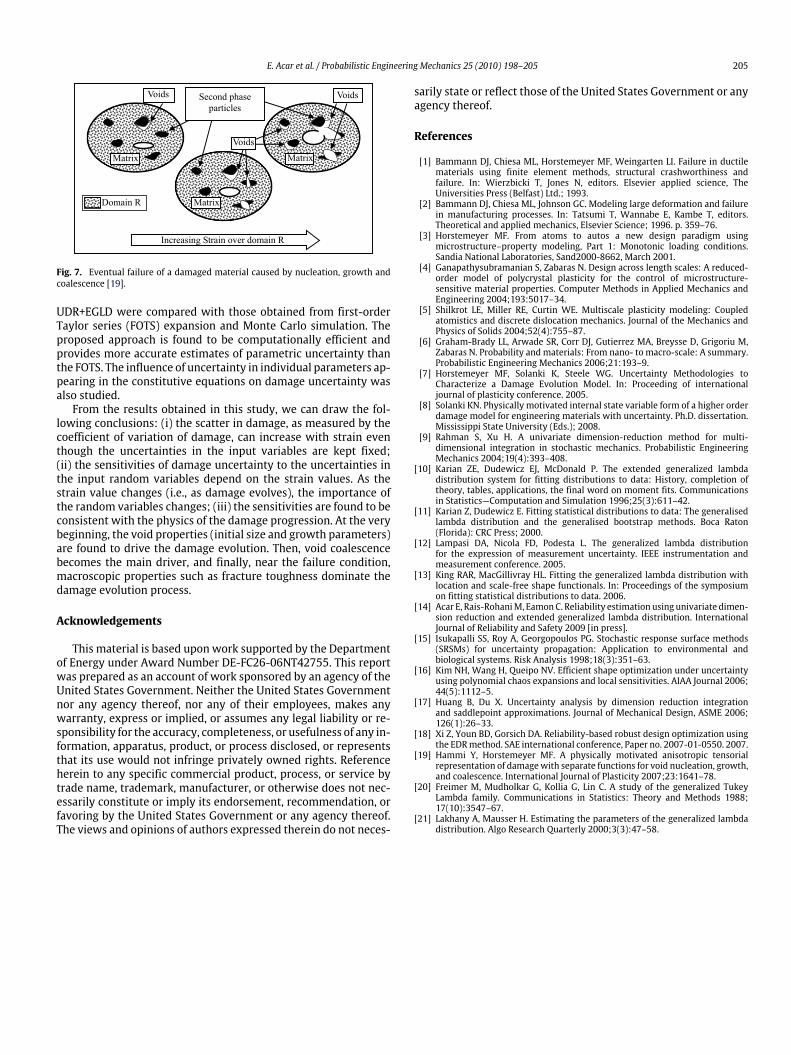
the physics of the damage progression shown in Fig. 7. At thebeginning, the void properties drive the damage evolution. Then,voids combine with each other and coalescence becomes the maindriver. Near failure,macroscopic properties such as fracture tough-ness, KIC , determines the damage evolution process.
7. Concluding remarks
This paper has presented a new approach for stochastic un-certainty analysis using the combination of univariate dimensionreduction (UDR) technique and the extended generalized lambdadistribution (EGLD). This approach was used to perform an un-certainty analysis on an un-notched cast AA356-T6 specimen us-ing an internal state variable plasticity–damage model. The effectsof uncertainty in material microstructural features (i.e., voids,cracks, inclusions) on damage initiation and evolution (or accumu-lation)were investigated. The uncertainty analysis results based on
E. Acar et al. / Probabilistic Engineering Mechanics 25 (2010) 198–205 205
Fig. 7. Eventual failure of a damaged material caused by nucleation, growth andcoalescence [19].
UDR+EGLD were compared with those obtained from first-orderTaylor series (FOTS) expansion and Monte Carlo simulation. Theproposed approach is found to be computationally efficient andprovides more accurate estimates of parametric uncertainty thanthe FOTS. The influence of uncertainty in individual parameters ap-pearing in the constitutive equations on damage uncertainty wasalso studied.From the results obtained in this study, we can draw the fol-
lowing conclusions: (i) the scatter in damage, as measured by thecoefficient of variation of damage, can increase with strain eventhough the uncertainties in the input variables are kept fixed;(ii) the sensitivities of damage uncertainty to the uncertainties inthe input random variables depend on the strain values. As thestrain value changes (i.e., as damage evolves), the importance ofthe random variables changes; (iii) the sensitivities are found to beconsistent with the physics of the damage progression. At the verybeginning, the void properties (initial size and growth parameters)are found to drive the damage evolution. Then, void coalescencebecomes the main driver, and finally, near the failure condition,macroscopic properties such as fracture toughness dominate thedamage evolution process.
Acknowledgements
This material is based upon work supported by the Departmentof Energy under Award Number DE-FC26-06NT42755. This reportwas prepared as an account of work sponsored by an agency of theUnited States Government. Neither the United States Governmentnor any agency thereof, nor any of their employees, makes anywarranty, express or implied, or assumes any legal liability or re-sponsibility for the accuracy, completeness, or usefulness of any in-formation, apparatus, product, or process disclosed, or representsthat its use would not infringe privately owned rights. Referenceherein to any specific commercial product, process, or service bytrade name, trademark, manufacturer, or otherwise does not nec-essarily constitute or imply its endorsement, recommendation, orfavoring by the United States Government or any agency thereof.The views and opinions of authors expressed therein do not neces-
sarily state or reflect those of the United States Government or anyagency thereof.
References
[1] Bammann DJ, Chiesa ML, Horstemeyer MF, Weingarten LI. Failure in ductilematerials using finite element methods, structural crashworthiness andfailure. In: Wierzbicki T, Jones N, editors. Elsevier applied science, TheUniversities Press (Belfast) Ltd.; 1993.
[2] Bammann DJ, Chiesa ML, Johnson GC. Modeling large deformation and failurein manufacturing processes. In: Tatsumi T, Wannabe E, Kambe T, editors.Theoretical and applied mechanics, Elsevier Science; 1996. p. 359–76.
[3] Horstemeyer MF. From atoms to autos a new design paradigm usingmicrostructure–property modeling, Part 1: Monotonic loading conditions.Sandia National Laboratories, Sand2000-8662, March 2001.
[4] Ganapathysubramanian S, Zabaras N. Design across length scales: A reduced-order model of polycrystal plasticity for the control of microstructure-sensitive material properties. Computer Methods in Applied Mechanics andEngineering 2004;193:5017–34.
[5] Shilkrot LE, Miller RE, Curtin WE. Multiscale plasticity modeling: Coupledatomistics and discrete dislocation mechanics. Journal of the Mechanics andPhysics of Solids 2004;52(4):755–87.
[6] Graham-Brady LL, Arwade SR, Corr DJ, Gutierrez MA, Breysse D, Grigoriu M,Zabaras N. Probability andmaterials: From nano- to macro-scale: A summary.Probabilistic Engineering Mechanics 2006;21:193–9.
[7] Horstemeyer MF, Solanki K, Steele WG. Uncertainty Methodologies toCharacterize a Damage Evolution Model. In: Proceeding of internationaljournal of plasticity conference. 2005.
[8] Solanki KN. Physically motivated internal state variable form of a higher orderdamage model for engineering materials with uncertainty. Ph.D. dissertation.Mississippi State University (Eds.); 2008.
[9] Rahman S, Xu H. A univariate dimension-reduction method for multi-dimensional integration in stochastic mechanics. Probabilistic EngineeringMechanics 2004;19(4):393–408.
[10] Karian ZE, Dudewicz EJ, McDonald P. The extended generalized lambdadistribution system for fitting distributions to data: History, completion oftheory, tables, applications, the final word on moment fits. Communicationsin Statistics—Computation and Simulation 1996;25(3):611–42.
[11] Karian Z, Dudewicz E. Fitting statistical distributions to data: The generalisedlambda distribution and the generalised bootstrap methods. Boca Raton(Florida): CRC Press; 2000.
[12] Lampasi DA, Nicola FD, Podesta L. The generalized lambda distributionfor the expression of measurement uncertainty. IEEE instrumentation andmeasurement conference. 2005.
[13] King RAR, MacGillivray HL. Fitting the generalized lambda distribution withlocation and scale-free shape functionals. In: Proceedings of the symposiumon fitting statistical distributions to data. 2006.
[14] Acar E, Rais-RohaniM, EamonC. Reliability estimation using univariate dimen-sion reduction and extended generalized lambda distribution. InternationalJournal of Reliability and Safety 2009 [in press].
[15] Isukapalli SS, Roy A, Georgopoulos PG. Stochastic response surface methods(SRSMs) for uncertainty propagation: Application to environmental andbiological systems. Risk Analysis 1998;18(3):351–63.
[16] Kim NH, Wang H, Queipo NV. Efficient shape optimization under uncertaintyusing polynomial chaos expansions and local sensitivities. AIAA Journal 2006;44(5):1112–5.
[17] Huang B, Du X. Uncertainty analysis by dimension reduction integrationand saddlepoint approximations. Journal of Mechanical Design, ASME 2006;126(1):26–33.
[18] Xi Z, Youn BD, Gorsich DA. Reliability-based robust design optimization usingthe EDRmethod. SAE international conference, Paper no. 2007-01-0550. 2007.
[19] Hammi Y, Horstemeyer MF. A physically motivated anisotropic tensorialrepresentation of damagewith separate functions for void nucleation, growth,and coalescence. International Journal of Plasticity 2007;23:1641–78.
[20] Freimer M, Mudholkar G, Kollia G, Lin C. A study of the generalized TukeyLambda family. Communications in Statistics: Theory and Methods 1988;17(10):3547–67.
[21] Lakhany A, Mausser H. Estimating the parameters of the generalized lambdadistribution. Algo Research Quarterly 2000;3(3):47–58.