Uncertainties in the Testing of the Coefficient of Thermal ...
Journal of Hydrology (2008) 361, 309–318
ava i lab le a t www.sc iencedi rec t . com
journal homepage: www.elsevier .com/ locate / jhydrol
Stochastic uncertainties and sensitivitiesof a regional-scale transport model of nitratein groundwater
Cors van den Brink a,*, Willem Jan Zaadnoordijk b, Saskia Burgers c,Jasper Griffioen d
a Royal Haskoning, Department of Environment, Chopinlaan 12, POB 8064, 9702 KB, Groningen, The Netherlandsb Royal Haskoning, Rotterdam, The Netherlandsc Biometris, Wageningen University, Wageningen, The Netherlandsd TNO Geological Survey of The Netherlands, Utrecht, The Netherlands
Received 15 April 2008; received in revised form 1 August 2008; accepted 2 August 2008
00do
*
KEYWORDSStochastic uncertaintyand sensivityassessment;Regional scale ground-water quality modeling;Latin hypercubesampling;Monte Carlo;Groundwater planning;Negotiation supportsystem
22-1694/$ - see front mattei:10.1016/j.jhydrol.2008.08
Corresponding author. TelE-mail address: c.vandenb
r ª 200.001
.: +31 50rink@roy
Summary Groundwater quality management relies more and more on models in recentyears. These models are used to predict the risk of groundwater contamination for variousland uses. This paper presents an assessment of uncertainties and sensitivities to inputparameters for a regional model. The model had been set up to improve and facilitatethe decision-making process between stakeholders and in a groundwater quality conflict.The stochastic uncertainty and sensitivity analysis comprised a Monte Carlo simulationtechnique in combination with a Latin hypercube sampling procedure. The uncertainty ofthe calculated concentrations of nitrate leached into groundwater was assessed for the var-ious combinations of land use, soil type, and depth of the groundwater table in a vulnerable,sandy region in The Netherlands. The uncertainties in the shallow groundwater were used toassess the uncertainty of the nitrate concentration in the abstracted groundwater.
The confidence intervals of the calculated nitrate concentrations in shallow groundwaterfor agricultural land use functions did not overlap with those of non-agricultural land usesuch as nature, indicating significantly different nitrate leaching in these areas. The modelresults were sensitive for almost all input parameters analyzed. However, the NSS is consid-ered pretty robust because no shifts in uncertainty between factors occurred between fac-tors towards systematic changes in fertilizer and manure inputs of the scenarios. In view ofthese results, there is no need to collect more data to allow science based decision-makingin this planning process.ª 2008 Elsevier B.V. All rights reserved.
8 Elsevier B.V. All rights reserved.
5 214 257.alhaskoning.com (Cors van den Brink).

310 Cors van den Brink et al.
Introduction
Groundwater quality management relies more and more onmodels in recent years (e.g. Thorsen et al., 2001; Refsgaardet al., 2005). These models are used to predict the risk ofgroundwater contamination for various types of land use.Advanced, physically based models could be used, but re-quire dense data input which is sparsely available, particu-larly on regional-scale (Thorsen et al., 2001). Regionalmodels have been developed (e.g. Tiktak (1999) and Beek-man (1998)) which use more generic data inputs, such asgroundwater level maps, regional manure application dataand soil types.
Both approaches, i.e., the advanced physically basedmodel and regional model, have uncertainties that needto be addressed in decision-making. Transparent environ-mental decision-making implies that policy-makers and reg-ulators have insight into the uncertainty and reliability ofthe input parameters and output variables of a model as akind of ‘certification of modeling results’ (Anderson andBates, 2001). In addition, it means that the model is diag-nostic for water management: different scenarios yield sig-nificantly different model results.
The uncertainty of environmental models complicatestheir use as prognostic tools (see e.g., Freeze (1975),Summers et al. (1993), Zhang et al. (1993), Tiktak (1999),Thorsen et al. (2001), Refsgaard et al. (2005) and Blasoneet al. (2008)). The sources are (1) the uncertainty of theinput data both time-varying (such as climate data andN-application data) and constant (e.g., soil physical charac-teristics) and (2) an inadequate model structure (processdescriptions) (Thorsen et al., 2001).
This paper presents an approach to assess uncertaintiesand sensitivities to input parameters for a regional modelto improve and facilitate the decision-making process be-tween stakeholders and in a groundwater quality conflict.It demonstrates that detailed models with highly accuratebut costly input requirements are not always required tohelp stakeholders to reach science based decisions.
Van den Brink et al. (2008) applied a regional model toidentify the best course of action to resolve a conflict be-tween land use and groundwater management. The modelunder consideration is a negotiation support system (NSS),set up to resolve a stakeholder-accepted conflict in the Hol-ten region, The Netherlands. The NSS comprises of a seriesof nitrate-leaching models for the unsaturated zone withvarious kinds of land use and a three-dimensional groundwa-ter transport model for calculation of nitrate transport fromthe groundwater table to a drinking water abstraction. Theaims of the NSS are (1) to explain the complexity of thegroundwater system in terms of recharge area and resi-dence times, (2) to rephrase the problem so that it illus-trates the unique role of each stakeholder and theinterrelationship between the concerned parties, and (3)evaluate scenarios. The two former aims have been met(Van den Brink et al., 2008), but the latter has not been ver-ified. It requires that the NSS can distinguish between vari-ous land use functions for which the uncertainty of theresults must be known.
The uncertainty and sensitivity analysis of the NSS ad-dressed three questions: (1) what is the uncertainty of the
calculated concentrations of the nitrate leached intogroundwater? (2) which input parameters explain the largestvariation in the model output? and (3) how does the uncer-tainty of leached nitrate translate into the uncertainty ofthe concentration in the abstracted groundwater? The an-swers to these three questions were used to determinewhether the model could significantly distinguish betweenthe scenarios. The stakeholders proposed scenarios of landuse changes.
This analysis was considered representative for drinkingwater abstractions below vulnerable sandy soils with variouskinds of land use in the infiltration area.
Materials and methods
Study site
Geohydrological and geochemical settingThe Holten region is located in the eastern part of The Neth-erlands, in the province of Overijssel (see Fig. 1). The regionenjoys a rural setting with a balance between small munic-ipalities, farms/dairies, and open public lands. The northernand southernmost parts of the area consist of ice-pushedridges covered with deciduous forest and pines. Natureand recreational functions dominate here. The central-southern valley is mainly used for intensive agriculture.The subsoil can be considered a single aquifer consistingof three distinctly different geological layers upon a geohy-drological basis at approximately 90 m below the soil sur-face. Groundwater abstraction started in this area in 1960with 10 wells and most abstraction screens were placed inthe second, most permeable, (sub)oxic layer. Five new wellswere installed in the third, i.e. deepest, anaerobic layer in1985 in order to avoid well clogging due to mixing of oxygen-rich and iron(II)-rich groundwater. The local water com-pany, in cooperation with the provincial authority, initiateda local planning process in response to the mounting con-cerns about nitrate concentrations in abstracted and shal-low groundwater.
Negotiation support system (NSS)The NSS operates on an annual time step encompassing theperiod 1950–2050 and includes a 10-year starting-up periodto simulate the initial distribution of nitrate in groundwateras a function of land use (1950–1960), a 39-year validationperiod (1960–1998), and a 52-year planning horizon (1999–2050). The model comprises two key systems, the ground-water and nitrate budgets (see Appendix 1 for more detail).Basic elements of the groundwater budget includes net an-nual recharge as a function of the vegetation type, depth tothe groundwater table, soil type, and the annual abstractionrate at each well. The nitrate budget tracks the primarysources, including fertilizers, forest-soil leachate, soil–min-eral leachate, and the primary sinks represented by crop up-take, denitrification and abstraction.
Planning processThe NSS supported the local planning process by providing atool with which to explore alternative land use scenariosand providing quantitative information on the impact ofthe proposed land use change and the change in N-applica-

Figure 1 Study area of the Holten case in the province of Overijssel, The Netherlands.
Stochastic uncertainties and sensitivities of a regional-scale transport model of nitrate in groundwater 311
tion on the quality of abstracted groundwater. Various pol-icy fields were involved: environmental and water manage-ment, management of natural heritage and land useplanning. The stakeholders in the planning process werefarmers, the water supply company, water board, the prov-ince, the township of Holten, recreation entrepreneurs, andorganisations managing the natural heritage. The farmershave been represented by three people representative forthe interest of the five farms entirely dependent economi-cally on agricultural activities in the capture zone of thegroundwater abstraction site. The water supply companyhas been represented by three people responsible for waterquality issues, spatial planning issues and communication
with farmers respectively. The water board has beenrepresented by one person. The province has been repre-sented by one person responsible for groundwater quality.The township of Holten has been represented by one personresponsible for spatial planning. The recreation entrepre-neurs have been represented by two people, running acamping site and an area with recreation homes. The regio-nal departments of the ministries managing the natural her-itage and rural area have been represented by one personrespectively.
Several land use scenarios were considered by Van denBrink et al. (2008): the ‘base’ and ‘adapted land use’ sce-narios were further developed to identify the best course

312 Cors van den Brink et al.
of action to resolve the stakeholder-accepted conflict. Thebase scenario calculates autonomous development, assum-ing no changes in land use pattern. The adapted land usescenario is identical to the base scenario until 2005, atwhich time the adapted land use scenario is assumed tobe implemented. The adapted land use scenario was definedby the water company and the provincial government basedon: (1) the calculated quality of the shallow groundwater in2005 obtained from the base scenario and (2) the residencetimes of the groundwater toward the abstraction site calcu-lated with the calibrated geohydrological flow model. Noscenarios were further developed, because implementingthe adapted land use scenario would be adequate for a sus-tainable protection of the drinking water abstraction.
The output generated by the NSS was organized in theform of maps and time series as requested by the stakehold-ers. This information visualized and quantified the conflict-ing interests between agricultural land use and drinking-water function, indicating that sustainable protection ofthe resource would require a substantial change in landuse. The changes in nitrate concentration due to theadapted land use scenario are significant as they are real-ized in an area with rather short residence times and wereacceptable to the stakeholders. As a result, the need for asubstantial change in the actual land use pattern to protectthe abstraction site became a shared notion among thestakeholders. In this way information from the NSS was usedin the bottom-up spatial planning process as the technicalbasis for management decision-making (c.f. Simonovic,2002). More details on the model and the planning processcan be found in van den Brink et al. (2008).
Uncertainty and sensitivity of the calculatedconcentration of nitrate leached into groundwater
The uncertainty and stochastic sensitivity analysis wasbased on a Monte Carlo approach in combination with a La-tin hypercube sampling (LHS) procedure applied to the inputparameters. The uncertainty due to the model structurewas assumed to be negligible compared to the uncertaintydue to the input parameters, based on previous experiencewith the same or similar nitrate leaching models applied oncomparable time and spatial scales (Beekman and Vogelaar,1997; Beekman, 1998; Otte, 1998; Vink and Schot, 1999).The Monte Carlo LHS approach consisted of six steps: (1) se-lect input data for inclusion in the analysis, (2) assign prob-ability density functions (PDFs) to each input factor, (3)generate an input matrix, (4) calculate nitrate leaching,(5) analyze the model output (uncertainty analysis), and(6) assess the influence of each input factor on the modeloutput (sensitivity analysis).
Step 1: select input dataTwo types of input data were used in our model: inputparameterizing the leaching processes (see Appendix 1)and input describing nitrate sources (e.g., fertilizers, atmo-spheric deposition and basic leaching) and sinks (crop up-take and denitrification). They play different roles in theplanning process. The leaching parameters are consideredconstant, while the source parameters may be affected byland use planning. We conducted the analysis using 41 input
parameters (see Appendix 2). The base scenario was used todescribe the autonomous developments regarding theimplementation of Dutch policy on mineral managementand local agricultural practice and developments as pro-vided by the stakeholders. The 2005 data set was used be-cause the output calculated with these data showed andquantified the conflicting interests between agriculturalland use and drinking-water function. The uncertainty ofthe quality of the abstracted groundwater was analyzedfor the situation in which the nitrate concentration of thegroundwater system was in equilibrium with the nitrogen in-put (N input) from land use, i.e. a stationary situation with aconstant nitrogen load in time at the surface.
Step 2: assign PDFsKey literature sources of the uncertainties of the inputparameters were the review papers by de Vries et al.(2003) and Kroeze et al. (2003). The model parameters thatwere used to describe the empirical relationships within theNSS were based on Beekman (1998). PDF characteristicswere established for all input parameters (see Appendix 2).
Step 3: generate an input matrixThe input matrix was generated using the LHS procedure forall combinations of model inputs and model parameters.This procedure uses a probabilistic sampling procedure thatprovides better coverage of the input distributions and hasbeen shown to be more efficient than the random samplingof the standard Monte Carlo analysis (Helton and Davis,2003). The input matrix in the present study consisted of1000 samples. No correlations between model inputs andparameters or other restrictions on the sampling werenecessary.
Step 4: calculate nitrate leachingThe nitrate concentration of the shallow groundwater (mgNO3 L
�1) in the Holten area was calculated for each MonteCarlo-LHS sample. Table 1 presents an overview of the re-sults of the different combinations of soil, land use, andgroundwater table depth.
Step 5: uncertainty analysisThe mean, standard deviation, coefficient of variation, and95% confidence interval (i.e., p = 0.05 and 0.95 quantile ofthe nitrate concentration) were used as measures of theuncertainty of the model output. These statistics were cal-culated from the 1000 samples of the Monte Carlo-LHS step.
Step 6: sensitivity analysisAssessment of the relative importance of the individual in-put parameters on the output variables was conducted usingvariance decomposition. The variance of the model outputcan be seen as the specification of the uncertainty. Thetop marginal variance (TMV) of an input is the variancereduction that would occur if the input would become fullyknown (Jansen et al., 1994). It is also called the first-ordersensitivity index or correlation ratio (Brus and Jansen,2004). In a regression-based sensitivity analysis, the rela-tionship between the model output (y) and model inputs(x1, . . .,xk) is approximated by a regression relation. Inputdata explaining more than 10% of the TMV were selected.In the present analysis, we used a linear regression model.

Table 1 Calculated uncertainty in output variables for each combination of land use (lu), soil (s), and groundwater levelclassification (Gt). The area within the study area, mean, standard deviation, and 95% confidence interval are given for eachcombination
Output variable Area (m2) Mean (mg NO3 L-1) Sd Sd (%) Lower (mg NO3 L-1) Upper (mg NO3 L-1)
lu001s1Gt3 211762 12.03 4.80 39.9 5.77 21.06lu001s1Gt5 643685 60.06 23.81 39.6 28.03 102.77lu001s1Gt6 1457687 72.35 27.04 37.4 35.33 124.34lu001s1Gt7 407203 90.38 32.06 35.5 45.73 150.05lu001s1Gt8 1087931 114.49 39.80 34.8 59.47 187.83lu001s3Gt3 2087760 4.10 1.13 27.6 2.43 6.17lu002s1Gt3 31978 13.58 3.66 27.0 8.09 19.86lu002s1Gt6 12778 81.34 17.53 21.6 53.92 110.11lu003s1Gt3 67662 8.18 2.21 27.0 4.99 12.20lu003s1Gt5 11080 40.90 10.92 26.7 23.90 60.33lu003s1Gt6 267130 49.13 11.09 22.6 32.50 67.84lu003s1Gt7 33243 61.40 11.85 19.3 43.47 82.45lu003s1Gt8 41089 77.77 13.97 18.0 54.94 100.59lu003s3Gt3 230630 6.13 1.68 27.4 3.65 9.11lu004s1Gt5 7739 5.45 1.94 35.7 2.58 9.09lu004s1Gt6 46500 6.53 2.11 32.3 3.40 10.56lu004s1Gt7 43602 8.18 2.48 30.3 4.46 12.69lu004s1Gt8 173866 10.35 3.03 29.2 5.80 15.67lu005s1Gt5 18299 12.36 3.68 29.8 6.96 19.15lu005s1Gt6 11897 14.82 3.76 25.4 9.12 21.38lu005s1Gt7 30389 18.52 4.10 22.2 12.03 25.62lu005s1Gt8 649832 23.46 4.98 21.2 15.95 31.98lu005s3Gt3 28241 3.22 0.86 26.8 1.96 4.77lu006s1Gt8 45890 55.51 14.29 25.7 33.72 79.75
Vulnerable sandy soils
lu101s1Gt3 30224 9.63 3.74 38.9 4.83 16.7lu101s1Gt5 284290 48.06 18.65 38.8 23.59 81.46lu101s1Gt6 2094426 57.88 21.08 36.4 29.99 97.65lu101s1Gt7 1381742 72.31 24.96 34.5 39.31 119.45lu101s1Gt8 2686584 91.60 30.95 33.8 50.53 149.64lu102s1Gt6 120073 71.96 15.22 21.2 47.86 96.61lu102s1Gt7 8852 90.10 16.77 18.6 65.23 119.00lu102s1Gt8 104239 114.11 19.72 17.3 83.55 148.06lu103s1Gt5 87485 33.59 9.00 26.8 19.44 49.49lu103s1Gt6 361638 40.34 9.17 22.7 26.78 56.06lu103s1Gt7 234511 50.42 9.78 19.4 36.01 66.79lu103s1Gt8 1150898 63.86 11.51 18.0 45.37 82.56
lu001 = grassland, lu002 = arable land, lu003 = maize land, lu004 = nature, lu005 = urban, lu006 = recreation; lu101 = grassland,lu102 = arable land, lu103 = maize land at vulnerable sandy soils; s1 = sandy soil, s3 = peat soil; Gt = groundwater class. The leachingfraction as a function of the groundwater level classification is: Gt1 = 0, Gt2 = 0.05, Gt3 = 0.10, Gt4 = 0.40, Gt5 = 0.50, Gt6 = 0.60,Gt7 = 0.75, Gt7* = 1.0.
Stochastic uncertainties and sensitivities of a regional-scale transport model of nitrate in groundwater 313
The quality of the approximation was measured using R2 ad-justed for sample size and number of parameters, i.e., thepercentage of variance accounted for in the full linear mod-el, and was successful if R2 was close to 100%. The sensitiv-ity analysis was performed with USAGE 2.0, a collection ofGenStat algorithms for sensitivity and uncertainty analyses(Goedhart and Thissen, 2002; GenStat Committee, 2006).
The sensitivity of the model output for the individual in-put parameters was expressed by the TMV within the combi-nations of land use (grassland, maize, arable, nature, urban,and recreation), soil type (sand, clay, and peat) and ground-water level classification (see Appendix 1, Table 4). Thegroundwater level classification used is a Dutch classifica-
tion for the depth of the Groundwater table below the sur-face, Gt (Van Heesen, 1970; Knotters and Van Walsum,1997). Around Holten, groundwater table depth classesare present between Gt3 (shallow) and Gt8 (deep).
Uncertainty of the calculated nitrate concentrationin groundwater abstracted
The uncertainty of the nitrate concentration in the ab-stracted groundwater was calculated as a function of theuncertainty of the nitrate concentration in shallow ground-water and the uncertainty of the fraction of groundwater

314 Cors van den Brink et al.
abstracted from the third anaerobic layer (see descriptionof study site).
The average nitrate concentration and standard devia-tion of the various combinations of land use, soil type,and groundwater level classification – determined by sto-chastic uncertainty analysis – was weighted spatiallyaccording to,
lX ¼Xn
i¼1
XiAi
Atotð1Þ
where lX is the average nitrate concentration in shallowgroundwater (mg NO3 L
�1), Xi is the nitrate concentrationfor combination i of land use, soil type, and groundwater ta-ble class (mg NO3 L
�1), Ai is the surface area associated withcombination i (m2) and Atot is the total surface area(m2) =
PAi.
The uncertainty of the nitrate concentration in ab-stracted groundwater was calculated from the variances inconcentration in shallow groundwater and reduction factor,where the co-variances were assumed to be zero (Moodet al., 1974):
varðXfÞ ¼ l2XvarðfÞ þ l2
fvarðXÞ þ varðXÞvarðfÞ ð2Þ
where X is the nitrate concentration in shallow groundwater(mg NO3 L
�1), f is the fraction of abstracted anaerobicgroundwater from third layer (�), lz is the average of zand var(z) is the variance of z.
Results
This section is divided into three parts: (1) uncertainty and(2) sensitivity analyses of nitrate leaching from the unsatu-rated zone, and (3) uncertainty analysis of the nitrate con-centration in abstracted groundwater. The uncertainty ofthe calculated nitrate concentration in shallow groundwateris expressed as the standard deviation. The 95% confidenceinterval is calculated as a function of soil type, groundwaterlevel classification, and N-application.
Uncertainty analysis
The aim of the uncertainty analysis is to quantify the overalluncertainty of the model output as a result of the uncertain-ties of the model input. The results in terms of statisticaldata are given in Table 1. The variation of the soil typesin the study area was so slight that the impact of soil typeon output variables could not be conducted (see Table 1).For soil type sand and groundwater table depth class Gt6(intermediate depth), the relative uncertainty of leachednitrate differed between land uses, increasing from arableat 21.6% via maize, urban and nature, to grassland at37.4%. In addition to having the largest relative uncertain-ties, the land use functions grassland and nature also cov-ered the largest areas within the study area. The absoluteuncertainties of the calculated leaching increased from nat-ure at 2.1 mg NO3 L
�1, via urban, maize and arable, tograssland at 27.0 mg NO3 L
�1. The land use function grass-land had by far the largest absolute uncertainty.
For soil type sand and land uses grassland and maize, therelative uncertainties varied with groundwater level classi-
fications, increasing with decreasing groundwater tabledepth (i.e. an increasing impact of denitrification). Theabsolute uncertainties showed an opposite pattern. The rel-ative uncertainties increased from 34.8% (groundwater ta-ble depth class Gt8 = large depth) to 39.9% (Gt3 = smalldepth) for grassland–sand and from 18.0% (Gt8) to 27.0%(Gt3) for the combination sand and maize. In contrast, theabsolute uncertainties decreased from 39.8 mg NO3 L
�1
(groundwater table depth class Gt8 = large depth) to4.8 mg NO3 L
�1 (groundwater table depth class Gt3 = shal-low depth) for grassland on sand and from 14.0 mg NO3 L
�1
(Gt8) to 2.2 mg NO3 L�1 (Gt3) for maize on sand.
Since 2001, the provincial authorities have allocated‘vulnerable sandy soils’, where an additional reduction inthe application of manure was implemented (Van den Brinket al., 2008). Although the nitrate leaching at the vulnera-ble sandy soils for the corresponding combinations of landuse, soil type and groundwater table depth is less as resultof a reduced N-application, the relative uncertainty of thisconcentration is identical.
Sensitivity analysis
The results of the sensitivity analysis are shown in Table 2,with the top marginal variance (TMV) being presented asthe percentage of total variance. The adjusted R2 was atleast 94%, indicating that nearly all variance in the outputwas accounted for and that there was no indication of aninteraction between the model inputs. The TMVs given in Ta-ble 2 show the uncertainties caused by a particular inputparameter.
The uncertainty in the input parameter Ngrowth isimportant for the variation in nitrate leaching in agriculturalland uses while and Nwinter is important for the variation innitrate leaching in non-agricultural land uses (see Appendix2). The variance explained by Ngrowth was up to 82% in thecase of agricultural land use and negligible for non-agricul-tural land uses. The variance of Nwinter was negligible for theagricultural land uses and only up to 22% for non-agriculturalland use (Table 2). The uncertainty of the model parameterdenitrification factor (Denit) was important for each landuse. This parameter reduces the nitrate leaching by reduc-ing the N-surplus. The N-surplus is the difference betweenthe primary sources, such as fertilizers, sewage leakageand atmospheric deposition, and the primary sinks repre-sented by crop uptake. The reduction depends only on thegroundwater table depth class (Gt). Denit explained up to55% of the variance in nitrate leaching for both agriculturaland non-agricultural land uses. Differences in the top mar-ginal variance among the various land uses with the samegroundwater level classification were caused by a differentweight of that parameter in the N-surplus and not by differ-ences in the uncertainty of Denit. The Denit PDF uncertain-ties were 20% for all groundwater table depths.
For the calculations of agricultural land use, the modelparameters basic leaching (Un_lu) and the maximum leach-ing percentage for a specific combination of soil and landuse (max_lu_soil) were important, like Denit. Un_lu ex-plained up to 44% of the variation in nitrate leaching wheremax_lu_soil explained up to 29%. The uncertainty of basicleaching (Un_lu) was less for grassland (0–20 kg N
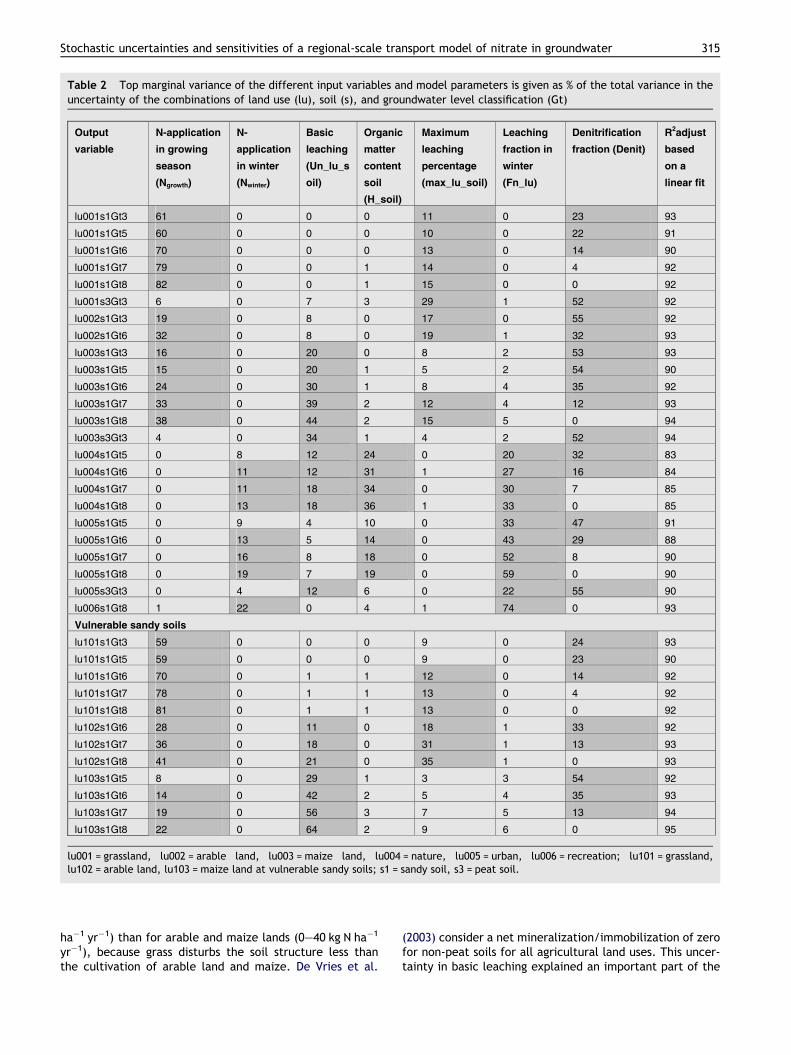
Table 2 Top marginal variance of the different input variables and model parameters is given as % of the total variance in theuncertainty of the combinations of land use (lu), soil (s), and groundwater level classification (Gt)
lu001 = grassland, lu002 = arable land, lu003 = maize land, lu004 = nature, lu005 = urban, lu006 = recreation; lu101 = grassland,lu102 = arable land, lu103 = maize land at vulnerable sandy soils; s1 = sandy soil, s3 = peat soil.
Stochastic uncertainties and sensitivities of a regional-scale transport model of nitrate in groundwater 315
ha�1 yr�1) than for arable and maize lands (0–40 kg N ha�1
yr�1), because grass disturbs the soil structure less thanthe cultivation of arable land and maize. De Vries et al.
(2003) consider a net mineralization/immobilization of zerofor non-peat soils for all agricultural land uses. This uncer-tainty in basic leaching explained an important part of the
316 Cors van den Brink et al.
variance seen for maize. The impact of the uncertainty wasgreater for maize than for arable land, because more N wasapplied to arable land (Nf + Nm = 100 + 160 kg N ha�1 yr�1)compared to maize (Nf + Nm = 100 + 30 kg N ha�1 yr�1). Nf
indicates the N application by fertilizer while Nm indicatesthe N application by manure (see Appendix 1). The uncer-tainty of the parameter determining maximum leaching per-centage for a specific combination of soil (max_lu_soil) wasdifferent for grassland (10–40% on sandy soils), arable land(35–100% on sandy soils) and maize land (30–70% on sandysoil). This uncertainty range fits within the range reportedby De Vries et al. (2003).
For the calculations on non-agricultural land uses, themodel parameters leaching fraction in the winter (Fn_lu)and organic matter content of the soil (H_soil) were impor-tant, like Denit. Fn_lu explained 20–74% of the variation innitrate leaching, H_soil explained up to 36%. Fn_lu ac-counted for an uncertainty of 20–40% for all non-agricul-tural land uses. The uncertainty of the winter leachingexplained up to 74% of the variance because the winterleaching comprised a substantial amount of the N-budget.The uncertainty of H_soil contributed only to the variancein nitrate leaching when the mineralization of organic mate-rial contributed substantially to the N-balance. This wasonly the case for nature and urban land uses. Basic leaching(Un_lu) for nature and urban resulted in a TMV of 12–18%,despite the mean value (l) of 0 kg N ha�1 yr�1 with a rangeof 0–10 and 0–5 kg N ha�1 yr�1 for nature and urban,respectively. The impact of the uncertainty of this particu-lar model parameter on the total uncertainty was noticedbecause the absolute range was substantial with regard tothe yearly N-input of nature and urban land use, i.e.,31.25 (20.31 + 10.94) and 36 (18 + 18) kg N ha�1 yr�1,respectively (see Appendix 2, Table 1). The uncertainty ofUn_lu was not substantial for the N-balance of recreationland use and explained just a small part of the variance.
The additional reduction in the application of manure in‘vulnerable sandy soils’ did not affect the outcome of thesensitivity analysis. The TMV values are almost identical tothe values of the corresponding combinations of land use,soil type and groundwater table depth (see Table 2). Slightdifferences in the TMV between these combinations werecaused by a slight shift in the N-balance and not by differ-ences in the uncertainty of the dominant parameters. Noshifts in uncertainty between factors occurred towards sys-tematic changes in fertilizer and manure inputs of the sce-narios. This indicates that the NSS is pretty robust towardsthese changes.
Uncertainties with regard to nitrate concentrationin abstracted groundwater
The average fraction of groundwater abstracted from thethird anaerobic layer was 0.584 and the standard deviationwas 0.090. The spatially weighted average nitrate concen-tration that leached to the groundwater was 40.6 NO3 L
�1
and the standard deviation was 10.8 mg NO3 L�1. Therefore,
the nitrate concentration in abstracted groundwater can beestimated by combining both terms: 40.6 · (1 � 0.584) =16.9 mg NO3 L
�1. The associated standard deviation is7.3 mg NO3 L
�1, i.e., 43%, using Eq. (2).
Discussion
Ideally, physically based transport models can be applied tomodel reactive groundwater transport and all parameterscan be obtained independently in the field. This can beachieved for cases that are rather homogeneous in theirspatial characteristics and have a temporally constant inputand where a limited number of processes are operational. Inreality, such an application and acquisition can rarely beachieved when models are used for management supportat a regional or larger scale. In the approach we used, mod-eling was carried out based upon the best-available infor-mation and PDFs were assessed using a subjective method(Brusseau, 1991; Refsgaard et al., 2005; Thorsen et al.,2001).
The sensitivity analysis was performed to test the appli-cability of the NSS in groundwater planning. This was ad-dressed using the following questions: (1) can the NSS beused as tool with which to explore alternative land use sce-narios and providing quantitative information on the impactof the proposed land use change and the change in N-appli-cation on the quality of shallow groundwater? and (2) whatdoes the sensitivity of the individual parameters mean forthe utilization of the NSS in groundwater planning?
Usefulness to establish differences between landuse and set up of scenarios
Shallow groundwaterThe differences in nitrate leaching between the various landuses were significant – the confidence intervals of agricul-tural land use and nature did not overlap at all within a gi-ven soil type and groundwater level classification (see Table1). The largest relative uncertainties for all combinations ofland use, soil type, and groundwater level classificationwere calculated for grass and nature. These relative uncer-tainties increased when denitrification increased, but werenot affected by a reduction of the N-application as was thecase in areas with vulnerable sandy soils. Despite the some-times large absolute uncertainties for, for example, grass-land and arable land, there was no overlap in confidenceintervals of the nitrate concentrations between agriculturaland nature land use functions within a given soil type andgroundwater level classification. Thus, changes in land usefunction will also lead to distinctive changes in nitrate con-centrations. In view of this significant distinction, there isno need for a further reduction of the overall uncertaintyof the output by the minimization of the uncertainty ofthe input parameters. The additional effort will not contrib-ute to the improvement of the prediction or provide moreinsight into the differences between the scenarios. TheNSS is, therefore, considered sensitive enough to revealthe effects of conflicting land uses and is, thus, useful inthe planning process by formulating land use scenarios.
Abstracted groundwaterThe uncertainty of 43% in the nitrate concentration in theabstracted groundwater explained with the 2005 data setstrongly resembles the uncertainty of 45% calculated forthe period 1960–1998 (Van den Brink et al., 2008). The lat-
Stochastic uncertainties and sensitivities of a regional-scale transport model of nitrate in groundwater 317
ter uncertainty was derived by comparing the nitrate con-centration data in abstracted groundwater with the nitrateconcentrations calculated with the NSS. The NSS calcula-tions have not been fitted with abstraction data or dataon the shallow groundwater (Van den Brink et al., 2008).Both uncertainties are not, however, directly comparablebecause one refers to a random year (2005) and the otherto a period of years (1960–1998). The groundwater qualitydata on the abstracted groundwater and data on the pump-ing hours contain no additional information with which tofurther reduce this uncertainty. So, calibration is not veryuseful, in addition to the fact that the regional modelingconcerns an underconstrained problem (c.f. Van der Griftand Griffioen, 2008).
Usefulness in groundwater planning
The PDF of the input parameters was based on bothliterature empirical data. The uncertainties of the inputparameters do not limit the use of the NSS in the Holtenstudy. A further reduction of the uncertainty of inputparameters demands either a larger literature review ornew experiments. The uncertainty of the input parameterscan possibly be decreased. This particularly concernsNgrowth, the most sensitive parameter for the land use typesshowing the highest N-application. The uncertainty of thisparameter can, in principle, be reduced through measure-ments like setting up a nutrient balance per parcel or agri-cultural farm. This approach was used by the watercompany in our study area. The results however show thatthe N-application on the parcels of participating farmsseemed inconsistent keeping in mind crop production andregional agricultural practices (Vitens, unpublished data).Based on this, the water company concluded that regionalagricultural statistics form the most trustworthy source ofinformation to estimate the N-application at a regional-scale.
Because a stochastic uncertainty and sensitivity analysisdoes not provide any information on the tenability of thestructure of the conceptual model, we evaluated the tena-bility using a pedigree analysis (Refsgaard et al., 2006).Refsgaard et al. (2006) mentioned aspects that need tobe scored in this analysis. They are (1) supporting empiricalevidence, (2) theoretical understanding and representationof the understood underlying mechanisms, (3) plausibility,and (4) colleague consensus. First, the modelled NSSshowed a good fit for the modeled concentrations basedon a large series of direct measurements, even withoutany calibration. These measurements, however, only re-flected the quality of the abstracted groundwater, i.e.,the output side of the modeling process. Second, the pro-cess descriptions were founded on a well-established the-ory using model equations to reflect process details andempirical equations based on basic literature and experi-ments. Third, the process descriptions, therefore, can beconsidered reasonably plausible and, last, acceptable toall but a few colleagues. All four aspects thus got positivescores. In addition to the results of the stochastic uncer-tainty analysis, the pedigree analysis confirmed the conclu-sion that the NSS is a useful instrument in the context ofgroundwater planning.
Conclusions
The analysis of the uncertainties of the nitrate leachingfrom various land uses showed that the negotiation supportsystem (NSS) can significantly distinguish between land usefunctions for our case study. In view of this significant dis-tinction, there is no need for a further reduction of theoverall uncertainty of the output by additional data collec-tion on input parameters to make sound science baseddecisions.
The sensitivity analysis showed that the NSS was mostsensitive for almost all included input parameters. How-ever, the NSS is considered robust because no shifts inuncertainty between factors occurred between factors to-wards systematic changes in fertilizer and manure inputsof the scenarios.
A pedigree analysis confirms that the NSS is a suitablediagnostic and prognostic tool for land use planning and pro-tection of a groundwater abstraction sites.
Acknowledgements
We thank Laura Cobb for her help in revising and editing themanuscript and Peter de Ruiter and anonymous reviewersfor helpful comments on previous versions of themanuscript.
Appendix A. Supplementary data
Supplementary data associated with this article can befound in the online version, at doi:10.1016/j.jhydrol.2008.08.001.
References
Anderson, M.G., Bates, P.D., 2001. Hydrological science: modelcredibility and scientific integrity. In: Anderson, M.G., Bates,P.D. (Eds.), Model Validation. Perspectives in HydrologicalScience. John Wiley and Sons, Chichester, pp. 1–10.
Beekman, W., Vogelaar, A.J., 1997. Verification of REGIO-NIT;model for simulation of nitrogen load at the land surface and inthe groundwater (in Dutch). KIWA Report SWE 97.003. Nieuweg-ein, The Netherlands, 39pp.
Beekman, W., 1998. SPREAD: Prediction of nitrate, hardness,chloride and sulphate in the shallow groundwater (in Dutch).KIWA Report SWE 98.012. Nieuwegein, The Netherlands, 32pp.
Blasone, R.S., Madsen, H., Rosbjerg, D., 2008. Uncertainty assess-ment of integrated distributed hydrological models using GLUEwith Markov chain Monte Carlo sampling. Journal of Hydrology353, 18–32.
Brus, D.J., Jansen, M.J.W., 2004. Uncertainty and sensitivityanalysis of spatial predictions of heavy metals in wheat. Journalof Environmental Quality 33, 882–890.
Brusseau, M.L., 1991. Application of a multiprocess non-equilibriumsorption model to solute transport in a stratified porous medium.Water Resource Research 27, 589–595.
De Vries, W., Kros, J., Oenema, O., de Klein, J., 2003. Uncertain-ties in the fate of nitrogen II: a quantitative assessment of theuncertainties in major nitrogen fluxes in The Netherlands.Nutrient Cycling in Agroecosystems 66, 71–102.
Freeze, R.A., 1975. A stochastic-conceptual analysis of one-dimen-sional groundwater flow in non-uniform homogeneous media.Water Resource Research (11), 725–741.
318 Cors van den Brink et al.
GenStat Committee, 2006. Genstat Reference Manual. Release 9.VSN International, Hemel Hempstead, UK.
Goedhart, P.W., Thissen, J.T.N.M., 2006. Biometris GenStatProcedure Library Manual, ninth ed. Biometris, Wageningen,The Netherlands [online available at <http://www.biometris.-wur.nl/UK/Software/>Genstat procedures].
Helton, J., Davis, F., 2003. Latin hypercube sampling and thepropagation of uncertainty in analyses of complex systems.Reliability Engineering and System Safety 81, 23–69.
Jansen, M.J.W., Rossing, W.A.H., Daamen, R.A., 1994. Monte Carloestimation of uncertainty contributions from several indepen-dent multivariate sources. In: Predictability and NonlinearModelling in Natural Sciences and Economics. Kluwer AcademicPublishers, Dordrecht, pp. 334–343.
Knotters, M., van Walsum, P.E.V., 1997. Estimating fluctuationquantities from time series of water-table depths using modelswith a stochastic component. Journal of Hydrology 197, 25–46.
Kroeze, C., Aerts, R., van Breemen, N., van Dam, D., van der Hoek,K., Hofschreuder, P., Hoosbeek, M., de Klein, J., Kros, H., vanOene, H., Oenema, O., Tietema, A., van der Veeren, R., deVries, W., 2003. Uncertainties in the fate of nitrogen I: anoverview of sources of uncertainty illustrated with a Dutch casestudy. Nutrient Cycling in Agroecosystems 66, 43–69.
Mood, A.M., Graybill, F.A., Boes, D.C., 1974. Introduction to theTheory of Statistics, third ed. McGraw-Hill Higher Ed, p. 564.
Otte, J., 1998. Nitrogen and chloride leaching to shallow ground-water in the recharge area of drinking water site Roosteren, TheNetherlands (in Dutch). Kiwa Report SWI 98.129, Nieuwegein,The Netherlands.
Refsgaard, J.C., Henriksen, H.J., Harrar, W.G., Scholten, H., Kassa-hun, A., 2005. Quality assurance in model based water manage-
ment – review of existing practice and outline of new approaches.Environment Modelling and Software 20, 1201–1225.
Refsgaard, J.C., van der Sluijs, J.P., Brown, J., van der Keur, P.,2006. A framework for dealing with uncertainty due to modelstructure error. Advances in Water Resources 29, 1586–1597.
Summers, J.K., Wilson, H.T., Kou, J., 1993. A method for quanti-fying the predicted uncertainties associated with water qualitymodels. Ecology Modeling (65), 165–176.
Tiktak, A., 1999. Modeling non-point source pollutants in soil. PhDThesis, University of Amsterdam, p. 224.
Thorsen, M., Refsgaard, J.C., Hansen, S., Pebesma, E., Jensen,J.B., Kleeschulte, S., 2001. Assessment of uncertainty insimulation of nitrate leaching to aquifers at catchment scale.Journal of Hydrology 242, 210–227.
Van den Brink, C., Zaadnoordijk, W.J., van der Grift, B., de Ruiter,P.C., Griffioen, J., 2008. Using a groundwater quality negotia-tion support system to change land use management near adrinking-water abstraction in The Netherlands. Journal ofHydrology 350, 339–356.
Van der Grift, B., Griffioen, J., 2008. Modelling assessment ofregional groundwater contamination due to historic smelteremissions of heavy metals. Journal of Contaminant Hydrology(96), 48–68.
Van Heesen, H.C., 1970. Presentation of the seasonal fluctuation ofthe water table on soil maps. Geoderma 4, 257–278.
Vink, C., Schot, P.P., 1999. Simulation of nitrate transport ingroundwater to production well Roosteren. EU-LIFE ProjectPRESYS-GQ, Technical Report 3, 1–40.
Zhang, H., Haan, C.T., Nofziger, D.L., 1993. An approach toestimating uncertainties in modeling transport of solutes throughsoils. Journal of Contaminant Hydrology (12), 35–50.
Copyright © 2022 FDOKUMEN