Stimulation of fecal bacteria in ambient waters by experimental inputs of organic and inorganic...
13
This article appeared in a journal published by Elsevier. The attached copy is furnished to the author for internal non-commercial research and education use, including for instruction at the authors institution and sharing with colleagues. Other uses, including reproduction and distribution, or selling or licensing copies, or posting to personal, institutional or third party websites are prohibited. In most cases authors are permitted to post their version of the article (e.g. in Word or Tex form) to their personal website or institutional repository. Authors requiring further information regarding Elsevier’s archiving and manuscript policies are encouraged to visit: http://www.elsevier.com/authorsrights
-
Upload
independent -
Category
Documents
-
view
0 -
download
0
Transcript of Stimulation of fecal bacteria in ambient waters by experimental inputs of organic and inorganic...

This article appeared in a journal published by Elsevier. The attachedcopy is furnished to the author for internal non-commercial researchand education use, including for instruction at the authors institution
and sharing with colleagues.
Other uses, including reproduction and distribution, or selling orlicensing copies, or posting to personal, institutional or third party
websites are prohibited.
In most cases authors are permitted to post their version of thearticle (e.g. in Word or Tex form) to their personal website orinstitutional repository. Authors requiring further information
regarding Elsevier’s archiving and manuscript policies areencouraged to visit:
http://www.elsevier.com/authorsrights
Author's personal copy
Stimulation of fecal bacteria in ambient waters byexperimental inputs of organic and inorganic phosphorus
Elizabeth A. Chudoba a, Michael A. Mallin a,*, Lawrence B. Cahoon b, Stephen A. Skrabal c
aCenter for Marine Science, University of North Carolina Wilmington, Wilmington, NC 28409, United StatesbDepartment of Biology and Marine Biology, University of North Carolina Wilmington, Wilmington, NC 28403, United StatescDepartment of Chemistry and Biochemistry, University of North Carolina Wilmington, Wilmington, NC 28403, United States
a r t i c l e i n f o
Article history:
Received 10 October 2012
Received in revised form
19 March 2013
Accepted 21 March 2013
Available online 6 April 2013
Keywords:
Fecal bacteria
Nutrients
Microzooplankton grazing
Dilutions
Bacterial growth rate
a b s t r a c t
Fecal microbial pollution of recreational and shellfishing waters is a major human health
and economic issue. Microbial pollution sourced from stormwater runoff is especially
widespread, and strongly associated with urbanization. However, non-point source
nutrient pollution is also problematic, and may come from sources different from fecal-
derived pollution (i.e. fertilization of farm fields, lawns and gardens, and ornamental
urban areas). Fecal bacteria require nutrients; thus the impact of such nutrient loading on
survival and abundance of fecal coliform bacteria in ambient waters was experimentally
investigated in a constructed wetland in coastal North Carolina, USA. A series of nutrient-
addition bioassays testing impacts of inorganic and organic nitrogen and phosphorus
demonstrated that additions of neither organic nor inorganic nitrogen stimulated fecal
coliform bacteria. However, phosphorus additions provided significant stimulation of fecal
coliform growth at times; on other occasions such additions did not. Dilution bioassays
combined with nutrient additions were subsequently devised to assess potential impacts
of microzooplankton grazing on the target fecal bacteria populations. Results demon-
strated grazing to be a significant bacterial reduction factor in 63% of tests, potentially
obscuring nutrient effects. Thus, combining dilution experiments with nutrient addition
bioassays yielded simultaneous information on microzooplankton grazing rates on fecal
bacteria, fecal bacterial growth rates, and nutrient limitation. Overall, when tested against
a non-amended control, additions of either organic or inorganic phosphorus significantly
stimulated fecal coliform bacterial growth on 50% of occasions tested, with organic
phosphorus generally providing greater stimulation. The finding of significant phosphorus
stimulation of fecal bacteria indicates that extraneous nutrient loading can, at times,
augment the impacts of fecal microbial pollution of shellfishing and human contact
waters.
ª 2013 Elsevier Ltd. All rights reserved.
1. Introduction
Coastal areas are highly important ecologically and econom-
ically due to their biodiversity, critical biotic habitats, human
recreational opportunities and seafood production. These at-
tributes also make coastal areas attractive for human devel-
opment. Urbanization has led to decreased water quality in
coastal regions due to ecosystem impacts from nutrient
* Corresponding author. Tel.: þ1 910 962 2358; fax: þ1 910 962 2410.E-mail address: [email protected] (M.A. Mallin).
Available online at www.sciencedirect.com
journal homepage: www.elsevier .com/locate/watres
wat e r r e s e a r c h 4 7 ( 2 0 1 3 ) 3 4 5 5e3 4 6 6
0043-1354/$ e see front matter ª 2013 Elsevier Ltd. All rights reserved.http://dx.doi.org/10.1016/j.watres.2013.03.047

Author's personal copy
loading to waterways, and human health issues from micro-
bial pollution. Microbial pollution comes from inputs of fecal
bacteria, viruses and protozoans; the fecal coliform bacteria
count (FC) is the most commonly used indicator of microbial
pathogen abundance for freshwater and shellfish standards.
Fecal coliform bacteria are a group of organisms origi-
nating in the intestinal tract of humans and other animals
(Murr et al., 1995). Esherichia, usually Escherichia coli, comprises
about 90% of the fecal coliforms. Fecalmicrobes enter ambient
waterways through point and nonpoint sources. Point sources
include industrial and municipal wastewater treatment plant
effluents and failing septic systems (Chigbu et al., 2004;
Cahoon et al., 2006; Lewis et al., 2007). Nonpoint sources
include wildlife manure, pet manure in developed areas, and
runoff from farm animal feedlots (Chigbu et al., 2004; Mallin
et al., 2000; Whitlock et al., 2002; Mallin and Cahoon, 2003;
Holland et al., 2004). Fecal coliform bacteria are not well
adapted to the aquatic environment, and most bacteria die
within hours to days of entering the aquatic environment,
(Evison, 1988) although in cases of sewage spills or runoff large
numbers may persist in sediments (Mallin et al., 2007; Fries
et al., 2008). Decline of water column counts depends on
several abiotic factors; in freshwater systems, temperature
and solar radiation are the two of the most important factors
responsible for the decline in bacteria in the water column
(Murr et al., 1995).
Biotic factors that decrease fecal counts in water are pre-
dation by microzooplankton and competition (Chigbu et al.,
2005). Microzooplankton communities include protozoa and
small metazoa, and play a significant role in connecting the
microbial food web to higher trophic levels. Due to their small
size microzooplankton feed on smaller sized particles
including bacteria, and make that biomass available to higher
trophic levels (Landry and Hasset, 1982; Vaque et al., 1992).
Field experiments in a New Zealand study showed that
microzooplankton communities, mainly heterotrophic fla-
gellates and ciliates, could exert a grazing pressure on bacte-
rial communities (James et al., 1996). Bacterial growth rates
were not lower than in other places, however, suggesting that
other factors such as substrate availability may be an impor-
tant controlling factor in bacterial growth rates (James et al.,
1996). The role of microzooplankton grazing upon fecal bac-
teria has been understudied, but a few studies have suggested
that grazing is a major means of fecal bacteria removal
(Enzinger and Cooper, 1976; Menon et al., 2003).
Some other factors influencing bacterial survival include
sedimentation, osmotic effects, and pH (Murr et al., 1995).
Large quantities of fecal bacteria can settle into the sediments
and remain viable for several weeks (Jeng et al., 2005; Fries
et al., 2008); therefore disturbances that resuspend the sedi-
ments, such as storms or boat passage, can increase fecal
coliform counts (Mallin et al., 2007; Toothman et al., 2009).
Fecal coliforms can grow within the sediments, where they
are sheltered from solar irradiance and predation and pre-
sumably find a nutrient-enhanced environment (Toothman
et al., 2009).
Many of the tidal creek watersheds in the southeastern
United States are sites of intense human development. Fecal
coliform counts have been significantly and positively corre-
lated to human population and urban/suburban development
factors in tidal creek watersheds, primarily a result of loss of
natural land cover and increased impervious surface leading
to enhanced stormwater runoff (Mallin et al., 2000; Holland
et al., 2004; Sanger et al., 2011). Loss of vegetation stemming
fromurbanization reduces the retention of nutrients (nitrogen
(N) and phosphorus (P)) on riparian land and increases N and P
loading to water bodies (Lewis et al., 2007; Sanger et al., 2011).
Lawn, garden and agricultural fertilizers are a source of (non-
sewage derived) nutrient loading to receiving water systems.
Nutrients, especially nitrogen (N) and phosphorus (P), are
biologically necessary for fecal bacteria survival (Kirchman,
1994). Increases in nutrient loading to streams can stimulate
not only algal productivity but bacterial abundances, poten-
tially including coliform bacteria sourced from leaking or
overflowing sewers (McFeters and Stuart, 1972; Lewis et al.,
2007). Lawn, garden and agricultural fertilizers increase
stream P and N concentrations without adding fecal bacteria.
Phosphate mining wastes would also increase P loading to
aquatic systems without adding fecal bacteria.
Mallin et al. (2004) found that in blackwater streams and
rivers natural field bacteria responded to P additions, sug-
gesting a potential P limitation. Natural bacteria have a greater
need for P as opposed to N, structurally as well as for ATP
(Kirchman, 1994); experiments using non-fecal bacteria have
shown stimulation from P additions but not N additions
(Chrzanowski et al., 1995; Sundareshwar et al., 2003).
Toothman et al. (2009) found that fecal bacteria in creek sed-
iments are usually not N or P limited, but in areas where
sediment P concentrations are low, experimental additions of
P significantly stimulated fecal bacterial abundances. In a
sewage effluent-enriched creek Surbeck et al. (2010) suggested
a die-off threshold below 70 mg/L of soluble P for E. coli and
enterococci. Therefore, P is predicted to increase the activity
and biomass of bacteria, either directly or indirectly (Morris
and Lewis, 1992). Though fecal coliform bacteria are not very
well adapted for aquatic living, nutrient additions can in-
crease the chance of survival and extend their survival time
(Murr et al., 1995).
Due to the health hazards to humans, fecal bacteria are a
major issue in recreational water systems as well as shell-
fishing areas, especially in drainages with high urbanization.
The purpose of this study was to determine if the addition of
nutrients, N and P, to water from field sites increased the
survivability of the fecal coliform bacteria in fresh water
samples. The hypotheses were:
� The addition of phosphorus will increase the survivability
more than nitrogen, or phosphorus and nitrogen together in
fresh water because of the high phosphorus requirements
by bacteria.
� Organic nutrients will have more effect on survivability
than inorganic nutrients because organic nutrients also
provide a carbon substrate.
To accomplish these goals nutrient addition bioassays and
dilution experiments were performed on water samples taken
from systems impacted by human development and thus
receiving fecal bacterial loading. Ancillary physical, chemical
and biological data were collected concurrently with water
collections to improve interpretation of the results.
wat e r r e s e a r c h 4 7 ( 2 0 1 3 ) 3 4 5 5e3 4 6 63456
Author's personal copy
2. Methods
2.1. Site description
The test area was in the JEL Wade Wetland, a constructed
wetland located in the City of Wilmington, NC. The wetland
drains an area of approximately 238 ha that consists primarily
of suburban development. The facility covers an area of
approximately 4.7 ha consisting of 2.3 ha of wetland, 0.77 ha of
open water and 1.4 ha of uplands (Fig. 1). The wetland was
designed to treat the first 2.5 cm of rainfall from the drainage
basin (Mallin et al., 2012). The outflowing water from the
wetland enters Hewletts Creek, which is a tidal creek
impacted by elevated fecal bacterial counts and algal blooms
(Mallin et al., 2000, 2007). The site for the water collections is
located at inflow 1 (Fig. 1).
2.2. Sample collection
Water samples were collected from the wetland inflow in a
25 L carboy. The carboy was first washed with a 10% bleach
solution, left for about an hour and rinsed with water, and
then rinsed again in the field with sample water. The carboy
was filled to the top and kept out of sunlight until returned to
the lab. Temperature, conductivity, salinity, dissolved oxygen,
pH and turbidity measurements were measured on site using
a YSI 6820 Multiparameter Water Quality Probe (sonde) linked
to a YSI 650 MDS display unit. Samples were not scheduled to
be taken corresponding to rain events, but rain events were
documented if they occurred within 1 week before sampling.
2.3. Nutrient analysis
A 125 mL bottle was used to collect unfiltered water samples
from the carboy for total nitrogen and phosphorus analysis.
Three 50 mL sub-samples were filtered through a 0.7 mm Mil-
lipore membrane filter and filtrate was collected in a glass
container to obtain a composite nutrient sample. This filtrate
was then poured into another 125 mL bottle, and used to
analyze inorganic N and P. Samples were frozen until
analyzed. Orthophosphate and nitrate were analyzed by
running the filtered samples through a segmented flow Bran-
Luebbe AutoAnalyzer, following APHA method 4120 B (APHA,
2005). Total N and total P were analyzed from the unfiltered
samples. A persulphate digestion method using an autoclave
(Valderrama, 1981) was utilized, with digested samples then
analyzed using the AutoAnalyzer as above. Organic nutrient
concentrations were computed by subtracting the inorganic N
and P from the total N and P concentrations.
The carboy was also subsampled for dissolved organic
carbon (DOC) analysis for samples collected from Septem-
bereNovember 2011. Water was drawn from the subsamples
using a syringe; the syringe was rinsed twice with sample
water and then the third volume was used for analysis. Once
60 mL was in the syringe, a pre-combusted 47 mm glass fiber
filter was placed in the filter unit. The first 40 mL through the
filter were discarded and the last 20 mL was collected into a
glass vial containing 100 mL of 6 M HCl. This vial was refrig-
erated until analyzed. The samples were then analyzed in a
Shimadzu TOC 5050A analyzer. Another DOC sample was
taken after 20 days of incubation and analyzed by the same
method above, to assess carbon uptake over time.
2.4. Biological analysis
Biochemical oxygen demand (BOD) was used to determine the
amount of labile organic material available for microbial
consumption in water samples collected SeptembereNo-
vember 2011. Method 5210 B (APHA, 2005) for 5-day BOD test
(BOD5) was used, with the exception that samples were not
seeded and pH was not adjusted.
2.5. Fecal coliform (FC) analysis
The FC analysis procedure followed Method 9222B (APHA,
2005) for total fecal coliforms. Samples bottles were shaken
vigorously and either 100 mL or 10 mL samples were then
poured into a sterile filtration funnel using a graduated cyl-
inder or a pipette. Filters were then placed in sterile petri
dishes with an absorbent pad containing approximately 2 mL
of MFC media. Dishes were then placed in 2 zip lock bags and
incubated in a water bath at 44.5 �C for 24 h. Individual dark
blue colonies formed after incubation representing colony
forming units (CFU)were counted.White or light pink colonies
were not considered fecal coliform colonies and were not
counted. All glassware used in the filtration process was
washed in DI water, soaked in an acid bath for at least 8 h and
autoclaved for 15 min at 121 �C.
2.6. Time-course bioassays
Two preliminary time course bioassays were run to assess the
peak FC concentrations and determine an appropriate dura-
tion for the bioassays. In the first bioassay, begun September
17, 2009, subsamples were taken every few days for 21 days
total. In the second bioassay, begun January 12, 2010, sub-
samples were taken every few days for 15 days. Organic nu-
trients at a final concentration of 1.5 mg N or P/L were used for
Fig. 1 e Map of the JEL Wade wetland. The boundary is
defined as the dark gray line and the sample site is inflow 1
indicated by IN1.
wat e r r e s e a r c h 4 7 ( 2 0 1 3 ) 3 4 5 5e3 4 6 6 3457
Author's personal copy
the treatment bottles in each of the bioassays. The bottles
were placed on a shaker rack inside a covered fume hood to
block out ambient light (as were all subsequent bioassays).
The rack was set to shake constantly.
2.7. Phosphorus concentration bioassay experiment
A bioassay was set up with different concentrations of P as
sodium beta-glycerophosphate (C3H7O6PNa2) to assess the
minimum concentration at which organic P has an effect on
the survivability of FC. This concentration was then used in
the following nutrient bioassay experiments. There were 6
treatment groups, with triplicates of each, used in this
experiment: a control of no additions, and additions of 100 mg/
L, 200 mg/L, 500 mg/L, 1000 mg/L and 1500 mg/L of organic P. The
bioassay was carried out in 1 L autoclaved glass bottles. After
the initial fecal coliform filtration, sub-samples were filtered
daily for five days. This bioassaywas begun September 7, 2010.
2.8. Mixed nutrient bioassay experiments
A set of bioassays was performed to analyze the effect of
organic N and P inputs on FC. There were four treatment
groups: a control, N enrichment, P enrichment, and N þ P
enrichment. Each of these treatments was set up in 1-l bottles
in triplicate, making 12 bottles total. The organic N stock so-
lution was made with urea (CH4N2O) and the organic P stock
solution wasmade as previously described. After the initial FC
samples were taken, organic nutrients were added to the
bottles as follows: nothing was added to the control bottles,
organic N was added to raise the concentration by 200 mg N/L,
organic P was added to raise the concentration by 100 mg P/L,
and the N þ P treatment consisted of 200 mg N/L of urea and
100 mg-P/L of beta-glycerophosphate. Note that these addi-
tions were made as such regardless of what the ambient
nutrient concentrations were. After the initial fecal coliform
sample, the treatments were sampled and filtered following
the same methods daily for five days.
A set of bioassays was also performed using inorganic
nutrients. They were set up using the same procedure as
before but with sodium nitrate (NaNO3) used as the inorganic
N and potassium phosphate (K2HPO4) used as the inorganic P.
Treatments were as above; control of no additions, N treat-
ment of 200 mg N/L, P treatment of 100 mg P/L, and a combined
N þ P. The organic and inorganic nutrient bioassays were run
simultaneously and utilized the same source water sample
from the wetland inflow. These mixed organic and inorganic
nutrient addition bioassays were performed on July 26, 2010,
October 5, 2010 and January 18, 2011.
2.9. Dilution assays
A set of dilution assays (Landry and Hasset, 1982) was done to
determine if microzooplankton grazing upon FC was a con-
founding issue in the nutrient addition experiments. These
types of assays involve making a series of dilutions of the raw
water to reducemicroorganism density in the samples, which
in turn reduces the encounter rate of microzooplankton
grazers and their bacterial prey. The dilution method makes
two assumptions: 1) the growth of individual FC bacteria is not
directly affected by the total bacterial population, thus
reduced bacteria density will not cause a change in growth
rate in the remaining bacteria cell; 2) the probability of a
bacteria cell being consumed is a direct function of the rate of
encounter of consumers with bacterial prey cells (Landry and
Hasset, 1982).
Four different treatments were used in this dilution
experiment; 100% unfiltered water, 75% unfiltered water and
25% filtered, 50% of each unfiltered and filtered, and 25%
unfiltered and 75% filtered water. To produce the filtered
water, half of the sample water from the carboy was filtered
through a Whatman 0.45 mm filter and collected in a clean
container. Once the dilution experiment was set up, each
dilution sample was sub-sampled for FC initially (Day 1) and
the next day (Day 2). This one-day incubation period was
selected to minimize bottle effects from longer incubation
periods and provide sufficient time for bacterial growth to be
detectable. Assays were set up in 500 mL autoclaved glass
containers. The first dilution experiment was done on March
30, 2011 without the addition of any nutrients and used five
replicates per treatment. A following dilution experiment was
run on May 17, 2011 with a combination of 1 mg/L carbon
(dextrose) and 100 mg/L of inorganic phosphorus added to each
bottle, and each treatment had four replicates. The next seven
dilution experiments were designed to compare inorganic to
organic P additions. For the inorganic P treatment, 100 mg/L of
potassium phosphate was added and to the organic P treat-
ment, 100 mg/L of beta-glycerophosphate was added. These
experiments were performed with samples collected on June
7, 2011, July 18, 2011, August 29, 2011, September 21, 2011,
October 4, 2011, October 19, 2011, and October 28, 2011. Lastly,
a dilution was set up comparing inorganic and organic N on
November 9, 2011. This was set up the same way as the
phosphorus comparison, but used 200 mg/L of urea for the
organic N and the same concentration as sodium nitrate for
the inorganic N treatment.
After the data were collected, the one-day growth rates for
each dilution bottle were calculated using the following
formula:
Specific growth rate (m, day�1) ¼ LN((Day 2 concentration/
Day 1 concentration)).
The specific growth rates were then plotted against Day 1
concentrations for each bottle.
2.10. Statistical analysis
To identify significant treatment effects for the nutrient bio-
assays, the data were first log-transformed, as FC data are
typically log-normal, and then an analysis of variance
(ANOVA) test was used to determine if the means of the
treatment groups were equal. Significant ANOVA results were
followed by treatment rankings by the least significant dif-
ference procedure (LSD).
Fecal coliform growth rates were plotted and regressed
against initial cell densities to interpret results of the dilution
experiments. If the slope of the line was statistically signifi-
cantly negative, then microzooplankton grazing was pre-
sumed to reduce fecal coliform concentrations. Thus, predation
could confound the impact of nutrient additions on bacterial growth
or survival, and controlling for grazer impacts would more clearly
wat e r r e s e a r c h 4 7 ( 2 0 1 3 ) 3 4 5 5e3 4 6 63458

Author's personal copy
demonstrate potential nutrient limitation of FC. For dilution bio-
assays with samples collected on September 21, October 4,
October 19, October 28 and November 9, non-amended con-
trols were also included to test for significant nutrient stim-
ulation (using ANOVA). To further investigate potential
factors influencing these experiments, regressions were
calculated for the grazing rate coefficients and growth rate
coefficients plotted against temperature, pH, turbidity, initial
N/P ratio, and initial DOC concentrations (from Tables 1 and
2); additionally grazing rate coefficients, growth rate co-
efficients, N/P ratios and log of the initial FC concentrations
were plotted against total rainfall from the previous 24-hr.
Significance levels of p < 0.05 were utilized for all statistical
tests. Statistical analyses were run using SAS Institute JMP v
6.0 software.
3. Results
3.1. Time course bioassays
FC samples were taken every few days during lengthy in-
cubations in preliminary time-course experiments, to deter-
mine peak FC concentrations and the appropriate length of
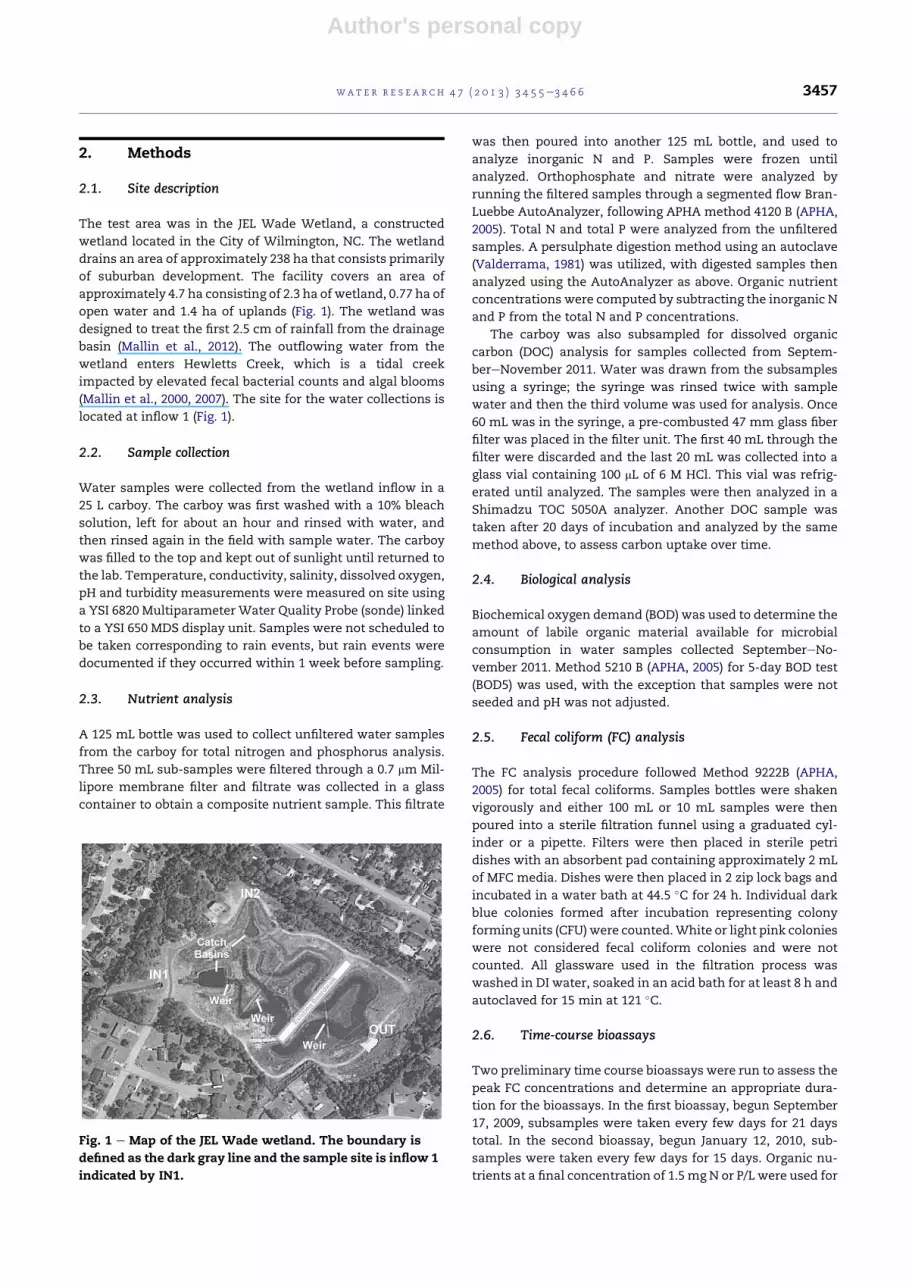
the subsequent bioassays. In the September 2009 bioassay
peak levels appeared on day 12, but a significant difference
( p¼ 0.0004) between the control and P treatments occurred on
day 4 (Fig. 2). In the January 2010 bioassay peak levels
appeared on day 3 (Fig. 3). Given these results, five days was
chosen as the appropriate length of future bioassays to
determine if there was a significant difference among treat-
ment groups. Both time course bioassays also indicated a
significant ( p < 0.01) stimulatory effect of organic P on fecal
bacterial counts compared to control.
3.2. Phosphorus addition bioassay results
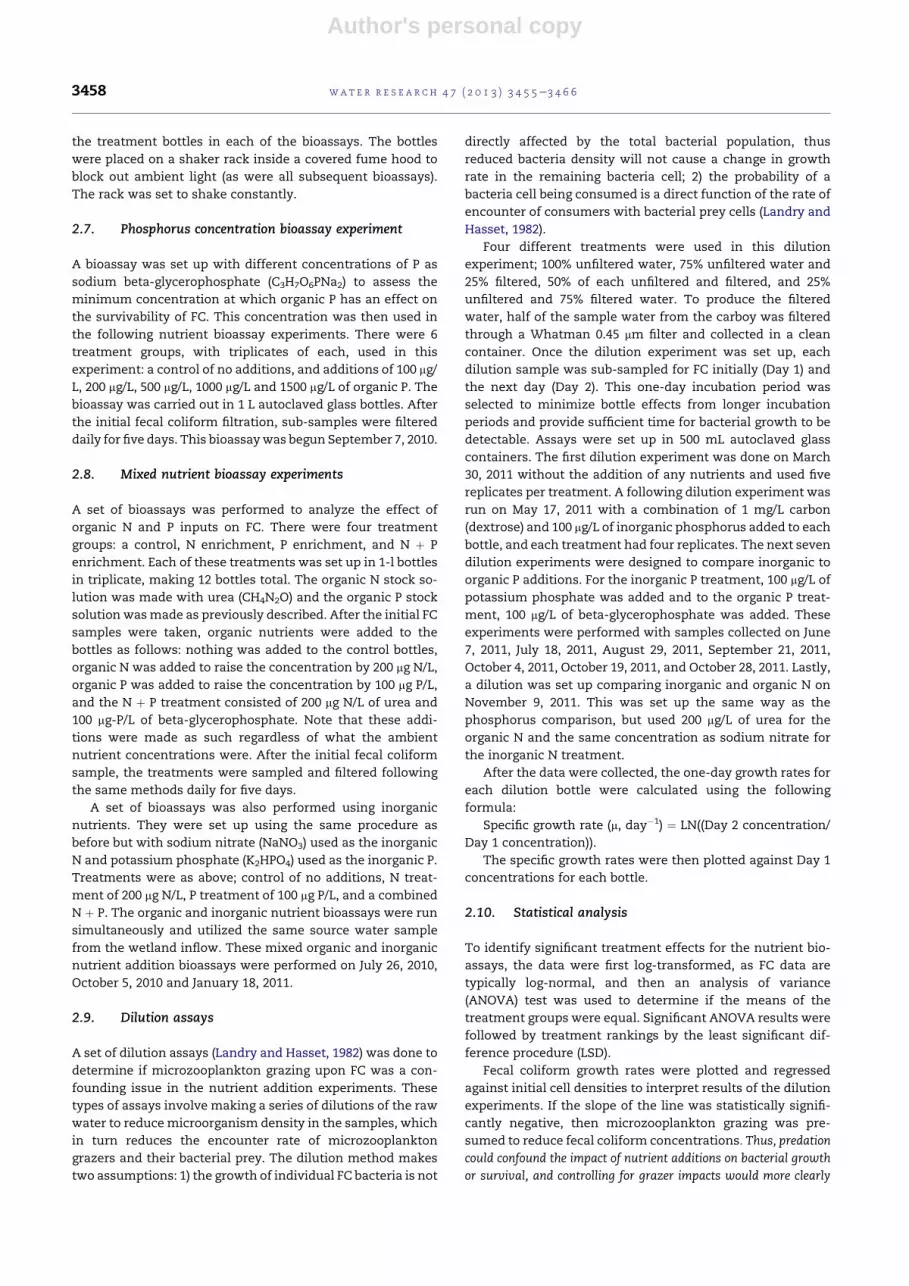
In the September 7, 2010 organic P addition bioassay (Fig. 4),
the first day FC counts were low with a geometric mean of 16
CFU/100 mL. From day 1 to day 5 the FC in the control group
decreased from 16 to 1 CFU/100 mL. However all of the P
enriched treatments increased in FC count fromday 1 to day 3,
and then decreased after day 3. Each of these treatment
groups was found to be significantly greater than the control
group between day 2 and 5 ( p < 0.05) (Fig. 4). Since all of these
treatments had an effect on FC growth, the P addition was
subsequently kept at 100 mg-P/L to keep the addition as close
as possible to previously-measured in situ wetland inflow
concentrations (Mallin et al., 2012).
3.3. Mixed nutrient addition bioassay results
In the July 26, 2010 JEL Wade Wetland bioassay the initial
geometric mean of 5 random samples was 2120 CFU/100 mL.
FC counts decreased from day 1 to day 3 and none of the
treatment groupswere significantly different than the control.
Similarly both the October 5, 2010 and January 18, 2011 mixed
nutrient bioassays had highest counts in the initial samples
and lower counts from that point, with no significant differ-
ence ( p > 0.05) among treatments and control (not shown).
3.4. Dilution experiment results
The results of the dilution experiments were interpreted as
follows: The grazing rate coefficient, g, is the slope of the
regression line for the unfiltered samples and the various di-
lutions. If the regression for the slope is significant and
negative, then grazing is having a significant effect on
Table 1 e Initial nutrient concentrations (as mg-N or P/L) for the phosphorus addition bioassay, the mixed nutrientbioassays and the dilutions for the JEL Wade Wetland, N/P molar ratio and percent of total N or P as nitrate ororthophosphate (note ammonium not available).
Experiments Dates Inorg. N (mg/L) Inorg. P (mg/L) Total N (mg/L) Total P (mg/L) Molar N/P ratio % Inorg. N % Inorg. P
P bioassay 9/7/10 130.2 0.6 810.6 31.0 58 16 2
Mixed Nut. 7/26/10 28.0 0.2 2104.2 105.4 44 <1 <1
Bioassays 10/5/10 47.2 7.8 1153.6 34.1 75 4 23
1/18/11 88.6 4.7 651.0 21.7 66 14 21
Dilution Exps. 3/30/11 5.2 16.4 1267.0 151.6 19 <1 11
5/17/11 20.0 5.9 608.0 28.8 47 3 20
6/7/11 5.3 1.2 807.0 36.9 48 1 3
7/18/11 4.5 0.3 698.0 38.8 40 1 1
9/21/11 e e 590.2 29.8 44 e e
10/4/11 64.3 0.2 618.9 8.7 158 10 2
10/19/11 61.6 4.0 454.6 26.4 38 14 15
10/28/11 75.0 0.2 541.9 15.5 77 14 2
11/9/11 42.3 0.2 425.0 7.4 127 10 2
Table 2 e Dissolved organic carbon (DOC) andbiochemical oxygen demand (BOD) data for the dilutionexperiments.
BOD (mg/L) 9/21/11 10/4/11 10/19/11 10/28/11 11/9/11
5-day 1.2 0.8 1.4 0.9 1.2
20-day 3.9 2.7 3.2 2.5 1.9
DOC (mg/L)
Initial 3.04 4.34 3.91 3.37 2.47
20-day 4.46 1.47 2.9 2.32
wat e r r e s e a r c h 4 7 ( 2 0 1 3 ) 3 4 5 5e3 4 6 6 3459
Author's personal copy
bacterial growth rates, potentially compromising limiting-
nutrient experiments. The growth rate coefficient, m0, which
is the y-intercept, represents the growth rate without grazing,
i.e. if all grazers were filtered out, theoretically. If the growth
rate coefficient is positive, then active growth of the fecal
microbes in that treatment occurred, and if the growth rate
coefficient is negative, it means that even in the absence of
grazing the fecal bacterial population declined. Net FC growth
rate, m, then equals growth minus grazing for the average
initial FC concentration:
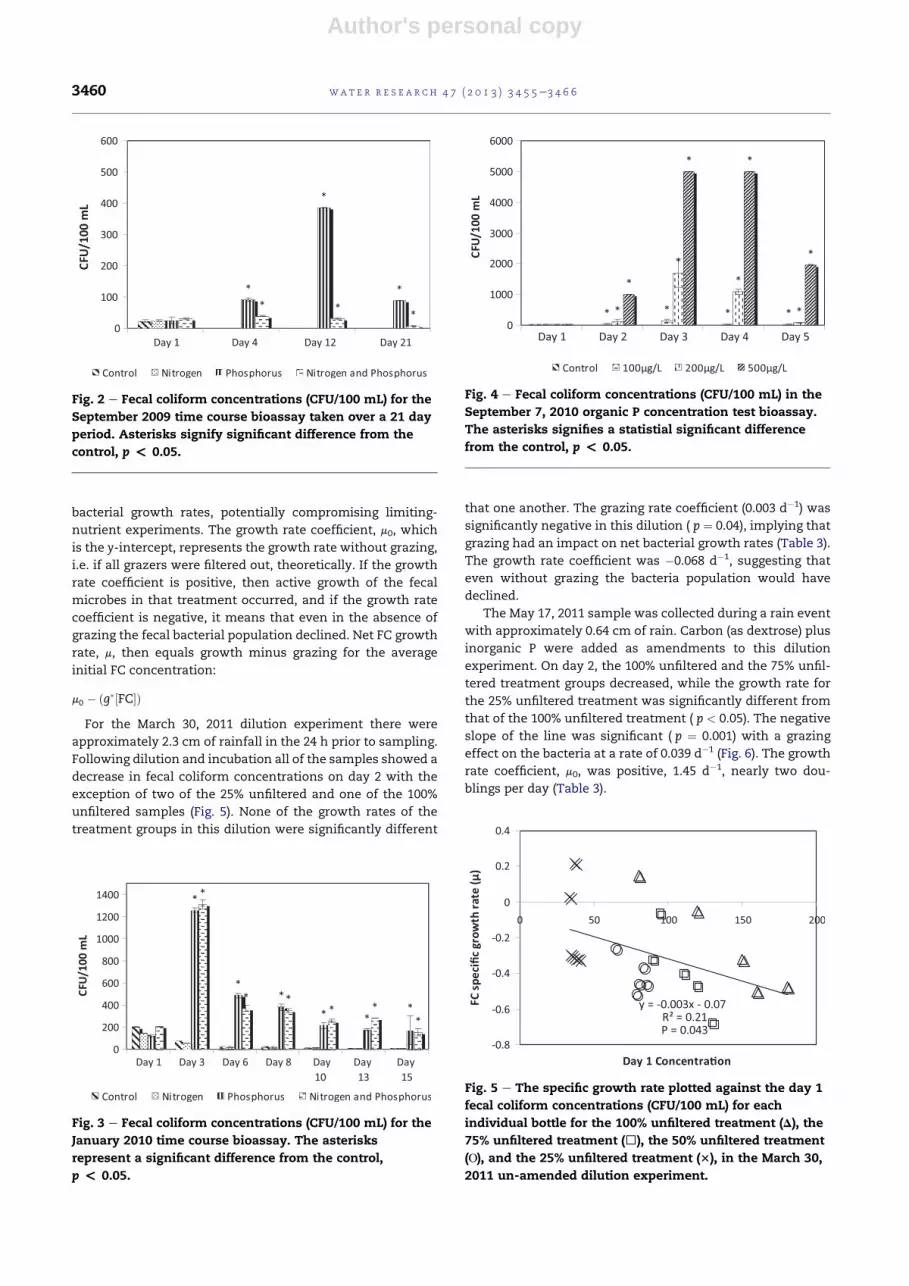
m0 � ðg�½FC�ÞFor the March 30, 2011 dilution experiment there were
approximately 2.3 cm of rainfall in the 24 h prior to sampling.
Following dilution and incubation all of the samples showed a
decrease in fecal coliform concentrations on day 2 with the
exception of two of the 25% unfiltered and one of the 100%
unfiltered samples (Fig. 5). None of the growth rates of the
treatment groups in this dilution were significantly different
that one another. The grazing rate coefficient (0.003 d�1) was
significantly negative in this dilution ( p ¼ 0.04), implying that
grazing had an impact on net bacterial growth rates (Table 3).
The growth rate coefficient was �0.068 d�1, suggesting that
even without grazing the bacteria population would have
declined.
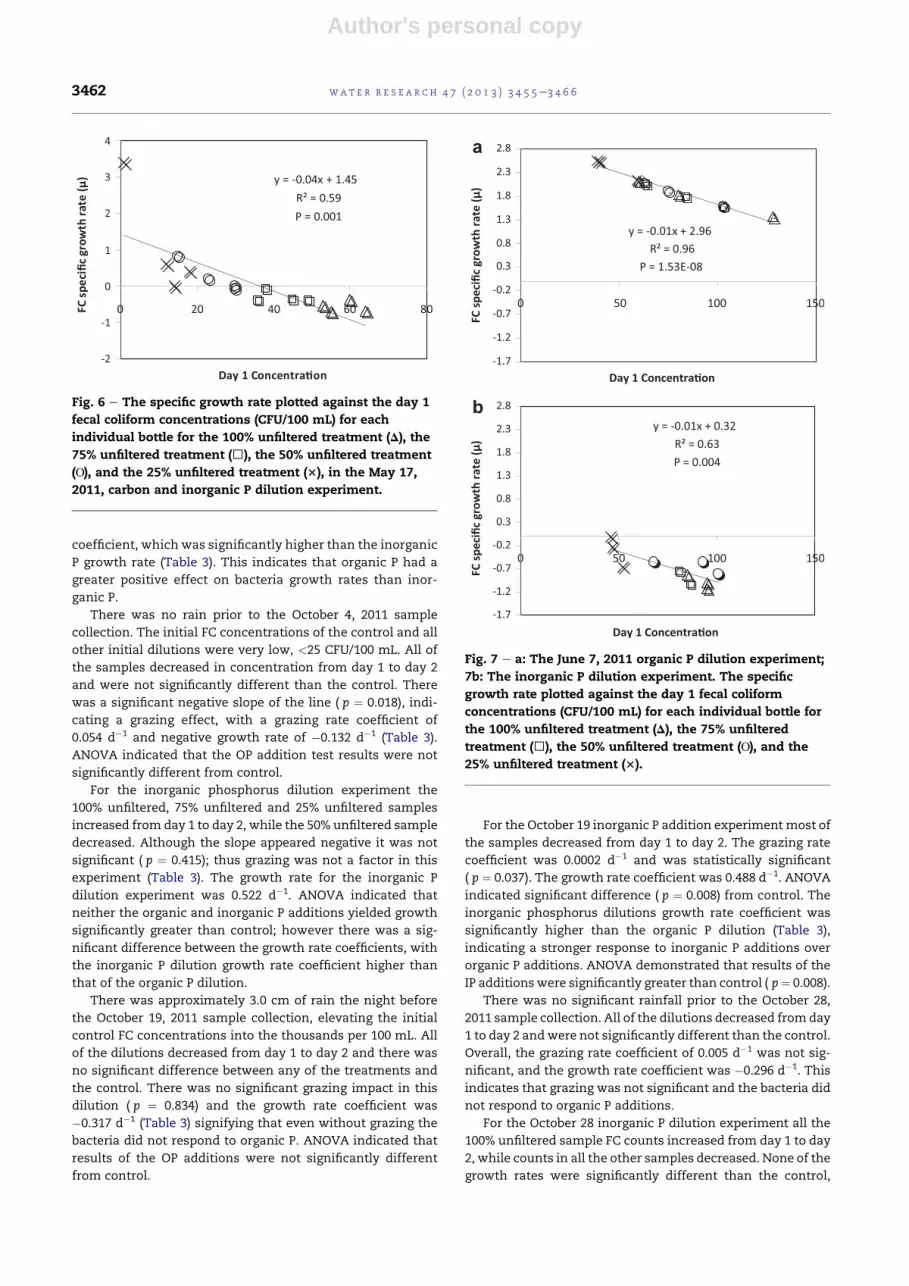
The May 17, 2011 sample was collected during a rain event
with approximately 0.64 cm of rain. Carbon (as dextrose) plus
inorganic P were added as amendments to this dilution
experiment. On day 2, the 100% unfiltered and the 75% unfil-
tered treatment groups decreased, while the growth rate for
the 25% unfiltered treatment was significantly different from
that of the 100% unfiltered treatment ( p < 0.05). The negative
slope of the line was significant ( p ¼ 0.001) with a grazing
effect on the bacteria at a rate of 0.039 d�1 (Fig. 6). The growth
rate coefficient, m0, was positive, 1.45 d�1, nearly two dou-
blings per day (Table 3).
Fig. 3 e Fecal coliform concentrations (CFU/100 mL) for the
January 2010 time course bioassay. The asterisks
represent a significant difference from the control,
p < 0.05.
Fig. 4 e Fecal coliform concentrations (CFU/100 mL) in the
September 7, 2010 organic P concentration test bioassay.
The asterisks signifies a statistial significant difference
from the control, p < 0.05.
Fig. 5 e The specific growth rate plotted against the day 1
fecal coliform concentrations (CFU/100 mL) for each
individual bottle for the 100% unfiltered treatment (D), the
75% unfiltered treatment (), the 50% unfiltered treatment
(O), and the 25% unfiltered treatment (3), in the March 30,
2011 un-amended dilution experiment.
Fig. 2 e Fecal coliform concentrations (CFU/100 mL) for the
September 2009 time course bioassay taken over a 21 day
period. Asterisks signify significant difference from the
control, p < 0.05.
wat e r r e s e a r c h 4 7 ( 2 0 1 3 ) 3 4 5 5e3 4 6 63460

Author's personal copy
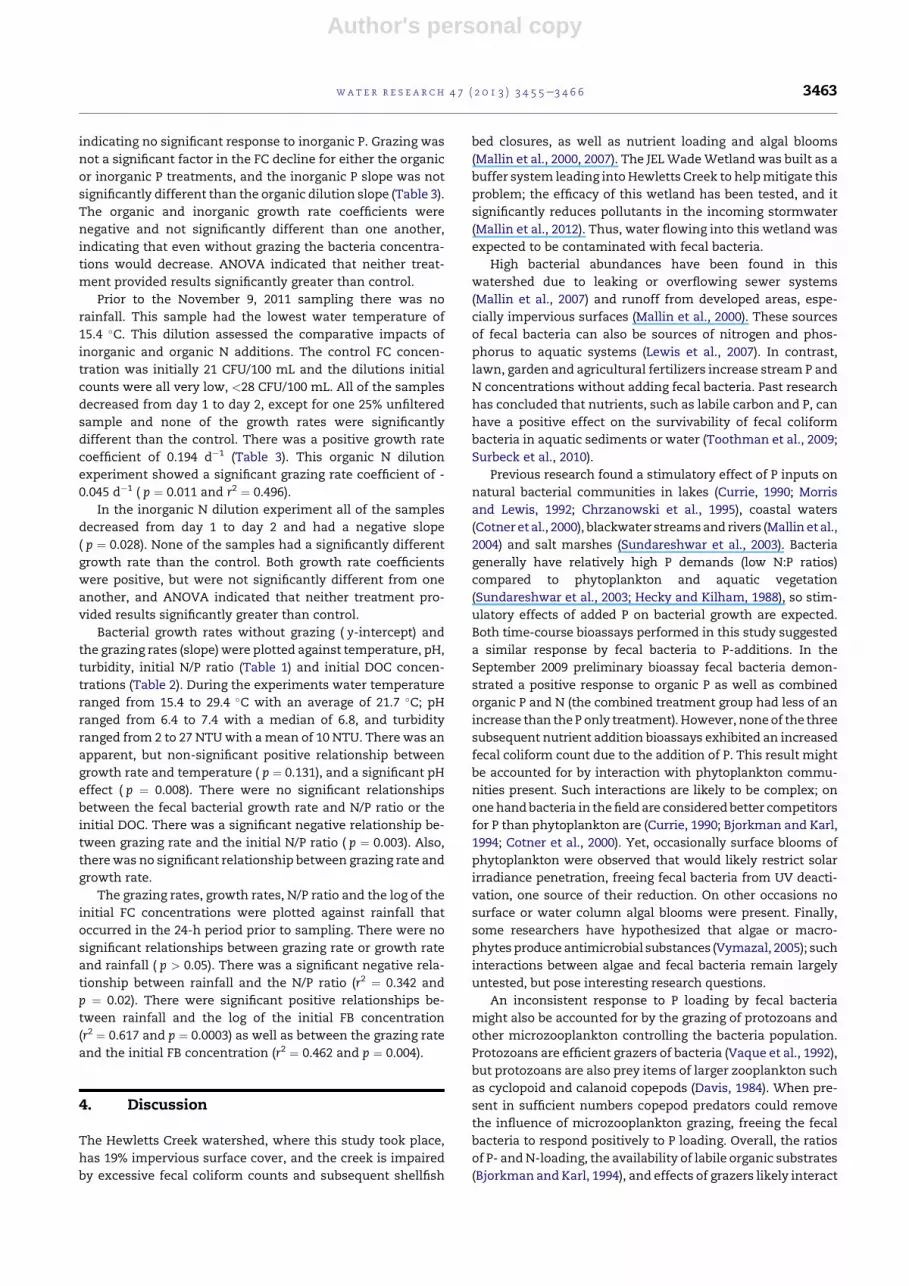
The June 7, 2011 experiment was the first dilution experi-
ment to compare the effects of inorganic and organic P addi-
tions. There was approximately 2.5 cm of rainfall in the 24 h
prior to collection and no field physical data were collected.
The FC counts in the organic phosphorus additions increased
dramatically from day 1 to day 2; on day 2 all of the samples
were too numerous to count with the 100 mL filtered samples.
The counts were conservatively estimated to be approxi-
mately 500 CFU/100 mL for these samples. Due to this esti-
mation of the day 2 concentration this dilution had a low
standard deviation, which accounted for the r2 ¼ 0.964. There
was a highly significant negative slope ( p-value ¼ 1.54 � 10�5)
with a grazing rate coefficient of 0.013 d�1, and a positive
growth rate coefficient of 2.96 d�1 (Fig. 7a; Table 3).
In contrast to the organic P additions, all of the fecal coli-
form counts for the inorganic P addition treatment decreased
from day 1 to day 2. The growth rate coefficient was 0.317 d�1.
The graph showed a significant ( p ¼ 0.004) negative slope of
the line, signifying a significant grazing rate coefficient of
0.013 d�1 (Fig. 7b). Both the organic and inorganic P dilution
experiments showed a significant negative slope, which in-
dicates a grazing effect, and the slopes were not significantly
different from one another. The projected growth rates
without grazing for the organic dilution and inorganic dilution
were both positive, but the organic P treatment growth rate
was significantly greater than the inorganic treatment growth
rate ( p < 0.05).
There was no rain in the 24 h prior to the July 18, 2011
dilution sample collection. This sample had the highest
starting temperature of all the experiments at 29.4 �C. In this
dilution experiment the fecal coliform counts in the 100%
unfiltered samples decreased from day 1 to day 2, and all the
other counts increased. The 100% unfiltered treatment group
was significantly different than the other treatments
( p < 0.05). For the organic phosphorus treatment dilution
experiment there was a significant negative slope (r2 ¼ 0.864
and p ¼ 1.19 � 10�5), with a grazing rate coefficient of 0.02 d�1,
and a positive growth rate coefficient of 2.01 d�1.
For the inorganic P addition experiment, the counts in the
100% unfiltered dilution samples also decreased from day 1 to
day 2, while counts in the other dilution samples increased.
The 100% unfiltered treatment group was significantly
different than the other treatment groups ( p < 0.05). The
growth rate coefficient was 1.43 d�1. The r2 value for the
inorganic P dilution was 0.748 ( p ¼ 0.0002), indicating a sig-
nificant slope with a positive grazing rate coefficient of
0.022 d�1. Both the inorganic and organic dilution experiments
showed significant negative regressions, and therefore a
grazing effect, but slopes were not significantly different than
one another. The organic and inorganic treatments both had
positive growth rate coefficients, but the organic dilution
growth rate coefficient was significantly higher than the
inorganic dilution, implying that organic P additions increased
bacteria growth rates more than inorganic P (Table 3).
Rainfall prior to the September 21, 2011 sample collection
yielded an accumulation of about 1.3 cm of rain. Initial control
FC concentration was 236 CFU/100 mL and increased slightly
to day 2. All of the samples had a positive growth rate and the
100% unfiltered and 75% unfiltered samples were significantly
higher than the control ( p < 0.05). The grazing rate coefficient
of 0.002 was not significant ( p ¼ 0.472), indicating grazing was
not affecting the bacteria growth rates. The growth rate co-
efficient was 0.841 d�1; suggesting the bacteria growth rate
was positively influenced by the organic P addition.
For the inorganic P dilution all of the samples decreased in
concentration from day 1 to day 2. The regression was not
significant, implying that grazing did not impact the growth
rate of the fecal coliform bacteria in this experiment. There
was a negative growth rate coefficient of �0.645 d�1, but
ANOVA showed that both organic and inorganic P additions
significantly stimulated bacterial growth relative to control
( p¼ 0.0001). The organic P dilution had a positive growth rate
Table 3 e Statistical results from the dilution experiments. The intercept represents the growth rate coefficient. The sloperepresents the grazing rate coefficient. The P value indicates a significant negative slope ( p < 0.05), which indicates thatgrazing is a potentially confounding fecal bacteria removal factor. A significant difference between intercepts represents adifference in organic or inorganic nutrients on the intercept (growth rate coefficient). NA [ not applicable or not done,NSD [ no significant difference between treatment and control.
Dilution Treatment Intercept Slope P Sig. negativeslope
Sig. betweenintercepts
ANOVA results trt.vs control
3/30/11 None �0.068 �0.003 0.04 Yes NA NA
5/17/11 C and Inorg. P 1.45 �0.039 0.001 Yes NA NA
6/7/11 Organic P 2.96 �0.013 1.54E-08 Yes Yes NA
6/7/11 Inorganic P 0.317 �0.013 0.004 Yes NA
7/18/11 Organic P 2.01 �0.020 1.20E-05 Yes Yes NA
7/18/11 Inorganic P 1.43 �0.022 0.0002 Yes NA
9/21/11 Organic P 0.84 0.002 0.472 No Yes OP > CON
9/21/11 Inorganic P �0.645 0.001 0.514 No IP > CON
10/4/11 Organic P �0.132 �0.054 0.018 Yes Yes NSD
10/4/11 Inorganic P 0.522 �0.040 0.415 No NSD
10/19/11 Organic P �0.317 1.00E-05 0.834 No Yes NSD
10/19/11 Inorganic P 0.488 �0.0002 0.037 Yes IP > CON
10/28/11 Organic P �0.296 �0.005 0.583 No No NSD
10/28/11 Inorganic P �0.023 0.002 0.858 No NSD
11/9/11 Organic N 0.194 �0.045 0.01 Yes No NSD
11/9/11 Inorganic N 0.395 �0.059 0.028 Yes NSD
wat e r r e s e a r c h 4 7 ( 2 0 1 3 ) 3 4 5 5e3 4 6 6 3461
Author's personal copy
coefficient, which was significantly higher than the inorganic
P growth rate (Table 3). This indicates that organic P had a
greater positive effect on bacteria growth rates than inor-
ganic P.
There was no rain prior to the October 4, 2011 sample
collection. The initial FC concentrations of the control and all
other initial dilutions were very low, <25 CFU/100 mL. All of
the samples decreased in concentration from day 1 to day 2
and were not significantly different than the control. There
was a significant negative slope of the line ( p ¼ 0.018), indi-
cating a grazing effect, with a grazing rate coefficient of
0.054 d�1 and negative growth rate of �0.132 d�1 (Table 3).
ANOVA indicated that the OP addition test results were not
significantly different from control.
For the inorganic phosphorus dilution experiment the
100% unfiltered, 75% unfiltered and 25% unfiltered samples
increased from day 1 to day 2, while the 50% unfiltered sample
decreased. Although the slope appeared negative it was not
significant ( p ¼ 0.415); thus grazing was not a factor in this
experiment (Table 3). The growth rate for the inorganic P
dilution experiment was 0.522 d�1. ANOVA indicated that
neither the organic and inorganic P additions yielded growth
significantly greater than control; however there was a sig-
nificant difference between the growth rate coefficients, with
the inorganic P dilution growth rate coefficient higher than
that of the organic P dilution.
There was approximately 3.0 cm of rain the night before
the October 19, 2011 sample collection, elevating the initial
control FC concentrations into the thousands per 100 mL. All
of the dilutions decreased from day 1 to day 2 and there was
no significant difference between any of the treatments and
the control. There was no significant grazing impact in this
dilution ( p ¼ 0.834) and the growth rate coefficient was
�0.317 d�1 (Table 3) signifying that even without grazing the
bacteria did not respond to organic P. ANOVA indicated that
results of the OP additions were not significantly different
from control.
For the October 19 inorganic P addition experiment most of
the samples decreased from day 1 to day 2. The grazing rate
coefficient was 0.0002 d�1 and was statistically significant
( p ¼ 0.037). The growth rate coefficient was 0.488 d�1. ANOVA
indicated significant difference ( p ¼ 0.008) from control. The
inorganic phosphorus dilutions growth rate coefficient was
significantly higher than the organic P dilution (Table 3),
indicating a stronger response to inorganic P additions over
organic P additions. ANOVA demonstrated that results of the
IP additionswere significantly greater than control ( p¼ 0.008).
There was no significant rainfall prior to the October 28,
2011 sample collection. All of the dilutions decreased fromday
1 to day 2 andwere not significantly different than the control.
Overall, the grazing rate coefficient of 0.005 d�1 was not sig-
nificant, and the growth rate coefficient was �0.296 d�1. This
indicates that grazing was not significant and the bacteria did
not respond to organic P additions.
For the October 28 inorganic P dilution experiment all the
100% unfiltered sample FC counts increased from day 1 to day
2, while counts in all the other samples decreased. None of the
growth rates were significantly different than the control,
Fig. 6 e The specific growth rate plotted against the day 1
fecal coliform concentrations (CFU/100 mL) for each
individual bottle for the 100% unfiltered treatment (D), the
75% unfiltered treatment (), the 50% unfiltered treatment
(O), and the 25% unfiltered treatment (3), in the May 17,
2011, carbon and inorganic P dilution experiment.
a
b
Fig. 7 e a: The June 7, 2011 organic P dilution experiment;
7b: The inorganic P dilution experiment. The specific
growth rate plotted against the day 1 fecal coliform
concentrations (CFU/100 mL) for each individual bottle for
the 100% unfiltered treatment (D), the 75% unfiltered
treatment (), the 50% unfiltered treatment (O), and the
25% unfiltered treatment (3).
wat e r r e s e a r c h 4 7 ( 2 0 1 3 ) 3 4 5 5e3 4 6 63462
Author's personal copy
indicating no significant response to inorganic P. Grazing was
not a significant factor in the FC decline for either the organic
or inorganic P treatments, and the inorganic P slope was not
significantly different than the organic dilution slope (Table 3).
The organic and inorganic growth rate coefficients were
negative and not significantly different than one another,
indicating that even without grazing the bacteria concentra-
tions would decrease. ANOVA indicated that neither treat-
ment provided results significantly greater than control.
Prior to the November 9, 2011 sampling there was no
rainfall. This sample had the lowest water temperature of
15.4 �C. This dilution assessed the comparative impacts of
inorganic and organic N additions. The control FC concen-
tration was initially 21 CFU/100 mL and the dilutions initial
counts were all very low, <28 CFU/100 mL. All of the samples
decreased from day 1 to day 2, except for one 25% unfiltered
sample and none of the growth rates were significantly
different than the control. There was a positive growth rate
coefficient of 0.194 d�1 (Table 3). This organic N dilution
experiment showed a significant grazing rate coefficient of -
0.045 d�1 ( p ¼ 0.011 and r2 ¼ 0.496).
In the inorganic N dilution experiment all of the samples
decreased from day 1 to day 2 and had a negative slope
( p ¼ 0.028). None of the samples had a significantly different
growth rate than the control. Both growth rate coefficients
were positive, but were not significantly different from one
another, and ANOVA indicated that neither treatment pro-
vided results significantly greater than control.
Bacterial growth rates without grazing ( y-intercept) and
the grazing rates (slope) were plotted against temperature, pH,
turbidity, initial N/P ratio (Table 1) and initial DOC concen-
trations (Table 2). During the experiments water temperature
ranged from 15.4 to 29.4 �C with an average of 21.7 �C; pHranged from 6.4 to 7.4 with a median of 6.8, and turbidity
ranged from 2 to 27 NTUwith amean of 10 NTU. There was an
apparent, but non-significant positive relationship between
growth rate and temperature ( p ¼ 0.131), and a significant pH
effect ( p ¼ 0.008). There were no significant relationships
between the fecal bacterial growth rate and N/P ratio or the
initial DOC. There was a significant negative relationship be-
tween grazing rate and the initial N/P ratio ( p ¼ 0.003). Also,
therewas no significant relationship between grazing rate and
growth rate.
The grazing rates, growth rates, N/P ratio and the log of the
initial FC concentrations were plotted against rainfall that
occurred in the 24-h period prior to sampling. There were no
significant relationships between grazing rate or growth rate
and rainfall ( p > 0.05). There was a significant negative rela-
tionship between rainfall and the N/P ratio (r2 ¼ 0.342 and
p ¼ 0.02). There were significant positive relationships be-
tween rainfall and the log of the initial FB concentration
(r2 ¼ 0.617 and p ¼ 0.0003) as well as between the grazing rate
and the initial FB concentration (r2 ¼ 0.462 and p ¼ 0.004).
4. Discussion
The Hewletts Creek watershed, where this study took place,
has 19% impervious surface cover, and the creek is impaired
by excessive fecal coliform counts and subsequent shellfish
bed closures, as well as nutrient loading and algal blooms
(Mallin et al., 2000, 2007). The JELWadeWetland was built as a
buffer system leading into Hewletts Creek to helpmitigate this
problem; the efficacy of this wetland has been tested, and it
significantly reduces pollutants in the incoming stormwater
(Mallin et al., 2012). Thus, water flowing into this wetland was
expected to be contaminated with fecal bacteria.
High bacterial abundances have been found in this
watershed due to leaking or overflowing sewer systems
(Mallin et al., 2007) and runoff from developed areas, espe-
cially impervious surfaces (Mallin et al., 2000). These sources
of fecal bacteria can also be sources of nitrogen and phos-
phorus to aquatic systems (Lewis et al., 2007). In contrast,
lawn, garden and agricultural fertilizers increase stream P and
N concentrations without adding fecal bacteria. Past research
has concluded that nutrients, such as labile carbon and P, can
have a positive effect on the survivability of fecal coliform
bacteria in aquatic sediments or water (Toothman et al., 2009;
Surbeck et al., 2010).
Previous research found a stimulatory effect of P inputs on
natural bacterial communities in lakes (Currie, 1990; Morris
and Lewis, 1992; Chrzanowski et al., 1995), coastal waters
(Cotner et al., 2000), blackwater streamsand rivers (Mallin et al.,
2004) and salt marshes (Sundareshwar et al., 2003). Bacteria
generally have relatively high P demands (low N:P ratios)
compared to phytoplankton and aquatic vegetation
(Sundareshwar et al., 2003; Hecky and Kilham, 1988), so stim-
ulatory effects of added P on bacterial growth are expected.
Both time-course bioassays performed in this study suggested
a similar response by fecal bacteria to P-additions. In the
September 2009 preliminary bioassay fecal bacteria demon-
strated a positive response to organic P as well as combined
organic P and N (the combined treatment group had less of an
increase than theP only treatment). However, noneof the three
subsequent nutrient addition bioassays exhibited an increased
fecal coliform count due to the addition of P. This result might
be accounted for by interaction with phytoplankton commu-
nities present. Such interactions are likely to be complex; on
onehandbacteria in thefield are consideredbetter competitors
for P than phytoplankton are (Currie, 1990; Bjorkman and Karl,
1994; Cotner et al., 2000). Yet, occasionally surface blooms of
phytoplankton were observed that would likely restrict solar
irradiance penetration, freeing fecal bacteria from UV deacti-
vation, one source of their reduction. On other occasions no
surface or water column algal blooms were present. Finally,
some researchers have hypothesized that algae or macro-
phytes produce antimicrobial substances (Vymazal, 2005); such
interactions between algae and fecal bacteria remain largely
untested, but pose interesting research questions.
An inconsistent response to P loading by fecal bacteria
might also be accounted for by the grazing of protozoans and
other microzooplankton controlling the bacteria population.
Protozoans are efficient grazers of bacteria (Vaque et al., 1992),
but protozoans are also prey items of larger zooplankton such
as cyclopoid and calanoid copepods (Davis, 1984). When pre-
sent in sufficient numbers copepod predators could remove
the influence of microzooplankton grazing, freeing the fecal
bacteria to respond positively to P loading. Overall, the ratios
of P- andN-loading, the availability of labile organic substrates
(Bjorkman and Karl, 1994), and effects of grazers likely interact
wat e r r e s e a r c h 4 7 ( 2 0 1 3 ) 3 4 5 5e3 4 6 6 3463

Author's personal copy
to regulate bacterial production and biomass, and may vary
among runoff events. Conditions favoring high phytoplankton
production may not simultaneously favor high bacterial pro-
duction (Currie, 1990), and vice versa, particularly as grazing
and remineralization ratesmay also differentially regulate the
bacterial and phytoplankton communities.
A high abundance of protozoans is expected in the JEL
WadeWetland, since it is a stormwater treatment system and
receives nutrient and fecal bacteria loading, supports natural
bacteria and phytoplankton communities, and has a high
abundance of macrophyte vegetation to serve as substrata for
protozoans (Mallin et al., 2012). The dilution experiments
performed in this study were designed to assess whether or
not grazing was having an effect on the fecal bacteria growth
rates. There are a few assumptions that correspond to the
dilution set-up; the first is a bottle effect. A time frame of 24 h
was chosen as a reasonable time frame to run these dilutions.
Protozoans are small and less sensitive to bottle effects than
larger, more mobile zooplankton. A shorter time frame would
run the risk of not seeing a significant effect of the grazing and
growth rates. The second assumption is that the protozoans
consume prey in proportion to prey density, when there is a
natural level of available food (Landry and Hasset, 1982). In
this study the initial fecal bacteria concentrationsweremostly
within the previously observed (Mallin et al., 2012) levels, and
therefore the protozoan grazing rate should be positively
correlated to bacterial concentrations. There was one experi-
ment in which the initial bacteria concentration was on the
high end of the normal level, and may show a saturation of
food available to the protozoans.
The dilution experiments in this study indicated there was
a grazing effect in this wetland, with ten out of the total 16
dilution experiments demonstrating a statistically significant
grazing rate. No significant difference was seen in the grazing
rates between the organic and inorganic nutrient dilution
experiments. The dilutions in which a grazing effect was not
seen occurred in September and October, when water tem-
peratures started to decline. This suggests a positive rela-
tionship between grazing and temperature, although such a
relationship was not statistically significant in this study.
There was a significant negative relationship between the
grazing rate and the initial N/P ratio. A lower N/P ratio creates
a positive environment for fecal bacteria growth due to rela-
tively higher P content; bacteria have greater structural and
energetic requirements for P compared with N (Kirchman,
1994; Lewis et al., 2007). This suggests that the grazing rate
is more dependent on the available bacteria population than
the nutrients available to the system. In all but one of the di-
lutions in which a grazing effect was observed, there was also
a positive y-intercept, indicating a projected positive growth
rate in the absence of grazing.
None of the six treatments involving nitrogen additions
supported significant stimulation compared to control. How-
ever, of the regular nutrient addition bioassay experiments,
three of six experiments showed significant organic P stimu-
lation over control. Of the dilution experiments that utilized a
control treatment, one of the four showed organic P stimula-
tion over control, and significant inorganic P stimulation over
control was found in two of seven experiments. Based on
growth rates, P stimulation was suggested in several of the
combined dilution/nutrient addition experiments. Three of
the six organic P dilutions had a positive growth rate coeffi-
cient, and were significantly higher than the inorganic P
growth rate coefficient. Four of the six inorganic P dilutions
had a positive growth rate coefficient, but only two of those
were significantly higher than the organic P dilution. Overall,
organic P additions had a stronger effect on the fecal bacteria
growth rate than the inorganic P additions. The negative
growth rates were observed in the cooler months, March,
September andOctober. These results are consistentwith past
findings that a strong biological response to nutrient additions
occurred from spring through fall, with little response in the
winter (Mallin et al., 2004).
A possible carbon limitation effect could also be a factor
hindering fecal coliform bacteria growth in the dilution ex-
periments in which a negative growth rate was observed.
Modeling in urban creek water by Surbeck et al. (2010) sug-
gested that fecal bacteria require [DOC] at greater than 7 mg/L
to survive and grow. Our DOC data were limited to five dates,
but levels were below that suggested threshold, between 2.5
and 4.3 mg/L (Table 2). Also, the low BOD5 concentrations
(Table 2) are indicative that the carbon is not particularly
labile. With the additional phosphorus added, labile carbon
may have become limiting to further fecal bacterial growth.
Further study of the relationship between BOD, carbon, and
fecal coliform bacteria may give a more comprehensive un-
derstanding of how bacteria respond in this environment.
Wetlands are a constantly changing environment, and
there are many different factors that may influence bacteria
growth at any given time. Bacteria have been found to be
sensitive to salinity and temperature in the aquatic environ-
ment (Murr et al., 1995). However, in this study the water was
fresh entering the wetland and there was a non-significant
relationship between temperature and bacterial growth
rates. Growth rate was positively related to pH, however. We
can speculate that the positive pH effect was indirect in that
highest pH values were in the spring and summer growing
season when algal and macrophyte biomass was highest. The
increased productivity may have led to increased excretion of
DOC, a bacterial substrate. Rainfall may have been an
important factor determining grazing rates. Fecal bacteria
concentrations increase after rain events then gradually
decrease over time (Jeng et al., 2005; Mallin et al., 2007). As the
initial fecal bacteria concentrations increased after a rain, the
grazing rates subsequently increased due to more prey avail-
ability in the system and increased encounter rates, reflected
by the positive correlation between grazing rates and initial
bacteria concentrations. Rainfall also increases the nutrient
load into this wetland from the watershed (Mallin et al., 2012),
increasing the nutrient availability for the bacteria and other
protozoan prey (i.e. phytoplankton) growth.
5. Conclusions
Many factors influence the survival or decline of fecal bacteria
in the aquatic environment; this study showed that additions
of organic and to a lesser extent inorganic phosphorus can
positively influence fecal bacterial survival and growth.
Increased fertilizer-based nutrient loading into water bodies
wat e r r e s e a r c h 4 7 ( 2 0 1 3 ) 3 4 5 5e3 4 6 63464
Author's personal copy
coupled with leaking or overflowing sewer or septic systems
has the potential to magnify negative impacts on water
quality and increase water recreation or shellfish closure
times due to fecal contamination. Thus, these impacts on
water quality can have significant economic as well as human
health effects on watersheds subject to such pollution
combinations.
Acknowledgements
We thank the City of Wilmington Stormwater Services
Department and the Ahuja Academy of Water Quality for
funding support, and the UNCW Graduate School, the UNCW
Center for Marine Sciences, and the Southeastern Estuarine
Research Society for research and conference travel grants to
EC. For field and laboratory assistance we thank Lauren
Bohrer, Mary Haltom and Matthew McIver.
r e f e r e n c e s
APHA, 2005. Standard Methods for the Examination of Water andWaste Water, twenty first ed. American Public HealthAssociation, Washington, DC.
Bjorkman, K., Karl, D.M., 1994. Bioavailability of inorganic andorganic phosphorus compounds to natural assemblages ofmicroorganisms in Hawaiian coastal waters. Marine EcologyProgress Series 111, 265e273.
Cahoon, L.B., Hales, J.C., Carey, E.S., Loucaides, S., Rowland, K.R.,Nearhoof, J.E., 2006. Shellfish closures in southeast BrunswickCounty, North Carolina: septic tanks vs. storm-water runoff asfecal coliform sources. Journal of Coastal Research 22 (2),319e327.
Chigbu, P., Gordon, S., Strange, T.R., 2004. Influence of inter-annual variations in climatic factors on fecal coliform levels inMississippi Sound. Water Research 38 (20), 4341e4352.
Chigbu, P., Gordon, S., Strange, T.R., 2005. Fecal coliform bacteriadisappearance rates in a North-Central Gulf of Mexico estuary.Estuarine Coastal and Shelf Science 65 (1e2), 309e318.
Chrzanowski, T.H., Sterner, R.W., Elser, J.J., 1995. Nutrientenrichment and nutrient regeneration stimulatebacterioplankton growth. Microbial Ecology 29 (3), 221e230.
Cotner, J.B., Sada, R.H., Bootsma, H., Johengen, T., Cavaletto, J.F.,Gardner, W.S., 2000. Nutrient limitation of bacteria in floridaBay. Estuaries 23, 611e620.
Currie, D.J., 1990. Large-scale variability and interactions amongphytoplankton, bacterioplankton, and phosphorus. Limnologyand Oceanography 35, 1437e1455.
Davis, C.C., 1984. Planktonic copepods. In: Steidinger, K.A.,Walker, L.M. (Eds.), Marine Plankton Life Cycle Strategies. CRCPress, Boca Raton, Fl, pp. 67e91.
Enzinger, R.M., Cooper, R.C., 1976. Role of bacteria and protozoa inthe removal of Escherichia coli from estuarine waters. Appliedand Environmental Microbiology 31 (5), 758e763.
Evison, L.M., 1988. Comparative studies on the survival ofindicator organisms and pathogens in fresh and sea water.Water Science Technology 20 (11e12), 309e315.
Fries, J.S., Characklis, G.W., Noble, R.T., 2008. Sediment-waterexchange of Vibrio sp. and fecal indicator bacteria:implications for persistence and transport in the Neuse RiverEstuary, North Carolina, USA. Water Research 42 (4e5),941e951.
Hecky, R.E., Kilham, P., 1988. Nutrient limitation of phytoplanktonin freshwater and marine environments: a review of recentevidence on the effects of enrichment. Limnology andOceanography 33, 796e822.
Holland, A.F., Sanger, D.M., Gawle, C.P., Lerberg, S.B.,Santiago, M.S., Riekerk, G.H.M., Zimmerman, L.E., Scott, G.I.,2004. Linkages between tidal creek ecosystems and thelandscape and demographic attributes of their watersheds.Journal of Experimental Marine Biology and Ecology 298 (2),151e178.
James, M.R., Hall, J.A., Barrett, D.P., 1996. Grazing by protozoa inmarine coastal and oceanic ecosystems off New Zealand. NewZealand Journal of Marine and Freshwater Research 30 (3),313e324.
Jeng, H.C., England, A.J., Bradford, H.B., 2005. Indicator organismsassociated with stormwater suspended particles andestuarine sediment. Journal of Environmental Science andHealth 40, 779e791.
Kirchman, D.L., 1994. The uptake of inorganic nutrients byheterotrophic bacteria. Microbial Ecology 28 (2), 255e271.
Landry, M.R., Hasset, R.P., 1982. Estimating the grazing impact ofmarine micro-zooplankton. Marine Biology 67 (3), 283e288.
Lewis, G.P., Mitchell, J.D., Anderson, C.B., Haney, D.C., Liao, M.,Sargent, K.A., 2007. Urban influences on stream chemistry andbiology in the Big Brushy Creek Watershed, South Carolina.Water Air Soil Pollution 182, 303e323.
Mallin, M.A., Cahoon, L.B., 2003. Industrialized animal productione a major source of nutrient and microbial pollution toaquatic ecosystems. Population and Environment 24, 369e385.
Mallin, M.A., Williams, K.E., Esham, E.C., Lowe, R.P., 2000. Effect ofhuman development on bacteriological water quality incoastal watersheds. Ecological Applications 10 (4), 1047e1056.
Mallin, M.A., McIver, M.R., Ensign, S.H., Cahoon, L.B., 2004.Photosynthetic and heterotrophic impacts of nutrient loadingto blackwater streams. Ecological Applications 14 (3), 823e838.
Mallin, M.A., Cahoon, L.B., Toothman, B.R., Parsons, D.C.,McIver, M.R., Ortwine, M.L., Harrington, R.N., 2007. Impacts ofa raw sewage spill on water and sediment quality in anurbanized estuary. Marine Pollution Bulletin 54 (1), 81e88.
Mallin, M.A., McAuliffe, J., McIver, M.R., Mayes, D., Hanson, M.R.,2012. High pollutant removal efficacy of a large constructedwetland leads to receiving stream improvements. Journal ofEnvironmental Quality 41, 2046e2055.
McFeters, F.A., Stuart, D.G., 1972. Survival of coliform bacteria innatural waters: field and laboratory studies with membrane-filter chambers. Applied Microbiology 24 (5), 805e811.
Menon, P., Billen, G., Servais, P., 2003. Mortality rates ofautochthonous and fecal bacteria in natural aquaticecosystems. Water Research 37, 4151e4158.
Morris, D.P., Lewis, W.M., 1992. Nutrient limitation ofbacterioplankton growth in Lake Dillon, Colorado. Limnologyand Oceanography 37 (6), 1179e1192.
Murr, A.C., Thackston, E.L., Adams, W.R., Speece, R.E., 1995.Modeling of Fecal Coliform Bacteria in the Cumberland RiverNear Nashville. Technical report 44. Environmental and WaterResources Engineering, Vanderbilt University.
Sanger, D., Bergquist, D., Blair, A., Riekerk, G., Wirth, E.,Webster, L., Felber, J., Washburn, T., DiDonato, G.,Holland, A.F., 2011. Gulf of Mexico Tidal Creeks Serve asSentinel Habitats for Assessing the Impact of CoastalDevelopment on Ecosystem Health, vol. 136. NOAA TechnicalMemorandum NOS NCCOS, p. 64.
Sundareshwar, P.V., Morris, J.T., Koepfler, E.K., Forwalt, B., 2003.Phosphorus limitation of coastal ecosystem processes.Science 299 (5606), 563e565.
Surbeck, C.Q., Jiang, S.C., Grant, S.B., 2010. Ecological control offecal indicator bacteria in an urban stream. EnvironmentalScience and Technology 44, 631e637.
wat e r r e s e a r c h 4 7 ( 2 0 1 3 ) 3 4 5 5e3 4 6 6 3465

Author's personal copy
Toothman, B.R., Cahoon, L.B., Mallin, M.A., 2009. Phosphorus andcarbohydrate, limitation of fecal coliform and fecalenteroccoccus within tidal creek sediments. Hydrobiologia636, 401e412.
Valderrama, J.G., 1981. The simultaneous analysis of totalnitrogen and phosphorus in natural waters. Marine Chemistry10 (2), 109e122.
Vaque, D., Pace, M.L., Findlay, S., Lints, D., 1992. Fate of bacterialproduction in a heterotrophic, ecosystem: grazing by protists
and metazoans in the Hudson Estuary. Marine EcologyProgress Series 89, 155e163.
Vymazal, J., 2005. Removal of enteric bacteria in constructedtreatment wetlands with emergent macrophytes: a review.Journal of Environmental Science and Health 40, 1355e1367.
Whitlock, J.E., Jones, D.T., Harwood, V.J., 2002. Identification ofthe sources of fecal coliforms in an urban watershed usingantibiotic resistance analysis. Water Research 36 (17),4273e4282.
wat e r r e s e a r c h 4 7 ( 2 0 1 3 ) 3 4 5 5e3 4 6 63466