Statistics, Knowledge and Governance
22
1 Draft, August 2009 Statistics, Knowledge and Governance (*) Enrico Giovannini Joaquim Oliveira Martins and Michela Gamba (*) Abstract This paper reviews the role of statistical information in economic and political systems. It discusses how the production of knowledge in a decentralized way is fundamentally different from the traditional production of information in a centralized way by National Statistical Offices (NSOs). An empirical case study using data from the Eurobarometer Survey shows that trust in the statistical system is related to trust in governance institutions (government, parliament and EU). A final section discusses different avenues for constructing indicators of societal progress. To be presented at the Conference “Statistics - Investment in the future 2" Prague, 14-15 September 2009 (*) OECD Statistics Directorate. Contact author: [email protected] . The views expressed are those of the authors and do not necessarily reflect those of the OECD or its Member countries.
-
Upload
independent -
Category
Documents
-
view
5 -
download
0
Transcript of Statistics, Knowledge and Governance

1
Draft, August 2009
Statistics, Knowledge and Governance (*)
Enrico Giovannini
Joaquim Oliveira Martins
and
Michela Gamba (*)
Abstract
This paper reviews the role of statistical information in economic and
political systems. It discusses how the production of knowledge in a
decentralized way is fundamentally different from the traditional
production of information in a centralized way by National Statistical
Offices (NSOs). An empirical case study using data from the
Eurobarometer Survey shows that trust in the statistical system is related
to trust in governance institutions (government, parliament and EU). A
final section discusses different avenues for constructing indicators of
societal progress.
To be presented at the Conference
“Statistics - Investment in the future 2" Prague, 14-15 September 2009
(*) OECD Statistics Directorate. Contact author: [email protected]. The views expressed are
those of the authors and do not necessarily reflect those of the OECD or its Member countries.

2
1. Introduction
The functioning of a modern democratic society needs a common knowledge base about
its economic, social and environmental characteristics. The comparison of the evolution
of these characteristics over time and vis-à-vis other nations can highlight risks and
opportunities and inform the public debate about policy actions. It is part of the
governance system.
The importance of information in economic and political processes is widely recognised
by modern theories. This information, coupled with the advancements in Information
and Communication Technologies (ICT) has changed the way in which markets and
societies work. Several studies have analysed the characteristics of the knowledge
society, as well as its impact on the production of official statistics.
In this paper we will try to discuss the role of statistics in building a knowledge society
and improving the democratic control of policy makers. This issue is especially
important because the development of information and communication technologies
(ICT) dramatically reduced the cost of producing statistics: therefore, nowadays a huge
number of organisations are able to produce statistical figures and indices, frequently
picked up by media, just for advocacy purposes and this contributes to create a sense of
“confusion” often reported by citizens about the real state of the economy and of the
society. This “noise” does not help at all citizens to make the best possible choices,
including the electoral ones, and this is not a good thing for the functioning of economic
markets and the democracy.
After reviewing briefly the role of statistical information in economic and political
systems, an empirical case study using data from the Eurobarometer shows that trust in
the statistical system is related to trust in the governance institutions at the national and
the EU level. Then, we illustrate how the production of knowledge is fundamentally
different from the traditional production of information in a centralized way by National
Statistical Offices (NSOs). A final section discusses different avenues for constructing
indicators of societal progress.
2. Role of Statistics in building a Knowledge Society
2.1 Information and Expectations in Economics: a brief overview
In the context of Walrasian equilibrium, economic agents are supposed to not only act
in a perfectly rational way, but to also be fully informed about relevant economic facts,
such as the quality of goods, prices, etc. This assumption has been frequently criticized.
The introduction of asymmetric and incomplete information in economic models
stimulated new approaches in microeconomic, macroeconomic and public economic
analyses. For example, Akerlof (1970), studying the market for car “lemons” (i.e. the
market in which the seller has private information about the quality of goods supplied,
while the buyer has not) demonstrated that, in such a situation, the buyers have to make
an expectation on the quality of the car and that, in equilibrium, only bad quality cars
are sold. Rothschild and Stiglitz (1976) applied this approach to insurance markets and
3
the key common conclusion of these studies is that, under certain assumptions, a bad
allocation of information could lead markets to failure.
Information plays a key role in the formation of expectations. When economic decisions
are to be taken under uncertain conditions, expectations on future or uncertain events
must be formulated, especially on events that are not completely under the control of the
decision maker. In a very general sense, an expectation can be seen as a value coming
from the joint probability distribution of the variables concerning the decision process.
As Lucas (1976) wrote, “at a purely formal level, we know that a rational agent must
formulate a subjective joint probability distribution over all unknown random variables
which impinge on his present and future market opportunities”1.
The problem here is that information is costly. Therefore, it is possible that, in practice,
economic agents do not act as the theory predicts, for example by only looking at mean
values or variance measures. In this case, simpler decision-making procedures (so called
naїve procedures) can be used. For example, a “static expectation”, i.e. an expectation
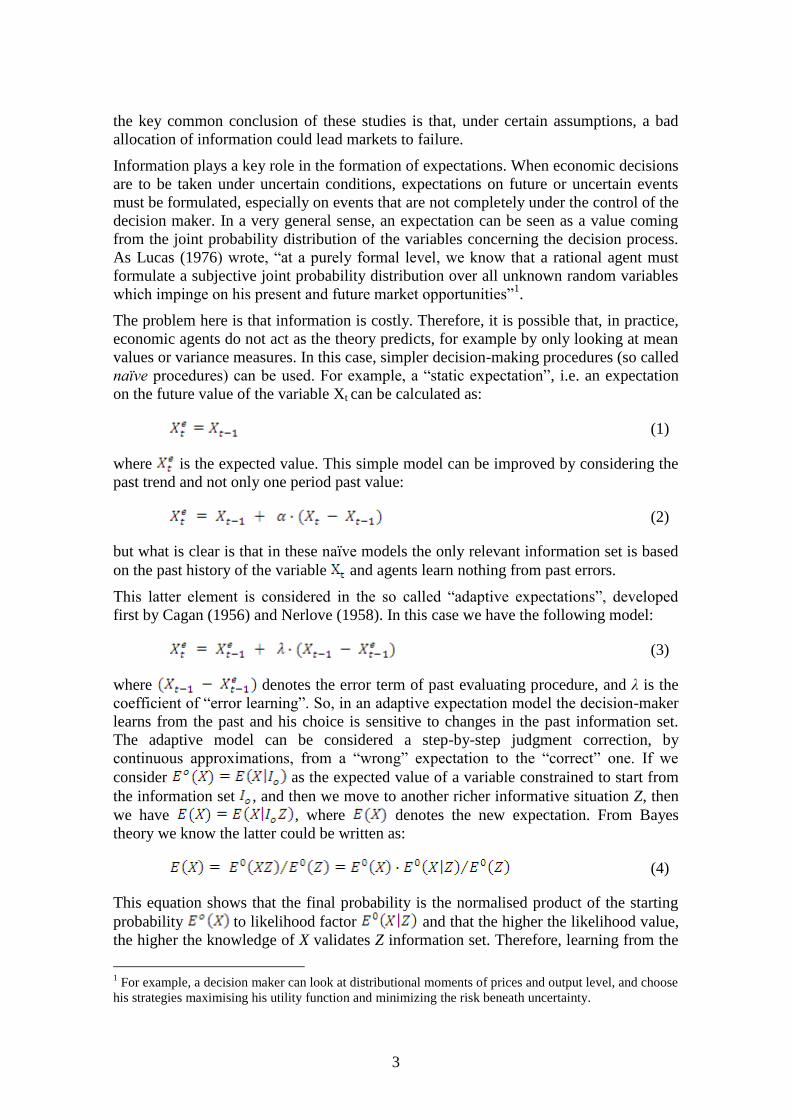
on the future value of the variable Xt can be calculated as:
(1)
where is the expected value. This simple model can be improved by considering the
past trend and not only one period past value:
(2)
but what is clear is that in these naїve models the only relevant information set is based
on the past history of the variable and agents learn nothing from past errors.
This latter element is considered in the so called “adaptive expectations”, developed
first by Cagan (1956) and Nerlove (1958). In this case we have the following model:
(3)
where denotes the error term of past evaluating procedure, and λ is the
coefficient of “error learning”. So, in an adaptive expectation model the decision-maker
learns from the past and his choice is sensitive to changes in the past information set.
The adaptive model can be considered a step-by-step judgment correction, by
continuous approximations, from a “wrong” expectation to the “correct” one. If we
consider as the expected value of a variable constrained to start from
the information set , and then we move to another richer informative situation Z, then
we have , where denotes the new expectation. From Bayes
theory we know the latter could be written as:
(4)
This equation shows that the final probability is the normalised product of the starting
probability to likelihood factor and that the higher the likelihood value,
the higher the knowledge of X validates Z information set. Therefore, learning from the
1 For example, a decision maker can look at distributional moments of prices and output level, and choose
his strategies maximising his utility function and minimizing the risk beneath uncertainty.

4
past is a way by which the past information Io, including past expectations, is enriched
by new information set Z, containing the true value realised in the past.
Based on Muth (1961), the concept of “rational expectations” was introduced in
economic theory by Lucas in the 1970s. Muth considered adaptive process a way of
wasting information, because not all relevant facts are taken into account in that kind of
“step-by-step” process. The forecast based on the adaptive model is therefore
suboptimal, due to the fact that individuals persist in systematic errors2.
In contrast, in rational expectations models, expectations tend to equalise for the same
information set the objective prediction of the theory. Therefore, the subjective
probability distribution, on average, is equivalent to the objective one emerging from
the econometric model that describes the expectations‟ formation process, because a
rational agent exploits all available information, including the model which describes
the interaction among variables.
The most important policy applications of this approach were identified by Lucas
(1975), who included the rational expectations hypothesis into macro-economic models.
His starting point was the work of Grumberg and Modigliani (1954) who suggest that
public predictions could support private ones, warranting their true values. In particular,
they assume that a public prediction is published by a public authority, or by a private
agent with a better information position. The consequence of this distinction is that the
response of individual agents to the publication of a public prediction may actually
increase their predictive abilities. If individuals react to the public prediction, the event
which will actually occur will be different from the one which would have occurred if
no public prediction had been made. The authors also show that the assumption
necessary to enforce public predictive warranty for individuals is that the forecaster
includes in his model all variables relevant for the formation of agents‟ expectations.
In this context, if agents act in a rational way, a policy maker could not make a correct
prediction of the impact of a specific decision using an econometric model based on the
past economic structure without considering how the agents react to the new policy
decision. In fact, agents will internalise the new policy decision in their models and will
change their behaviour, therefore, making the models based on the latter totally
obsolete.3 It is important to note here that expectations may have important
consequences for economic development as Krugman (1991) has shown.4
2 As Friedman (1962) wrote, “individuals are not fools – or at least some of them are not”
3 First, economic policies cannot be based on traditional econometric models, but only on models that
consider the reactions of the agents to policy changes. Second, policies based on fixed and announced
“rules” are better than those based on discretional interventions, because random choices could not be
included in agents‟ expectations, making econometric forecasts undetermined. Lucas then totally reverses
the implications of Modigliani and Grumberg model, due to the fact that for him all agents have the same
information set and the same knowledge of how expectations are formed. 4 Krugman (1991) showed that in a model displaying multiple equilibria a country may be lock-in by
history depending basically in three conditions. When the future is heavily discounted, individuals will
not care much about future actions of other individuals, and this will eliminate the possibility of self-
fulfilling prophecies. In some sense, the greater the impatience, the more individuals will be prisoners of
history. When external economies are small there will not be enough interdependence among decisions
and history also dominates. Another case of strong path-dependence is when an economy adjusts slowly.
If adjustment is slow, factor rewards will be near current levels for a long time whatever the expectations,
so that factor reallocation always follows current returns. Krugman showed that in order to escape from

5
The importance of information and expectations for development provide a rational for
the role of official statistics, which, of course, are integral part of the information set
available to all agents. For example, if there is “confusion” or “noise” among economic
agents about the “true” price level, both for specific products and for the whole basket
of goods and services, this can bring about suboptimal decisions and produce
macroeconomic effects, at least in the short run.
More generally, if economic agents do not trust available statistics, the economic
system can suffer because of this uncertainty5. The connection between the credibility
of official statistics and the functioning of economic markets is extremely important in
modern societies, where media play a key role in influencing public opinion and
expectations about future economic developments. Statistics have been developed to go
beyond what individuals can observe at a reasonable cost and nowadays statistics
produced by public institutions according to high quality standards, developed in an
impartial way, disseminated to all agents at the same time are considered a “public
good”. Some international organisations have a role of watch-dog to verify that key
statistics produced at national level are produced according to internationally agreed
standards.
2.2 Information and the Political system
Information plays an important role not only in economic models, but also in “public
choice” models, in the so called “positive political theory”, based on rational choice
modelling and on analytical conclusions reached by the economic theory. Downs (1957)
first introduced rational models for the political choice of individuals, considering the
election mechanism as a “market” in which politicians supply different political
platforms which are demanded by voters, who have to decide whether and how to vote.
To do that, the generic voter estimates a “party differential”, i.e. the difference between
the expected utility derived from the choice between various (normally two) parties‟
candidates. A voter whose differential between parties is non-zero subsequently takes
into consideration the cost of voting: to vote, the cost of voting must be lower that the
“discounted utility” of voting, calculated using the likelihood that his vote will make a
difference in the election.
Importantly, one of the components of the voting cost is the cost of collecting
information: acquiring information about candidates and policies can be very expensive
and the value derived from this search must be discounted by the fact that the individual
has little impact on the final outcome of the elections. Thus, the citizen is viewed as a
“rational ignorant” and the obvious impact of missing or limited information on
political issues is that the percentage of informed voters in elections could be very little
- not a good thing for democracy.
Downs‟ conclusions are not only important to understand individuals‟ behaviour, but
also to evaluate the nature of political outcomes in a democracy. Hotelling (1929) had
already demonstrated that two political parties competing for the votes of citizens,
such an underdevelopment lock-in, an expectation-driven equilibrium exists when , where r is
the rate of discount, γ the speed of adjustment and β the strength of increasing returns. 5 See Giovannini (2007) for an example of loss of confidence in official statistics based on the case study
of the Euro changeover.

6
whose preferences were spaced along a one dimensional policy space, will converge on
the median voter‟s ideal point. Building on this, Downs observes that a large measure of
ideological consensus is necessary for a stable and effective two-party democracy,
because a lack of information could encourage several parties to take up positions
favoured by large clumps of voters, resulting in political instability.
Wittman (1973) better specifies this process, considering the fact that voters cannot
perfectly monitor and sanction candidates, so the ability of politicians to adapt their own
preferences in response to the voters‟ seems to be a negative function of the voter‟s
awareness. Alesina (1988) argues that convergence between parties‟ electoral
programmes depends on their ability to commit to campaign platforms, which may
depend on the presence of indicators that permit citizens to hold politicians accountable
for their campaign promises. Once they are elected, in the absence of indicators to
monitor if their actions coincide with their campaign platform, parties‟ commitments
during the campaign can be totally ignored afterwards.
McKelvey and Ordeshook (1986a, 1986b) show that the presence of some uninformed
voters does not change equilibrium behaviour. When voters are totally uninformed, the
democratic process ensures equilibrium as if they were totally informed, in the sense
that median voter behaviour will emerge from elections even with limited information
sets. This could suggest that the democratic mechanism is a way to minimise
information costs, in the same way that the perfect market does. As an economic agent
only needs to know the prices of goods he wants to consume or produce, a democratic
voter only needs to know the candidates and the election mechanism6.
The case of incomplete information leads to the introduction of the principal-agent
theory into the political process. Political elections are seen as incomplete contracts
between a principal less informed (the voter) and an agent (the politician) who has to
achieve the principal‟s goals in an incomplete information structure. If a representative
democracy is a form of state in which people have the control of government choice,
through elections voters have the opportunity to achieve four major objectives:
aggregate their personal preferences, making clear to politicians their welfare function;
aggregate dispersed information about the correct political decisions; solve an adverse
selection problem by selecting the best candidates; mitigate moral hazard problems by
holding elected officials accountable for their actions.
The major problem is that, contrary to the principal-agent link in a market, the principal
does not have a proper indicator at a reasonable cost (such as price), that can drive the
politician‟s actions. The most politicians can commit is an input (public expenditure, tax
6 This consideration comes out from Condorcet theorem, demonstrated in the 18
th century. Condorcet
assumed a group of voters facing a binary judgment problem, such as: he is accused - is he innocent or
guilty? Each voter is supposed to be correct with a probability of p ≥ 50%. Assuming that the voting
mechanism is the majority rule and that voters vote independently (i.e. without being informed of others‟
ballots), then a majority will be correct with a probability greater than p, and the probability that the
majority is correct approaches 100% as the size of the group tend to infinite. Judgment accuracy is
improved merely by using majority rule. The most critical hypothesis here is that voters vote
independently: however it is clear that someone votes together with positive correlation, and this
correlation is a positive function of information lacking. In this case majority rule out-performs the
average individual judgment as long as this correlation is low. But if public information is not available
for all voters, probably the less informed voters will follow opinion leaders, or public polls, or eventually
will not vote at all, with a clear degradation in the democratic process.

7
rates, etc.), not an output (economic growth, low inflation, etc.), a programme not a
result. They can commit themselves on variables they control, but the promised results
depend on the reliability of the commitment and the solidity of the theory used to
identify instruments and evaluate expected results.7
The stick and carrot (i.e. the sanction of no re-election, the premium of being re-elected)
mechanism only works if there is a proper measure of outputs/outcomes delivered by a
certain policy. Of course, statistical information plays a great role in this process: in
fact, in a world of costly information, rational citizens will spend more time informing
themselves about their own private purchases than about public policies, for which their
efforts will have little effect. Therefore, voters, like shareholders of a large firm, face
the difficult task of monitoring the activities of large hierarchies staffed by people who
have information and expertise that is unavailable to the average voter.8
3. Statistics and Trust: a case study based on the Eurobarometer survey
From the previous discussion, the relation between the trust in statistics and in
governance institutions is therefore an important point that to assess empirically. To this
aim, we used the Standard Eurobarometer. This survey carried out by the European
Commission covers the population of the respective nationalities of the EU member
states, resident in each member state aged 15 years old and over.
The Survey consists in a total of 30,224 individuals interviewed between the 10th
April
and 15th
May 2007. The questionnaire consisted of 74 questions- 58 questions
attempting to measure wide aspects of the community life, spanning from global
warming, to the sentiment of EU citizens towards policy issues such as globalisation,
trade, trust in institutions as well as in official statistics; and 16 demographic questions
contextualizing the socio-economic lives of the respondents. Based on this dataset, we
test whether there is any significant relationship between the importance of statistics
and the trust people have in official data, as well as in EU institutions such as the
Parliament, the European Union and the national government.
A selection of OECD countries among the EU group was made, which reduced the
sample to 22,624 observations.9 A selection of seven questions from the core part of the
questionnaire plus eight questions (control variables) from the demographic and socio-
economic questions were carried out. Since almost all questions in the questionnaire
return qualitative closed-answers based on a Likert scale, all the variables selected have
been transformed into binary variables (0, 1) assigning 1 to the event of interest (i.e.
trust in EU institutions) and 0 to the opposite event (i.e. no-trust).10
To avoid potential
multicolinearity, we created an aggregated variable for the trust in institutions
(government, parliament and EU). Indeed, these three variables are highly correlated to
each other (see Table A.2 in the Annex). This variable takes the value of one when the
individual has trust at least in two institutions among the three considered. Figure 1
7 If the theory (i.e. the process through which political inputs generate outputs/outcomes) is weak, there
will be incredulity about the results that are supposed to be provided. 8 A similar relationship exists between politicians and bureaucrats (see Niskanen, 1971 and Holmstrom,
1979). 9 Note that OECD accession candidate countries, such as Estonia and Slovenia were left in the sample.
10 See Annex for the correspondence between the Eurobarometer questions and their coding in our
dataset.

8
displays the positive bi-variate relation between trust in statistics and trust in institutions
on cross-country basis. The relationship is rather strong. In the top right of the chart,
countries such as Netherlands, Finland and Denmark emerge as having the strongest
percentage of respondents having both trust in statistics and institutions, whereas
France, the U.K and Hungary have the lowest percentage of positive opinions. In
Poland and the Czech Republic, trust in statistics is not matched by trust in institutions.
Figure 1. Trust in Statistics vs. Trust in Institutions
Source: Eurobarometer Survey
For the econometric test, all countries are pulled together and no geographical areas
have been identified so the outcomes refer to Europe as a whole. We estimated the
relation using both simple OLS and a logistic regression approach (Logit) over the
dependent binary variables of the model. We control for a number of demographic and
socio-economic factors, such as civil status (married or not), children, education level,
gender, age, employment situation and use of ICT equipment. We also included in the
regression a latent variable capturing whether the individual feels that his/her situation
has improved over the recent years. In order to control for possible endogeneity among
the three variables, we also carried out an instrumental variable estimation using the
GMM method (Tables 1 & 2).

9
Table 1. Effect of Trusting Statistics on Trusting Institutions
(1) (2) (3) (4) Dependent variable : Trust in institutions
OLS OLS with country FE
Logit Logit with country FE
Trust in Statistics 0.282*** 0.253*** 1.200*** 1.169*** (0.0073) (0.0073) (0.033) (0.035) mood_improv 0.104*** 0.0841*** 0.472*** 0.417*** (0.0076) (0.0077) (0.035) (0.038) rural 0.0284*** 0.0147* 0.131*** 0.0718* (0.0080) (0.0079) (0.037) (0.039) ICT 0.0290*** -0.0135 0.132*** -0.0664 (0.0082) (0.0085) (0.037) (0.042) edu 0.0381*** 0.0331*** 0.174*** 0.162*** (0.0057) (0.0057) (0.026) (0.028) status 0.0144* 0.0225*** 0.0655* 0.111*** (0.0078) (0.0076) (0.036) (0.038) children 0.0253** 0.0194** 0.116** 0.0997** (0.0098) (0.0094) (0.045) (0.047) age 0.00311*** 0.00209*** 0.0142*** 0.0104*** (0.00034) (0.00034) (0.0016) (0.0017) sex_male 0.0212*** 0.00956 0.0987*** 0.0505 (0.0073) (0.0071) (0.034) (0.035) managers 0.0562*** 0.0571*** 0.267*** 0.299*** (0.017) (0.016) (0.078) (0.081) other_white_collars 0.0174 0.0348** 0.0792 0.176** (0.017) (0.016) (0.077) (0.080) manual_workers -0.0133 -0.0248* -0.0578 -0.116 (0.015) (0.015) (0.069) (0.072) house_person 0.0867*** 0.0468*** 0.397*** 0.229** (0.019) (0.018) (0.087) (0.089) unemployed -0.0293 -0.0317 -0.125 -0.145 (0.020) (0.020) (0.092) (0.096) retired -0.00132 0.0119 -0.00634 0.0576 (0.016) (0.016) (0.074) (0.078) student 0.0808*** 0.0649*** 0.367*** 0.319*** (0.020) (0.019) (0.091) (0.095) Constant 0.0856*** 0.318*** -1.854*** -0.909*** (0.024) (0.034) (0.11) (0.18) Observations 17781 17781 17781 17781 R-squared 0.12 0.19 . .
Notes: Robust standard errors in parentheses *** p<0.01, ** p<0.05, * p<0.1. Trust in institutions combines trust in national government, parliament and the EU. Coefficients for country dummies are not shown. The meaning of the acronyms for control variables is provided in the Annex.

10
Table 2. Effect of Trusting Statistics on
Trusting Institutions, with control for
endogeneity
(1) Dependent variable : Trust in institutions
IV-GMM method
Trust in statistics 0.464*** (10.3) mood_improv 0.0696*** (7.76) rural 0.0167** (2.01) status 0.0173** (2.17) children 0.0173* (1.74) age 0.00220*** (6.34) sex_male 0.00454 (0.60) managers 0.0458*** (2.74) other_white_collars 0.0228 (1.35) manual_workers -0.0349** (-2.29) house_person 0.0249 (1.30) unemployed -0.0355* (-1.72) retired -0.00340 (-0.21) student 0.0571*** (2.87) Constant 0.306*** (7.88) Observations 16984 R-squared 0.15
Notes: Standard errors in parentheses *** p<0.01, ** p<0.05, * p<0.1. Trust in institutions combines trust in national government, parliament and the EU. Coefficients for country dummies are not shown. The meaning of the acronyms for control variables is provided in the Annex. The instruments used are importance_stat, edu and ICT.
These results illustrate the strong linkages between statistics and governance
institutions. The trust in statistics (Q58, “Do you trust in official statistics in your
country”) is statistically significant among these respondents that trust in institutions
(Table 1). The results show a strong robust and positive relationship between these two
variables for the different types of specifications tested. In addition, the trust in
institutions appears to be also influenced positively by the mood of the individual
(whether his/her situation has improved over the last 5 years), the level of education and
the use of ICT equipment. This shows also the importance of the human capital and
technological dimensions.

11
4. The evolving role of statistics as a public good
4.1 Challenges for the Official Statistical Systems
Because of the power of information in our societies, all individuals need more than
ever statistics to make their decisions, including the voting ones. In this context, the
value added of official statistics depends on its capacity of creating knowledge in the
whole society, not only among policy makers. In addition, globalisation, technological
revolution and cultural change are generating new challenges for the official statistical
systems.
Globalisation fosters the demand for internationally comparable statistics, as well as
national data. This demand for very timely data, with a detailed sectoral and
geographical breakdown, is mainly due to the growing role of multinationals and
international investors, which need to make decisions about the re-location of
production processes or the investment of available funds. But also millions of
enterprises need data to decide where are the most dynamic markets, the most skilled
workers, etc.
The development of a culture of “evidence-based decision making”, together with the
transfer of some decisions from the State to individuals and the growing opportunities
created by globalisation, has stimulated an unprecedented growth in the demand for
statistics by individuals. Millions of people are looking for the best opportunities to
study, to work, to spend their life once retired from work, etc.
An increasing demand is also generated by the monitoring policy outcomes through
statistical indicators is a common practice in a growing number of countries and at
international level. This is one of the key elements of the peer-pressure mechanisms.
The development of statistical methods and ICT have reduced the cost of producing
statistics, fostering the presence of new “agents” in the market of statistical information,
including NGOs, private companies, lobbies, etc. This multiplicity of sources may
produce a “cacophony” in our societies, where users feel bombarded by data and have a
growing difficulty to distinguish high and low quality statistics. Often, mass media love
“numbers” and quote them as much as possible, without paying attention to their
quality.
New ICT tools and the success of Internet are deeply changing the way in which people,
especially new generations, look for and find data. According to the Internet experts,
95% of those who use Google do not go beyond the first page of occurrences; once they
reach a particular site, a similar percentage of users do not click more than three times
to find what they want: if after three clicks they have not found what they are looking
for, they quit the site.
4.2. From “information providers” to “knowledge builders”
Looking at these pressures coming from global changes, some actions can be suggested.
First, it seems important to create a forward/outward looking culture in statistical
institutes, to be able to provide the most relevant information for the whole society and

12
its different parts. Stimulate scientific attitude, creativity, courage and communication at
all levels, to become and be recognised as part of the “knowledge industry”, and not of
the bureaucratic public sector. Maximise direct communication with the final users
using new ICT tools and re-discuss with mass media the way in which they disseminate
official data. Engage emerging players (NGOs, youth associations, etc.) in the use and
re-dissemination of statistical information. Develop a dissemination platform designed
for a global audience and include more international comparisons in standard statistical
products. Re-think the way in which statistical releases can be useful to build “personal
information” (for example, putting emphasis on detailed data and on variability – across
sectors, across regions, etc. – instead of giving prominence to averages). Take a more
aggressive communication attitude against sources characterised by very low data
quality. Investigate how the society looks at official statistics and try to fix the specific
problems that emerge from this analysis. Regularly discuss with political masters the
risks and the opportunities for the statistical function in a fast changing society. And,
finally, dedicate more resources to initiatives aimed at developing statistical culture in
the population, especially in new generations.
All these suggestions are coherent with a vision of NSOs and international
organisations as “knowledge builders” and not simply as “information providers”.
Therefore, the job of official statisticians should not be limited to produce and
disseminate data, but to make statistics actually used to build knowledge by all
components of the society, and therefore to be used in as many decision-making
processes as possible. In some sense, statistical information may become a public good
produced in a more decentralized way. This requires innovative thinking, re-orientation
of resources, alliances with new partners, revision of the skills needed to perform these
new functions, changes in the legal and institutional set ups, better integration between
national and international organisations. In this way, statistics can become more
relevant than ever. This evolving role of statistics is depicted in Figure 2 and could be
summarised in the term “Societistics”, i.e. a statistical framework that is geared for the
society and is part of the overall governance system, rather than focusing mainly on
providing information tools for public policy makers.
Figure 2. From Statistics to ‘Sociestics’
Information Knowledge
Government
Domestic information
provider
Society
Global knowledge
builder
13
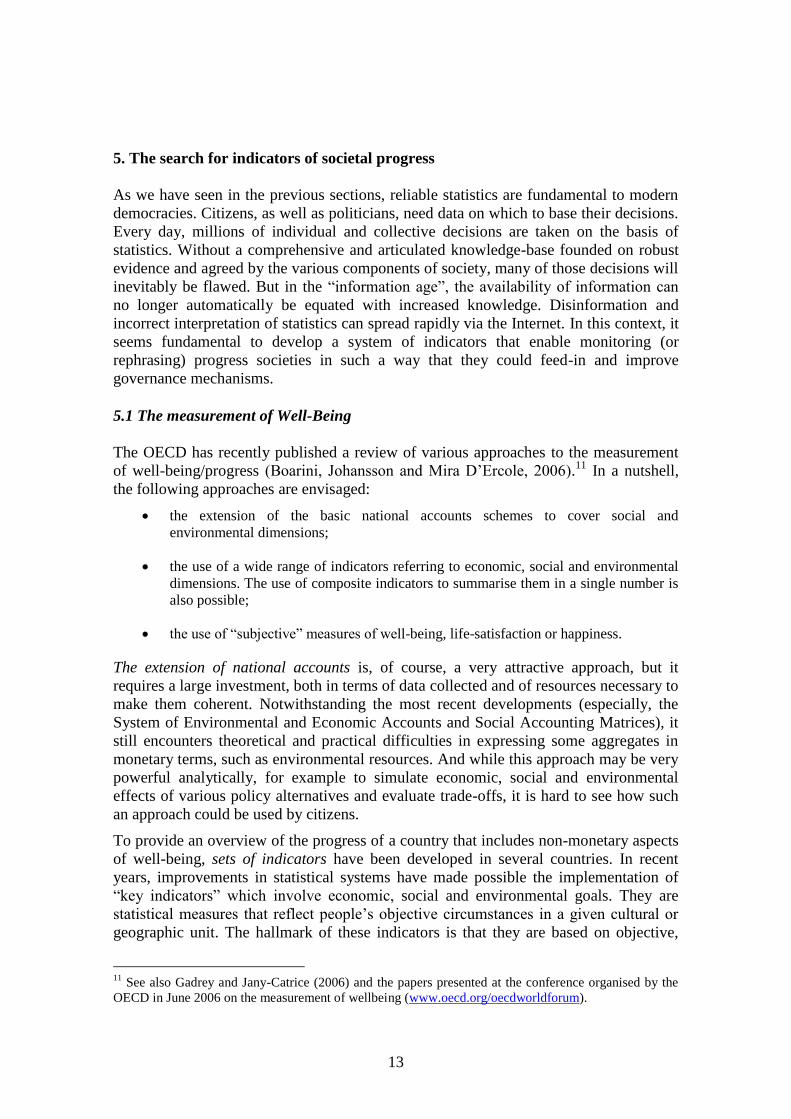
5. The search for indicators of societal progress
As we have seen in the previous sections, reliable statistics are fundamental to modern
democracies. Citizens, as well as politicians, need data on which to base their decisions.
Every day, millions of individual and collective decisions are taken on the basis of
statistics. Without a comprehensive and articulated knowledge-base founded on robust
evidence and agreed by the various components of society, many of those decisions will
inevitably be flawed. But in the “information age”, the availability of information can
no longer automatically be equated with increased knowledge. Disinformation and
incorrect interpretation of statistics can spread rapidly via the Internet. In this context, it
seems fundamental to develop a system of indicators that enable monitoring (or
rephrasing) progress societies in such a way that they could feed-in and improve
governance mechanisms.
5.1 The measurement of Well-Being
The OECD has recently published a review of various approaches to the measurement
of well-being/progress (Boarini, Johansson and Mira D‟Ercole, 2006).11
In a nutshell,
the following approaches are envisaged:
the extension of the basic national accounts schemes to cover social and
environmental dimensions;
the use of a wide range of indicators referring to economic, social and environmental
dimensions. The use of composite indicators to summarise them in a single number is
also possible;
the use of “subjective” measures of well-being, life-satisfaction or happiness.
The extension of national accounts is, of course, a very attractive approach, but it
requires a large investment, both in terms of data collected and of resources necessary to
make them coherent. Notwithstanding the most recent developments (especially, the
System of Environmental and Economic Accounts and Social Accounting Matrices), it
still encounters theoretical and practical difficulties in expressing some aggregates in
monetary terms, such as environmental resources. And while this approach may be very
powerful analytically, for example to simulate economic, social and environmental
effects of various policy alternatives and evaluate trade-offs, it is hard to see how such
an approach could be used by citizens.
To provide an overview of the progress of a country that includes non-monetary aspects
of well-being, sets of indicators have been developed in several countries. In recent
years, improvements in statistical systems have made possible the implementation of
“key indicators” which involve economic, social and environmental goals. They are
statistical measures that reflect people‟s objective circumstances in a given cultural or
geographic unit. The hallmark of these indicators is that they are based on objective,
11
See also Gadrey and Jany-Catrice (2006) and the papers presented at the conference organised by the
OECD in June 2006 on the measurement of wellbeing (www.oecd.org/oecdworldforum).
14
quantitative statistics rather than on individuals‟ subjective perceptions of their social
environment. As a result, it is very easy to make comparisons over time and/or
countries, using them as “benchmarks”. However, key indicators can suffer from
several weaknesses: first, they can provide a misleading view of certain phenomena (for
example, it is known that rape incidents are underreported to the police and therefore
crime indicators based on administrative data can be misleading). Second, looking at a
multiplicity of indicators it is not easy to derive a synthetic view about the overall
progress of a country (normally, some indicators improve, others worsen).
Composite indicators aggregate “sectoral” indicators using weights and aim to provide a
comprehensive picture of a country, comparable over time and between countries. They
allow the ranking of countries as well (very appreciated by the media), making it
possible for the public to evaluate overall policy results. However, composite indicators
suffer from important weaknesses and can be misleading for policy evaluations, pushing
people to draw simplistic conclusions. For example, the construction of a composite
indicator involves stages where judgments have to be made (especially concerning the
weights structure, the selection of sub-indicators, the aggregation method, etc.), thus
uncertainty and sensitivity analysis are needed to test the robustness of results, but this
complicates their presentation to non experts (Giovannini et al., 2005). In addition, in
order to be representative of society‟s point of view, the choice of the weights structure
cannot be delegated to statisticians or to politicians. Therefore, the use of composite
indicators for measuring the overall progress is often criticised.
Finally, subjective indicators are based on the assumption that well-being depends on
the degree of utility that individuals perceive in their social environment, i.e. how
people react to and experience the events and situations in their lives. Several studies
recognise that there is little correlation between objective measures of well-being and
subjective ones and this may be due to several factors: for example, people can adapt
themselves to their living standards, or can adjust their cognitive attention and
expectations to external circumstances in ways that are advantageous for themselves.
When the prospects of social comparison are not favourable, individuals often rearrange
their scale of satisfaction, redirecting their attention to tasks and situation that are better
for them. This concept has to be underlined if subjective indicators are used in political
processes: if they are “endogenous” they lack the necessary link to actual outcomes and
politicians could be tempted to spend more resources to try to change citizens‟
perceptions using propaganda rather than to change the social well-being itself.12
5.2 The need for a holistic approach: The OECD Project on “Measuring the Progress
of Societies”
In the search for more reliable “common knowledge”, sets of indicators, rather than
single composite indicators or subjective indicators, seem to be the best tool to support
policy making systems and to allow citizens to make more informed decisions. In fact,
they cover a wide area of political subjects (economy, environment, society, etc.), are
not subject to the problem of establishing weights, can take into account the complexity
of modern societies and the multiplicity of societal goals and can provide a manageable
picture of a country‟s overall performance. Of course, the choice of “key indicators” has
12
The OECD has recently organised an international conference on the measurement of happiness and
policy making (see www.oecd.org/oecdworldforum).

15
to be done in a very transparent way, involving statistical experts, civil society, subject-
matter experts, media and policy makers. This is the approach followed by several
OECD countries, where commissions are established by governments involving various
components of the society to select the list of key indicators: once the selection is made,
the statistical office is then put in charge of producing a periodic report, widely
disseminated to citizens. From the available experiences it is clear that the strength of
key indicators lies in their capability to address three fundamental issues: present a
simplified, but reliable, view of society, contribute to a shared knowledge among
citizens, and make politicians accountable for their actions.
One of the first countries involved in developing “key indicators” was Australia. In
2002, a publication of the Australian Bureau of Statistics (ABS) called “Measuring
Australia‟s Progress” presented a comprehensive framework for the measurement of
well-being and a rich set of key indicators. In ABS‟s view, progress is closely related to
these three concepts:
well-being or welfare, which is generally used to mean the condition of being well in
life. It typically includes material, physical, social and spiritual aspects of life;
quality of life, which is linked to well-being, but with the difference that what is
highlighted here is the capability of society to respond to people‟s wants and needs;
sustainability, which considers whether an activity or condition can be maintained
indefinitely. It is mostly been used to describe the impact of human activities on
environmental and social systems.
The domains of progress were chosen during initial phases of the project and after
consulting government, civil society, experts, academics, business councils, community
organisations and individuals. The choices were tested through several further rounds of
consultation to make the final selection, taking into account of the full spectrum of
views. External advisors were present in an expert reference group, comprised of
academics, scientists, and the heads of two prominent civil society organisations, one
who seeks to combat poverty and inequality, and the other an independent public policy
research institute. This suggests that the focal point was not the policy making process
or international benchmarking, but primarily the expectations and opinions of citizens.13
13
The Australian experience is just of one the several initiatives that are underway in OECD countries
and beyond. To analyse and compare them, the OECD organised in 2004 the first World Forum on Key
Indicators “Statistics, Knowledge and Policy” (see www.oecd.org/oecdworldforum). The Palermo Forum
was just one of the initiatives taken by the OECD to foster the use of “key indicators” to analyse overall
countries‟ performances. Extremely important in this respect has been the creation of the OECD
Factbook: Economic, Environmental and Social Statistics, a publication that presents, in an innovative
way, a carefully selected range of 150 indicators covering broad thematic areas: Population and
migration, Macroeconomic trends, Economic globalisation, Energy, Prices, Labour market, Science and
technology, Environment, Education, Public policies and Quality of life. In addition, every year, the
OECD Factbook includes a special section focusing on a current “hot topic”. The on line 2008 Edition of
the FactBook is also accessible through dynamic charts and is available through a Gapminder interface.
The OECD also launched a Global Project on the measurement of the progress of societies and, as a part
of it, the OECD organised the second World Forum on “Statistics, Knowledge and Policy” (June 2007,
Istanbul, Turkey), in co-operation with the European Commission (EC), the Conference of Islamic
Countries (OIC), the United Nations (UN) and the World Bank (WB) and with the support of several
other institutions (see www.oecd.org/oecdworldforum).

16
6. Summary and conclusions
In this paper, we have considered different research avenues for the interaction between
statistics and governance. We started by surveying the economic and political science
literature on the role of information and expectations for a well-functioning society. We
then provided empirical evidence on the positive link between trust in statistics and trust
in institutions using the European Barometer Survey. The importance of statistics for the
governance mechanisms and the current rapidly changing environment create specific
challenges for the official statistical institutions. We argued in this paper that a new
design of statistical systems more geared towards the society as whole rather than mainly
for public decision-makers was needed. Among others, the creation of new indicators of
societal progress would be an important step in this direction.
References
Akerlof, G. (1970), “The Market of Lemons: Qualitative Uncertainty and the Market
Mechanism”, Quarterly Journal of Economics, No. 89, pp. 488-500.
Alesina, A. (1988), “Credibility and Policy Convergence in a Two-Party System with rational
Voters”, American Economic Review, No. 78, pp. 796-805.
Boarini, R., A. Johansson and M. Mira D‟Ercole “Alternative Measures of Well-being”,
Economics Department Working Papers, No. 476, OECD, Paris.
Downs, A. (1957), An Economic Theory of Democracy, Harper & Row, New York.
Friedman, M. (1968), “The Role of Monetary Policy”, The American Economic Review, No.
58, pp. 1-17.
Gadrey, J. and F. Jany-Catrice (2006), The New Indicators of Well-being and Development”,
Palgrave Macmillan, New York.
Giovannini, E., (2007), “Statistics and Politics in a “Knowledge Society”, Statistics Directorate
Working Paper (2007)2.
Giovannini, E., et al. (2005), “Handbook on Constructing Composite Indicators: Methodology
and User Guide” OECD Statistics working paper, OECD, Paris.
Grunberg, E. and F. Modigliani (1954), “The Predictability of Social Events”, The Journal of
Political Economy, No. 62, pp. 465-478.
Holmstrom, B. (1999), “Managerial Incentive Problems: A Dynamic Perspective”, The Review
of Economic Studies, Vol. 66, No. 1, pp. 169-182.
Hotelling, H. (1929), “Stability in Competition”, Economic Journal, No. 39, pp. 41-57.
Krugman, Paul (1991). "History Versus Expectations", Quarterly Journal of Economics,
Vol. 106(2), 651-667.
17
Lucas, R.E., Jr. (1975), “An Equilibrium Model of Business Cycle”, The Journal of Political
Economy, No. 83, pp. 1113-1144.
Lucas, R.E., Jr. (1976), “Econometric Policy Evaluation: a Critique”, in Brunner, K., A.H.
Meltzer (eds.), The Philips curve and Labour Markets, Carnegie-Rochester Conference
Series on Public Policy, No. 1, pp. 19-46.
McKelvey, R. and P. Ordeshook, (1986b), “Information and Elections: Retrospective Voting
and Rational Expectations” in Ferejohn and Kuklinski, Information and Democratic
Process, Urbana of Illinois Press, Urbana, 1990, pp. 281-312.
Muth, J.F. (1961), “Rational Expectations and the Theory of Price Movements” Econometrica,
No. 29, pp. 315-335.
Niskanen W. (1971), “Bureaucracy and Representative Government”, Atherton, Aldine.
Persson, Torsten and Guido Tabellini (2006), “Democratic capital the nexus of political and
economic change”, NBER Working Paper No. 12175.
Przeworski, Adam, M. Alvarez, J.A. Cheibub and F. Limongi (2000), Democracy and
Development: Political Institutions and Well-Being in the World, 1950-1990, Cambridge:
Cambridge University Press.
Rothschild, M. and J. Stiglitz (1976), “Equilibrium in Competitive Insurance Markets: An Essay
on the Economics of Imperfect Information”, Quarterly Journal of Economics, No. 90,
pp. 629-649.
Wittman, D. (1973), “Parties as Utility Maximizers”, American Political Science Review, No.
67, pp. 490-498.
18
Annex: EUROBAROMETER Data and Variable Definitions
The basic sample design applied in all states is a multi-stage, random probability
sample, where for each country, a number of sampling points was drawn with
probability proportional to population size (for total coverage) and to population
density. The sampling points have been drawn from each of the administrative regional
units after stratification by individual unit and type of area. As such, the sampling points
represent the whole territory of countries surveys according to the Eurostat NUTS II14
.
All interviews were conducted face-to-face in people‟s houses and in the appropriate
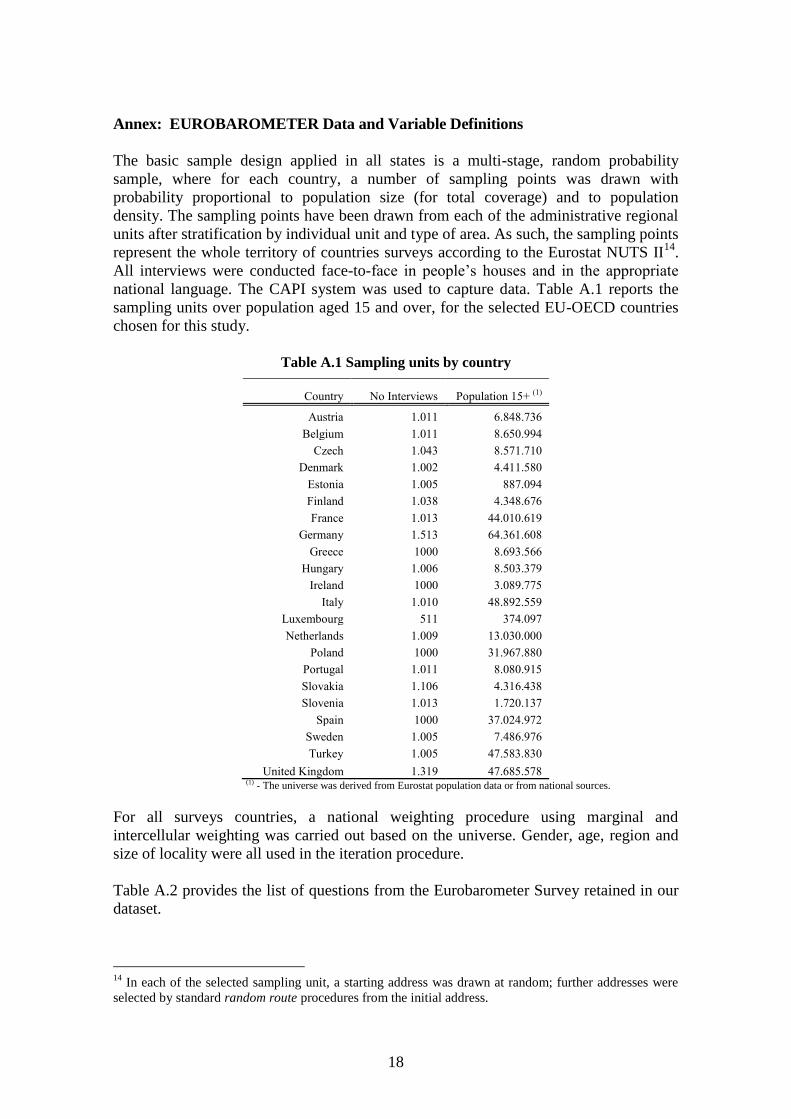
national language. The CAPI system was used to capture data. Table A.1 reports the
sampling units over population aged 15 and over, for the selected EU-OECD countries
chosen for this study.
Table A.1 Sampling units by country
Country No Interviews Population 15+ (1)
Austria 1.011 6.848.736
Belgium 1.011 8.650.994
Czech 1.043 8.571.710
Denmark 1.002 4.411.580
Estonia 1.005 887.094
Finland 1.038 4.348.676
France 1.013 44.010.619
Germany 1.513 64.361.608
Greece 1000 8.693.566
Hungary 1.006 8.503.379
Ireland 1000 3.089.775
Italy 1.010 48.892.559
Luxembourg 511 374.097
Netherlands 1.009 13.030.000
Poland 1000 31.967.880
Portugal 1.011 8.080.915
Slovakia 1.106 4.316.438
Slovenia 1.013 1.720.137
Spain 1000 37.024.972
Sweden 1.005 7.486.976
Turkey 1.005 47.583.830
United Kingdom 1.319 47.685.578 (1) - The universe was derived from Eurostat population data or from national sources.
For all surveys countries, a national weighting procedure using marginal and
intercellular weighting was carried out based on the universe. Gender, age, region and
size of locality were all used in the iteration procedure.
Table A.2 provides the list of questions from the Eurobarometer Survey retained in our
dataset.
14
In each of the selected sampling unit, a starting address was drawn at random; further addresses were
selected by standard random route procedures from the initial address.
19
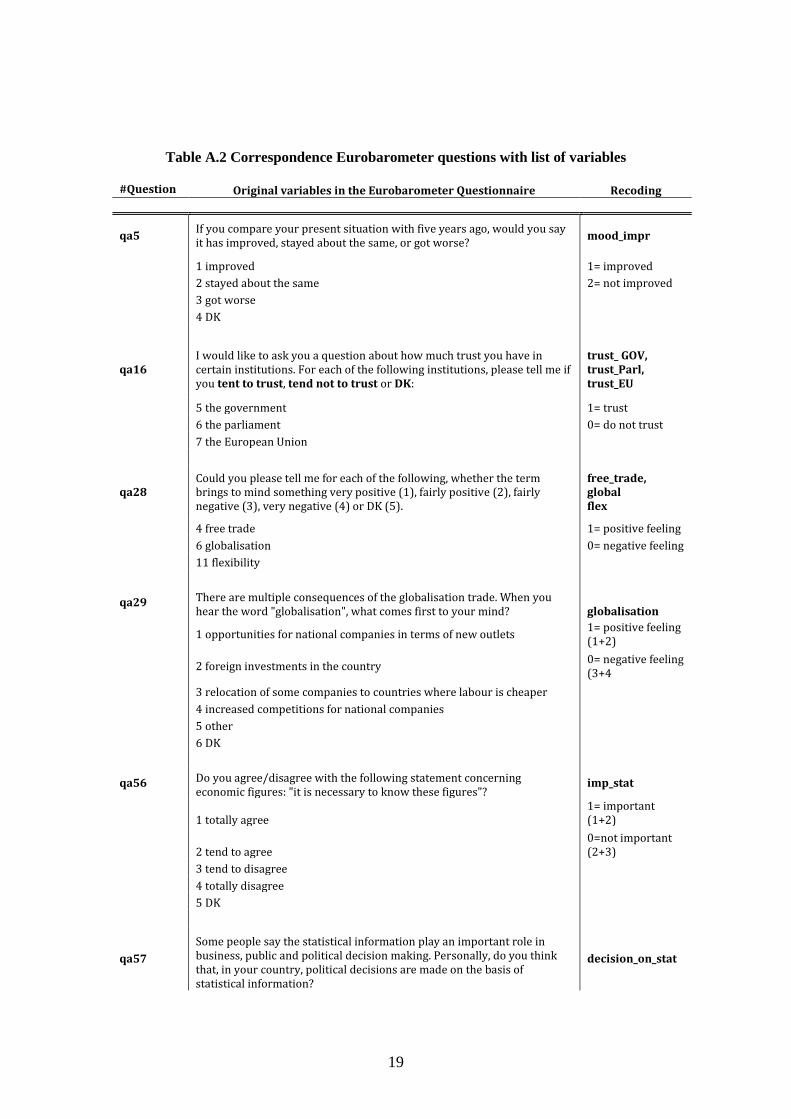
Table A.2 Correspondence Eurobarometer questions with list of variables
#Question Original variables in the Eurobarometer Questionnaire Recoding
qa5 If you compare your present situation with five years ago, would you say it has improved, stayed about the same, or got worse?
mood_impr
1 improved 1= improved
2 stayed about the same 2= not improved
3 got worse
4 DK
qa16 I would like to ask you a question about how much trust you have in certain institutions. For each of the following institutions, please tell me if you tent to trust, tend not to trust or DK:
trust_ GOV, trust_Parl, trust_EU
5 the government 1= trust
6 the parliament 0= do not trust
7 the European Union
qa28 Could you please tell me for each of the following, whether the term brings to mind something very positive (1), fairly positive (2), fairly negative (3), very negative (4) or DK (5).
free_trade, global flex
4 free trade 1= positive feeling
6 globalisation 0= negative feeling
11 flexibility
qa29 There are multiple consequences of the globalisation trade. When you hear the word "globalisation", what comes first to your mind? globalisation
1 opportunities for national companies in terms of new outlets
1= positive feeling (1+2)
2 foreign investments in the country
0= negative feeling (3+4
3 relocation of some companies to countries where labour is cheaper
4 increased competitions for national companies
5 other
6 DK
qa56 Do you agree/disagree with the following statement concerning economic figures: "it is necessary to know these figures"?
imp_stat
1 totally agree 1= important (1+2)
2 tend to agree 0=not important (2+3)
3 tend to disagree
4 totally disagree
5 DK
qa57
Some people say the statistical information play an important role in business, public and political decision making. Personally, do you think that, in your country, political decisions are made on the basis of statistical information?
decision_on_stat

20
1 yes certainly 1= yes (1+2)
2 yes probably 2= no (3+4)
3 no probably not
4 no certainly not
5 DK
qa58
Personally, how much trust do you have in the official statistics in your country, for example the statistics on unemployment, inflation or economic growth? Would you say that you tend to trust these official statistics or tend not to trust them?
trust_stat
1 tend to trust 1= trust (1)
2 Tend not to trust 2= don't trust (0)
3 DK
DEMOGRAPHIC and SOCIO-ECONOMIC CONTROLS
D7 Current status situation: status
1 married 1= married (1+2)
2 remarried
0= unmarried( form 3 to 10)
3 unmarried, living with partner
4 unmarried, never lived with partner
5 unmarried, previously lived with partner, but alone now
6 divorced
7 separated
8 widowed
9 other
10 refusal
D8 How old were you when you stopped full-time education? EDU
1 less than 15 yrs old 0=basic education
2 between 16-19 1=secondary education
3 still studying 3= tertiary education
4 no full time education
5 refusal
6 DK
D10 Gender sex
1 male 1= male
2 female 0= female
D11 How old are you? age
continuous variable left unchanged
D15a What is your current situation? work
1 self-employed
8 variables created accordingly to the 8 working categories here on the left
2 managers
3 other white collars
4 manual workers
21
5 house persons
6 unemployed
7 retired
8 students
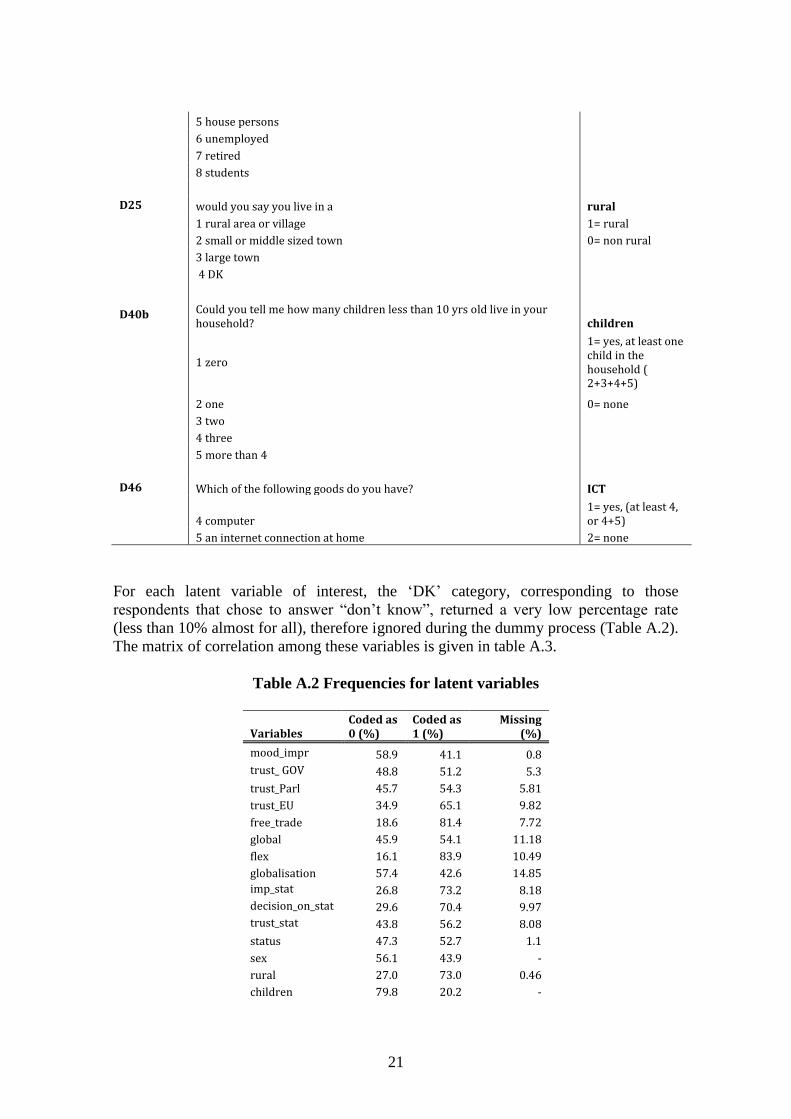
D25 would you say you live in a rural
1 rural area or village 1= rural
2 small or middle sized town 0= non rural
3 large town
4 DK
D40b Could you tell me how many children less than 10 yrs old live in your
household? children
1 zero
1= yes, at least one child in the household ( 2+3+4+5)
2 one 0= none
3 two
4 three
5 more than 4
D46 Which of the following goods do you have? ICT
4 computer 1= yes, (at least 4, or 4+5)
5 an internet connection at home 2= none
For each latent variable of interest, the „DK‟ category, corresponding to those
respondents that chose to answer “don‟t know”, returned a very low percentage rate
(less than 10% almost for all), therefore ignored during the dummy process (Table A.2).
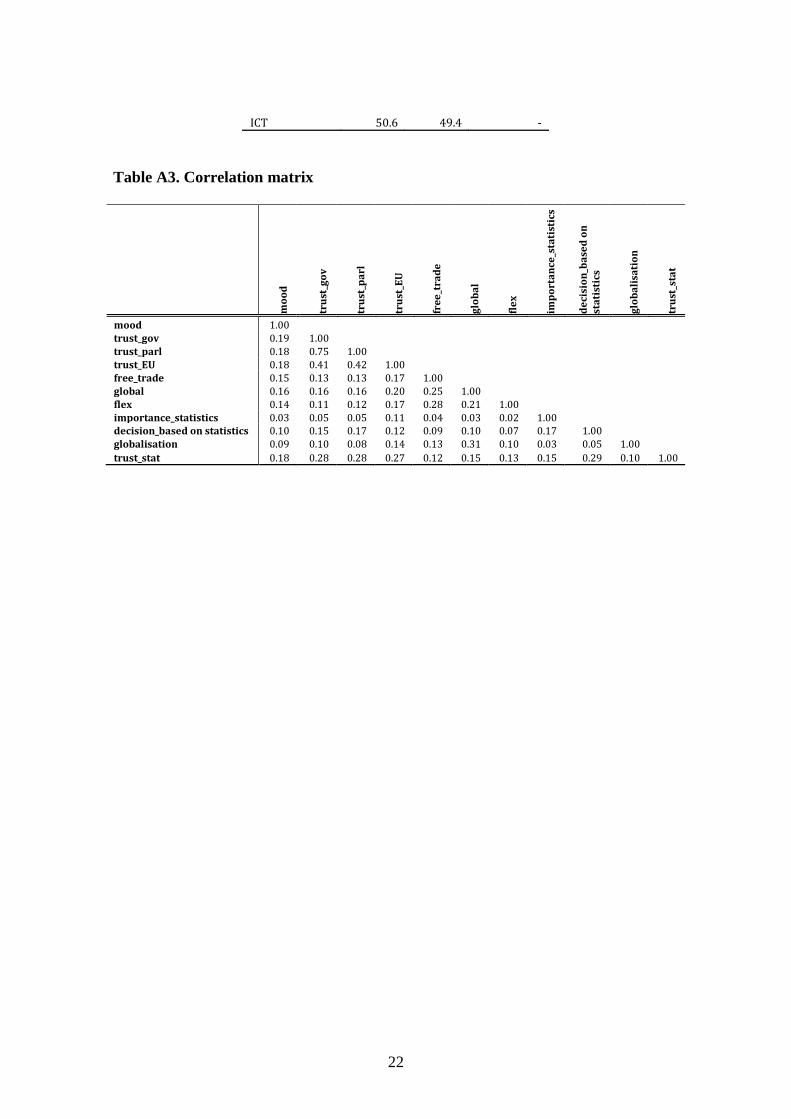
The matrix of correlation among these variables is given in table A.3.
Table A.2 Frequencies for latent variables
Variables Coded as 0 (%)
Coded as 1 (%)
Missing (%)
mood_impr 58.9 41.1 0.8
trust_ GOV 48.8 51.2 5.3
trust_Parl 45.7 54.3 5.81
trust_EU 34.9 65.1 9.82
free_trade 18.6 81.4 7.72
global 45.9 54.1 11.18
flex 16.1 83.9 10.49
globalisation 57.4 42.6 14.85
imp_stat 26.8 73.2 8.18
decision_on_stat 29.6 70.4 9.97
trust_stat 43.8 56.2 8.08
status 47.3 52.7 1.1
sex 56.1 43.9 -
rural 27.0 73.0 0.46
children 79.8 20.2 -
22
ICT 50.6 49.4 -
Table A3. Correlation matrix
mo
od
tru
st_g
ov
tru
st_p
arl
tru
st_E
U
fre
e_t
rad
e
glo
ba
l
fle
x
imp
ort
an
ce_s
tati
stic
s
de
cisi
on
_ba
sed
on
st
ati
stic
s
glo
ba
lisa
tio
n
tru
st_s
tat
mood 1.00 trust_gov 0.19 1.00 trust_parl 0.18 0.75 1.00 trust_EU 0.18 0.41 0.42 1.00 free_trade 0.15 0.13 0.13 0.17 1.00 global 0.16 0.16 0.16 0.20 0.25 1.00 flex 0.14 0.11 0.12 0.17 0.28 0.21 1.00 importance_statistics 0.03 0.05 0.05 0.11 0.04 0.03 0.02 1.00 decision_based on statistics 0.10 0.15 0.17 0.12 0.09 0.10 0.07 0.17 1.00 globalisation 0.09 0.10 0.08 0.14 0.13 0.31 0.10 0.03 0.05 1.00
trust_stat 0.18 0.28 0.28 0.27 0.12 0.15 0.13 0.15 0.29 0.10 1.00